Vote 03 Department of Health
72
Vote 03 Department of Health
Transcript of Vote 03 Department of Health

Vote 03
Department of Health

Department of Health
60
Department of Health Vote 03
To be appropriated by Vote in 2020/21 R 13 197 187 000
Direct Charge Not Applicable
Responsible MEC MEC for Health
Administrating Department Department of Health
Accounting Officer Superintendent General for Health
1. Overview
Vision
A long and healthy life for all communities of the North West Province
Mission
To render accessible, equitable, integrated quality and client orientated health care services, in line
with all approved protocols, principles that govern the health sector national and internationally
Values
In rendering such services, we shall observe values contained in the following:
Batho Pele Principles
Patients' Rights Charter
Children’s Rights Charter
Women's Charter
Disability Rights Charter
Strategic Goals
National Development Plan 2030
The National Development Plan (NDP) sets out nine (9) long-term health goals for South Africa. Five
of these goals relate to improving the health and well-being of the population, and the other four deals
with aspects of health systems strengthening.
By 2030, South Africa should have:
Raised the life expectancy of South Africans to at least 70 years;
Progressively improved TB prevention and cure;
Reduced maternal, infant and child mortality;
Significantly reduced prevalence of non-communicable diseases;

2020/21 Estimates of Provincial Revenue and Expenditure
61
Reduced injury, accidents and violence by 50 per cent from 2010 levels;
Completed Health system reforms;
Primary healthcare teams provide care to families and communities; and
Universal health care coverage.
Filled posts with skilled, committed and competent individuals.
Sustainable Development Goals 2030
The Sustainable Development Goals 2030, which are built on the Millennium Development Goals
2015, were adopted as Global Goals by the world leaders on 25 September 2015. There are
17 Sustainable Development Goals (SDGs) to end poverty, fight inequality and tackle climate change
by 2030.
Goal 3, which is “Ensure healthy lives and promote well-being for all at all ages”, has 13 targets:
By 2030, reduce the global maternal mortality ratio to less than 70 per 100,000 live births;
By 2030, end preventable deaths of new-borns and children under 5 years of age, with all
countries aiming to reduce neonatal mortality to at least as low as 12 per 1,000 live births and
under-5 mortality to at least as low as 25 per 1,000 live births;
By 2030, end the epidemics of AIDS, tuberculosis, malaria and neglected tropical diseases and
combat hepatitis, water-borne diseases and other communicable diseases;
By 2030, reduce by one third premature mortality from non-communicable diseases through
prevention and treatment and promote mental health and well-being;
Strengthen the prevention and treatment of substance abuse, including narcotic drug abuse and
harmful use of alcohol;
By 2020, halve the number of global deaths and injuries from road traffic accidents;
By 2030, ensure universal access to sexual and reproductive health-care services, including for
family planning, information education and the integration of reproductive health into national
strategies and programmes;
Achieve universal health coverage, including financial risk protection, access to quality essential
health-care services and access to safe, effective, quality and affordable essential medicines and
vaccines for all;
By 2030, substantially reduce the number of deaths and illnesses from hazardous chemicals and
air, water and soil pollution and contamination;
Strengthen the implementation of the World Health Organization Framework Convention on
Tobacco Control in all countries, as appropriate;
Support the research and development of vaccines and medicines for the communicable and
non-communicable diseases that primarily affect developing countries, provide access to
affordable essential medicines and vaccines, in accordance with the Doha Declaration on the
TRIPS Agreement and Public Health, which affirms the right of developing countries to use to the
full the provisions in the Agreement on Trade Related Aspects of Intellectual Property Rights

Department of Health
62
regarding flexibilities to protect public health, and, in particular, provide access to medicines for
all;
Substantially increase health financing and the recruitment, development, training and retention
of the health workforce in developing countries, especially in least developed countries and small
island developing States; and
Strengthen the capacity of all countries, particularly developing countries, for early warning, risk
reduction and management of national and global health risks.
NDP Goals 2030 SDG Goals 2030
Tuberculosis (TB) prevention and cure
progressively improved
End the epidemics of AIDS, tuberculosis, malaria and neglected tropical diseases and
combat hepatitis, water-borne diseases and other communicable diseases.
Maternal, infant and child mortality reduced
Reduce the global maternal mortality ratio to less than 70 per 100,000 live births.
End preventable deaths of newborns and children under 5 years of age, with all
countries aiming to reduce neonatal mortality to at least as low as 12 per 1,000 live
births and under-5 mortality to at least as low as 25 per 1,000 live births.
Prevalence of Non-Communicable Diseases
reduced
Reduce by one third premature mortality from non-communicable diseases through
prevention and treatment and promote mental health and well-being strengthen the
prevention and treatment of substance abuse, including narcotic drug abuse and
harmful use of alcohol
Strengthen the implementation of the World Health Organization Framework
Convention on Tobacco Control in all countries, as appropriate.
Injury, accidents and violence reduced by
50per cent from 2010 levels. By 2020, halve the number of global deaths and injuries from road traffic accidents.
Health systems reforms completed.
Achieve universal health coverage, including financial risk protection, access to quality
essential health-care services and access to safe, effective, quality and affordable
essential medicines and vaccines for all.
Primary health care teams deployed to provide
care to families and communities.
Ensure universal access to sexual and reproductive health-care services, including for
family planning, information and education, and the integration of reproductive health
into national strategies and programmes.
Universal health coverage achieved.
Achieve universal health coverage, including financial risk protection, access to quality
essential health-care services and access to safe, effective, quality and affordable
essential medicines and vaccines for all
Posts filled with skilled, committed and
competent individuals.
Substantially increase health financing and the recruitment, development, training and
retention of the health workforce in developing countries, especially in least developed
countries and small island developing States.
Other Departmental specific priorities are listed below:
District Health Services (DHS)
Primary Health Care (PHC) re-engineering is a national priority programme for health service delivery
improvement. Ward-based Primary Health Care Outreach Teams (WBPHCOT) renders home based
and community services by Community Health Workers.

2020/21 Estimates of Provincial Revenue and Expenditure
63
The programme employs CHW, who must serve under supervision of an outreach team leader being
a Professional Nurse or Enrolled Nurse where available to provide services to the community of a
ward. These teams must be supported in the community by the services of Environmental Health
Practitioners in this regard; specialist teams have been trained to conduct community health work at a
household level. Personnel costs will continue to increase for this objective to be achieved which will
have the effect of increasing employment levels and reducing poverty at a community level.
Implementation of four streams of PHC re-engineering included contracting of GP and other health
professionals into public health facilities.
Emergency Medical Services (EMS)
The primary response times of the EMS in both rural and urban areas need to improve so that the
national standards are met. The national standard for EMS response time is that Priority 1 (P1)
patients should be reached within 40 minutes in rural areas and within 15 minutes in urban areas. The
target is that 75 per cent of P1 patients should be reached within the time. Currently in the province,
55 per cent of rural patients and 50 per cent of urban patients are serviced within the national norms.
The current national norm for ambulances is one ambulance per 10 000 population. Currently, the
province has one ambulance per 50 000 population.
Therefore, there is a need to improve EMS in the North West Province. The North West province is a
predominantly rural province with a population of 4 027 160.
EMS Call Demand
The current average call rate for EMS is 800 calls per day that is serviced by 99 provincial operational
ambulances and 48 private EMS ambulances. The private EMS ambulances undertake Inter-Facility
Transfers (IFT) only when provincial services do not have the requisite skills (Advanced Life Support)
to manage the patient during the transfer.
EMS Performance
EMS attends to 45.6 per cent of urban P1 patients in 15 minutes and 55.9 per cent of rural P1
patients within 40 minutes. The target set for P1 urban and P1 rural in the current Annual
Performance plan is ≥50per cent and ≥55per cent respectively. This is against a national norm of 75
per cent in both, urban and rural settings.
EMS Communication Centres
There are currently four (4) EMS Communications Centres located at Klerksdorp, Vryburg, Mahikeng
and Rustenburg. Each centre has a staff establishment of 32 staff members.

Department of Health
64
With an average call volume of 800 calls, the average call rate equates to 20 calls per hour for the
province and 5 calls per hour per centre. Data is collected manually within the communication centres
and may not be accurate. None of the EMS vehicles have tracking devices installed, digital
communication or computer aid dispatch system. This may contribute to inefficient use or abuse of
EMS vehicles and poor response time.
Human Resources
The current total operational staff complement is 520 and the staff qualification distribution is 50 per
cent Basic Ambulance Assistant (BAA), 31 per cent (Ambulance Emergency Assistant (AEA) and 19
per cent Emergency Care Technician (ECT). There are no operational Paramedics or Emergency
Care Practitioners (ECP).
EMS Vehicles - Ambulances
The current total ambulance fleet is 152. Whilst a total of 120 ambulances are functional and available
for operations, only 99 are operational due to staff shortages. A further 53 ambulances are dormant
due to various factors such as high mileage, accidents and breakdowns. A total of 48 new
ambulances were recently distributed to the districts and have improved the ambulance coverage.
Planned Patient Transport
Approximately 60 per cent of calls done by ambulances do not require patient medical care. These
calls can be undertaken by Planned Patient Transport (PPT). It is cheaper to move patients using
PPT than EMS given that EMS requires vehicles that needs to be converted, equipment and 10 staff
members and PPT requires just a vehicle and 5 staff members. A pilot of PPT with fixed routes was
tested in Ventersdorp and Matlosana, where the response times for ambulances improved by 60 per
cent. No centralized budget for PPT exists except for vehicle purchases in EMS. The PPT call rate is
unknown due to the fragmented nature of the service. PPT staff members are either employed as
PPT drivers in EMS or by the different hospitals or sub-districts. The provincial policy does not
adequately address coordinated patient referrals. The 44 vehicles available to for PPT but cannot be
operated due to staff shortages.
Way forward for EMS in North West Province: -
Implement an EMS communication system
The 4 district centres need to be consolidated into a single provincial communication centre. This
would result in cost saving on Compensation of Employees and Information Technology costs where
only one (1) system will be used instead of four (4). The centre should consist of an EMS dispatch
centre, a Provincial Health Operation Centre, as well as a Disaster Management Joint Operations
Centre. The EMS communication system will: -

2020/21 Estimates of Provincial Revenue and Expenditure
65
have a computer aided dispatch system;
a real time vehicle tracking system using Uber-like technology;
The communication system will have live performance monitoring and produce real time reports;
The communication system will feed into a database for evidence informed decisions.
Implement Planned Patient Transport (PTT)
The department will establish a PPT service, which will be funded as a provincial function under
budget programme 3.2 and PPT will become a sole EMS function with its own structure.
The following activities will be implemented: -
Develop a hub and spoke PPT model;
Transfer all current staff and vehicles from hospitals, clinics and sub-districts to EMS;
Create a waiting room at each hospital for PPT and
Central booking of patients to be done via the Communication Centre.
The formation of PPT will free up ambulances and thus improve response times.
Replace all non-functional ambulances
The department will: -
Procure additional ambulances and response vehicles;
Develop an on-going fleet replacement plan;
Determine the most appropriate type of ambulance based on terrain needs and
Re-deploy staff (96) from rationalization process of the communication centres, which will place
more ambulances on the road.
To improve response time for the North West Department of Health the following needs to be done:
Develop a communication system;
Employ EMS staff;
Redeploy current misplace staff;
Procure more ambulances and
Develop a Planned Patient Transport Services.
Human Resource Management
Current staff deemed to be surplus in specific areas of EMS will be reallocated to PPT;
As a short-term measure, drivers must be appointed for PPT and

Department of Health
66
Vacant EMS post have been filled to date, although not adequate to operate all functional
ambulance or meet the demand.
Staff Category Number Population to Staff Ratio
Community Health Workers 6 413 173
Nursing Assistants 2 749 74
Enrolled Nurse 975 26
Professional Nurse 4 981 134
Medical Practitioners 1 007 27
Pharmacists 288 8
Dental Practitioners 69 2
Occupational Therapists 66 2
Physiotherapy 99 3
Speech Therapy/Audiology 30 1
Capital Projects
The maintenance and refurbishment of health facilities is an important national priority to ensure that
the infrastructure investment is maintained and meets the basic community requirements as well as
related staff retention initiatives. The services are routinely sourced at a local level thus providing
employment in the districts as most of the health facilities are placed in a decentralized manner to
reach coverage of all communities in the province.
Training
The National and the Provincial Departments, as well as Medical Schools are working in earnest to
ensure smooth transition and reintegration of the large number of returning students on the Nelson
Mandela Fidel Castro (NMFC) Medical Training Programme. A Steering Committee has been
established at the National Level with the participation of Provinces, where the following issues are
being discussed:
i. Identification of health facilities that can be utilized as training platforms.
ii. State of readiness of provincial clinical platforms (Audits of available resources and capacity.
are being conducted as part of this transition period.
iii. Funding mechanisms for the project.
iv. Monitoring and Evaluation framework for the project.
On the other hand, students recruited for studying in local universities prior to centralization bursaries
and those funded by the Office of the Premier but pursuing health related courses are also given the
support that they need to complete their studies. Monitoring and Evaluation visits are undertaken to
universities that host our students. Furthermore, students on the Graduate and Student Internship
Programme will be put on the mandatory course namely: Breaking Barriers to Entry (BB2E).

2020/21 Estimates of Provincial Revenue and Expenditure
67
The Department will continue to up skill Senior, Middle and Emerging Managers on identified courses,
however, cognizance shall be taken of the budget allocation. The Regional Training Centres shall also
continue to up skill health professionals on identified needs.
To ensure compliance, the department is planning to conduct continuous training and workshops on
MCS and SCM prescripts.
Environmental Health Services
The following paragraphs provide a framework within which the environmental health services in the
North West Province can be improved and as such, a background is first provided to understand the
current situation.
Environmental Health by its very nature is a preventative health service, thus it is part and parcel of
the greater PHC scenario.
Environmental Health is defined as: “the branch of public health that is concerned with all aspects of
the natural and built environment that may affect human health”. Other terms referring to or
concerning environmental health are environmental public health, and public health protection /
environmental health protection.
Environmental health has been defined in a 1999 document by the World Health Organization (WHO)
as:
“Those aspects of the human health and disease that are determined by factors in the environment. It
also refers to the theory and practice of assessing and controlling factors in the environment that can
potentially affect health.
Environmental health as used by the WHO Regional Office for Europe, includes both the direct
pathological effects of chemicals, radiation and some biological agents, and the effects (often indirect)
on health and well-being of the broad physical, psychological, social and cultural environment, which
includes housing, urban development, land use and transport”.
As of 2016 the WHO website on environmental health states "Environmental health addresses all the
physical, chemical, and biological factors external to a person, and all the related factors impacting
behaviours. It encompasses the assessment and control of those environmental factors that can
potentially affect health. It is targeted towards preventing disease and creating health-supportive
environments. This definition excludes behaviour not related to environment, as well as behaviour
related to the social and cultural environment, as well as genetics."

Department of Health
68
1.1 Aligning departmental budgets to achieve government’s prescribed outcomes
The National Development Plan (NDP) sets out nine (9) long-term health goals for South Africa. Five
of these goals relate to improving the health and well-being of the population, and the other four deals
with aspects of health systems strengthening.
By 2030, South Africa should have:
Raised the life expectancy of South Africans to at least 70 years;
Progressively improve TB prevention and cure;
Reduce maternal, infant and child mortality;
Significantly reduce prevalence of non-communicable diseases;
Reduce injury, accidents and violence by 50 per cent from 2010 levels;
Complete Health system reforms;
Primary healthcare teams provide care to families and communities;
Universal health care coverage; and
Fill posts with skilled, committed and competent individuals.
2. Review of the current financial year (2019/20)
The Department planned to strengthen availability of hospital level medications through monitoring of
stock levels using hospital dashboard to be rolled out by the National Department of Health (NDOH)
to hospital Pharmacies. Availability improved due to the supplier payments camps instituted by the
Administrator and the Chief Financial officer. The department has commenced to implement
sustainable pharmaceutical services with the experts from the NGO’s.
The department has procured 20 planned patient transporters, and 48 ambulances which will improve
the response time and coverage of emergency medical services. Planned patient transporters (PPTs)
are used to transport seated or ambulatory patients from one facility to referral health facilities.
In the fight against HIV and AIDS the department has increased the number of people on ART from
244 120 in 2017/18 to 278 802 currently. There are 18 functional units across the Province for the
provision of services to patients with MDR TB (initiation, monitoring and management).
The following projects started in 2019/20:
Witrand Hospital maintenance project is at 52per cent physical completion – R14 million contract;
JST Hospital Repair and Maintenance Project C (RAMP C) contractor started on site recently
R39 million;
Four projects on refurbishment of Heating and Ventilation and Air Conditioning (HVAC) for the
following facilities; MPH, Zeerust Hospital, General De La Rey Hospital and Schweizer Reneke
2020/21 Estimates of Provincial Revenue and Expenditure
69
Hospital are anticipated to kick start before end of financial year. These projects will have a total
of R15 million contract amount.
The following projects were completed in 2019/2020:
Boitekong CHC (new facility)
Jouberton CHC (new facility)
Mmakaunyane Clinic (new facility)
Mahikeng Provincial Hospital (maintenance)
Nursing Colleges
Number of intake at Training Colleges was:
Excelsius Nursing College
Intake in January (Students on study leave) 75
Mmabatho Nursing Colleges
Matriculants 31
Students on study leave 45
Total 76
Number of students graduated in September 2019
Excelsius Nursing College 166
Mmabatho Nursing College 135
North West University 28
Total 329
3. Outlook for the coming financial year (2020/21)
Infrastructure projects to be completed in 2020/21
Witrand Hospital maintenance project,
JST Hospital Repair and Maintenance Project C (RAMP C),
Excelsius Nursing College,
Four projects on refurbishment of Heating and Ventilation and Air,
Conditioning (HVAC) for the following facilities; MPH, Zeerust Hospital,
General De La Rey Hospital and Schweizer Reneke Hospital.

Department of Health
70
New projects to be started in 2020/21
Replacement of Motswedi Clinic;
Bophelong Psychiatric Hospital Phase 3;
Ventersdorp Bulk Pharmacy;
Delareyville Bulk Pharmacy;
Replacement of Rapulana Clinic
EMRS
Procure additional ambulances and response vehicles;
Develop an on-going fleet replacement plan; and
To capacitate government EMS services to have adequate resources to respond to emergencies
across the Province.
Tertiary Services
Implementation of delivery of medicines to hospitals at 70 per cent;
To ensure availability of essential drugs and medical suppliers in all facilities all the time.
Revitalization of the HCT campaign and implementation on HIV self-screening to reach the
UNAIDS 90-90-90 targets; to achieve 90-90-90 targets, the province must increase the number
of adult men on ART by 57241, the number of adult women on ART by 55952, and the number of
children on ART, by 8997, by December 2020 and
To conduct study on determining the best ways of preventing drug resistance.
NHI Pilot
The department of Health through the leadership of the political head, Executive Authority conducted
community engagements in the four districts in November 2019 to introduce NHI in preparation for the
parliamentary hearings. Internally, NHI Summit was conducted in December 2019 as the first contact
with all categories of health professionals to introduce the NHI Bill and to seek their inputs.
4. Reprioritisation
The department intends moving away from curative health care system to a preventative health care
system by strongly emphasising on Primary Health Care. The 2020/21 allocated budget was
reprioritised to cater for a preventative health care system. This approach will ensure a reduction of
long queues in our hospitals and clinics and provide a better service closer to patient homes in rural
areas.

2020/21 Estimates of Provincial Revenue and Expenditure
71
Reprioritization of services was done with consideration of the programme impact, resources needed
and the interest of the community and stakeholders to a particular health service. This was within the
equitable budget provided over the MTEF.
Reprioritisation of functions and activities in the 2020/21 financial year is crucial for the successful
implementation of the programmes considering the increasing health sector inflation and the
5 per cent cut of the baseline over the MTEF.
5. Procurement
The major /key projects include amongst others:
Klipgat CHC;
DoH Medical Stores. Refurbish;
Districts Generator Term Contracts Phase 2;
NMM & RSM Boiler Term Contracts Phase 2;
JST Mental Unit Refurbishment;
Deelpan Clinic-Parkhome;
Kopela Clinic-Parkhome;
Hardware and servers;
60 x Red Fleet;
10 x white fleet;
Medical and Allied Equipment for various Hospitals and Clinics;
Student Management System;
Invoice Tracking System.
Establishment of Infrastructure funds for 2019/20
The North West Department of Health has signed a protocol agreement with National Department of
Health. A tender has been awarded to the service provider for procurement and installation of eight
(8) Coal Fired Boilers for Mafikeng Provincial Hospital, Zeerust Hospital, Schweizer Reneke Hospital
and Gelukspan Hospital. The contract is for two boilers per hospital as well as a three-year service
maintenance.
Further to the above, the National Department of Health is also refurbishing Heating Ventilation and
Air Conditioning (HVAC) systems at Hospitals and they are also doing refurbishment at the
Klerksdorp/Shaping Hospitals as well as at Christiana Hospital.

Department of Health
72
6. Receipts and financing
6.1. Summary of receipts
Table 3.1 : Summary of receipts
OutcomeMain
appropriation
Adjusted
appropriation
Revised
estimateMedium-term estimates
R thousand 2016/17 2017/18 2018/19 2020/21 2021/22 2022/23
Equitable share 7 506 829 8 117 129 8 722 597 9 557 850 9 557 850 9 557 850 10 328 213 11 173 863 11 899 749
Conditional grants 2 028 496 2 304 501 2 417 932 2 478 748 2 530 791 2 530 791 2 779 238 2 993 170 3 146 246
Comprehensive HIV/AIDS & TB Component 1 137 969 1 296 769 1 342 812 1 475 402 1 475 402 1 475 402 1 613 750 1 832 651 1 929 799
Human Papillomavirus Vaccine Component – – 13 264 14 007 10 426 10 426 14 777 15 590 16 169
Health Facility Revitalisation Grant 502 812 597 118 615 992 508 549 527 993 527 993 597 158 580 598 613 906
Health Professions Training And Development Grant 111 565 119 194 126 107 132 452 132 452 132 452 141 863 148 146 153 637
Statutory Human Resource Component – – – 29 994 35 184 35 184 50 860 52 839 54 787
National Tertiary Services Grant 253 518 267 538 294 916 300 482 310 248 310 248 326 867 341 329 355 120
National Health Insurance Grant 8 090 – – – 21 224 21 224 21 191 22 017 22 828
Expanded Public Works Programme Incentive Grant For Provinces 2 000 2 000 2 000 2 000 2 000 2 000 – – –
Social Sector Expanded Public Works Programme Incentive Grant For
Provinces
12 542 21 882 22 841 15 862 15 862 15 862 12 772 – –
Donations 1 997 1 856 1 967 2 085 2 085 2 085 – – –
Financing – 100 000 320 428 150 000 150 000 150 000 – – –
Departmental receipts 73 058 76 711 80 547 85 058 85 058 85 058 89 736 94 582 99 122
Total receipts 9 610 380 10 600 197 11 543 471 12 273 741 12 325 784 12 325 784 13 197 187 14 261 615 15 145 117
2019/20
The department’s operations are funded through the equitable share, conditional grants and own
receipts from 2021/22. Equitable share constitutes 78.2 per cent of the total budget for 2020/21,
2021/22 and 78.3 and 78.5 per cent in the two (2) outer years.
Conditional Grants
The main objectives of the conditional grants within the department are as follows:
Comprehensive HIV/AIDS and TB Grant: To decrease the burden of disease related to the HIV
and tuberculosis epidemics; to minimise maternal and child mortality and morbidity; and to
optimise good health for children, adolescents and women.
Social Sector EPWP Grant: To incentivise Provincial Social Departments identified in the 2016
Social Sector EPWP Log-frame to increase job creation by focusing on the strengthening and
expansion of social service programmes that have employment potential.
Human Papillomavirus Vaccine (HPV) Grant: To address capacity constraints in the province
and to create an alternate track to speed up infrastructure delivery.
Health Facility Revitalisation Grant: To oversee the planning and construction of health
facilities to contribute towards the provision of comprehensive quality health services; and to
facilitate the upgrade, rehabilitation, replacement and renovation of clinics, community health
centres, district, regional, tertiary and specialized hospitals, as well as other health related
facilities. The grant is also used to provide technical support and monitor implementation of
maintenance at health facilities.
National Tertiary Services Grant: To ensure provision of tertiary health services in the North
West Province and to compensate tertiary facilities for the additional costs associated with
provision of Tertiary Services.
Health Professions Training and Development Grant and Human Resource Capacitation
Grant will be merge from 2020/21 financial year.

2020/21 Estimates of Provincial Revenue and Expenditure
73
National Health Insurance Grant: To expand the alternative models for dispensing and
distribution of chronic medication. To develop and roll out new health information systems in
preparation for NHI. To enable the health sector to address the deficiencies in primary health
care facilities systematically and to yield fast results through the implementation of the ideal clinic
programme.
Funds are allocated to non-negotiable items over the MTEF to ensure continued monitoring and
quality service in health facilities.
6.2. Departmental receipts collection
Table 3.2 : Summary of departmental receipts collection
OutcomeMain
appropriation
Adjusted
appropriation
Revised
estimateMedium-term estimates
R thousand 2016/17 2017/18 2018/19 2020/21 2021/22 2022/23
Tax receipts – – – – – – – – –
Casino tax es – – – – – – – – –
Horse racing tax es – – – – – – – – –
Liquor licences – – – – – – – – –
Motor v ehicle licences – – – – – – – – –
Sales of goods and serv ices other than capital assets 71 687 71 838 65 057 80 116 80 116 80 116 84 522 89 081 93 357
Transfers receiv ed – – – – – – – – –
Fines, penalties and forfeits – – – – – – – – –
Interest, div idends and rent on land – – – – – – – – –
Sales of capital assets – – – – – – – – –
Transactions in financial assets and liabilities 7 051 3 893 3 465 4 942 4 942 4 942 5 214 5 501 5 765
Total departmental receipts 78 738 75 731 68 522 85 058 85 058 85 058 89 736 94 582 99 122
2019/20
The department signed a Memorandum of Understanding (MOU) between Road Accident Fund in
relation immediate payment of Statutory Medical Reports. This will add value regarding additional
sources of revenue. The Electronic Data Interchange is implemented at all hospitals also continue to
improve collection at all hospitals in the medical schemes fraternity.
There are factors that negatively impact on collection of revenue and they include the following:
Approximately 88 per cent of patients attending the department’s health facilities are unable to
make a meaningful contribution in paying for the services provided;
The provision of free services to children under 6 years of age, pensioners, people with
disabilities, the unemployed and patients on the ART programme;
The on-going review of the Uniform Patient Fee Structure (UPFS), resulting in more groups being
included under the categories which exempt them from the payment of fees and the reduction in
fees payable by certain categories of patients.
Department has rolled rolling-out the ITC linked Patient Verification System in the current financial
year to the last seven hospitals which will result in nineteen hospitals in total. The aim is to reduce the
debtors’ book and increase revenue for the cash paying patients category. All cash paying patients
will be verified in relation to their employment status and this will reduce the debt volume.

Department of Health
74
Other Revenue Enhancement Strategies.
The department is continuously looking at different ways of enhancing revenue collection. Some of
the strategies the department will be embarking on in the financial year 2020/21 are:
Small Messages Services. (SMS)
This is one of the largest marketing strategies and communication tool used to transmit information to
patients owing the department. It can also serve as a debt collection mechanism for the department.
The success is dependent on the outcomes of the PVS to update contact numbers. The average cost
per sms is at R0.40 cents. The PAAB sms distribution module development is ongoing.
Public Private Partnerships.
Sectors like Medical Schemes and other Health Sectors partnered with the department are key role
players in the revenue generation value chain and health service provision. The department is
engaging these institutions to sign Memorandum of Understanding (MOU’s) as that is to the benefit of
the department and revenue maximisation.
Speed Point Payment System.
Cash payment system limits the patient’s choice on the mode of payments for the services rendered
and this at the same time reduce the volume of cash in transit to bank. It creates a choice for clients to
do payment with methods they would prefer. The costs attached to this mechanism include the
monthly rental fee of the equipment.
The revenue enhancement initiatives need some investment in modern revenue collection systems.
6.3 Donor funding
Amounts of R2 million in 2016/17, R1.9 million in 2017/18, R2 million and R2.1 million were allocated
respectively in 2018/19 and 2019/20 as donations which include R246 thousand (2016/17) for Job
Shimankane Hospital and Netcare is funding two (2) Registrar Posts for a period of four years from
2015/16 to 2019/20. These Registrars are based in Klerksdorp Tertiary Hospital. One Registrar has
since resigned and only one is left. Once the remaining Registrar complete training, he/she will work
for two years as a consultant in emergency medicine at Tshepong Hospital.

2020/21 Estimates of Provincial Revenue and Expenditure
75
7. Payment summary
7.1 Key assumptions
Key assumptions underpinning the development of the 2020 MTEF Budgets include:
Where justifiable, CPI projections were used to calculate inflation related items.
Revised inflationary projections for non-personnel items is 4.8 per cent in 2020/21, 4.8 per cent
in 2021/22 and 4.7 per cent in 2022/23.
Compensation of Employees is budgeted at 5.6 per cent, 5.5 per cent and 5.4 per cent over the
MTEF.
Pay progression across the public service is estimated at 1.5 per cent per annum.
The MTEF budget further makes provision for the following:
The department will continue to adhere to cost cutting measures over the MTEF;
The review of the Good & Services budget and redirect funds to overheating cost centres within
the District;
Reduction in Travel and Subsistence;
Reduction in number of meetings and using other alternative methods for meetings;
Reductions in number of conferences attended by an employee;
Prioritise the maintenance of facilities rather than building new facilities;
Engage private sector in other specialised services and recruit NGO or developmental partners
to provide health promotion and rehabilitation work;
Implementation of shared services concept;
Rationalisation of facilities; APP
Management of overtime & RWOPS;
Employment of additional staff to reduce the cost of overtime to avoid a situation where staff are
performing overtime exceeding 30 per cent of their basic salaries;
Proper gate-keeping for laboratory and blood tests;
Compliance to SCM prescripts;
Prompt payment of accounts to avoid interest charges;
Revise/reduce the targets in line with budget allocations;
Cutting on the operations meaning reduction of hours of services where there are fewer nurses
and staff;
Rationalisation by closing some facilities to pool the nurses and administration staff to high
volume sites - this will reduce access of health services to communities - but would reduce costs;
Clinical Managers are ensuring and encouraging clinical and health practitioners to order
laboratory test that are essential and appropriate for diagnosis;

Department of Health
76
More focus will be on maintenance and refurbishment of health facilities, than on building new
one;
Printing of documents will be reducing, thereby cutting paper and cartridges costs;
Participating in the RT15 Vodacom contract to implement the Invoice Tracking System to
improve timely payment of invoices.
7.2 Programme Summary
Table 3.3 : Summary of payments and estimates by programme: Health
OutcomeMain
appropriation
Adjusted
appropriation
Revised
estimateMedium-term estimates
R thousand 2016/17 2017/18 2018/19 2020/21 2021/22 2022/23
1. Administration 327 513 302 584 368 090 465 001 476 664 546 451 721 178 825 799 900 284
2. District Health Serv ices 5 012 583 5 334 825 5 952 423 6 191 922 6 247 964 6 530 538 6 409 910 7 010 137 7 402 023
3. Emergency Medical Serv ices 296 657 296 433 345 364 404 275 408 342 534 920 405 759 444 379 446 026
4. Prov incial Hospital Serv ices 1 463 908 1 555 446 1 723 940 1 850 044 1 840 044 1 927 957 2 176 077 2 084 926 2 150 511
5. Central Hospital Serv ices 1 398 183 1 552 646 1 763 535 1 912 184 1 942 150 2 097 246 2 000 229 2 179 501 2 283 409
6. Health Science And Training 466 991 390 486 386 321 387 954 374 967 374 967 335 243 448 647 538 458
7. Health Care Support Serv ices 233 586 237 242 298 327 432 433 420 281 509 913 551 633 687 628 810 500
8. Health Facilities And Maintenance 567 833 633 755 670 323 629 928 615 372 615 372 597 158 580 598 613 906
Total payments and estimates 9 767 254 10 303 417 11 508 323 12 273 741 12 325 784 13 137 364 13 197 187 14 261 615 15 145 117
2019/20
The overall budget of the department consists of eight programmes as indicated above including the
seven conditional grants of which Comprehensive HIV/AIDS grant comprises of four components and
Statutory Human Resource and Health Professions Training & Development Grant comprises of two
components.
Budget Allocation and Additional funding since 2016/17- 2021/22 MTEF
2016/17: The main appropriation for 2016/17 financial year was R9.461 billion adjusted to R9.676
billion which includes additional funds of R181.6 million that were directed to Compensation of
Employees and Goods and Services for the payment of accruals and the remaining funds were
directed to new mandates and other core items as well as a Roll-over of R33.8 million on Conditional
Grants. The department also prioritised funds for Cuban Medical Students amounting to R112 million.
The pharmaceutical budget was moved from District Health Services (Programme 2) to Health Care
Support Services (Programme 7) where it is managed as a medicine trading account.
During the past financial year, the national economic growth was revised downwards and the
equitable share and conditional grants allocation funding reduced. The budget reduction was targeted
at inefficiencies in the system, especially the non-core spending and the Compensation of Employees
which is currently threatening to overcrowd other spending priorities.
Roll overs: Health Facility Revitalisation Grant received R22.4 million, Comprehensive HIV/AIDS and
TB Grant R10.5 million, National Tertiary Service Grant R422 thousand and National Health
Insurance Grants R547 thousand.

2020/21 Estimates of Provincial Revenue and Expenditure
77
The department received a donation of R1.8 million from Netcare for four Registrar posts for a period
of four years which will end in 2019/20 and R246 thousand was also received for JST Hospital from a
donor.
2017/18: The appropriation for 2017/18 was R10.461 billion and adjusted to R10.600 billion,
R130 million was received as an additional allocation which included R50 million for the
implementation of Mobile Clinic Project, R50 million to alleviate pressure on Goods and Services
related to patient care namely medicine, laboratory services and medical supplies and R30 million
was allocated from the Indirect National Insurance Grant to the Health Facility Revitalisation Grant to
continue with the construction of Excelsius Nursing College.
R60 million was declared unspent on Compensation of Employees and machinery and equipment as
per EXCO resolution and redirected to medicine, laboratory services and medical supplies.
Changes to baseline: Sustained reduction on COE of R130.9 million was redirected to address
accruals. Furthermore, there was a reduction of R19.4 million on the ICT Transformation Programme.
An amount of R220 million was allocated to address accruals in Goods and Services.
Roll over of both equitable share and conditional grants was requested and approval granted.
Underspending was recorded at 2.8 per cent of the total vote.
2018/19: The main appropriation for 2018/19 financial year is R11.154 billion, an increase of
11.7 per cent as compared to 2017/18 Adjusted Budget. Compensation of Employees increased by
11.8 per cent and Goods and Services increased with 15.9 per cent. Transfers and Subsidies
allocation reduced by 16.8 per cent because expenditure relating to Cuban Programme will be
soothed. Capital Payments grew with 1.5 per cent because of the reduction in the Health Facility
Revitalisation Grant.
Changes to baseline: Additions maintained from (2016/17, 2017/18) amounts to R544.7 million as
well R58 million as a reduction to the Provincial Equitable Share. Furthermore, Equitable Share was
also reduced which is inclusive of bursaries of R81.8 million, R144.1 million was received as
additional funds towards medicine, medical supplies and laboratory services.
The adjusted budget for the financial year amounts to R11.543 billion inclusive of R8.723 billion for
equitable share of which: R111.4 million was a roll-over of unspent funds from preceding year and
R209 million as additional to deal with accruals. Conditional Grants of R2.418 billion (which includes
roll-overs of R69.5 million) and Own Revenue of R80.5 million.
2019/20: The revised appropriation for the 2019/20 is R12.273 billion, a 6.3 per cent increase from
2018/19 financial year. Current Payments is allocated 94 per cent of the budget, with Compensation
of Employees allocated 63.3 per cent. Goods and Services declined with 5.6 per cent due to
prioritisation of filling of vacant posts. Transfers and Subsidies is allocated less than 5.5 per cent and

Department of Health
78
Capital Payments is less than 19.2 per cent with Building and Fixed Structures less 34.4 per cent with
a 31.6 per cent increase on Machinery and Equipment for procurement of medical equipments.
Roll over of R210 million was requested for Health Facility Revitilisation grant amounting to
R19 444 million and for National Tertiary Services Grant for R9 677 million and was approved.
Changes to baseline: Maintained additional to baseline from (2016/17, 2017/18) amounts to
R777.3 million and Equitable Share reduction of R61.2 million. Included is the sustained CoE
reduction of R146 million and ICT Transformation Programme of R21.7 million. It further includes
additional allocation of R154.8 million to augment allocation for Health priorities such as Medical
Suppliers, Medicine and National Laboratory Services. Additional R54.2 million for PES Adjustments
and R83 million for additions to baseline adjustment. An amount of R81.6 million is reduced on
bursaries for 2019/20 financial year that are centralised at Office of the Premier. The additional
allocation on equitable share is earmarked for amongst other to fund key priorities such as to
supplement the maintenance of health facilities, Compensation of Employees’ liabilities for previous
years, accruals and appointment of critical personnel mainly to expand the 24-hour service at least
with one clinic in each district.
2020/21: The main appropriation for 2020/21 financial year is R13.197 billion. The increased funds
are directed to Compensation of Employees which needed to be aligned with the Improvement of
Condition of Service (ICS) and embedded in it, is funding for filling of vacant posts. Medicine,
Laboratory Services and Medical Suppliers has been prioritised for 2020/21 financial year to
effectively carry departmental mandate.
Earmarked Funds: Funds set aside, is the minimum amount that department must allocate for
specific priorities such as Laboratory Services of R176.2 million, Medical Suppliers of R308.3 million,
Medicine of R358.1 million. The department has the prerogative to supplement the allocation in line
with funding requirements. Funding set aside for CoE liabilities of R110.4 million is intended to
supplement and address outstanding pay progression and performance bonus up until 31st March
2020.
2021/22: The baseline for 2021/22 is R14.262 billion, inclusive of R66.9 million for Cuban Doctors.
Increase on Good and Services is mainly on Laboratory Services, Medical Suppliers and Medicine
and are allocated more than 20 per cent due to increased number of headcount to health facilities.
Earmarked Funds: An amount of R319.6 million, R290.1 million and R500.7 million is earmarked as
a minimum for Laboratory Services, Medical Services and Medicine. In addition, R117.3 million is
reduced from Infrastructure Equitable Share and redirected for Goods and Services pressures.
2022/23: The baseline for 2022/23 is R15.145 billion. Health related funding for Cuban Doctors is
allocated R69.2 million. Compensation of Employees is allocated 4.8 per cent to ensure that the
excess is repriorised for key budget pressure.

2020/21 Estimates of Provincial Revenue and Expenditure
79
Earmarked Funds: Earmarked funds for Laboratory Services is R330.3 million, Medical Suppliers of
R301.1 million and Medicine of R507.8 million as minimum. Additional R126.7 million is reduced from
Equitable Share Infrastructure to Goods and Services to reduce pressure on Goods and Services
pressures.
Summary of economic classification
Table 3.4 : Summary of provincial payments and estimates by economic classification: Health
OutcomeMain
appropriation
Adjusted
appropriation
Revised
estimateMedium-term estimates
R thousand 2016/17 2017/18 2018/19 2020/21 2021/22 2022/23
Current payments 8 854 806 9 418 272 10 654 713 11 495 849 11 577 106 12 386 547 12 537 387 13 408 663 14 195 566
Compensation of employ ees 6 051 077 6 412 002 7 165 979 7 774 012 7 809 500 8 035 434 8 552 695 8 838 276 9 262 844
Goods and serv ices 2 802 201 3 005 112 3 483 141 3 719 320 3 762 023 4 344 965 3 982 525 4 567 609 4 929 859
Interest and rent on land 1 528 1 158 5 593 2 517 5 583 6 148 2 167 2 778 2 863
Transfers and subsidies to: 312 099 244 048 203 042 204 547 182 155 183 406 169 113 253 094 334 468
Prov inces and municipalities – – – – – – – – –
Departmental agencies and accounts 16 762 18 891 18 955 21 000 21 000 21 000 20 000 23 210 24 324
Higher education institutions – – – – – – – – –
Foreign gov ernments and international organisations – – – – – – – – –
Public corporations and priv ate enterprises – – – – – – – – –
Non-profit institutions 6 482 – – – – 360 – – –
Households 288 855 225 157 184 087 183 547 161 155 162 046 149 113 229 884 310 144
Payments for capital assets 600 349 641 097 650 568 573 345 566 523 567 411 490 687 599 858 615 083
Buildings and other fix ed structures 501 347 550 013 536 197 364 117 380 262 380 258 280 340 361 703 405 702
Machinery and equipment 99 002 91 084 114 371 209 228 186 261 187 153 210 347 238 155 209 381
Heritage Assets – – – – – – – – –
Specialised military assets – – – – – – – – –
Biological assets – – – – – – – – –
Land and sub-soil assets – – – – – – – – –
Softw are and other intangible assets – – – – – – – – –
Payments for financial assets – – – – – – – – –
Total economic classification 9 767 254 10 303 417 11 508 323 12 273 741 12 325 784 13 137 364 13 197 187 14 261 615 15 145 117
2019/20
The above budget is geared towards ensuring speeding up performance through implementation of
health reforms that will benefit the community especially uninsured who regularly visit public
institutions for medical diagnostic and treatment.
Current Payments: The allocation for current payments (includes Compensation of Employees,
Goods and Services and interest & rent on land) is, R12.5 billion in 2020/21, R13.4 billion in 2021/22
and R14.2 million in the outer year.
Compensation of Employees: The Department adjusted the allocations from 2019/20 to 2021/22 to
accommodate personnel costs. The department is projecting growth in personnel numbers over the
MTEF to make provision for the staffing of new and expanded facilities and retention of health
Professionals who are bursary holders of the department, low level category posts and to cater for the
return of the Cuban trained Medical Officers. R110.4 million has been injected to Compensation of
Employees for payment of outstanding staff liabilities.
Following the invoking of section 100(1) (b) of the Constitution, the Administrator of the department is
in a process of developing a new structure for the department in line with its needs and allocated
budget taking into account issues of Workplace Indicators for Staffing Needs (WISN) and proposed
structures for non-core services from the Department of Public Service and Administration (DPSA).

Department of Health
80
This Process might also result in the rationalization of services and facilities. The structures of all
hospitals are based on the Ministerial gazette, but an amendment to this gazette is envisaged.
Since the invoking of section 100(1)(b) of the Constitution, the department reports to the National
Minister for Health who approves the advertisements and filling of posts. The department identified a
list of critical managerial as well as low level posts that should be filled over the MTEF. The filling of
posts will reduce the costs on overtime by appointing additional staff. Since 2017/18, the Auditor
General has been concerned about the high vacancy rate, especially at higher positions that were not
filled. Replacement of critical skills is prioritized over filling of support posts.
The department has prioritized the filling of critical posts, including core and support posts, however
health professional posts are being prioritized above administration posts. The department will strive
to fill posts at facilities being refurbished and revitalized through the process of identifying critical
posts. The cost to fill a post is dependent on the type of position being filled. OSD positions are more
costly to fill than non-OSD positions. Due to the nature of the service the department renders, most of
the positions to be filled are OSD related. Over and above, 65 Cuban trained students must be
absorbed from 2018/19 as Medical Interns and from 2019/20 as Medical Officers that must complete
Community Service.
Allocation for this economic classification has been increased to cater for current headcounts and
Improvement of Conditions of Service within the Programmes, where there was a shortage.
The following Grants are also allocated within the Departmental Compensation of Employees:
National Tertiary Services, Statutory Human Resource Component, Health Professional Training and
Development, Comprehensive HIV/AIDS and TB component, National Health Insurance Grant, Social
Sector EPWP Grant and Human Papillomavirus Vaccine Component.
Goods and Services: The allocated funds from 2020/21 financial year, are directly in line with CPIX,
the increase in demand for health services and the high rate of inflation on medical supplies and
services, Medicine and Security Services. Other contributing factors are increased costs related to
Patient Catering, Electricity, Laboratory Services etc., and some of the projects mentioned by MEC in
the budget speech such as the reduction of infant and child mortality through immunization,
awareness of activities to reduce chronic illness to employees and the community, branding of ideal
clinic without and additional funding received.
Inclusive in the allocation for 2020/21 to 2022/23 are earmarked funds to assist the Department with
Accruals on Laboratory Services, Medical Supplies and Medicine and to reduce pressure on security
services, patient catering, medical Waste and Electronic Patient Record System to avoid litigations
and to improve audit outcomes on predetermined objectives.
Other items which had an impact on costs for Goods and Services include, high costs of Medical
Supplies that affects allocations for Tertiary Hospitals that are exceeding their quarterly target that

2020/21 Estimates of Provincial Revenue and Expenditure
81
found expression in the allocation. Included are cost of sustaining the MDR/XDR and to cover all
(YES list) requirement of attaining status of treating certain deceases/discipline in the province.
The fluctuating rand/dollar exchange poses a challenge concerning the allocation of drugs. However,
the department is maintaining an increase on the allocation of medicine over the MTEF. The
challenge from 2018/19 financial year with availability of drugs is caused by the fact that some of
major suppliers are constantly out of stock and some do not comply with procurement process.
Increase in costs for patients catering is determined by the cost per PDE that is also high at Tertiary
Services and other targets.
Transfers and subsidies: The increase is vital to cater for more than 400 Cuban medical students
and other health professionals studying in the country. Social benefits and Skills Levy have been
calculated up to 30 per cent SETA/s – one third for Administration and two thirds to fund discretionary
projects amounting to R20 million on levy for the department per annum.
Payments for capital assets: Amid the allocation, the Department intends to procure CT Scans for
Mafikeng Provincial, Vryburg and Potchefstroom Hospital. Procurement of Red Fleet to reinforce
service delivery to the citizens residing in both rural and urban areas by improving response time.
Procurement of White Fleet will also reduce on kilometre claims by officials. In addition, to procure
modernised medical and allied equipment. Building and Fixed Structures allocation will not focus on
building new facilities but rather on upgrading and maintaining identified dilapidated buildings. Details
of all infrastructure related projects are within the B5.
7.3 Infrastructure payments
Table 3.5 : Summary of provincial infrastructure payments and estimates by category
OutcomeMain
appropriation
Adjusted
appropriation
Revised
estimateMedium-term estimates
R thousand 2016/17 2017/18 2018/19 2020/21 2021/22 2022/23
Existing infrastructure assets 255 186 205 636 318 877 402 955 397 226 397 226 431 445 282 438 266 063
Maintenance and repairs 64 989 55 156 89 125 137 721 112 548 112 548 146 508 145 238 136 829
Upgrades and additions 164 487 144 350 222 240 226 819 246 263 246 263 149 514 126 700 124 234
Refurbishment and rehabilitation 25 710 6 130 7 512 38 415 38 415 38 415 135 423 10 500 5 000
New infrastructure assets 310 646 427 547 349 793 192 973 184 146 184 146 131 713 262 160 311 843
Infrastructure transfers – – – – – – – – –
Current – – – – – – – – –
Capital – – – – – – – – –
Infrastructure payments for financial assets – – – – – – – – –
Infrastructure leases – – – – – – – – –
Non infrastructure – – – 32 000 32 000 32 000 34 000 36 000 36 000
Total department infrastructure 565 832 633 183 668 670 627 928 613 372 613 372 597 158 580 598 613 906
1. Total provincial infrastructure is the sum of "Capital" plus "Recurrent maintenance". This includes non infrastructure items.
2019/20

Department of Health
82
7.4.1 Departmental infrastructure payments
Detail on infrastructure investment estimated as referred to in Table B5.
7.4.2 Maintenance (Table B5)
The emphasis for the 2020/21 financial year allocation for all maintenance will be sourced from the
Health Facilities Revitalisation grant. Details of refurbishment and upgrading of health facilities is
outlined in the B5 which will be in line with the conversion of health facilities to meet the National Core
Standards and the Ideal Clinic Status. This will be achieved through the implementation of a
Maintenance Policy.
7.4.3 Non-infrastructure items (Table B5)
Compensation of Employees is meant for salary related expenditure for personnel within the Chief
Directorate. Goods and Services allocation includes items/activities related to Quality Assurance to
assist in compliance of National Core Standards.
7.4 Departmental Public-Private Partnership (PPP) projects
None
7.5 Transfers
None
7.6.1 Transfers to public entities
None
7.6.2 Transfers to other entities

2020/21 Estimates of Provincial Revenue and Expenditure
83
Table 3.6 : Summary of departmental transfers to other entities
OutcomeMain
appropriation
Adjusted
appropriation
Revised
estimateMedium-term estimates
R thousand 2016/17 2017/18 2018/19 2020/21 2021/22 2022/23
Ragoga – – – – – – – – –
Ditlamelw a Trading Enterprise – – – – – – – – –
Roucomp Sy stem – – – – – – – – –
Masedi Project – – – – – – – – –
Life Line – – – – – – – – –
Mpho y a bophelo – – – – – – – – –
Life Line Rustenburg – – – – – – – – –
North West Life Line – – – – – – – – –
Skills dev elopment Lev y – – – – – – – – –
High Education institutions – – – – – – – – –
Tapologo 6 482 – – – – – – – –
Total departmental transfers 6 482 – – – – – – – –
2019/20
Transfers to public entity were allocated during 2015/16 and 2016/17 and no further allocations are
made over the MTEF.
7.6.3 Transfers to local government
None
8. Receipts and retentions: Provincial Legislature
Not applicable.
9. Programme description
Programme 1: Administration
Description and objectives
Programme Purpose
The aim of the Programme is to provide strategic management and administrative support to all
departmental programmes. The Programme’s function is to ensure that health services are rendered
in accordance with approved policies and that comprehensive and better health care services are
coordinated in the Province.
The Programme has two sub-programmes namely, Office of the MEC and Management.
Strategic objectives
To strengthen financial and supply chain Management System;
To provide appropriate Human Resources for Health by 2021;
To strengthen health information systems by 2021; and
To strengthen records management system and programs by 2021.

Department of Health
84
Programme expenditure analysis
Table 3.7 : Summary of payments and estimates by sub-programme: Programme 1: Administration
OutcomeMain
appropriation
Adjusted
appropriation
Revised
estimateMedium-term estimates
R thousand 2016/17 2017/18 2018/19 2020/21 2021/22 2022/23
1. Office Of The Mec 7 589 7 497 7 452 9 789 11 954 11 954 11 493 10 942 11 467
2. Management 319 924 295 087 360 638 455 212 464 710 534 497 709 685 814 857 888 817
Total payments and estimates 327 513 302 584 368 090 465 001 476 664 546 451 721 178 825 799 900 284
2019/20
Table 3.8 : Summary of payments and estimates by economic classification: Programme 1: Administration
OutcomeMain
appropriation
Adjusted
appropriation
Revised
estimateMedium-term estimates
R thousand 2016/17 2017/18 2018/19 2020/21 2021/22 2022/23
Current payments 310 450 285 883 350 456 448 036 451 388 521 175 702 710 806 420 879 977
Compensation of employ ees 189 703 196 056 201 513 228 245 228 245 228 245 232 652 251 527 271 445
Goods and serv ices 120 034 89 791 147 182 219 606 222 546 292 333 469 683 554 687 608 316
Interest and rent on land 713 36 1 761 185 597 597 375 206 216
Transfers and subsidies to: 13 279 15 258 15 580 15 535 23 846 23 846 16 413 16 879 17 689
Prov inces and municipalities – – – – – – – – –
Departmental agencies and accounts – – – – – – – – –
Higher education institutions – – – – – – – – –
Foreign gov ernments and international organisations – – – – – – – – –
Public corporations and priv ate enterprises – – – – – – – – –
Non-profit institutions – – – – – – – – –
Households 13 279 15 258 15 580 15 535 23 846 23 846 16 413 16 879 17 689
Payments for capital assets 3 784 1 443 2 054 1 430 1 430 1 430 2 055 2 500 2 618
Buildings and other fix ed structures – – – – – – – – –
Machinery and equipment 3 784 1 443 2 054 1 430 1 430 1 430 2 055 2 500 2 618
Heritage Assets – – – – – – – – –
Specialised military assets – – – – – – – – –
Biological assets – – – – – – – – –
Land and sub-soil assets – – – – – – – – –
Softw are and other intangible assets – – – – – – – – –
Payments for financial assets – – – – – – – – –
Total economic classification 327 513 302 584 368 090 465 001 476 664 546 451 721 178 825 799 900 284
2019/20
Commencing from 2019/20 financial years, kilometer log sheets, legal cost, audit fees and Security
Services allocations were removed from Public Health Care Programmes to this programme. The
rationale for this movement is to ensure that the allocation in the Public Health Care Programmes is
mainly focused on service delivery driven items i.e. Patient Catering and National Health Laboratory
Services (NHLS). The reallocation of funds from other Programmes, attribute to the above inflationary
increase on the programme. Security budget will also be managed from this programme to avoid
threats by Security companies to abandon institutions when payments are not made.
Sub programme 1: Office of the MEC is allocated R11.5 million in 2020/21 to adequately fund all
activities and mandates of the Political Head of the Department. Salary of the MEC is also inclusive in
the allocation.
Sub programme 2: Management is allocated R709.7 million in the first year, the above inflation
growth in 2020/21 is due to the centralisation of security budget for the entire health facilities in the
Province, kilometre log sheets, audit fees and legal cost, that are management in the Programme.
R814.9 million is allocated in 2021/22 and R888.8 million to cater for all items mentioned and to
enable the programme to play its oversight role.
Compensation of Employees: The allocation has increased to R232.7 million in 2020/21 to cater for
filling of vacant posts and payment of staff liabilities, R251.5 million is allocated for 2020/21 and
R271.4 million in the outer year.

2020/21 Estimates of Provincial Revenue and Expenditure
85
Goods and Services: Allocated R469.7 million in 2020/21 financial year due to centralisation of
functions that are managed in the Programme to ensure regular payments. An increase of
R554.7 million in 2021/22 and R608.3 million in the outer year is recorded.
Transfers and Subsidies: The Economic Classification is allocated R16.4 million in 2020/21,
R16.9 million in 2021/22 and R17.7 million in the outer year for payments of lawsuits and staff
benefits.
Machinery and Equipment: An amount of R2.1 million will be allocated in 2020/21 and increase to
R2.5 million in 2021/22 for procurement of office furniture and equipment.
The sub-programme’s budget is allocated to cost centers/directorates in line with departmental
delegations to enable them to perform administrative function for the entire department. Demand and
Acquisition were allocated funds for key operations of the program (i.e. property payments, and
communication) while Assets & Inventory Management budget is for all assets and inventory items for
the New Office Park residence.
Service delivery measures
Table 3.9 : Service delivery measures - Programme 1: Administration
Estimated
performanceMedium-term estimates
Programme performance measures 2019/20 2020/21 2021/22 2022/23
Audit opinion from Auditor General 0 Adv erse Audit findings reduced by 50%Adv erse Audit findings reduced by 50%Adv erse Audit findings reduced by 50%
Percentage compliance w ith the approv ed demand and procurement plan 0 1 1 1
Percentage of inv oices paid w ithin 30 day s 0 1 1 1
Percentage of reduced accruals – 0 0 0
Number of Medical officers per 100 000 people – 26 26 26
Number of Professional nurses per 100 000 people – 127 127 127
Number of pharmacists per 100 000 people – 8 8 8
Rev iew ed and approv ed HR structure – – – –
Integrated electronic and records management sy stem dev eloped – – – –
Dev eloped security insourcing framew ork – – – –
Percentage of facilities on Ideal clinic program comply ing to information management tool 1 – – –
No. of audit qualification areas – 2 – –
% reduction in Medico Legal cases – 0 0 0
No of approv ed safety and security strategies – 1 1 1
% of reduced security incidents – 0 0 0
No. of approv ed Costed HRH Plans – 1 1 1
No. of CHWs appointed – 7 200 8 400 9 600
Number of PHC facilities w ith functional Clinic committees – 298 298 298
Number of Hospitals w ith functional hospital boards – 17 17 17
NB: “For A Comprehensive list of Output Indicators refer to the 2020/21 APP”
Programme 2: District Health Services
Description and objectives
Programme Purpose
The purpose of the Programme is to provide accelerated promotive, preventive, curative, rehabilitative
and palliative health care services in an accessible, affordable, equitable and integrated manner. This
Department of Health
86
will be achieved through incorporation of finance, Human resource, information and technology,
leadership, infrastructure and pharmaceuticals (WHO Health Systems Building Blocks).
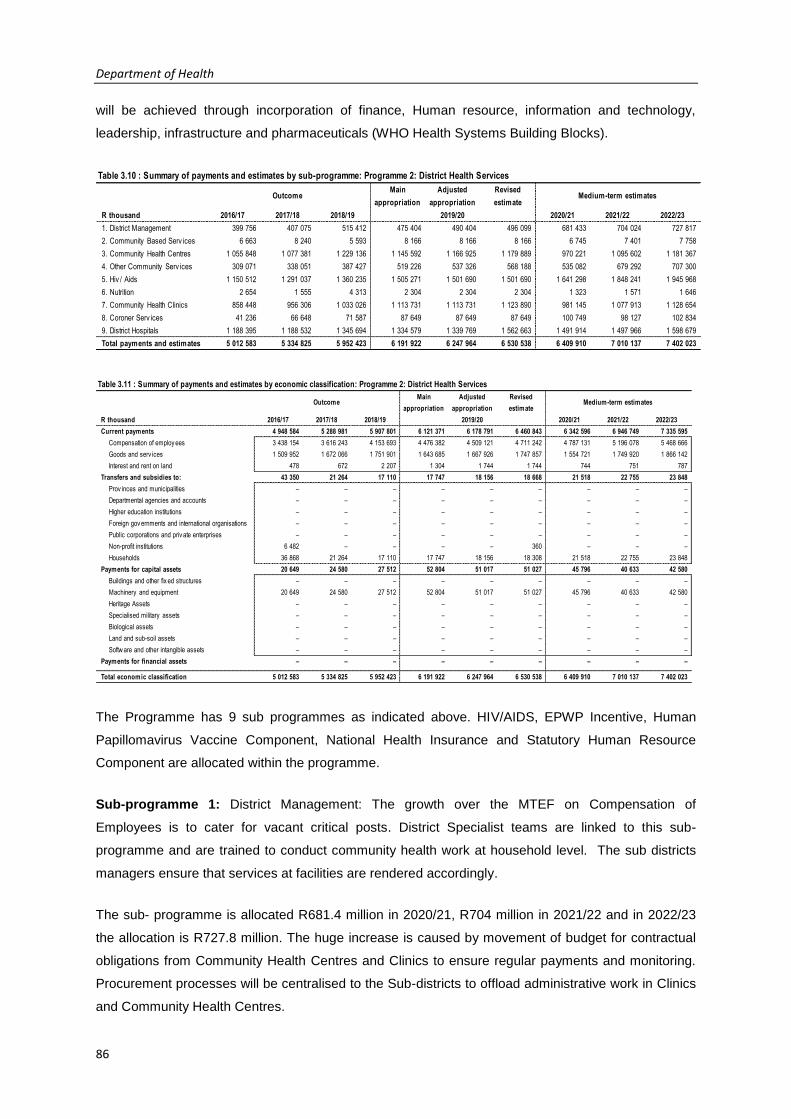
Table 3.10 : Summary of payments and estimates by sub-programme: Programme 2: District Health Services
OutcomeMain
appropriation
Adjusted
appropriation
Revised
estimateMedium-term estimates
R thousand 2016/17 2017/18 2018/19 2020/21 2021/22 2022/23
1. District Management 399 756 407 075 515 412 475 404 490 404 496 099 681 433 704 024 727 817
2. Community Based Serv ices 6 663 8 240 5 593 8 166 8 166 8 166 6 745 7 401 7 758
3. Community Health Centres 1 055 848 1 077 381 1 229 136 1 145 592 1 166 925 1 179 889 970 221 1 095 602 1 181 367
4. Other Community Serv ices 309 071 338 051 387 427 519 226 537 326 568 188 535 082 679 292 707 300
5. Hiv / Aids 1 150 512 1 291 037 1 360 235 1 505 271 1 501 690 1 501 690 1 641 298 1 848 241 1 945 968
6. Nutrition 2 654 1 555 4 313 2 304 2 304 2 304 1 323 1 571 1 646
7. Community Health Clinics 858 448 956 306 1 033 026 1 113 731 1 113 731 1 123 890 981 145 1 077 913 1 128 654
8. Coroner Serv ices 41 236 66 648 71 587 87 649 87 649 87 649 100 749 98 127 102 834
9. District Hospitals 1 188 395 1 188 532 1 345 694 1 334 579 1 339 769 1 562 663 1 491 914 1 497 966 1 598 679
Total payments and estimates 5 012 583 5 334 825 5 952 423 6 191 922 6 247 964 6 530 538 6 409 910 7 010 137 7 402 023
2019/20
Table 3.11 : Summary of payments and estimates by economic classification: Programme 2: District Health Services
OutcomeMain
appropriation
Adjusted
appropriation
Revised
estimateMedium-term estimates
R thousand 2016/17 2017/18 2018/19 2020/21 2021/22 2022/23
Current payments 4 948 584 5 288 981 5 907 801 6 121 371 6 178 791 6 460 843 6 342 596 6 946 749 7 335 595
Compensation of employ ees 3 438 154 3 616 243 4 153 693 4 476 382 4 509 121 4 711 242 4 787 131 5 196 078 5 468 666
Goods and serv ices 1 509 952 1 672 066 1 751 901 1 643 685 1 667 926 1 747 857 1 554 721 1 749 920 1 866 142
Interest and rent on land 478 672 2 207 1 304 1 744 1 744 744 751 787
Transfers and subsidies to: 43 350 21 264 17 110 17 747 18 156 18 668 21 518 22 755 23 848
Prov inces and municipalities – – – – – – – – –
Departmental agencies and accounts – – – – – – – – –
Higher education institutions – – – – – – – – –
Foreign gov ernments and international organisations – – – – – – – – –
Public corporations and priv ate enterprises – – – – – – – – –
Non-profit institutions 6 482 – – – – 360 – – –
Households 36 868 21 264 17 110 17 747 18 156 18 308 21 518 22 755 23 848
Payments for capital assets 20 649 24 580 27 512 52 804 51 017 51 027 45 796 40 633 42 580
Buildings and other fix ed structures – – – – – – – – –
Machinery and equipment 20 649 24 580 27 512 52 804 51 017 51 027 45 796 40 633 42 580
Heritage Assets – – – – – – – – –
Specialised military assets – – – – – – – – –
Biological assets – – – – – – – – –
Land and sub-soil assets – – – – – – – – –
Softw are and other intangible assets – – – – – – – – –
Payments for financial assets – – – – – – – – –
Total economic classification 5 012 583 5 334 825 5 952 423 6 191 922 6 247 964 6 530 538 6 409 910 7 010 137 7 402 023
2019/20
The Programme has 9 sub programmes as indicated above. HIV/AIDS, EPWP Incentive, Human
Papillomavirus Vaccine Component, National Health Insurance and Statutory Human Resource
Component are allocated within the programme.
Sub-programme 1: District Management: The growth over the MTEF on Compensation of
Employees is to cater for vacant critical posts. District Specialist teams are linked to this sub-
programme and are trained to conduct community health work at household level. The sub districts
managers ensure that services at facilities are rendered accordingly.
The sub- programme is allocated R681.4 million in 2020/21, R704 million in 2021/22 and in 2022/23
the allocation is R727.8 million. The huge increase is caused by movement of budget for contractual
obligations from Community Health Centres and Clinics to ensure regular payments and monitoring.
Procurement processes will be centralised to the Sub-districts to offload administrative work in Clinics
and Community Health Centres.

2020/21 Estimates of Provincial Revenue and Expenditure
87
Sub-programme 2: Community Based Services: Allocation is reduced to R6.7 million in 2020/21,
R7.4 million in 2020/22 and R7.7 million in the outer year due to reprioritisation.
Within the allocation, the following activities are managed:
Monitor the implementation of youth-friendly health services;
Monitor the mainstreaming of gender, disability and Youth into departmental policies and
programmes;
Monitor the strengthening of health governance structures (Hospital Boards, Clinic Committees,
Sub-districts governance Structures, District Health Councils, Provincial Health Consultative
Forum);
Monitor and ensure the inclusion of Traditional Health Practitioners in the Health System;
Monitor Poverty Alleviation, Comprehensive Rural Development Programmes.
Sub-programme 3: The Community Health Centres: The sub programme’s allocation is reduced in
2020/21 to R970.2 million as compared to the two previous years due to the reallocation of Medicine
budget to Programme 7 (Health Care Support Services) with legal cost, audit fees and kilometre log
sheets reallocated to Programme 1 (Administration). From 2020/21, the allocation for contractual
obligations has been moved to District Management to ensure regular payments and proper
monitoring. The sub-programme further grows with R1.096 billion in 2021/22 and R1.181 billion in the
outer year.
Sub-programme 4: Other community services register high growth of R535.1 million in 2020/21,
R679.3 million in 2021/22 and R707.3 million in the outer year. A total number of 800 Community
Service Health Professionals joined the department. The budget furthermore, increased to provide for
Cuban Doctors who will be returning to the country and R66.9 million in 2021/22 and R69.9 million is
inclusive in the 2022/23 financial year. The bulk of the allocation is paying salaries and part is
allocated to Goods & Services and Transfers & Subsidies. Included in the allocation is earmarked
funds for Laboratory services (Blood Services, NHLS) Patient Catering, Medical Waste and Security
Services over the MTEF. These funds are allocated to this sub-programme to ensure that they are
utilised for the intended purpose.
Sub-programme 5: HIV/AIDS is allocated R1.641 billion in 2020/21, R1.848 billion in 2021/21 and
R1.946 million. The allocation will be used to decrease the burden of disease related to the HIV and
Tuberculosis epidemics; to minimise maternal and child mortality and morbidity; and to optimise good
health for children, adolescents and women. R14.8 million, R15.6 million and R16.2 million
respectively over the MTEF for the Human Papillomavirus Vaccine Component and R12.7 million is
for EPWP Incentive Grant.
Sub-programme 6: Nutrition declined to R1.323 million 2020/21, R1.571 million in 2021/21 and
R1.646 in the outer year because of the reprioritisation.
Department of Health
88
Sub-programme 7: Community Health Clinics are rendering Primary Health Care at the early stage.
Some clinics within the Province are rendering 24 hours service. The sub-programme’s budget grows
above inflationary projections, it is allocated R981.1 million in 2020/21 with R1.078 million and
R1.129 million in the two outer years. Payment of contractual obligations has been moved to District
Management for monitoring and reporting. Medicine budget for the sub-programme is within Medical
Stores in Programme 7. The rationale is to ensure distribution of medicine at clinics are done as and
when requested.
Sub-programme 8: Coroner services: The provision for Forensic Services, directed at ensuring
impartial professional evidence for the criminal justice system concerning death due to unnatural
causes is reflected under this sub-programme.
The Forensic Pathology Services are operational in the four Districts, 8 Medico-legal mortuaries are
located as follows:
M2 level in NMM (Lichtenburg and MPH accommodates 250 - 500 bodies each);
M3 level in Dr. RSM (Joe Morolong which accommodate 500 - 1000 bodies);
M4 level in Dr. KK (Potchefstroom and Klerksdorp facilities accommodates 1000 – 1500 bodies);
M5 level in Bojanala (Phokeng and Brits accommodates 1500 - 2000 bodies).
Allocation for the sub programme is R100.7 million in 2020/21, R98.1 million in 2021/22 and
R102.8 million in the outer year. Allocations are mainly for Medical Supplies as the main cost driver in
the sub-programme. Most of forensic mortuaries are situated in the district hospitals and
administration functions are perform where there are stationed.
Sub-programme 9: The District Hospitals: 13 District hospitals are rendering level 1 care to both
insured and uninsured communities. The sub programme is allocated R1.492 billion in 2020/21,
R1.498 billion and R1.599 in the outer years. Medicine budget is within the allocation due to gazetting
and most funds are allocated to non-negotiable items.
Compensation of Employees: Allocation for 2020/21 is R4.787 billion in 2021/22 is R5.196 billion
and R5.469 billion is inclusive of EPWP, HPV, National Health Insurance, HIV/AIDS and Statutory
Human Resource Component.
Goods and Services: The Economic Classification is allocated R1.555 billion in 2020/21,
R1.750 billion in 2021/22 and R1.866 billion in the outer year. The allocation is mainly on non-
negotiable items to ensure optimum health care to the citizens and to procure Medical and Allied
Equipment less than 5 000.
Transfers and subsidies is allocated R21.5 million in 2020/21, R22.8 million in 2021/22 and
R23.8 million in the outer year for payment of staff liabilities.

2020/21 Estimates of Provincial Revenue and Expenditure
89
Machinery and Equipment: An amount of R45.8 million in 2020/21 and further decrease to
R40.6 million in 2021/22.
Service delivery measures
Table 3.12 : Service delivery measures - Programme 2: District Health Services
Estimated
performanceMedium-term estimates
Programme performance measures 2019/20 2020/21 2021/22 2022/23
Ideal clinic status determinations conducted by Perfect Permanent Team for Ideal Clinic Realisation and Maintenance (PPTICRM) rate (fix ed clinic/CHC/CDC) ≥99% ≥99 ≥99 ≥99
Percentages of facilities that maintained the ideal clinic status ≥90% _>95% _>95% _>95%
Ideal clinic status rate ≥48% ≥55% ≥60% ≥60%
Complaint Resolution w ithin 25 w orking day s rate (PHC) ≤2 ≤2 ≤2 ≤2
Av erage Length of Stay (District Hospitals) 0 0 0 0
Inpatient Bed Utilization Rate (District Hospitals) 4-6 day s 4 – 6 day s 4 – 6 day s 4 – 6 day s
Ex penditure per PDE (District Hospitals) 60% - 75% 60% - 75% 60% - 75% 60% - 75%
Complaint Resolution w ithin 25 w orking day s rate (District Hospitals) R2500 – R3000 R2500 – R3000 R2500 – R3000 R2500 – R3000
ART Client remain on ART end of month – Total ≥85% ≥85% ≥85% ≥85%
HIV Test done -total ≥318 280 ≥369 205 ≥407 205 ≥407 205
TB clients treatment success rate ≥765 146 ≥765 146 ≥800 000 ≥800 000
TB/HIV co-infected client on ART rate ≥82% ≥82% ≥82% ≥82%
TB client 5y rs and older start on treatment rate ≥85% ≥90% ≥95% ≥95%
TB MDR treatment success rate ≥90% ≥95% ≥95% ≥95%
Antenatal client start on ART rate ≥60% ≥60% ≥60% ≥60%
Mother postnatal v isit w ithin 6 day s rate ≥90% ≥90% ≥90% ≥90%
Infant 1st PCR test positiv e around 10 w eeks rate ≥ 87% ≥87% ≥87% ≥87%
Immunization under 1y ear cov erage [1] <1.5% <1.5% <1.5% <1.5%
School Grade 1 learners screened ≥75% ≥80% ≥85% ≥85%
School Grade 8 learners screened 38500-39,000 38,000-39,000 3900- 39000 3900- 39000
Couple y ear protection rate (international) 25000-25500 25500-26000 25500-26000 25500-26000
Cerv ical cancer screening cov erage 30 y ears and older ≥50% ≥55% 1 1
HPV 1st dose cov erage ≥65% ≥68% ≥70 ≥70
Cataract Surgery Performed ≥29 600 ≥29 600 ≥29 600 ≥29 600
Malaria case fatality rate ≥1000 ≥1000 ≥1000 ≥1000
Clients 40 y ears and older screened for hy pertension – – – –
Clients 40 y ears and older screened for diabetes ≥174 000 ≥224 000 ≥274 000 ≥274 000
PHC client screened for Mental disorder ≥87 000 ≥95 100 ≥100 000 ≥100 000
Mental disorders screening rate ≥1 000 000 ≥1 200 000 ≥1 500 000 ≥1 500 000
Diabetes new client 18 y ears and older detection rate – – – –
Programme 3: Emergency Medical Services
Description and objectives
Programme Purpose
To render a well-functioning Emergency Medical Services (EMS) with its components (Planned
Patient Transport and Emergency Transport) and Forensic Pathology Services (FPS) throughout the
province
The primary response times for EMS in both rural and urban areas need to improve to meet the
national standards. The national standard is that Priority 1 (P1) patients should be reached within
40 minutes in rural areas and within 15 minutes in urban areas. 75 per cent of P1 patients should be
reached within the time. Currently in the province, 55 per cent of rural patients and 45 per cent of
urban patients are serviced within the national norms. The current national norm for ambulances is
one ambulance per 10 000 population, currently the province has one ambulance per 55 000
population.
The service needs to move its focus to Planned Patient Transport as 65 per cent of the patients
transported do not need an ambulance. This would have an impact on response times. More drivers
will have to be employed and fixed routes will have to be developed. Additional ambulances and
Planned Patient transport vehicles will have to be bought to increase the fleet size.

Department of Health
90
Signed service level agreements with local Emergency Medical Services Providers as a backup
service in case of emergencies or a disaster. The employment of contract workers in all vacant funded
post to increase the number of operational vehicles will have to be considered.
Allocation for this programme is R405.8 million in 2020/21 and R444.4 million in 2021/22 and
R446 million in the outer year.
Table 3.13 : Summary of payments and estimates by sub-programme: Programme 3: Emergency Medical Services
OutcomeMain
appropriation
Adjusted
appropriation
Revised
estimateMedium-term estimates
R thousand 2016/17 2017/18 2018/19 2020/21 2021/22 2022/23
1. Emergency Transport 284 227 273 422 325 559 377 687 381 754 508 332 366 759 402 190 411 956
2. Planned Patient Transport 12 430 23 011 19 805 26 588 26 588 26 588 39 000 42 189 34 070
Total payments and estimates 296 657 296 433 345 364 404 275 408 342 534 920 405 759 444 379 446 026
2019/20
Table 3.14 : Summary of payments and estimates by economic classification: Programme 3: Emergency Medical Services
OutcomeMain
appropriation
Adjusted
appropriation
Revised
estimateMedium-term estimates
R thousand 2016/17 2017/18 2018/19 2020/21 2021/22 2022/23
Current payments 283 255 275 442 323 215 377 467 401 886 528 464 367 053 404 562 414 441
Compensation of employ ees 239 409 234 343 251 287 272 984 276 984 290 871 312 361 315 714 322 329
Goods and serv ices 43 819 41 072 71 654 104 191 124 821 237 317 54 579 88 763 92 023
Interest and rent on land 27 27 274 292 81 276 113 85 89
Transfers and subsidies to: 247 885 59 1 143 1 210 1 210 1 156 1 220 1 279
Prov inces and municipalities – – – – – – – – –
Departmental agencies and accounts – – – – – – – – –
Higher education institutions – – – – – – – – –
Foreign gov ernments and international organisations – – – – – – – – –
Public corporations and priv ate enterprises – – – – – – – – –
Non-profit institutions – – – – – – – – –
Households 247 885 59 1 143 1 210 1 210 1 156 1 220 1 279
Payments for capital assets 13 155 20 106 22 090 25 665 5 246 5 246 37 550 38 597 30 306
Buildings and other fix ed structures – – – – – – 9 000 – –
Machinery and equipment 13 155 20 106 22 090 25 665 5 246 5 246 28 550 38 597 30 306
Heritage Assets – – – – – – – – –
Specialised military assets – – – – – – – – –
Biological assets – – – – – – – – –
Land and sub-soil assets – – – – – – – – –
Softw are and other intangible assets – – – – – – – – –
Payments for financial assets – – – – – – – – –
Total economic classification 296 657 296 433 345 364 404 275 408 342 534 920 405 759 444 379 446 026
2019/20
Sub Programme 1: Emergency Medical Services is allocated R366.8 million in 2020/21,
R402.2 million in 2022/21 and R412 million in the outer year to render administrative functions for the
EMRS. Most of EMRS offices are stationed at hospitals and their running costs are attached to where
they station.
Sub Programme 2: Planned Patient Transport is allocated R39 million, R42.1 million and
R34.7 million over the MTEF, respectively. The department plans to increase red fleet and conversion
of these ambulances is allocated within the sub programme.
Compensation of Employees: The allocation grows to R312.4 million R315.7 million and
R322.3 million over the MTEF, respectively to cover costs of the advertised vacant posts.
Goods and Services: The allocation declined to R54.6 million in 2020/21 and increase significantly
to R88.7 million due to reprioritisation. The increase in 2022/23 of R92 million in the outer year is to

2020/21 Estimates of Provincial Revenue and Expenditure
91
cover cost for the proposed EMRS call center. The sub-programme is also monitoring the calls of
ambulances and coordinate private ambulances if need be.
Transfers and subsidies: Allocation increases to cater for expenditure relating to personnel benefits,
injury on duty payments and other staff benefits with R1.2 million, R1.2 million and R1.3 million over
the MTEF, respectively.
Machinery and Equipment: Majority of the budget is allocated to Planned Patient Transport for
procuring ambulances and emergency medical equipment that is allocated R28.6 million in 2020/21,
R38.6 million in 2021/22 and R30.3 million in 2022/23.
Table 3.15 : Service delivery measures - Programme 3: Emergency Medical Services
Estimated
performanceMedium-term estimates
Programme performance measures 2019/20 2020/21 2021/22 2022/23
EMS operational ambulance cov erage 1 0 0 0
EMS P1 urban response under 15 minutes rate 0 1 1 1
EMS P1 rural response under 40 minutes rate 1 1 1 1
EMS inter-facility transfer rate 0 0 0 0
Number of communication Centres – 1 1 1
PPT Inter-facility transfer rate – 1 1 1
Number of Ambulances procured per district – 184 200 200
Approv ed dev elopment plan – 1 – –
Community satisfaction rate (surv ey ) – 1 1 1
Proportion of compliant EMS prov iders – 1 1 1
Number of outreach programmes conducted per district – 16 16 16
Programme 4: Provincial Hospitals (Regional and Psychiatric Hospitals)
Description and objectives
Programme purpose
The purpose of this programme is to provide Regional Hospital Care Services to the People of the
North West Province. There are three Regional Hospitals and two Specialised Hospitals in the North
West Province. The three regional hospitals are Potchefstroom Hospital, Mafikeng Provincial Hospital
and Joe Morolong Memorial Hospital. Witrand and Bophelong Psychiatric Hospitals are the two
Specialized Hospitals rendering psychiatric and rehabilitative services for the entire North West
Province. This will be achieved through the implementation of the Ideal Hospital Realisation &
Maintenance, patient’s feedback mechanisms and six ministerial priorities for hospital care.
Programme 4 (Regional and Specialized Hospitals) is working towards Universal Health Coverage
through established clinical health services to ensure service coverage of the population. Universal
Health Coverage can be realized through certification of facilities reaching ideal status through the
Ideal Hospital Realization and Maintenance Framework, but underfunding is slowing the process
towards certification. As a mechanism to improve hospital services, Regional and Specialized
Hospitals will continue implementing Ideal Hospital Realization & Maintenance aims to improve the
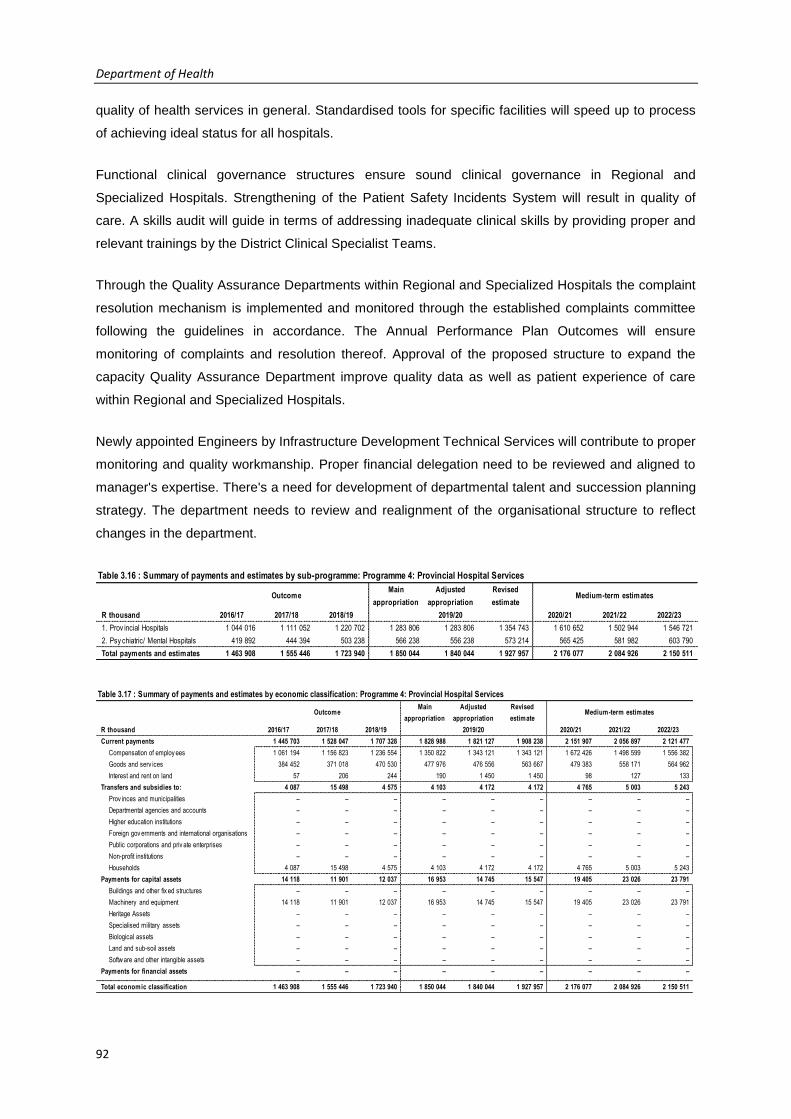
Department of Health
92
quality of health services in general. Standardised tools for specific facilities will speed up to process
of achieving ideal status for all hospitals.
Functional clinical governance structures ensure sound clinical governance in Regional and
Specialized Hospitals. Strengthening of the Patient Safety Incidents System will result in quality of
care. A skills audit will guide in terms of addressing inadequate clinical skills by providing proper and
relevant trainings by the District Clinical Specialist Teams.
Through the Quality Assurance Departments within Regional and Specialized Hospitals the complaint
resolution mechanism is implemented and monitored through the established complaints committee
following the guidelines in accordance. The Annual Performance Plan Outcomes will ensure
monitoring of complaints and resolution thereof. Approval of the proposed structure to expand the
capacity Quality Assurance Department improve quality data as well as patient experience of care
within Regional and Specialized Hospitals.
Newly appointed Engineers by Infrastructure Development Technical Services will contribute to proper
monitoring and quality workmanship. Proper financial delegation need to be reviewed and aligned to
manager's expertise. There's a need for development of departmental talent and succession planning
strategy. The department needs to review and realignment of the organisational structure to reflect
changes in the department.
Table 3.16 : Summary of payments and estimates by sub-programme: Programme 4: Provincial Hospital Services
OutcomeMain
appropriation
Adjusted
appropriation
Revised
estimateMedium-term estimates
R thousand 2016/17 2017/18 2018/19 2020/21 2021/22 2022/23
1. Prov incial Hospitals 1 044 016 1 111 052 1 220 702 1 283 806 1 283 806 1 354 743 1 610 652 1 502 944 1 546 721
2. Psy chiatric/ Mental Hospitals 419 892 444 394 503 238 566 238 556 238 573 214 565 425 581 982 603 790
Total payments and estimates 1 463 908 1 555 446 1 723 940 1 850 044 1 840 044 1 927 957 2 176 077 2 084 926 2 150 511
2019/20
Table 3.17 : Summary of payments and estimates by economic classification: Programme 4: Provincial Hospital Services
OutcomeMain
appropriation
Adjusted
appropriation
Revised
estimateMedium-term estimates
R thousand 2016/17 2017/18 2018/19 2020/21 2021/22 2022/23
Current payments 1 445 703 1 528 047 1 707 328 1 828 988 1 821 127 1 908 238 2 151 907 2 056 897 2 121 477
Compensation of employ ees 1 061 194 1 156 823 1 236 554 1 350 822 1 343 121 1 343 121 1 672 426 1 498 599 1 556 382
Goods and serv ices 384 452 371 018 470 530 477 976 476 556 563 667 479 383 558 171 564 962
Interest and rent on land 57 206 244 190 1 450 1 450 98 127 133
Transfers and subsidies to: 4 087 15 498 4 575 4 103 4 172 4 172 4 765 5 003 5 243
Prov inces and municipalities – – – – – – – – –
Departmental agencies and accounts – – – – – – – – –
Higher education institutions – – – – – – – – –
Foreign gov ernments and international organisations – – – – – – – – –
Public corporations and priv ate enterprises – – – – – – – – –
Non-profit institutions – – – – – – – – –
Households 4 087 15 498 4 575 4 103 4 172 4 172 4 765 5 003 5 243
Payments for capital assets 14 118 11 901 12 037 16 953 14 745 15 547 19 405 23 026 23 791
Buildings and other fix ed structures – – – – – – – – –
Machinery and equipment 14 118 11 901 12 037 16 953 14 745 15 547 19 405 23 026 23 791
Heritage Assets – – – – – – – – –
Specialised military assets – – – – – – – – –
Biological assets – – – – – – – – –
Land and sub-soil assets – – – – – – – – –
Softw are and other intangible assets – – – – – – – – –
Payments for financial assets – – – – – – – – –
Total economic classification 1 463 908 1 555 446 1 723 940 1 850 044 1 840 044 1 927 957 2 176 077 2 084 926 2 150 511
2019/20

2020/21 Estimates of Provincial Revenue and Expenditure
93
The programme has been allocated R2.176 billion in 2020/21, R2.085 billion in 2021/22 and
R2.151 billion in 2022/23. The programme focuses on efficiency in disease management and quality
of care through optimal usage of available resources guided by relevant protocols and Standard
Operating Procedures.
Sub Programme 1: Provincial Hospitals. Within the allocation is Health Professional and
Development Grant, Human Resource Capacitation Grant and Equitable Share. The sub programme
is allocated R1.611 million in 2020/21, R1.503 billion in 2021/22 and R1.547 billion in the outer year.
Funds are allocated to non-negotiables to ensure that ministerial six priorities are implemented.
Sub Programme 2: Psychiatric Hospitals. These hospitals are allocated R565.4 million in 2020/21,
R582 million in 2021/22 and R603.8 million in 2022/23. Cost drivers are, patient catering and
contractors as the state of the two psychiatric hospitals needs attention of daily basis.
Economic Classifications:
Compensation of Employees is allocated R1.672 billion in 2020/21, R1.4998 billion in 2021/22 and
R1.556 billion in 2022/23 inclusive of Health Professions Training & Development Component.
Goods and Services: Goods and Services is allocated R479.4 million, R558.2 million and
R565 million over the MTEF, respectively. Cost drivers are laboratory services (NHLS), medical
supplies and agency and outsourced services within which patient catering and medical waste are
allocated.
Transfers and Subsidies: Allocation for 2020/21 is allocated R4.8 million is 2020/21, R5 million in
2021/22 and R5.2 million in the outer year for payment of staff benefits.
Machinery and Equipment: R19.4 million is allocated for 2020/21, with R23 million in 2021/22 and
R23.8 million in 2022/23 for procurement of Medical and Allied Equipment at both Provincial and
Psychiatric Hospitals.
Table 3.18 : Service delivery measures - Programme 4: Provincial Hospital Services
Estimated
performanceMedium-term estimates
Programme performance measures 2019/20 2020/21 2021/22 2022/23
Quality improv ement plan after self-assessment rate 1 ≥85% ≥85% ≥85%
Complaints resolution rate (Regional Hospitals) 0 – – –
Complaint Resolution w ithin 25 w orking day s rate (Regional Hospitals) 0 – – –
Av erage Length of stay (Regional Hospital) 5 4-7 Day s 4-7 Day s 4-7 Day s
Inpatient Bed Utilisation Rate (Regional Hospital) 1 70% – 85% 70% – 85% 70% – 85%
Ex penditure per PDE (Regional Hospitals) R3801 ≥R3800 ≥R3800 ≥R3800
Psy chiatric Hospitals – – – –
Quality improv ement plan after self-assessment rate – 1 1 1
Complaints resolution rate – – – –
Complaint resolution w ithin 25 w orking day s rate – – – –
Inpatient Bed Utilisation rate 1 ≥90% ≥90% ≥90%
Av erage Length of Stay 1 ≥90% ≥90% ≥90%
Ex penditure per patient day equiv alent (PDE) 1 70% – 80% 70% – 80% 70% – 80%

Department of Health
94
Programme 5: Central Hospitals Services
Description and objectives
The purpose of this programme is to provide access to Tertiary Hospital care services for patients in
the North West Province, retention and training of health care professionals, and research. The North
West Province does not have a fully developed Tertiary or Central hospital; tertiary services are
incrementally initiated and sustained at Klerksdorp/Tshepong Complex and Job Shimankana Tabane
Hospitals.
The focus is on improving efficiency in managing diseases, quality of care through provision of
appropriate resource, protocols and SOPs. This will be driven by the implementation of the Ideal
Hospital Realization Framework, patients’ feedback mechanisms. The contribution of outputs towards
achieving the outcomes and impact in the Strategic Plan aligned to the mandate of the institution; as
well as the achievement of priorities of women, children and people with disabilities.
The addressing of the above outputs will contribute to the reduction of client’s complaints and
increase patient satisfaction. It will further positively influence the quality of health and wellbeing of
community members and explain planned interventions to deliver all the outputs in the narrative.
Prioritise the budget for procurement of implants and increase the theatre allocation time for
operations. Regular maintenance of Infrastructure and medical equipment.
Table 3.19 : Summary of payments and estimates by sub-programme: Programme 5: Central Hospital Services
OutcomeMain
appropriation
Adjusted
appropriation
Revised
estimateMedium-term estimates
R thousand 2016/17 2017/18 2018/19 2020/21 2021/22 2022/23
1. Prov incial Hospital Tertiary Serv ices 1 398 183 1 552 646 1 763 535 1 912 184 1 942 150 2 097 246 2 000 229 2 179 501 2 283 409
Total payments and estimates 1 398 183 1 552 646 1 763 535 1 912 184 1 942 150 2 097 246 2 000 229 2 179 501 2 283 409
2019/20
Table 3.20 : Summary of payments and estimates by economic classification: Programme 5: Central Hospital Services
OutcomeMain
appropriation
Adjusted
appropriation
Revised
estimateMedium-term estimates
R thousand 2016/17 2017/18 2018/19 2020/21 2021/22 2022/23
Current payments 1 363 640 1 524 131 1 723 228 1 872 440 1 888 640 2 043 378 1 961 131 2 133 884 2 260 050
Compensation of employ ees 925 070 1 018 959 1 127 080 1 229 636 1 242 286 1 250 865 1 316 526 1 334 679 1 385 701
Goods and serv ices 438 342 504 976 595 221 642 343 644 783 790 942 643 885 798 720 873 841
Interest and rent on land 228 196 927 461 1 571 1 571 720 485 508
Transfers and subsidies to: 6 182 3 506 3 825 3 788 3 788 4 146 4 049 3 997 4 189
Prov inces and municipalities – – – – – – – – –
Departmental agencies and accounts – – – – – – – – –
Higher education institutions – – – – – – – – –
Foreign gov ernments and international organisations – – – – – – – – –
Public corporations and priv ate enterprises – – – – – – – – –
Non-profit institutions – – – – – – – – –
Households 6 182 3 506 3 825 3 788 3 788 4 146 4 049 3 997 4 189
Payments for capital assets 28 361 25 009 36 482 35 956 49 722 49 722 35 049 41 620 19 170
Buildings and other fix ed structures – – – – – – – – –
Machinery and equipment 28 361 25 009 36 482 35 956 49 722 49 722 35 049 41 620 19 170
Heritage Assets – – – – – – – – –
Specialised military assets – – – – – – – – –
Biological assets – – – – – – – – –
Land and sub-soil assets – – – – – – – – –
Softw are and other intangible assets – – – – – – – – –
Payments for financial assets – – – – – – – – –
Total economic classification 1 398 183 1 552 646 1 763 535 1 912 184 1 942 150 2 097 246 2 000 229 2 179 501 2 283 409
2019/20

2020/21 Estimates of Provincial Revenue and Expenditure
95
Provincial Hospital Tertiary Services is funded through Equitable Share and Conditional Grants
(National Tertiary Services Grant). The allocated budget R2 billion in 2020/21, R2.180 billion in
2021/2022 and R2.283 billion in 2022/23. The Netcare donor funding is seizing the end of 2019/20
financial year.
Compensation of Employees: The programme is allocated R1.317 billion in 2020/21, R1.335 billion
in 2021/22 million and R1.386 billion in the outer year. The programme has the largest vacancy rate
where at times services of agencies are used for continuity.
Goods and Services: R643.9 million in 2020/21, R798.7 million in 2021/22 and R873.8 million in the
outer year. Items like medical supplies and medicine receives the highest allocations as performance
information in these items e.g. haemolysis and other items remain very high.
Transfers and Subsidies. Allocation for 2020/21 and 2021/22 is R4 million respectively and increase
to R4.2 million for the outer year for payment of staff benefits.
Machinery and Equipment: Equipment is allocated R35 million in 2020/21, R41.6 million in 2021/22
and R19.1 million in 2022/23. Allocation is inclusive of both Equitable Share and National Tertiary
Services Grant.
Table 3.21 : Service delivery measures - Programme 5: Central Hospital Services
Estimated
performanceMedium-term estimates
Programme performance measures 2019/20 2020/21 2021/22 2022/23
Complaints resolution rate (Tertiary Hospitals) 1 ≥85% ≥85% ≥85%
Complaint Resolution w ithin 25 w orking day s rate (Tertiary Hospitals) 1 ≥90% ≥90% ≥90%
Av erage Length of Stay (Tertiary Hospitals) 6 6-8day s 6-8day s 6-8day s
Inpatient Bed Utilisation Rate (Tertiary Hospitals) 1 75-82% 75-82% 75-82%
Ex penditure per PDE (Tertiary Hospitals) R3624 R2400-R4500 R2500-R4600 R2600-R4700
Hip replacement rate 0 ≥10% ≥11% ≥12%
Knee replacement rate 0 ≥4% ≥4% ≥4%
Haemodialy sis rate 1 ≥85% ≥85% ≥85%
Number of Radiotherapy Sessions 1 919 ≥6800 ≥6800 ≥6800
Number of MRI scans performed 348 ≥1200 ≥1200 ≥1200
Number of CT Scans performed 4 792 ≥9600 ≥9600 ≥9600
Percentage of hospitals that qualify as Ideal Hospital – 1 1 1
Percentage of Hospitals w ith functional hospital boards – 1 1 1
Programme 6: Health Science and Training
Description and objectives
To support health care service delivery through the provision of education, training and development.
The programme comprises of the following sub-programmes:
Nurses Training Colleges:
Purpose: To provide various accredited nursing programmes to produce competent skilled nurse
practitioners.

Department of Health
96
Emergency Medical Services (EMS) Training College
Purpose: To increase the number of Emergency Medical Care practitioners to improve response time
and coverage.
Primary Health Care (PHC) Nurses Training
Purpose: To provide nurses with assessment, diagnostic, analytical and management skills in order to
offer comprehensive primary health care services.
Training (Other)
Purpose: To provide all categories of personnel and potential employees access to quality learning
and development opportunities including employees with special requirements. The health system
requires competent workforce at all levels- from primary health care facilities to tertiary hospitals
hence the prospective medical officers; nurses and emergency care personnel will be serving the
diverse communities of the North West Province upon completion of their studies.
The following interventions will be used to deliver all the outputs:
Mentoring programmes will be put in place for students registered at different Colleges and
universities for students and learners who are finding it difficult to complete particular modules at the
estimated completion period.
Table 3.22 : Summary of payments and estimates by sub-programme: Programme 6: Health Science And Training
OutcomeMain
appropriation
Adjusted
appropriation
Revised
estimateMedium-term estimates
R thousand 2016/17 2017/18 2018/19 2020/21 2021/22 2022/23
1. Nurses Training Colleges 189 127 171 804 171 635 168 927 160 240 160 240 153 230 171 820 179 723
2. Ems Training College 22 813 18 755 18 500 19 347 18 847 18 847 16 146 19 881 20 423
3. Primary Health Care Training 11 920 14 186 14 070 15 392 11 792 13 435 13 985 13 831 14 497
4. Training Other 243 131 185 741 182 116 184 288 184 088 182 445 151 882 243 115 323 815
Total payments and estimates 466 991 390 486 386 321 387 954 374 967 374 967 335 243 448 647 538 458
2019/20

2020/21 Estimates of Provincial Revenue and Expenditure
97
Table 3.23 : Summary of payments and estimates by economic classification: Programme 6: Health Science And Training
OutcomeMain
appropriation
Adjusted
appropriation
Revised
estimateMedium-term estimates
R thousand 2016/17 2017/18 2018/19 2020/21 2021/22 2022/23
Current payments 220 474 201 150 221 160 222 266 240 635 240 276 212 660 242 160 252 927
Compensation of employ ees 130 566 122 094 122 076 133 053 126 853 126 853 134 124 142 220 151 451
Goods and serv ices 89 888 79 038 99 029 89 167 113 731 113 372 78 476 99 877 101 410
Interest and rent on land 20 18 55 46 51 51 60 63 66
Transfers and subsidies to: 244 859 187 483 161 703 162 030 130 674 131 033 121 000 203 016 281 985
Prov inces and municipalities – – – – – – – – –
Departmental agencies and accounts 16 762 18 891 18 955 21 000 21 000 21 000 20 000 23 210 24 324
Higher education institutions – – – – – – – – –
Foreign gov ernments and international organisations – – – – – – – – –
Public corporations and priv ate enterprises – – – – – – – – –
Non-profit institutions – – – – – – – – –
Households 228 097 168 592 142 748 141 030 109 674 110 033 101 000 179 806 257 661
Payments for capital assets 1 658 1 853 3 458 3 658 3 658 3 658 1 583 3 471 3 546
Buildings and other fix ed structures – – – – – – – – –
Machinery and equipment 1 658 1 853 3 458 3 658 3 658 3 658 1 583 3 471 3 546
Heritage Assets – – – – – – – – –
Specialised military assets – – – – – – – – –
Biological assets – – – – – – – – –
Land and sub-soil assets – – – – – – – – –
Softw are and other intangible assets – – – – – – – – –
Payments for financial assets – – – – – – – – –
Total economic classification 466 991 390 486 386 321 387 954 374 967 374 967 335 243 448 647 538 458
2019/20
The programme is allocated R335.2 million in 2020/21, R448.6 million is allocated for 2021/22 and
R538.5 for 2022/23 for training of both Doctors and Nurses.
Sub programme 1: Nurses Training Colleges are allocated R153.2 million in 2020/21, R171.8 million
in 2021/22 and R179.7 million in the outer year. The allocation is reduced in 2021/21 due to limited
intake of Nurses due to preparation of the new curriculum. Colleges are in a process of implementing
student management system that is projected to be in place soon.
Sub Programme 2: EMS Training College’s allocation is allocated R16.1 million in 2020/21,
increased to R19.9 million in 2020/21 and R20.4 million in 2022/23. The EMS College is preparing to
apply for accreditation to offer the new EMS Qualifications that came into effect in 2017 due to
changes across the Higher Education spectrum. Currently the College is still offering the traditional
Ambulance Emergency Assistant short course and other operational training programs for EMS
personnel, Doctors and Nurses to improve health service delivery and compliance to statutory
requirements by healthcare facilities.
The accreditation process to offer new higher educational programmes, Higher Certificate and
Diploma in Emergency Medical Care, is projected to continue into the next financial year 2020/2021
and with it brings huge financial implications. The nature of the new programs requires the College to
put in place various resources and systems which were not required while offering the legacy courses.
Sub programme 3: Primary Health Care Training is allocated R14 million, R13.8 million and
R14.5 million over the MTEF, respectively to enable training for personnel and nurses.
Sub-programme 4: Training Other - Provision for skills development interventions were made for all
personnel categories in the Department the target group includes actual and potential employees.
Provision of bursaries were made for health science training programmes at undergraduate and

Department of Health
98
postgraduate levels. The sub-programme is allocated R151.9 million and increase significantly to
R243.1 million in 2021/22 and R323.8 million in the outer year to pay for Cuban Medical Students and
other students at Local Universities.
Economic Classifications
Compensation of Employees: The Economic Classification is allocated R134.1 million in 2020/21,
R142.2 million and R151.5 million in the outer year which includes stipend for Interns and Bursars at
Nursing Colleges.
Goods and Services: The allocation in 2021/22 is reduced due to budget cuts. R94.8 million,
R99.9 million and R101.4 million over the MTEF, respectively, is allocated for various activities within
the Programme e.g. expenditure for students and doctors that completed their studies from Cuba and
finalising in the country and other training needs by officials in the department.
Transfers and Subsidies: The programme has been allocated R121 million, R203 million and
R282 million over the MTEF, respectively for Nelson Mandela Fidel Castro programme and for Local
Universities.
Machinery and Equipment: This is allocated R1.6 million in 2020/21, R3.5 million in 2021/22 and
outer year respectively, for procurement of medical accessories for Cuban Students and some
equipment for other sub-programmes.
Table 3.24 : Service delivery measures - Programme 6: Health Science And Training
Estimated
performanceMedium-term estimates
Programme performance measures 2019/20 2020/21 2021/22 2022/23
Total number of first y ear students enrolled for Basic Nursing programme[1] – 100 150 150
Total number of Ambulance Emergency Assistant students enrolled[2] 24 - - -
Number of Ambulance Emergency Assistant students graduating[3] – - - -
Number of Basic Nurse Students graduating 329 249 – –
Number of medicine bursars graduating 15 50 65 90
Number of Allied Health programme bursars graduating – 15 15 15
Number of accredited Nursing College – – 1 1
Number of New Nursing Programmes Accredited – – 3 2
Number of beneficiaries registered on the Nelson Mandela Fidel Castro programme – 15 15 15
Number of unemploy ed beneficiaries registered for medicine in local univ ersities – 5 5 5
Number of serv ing officers and unemploy ed y outh registered for Allied programmes – 34 39 39
Number of serv ing officers and unemploy ed y outh registered for Allied Programmes graduating – 3 – –
Number of Accredited Emergency Medical Care College. – – – 1
Number of new Emergency Medical Care Programmes Accredited – – – 2
Number of induction Programmes dev eloped – – 1 1
Percentage of new employ ees inducted. – 1 1 1
Number of beneficiaries registered on learnerships – 1 1 1
Programme 7: Health Care Support Services
Description and objectives
Programme purpose
The purpose of this programme is to provide health care support services, namely, Pharmaceutical
Services, Transport Management Services, Health Technology Services, Information and

2020/21 Estimates of Provincial Revenue and Expenditure
99
Communication Technology as well as Rehabilitation Services to the Department. The programme
comprises of the following sub-programmes:
Pharmaceutical Services:
Purpose: To provide an adequate and reliable supply of safe, cost-effective and appropriate
medicines and surgical consumables of acceptable quality
Transport Management Services
Purpose: To provide effective, efficient and appropriate transport management services to the
Department.
Health Technology Services
Purpose: To provide health technology management services
Information and Communication Technology
Purpose: To provide robust and reliable IT systems, network infrastructure and technical support to
enable business operations of the department through the utilisation of appropriate and cost-effective
technology.
Rehabilitation Services
Purpose: To provide assistive devices to people with disabilities to regain physical, mental and/or
cognitive abilities that have been lost or impaired because of disease, injury or treatment.
Table 3.25 : Summary of payments and estimates by sub-programme: Programme 7: Health Care Support Services
OutcomeMain
appropriation
Adjusted
appropriation
Revised
estimateMedium-term estimates
R thousand 2016/17 2017/18 2018/19 2020/21 2021/22 2022/23
1. Engineering 52 813 43 802 52 394 89 211 80 951 80 951 109 518 116 970 122 230
2. Prov incial Laundry Serv ices 29 138 30 875 34 272 30 358 30 466 30 466 27 818 39 530 41 439
3. Orthotic And Prothetic Serv ices 6 730 8 287 8 804 11 659 13 659 13 659 14 029 29 061 30 456
4. Medicine Trading Account 144 905 154 278 202 857 301 205 295 205 384 837 400 268 502 067 616 375
Total payments and estimates 233 586 237 242 298 327 432 433 420 281 509 913 551 633 687 628 810 500
2019/20

Department of Health
100
Table 3.26 : Summary of payments and estimates by economic classification: Programme 7: Health Care Support Services
OutcomeMain
appropriation
Adjusted
appropriation
Revised
estimateMedium-term estimates
R thousand 2016/17 2017/18 2018/19 2020/21 2021/22 2022/23
Current payments 228 407 232 827 295 144 405 420 408 729 498 339 535 412 637 096 757 895
Compensation of employ ees 50 574 52 010 56 977 62 090 64 090 65 437 71 475 73 459 78 870
Goods and serv ices 177 828 180 814 238 042 343 291 344 550 432 813 463 880 563 576 678 961
Interest and rent on land 5 3 125 39 89 89 57 61 64
Transfers and subsidies to: 95 112 167 201 309 331 212 224 235
Prov inces and municipalities – – – – – – – – –
Departmental agencies and accounts – – – – – – – – –
Higher education institutions – – – – – – – – –
Foreign gov ernments and international organisations – – – – – – – – –
Public corporations and priv ate enterprises – – – – – – – – –
Non-profit institutions – – – – – – – – –
Households 95 112 167 201 309 331 212 224 235
Payments for capital assets 5 084 4 303 3 016 26 812 11 243 11 243 16 009 50 308 52 370
Buildings and other fix ed structures – – – – – – – – –
Machinery and equipment 5 084 4 303 3 016 26 812 11 243 11 243 16 009 50 308 52 370
Heritage Assets – – – – – – – – –
Specialised military assets – – – – – – – – –
Biological assets – – – – – – – – –
Land and sub-soil assets – – – – – – – – –
Softw are and other intangible assets – – – – – – – – –
Payments for financial assets – – – – – – – – –
Total economic classification 233 586 237 242 298 327 432 433 420 281 509 913 551 633 687 628 810 500
2019/20
Sub Programme 1: Engineering – inclusive of the allocation is SITA related costs, Student
Management Information System, Patient Verification System and Invoice Tracking System.
Electronic Patient Record System to avoid litigations and improve audit outcome. The allocation over
the MTEF is R109.5 million, R116.9 million and R122.2 which will focus on improvement of security in
the Provincial Office and for replacement of servers at various health institutions. The prioritised
procurement of white fleet department in the two outer years since these types of vehicles were last
procured two years ago.
Sub Programme 2: Provincial Laundry Services: Allocation for 2020/21 is R27.8 million,
R39.5 million in 2021/22 and R41.4 million in 2022/23 is for rendering laundry services in Dr KK
district. There is a need to procure laundry machines in four districts and replace the one in Dr KK as
it reached its life span.
Sub Programme 3: Orthotic and Prosthetic: The sub-programme is allocated R14 million in
2020/21, R29.1 million in 2021/22 and 2022/23 of R30.5 million. There are two Orthopaedic Centres
in the Province located at Dr KK and Ngaka Modiri Molema. Funds are also allocated to
operationalise the other centre at Joe Morolong Memorial Hospital.
Sub Programme 4: Medicine Trading Account: The huge increase in this sub-programme is
because of centralising Pharmaceuticals and Surgical budgets from Clinics and Community Health
Centres of R400.3 million is allocated in 2020/21, R502.1million in 2021/22 and R616.4 million in the
outer year. The sub-programme is responsible for procurement of pharmaceutical and surgicals in the
Province and in return, hospitals are journalised as and when collecting medicines at the depot.
Allocations for medicine for Clinics and Community Health Centres are within this allocated.

2020/21 Estimates of Provincial Revenue and Expenditure
101
Economic Classifications:
Compensation of Employees: The economic classification is allocated R71.5 million in 2020/21,
R73.5 million in 2021/22 and R78.9 million in the outer year.
Goods and Services: A greater portion of the programme’s budget is allocated in this economic
classification for management of Pharmaceuticals, Surgicals and Network related costs for the
department. R463.9 million is allocated in 2020/21, R563.6 million in 2021/22 and R679 million in the
outer year.
Transfers and Subsidies: The allocation is R212 thousand in 2020/21 with R224 thousand and
R235 thousand in the two outer years for payment of staff benefits.
Machinery and Equipment: The programme is allocated R16 million in 2020/21, R50.3 million in
2021/22 and R52.4 million in the outer year which is include the procurement of White Fleet and
Servers for the entire department were there is a need.
Table 3.27 : Service delivery measures - Programme 7: Health Care Support Services
Estimated
performanceMedium-term estimates
Programme performance measures 2019/20 2020/21 2021/22 2022/23
Percentage av ailability of essential medicines 1 ≥95% ≥95% ≥95%
Percentage av ailability of surgical supplies 1 ≥75% ≥80% ≥80%
Percentage of medical equipment serv iced according to departmental maintenance plan – ≥70% ≥70% ≥70%
Number of w heelchairs issued 445 ≥1000 ≥1100 ≥1150
Number of campuses implementing Student Management Information Sy stem – - - -
Number of hospitals w here netw ork hardw are has been replaced in line w ith IT infrastructure maintenance plan – 7 9 9
Number of hospitals implementing the latest v ersion of Patient Administration and Billing (PAAB) sy stem – 26 26 26
Percentage av ailability of essential medicines as contained in the prov incial code list (formulary ) at different lev els – ≥90% ≥90% ≥90%
Percentage av ailability of surgical supplies as contained in the prov incial code list (formulary ) at different lev els – ≥85% ≥85% ≥85%
Number of w hite fleet v ehicles procured – 286 – –
Number of institutions w ith serv iced maintenance plans – ≥70% ≥70% ≥70%
Number of colleges w ith Student Management Information Sy stem – 3 – –
Number of facilities w ith an integrated electronic documents and records management sy stem (EDRMS) – 3 5 6
Programme 8: Health Facilities Management:
Description and objectives
Programme Purpose
To oversee the planning and construction of health facilities to contribute towards the provision of
comprehensive quality health services.
To facilitate the construction, upgrade, rehabilitation, replacement and renovation of clinics,
community health centres, district, regional, tertiary and specialized hospitals as well as other
health related facilities.
To provide technical support and monitor implementation of maintenance at health facilities
within the Province.

Department of Health
102
Table 3.28 : Summary of payments and estimates by sub-programme: Programme 8: Health Facilities And Maintenance
OutcomeMain
appropriation
Adjusted
appropriation
Revised
estimateMedium-term estimates
R thousand 2016/17 2017/18 2018/19 2020/21 2021/22 2022/23
1. Community Health Facilities – -1 – – – – – – –
2. District Hospital Serv ices 495 953 563 554 581 060 510 549 529 993 529 993 597 158 580 598 613 906
3. Other Facilities 42 382 36 222 43 788 57 320 23 320 23 320 – – –
4. Health Maintenance 29 498 33 980 45 475 62 059 62 059 62 059 – – –
Total payments and estimates 567 833 633 755 670 323 629 928 615 372 615 372 597 158 580 598 613 906
2019/20
Table 3.29 : Summary of payments and estimates by economic classification: Programme 8: Health Facilities And Maintenance
OutcomeMain
appropriation
Adjusted
appropriation
Revised
estimateMedium-term estimates
R thousand 2016/17 2017/18 2018/19 2020/21 2021/22 2022/23
Current payments 54 293 81 811 126 381 219 861 185 910 185 834 263 918 180 895 173 204
Compensation of employ ees 16 407 15 474 16 799 20 800 18 800 18 800 26 000 26 000 28 000
Goods and serv ices 37 886 66 337 109 582 199 061 167 110 166 664 237 918 153 895 144 204
Interest and rent on land – – – – – 370 – 1 000 1 000
Transfers and subsidies to: – 42 23 – – – – – –
Prov inces and municipalities – – – – – – – – –
Departmental agencies and accounts – – – – – – – – –
Higher education institutions – – – – – – – – –
Foreign gov ernments and international organisations – – – – – – – – –
Public corporations and priv ate enterprises – – – – – – – – –
Non-profit institutions – – – – – – – – –
Households – 42 23 – – – – – –
Payments for capital assets 513 540 551 902 543 919 410 067 429 462 429 538 333 240 399 703 440 702
Buildings and other fix ed structures 501 347 550 013 536 197 364 117 380 262 380 258 271 340 361 703 405 702
Machinery and equipment 12 193 1 889 7 722 45 950 49 200 49 280 61 900 38 000 35 000
Heritage Assets – – – – – – – – –
Specialised military assets – – – – – – – – –
Biological assets – – – – – – – – –
Land and sub-soil assets – – – – – – – – –
Softw are and other intangible assets – – – – – – – – –
Payments for financial assets – – – – – – – – –
Total economic classification 567 833 633 755 670 323 629 928 615 372 615 372 597 158 580 598 613 906
2019/20
Sub-programme 2: District Hospital Services was allocated R597.2 million in 2020/21, R580.6 million
in 2021/22 and R613.9 in 2022/23. The sub-programme is purely funded through the Health Facility
Revitalisation Grant and from 2020/21, all maintenance of facilities will be allocated within the grant.
Economic Classifications:
Compensation of Employees is allocated R26 million in 2020/21 and 2021/22 respectively and
R28 million in 2022/23 financial years for Infrastructure Technical Capacity.
Goods and Services: Is allocated R237.9 million in 2020/21, R153,9 million in 2021/22 and
R144.2 million in 2022/23 financial years. Allocation for maintenance is embedded in Goods and
Services that will be used for maintaining Health Facilities in the Province.
Buildings and Fix structures: The total allocation for the programme is R271.3 million in 2020/21,
R361.7 million in 2022/23 and R405.7 million in 2022/3 for the two outer years for infrastructure
projects as recorded in the Table B5.
Machinery and Equipment is allocated R61.9 million for first two years and R38 million and
R35 million in the outer year for Health machinery and technology.

2020/21 Estimates of Provincial Revenue and Expenditure
103
Table 3.30 : Service delivery measures - Programme 8: Health Facilities And Maintenance
Estimated
performanceMedium-term estimates
Programme performance measures 2019/20 2020/21 2021/22 2022/23
Number of projects plans completed that are compliant to the gazzeted infrastructure norms and standards 3 5 8 8
Number of Projects on w hich construction started – 5 8 8
Number of projects completed 1 5 0 0
Proportion of infrastructure budget allocated to maintenance – 0 0 0
Number of health facilities that hav e undergone major and minor refurbishment in NHI Pilot District – 2 3 3
Number of health facilities that hav e undergone major and minor refurbishment outside NHI pilot District – 5 4 4
Percentage Completeness of the Project Management Information Sy stem (PMIS) 1 1 1 1
Proportion of infrastructure budget spent on all maintenance (prev entativ e and scheduled) 0 – – –
Percentage of Health facilities refurbished and maintained – 1 1 1
10. Other programme information
10.1 Personnel numbers and costs
Table 3.31 : Personnel numbers and costs by programme
Personnel numbersAs at
31 March 2017
As at
31 March 2018
As at
31 March 2019
As at
31 March 2020
As at
31 March 2021
As at
31 March 2022
As at
31 March 2023
1. Administration 531 507 513 528 520 542 562
2. District Health Serv ices 17 294 17 495 17 208 17 312 18 305 18 654 18 959
3. Emergency Medical Serv ices 812 821 801 800 919 935 949
4. Prov incial Hospital Serv ices 3 093 3 093 3 129 3 148 3 409 3 528 3 632
5. Central Hospital Serv ices 2 689 2 687 2 789 2 810 3 050 3 132 3 204
6. Health Science And Training 1 407 1 581 976 986 779 793 805
7. Health Care Support Serv ices 218 216 222 225 248 261 271
8. Health Facilities And Maintenance 119 18 101 101 117 121 124
Direct charges – – – – – – –
Total provincial personnel numbers 26 163 26 418 25 739 25 909 27 346 27 965 28 505
Total prov incial personnel cost (R thousand) 6 051 077 6 412 002 7 165 979 8 035 434 8 552 695 8 838 276 9 262 844
Unit cost (R thousand) 231 243 278 310 313 316 325
1. Full-time equivalent
Table 3.32 : Summary of departmental personnel numbers and costs by component
Actual Revised estimate Medium-term expenditure estimate
R thousands
Personnel
numbers1 Costs
Personnel
numbers1 Costs
Personnel
numbers1 Costs
Filled
posts
Additional
posts
Personnel
numbers1 Costs
Personnel
numbers1 Costs
Personnel
numbers1 Costs
Personnel
numbers1 Costs
Personnel
growth rate
Costs
growth rate
% Costs
of
Total
Salary level
1 – 7 10 785 2 209 207 10 466 2 265 600 10 906 2 484 649 10 908 – 10 908 2 841 942 11 990 2 957 754 12 316 3 007 026 12 601 3 107 983 4.9% 3.0% 34.3%
8 – 10 5 291 2 363 282 5 543 2 515 379 5 608 2 800 582 5 740 – 5 740 3 069 079 6 284 3 378 907 6 519 3 477 168 6 724 3 660 958 5.4% 6.1% 39.1%
11 – 12 1 397 1 155 046 1 494 1 301 157 1 496 1 458 612 1 527 – 1 527 1 671 397 1 670 1 749 495 1 725 1 897 371 1 773 2 031 989 5.1% 6.7% 21.4%
13 – 16 43 54 065 43 54 437 47 60 501 54 – 54 58 135 56 65 960 59 69 104 61 74 408 4.6% 8.6% 0.8%
Other 8 647 269 477 8 872 275 429 7 682 361 636 7 681 – 7 681 394 881 7 346 400 579 7 346 387 607 7 346 387 507 -1.5% -0.6% 4.5%
Total 26 163 6 051 077 26 418 6 412 002 25 739 7 165 979 25 909 – 25 909 8 035 434 27 346 8 552 695 27 965 8 838 276 28 505 9 262 844 3.2% 4.9% 100.0%
Programme
1. Administration 531 189 703 507 196 056 513 201 513 528 – 528 228 245 520 232 652 542 251 527 562 271 445 2.1% 5.9% 2.9%
2. District Health Serv ices 17 294 3 438 154 17 495 3 616 243 17 208 4 153 693 17 312 – 17 312 4 711 242 18 305 4 787 131 18 654 5 196 078 18 959 5 468 666 3.1% 5.1% 58.8%
3. Emergency Medical Serv ices 812 239 409 821 234 343 801 251 287 800 – 800 290 871 919 312 361 935 315 714 949 322 329 5.9% 3.5% 3.6%
4. Prov incial Hospital Serv ices 3 093 1 061 194 3 093 1 156 823 3 129 1 236 554 3 148 – 3 148 1 343 121 3 409 1 672 426 3 528 1 498 599 3 632 1 556 382 4.9% 5.0% 16.8%
5. Central Hospital Serv ices 2 689 925 070 2 687 1 018 959 2 789 1 127 080 2 810 – 2 810 1 250 865 3 050 1 316 526 3 132 1 334 679 3 204 1 385 701 4.5% 3.5% 15.2%
6. Health Science And Training 1 407 130 566 1 581 122 094 976 122 076 986 – 986 126 853 779 134 124 793 142 220 805 151 451 -6.5% 6.1% 1.6%
7. Health Care Support Serv ices 218 50 574 216 52 010 222 56 977 225 – 225 65 437 248 71 475 261 73 459 271 78 870 6.4% 6.4% 0.8%
8. Health Facilities And Maintenance 119 16 407 18 15 474 101 16 799 101 – 101 18 800 117 26 000 121 26 000 124 28 000 7.1% 14.2% 0.3%
Direct charges – – – – – – – – – – – – – – – – – – –
Total 26 163 6 051 077 26 418 6 412 002 25 739 7 165 979 25 909 – 25 909 8 035 434 27 346 8 552 695 27 965 8 838 276 28 505 9 262 844 3.2% 4.9% 100.0%
Employee dispensation classification
Public Serv ice Act appointees not cov ered by OSDs 7 179 1 753 012 7 273 1 787 074 6 741 1 570 646 6 756 – 6 756 1 680 968 7 277 1 794 492 7 444 1 851 395 7 590 1 910 273 4.0% 4.4% 20.8%
Public Serv ice Act appointees still to be cov ered by OSDs 1 – – – – 4 966 – – – 5 376 – – – – – – – -100.0% 0.0%
Professional Nurses, Staff Nurses and Nursing Assistants 7 364 2 703 391 7 318 2 880 717 8 324 3 162 070 8 444 – 8 444 3 583 561 9 398 3 842 687 9 606 3 906 350 9 790 4 078 455 5.1% 4.4% 44.3%
Legal Professionals 2 1 979 2 2 147 2 2 448 2 – 2 2 650 4 2 891 4 3 046 4 3 192 26.0% 6.4% 0.0%
Social Serv ices Professions 51 21 020 54 22 701 50 23 181 50 – 50 25 093 48 27 130 49 28 862 50 30 247 – 6.4% 0.3%
Engineering Professions and related occupations 38 15 176 41 16 390 40 39 919 40 – 40 43 812 50 46 668 51 49 703 52 52 089 9.1% 5.9% 0.6%
Medical and related professionals 2 077 1 334 300 2 215 1 452 924 2 198 1 794 601 2 230 – 2 230 2 047 571 2 708 2 139 930 2 770 2 269 553 2 820 2 424 211 8.1% 5.8% 25.8%
Therapeutic, Diagnostic and other related Allied Health Professionals 597 220 300 618 247 999 606 299 726 609 – 609 320 494 785 351 421 802 373 198 816 391 112 10.2% 6.9% 4.2%
Educators and related professionals – – – – – – – – – – – – – – – – – – –
Others such as interns, EPWP, learnerships, etc 8 854 1 899 8 897 2 050 7 778 268 422 7 778 – 7 778 325 908 7 076 347 476 7 239 356 169 7 383 373 265 -1.7% 4.6% 4.0%
Total 26 163 6 051 077 26 418 6 412 002 25 739 7 165 979 25 909 – 25 909 8 035 434 27 346 8 552 695 27 965 8 838 276 28 505 9 262 844 3.2% 4.9% 100.0%
1. Personnel numbers includes all filled posts together with those posts additional to the approved establishment
Average annual growth over MTEF
2016/17 2017/18 2018/19 2019/20 2020/21 2021/22 2022/23 2019/20 - 2022/23

Department of Health
104
Summary of performance against Provincial Human Resource Plan
Current deployment of staff
The department managed to balance the 2019/20 MTEF to the revised baseline allocation, even
though a number of additional and critical services will not be adequately funded. Efficiency measures
will be implemented should funding be inadequate.
The approved funded structure has 21 705 posts that was approved by the MPSA on 04 October
2019. The department is busy with the developing of an ideal structure with the purpose of
implementing NHI.
Imbalances in service structures and staff mix
The changes in policy regarding staff mix as a result of changes in functions and strategies (e.g. NHI,
PHC re-engineering) is being implemented in the new budgeted aligned structure.
Accuracy of staff establishment at all level against service requirements
The organisational and post structure were drafted and is aligned with the personnel budget. To have
an approved structure in line with the COE budget, the structure mainly concentrated on current warm
bodies, alignment of the top structure and significant reduction in unfunded posts.
Staff recruitment and retention systems and challenges
The department developed a recruitment and retention strategy and policy which consolidate several
interventions and strategies such as rural allowance, strengthening of OSD implementation and
availing adequate funding for bursaries especially for students from the rural and underserved areas.
Absenteeism and staff turnovers
Employees that are classified as highly skilled supervision (Sal level 9-12) took the most sick leave,
36 days on average per employee followed by skilled employees (Sal Levels 3 – 5). Senior managers
took the least number of sick leave, 8 days on average.
The average turnover rate over the past year was standing at 32per cent overall and 17per cent for
critical occupations. The reason for the high turnover is since the department has been filling posts
during the past financial year.
Progress on the rollout of Workload Indicators Staffing Need (WISN) tool and methodology
The project on WISN is currently on hold whilst the department is developing the ideal structure for
the implementation of the National Health Insurance.

2020/21 Estimates of Provincial Revenue and Expenditure
105
10.2 Training
Table 3.33 : Information on training: Health
OutcomeMain
appropriation
Adjusted
appropriation
Revised
estimateMedium-term estimates
R thousand 2016/17 2017/18 2018/19 2020/21 2021/22 2022/23
Number of staff 26 163 26 418 25 739 25 909 25 909 25 909 27 346 27 965 28 505
Number of personnel trained 9 400 10 000 10 700 1 580 1 580 1 580 1 610 1 720 1 720
of which
Male 3 000 3 500 4 000 500 500 500 510 520 520
Female 6 400 6 500 6 700 1 080 1 080 1 080 1 100 1 200 1 200
Number of training opportunities 415 429 445 195 195 195 209 219 219
of which
Tertiary 40 42 44 30 30 30 32 35 35
Workshops 200 210 222 150 150 150 160 165 165
Seminars 30 32 33 10 10 10 12 14 14
Other 145 145 145 5 5 5 5 5 5
Number of bursaries offered 419 441 450 200 200 200 200 200 200
Number of interns appointed 115 115 115 200 200 200 200 200 200
Number of learnerships appointed 160 170 180 50 50 50 50 100 100
Number of day s spent on training – – – – – 1 100 – – –
Payments on training by programme
1. Administration – – – – – – – – –
2. District Health Serv ices 11 944 13 582 14 370 15 174 15 174 15 174 16 009 16 889 17 700
3. Emergency Medical Serv ices 1 726 1 826 1 932 2 040 2 040 2 040 2 152 2 270 2 379
4. Prov incial Hospital Serv ices 2 000 2 380 2 518 2 659 2 659 2 659 2 805 2 959 3 101
5. Central Hospital Serv ices – – – – – – – – –
6. Health Science And Training 29 924 35 696 37 766 39 881 39 881 39 881 42 074 44 388 46 519
7. Health Care Support Serv ices 2 256 2 369 2 506 2 647 2 647 2 647 2 793 2 947 3 088
8. Health Facilities And Maintenance – – – – – – – – –
Total payments on training 47 850 55 853 59 092 62 401 62 401 62 401 65 833 69 453 72 787
2019/20
Budget provision and sustainability for the Cuban Training Programme
Training Other
Many important building blocks have been put in place in relation to human resources development,
but despite all these efforts, the Department remains constrained by shortage of staff; ageing
workforce; lack of skills, and budgetary constraints to up skill those in the system. Similarly, youth
unemployment is a major national challenge and need urgent and coordinated responses to address.
The Department therefore also must play a major role in the development on youth through;
Internships; Apprenticeships; Bursaries and Learnerships.
For our Province to achieve high levels of economic growth and address our social challenges of
poverty and unemployment the Department must invest in education and training and skills
development to achieve the vision of a skilled and capable workforce. With limited budget the
Department has not been able to accommodate the required number of graduate and student interns
for workplace exposure; nor has it been able to initiate learnerships for unemployed youth related to
the following trades; Electrical Engineering; Plumbing and Carpentry which skills are important skills
for the maintenance of our health infrastructure.
In respect of the of the Nelson Mandela/ Fidel Castro Medical Training Programme it must be noted
that presently there are two hundred and seven (207) students at various levels in Cuba, and one
hundred and twenty-nine (129) students in local universities doing their final 18 months clinical

Department of Health
106
rotations. In the 2020/2021 financial year therefore there will be over one hundred and fifty (150)
students doing their final rotations in the different medical universities. It is envisaged that over a
hundred students will come for vacation next year and will also be doing their three-week electives at
the different hospitals. This will require that the Department buy air tickets; and pay for their
accommodation, meals and transportation again during the electives period and pay for student’s
tuition for those in local universities. As has been the case in recent years, high per centage of the
Training Budget is utilized for these students as the Department cannot renege on its obligations.
Prioritised training programmes for the 2020/2021 are skewed towards induction of new employees;
unemployed youth; serving officers in identified scarce clinical and transversal skills as pinpointed by
the Auditors and National Health for implementation of NHI. The Department therefore needs to gear
up for the challenges facing it.
10.3 Reconciliation of structural changes
No structural changes were made.
Table 3.34 : Reconciliation of structural changes: Health
2019/20 2020/21
Program
mesR'000 Programmes R'000
1. Administration 721 178
1. Office Of The Mec 11 493
2. Management 709 685
2. District Health Services 6 409 910
1. District Management 681 433
2. Community Based Serv ices 6 745
3. Community Health Centres 970 221
4. Other Community Serv ices 535 082
5. Hiv / Aids 1 641 298
6. Nutrition 1 323
7. Community Health Clinics 981 145
8. Coroner Serv ices 100 749
9. District Hospitals 1 491 914
3. Emergency Medical Services 405 759
1. Emergency Transport 366 759
2. Planned Patient Transport 39 000
4. Provincial Hospital Services 2 176 077
1. Prov incial Hospitals 1 610 652
2. Psy chiatric/ Mental Hospitals 565 425
5. Central Hospital Services 2 000 229
1. Prov incial Hospital Tertiary Serv ices 2 000 229
2. Central Hospital Serv ices –
6. Health Science And Training 335 243
1. Nurses Training Colleges 153 230
2. Ems Training College 16 146
3. Primary Health Care Training 13 985
4. Training Other 151 882
7. Health Care Support Services 551 633
1. Engineering 109 518
2. Prov incial Laundry Serv ices 27 818
3. Orthotic And Prothetic Serv ices 14 029
4. Medicine Trading Account 400 268
8. Health Facilities And Maintenance 597 158
1. Community Health Facilities –
2. District Hospital Serv ices 597 158
3. Other Facilities –
4. Health Maintenance –
– 13 197 187

2020/21 Estimates of Provincial Revenue and Expenditure
107
Annexure to the Estimates of Provincial Revenue and
Expenditure

Department of Health
108
Table B.1: Specification of receipts: Health
OutcomeMain
appropriation
Adjusted
appropriation
Revised
estimateMedium-term estimates
R thousand 2016/17 2017/18 2018/19 2020/21 2021/22 2022/23
Tax receipts – – – – – – – – –
Casino tax es – – – – – – – – –
Horse racing tax es – – – – – – – – –
Liquor licences – – – – – – – – –
Motor v ehicle licences – – – – – – – – –
Sales of goods and services other than capital assets 71 687 71 838 65 057 80 116 80 116 80 116 84 522 89 081 93 357
Sale of goods and serv ices produced by department (ex cluding capital assets) 71 566 71 772 65 025 80 116 80 116 80 116 84 522 89 081 93 357
Sales by market establishments – – – – – – – – –
Administrativ e fees 1 231 1 497 1 545 2 471 2 471 2 471 2 607 2 750 4 947
Other sales 70 335 70 275 63 480 77 645 77 645 77 645 81 915 86 331 88 410
Of which
Health patient fees 56 554 56 699 53 039 64 798 64 798 64 798 68 362 72 122 76 292
Other (Specify) 852 482 555 586 586 586 618 652 416
Other (Specify) 4 482 7 281 4 385 6 452 6 452 6 452 6 807 7 181 6 968
Other (Specify) 8 447 5 813 5 501 5 809 5 809 5 809 6 128 6 465 4 734
Sales of scrap, w aste, arms and other used current goods (ex cluding capital assets) 121 66 32 – – – – – –
Transfers received from: – – – – – – – – –
Other gov ernmental units – – – – – – – – –
Higher education institutions – – – – – – – – –
Foreign gov ernments – – – – – – – – –
International organisations – – – – – – – – –
Public corporations and priv ate enterprises – – – – – – – – –
Households and non-profit institutions – – – – – – – – –
Fines, penalties and forfeits – – – – – – – – –
Interest, dividends and rent on land – – – – – – – – –
Interest – – – – – – – – –
Div idends – – – – – – – – –
Rent on land – – – – – – – – –
Sales of capital assets – – – – – – – – –
Land and sub-soil assets – – – – – – – – –
Other capital assets – – – – – – – – –
Transactions in financial assets and liabilities 7 051 3 893 3 465 4 942 4 942 4 942 5 214 5 501 5 765
Total departmental receipts 78 738 75 731 68 522 85 058 85 058 85 058 89 736 94 582 99 122
2019/20
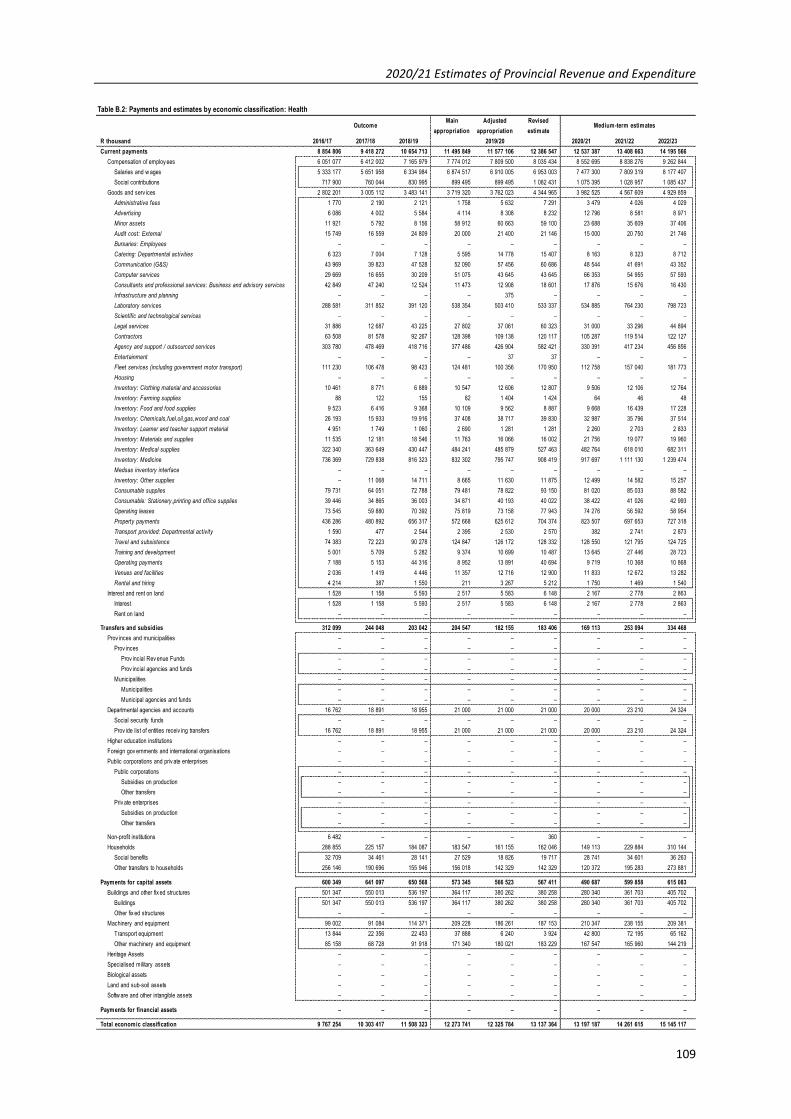
2020/21 Estimates of Provincial Revenue and Expenditure
109
Table B.2: Payments and estimates by economic classification: Health
OutcomeMain
appropriation
Adjusted
appropriation
Revised
estimateMedium-term estimates
R thousand 2016/17 2017/18 2018/19 2020/21 2021/22 2022/23
Current payments 8 854 806 9 418 272 10 654 713 11 495 849 11 577 106 12 386 547 12 537 387 13 408 663 14 195 566
Compensation of employ ees 6 051 077 6 412 002 7 165 979 7 774 012 7 809 500 8 035 434 8 552 695 8 838 276 9 262 844
Salaries and w ages 5 333 177 5 651 958 6 334 984 6 874 517 6 910 005 6 953 003 7 477 300 7 809 319 8 177 407
Social contributions 717 900 760 044 830 995 899 495 899 495 1 082 431 1 075 395 1 028 957 1 085 437
Goods and serv ices 2 802 201 3 005 112 3 483 141 3 719 320 3 762 023 4 344 965 3 982 525 4 567 609 4 929 859
Administrative fees 1 770 2 190 2 121 1 758 5 632 7 291 3 479 4 026 4 029
Advertising 6 086 4 002 5 584 4 114 8 308 8 232 12 796 8 581 8 971
Minor assets 11 921 5 792 8 156 58 912 60 663 59 100 23 688 35 609 37 406
Audit cost: External 15 749 16 559 24 809 20 000 21 400 21 146 15 000 20 750 21 746
Bursaries: Employees – – – – – – – – –
Catering: Departmental activities 6 323 7 004 7 128 5 595 14 778 15 407 8 163 8 323 8 712
Communication (G&S) 43 969 39 823 47 528 52 090 57 456 60 686 48 544 41 691 43 352
Computer services 29 669 16 655 30 209 51 075 43 645 43 645 66 353 54 955 57 593
Consultants and professional services: Business and advisory services 42 849 47 240 12 524 11 473 12 908 18 601 17 876 15 676 16 430
Infrastructure and planning – – – – 375 – – – –
Laboratory services 288 581 311 852 391 120 538 354 503 410 533 337 534 885 764 230 798 723
Scientific and technological services – – – – – – – – –
Legal services 31 886 12 687 43 225 27 802 37 061 60 323 31 000 33 296 44 894
Contractors 63 508 81 578 92 267 128 398 109 138 120 117 105 287 119 514 122 127
Agency and support / outsourced services 303 780 478 469 418 716 377 486 426 904 582 421 330 391 417 234 456 856
Entertainment – – – – 37 37 – – –
Fleet services (including government motor transport) 111 230 106 478 98 423 124 481 100 356 170 950 112 758 157 040 181 773
Housing – – – – – – – – –
Inventory: Clothing material and accessories 10 461 8 771 6 889 10 547 12 606 12 807 9 506 12 106 12 764
Inventory: Farming supplies 88 122 155 82 1 404 1 424 64 46 48
Inventory: Food and food supplies 9 523 6 416 9 368 10 109 9 562 8 887 9 668 16 439 17 228
Inventory: Chemicals,fuel,oil,gas,wood and coal 26 193 15 933 19 916 37 408 38 717 39 830 32 987 35 796 37 514
Inventory: Learner and teacher support material 4 951 1 749 1 060 2 690 1 281 1 281 2 260 2 703 2 833
Inventory: Materials and supplies 11 535 12 181 18 546 11 763 16 066 16 002 21 756 19 077 19 960
Inventory: Medical supplies 322 340 363 649 430 447 484 241 485 879 527 463 482 764 618 010 682 311
Inventory: Medicine 736 369 729 838 816 323 832 302 795 747 908 419 917 697 1 111 130 1 239 474
Medsas inventory interface – – – – – – – – –
Inventory: Other supplies – 11 068 14 711 8 665 11 630 11 875 12 499 14 582 15 257
Consumable supplies 79 731 64 051 72 788 79 481 78 822 93 150 81 020 85 033 88 582
Consumable: Stationery,printing and office supplies 39 446 34 865 36 003 34 871 40 193 40 022 38 422 41 026 42 993
Operating leases 73 545 59 880 70 392 75 819 73 158 77 943 74 276 56 592 58 954
Property payments 436 286 480 892 656 317 572 668 625 612 704 374 823 507 697 653 727 318
Transport provided: Departmental activity 1 590 477 2 544 2 395 2 530 2 570 382 2 741 2 873
Travel and subsistence 74 383 72 223 90 278 124 847 126 172 128 332 128 550 121 795 124 725
Training and development 5 001 5 709 5 282 9 374 10 699 10 487 13 645 27 446 28 723
Operating payments 7 188 5 153 44 316 8 952 13 891 40 694 9 719 10 368 10 868
Venues and facilities 2 036 1 419 4 446 11 357 12 716 12 900 11 833 12 672 13 282
Rental and hiring 4 214 387 1 550 211 3 267 5 212 1 750 1 469 1 540
Interest and rent on land 1 528 1 158 5 593 2 517 5 583 6 148 2 167 2 778 2 863
Interest 1 528 1 158 5 593 2 517 5 583 6 148 2 167 2 778 2 863
Rent on land – – – – – – – – –
Transfers and subsidies 312 099 244 048 203 042 204 547 182 155 183 406 169 113 253 094 334 468
Prov inces and municipalities – – – – – – – – –
Prov inces – – – – – – – – –
Prov incial Rev enue Funds – – – – – – – – –
Prov incial agencies and funds – – – – – – – – –
Municipalities – – – – – – – – –
Municipalities – – – – – – – – –
Municipal agencies and funds – – – – – – – – –
Departmental agencies and accounts 16 762 18 891 18 955 21 000 21 000 21 000 20 000 23 210 24 324
Social security funds – – – – – – – – –
Prov ide list of entities receiv ing transfers 16 762 18 891 18 955 21 000 21 000 21 000 20 000 23 210 24 324
Higher education institutions – – – – – – – – –
Foreign gov ernments and international organisations – – – – – – – – –
Public corporations and priv ate enterprises – – – – – – – – –
Public corporations – – – – – – – – –
Subsidies on production – – – – – – – – –
Other transfers – – – – – – – – –
Priv ate enterprises – – – – – – – – –
Subsidies on production – – – – – – – – –
Other transfers – – – – – – – – –
Non-profit institutions 6 482 – – – – 360 – – –
Households 288 855 225 157 184 087 183 547 161 155 162 046 149 113 229 884 310 144
Social benefits 32 709 34 461 28 141 27 529 18 826 19 717 28 741 34 601 36 263
Other transfers to households 256 146 190 696 155 946 156 018 142 329 142 329 120 372 195 283 273 881
Payments for capital assets 600 349 641 097 650 568 573 345 566 523 567 411 490 687 599 858 615 083
Buildings and other fix ed structures 501 347 550 013 536 197 364 117 380 262 380 258 280 340 361 703 405 702
Buildings 501 347 550 013 536 197 364 117 380 262 380 258 280 340 361 703 405 702
Other fix ed structures – – – – – – – – –
Machinery and equipment 99 002 91 084 114 371 209 228 186 261 187 153 210 347 238 155 209 381
Transport equipment 13 844 22 356 22 453 37 888 6 240 3 924 42 800 72 195 65 162
Other machinery and equipment 85 158 68 728 91 918 171 340 180 021 183 229 167 547 165 960 144 219
Heritage Assets – – – – – – – – –
Specialised military assets – – – – – – – – –
Biological assets – – – – – – – – –
Land and sub-soil assets – – – – – – – – –
Softw are and other intangible assets – – – – – – – – –
Payments for financial assets – – – – – – – – –
Total economic classification 9 767 254 10 303 417 11 508 323 12 273 741 12 325 784 13 137 364 13 197 187 14 261 615 15 145 117
2019/20

Department of Health
110
Table B.2: Payments and estimates by economic classification: Programme 1: Administration
OutcomeMain
appropriation
Adjusted
appropriation
Revised
estimateMedium-term estimates
R thousand 2016/17 2017/18 2018/19 2020/21 2021/22 2022/23
Current payments 310 450 285 883 350 456 448 036 451 388 521 175 702 710 806 420 879 977
Compensation of employ ees 189 703 196 056 201 513 228 245 228 245 228 245 232 652 251 527 271 445
Salaries and w ages 165 430 171 352 176 730 201 576 201 576 201 576 202 042 219 234 237 602
Social contributions 24 273 24 704 24 783 26 669 26 669 26 669 30 610 32 293 33 843
Goods and serv ices 120 034 89 791 147 182 219 606 222 546 292 333 469 683 554 687 608 316
Administrative fees 882 785 864 640 1 416 1 670 1 417 1 445 1 324
Advertising 1 532 1 475 2 790 1 715 1 752 1 752 8 837 4 938 5 175
Minor assets 130 154 46 549 584 584 249 528 553
Audit cost: External 11 400 12 225 18 144 20 000 19 900 19 646 15 000 20 750 21 746
Bursaries: Employees – – – – – – – – –
Catering: Departmental activities 947 1 546 1 347 906 2 690 2 690 1 178 1 242 1 302
Communication (G&S) 5 834 3 917 4 277 5 743 4 895 4 895 4 098 5 116 5 361
Computer services 6 921 – – – – – – – –
Consultants and professional services: Business and advisory services 6 070 11 055 3 769 6 199 5 020 5 020 9 319 10 320 10 815
Infrastructure and planning – – – – 375 – – – –
Laboratory services – – 270 – – – – – –
Scientific and technological services – – – – – – – – –
Legal services 20 934 4 659 13 639 27 802 34 061 57 322 31 000 33 296 44 894
Contractors 837 69 7 619 2 468 256 256 1 100 1 337 1 401
Agency and support / outsourced services 7 796 – 17 235 700 5 700 5 700 4 800 14 892 15 607
Entertainment – – – – – – – – –
Fleet services (including government motor transport) 21 456 28 038 42 188 100 000 94 730 126 282 110 000 125 496 148 715
Housing – – – – – – – – –
Inventory: Clothing material and accessories 20 524 581 493 493 454 440 490 514
Inventory: Farming supplies – – – – – – – – –
Inventory: Food and food supplies 29 19 2 – – – – – –
Inventory: Chemicals,fuel,oil,gas,wood and coal 3 012 – 90 – – 39 70 20 21
Inventory: Learner and teacher support material – – – – – – – – –
Inventory: Materials and supplies 1 1 111 135 76 76 52 60 63
Inventory: Medical supplies – – – – – – – – –
Inventory: Medicine – – 2 061 – – – – – –
Medsas inventory interface – – – – – – – – –
Inventory: Other supplies – 413 – – 28 28 500 500 524
Consumable supplies 835 534 1 055 1 298 2 435 2 435 2 607 2 578 2 702
Consumable: Stationery,printing and office supplies 4 375 3 811 2 894 4 989 3 092 3 092 4 019 4 238 4 441
Operating leases 1 565 1 111 897 1 767 1 200 1 200 1 942 1 967 2 061
Property payments 9 617 7 775 16 066 21 525 20 259 35 607 250 000 301 380 315 846
Transport provided: Departmental activity – – – – – – – – –
Travel and subsistence 10 890 10 376 9 787 12 881 16 573 16 481 14 115 14 730 15 437
Training and development 371 65 24 – – – 25 – –
Operating payments 855 1 100 766 1 496 1 415 1 416 1 705 1 787 1 873
Venues and facilities 87 139 634 8 300 5 451 5 543 7 182 7 547 7 910
Rental and hiring 3 638 – 26 – 145 145 28 30 31
Interest and rent on land 713 36 1 761 185 597 597 375 206 216
Interest 713 36 1 761 185 597 597 375 206 216
Rent on land – – – – – – – – –
Transfers and subsidies 13 279 15 258 15 580 15 535 23 846 23 846 16 413 16 879 17 689
Prov inces and municipalities – – – – – – – – –
Prov inces – – – – – – – – –
Prov incial Rev enue Funds – – – – – – – – –
Prov incial agencies and funds – – – – – – – – –
Municipalities – – – – – – – – –
Municipalities – – – – – – – – –
Municipal agencies and funds – – – – – – – – –
Departmental agencies and accounts – – – – – – – – –
Social security funds – – – – – – – – –
Prov ide list of entities receiv ing transfers – – – – – – – – –
Higher education institutions – – – – – – – – –
Foreign gov ernments and international organisations – – – – – – – – –
Public corporations and priv ate enterprises – – – – – – – – –
Public corporations – – – – – – – – –
Subsidies on production – – – – – – – – –
Other transfers – – – – – – – – –
Priv ate enterprises – – – – – – – – –
Subsidies on production – – – – – – – – –
Other transfers – – – – – – – – –
Non-profit institutions – – – – – – – – –
Households 13 279 15 258 15 580 15 535 23 846 23 846 16 413 16 879 17 689
Social benefits 667 1 363 1 331 694 694 694 1 206 772 809
Other transfers to households 12 612 13 895 14 249 14 841 23 152 23 152 15 207 16 107 16 880
Payments for capital assets 3 784 1 443 2 054 1 430 1 430 1 430 2 055 2 500 2 618
Buildings and other fix ed structures – – – – – – – – –
Buildings – – – – – – – – –
Other fix ed structures – – – – – – – – –
Machinery and equipment 3 784 1 443 2 054 1 430 1 430 1 430 2 055 2 500 2 618
Transport equipment – – – – – – – – –
Other machinery and equipment 3 784 1 443 2 054 1 430 1 430 1 430 2 055 2 500 2 618
Heritage Assets – – – – – – – – –
Specialised military assets – – – – – – – – –
Biological assets – – – – – – – – –
Land and sub-soil assets – – – – – – – – –
Softw are and other intangible assets – – – – – – – – –
Payments for financial assets – – – – – – – – –
Total economic classification 327 513 302 584 368 090 465 001 476 664 546 451 721 178 825 799 900 284
2019/20

2020/21 Estimates of Provincial Revenue and Expenditure
111
Table B.2: Payments and estimates by economic classification: Programme 2: District Health Services
OutcomeMain
appropriation
Adjusted
appropriation
Revised
estimateMedium-term estimates
R thousand 2016/17 2017/18 2018/19 2020/21 2021/22 2022/23
Current payments 4 948 584 5 288 981 5 907 801 6 121 371 6 178 791 6 460 843 6 342 596 6 946 749 7 335 595
Compensation of employ ees 3 438 154 3 616 243 4 153 693 4 476 382 4 509 121 4 711 242 4 787 131 5 196 078 5 468 666
Salaries and w ages 3 036 087 3 192 448 3 688 148 3 959 800 3 992 539 4 152 159 4 245 301 4 629 050 4 867 331
Social contributions 402 067 423 795 465 545 516 582 516 582 559 083 541 830 567 028 601 335
Goods and serv ices 1 509 952 1 672 066 1 751 901 1 643 685 1 667 926 1 747 857 1 554 721 1 749 920 1 866 142
Administrative fees 178 371 813 391 1 121 2 560 913 1 454 1 523
Advertising 3 900 2 057 2 252 1 400 5 445 5 445 2 268 2 686 2 816
Minor assets 5 425 2 258 4 191 17 394 19 347 18 160 7 007 8 006 8 391
Audit cost: External 3 278 2 692 2 514 – – – – – –
Bursaries: Employees – – – – – – – – –
Catering: Departmental activities 4 784 4 775 4 263 3 366 10 314 10 909 4 391 5 282 5 536
Communication (G&S) 23 790 23 337 25 265 27 745 27 388 30 616 25 577 19 449 20 384
Computer services 104 42 – – 400 400 – – –
Consultants and professional services: Business and advisory services 36 691 36 092 1 518 5 063 6 650 12 343 5 824 5 092 5 338
Infrastructure and planning – – – – – – – – –
Laboratory services 223 603 229 847 293 274 378 802 345 031 362 218 416 901 570 477 595 670
Scientific and technological services – – – – – – – – –
Legal services 6 751 5 399 3 235 – 3 000 3 000 – – –
Contractors 12 496 18 521 19 167 27 459 31 839 38 370 22 878 12 476 13 076
Agency and support / outsourced services 117 487 282 790 123 114 103 649 123 572 117 249 92 768 98 580 99 713
Entertainment – – – – – – – – –
Fleet services (including government motor transport) 55 139 45 997 37 518 20 415 416 99 420 440
Housing – – – – – – – – –
Inventory: Clothing material and accessories 3 723 3 468 3 058 3 120 5 803 5 803 2 105 3 434 3 599
Inventory: Farming supplies 12 75 150 – 1 374 1 379 4 4 4
Inventory: Food and food supplies 6 450 2 774 5 457 4 633 4 768 3 964 4 106 7 203 7 549
Inventory: Chemicals,fuel,oil,gas,wood and coal 9 703 3 024 3 048 13 313 13 620 14 735 3 482 7 300 7 650
Inventory: Learner and teacher support material 5 – 6 – – – – 58 61
Inventory: Materials and supplies 2 699 3 570 9 213 3 810 6 260 6 271 6 375 6 917 7 249
Inventory: Medical supplies 112 938 102 272 129 280 140 188 136 883 142 423 102 981 148 258 165 373
Inventory: Medicine 529 900 563 504 657 013 531 028 507 267 520 505 541 650 601 888 648 789
Medsas inventory interface – – – – – – – – –
Inventory: Other supplies – 4 951 4 406 3 450 4 040 4 040 2 962 2 955 3 096
Consumable supplies 29 315 26 852 35 155 35 219 36 932 38 239 35 217 28 051 29 398
Consumable: Stationery,printing and office supplies 16 469 15 700 18 620 16 871 19 592 19 642 16 999 20 613 21 601
Operating leases 27 582 23 419 26 145 25 385 26 417 26 417 33 252 18 621 19 515
Property payments 233 727 228 638 263 469 228 864 252 339 278 361 160 958 106 125 121 218
Transport provided: Departmental activity 455 279 1 112 30 170 210 32 710 744
Travel and subsistence 37 338 35 472 47 233 65 399 60 494 64 018 57 103 62 427 65 423
Training and development 1 021 842 2 180 3 011 3 275 3 276 2 993 4 220 4 423
Operating payments 2 648 1 797 24 893 1 619 6 700 7 408 1 715 1 977 2 073
Venues and facilities 1 880 886 2 865 2 255 4 408 4 475 2 949 3 809 3 993
Rental and hiring 461 365 1 474 201 3 062 5 005 1 212 1 428 1 497
Interest and rent on land 478 672 2 207 1 304 1 744 1 744 744 751 787
Interest 478 672 2 207 1 304 1 744 1 744 744 751 787
Rent on land – – – – – – – – –
Transfers and subsidies 43 350 21 264 17 110 17 747 18 156 18 668 21 518 22 755 23 848
Prov inces and municipalities – – – – – – – – –
Prov inces – – – – – – – – –
Prov incial Rev enue Funds – – – – – – – – –
Prov incial agencies and funds – – – – – – – – –
Municipalities – – – – – – – – –
Municipalities – – – – – – – – –
Municipal agencies and funds – – – – – – – – –
Departmental agencies and accounts – – – – – – – – –
Social security funds – – – – – – – – –
Prov ide list of entities receiv ing transfers – – – – – – – – –
Higher education institutions – – – – – – – – –
Foreign gov ernments and international organisations – – – – – – – – –
Public corporations and priv ate enterprises – – – – – – – – –
Public corporations – – – – – – – – –
Subsidies on production – – – – – – – – –
Other transfers – – – – – – – – –
Priv ate enterprises – – – – – – – – –
Subsidies on production – – – – – – – – –
Other transfers – – – – – – – – –
Non-profit institutions 6 482 – – – – 360 – – –
Households 36 868 21 264 17 110 17 747 18 156 18 308 21 518 22 755 23 848
Social benefits 20 352 14 309 16 956 15 770 16 179 16 331 21 518 22 755 23 848
Other transfers to households 16 516 6 955 154 1 977 1 977 1 977 – – –
Payments for capital assets 20 649 24 580 27 512 52 804 51 017 51 027 45 796 40 633 42 580
Buildings and other fix ed structures – – – – – – – – –
Buildings – – – – – – – – –
Other fix ed structures – – – – – – – – –
Machinery and equipment 20 649 24 580 27 512 52 804 51 017 51 027 45 796 40 633 42 580
Transport equipment 1 407 544 3 048 4 800 4 500 2 000 4 800 5 587 5 855
Other machinery and equipment 19 242 24 036 24 464 48 004 46 517 49 027 40 996 35 046 36 725
Heritage Assets – – – – – – – – –
Specialised military assets – – – – – – – – –
Biological assets – – – – – – – – –
Land and sub-soil assets – – – – – – – – –
Softw are and other intangible assets – – – – – – – – –
Payments for financial assets – – – – – – – – –
Total economic classification 5 012 583 5 334 825 5 952 423 6 191 922 6 247 964 6 530 538 6 409 910 7 010 137 7 402 023
2019/20

Department of Health
112
Table B.2: Payments and estimates by economic classification: Programme 3: Emergency Medical Services
OutcomeMain
appropriation
Adjusted
appropriation
Revised
estimateMedium-term estimates
R thousand 2016/17 2017/18 2018/19 2020/21 2021/22 2022/23
Current payments 283 255 275 442 323 215 377 467 401 886 528 464 367 053 404 562 414 441
Compensation of employ ees 239 409 234 343 251 287 272 984 276 984 290 871 312 361 315 714 322 329
Salaries and w ages 203 920 196 609 210 564 234 913 238 913 241 166 272 196 273 340 277 921
Social contributions 35 489 37 734 40 723 38 071 38 071 49 705 40 165 42 374 44 408
Goods and serv ices 43 819 41 072 71 654 104 191 124 821 237 317 54 579 88 763 92 023
Administrative fees – -2 3 – – – – 5 5
Advertising 99 13 – – – – – – –
Minor assets 245 396 398 813 714 714 500 771 808
Audit cost: External 1 071 372 2 400 – – – – – –
Bursaries: Employees – – – – – – – – –
Catering: Departmental activities – 15 34 81 186 225 44 11 12
Communication (G&S) 3 937 2 873 3 489 3 023 2 953 3 030 3 219 2 524 2 645
Computer services 35 107 – – – – 20 – –
Consultants and professional services: Business and advisory services 10 9 4 080 – 232 232 – – –
Infrastructure and planning – – – – – – – – –
Laboratory services 112 201 644 – – – – – –
Scientific and technological services – – – – – – – – –
Legal services 1 802 1 276 4 008 – – – – – –
Contractors 1 348 1 895 761 341 385 385 210 377 395
Agency and support / outsourced services 1 417 9 167 21 671 52 189 88 548 161 822 40 000 44 678 45 823
Entertainment – – – – – – – – –
Fleet services (including government motor transport) 7 985 7 972 10 687 24 461 5 000 44 001 2 000 30 517 31 981
Housing – – – – – – – – –
Inventory: Clothing material and accessories 1 250 2 259 939 484 1 127 1 127 1 134 1 241 1 301
Inventory: Farming supplies – 21 – – – – – – –
Inventory: Food and food supplies 1 19 2 – – – – – –
Inventory: Chemicals,fuel,oil,gas,wood and coal 1 024 87 139 220 282 282 420 47 49
Inventory: Learner and teacher support material – – – – – – – – –
Inventory: Materials and supplies 373 282 253 260 111 111 136 529 554
Inventory: Medical supplies 604 616 1 029 1 400 897 897 266 1 410 1 478
Inventory: Medicine 291 130 2 – 10 10 – 105 110
Medsas inventory interface – – – – – – – – –
Inventory: Other supplies – 371 426 359 359 359 – 150 157
Consumable supplies 1 661 1 032 1 465 1 026 1 721 1 721 1 034 200 210
Consumable: Stationery,printing and office supplies 1 213 321 716 1 015 719 719 352 211 221
Operating leases 2 088 1 492 1 014 1 362 1 156 1 156 710 570 597
Property payments 14 906 7 463 6 422 9 128 13 855 13 855 945 652 683
Transport provided: Departmental activity – – 1 244 2 115 2 110 2 110 – 1 664 1 744
Travel and subsistence 2 276 2 589 3 568 5 321 3 938 3 938 3 589 2 735 2 866
Training and development – – 103 380 290 290 – 205 215
Operating payments 23 96 6 157 213 228 333 – 161 169
Venues and facilities 48 – – – – – – – –
Rental and hiring – – – – – – – – –
Interest and rent on land 27 27 274 292 81 276 113 85 89
Interest 27 27 274 292 81 276 113 85 89
Rent on land – – – – – – – – –
Transfers and subsidies 247 885 59 1 143 1 210 1 210 1 156 1 220 1 279
Prov inces and municipalities – – – – – – – – –
Prov inces – – – – – – – – –
Prov incial Rev enue Funds – – – – – – – – –
Prov incial agencies and funds – – – – – – – – –
Municipalities – – – – – – – – –
Municipalities – – – – – – – – –
Municipal agencies and funds – – – – – – – – –
Departmental agencies and accounts – – – – – – – – –
Social security funds – – – – – – – – –
Prov ide list of entities receiv ing transfers – – – – – – – – –
Higher education institutions – – – – – – – – –
Foreign gov ernments and international organisations – – – – – – – – –
Public corporations and priv ate enterprises – – – – – – – – –
Public corporations – – – – – – – – –
Subsidies on production – – – – – – – – –
Other transfers – – – – – – – – –
Priv ate enterprises – – – – – – – – –
Subsidies on production – – – – – – – – –
Other transfers – – – – – – – – –
Non-profit institutions – – – – – – – – –
Households 247 885 59 1 143 1 210 1 210 1 156 1 220 1 279
Social benefits 247 110 59 1 143 1 210 1 210 1 156 1 220 1 279
Other transfers to households – 775 – – – – – – –
Payments for capital assets 13 155 20 106 22 090 25 665 5 246 5 246 37 550 38 597 30 306
Buildings and other fix ed structures – – – – – – 9 000 – –
Buildings – – – – – – 9 000 – –
Other fix ed structures – – – – – – – – –
Machinery and equipment 13 155 20 106 22 090 25 665 5 246 5 246 28 550 38 597 30 306
Transport equipment 11 854 18 504 19 405 23 088 – – 28 000 38 285 29 979
Other machinery and equipment 1 301 1 602 2 685 2 577 5 246 5 246 550 312 327
Heritage Assets – – – – – – – – –
Specialised military assets – – – – – – – – –
Biological assets – – – – – – – – –
Land and sub-soil assets – – – – – – – – –
Softw are and other intangible assets – – – – – – – – –
Payments for financial assets – – – – – – – – –
Total economic classification 296 657 296 433 345 364 404 275 408 342 534 920 405 759 444 379 446 026
2019/20

2020/21 Estimates of Provincial Revenue and Expenditure
113
Table B.2: Payments and estimates by economic classification: Programme 4: Provincial Hospital Services
OutcomeMain
appropriation
Adjusted
appropriation
Revised
estimateMedium-term estimates
R thousand 2016/17 2017/18 2018/19 2020/21 2021/22 2022/23
Current payments 1 445 703 1 528 047 1 707 328 1 828 988 1 821 127 1 908 238 2 151 907 2 056 897 2 121 477
Compensation of employ ees 1 061 194 1 156 823 1 236 554 1 350 822 1 343 121 1 343 121 1 672 426 1 498 599 1 556 382
Salaries and w ages 932 662 1 022 189 1 089 237 1 092 674 1 084 973 1 084 717 1 300 235 1 205 781 1 249 508
Social contributions 128 532 134 634 147 317 258 148 258 148 258 404 372 191 292 818 306 874
Goods and serv ices 384 452 371 018 470 530 477 976 476 556 563 667 479 383 558 171 564 962
Administrative fees 171 57 47 310 610 610 278 180 189
Advertising 280 432 293 426 404 404 556 315 331
Minor assets 1 420 1 145 1 026 3 080 2 955 2 955 3 042 2 398 2 513
Audit cost: External – 270 635 – – – – – –
Bursaries: Employees – – – – – – – – –
Catering: Departmental activities 136 113 125 – 234 234 50 52 54
Communication (G&S) 2 924 3 810 5 239 6 263 6 482 6 482 6 292 5 692 5 965
Computer services – 15 6 – 71 71 111 32 34
Consultants and professional services: Business and advisory services 62 39 59 211 235 235 196 192 202
Infrastructure and planning – – – – – – – – –
Laboratory services 33 498 27 692 28 416 64 408 55 908 68 648 50 384 98 267 102 984
Scientific and technological services – – – – – – – – –
Legal services 1 399 845 18 176 – – – – – –
Contractors 14 554 26 849 20 834 22 335 19 011 23 693 25 700 23 588 24 721
Agency and support / outsourced services 70 955 81 794 96 245 90 724 88 036 114 270 84 718 99 955 114 753
Entertainment – – – – – – – – –
Fleet services (including government motor transport) 8 943 8 364 3 902 – 195 195 9 11 12
Housing – – – – – – – – –
Inventory: Clothing material and accessories 1 559 1 491 1 126 4 083 2 599 2 599 3 340 3 831 4 015
Inventory: Farming supplies – 18 – 82 27 42 60 42 44
Inventory: Food and food supplies 2 222 2 742 2 850 3 999 3 227 3 227 3 500 6 307 6 610
Inventory: Chemicals,fuel,oil,gas,wood and coal 4 483 940 1 477 2 318 1 868 1 868 2 870 3 817 4 000
Inventory: Learner and teacher support material – 90 132 – – – – – –
Inventory: Materials and supplies 1 997 4 125 3 154 2 078 4 150 4 150 5 250 4 103 4 300
Inventory: Medical supplies 72 357 57 945 68 733 78 551 82 060 82 060 76 044 112 164 89 522
Inventory: Medicine 55 653 27 872 25 590 37 692 28 692 29 765 48 432 59 550 61 408
Medsas inventory interface – – – – – – – – –
Inventory: Other supplies – 3 659 7 743 3 400 4 701 4 701 5 400 8 306 8 705
Consumable supplies 23 375 17 366 17 932 22 890 20 758 20 758 23 200 25 229 26 440
Consumable: Stationery,printing and office supplies 4 063 3 823 4 098 4 381 6 751 6 751 6 788 4 995 5 235
Operating leases 6 993 5 572 10 502 16 901 12 801 17 699 10 834 9 956 10 434
Property payments 69 125 88 689 139 683 97 084 121 941 133 421 113 909 76 635 79 334
Transport provided: Departmental activity 893 – – – – – – – –
Travel and subsistence 5 832 4 945 4 982 15 419 9 629 9 629 7 210 11 441 11 990
Training and development 1 384 316 808 693 1 613 1 613 1 040 1 019 1 068
Operating payments 103 – 6 620 648 648 26 637 170 94 99
Venues and facilities – – 97 – 950 950 – – –
Rental and hiring 71 – – – – – – – –
Interest and rent on land 57 206 244 190 1 450 1 450 98 127 133
Interest 57 206 244 190 1 450 1 450 98 127 133
Rent on land – – – – – – – – –
Transfers and subsidies 4 087 15 498 4 575 4 103 4 172 4 172 4 765 5 003 5 243
Prov inces and municipalities – – – – – – – – –
Prov inces – – – – – – – – –
Prov incial Rev enue Funds – – – – – – – – –
Prov incial agencies and funds – – – – – – – – –
Municipalities – – – – – – – – –
Municipalities – – – – – – – – –
Municipal agencies and funds – – – – – – – – –
Departmental agencies and accounts – – – – – – – – –
Social security funds – – – – – – – – –
Prov ide list of entities receiv ing transfers – – – – – – – – –
Higher education institutions – – – – – – – – –
Foreign gov ernments and international organisations – – – – – – – – –
Public corporations and priv ate enterprises – – – – – – – – –
Public corporations – – – – – – – – –
Subsidies on production – – – – – – – – –
Other transfers – – – – – – – – –
Priv ate enterprises – – – – – – – – –
Subsidies on production – – – – – – – – –
Other transfers – – – – – – – – –
Non-profit institutions – – – – – – – – –
Households 4 087 15 498 4 575 4 103 4 172 4 172 4 765 5 003 5 243
Social benefits 4 027 14 197 4 575 4 103 4 172 4 172 4 765 5 003 5 243
Other transfers to households 60 1 301 – – – – – – –
Payments for capital assets 14 118 11 901 12 037 16 953 14 745 15 547 19 405 23 026 23 791
Buildings and other fix ed structures – – – – – – – – –
Buildings – – – – – – – – –
Other fix ed structures – – – – – – – – –
Machinery and equipment 14 118 11 901 12 037 16 953 14 745 15 547 19 405 23 026 23 791
Transport equipment – – – – – – – – –
Other machinery and equipment 14 118 11 901 12 037 16 953 14 745 15 547 19 405 23 026 23 791
Heritage Assets – – – – – – – – –
Specialised military assets – – – – – – – – –
Biological assets – – – – – – – – –
Land and sub-soil assets – – – – – – – – –
Softw are and other intangible assets – – – – – – – – –
Payments for financial assets – – – – – – – – –
Total economic classification 1 463 908 1 555 446 1 723 940 1 850 044 1 840 044 1 927 957 2 176 077 2 084 926 2 150 511
2019/20

Department of Health
114
Table B.2: Payments and estimates by economic classification: Programme 5: Central Hospital Services
OutcomeMain
appropriation
Adjusted
appropriation
Revised
estimateMedium-term estimates
R thousand 2016/17 2017/18 2018/19 2020/21 2021/22 2022/23
Current payments 1 363 640 1 524 131 1 723 228 1 872 440 1 888 640 2 043 378 1 961 131 2 133 884 2 260 050
Compensation of employ ees 925 070 1 018 959 1 127 080 1 229 636 1 242 286 1 250 865 1 316 526 1 334 679 1 385 701
Salaries and w ages 819 619 902 375 998 249 1 204 657 1 217 307 1 093 559 1 284 303 1 299 711 1 349 055
Social contributions 105 451 116 584 128 831 24 979 24 979 157 306 32 223 34 968 36 646
Goods and serv ices 438 342 504 976 595 221 642 343 644 783 790 942 643 885 798 720 873 841
Administrative fees 104 27 30 35 35 35 55 37 39
Advertising 57 6 3 16 150 150 75 79 83
Minor assets 646 748 790 980 1 599 1 599 1 382 4 254 4 458
Audit cost: External – 1 000 1 000 – – – – – –
Bursaries: Employees – – – – – – – – –
Catering: Departmental activities 10 24 – – 162 162 205 84 88
Communication (G&S) 4 573 4 249 6 852 5 856 5 870 5 870 6 012 5 940 6 225
Computer services 98 66 174 16 46 46 48 63 66
Consultants and professional services: Business and advisory services 16 4 3 092 – 20 20 37 72 75
Infrastructure and planning – – – – – – – – –
Laboratory services 31 368 54 112 68 516 95 144 102 471 102 471 67 600 95 486 100 069
Scientific and technological services – – – – – – – – –
Legal services 1 000 508 1 167 – – 1 – – –
Contractors 17 918 16 610 24 617 24 844 23 872 23 872 26 368 27 616 28 942
Agency and support / outsourced services 88 710 96 917 148 782 119 553 112 362 174 694 94 105 145 015 166 168
Entertainment – – – – 37 37 – – –
Fleet services (including government motor transport) 16 155 11 898 – – – 40 120 37 39
Housing – – – – – – – – –
Inventory: Clothing material and accessories 420 211 598 1 196 1 466 1 466 1 514 2 210 2 316
Inventory: Farming supplies – – – – – – – – –
Inventory: Food and food supplies 817 859 1 052 1 458 1 548 1 696 2 002 2 923 3 063
Inventory: Chemicals,fuel,oil,gas,wood and coal 7 940 11 838 11 953 21 430 22 790 22 790 26 052 24 505 25 681
Inventory: Learner and teacher support material – – 12 – – – – – –
Inventory: Materials and supplies 1 522 1 455 1 438 1 439 2 359 2 359 5 829 3 468 3 634
Inventory: Medical supplies 114 950 161 167 165 764 206 414 204 365 220 365 222 236 250 043 274 638
Inventory: Medicine 54 098 55 373 31 938 53 095 59 095 89 095 45 422 83 025 97 010
Medsas inventory interface – – – – – – – – –
Inventory: Other supplies – 1 527 1 907 1 456 2 301 2 301 2 335 1 644 1 723
Consumable supplies 19 387 14 023 13 004 13 343 11 482 23 918 13 034 18 983 19 894
Consumable: Stationery,printing and office supplies 3 571 3 746 4 148 3 570 4 488 4 488 4 758 5 337 5 593
Operating leases 18 758 12 755 9 916 11 481 11 469 11 469 15 659 15 153 15 880
Property payments 51 093 50 828 90 911 69 591 68 343 93 545 79 010 99 779 104 568
Transport provided: Departmental activity 242 198 188 250 250 250 350 367 385
Travel and subsistence 2 016 3 167 3 337 6 042 4 219 4 219 24 361 6 968 7 302
Training and development 203 152 74 300 300 300 687 840 880
Operating payments 2 670 1 508 3 958 4 834 3 684 3 684 4 629 4 792 5 022
Venues and facilities – – – – – – – – –
Rental and hiring – – – – – – – – –
Interest and rent on land 228 196 927 461 1 571 1 571 720 485 508
Interest 228 196 927 461 1 571 1 571 720 485 508
Rent on land – – – – – – – – –
Transfers and subsidies 6 182 3 506 3 825 3 788 3 788 4 146 4 049 3 997 4 189
Prov inces and municipalities – – – – – – – – –
Prov inces – – – – – – – – –
Prov incial Rev enue Funds – – – – – – – – –
Prov incial agencies and funds – – – – – – – – –
Municipalities – – – – – – – – –
Municipalities – – – – – – – – –
Municipal agencies and funds – – – – – – – – –
Departmental agencies and accounts – – – – – – – – –
Social security funds – – – – – – – – –
Prov ide list of entities receiv ing transfers – – – – – – – – –
Higher education institutions – – – – – – – – –
Foreign gov ernments and international organisations – – – – – – – – –
Public corporations and priv ate enterprises – – – – – – – – –
Public corporations – – – – – – – – –
Subsidies on production – – – – – – – – –
Other transfers – – – – – – – – –
Priv ate enterprises – – – – – – – – –
Subsidies on production – – – – – – – – –
Other transfers – – – – – – – – –
Non-profit institutions – – – – – – – – –
Households 6 182 3 506 3 825 3 788 3 788 4 146 4 049 3 997 4 189
Social benefits 6 182 3 506 3 825 3 788 3 788 4 146 4 049 3 997 4 189
Other transfers to households – – – – – – – – –
Payments for capital assets 28 361 25 009 36 482 35 956 49 722 49 722 35 049 41 620 19 170
Buildings and other fix ed structures – – – – – – – – –
Buildings – – – – – – – – –
Other fix ed structures – – – – – – – – –
Machinery and equipment 28 361 25 009 36 482 35 956 49 722 49 722 35 049 41 620 19 170
Transport equipment – – – – – – – – –
Other machinery and equipment 28 361 25 009 36 482 35 956 49 722 49 722 35 049 41 620 19 170
Heritage Assets – – – – – – – – –
Specialised military assets – – – – – – – – –
Biological assets – – – – – – – – –
Land and sub-soil assets – – – – – – – – –
Softw are and other intangible assets – – – – – – – – –
Payments for financial assets – – – – – – – – –
Total economic classification 1 398 183 1 552 646 1 763 535 1 912 184 1 942 150 2 097 246 2 000 229 2 179 501 2 283 409
2019/20

2020/21 Estimates of Provincial Revenue and Expenditure
115
Table B.2: Payments and estimates by economic classification: Programme 6: Health Science And Training
OutcomeMain
appropriation
Adjusted
appropriation
Revised
estimateMedium-term estimates
R thousand 2016/17 2017/18 2018/19 2020/21 2021/22 2022/23
Current payments 220 474 201 150 221 160 222 266 240 635 240 276 212 660 242 160 252 927
Compensation of employ ees 130 566 122 094 122 076 133 053 126 853 126 853 134 124 142 220 151 451
Salaries and w ages 117 666 108 955 108 429 114 432 108 232 108 232 94 803 100 736 107 975
Social contributions 12 900 13 139 13 647 18 621 18 621 18 621 39 321 41 484 43 476
Goods and serv ices 89 888 79 038 99 029 89 167 113 731 113 372 78 476 99 877 101 410
Administrative fees 370 891 323 372 2 412 2 370 801 889 932
Advertising 218 19 63 57 57 57 60 63 66
Minor assets 2 092 306 483 1 682 1 073 697 625 254 266
Audit cost: External – – – – 1 500 1 500 – – –
Bursaries: Employees – – – – – – – – –
Catering: Departmental activities 319 411 1 271 1 032 982 977 1 295 1 389 1 456
Communication (G&S) 1 537 1 339 2 084 3 012 1 623 1 548 2 787 2 181 2 266
Computer services 8 74 280 – – – 300 – –
Consultants and professional services: Business and advisory services – 41 6 – 750 750 – – –
Infrastructure and planning – – – – – – – – –
Laboratory services – – – – – – – – –
Scientific and technological services – – – – – – – – –
Legal services – – – – – – – – –
Contractors 8 204 4 648 2 577 9 041 6 752 6 385 3 769 4 653 4 876
Agency and support / outsourced services 5 646 3 580 4 429 8 985 6 894 6 894 6 000 8 503 8 911
Entertainment – – – – – – – – –
Fleet services (including government motor transport) 1 312 3 709 3 742 – 16 16 100 105 110
Housing – – – – – – – – –
Inventory: Clothing material and accessories 2 849 316 557 500 347 347 470 -130 -136
Inventory: Farming supplies 76 – – – 3 3 – – –
Inventory: Food and food supplies – 3 5 19 19 – – – –
Inventory: Chemicals,fuel,oil,gas,wood and coal 31 16 24 77 77 36 40 51 54
Inventory: Learner and teacher support material 4 946 1 659 910 2 690 1 281 1 281 2 260 2 645 2 772
Inventory: Materials and supplies 1 006 873 776 490 540 531 1 099 1 163 1 210
Inventory: Medical supplies 927 179 365 133 204 212 190 206 214
Inventory: Medicine – – – – 196 98 200 – –
Medsas inventory interface – – – – – – – – –
Inventory: Other supplies – 147 96 – 201 314 302 527 552
Consumable supplies 2 043 1 402 1 831 2 335 2 645 2 540 2 407 2 541 2 660
Consumable: Stationery,printing and office supplies 8 017 5 152 3 936 2 371 4 299 4 078 3 164 3 689 3 866
Operating leases 16 466 15 494 21 880 18 870 20 062 19 948 11 824 10 267 10 406
Property payments 16 957 18 631 28 973 13 453 23 939 26 656 11 283 15 840 16 486
Transport provided: Departmental activity – – – – – – – – –
Travel and subsistence 14 716 14 882 19 648 18 416 29 868 28 143 18 700 21 508 19 797
Training and development 1 334 4 226 1 998 4 690 4 895 4 895 8 400 20 662 21 637
Operating payments 793 652 1 922 142 1 140 1 140 1 500 1 557 1 632
Venues and facilities 21 388 850 800 1 906 1 904 900 1 314 1 377
Rental and hiring – – – – 50 52 – – –
Interest and rent on land 20 18 55 46 51 51 60 63 66
Interest 20 18 55 46 51 51 60 63 66
Rent on land – – – – – – – – –
Transfers and subsidies 244 859 187 483 161 703 162 030 130 674 131 033 121 000 203 016 281 985
Prov inces and municipalities – – – – – – – – –
Prov inces – – – – – – – – –
Prov incial Rev enue Funds – – – – – – – – –
Prov incial agencies and funds – – – – – – – – –
Municipalities – – – – – – – – –
Municipalities – – – – – – – – –
Municipal agencies and funds – – – – – – – – –
Departmental agencies and accounts 16 762 18 891 18 955 21 000 21 000 21 000 20 000 23 210 24 324
Social security funds – – – – – – – – –
Prov ide list of entities receiv ing transfers 16 762 18 891 18 955 21 000 21 000 21 000 20 000 23 210 24 324
Higher education institutions – – – – – – – – –
Foreign gov ernments and international organisations – – – – – – – – –
Public corporations and priv ate enterprises – – – – – – – – –
Public corporations – – – – – – – – –
Subsidies on production – – – – – – – – –
Other transfers – – – – – – – – –
Priv ate enterprises – – – – – – – – –
Subsidies on production – – – – – – – – –
Other transfers – – – – – – – – –
Non-profit institutions – – – – – – – – –
Households 228 097 168 592 142 748 141 030 109 674 110 033 101 000 179 806 257 661
Social benefits 1 139 822 1 205 1 830 -7 526 -7 167 -4 165 630 660
Other transfers to households 226 958 167 770 141 543 139 200 117 200 117 200 105 165 179 176 257 001
Payments for capital assets 1 658 1 853 3 458 3 658 3 658 3 658 1 583 3 471 3 546
Buildings and other fix ed structures – – – – – – – – –
Buildings – – – – – – – – –
Other fix ed structures – – – – – – – – –
Machinery and equipment 1 658 1 853 3 458 3 658 3 658 3 658 1 583 3 471 3 546
Transport equipment – – – – – 184 – – –
Other machinery and equipment 1 658 1 853 3 458 3 658 3 658 3 474 1 583 3 471 3 546
Heritage Assets – – – – – – – – –
Specialised military assets – – – – – – – – –
Biological assets – – – – – – – – –
Land and sub-soil assets – – – – – – – – –
Softw are and other intangible assets – – – – – – – – –
Payments for financial assets – – – – – – – – –
Total economic classification 466 991 390 486 386 321 387 954 374 967 374 967 335 243 448 647 538 458
2019/20

Department of Health
116
Table B.2: Payments and estimates by economic classification: Programme 7: Health Care Support Services
OutcomeMain
appropriation
Adjusted
appropriation
Revised
estimateMedium-term estimates
R thousand 2016/17 2017/18 2018/19 2020/21 2021/22 2022/23
Current payments 228 407 232 827 295 144 405 420 408 729 498 339 535 412 637 096 757 895
Compensation of employ ees 50 574 52 010 56 977 62 090 64 090 65 437 71 475 73 459 78 870
Salaries and w ages 42 765 44 009 48 344 53 661 55 661 56 180 62 856 64 367 69 342
Social contributions 7 809 8 001 8 633 8 429 8 429 9 257 8 619 9 092 9 528
Goods and serv ices 177 828 180 814 238 042 343 291 344 550 432 813 463 880 563 576 678 961
Administrative fees 15 30 33 10 38 46 15 16 17
Advertising – – – – – – – – –
Minor assets 2 72 35 264 241 241 383 398 417
Audit cost: External – – 116 – – – – – –
Bursaries: Employees – – – – – – – – –
Catering: Departmental activities 19 7 30 10 10 10 – 13 14
Communication (G&S) 217 267 298 348 8 145 8 145 359 378 396
Computer services 22 503 16 351 29 749 51 059 43 128 43 128 65 874 54 860 57 493
Consultants and professional services: Business and advisory services – – – – 1 1 – – –
Infrastructure and planning – – – – – – – – –
Laboratory services – – – – – – – – –
Scientific and technological services – – – – – – – – –
Legal services – – 3 000 – – – – – –
Contractors 8 151 10 585 10 242 9 060 8 251 8 076 14 762 16 257 17 048
Agency and support / outsourced services 11 769 4 221 7 240 1 686 1 792 1 792 8 000 5 611 5 881
Entertainment – – – – – – – – –
Fleet services (including government motor transport) 240 270 386 – – – 430 454 476
Housing – – – – – – – – –
Inventory: Clothing material and accessories 640 502 30 171 271 511 503 530 555
Inventory: Farming supplies – 8 5 – – – – – –
Inventory: Food and food supplies 4 – – – – – – 6 6
Inventory: Chemicals,fuel,oil,gas,wood and coal – 28 3 185 50 80 80 53 56 59
Inventory: Learner and teacher support material – – – – – – – – –
Inventory: Materials and supplies 3 240 1 623 3 056 3 051 2 070 2 004 2 015 2 337 2 450
Inventory: Medical supplies 20 074 41 471 64 794 57 455 61 370 81 188 80 047 104 929 150 286
Inventory: Medicine 96 427 82 959 99 719 210 487 200 487 268 946 281 993 366 562 432 157
Medsas inventory interface – – – – – – – – –
Inventory: Other supplies – – – – – – – – –
Consumable supplies 2 428 2 277 1 688 2 370 1 849 1 849 2 521 2 651 2 778
Consumable: Stationery,printing and office supplies 1 737 2 312 1 591 1 674 1 252 1 252 1 842 1 943 2 036
Operating leases 93 37 38 53 53 54 55 58 61
Property payments 9 949 17 578 12 447 5 162 14 948 14 926 4 544 6 018 6 307
Transport provided: Departmental activity – – – – – – – – –
Travel and subsistence 276 188 303 369 451 451 472 486 510
Training and development – – 7 – 26 26 – – –
Operating payments – – – – 76 76 – – –
Venues and facilities – 6 – 2 1 1 2 2 2
Rental and hiring 44 22 50 10 10 10 10 11 12
Interest and rent on land 5 3 125 39 89 89 57 61 64
Interest 5 3 125 39 89 89 57 61 64
Rent on land – – – – – – – – –
Transfers and subsidies 95 112 167 201 309 331 212 224 235
Prov inces and municipalities – – – – – – – – –
Prov inces – – – – – – – – –
Prov incial Rev enue Funds – – – – – – – – –
Prov incial agencies and funds – – – – – – – – –
Municipalities – – – – – – – – –
Municipalities – – – – – – – – –
Municipal agencies and funds – – – – – – – – –
Departmental agencies and accounts – – – – – – – – –
Social security funds – – – – – – – – –
Prov ide list of entities receiv ing transfers – – – – – – – – –
Higher education institutions – – – – – – – – –
Foreign gov ernments and international organisations – – – – – – – – –
Public corporations and priv ate enterprises – – – – – – – – –
Public corporations – – – – – – – – –
Subsidies on production – – – – – – – – –
Other transfers – – – – – – – – –
Priv ate enterprises – – – – – – – – –
Subsidies on production – – – – – – – – –
Other transfers – – – – – – – – –
Non-profit institutions – – – – – – – – –
Households 95 112 167 201 309 331 212 224 235
Social benefits 95 112 167 201 309 331 212 224 235
Other transfers to households – – – – – – – – –
Payments for capital assets 5 084 4 303 3 016 26 812 11 243 11 243 16 009 50 308 52 370
Buildings and other fix ed structures – – – – – – – – –
Buildings – – – – – – – – –
Other fix ed structures – – – – – – – – –
Machinery and equipment 5 084 4 303 3 016 26 812 11 243 11 243 16 009 50 308 52 370
Transport equipment 583 3 308 – 10 000 1 740 1 740 10 000 28 323 29 328
Other machinery and equipment 4 501 995 3 016 16 812 9 503 9 503 6 009 21 985 23 042
Heritage Assets – – – – – – – – –
Specialised military assets – – – – – – – – –
Biological assets – – – – – – – – –
Land and sub-soil assets – – – – – – – – –
Softw are and other intangible assets – – – – – – – – –
Payments for financial assets – – – – – – – – –
Total economic classification 233 586 237 242 298 327 432 433 420 281 509 913 551 633 687 628 810 500
2019/20

2020/21 Estimates of Provincial Revenue and Expenditure
117
Table B.2: Payments and estimates by economic classification: Programme 8: Health Facilities And Maintenance
OutcomeMain
appropriation
Adjusted
appropriation
Revised
estimateMedium-term estimates
R thousand 2016/17 2017/18 2018/19 2020/21 2021/22 2022/23
Current payments 54 293 81 811 126 381 219 861 185 910 185 834 263 918 180 895 173 204
Compensation of employ ees 16 407 15 474 16 799 20 800 18 800 18 800 26 000 26 000 28 000
Salaries and w ages 15 028 14 021 15 283 12 804 10 804 15 414 15 564 17 100 18 673
Social contributions 1 379 1 453 1 516 7 996 7 996 3 386 10 436 8 900 9 327
Goods and serv ices 37 886 66 337 109 582 199 061 167 110 166 664 237 918 153 895 144 204
Administrative fees 50 31 8 – – – – – –
Advertising – – 183 500 500 424 1 000 500 500
Minor assets 1 961 713 1 187 34 150 34 150 34 150 10 500 19 000 20 000
Audit cost: External – – – – – – – – –
Bursaries: Employees – – – – – – – – –
Catering: Departmental activities 108 113 58 200 200 200 1 000 250 250
Communication (G&S) 1 157 31 24 100 100 100 200 411 110
Computer services – – – – – – – – –
Consultants and professional services: Business and advisory services – – – – – – 2 500 – –
Infrastructure and planning – – – – – – – – –
Laboratory services – – – – – – – – –
Scientific and technological services – – – – – – – – –
Legal services – – – – – – – – –
Contractors – 2 401 6 450 32 850 18 772 19 080 10 500 33 210 31 668
Agency and support / outsourced services – – – – – – – – –
Entertainment – – – – – – – – –
Fleet services (including government motor transport) – 230 – – – – – – –
Housing – – – – – – – – –
Inventory: Clothing material and accessories – – – 500 500 500 – 500 600
Inventory: Farming supplies – – – – – – – – –
Inventory: Food and food supplies – – – – – – 60 – –
Inventory: Chemicals,fuel,oil,gas,wood and coal – – – – – – – – –
Inventory: Learner and teacher support material – – – – – – – – –
Inventory: Materials and supplies 697 252 545 500 500 500 1 000 500 500
Inventory: Medical supplies 490 -1 482 100 100 318 1 000 1 000 800
Inventory: Medicine – – – – – – – – –
Medsas inventory interface – – – – – – – – –
Inventory: Other supplies – – 133 – – 132 1 000 500 500
Consumable supplies 687 565 658 1 000 1 000 1 690 1 000 4 800 4 500
Consumable: Stationery,printing and office supplies 1 – – – – – 500 – –
Operating leases – – – – – – – – –
Property payments 30 912 61 290 98 346 127 861 109 988 108 003 202 858 91 224 82 876
Transport provided: Departmental activity – – – – – – – – –
Travel and subsistence 1 039 604 1 420 1 000 1 000 1 453 3 000 1 500 1 400
Training and development 688 108 88 300 300 87 500 500 500
Operating payments 96 – – – – – – – –
Venues and facilities – – – – – 27 800 – –
Rental and hiring – – – – – – 500 – –
Interest and rent on land – – – – – 370 – 1 000 1 000
Interest – – – – – 370 – 1 000 1 000
Rent on land – – – – – – – – –
Transfers and subsidies – 42 23 – – – – – –
Prov inces and municipalities – – – – – – – – –
Prov inces – – – – – – – – –
Prov incial Rev enue Funds – – – – – – – – –
Prov incial agencies and funds – – – – – – – – –
Municipalities – – – – – – – – –
Municipalities – – – – – – – – –
Municipal agencies and funds – – – – – – – – –
Departmental agencies and accounts – – – – – – – – –
Social security funds – – – – – – – – –
Prov ide list of entities receiv ing transfers – – – – – – – – –
Higher education institutions – – – – – – – – –
Foreign gov ernments and international organisations – – – – – – – – –
Public corporations and priv ate enterprises – – – – – – – – –
Public corporations – – – – – – – – –
Subsidies on production – – – – – – – – –
Other transfers – – – – – – – – –
Priv ate enterprises – – – – – – – – –
Subsidies on production – – – – – – – – –
Other transfers – – – – – – – – –
Non-profit institutions – – – – – – – – –
Households – 42 23 – – – – – –
Social benefits – 42 23 – – – – – –
Other transfers to households – – – – – – – – –
Payments for capital assets 513 540 551 902 543 919 410 067 429 462 429 538 333 240 399 703 440 702
Buildings and other fix ed structures 501 347 550 013 536 197 364 117 380 262 380 258 271 340 361 703 405 702
Buildings 501 347 550 013 536 197 364 117 380 262 380 258 271 340 361 703 405 702
Other fix ed structures – – – – – – – – –
Machinery and equipment 12 193 1 889 7 722 45 950 49 200 49 280 61 900 38 000 35 000
Transport equipment – – – – – – – – –
Other machinery and equipment 12 193 1 889 7 722 45 950 49 200 49 280 61 900 38 000 35 000
Heritage Assets – – – – – – – – –
Specialised military assets – – – – – – – – –
Biological assets – – – – – – – – –
Land and sub-soil assets – – – – – – – – –
Softw are and other intangible assets – – – – – – – – –
Payments for financial assets – – – – – – – – –
Total economic classification 567 833 633 755 670 323 629 928 615 372 615 372 597 158 580 598 613 906
2019/20

Department of Health
118
Table B.2: Payments and estimates by economic classification: Comprehensive Hiv/Aids & Tb Component
OutcomeMain
appropriation
Adjusted
appropriation
Revised
estimateMedium-term estimates
R thousand 2016/17 2017/18 2018/19 2020/21 2021/22 2022/23
Current payments 1 124 020 1 261 230 1 329 622 1 458 744 1 458 744 1 458 744 1 592 950 1 810 187 1 906 257
Compensation of employ ees 487 606 455 783 639 165 638 494 638 494 638 494 710 000 782 897 820 476
Salaries and w ages 462 136 426 991 606 235 610 668 610 668 610 668 670 000 745 087 780 851
Social contributions 25 470 28 792 32 930 27 826 27 826 27 826 40 000 37 810 39 625
Goods and serv ices 636 414 805 447 689 820 820 230 820 230 820 230 882 929 1 027 174 1 085 659
Administrative fees 44 36 142 250 250 250 317 305 320
Advertising 3 809 1 865 2 160 1 400 1 400 1 400 2 300 2 640 2 767
Minor assets 1 437 64 636 892 892 892 800 2 328 2 440
Audit cost: External – – – – – – – – –
Bursaries: Employees – – – – – – – – –
Catering: Departmental activities 3 763 1 131 2 785 2 000 2 000 2 000 6 000 3 492 3 660
Communication (G&S) 3 657 1 910 1 853 1 300 1 300 1 300 6 200 2 328 2 440
Computer services 104 – – – – – – – –
Consultants and professional services: Business and advisory services 33 371 – – – – – – – –
Infrastructure and planning – – – – – – – – –
Laboratory services 148 984 162 036 219 494 258 217 258 217 258 217 303 128 386 281 404 819
Scientific and technological services – – – – – – – – –
Legal services – – – – – – – – –
Contractors 879 19 27 2 320 2 320 2 320 80 58 61
Agency and support / outsourced services 55 085 223 824 27 559 15 000 15 000 15 000 28 000 11 338 11 882
Entertainment – – – – – – – – –
Fleet services (including government motor transport) 1 – – – – – – – –
Housing – – – – – – – – –
Inventory: Clothing material and accessories 467 – – – – – 28 – –
Inventory: Farming supplies – – – – – – – – –
Inventory: Food and food supplies 3 237 250 2 032 1 800 1 800 1 800 2 000 2 328 2 440
Inventory: Chemicals,fuel,oil,gas,wood and coal 1 – 2 50 50 50 20 58 61
Inventory: Learner and teacher support material – – – – – – – – –
Inventory: Materials and supplies – – 5 252 – – – 900 2 328 2 440
Inventory: Medical supplies 49 835 46 529 49 869 35 000 35 000 35 000 38 000 51 460 53 930
Inventory: Medicine 304 506 354 545 341 427 466 963 466 963 466 963 458 650 520 555 554 722
Medsas inventory interface – – – – – – – – –
Inventory: Other supplies – 93 439 220 220 220 53 582 610
Consumable supplies 2 010 2 237 5 662 10 000 10 000 10 000 3 700 11 639 12 198
Consumable: Stationery,printing and office supplies 4 096 1 429 5 940 3 125 3 125 3 125 600 5 238 5 489
Operating leases 462 79 105 698 698 698 132 233 244
Property payments 3 746 1 510 4 401 5 000 5 000 5 000 570 3 492 3 660
Transport provided: Departmental activity 193 – – – – – 1 000 – –
Travel and subsistence 12 523 5 916 12 180 12 200 12 200 12 200 20 000 14 477 15 172
Training and development 787 558 914 1 880 1 880 1 880 450 2 095 2 196
Operating payments 1 211 599 4 047 62 62 62 4 000 78 82
Venues and facilities 1 745 713 2 133 1 652 1 652 1 652 4 000 2 910 3 050
Rental and hiring 461 104 761 201 201 201 2 000 931 976
Interest and rent on land – – 637 20 20 20 20 116 122
Interest – – 637 20 20 20 20 116 122
Rent on land – – – – – – – – –
Transfers and subsidies 6 532 436 441 250 250 250 800 582 610
Prov inces and municipalities – – – – – – – – –
Prov inces – – – – – – – – –
Prov incial Rev enue Funds – – – – – – – – –
Prov incial agencies and funds – – – – – – – – –
Municipalities – – – – – – – – –
Municipalities – – – – – – – – –
Municipal agencies and funds – – – – – – – – –
Departmental agencies and accounts – – – – – – – – –
Social security funds – – – – – – – – –
Prov ide list of entities receiv ing transfers – – – – – – – – –
Higher education institutions – – – – – – – – –
Foreign gov ernments and international organisations – – – – – – – – –
Public corporations and priv ate enterprises – – – – – – – – –
Public corporations – – – – – – – – –
Subsidies on production – – – – – – – – –
Other transfers – – – – – – – – –
Priv ate enterprises – – – – – – – – –
Subsidies on production – – – – – – – – –
Other transfers – – – – – – – – –
Non-profit institutions 6 482 – – – – – – – –
Households 50 436 441 250 250 250 800 582 610
Social benefits 50 436 287 250 250 250 800 582 610
Other transfers to households – – 154 – – – – – –
Payments for capital assets 7 417 7 563 7 398 16 408 16 408 16 408 20 000 21 882 22 932
Buildings and other fix ed structures – – – – – – – – –
Buildings – – – – – – – – –
Other fix ed structures – – – – – – – – –
Machinery and equipment 7 417 7 563 7 398 16 408 16 408 16 408 20 000 21 882 22 932
Transport equipment 1 407 544 2 975 4 800 4 800 4 800 10 000 5 587 5 855
Other machinery and equipment 6 010 7 019 4 423 11 608 11 608 11 608 10 000 16 295 17 077
Heritage Assets – – – – – – – – –
Specialised military assets – – – – – – – – –
Biological assets – – – – – – – – –
Land and sub-soil assets – – – – – – – – –
Softw are and other intangible assets – – – – – – – – –
Payments for financial assets – – – – – – – – –
Total economic classification 1 137 969 1 269 229 1 337 461 1 475 402 1 475 402 1 475 402 1 613 750 1 832 651 1 929 799
2019/20

2020/21 Estimates of Provincial Revenue and Expenditure
119
Table B.2: Payments and estimates by economic classification: Health Facility Revitalisation Grant
OutcomeMain
appropriation
Adjusted
appropriation
Revised
estimateMedium-term estimates
R thousand 2016/17 2017/18 2018/19 2020/21 2021/22 2022/23
Current payments 22 795 47 231 70 374 116 875 116 875 116 875 157 385 180 895 173 204
Compensation of employ ees 14 407 14 875 16 168 19 000 19 000 19 000 26 000 26 000 28 000
Salaries and w ages 13 030 13 422 14 648 11 004 11 004 11 004 16 001 17 100 18 673
Social contributions 1 377 1 453 1 520 7 996 7 996 7 996 10 000 8 900 9 327
Goods and serv ices 8 388 32 356 54 206 97 875 97 875 97 875 131 384 153 895 144 204
Administrative fees 50 31 8 – – – – – –
Advertising – – 183 1 000 1 000 1 000 1 000 500 500
Minor assets 1 961 714 1 083 33 100 33 100 33 100 10 500 19 000 20 000
Audit cost: External – – – – – – – – –
Bursaries: Employees – – – – – – – – –
Catering: Departmental activities 108 113 46 200 200 200 1 000 250 250
Communication (G&S) 1 157 29 24 100 100 100 200 411 110
Computer services – – – – – – – – –
Consultants and professional services: Business and advisory services – – – – – – 2 500 – –
Infrastructure and planning – – – – – – – – –
Laboratory services – – – – – – – – –
Scientific and technological services – – – – – – – – –
Legal services – – – – – – – – –
Contractors – 2 050 604 26 500 26 500 26 500 11 200 33 210 31 668
Agency and support / outsourced services – – – – – – – – –
Entertainment – – – – – – – – –
Fleet services (including government motor transport) – – – – – – – – –
Housing – – – – – – – – –
Inventory: Clothing material and accessories – – – 300 300 300 – 500 600
Inventory: Farming supplies – – – – – – – – –
Inventory: Food and food supplies – – – – – – 62 – –
Inventory: Chemicals,fuel,oil,gas,wood and coal – – – – – – – – –
Inventory: Learner and teacher support material – – – – – – – – –
Inventory: Materials and supplies 697 50 294 100 100 100 1 000 500 500
Inventory: Medical supplies 490 – 481 – – – 1 000 1 000 800
Inventory: Medicine – – – – – – – – –
Medsas inventory interface – – – – – – – – –
Inventory: Other supplies – – 133 – – – 1 000 500 500
Consumable supplies 504 365 658 – – – 1 000 4 800 4 500
Consumable: Stationery,printing and office supplies 1 – – 500 500 500 500 – –
Operating leases – – – – – – – – –
Property payments 1 597 27 942 49 419 35 075 35 075 35 075 95 624 91 224 82 876
Transport provided: Departmental activity – – – – – – – – –
Travel and subsistence 1 039 954 1 185 1 000 1 000 1 000 3 000 1 500 1 400
Training and development 688 108 88 – – – 500 500 500
Operating payments 96 – – – – – – – –
Venues and facilities – – – – – – 800 – –
Rental and hiring – – – – – – 500 – –
Interest and rent on land – – – – – – – 1 000 1 000
Interest – – – – – – – – –
Rent on land – – – – – – – 1 000 1 000
Transfers and subsidies – 42 23 – – – – – –
Prov inces and municipalities – – – – – – – – –
Prov inces – – – – – – – – –
Prov incial Rev enue Funds – – – – – – – – –
Prov incial agencies and funds – – – – – – – – –
Municipalities – – – – – – – – –
Municipalities – – – – – – – – –
Municipal agencies and funds – – – – – – – – –
Departmental agencies and accounts – – – – – – – – –
Social security funds – – – – – – – – –
Prov ide list of entities receiv ing transfers – – – – – – – – –
Higher education institutions – – – – – – – – –
Foreign gov ernments and international organisations – – – – – – – – –
Public corporations and priv ate enterprises – – – – – – – – –
Public corporations – – – – – – – – –
Subsidies on production – – – – – – – – –
Other transfers – – – – – – – – –
Priv ate enterprises – – – – – – – – –
Subsidies on production – – – – – – – – –
Other transfers – – – – – – – – –
Non-profit institutions – – – – – – – – –
Households – 42 23 – – – – – –
Social benefits – 42 23 – – – – – –
Other transfers to households – – – – – – – – –
Payments for capital assets 471 158 515 681 509 116 391 674 411 118 411 118 439 774 399 703 440 702
Buildings and other fix ed structures 458 965 513 792 501 918 345 974 365 418 365 418 394 774 361 703 405 702
Buildings 458 965 513 792 501 918 345 974 365 418 365 418 394 774 361 703 405 702
Other fix ed structures – – – – – – – – –
Machinery and equipment 12 193 1 889 7 198 45 700 45 700 45 700 45 000 38 000 35 000
Transport equipment – – – – – – – – –
Other machinery and equipment 12 193 1 889 7 198 45 700 45 700 45 700 45 000 38 000 35 000
Heritage Assets – – – – – – – – –
Specialised military assets – – – – – – – – –
Biological assets – – – – – – – – –
Land and sub-soil assets – – – – – – – – –
Softw are and other intangible assets – – – – – – – – –
Payments for financial assets – – – – – – – – –
Total economic classification 493 953 562 954 579 513 508 549 527 993 527 993 597 158 580 598 613 906
2019/20

Department of Health
120
Table B.2: Payments and estimates by economic classification: Health Professions Training And Development Component
OutcomeMain
appropriation
Adjusted
appropriation
Revised
estimateMedium-term estimates
R thousand 2016/17 2017/18 2018/19 2020/21 2021/22 2022/23
Current payments 111 346 118 384 125 334 131 567 131 567 131 567 140 769 147 161 152 605
Compensation of employ ees 94 723 107 349 110 088 112 123 112 123 112 123 121 872 124 797 130 788
Salaries and w ages 90 870 104 838 104 685 109 826 109 826 109 826 119 449 122 240 128 108
Social contributions 3 853 2 511 5 403 2 297 2 297 2 297 2 423 2 557 2 680
Goods and serv ices 16 623 11 035 15 246 19 444 19 444 19 444 18 897 22 364 21 817
Administrative fees – – – – – – – – –
Advertising – – – – – – – – –
Minor assets – 50 5 75 75 75 77 84 88
Audit cost: External – – – – – – – – –
Bursaries: Employees – – – – – – – – –
Catering: Departmental activities – – – – – – – – –
Communication (G&S) 137 315 404 317 317 317 342 352 368
Computer services – – – – – – – – –
Consultants and professional services: Business and advisory services – – – – – – – – –
Infrastructure and planning – – – – – – – – –
Laboratory services 2 086 2 221 2 279 3 200 3 200 3 200 3 250 3 562 3 733
Scientific and technological services – – – – – – – – –
Legal services – – – – – – – – –
Contractors – – – – – – – – –
Agency and support / outsourced services 355 800 495 549 549 549 500 611 640
Entertainment – – – – – – – – –
Fleet services (including government motor transport) – – – – – – – – –
Housing – – – – – – – – –
Inventory: Clothing material and accessories – – – – – – – – –
Inventory: Farming supplies – – – – – – – – –
Inventory: Food and food supplies – – – – – – – – –
Inventory: Chemicals,fuel,oil,gas,wood and coal – – – – – – – – –
Inventory: Learner and teacher support material – – – – – – – – –
Inventory: Materials and supplies – – – – – – – – –
Inventory: Medical supplies 5 332 4 370 4 471 5 822 5 822 5 822 6 684 7 202 5 928
Inventory: Medicine – – – – – – – – –
Medsas inventory interface – – – – – – – – –
Inventory: Other supplies – – – – – – – – –
Consumable supplies – 140 148 – – – 200 – –
Consumable: Stationery,printing and office supplies – 100 169 112 112 112 0 125 131
Operating leases 5 764 2 100 6 564 8 397 8 397 8 397 6 932 9 346 9 795
Property payments – – – – – – – – –
Transport provided: Departmental activity – – – – – – – – –
Travel and subsistence 2 949 939 677 972 972 972 913 1 082 1 134
Training and development – – – – – – – – –
Operating payments – – 34 – – – – – –
Venues and facilities – – – – – – – – –
Rental and hiring – – – – – – – – –
Interest and rent on land – – – – – – – – –
Interest – – – – – – – – –
Rent on land – – – – – – – – –
Transfers and subsidies 39 343 38 362 362 362 148 403 422
Prov inces and municipalities – – – – – – – – –
Prov inces – – – – – – – – –
Prov incial Rev enue Funds – – – – – – – – –
Prov incial agencies and funds – – – – – – – – –
Municipalities – – – – – – – – –
Municipalities – – – – – – – – –
Municipal agencies and funds – – – – – – – – –
Departmental agencies and accounts – – – – – – – – –
Social security funds – – – – – – – – –
Prov ide list of entities receiv ing transfers – – – – – – – – –
Higher education institutions – – – – – – – – –
Foreign gov ernments and international organisations – – – – – – – – –
Public corporations and priv ate enterprises – – – – – – – – –
Public corporations – – – – – – – – –
Subsidies on production – – – – – – – – –
Other transfers – – – – – – – – –
Priv ate enterprises – – – – – – – – –
Subsidies on production – – – – – – – – –
Other transfers – – – – – – – – –
Non-profit institutions – – – – – – – – –
Households 39 343 38 362 362 362 148 403 422
Social benefits 39 343 38 362 362 362 148 403 422
Other transfers to households – – – – – – – – –
Payments for capital assets 180 467 735 523 523 523 946 582 610
Buildings and other fix ed structures – – – – – – – – –
Buildings – – – – – – – – –
Other fix ed structures – – – – – – – – –
Machinery and equipment 180 467 735 523 523 523 946 582 610
Transport equipment – – – – – – – – –
Other machinery and equipment 180 467 735 523 523 523 946 582 610
Heritage Assets – – – – – – – – –
Specialised military assets – – – – – – – – –
Biological assets – – – – – – – – –
Land and sub-soil assets – – – – – – – – –
Softw are and other intangible assets – – – – – – – – –
Payments for financial assets – – – – – – – – –
Total economic classification 111 565 119 194 126 107 132 452 132 452 132 452 141 863 148 146 153 637
2019/20
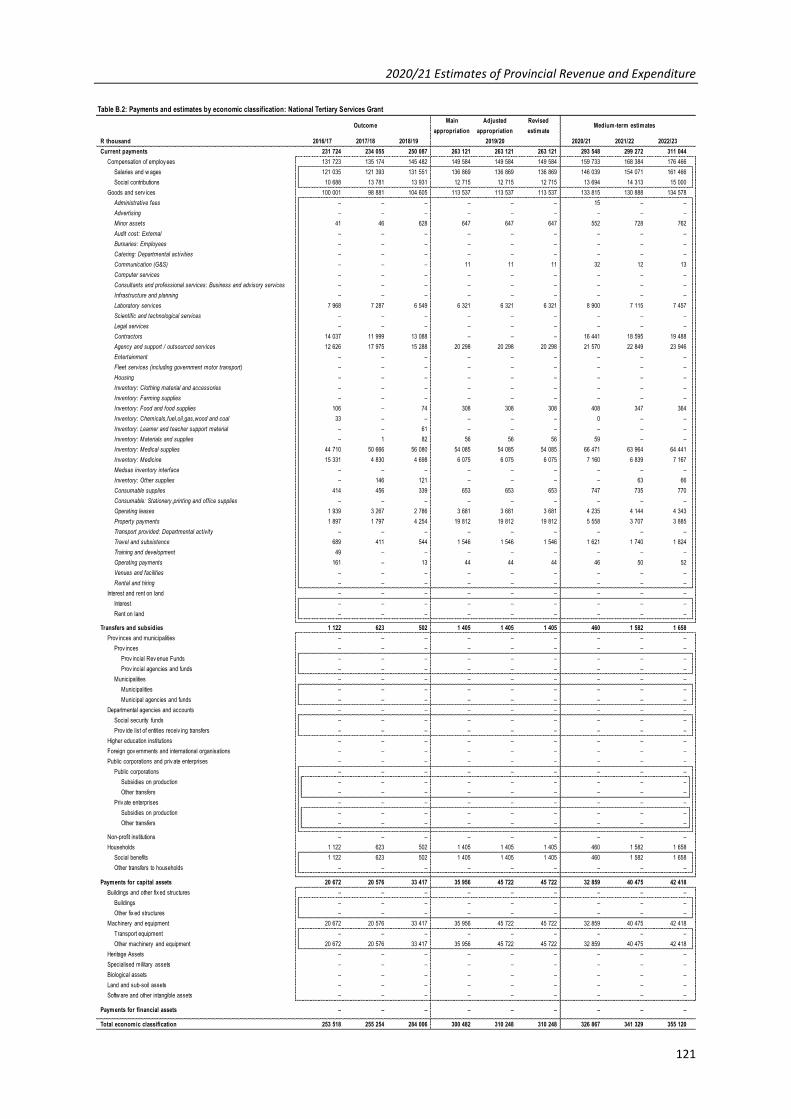
2020/21 Estimates of Provincial Revenue and Expenditure
121
Table B.2: Payments and estimates by economic classification: National Tertiary Services Grant
OutcomeMain
appropriation
Adjusted
appropriation
Revised
estimateMedium-term estimates
R thousand 2016/17 2017/18 2018/19 2020/21 2021/22 2022/23
Current payments 231 724 234 055 250 087 263 121 263 121 263 121 293 548 299 272 311 044
Compensation of employ ees 131 723 135 174 145 482 149 584 149 584 149 584 159 733 168 384 176 466
Salaries and w ages 121 035 121 393 131 551 136 869 136 869 136 869 146 039 154 071 161 466
Social contributions 10 688 13 781 13 931 12 715 12 715 12 715 13 694 14 313 15 000
Goods and serv ices 100 001 98 881 104 605 113 537 113 537 113 537 133 815 130 888 134 578
Administrative fees – – – – – – 15 – –
Advertising – – – – – – – – –
Minor assets 41 46 628 647 647 647 552 728 762
Audit cost: External – – – – – – – – –
Bursaries: Employees – – – – – – – – –
Catering: Departmental activities – – – – – – – – –
Communication (G&S) – – – 11 11 11 32 12 13
Computer services – – – – – – – – –
Consultants and professional services: Business and advisory services – – – – – – – – –
Infrastructure and planning – – – – – – – – –
Laboratory services 7 968 7 287 6 549 6 321 6 321 6 321 8 900 7 115 7 457
Scientific and technological services – – – – – – – – –
Legal services – – – – – – – – –
Contractors 14 037 11 999 13 088 – – – 16 441 18 595 19 488
Agency and support / outsourced services 12 626 17 975 15 288 20 298 20 298 20 298 21 570 22 849 23 946
Entertainment – – – – – – – – –
Fleet services (including government motor transport) – – – – – – – – –
Housing – – – – – – – – –
Inventory: Clothing material and accessories – – – – – – – – –
Inventory: Farming supplies – – – – – – – – –
Inventory: Food and food supplies 106 – 74 308 308 308 408 347 364
Inventory: Chemicals,fuel,oil,gas,wood and coal 33 – – – – – 0 – –
Inventory: Learner and teacher support material – – 61 – – – – – –
Inventory: Materials and supplies – 1 82 56 56 56 59 – –
Inventory: Medical supplies 44 710 50 666 56 080 54 085 54 085 54 085 66 471 63 964 64 441
Inventory: Medicine 15 331 4 830 4 698 6 075 6 075 6 075 7 160 6 839 7 167
Medsas inventory interface – – – – – – – – –
Inventory: Other supplies – 146 121 – – – – 63 66
Consumable supplies 414 456 339 653 653 653 747 735 770
Consumable: Stationery,printing and office supplies – – – – – – – – –
Operating leases 1 939 3 267 2 786 3 681 3 681 3 681 4 235 4 144 4 343
Property payments 1 897 1 797 4 254 19 812 19 812 19 812 5 558 3 707 3 885
Transport provided: Departmental activity – – – – – – – – –
Travel and subsistence 689 411 544 1 546 1 546 1 546 1 621 1 740 1 824
Training and development 49 – – – – – – – –
Operating payments 161 – 13 44 44 44 46 50 52
Venues and facilities – – – – – – – – –
Rental and hiring – – – – – – – – –
Interest and rent on land – – – – – – – – –
Interest – – – – – – – – –
Rent on land – – – – – – – – –
Transfers and subsidies 1 122 623 502 1 405 1 405 1 405 460 1 582 1 658
Prov inces and municipalities – – – – – – – – –
Prov inces – – – – – – – – –
Prov incial Rev enue Funds – – – – – – – – –
Prov incial agencies and funds – – – – – – – – –
Municipalities – – – – – – – – –
Municipalities – – – – – – – – –
Municipal agencies and funds – – – – – – – – –
Departmental agencies and accounts – – – – – – – – –
Social security funds – – – – – – – – –
Prov ide list of entities receiv ing transfers – – – – – – – – –
Higher education institutions – – – – – – – – –
Foreign gov ernments and international organisations – – – – – – – – –
Public corporations and priv ate enterprises – – – – – – – – –
Public corporations – – – – – – – – –
Subsidies on production – – – – – – – – –
Other transfers – – – – – – – – –
Priv ate enterprises – – – – – – – – –
Subsidies on production – – – – – – – – –
Other transfers – – – – – – – – –
Non-profit institutions – – – – – – – – –
Households 1 122 623 502 1 405 1 405 1 405 460 1 582 1 658
Social benefits 1 122 623 502 1 405 1 405 1 405 460 1 582 1 658
Other transfers to households – – – – – – – – –
Payments for capital assets 20 672 20 576 33 417 35 956 45 722 45 722 32 859 40 475 42 418
Buildings and other fix ed structures – – – – – – – – –
Buildings – – – – – – – – –
Other fix ed structures – – – – – – – – –
Machinery and equipment 20 672 20 576 33 417 35 956 45 722 45 722 32 859 40 475 42 418
Transport equipment – – – – – – – – –
Other machinery and equipment 20 672 20 576 33 417 35 956 45 722 45 722 32 859 40 475 42 418
Heritage Assets – – – – – – – – –
Specialised military assets – – – – – – – – –
Biological assets – – – – – – – – –
Land and sub-soil assets – – – – – – – – –
Softw are and other intangible assets – – – – – – – – –
Payments for financial assets – – – – – – – – –
Total economic classification 253 518 255 254 284 006 300 482 310 248 310 248 326 867 341 329 355 120
2019/20

Department of Health
122
Table B.2: Payments and estimates by economic classification: National Health Insurance Grant
OutcomeMain
appropriation
Adjusted
appropriation
Revised
estimateMedium-term estimates
R thousand 2016/17 2017/18 2018/19 2020/21 2021/22 2022/23
Current payments 7 128 – – – 21 224 21 224 21 191 22 017 22 828
Compensation of employ ees 665 – – – 21 224 21 224 21 191 22 017 22 828
Salaries and w ages 566 – – – 21 224 21 224 15 191 15 017 15 738
Social contributions 99 – – – – – 6 000 7 000 7 090
Goods and serv ices 6 463 – – – – – – – –
Administrative fees – – – – – – – – –
Advertising – – – – – – – – –
Minor assets 1 853 – – – – – – – –
Audit cost: External – – – – – – – – –
Bursaries: Employees – – – – – – – – –
Catering: Departmental activities 189 – – – – – – – –
Communication (G&S) 8 – – – – – – – –
Computer services – – – – – – – – –
Consultants and professional services: Business and advisory services 1 674 – – – – – – – –
Infrastructure and planning – – – – – – – – –
Laboratory services – – – – – – – – –
Scientific and technological services – – – – – – – – –
Legal services – – – – – – – – –
Contractors – – – – – – – – –
Agency and support / outsourced services – – – – – – – – –
Entertainment – – – – – – – – –
Fleet services (including government motor transport) – – – – – – – – –
Housing – – – – – – – – –
Inventory: Clothing material and accessories 704 – – – – – – – –
Inventory: Farming supplies – – – – – – – – –
Inventory: Food and food supplies – – – – – – – – –
Inventory: Chemicals,fuel,oil,gas,wood and coal – – – – – – – – –
Inventory: Learner and teacher support material – – – – – – – – –
Inventory: Materials and supplies 181 – – – – – – – –
Inventory: Medical supplies 265 – – – – – – – –
Inventory: Medicine – – – – – – – – –
Medsas inventory interface – – – – – – – – –
Inventory: Other supplies – – – – – – – – –
Consumable supplies 1 111 – – – – – – – –
Consumable: Stationery,printing and office supplies 117 – – – – – – – –
Operating leases – – – – – – – – –
Property payments 151 – – – – – – – –
Transport provided: Departmental activity – – – – – – – – –
Travel and subsistence 110 – – – – – – – –
Training and development – – – – – – – – –
Operating payments 100 – – – – – – – –
Venues and facilities – – – – – – – – –
Rental and hiring – – – – – – – – –
Interest and rent on land – – – – – – – – –
Interest – – – – – – – – –
Rent on land – – – – – – – – –
Transfers and subsidies – – – – – – – – –
Prov inces and municipalities – – – – – – – – –
Prov inces – – – – – – – – –
Prov incial Rev enue Funds – – – – – – – – –
Prov incial agencies and funds – – – – – – – – –
Municipalities – – – – – – – – –
Municipalities – – – – – – – – –
Municipal agencies and funds – – – – – – – – –
Departmental agencies and accounts – – – – – – – – –
Social security funds – – – – – – – – –
Prov ide list of entities receiv ing transfers – – – – – – – – –
Higher education institutions – – – – – – – – –
Foreign gov ernments and international organisations – – – – – – – – –
Public corporations and priv ate enterprises – – – – – – – – –
Public corporations – – – – – – – – –
Subsidies on production – – – – – – – – –
Other transfers – – – – – – – – –
Priv ate enterprises – – – – – – – – –
Subsidies on production – – – – – – – – –
Other transfers – – – – – – – – –
Non-profit institutions – – – – – – – – –
Households – – – – – – – – –
Social benefits – – – – – – – – –
Other transfers to households – – – – – – – – –
Payments for capital assets 961 – – – – – – – –
Buildings and other fix ed structures – – – – – – – – –
Buildings – – – – – – – – –
Other fix ed structures – – – – – – – – –
Machinery and equipment 961 – – – – – – – –
Transport equipment – – – – – – – – –
Other machinery and equipment 961 – – – – – – – –
Heritage Assets – – – – – – – – –
Specialised military assets – – – – – – – – –
Biological assets – – – – – – – – –
Land and sub-soil assets – – – – – – – – –
Softw are and other intangible assets – – – – – – – – –
Payments for financial assets – – – – – – – – –
Total economic classification 8 089 – – – 21 224 21 224 21 191 22 017 22 828
2019/20

2020/21 Estimates of Provincial Revenue and Expenditure
123
Table B.2: Payments and estimates by economic classification: Expanded Public Works Programme Incentive Grant For Provinces
OutcomeMain
appropriation
Adjusted
appropriation
Revised
estimateMedium-term estimates
R thousand 2016/17 2017/18 2018/19 2020/21 2021/22 2022/23
Current payments 2 000 571 1 654 2 000 2 000 2 000 – – –
Compensation of employ ees 2 000 571 1 654 1 800 1 800 1 800 – – –
Salaries and w ages 1 998 571 1 659 1 300 1 300 1 300 – – –
Social contributions 2 – -5 500 500 500 – – –
Goods and serv ices – – – 200 200 200 – – –
Administrative fees – – – – – – – – –
Advertising – – – – – – – – –
Minor assets – – – – – – – – –
Audit cost: External – – – – – – – – –
Bursaries: Employees – – – – – – – – –
Catering: Departmental activities – – – – – – – – –
Communication (G&S) – – – – – – – – –
Computer services – – – – – – – – –
Consultants and professional services: Business and advisory services – – – – – – – – –
Infrastructure and planning – – – – – – – – –
Laboratory services – – – – – – – – –
Scientific and technological services – – – – – – – – –
Legal services – – – – – – – – –
Contractors – – – – – – – – –
Agency and support / outsourced services – – – – – – – – –
Entertainment – – – – – – – – –
Fleet services (including government motor transport) – – – – – – – – –
Housing – – – – – – – – –
Inventory: Clothing material and accessories – – – 200 200 200 – – –
Inventory: Farming supplies – – – – – – – – –
Inventory: Food and food supplies – – – – – – – – –
Inventory: Chemicals,fuel,oil,gas,wood and coal – – – – – – – – –
Inventory: Learner and teacher support material – – – – – – – – –
Inventory: Materials and supplies – – – – – – – – –
Inventory: Medical supplies – – – – – – – – –
Inventory: Medicine – – – – – – – – –
Medsas inventory interface – – – – – – – – –
Inventory: Other supplies – – – – – – – – –
Consumable supplies – – – – – – – – –
Consumable: Stationery,printing and office supplies – – – – – – – – –
Operating leases – – – – – – – – –
Property payments – – – – – – – – –
Transport provided: Departmental activity – – – – – – – – –
Travel and subsistence – – – – – – – – –
Training and development – – – – – – – – –
Operating payments – – – – – – – – –
Venues and facilities – – – – – – – – –
Rental and hiring – – – – – – – – –
Interest and rent on land – – – – – – – – –
Interest – – – – – – – – –
Rent on land – – – – – – – – –
Transfers and subsidies – – – – – – – – –
Prov inces and municipalities – – – – – – – – –
Prov inces – – – – – – – – –
Prov incial Rev enue Funds – – – – – – – – –
Prov incial agencies and funds – – – – – – – – –
Municipalities – – – – – – – – –
Municipalities – – – – – – – – –
Municipal agencies and funds – – – – – – – – –
Departmental agencies and accounts – – – – – – – – –
Social security funds – – – – – – – – –
Prov ide list of entities receiv ing transfers – – – – – – – – –
Higher education institutions – – – – – – – – –
Foreign gov ernments and international organisations – – – – – – – – –
Public corporations and priv ate enterprises – – – – – – – – –
Public corporations – – – – – – – – –
Subsidies on production – – – – – – – – –
Other transfers – – – – – – – – –
Priv ate enterprises – – – – – – – – –
Subsidies on production – – – – – – – – –
Other transfers – – – – – – – – –
Non-profit institutions – – – – – – – – –
Households – – – – – – – – –
Social benefits – – – – – – – – –
Other transfers to households – – – – – – – – –
Payments for capital assets – – – – – – – – –
Buildings and other fix ed structures – – – – – – – – –
Buildings – – – – – – – – –
Other fix ed structures – – – – – – – – –
Machinery and equipment – – – – – – – – –
Transport equipment – – – – – – – – –
Other machinery and equipment – – – – – – – – –
Heritage Assets – – – – – – – – –
Specialised military assets – – – – – – – – –
Biological assets – – – – – – – – –
Land and sub-soil assets – – – – – – – – –
Softw are and other intangible assets – – – – – – – – –
Payments for financial assets – – – – – – – – –
Total economic classification 2 000 571 1 654 2 000 2 000 2 000 – – –
2019/20

Department of Health
124
Table B.2: Payments and estimates by economic classification: Social Sector Expanded Public Works Programme Incentive Grant For Provinces
OutcomeMain
appropriation
Adjusted
appropriation
Revised
estimateMedium-term estimates
R thousand 2016/17 2017/18 2018/19 2020/21 2021/22 2022/23
Current payments 12 542 21 882 22 841 15 862 15 862 15 862 12 772 – –
Compensation of employ ees 12 542 21 882 22 687 15 862 15 862 15 862 12 772 – –
Salaries and w ages 12 541 21 878 22 463 15 362 15 362 15 362 12 772 – –
Social contributions 1 4 224 500 500 500 – – –
Goods and serv ices – – 154 – – – – – –
Administrative fees – – – – – – – – –
Advertising – – – – – – – – –
Minor assets – – – – – – – – –
Audit cost: External – – – – – – – – –
Bursaries: Employees – – – – – – – – –
Catering: Departmental activities – – – – – – – – –
Communication (G&S) – – 154 – – – – – –
Computer services – – – – – – – – –
Consultants and professional services: Business and advisory services – – – – – – – – –
Infrastructure and planning – – – – – – – – –
Laboratory services – – – – – – – – –
Scientific and technological services – – – – – – – – –
Legal services – – – – – – – – –
Contractors – – – – – – – – –
Agency and support / outsourced services – – – – – – – – –
Entertainment – – – – – – – – –
Fleet services (including government motor transport) – – – – – – – – –
Housing – – – – – – – – –
Inventory: Clothing material and accessories – – – – – – – – –
Inventory: Farming supplies – – – – – – – – –
Inventory: Food and food supplies – – – – – – – – –
Inventory: Chemicals,fuel,oil,gas,wood and coal – – – – – – – – –
Inventory: Learner and teacher support material – – – – – – – – –
Inventory: Materials and supplies – – – – – – – – –
Inventory: Medical supplies – – – – – – – – –
Inventory: Medicine – – – – – – – – –
Medsas inventory interface – – – – – – – – –
Inventory: Other supplies – – – – – – – – –
Consumable supplies – – – – – – – – –
Consumable: Stationery,printing and office supplies – – – – – – – – –
Operating leases – – – – – – – – –
Property payments – – – – – – – – –
Transport provided: Departmental activity – – – – – – – – –
Travel and subsistence – – – – – – – – –
Training and development – – – – – – – – –
Operating payments – – – – – – – – –
Venues and facilities – – – – – – – – –
Rental and hiring – – – – – – – – –
Interest and rent on land – – – – – – – – –
Interest – – – – – – – – –
Rent on land – – – – – – – – –
Transfers and subsidies – – – – – – – – –
Prov inces and municipalities – – – – – – – – –
Prov inces – – – – – – – – –
Prov incial Rev enue Funds – – – – – – – – –
Prov incial agencies and funds – – – – – – – – –
Municipalities – – – – – – – – –
Municipalities – – – – – – – – –
Municipal agencies and funds – – – – – – – – –
Departmental agencies and accounts – – – – – – – – –
Social security funds – – – – – – – – –
Prov ide list of entities receiv ing transfers – – – – – – – – –
Higher education institutions – – – – – – – – –
Foreign gov ernments and international organisations – – – – – – – – –
Public corporations and priv ate enterprises – – – – – – – – –
Public corporations – – – – – – – – –
Subsidies on production – – – – – – – – –
Other transfers – – – – – – – – –
Priv ate enterprises – – – – – – – – –
Subsidies on production – – – – – – – – –
Other transfers – – – – – – – – –
Non-profit institutions – – – – – – – – –
Households – – – – – – – – –
Social benefits – – – – – – – – –
Other transfers to households – – – – – – – – –
Payments for capital assets – – – – – – – – –
Buildings and other fix ed structures – – – – – – – – –
Buildings – – – – – – – – –
Other fix ed structures – – – – – – – – –
Machinery and equipment – – – – – – – – –
Transport equipment – – – – – – – – –
Other machinery and equipment – – – – – – – – –
Heritage Assets – – – – – – – – –
Specialised military assets – – – – – – – – –
Biological assets – – – – – – – – –
Land and sub-soil assets – – – – – – – – –
Softw are and other intangible assets – – – – – – – – –
Payments for financial assets – – – – – – – – –
Total economic classification 12 542 21 882 22 841 15 862 15 862 15 862 12 772 – –
2019/20

2020/21 Estimates of Provincial Revenue and Expenditure
125
Table B.2: Payments and estimates by economic classification: Human Papillomavirus Vaccine Component
OutcomeMain
appropriation
Adjusted
appropriation
Revised
estimateMedium-term estimates
R thousand 2016/17 2017/18 2018/19 2020/21 2021/22 2022/23
Current payments – – 13 264 13 807 10 226 10 226 14 577 15 274 15 838
Compensation of employ ees – – 3 352 3 400 3 400 3 400 3 400 3 946 4 135
Salaries and w ages – – 3 352 3 400 3 400 3 400 3 400 3 946 4 135
Social contributions – – – – – – – – –
Goods and serv ices – – 9 912 10 407 6 826 6 826 11 177 11 328 11 703
Administrative fees – – – – – – – – –
Advertising – – – – – – – – –
Minor assets – – – 100 100 100 100 270 283
Audit cost: External – – – – – – – – –
Bursaries: Employees – – – – – – – – –
Catering: Departmental activities – – 20 150 150 150 150 166 174
Communication (G&S) – – – – – – – – –
Computer services – – – – – – – – –
Consultants and professional services: Business and advisory services – – – – – – – – –
Infrastructure and planning – – – – – – – – –
Laboratory services – – – – – – – – –
Scientific and technological services – – – – – – – – –
Legal services – – – – – – – – –
Contractors – – – – – – – – –
Agency and support / outsourced services – – – – – – – – –
Entertainment – – – – – – – – –
Fleet services (including government motor transport) – – – – – – – – –
Housing – – – – – – – – –
Inventory: Clothing material and accessories – – – – – – – – –
Inventory: Farming supplies – – – – – – – – –
Inventory: Food and food supplies – – – – – – – – –
Inventory: Chemicals,fuel,oil,gas,wood and coal – – – – – – – – –
Inventory: Learner and teacher support material – – – – – – – – –
Inventory: Materials and supplies – – 89 – – – – – –
Inventory: Medical supplies – – – 564 564 564 564 625 655
Inventory: Medicine – – 8 710 7 743 4 162 4 162 6 513 8 986 9 248
Medsas inventory interface – – – – – – – – –
Inventory: Other supplies – – – – – – – – –
Consumable supplies – – – – – – – – –
Consumable: Stationery,printing and office supplies – – – – – – – – –
Operating leases – – – – – – – – –
Property payments – – – – – – – – –
Transport provided: Departmental activity – – – – – – – – –
Travel and subsistence – – 1 074 1 700 1 700 1 700 3 700 1 115 1 169
Training and development – – – – – – – – –
Operating payments – – – – – – – – –
Venues and facilities – – 19 150 150 150 150 166 174
Rental and hiring – – – – – – – – –
Interest and rent on land – – – – – – – – –
Interest – – – – – – – – –
Rent on land – – – – – – – – –
Transfers and subsidies – – – – – – – – –
Prov inces and municipalities – – – – – – – – –
Prov inces – – – – – – – – –
Prov incial Rev enue Funds – – – – – – – – –
Prov incial agencies and funds – – – – – – – – –
Municipalities – – – – – – – – –
Municipalities – – – – – – – – –
Municipal agencies and funds – – – – – – – – –
Departmental agencies and accounts – – – – – – – – –
Social security funds – – – – – – – – –
Prov ide list of entities receiv ing transfers – – – – – – – – –
Higher education institutions – – – – – – – – –
Foreign gov ernments and international organisations – – – – – – – – –
Public corporations and priv ate enterprises – – – – – – – – –
Public corporations – – – – – – – – –
Subsidies on production – – – – – – – – –
Other transfers – – – – – – – – –
Priv ate enterprises – – – – – – – – –
Subsidies on production – – – – – – – – –
Other transfers – – – – – – – – –
Non-profit institutions – – – – – – – – –
Households – – – – – – – – –
Social benefits – – – – – – – – –
Other transfers to households – – – – – – – – –
Payments for capital assets – – – 200 200 200 200 316 331
Buildings and other fix ed structures – – – – – – – – –
Buildings – – – – – – – – –
Other fix ed structures – – – – – – – – –
Machinery and equipment – – – 200 200 200 200 316 331
Transport equipment – – – – – – – – –
Other machinery and equipment – – – 200 200 200 200 316 331
Heritage Assets – – – – – – – – –
Specialised military assets – – – – – – – – –
Biological assets – – – – – – – – –
Land and sub-soil assets – – – – – – – – –
Softw are and other intangible assets – – – – – – – – –
Payments for financial assets – – – – – – – – –
Total economic classification – – 13 264 14 007 10 426 10 426 14 777 15 590 16 169
2019/20

Department of Health
126
Table B.2: Payments and estimates by economic classification: Statutory Human Resources Component
OutcomeMain
appropriation
Adjusted
appropriation
Revised
estimateMedium-term estimates
R thousand 2016/17 2017/18 2018/19 2020/21 2021/22 2022/23
Current payments – – – 29 994 35 184 35 184 50 860 52 839 54 787
Compensation of employ ees – – – 17 946 23 136 23 136 49 949 51 253 53 513
Salaries and w ages – – – 15 446 20 636 20 636 40 731 41 125 42 899
Social contributions – – – 2 500 2 500 2 500 9 218 10 128 10 614
Goods and serv ices – – – 12 048 12 048 12 048 911 1 586 1 274
Administrative fees – – – – – – – – –
Advertising – – – – – – – – –
Minor assets – – – – – – – – –
Audit cost: External – – – – – – – – –
Bursaries: Employees – – – – – – – – –
Catering: Departmental activities – – – – – – – – –
Communication (G&S) – – – 500 500 500 250 250 500
Computer services – – – – – – – – –
Consultants and professional services: Business and advisory services – – – – – – – – –
Infrastructure and planning – – – – – – – – –
Laboratory services – – – – – – – – –
Scientific and technological services – – – – – – – – –
Legal services – – – – – – – – –
Contractors – – – – – – – – –
Agency and support / outsourced services – – – – – – – – –
Entertainment – – – – – – – – –
Fleet services (including government motor transport) – – – – – – – – –
Housing – – – – – – – – –
Inventory: Clothing material and accessories – – – 1 000 1 000 1 000 500 500 524
Inventory: Farming supplies – – – – – – – – –
Inventory: Food and food supplies – – – – – – – – –
Inventory: Chemicals,fuel,oil,gas,wood and coal – – – – – – – – –
Inventory: Learner and teacher support material – – – – – – – – –
Inventory: Materials and supplies – – – – – – – – –
Inventory: Medical supplies – – – – – – – – –
Inventory: Medicine – – – – – – – – –
Medsas inventory interface – – – – – – – – –
Inventory: Other supplies – – – – – – – – –
Consumable supplies – – – – – – – – –
Consumable: Stationery,printing and office supplies – – – – – – – – –
Operating leases – – – – – – – – –
Property payments – – – – – – – – –
Transport provided: Departmental activity – – – – – – – – –
Travel and subsistence – – – 10 548 10 548 10 548 161 836 250
Training and development – – – – – – – – –
Operating payments – – – – – – – – –
Venues and facilities – – – – – – – – –
Rental and hiring – – – – – – – – –
Interest and rent on land – – – – – – – – –
Interest – – – – – – – – –
Rent on land – – – – – – – – –
Transfers and subsidies – – – – – – – – –
Prov inces and municipalities – – – – – – – – –
Prov inces – – – – – – – – –
Prov incial Rev enue Funds – – – – – – – – –
Prov incial agencies and funds – – – – – – – – –
Municipalities – – – – – – – – –
Municipalities – – – – – – – – –
Municipal agencies and funds – – – – – – – – –
Departmental agencies and accounts – – – – – – – – –
Social security funds – – – – – – – – –
Prov ide list of entities receiv ing transfers – – – – – – – – –
Higher education institutions – – – – – – – – –
Foreign gov ernments and international organisations – – – – – – – – –
Public corporations and priv ate enterprises – – – – – – – – –
Public corporations – – – – – – – – –
Subsidies on production – – – – – – – – –
Other transfers – – – – – – – – –
Priv ate enterprises – – – – – – – – –
Subsidies on production – – – – – – – – –
Other transfers – – – – – – – – –
Non-profit institutions – – – – – – – – –
Households – – – – – – – – –
Social benefits – – – – – – – – –
Other transfers to households – – – – – – – – –
Payments for capital assets – – – – – – – – –
Buildings and other fix ed structures – – – – – – – – –
Buildings – – – – – – – – –
Other fix ed structures – – – – – – – – –
Machinery and equipment – – – – – – – – –
Transport equipment – – – – – – – – –
Other machinery and equipment – – – – – – – – –
Heritage Assets – – – – – – – – –
Specialised military assets – – – – – – – – –
Biological assets – – – – – – – – –
Land and sub-soil assets – – – – – – – – –
Softw are and other intangible assets – – – – – – – – –
Payments for financial assets – – – – – – – – –
Total economic classification – – – 29 994 35 184 35 184 50 860 52 839 54 787
2019/20

2020/21 Estimates of Provincial Revenue and Expenditure
127
Tabl
e B.
5: H
ealth
- Pa
ymen
ts o
f inf
rast
ruct
ure
by c
ateg
ory
Date
: Sta
rtDa
te: F
inis
h M
TEF
2021
/22
MTE
F
2022
/23
1. N
ew in
frast
ruct
ure
asse
ts
NWDo
H/PS
/53/
19Br
its N
ew S
taff A
ccom
odati
on IC
T Co
nnec
tion
3. D
esign
Dev
elopm
ent
Mad
ibeng
(NW
372)
Build
ings
and
other
fixed
stru
cture
sHo
spita
l16
Oct
2019
31 J
ul 20
20HF
RGNo
t par
t of a
pro
gram
me
NWDo
H
2
000
-
2 00
0
-
-
NWDo
H/PS
/12/
18M
athibe
stadt
CHC
Com
pletio
n of
Proje
ct4.
Des
ign D
ocum
entat
ionBu
ilding
s an
d oth
er fix
ed s
tructu
res
25 S
ep 2
018
31 O
ct 20
21NW
DoH
83
000
2 00
0
3
724
23
909
1
0 00
0
NWDo
H/PS
/018
/11-
HTM
athibe
stadt
CHC
HT5.
Wor
ks M
achin
ery
and
Equip
men
t1
Apr 2
016
31 J
ul 20
20NW
DoH
11
500
8 31
3
2
000
500
-
NWDo
H/PS
/54/
19M
adikw
e Cl
inic
Purifi
catio
n Pl
ant
1. In
itiatio
nM
oses
Kot
ane
(NW
375)
Build
ings
and
other
fixed
stru
cture
sCl
inic
16 O
ct 20
1931
Jul
2020
HFRG
Not p
art o
f a p
rogr
amm
eNW
DoH
2
800
110
2 1
00
-
-
DPW
167
Mm
akau
nyan
e Cl
inic
5. W
orks
Build
ings
and
other
fixed
stru
cture
sHF
RGNo
t par
t of a
pro
gram
me
NWDo
H32
000
17
749
4
000
-
-
DPW
167-
HTM
mak
auny
ane
Clini
c HT
5. W
orks
Mac
hiner
y an
d Eq
uipm
ent
HFRG
Not p
art o
f a p
rogr
amm
eNW
DoH
2 50
0
-
2
500
-
-
NWDo
H/01
5/12
Klipg
at CH
C - A
BM
2. C
once
ptM
adib
eng
(NW
372)
Build
ings
and
other
fixed
stru
cture
sCo
mm
unity
Hea
lth C
entre
01 N
ov 2
016
31 M
ay 2
025
HFRG
Not p
art o
f a p
rogr
amm
eNW
DoH
173
000
-
-
500
5
000
NWDo
H/PS
/51/
19Le
botlo
ane
CHC
- ABM
1. In
itiatio
nBu
ilding
s an
d oth
er fix
ed s
tructu
res
22 J
ul 20
1931
Oct
2022
NWDo
H
16
5 00
0
-
3 0
00
9 00
0
12
000
NWDo
H/PS
/51/
19 H
TLe
botlo
ane
CHC
HT1.
Initia
tion
Mac
hiner
y an
d Eq
uipm
ent
22 J
ul 20
1931
Oct
2022
NWDo
H
1
5 00
0
-
-
-
8 0
00
NWDo
H/PS
/08/
15M
orule
ng C
linic
4. D
esign
Doc
umen
tation
Mos
es K
otan
e (N
W37
5)Bu
ilding
s an
d oth
er fix
ed s
tructu
res
Clnic
1 Ju
l 201
831
Oct
2024
HFRG
Not p
art o
f a p
rogr
amm
eNW
DoH
44
800
-
-
-
2
500
NWDo
H/PS
/43/
19Su
nrise
Par
k Cl
inic
3. D
esign
Dev
elopm
ent
Ruste
nbur
g (N
W37
3)Bu
ilding
s an
d oth
er fix
ed s
tructu
res
Clini
c10
Feb
201
931
Jan
202
3HF
RGNo
t par
t of a
pro
gram
me
NWDo
H
3
6 00
0
-
3 9
03
2
6 27
3
5
824
NWDo
H/PS
/43/
19-H
TSu
nrise
Par
k Cl
inic-
HT3.
Des
ign D
evelo
pmen
tRu
stenb
urg
(NW
373)
Mac
hiner
y an
d Eq
uipm
ent
Clini
c10
Feb
201
931
Jan
202
3HF
RGNo
t par
t of a
pro
gram
me
NWDo
H
2 5
00
-
-
2
500
-
NWDo
H/PS
/44/
19Ra
mok
okas
tad C
linic
- ABM
2. C
once
ptM
oses
Kota
ne (N
W37
5)Bu
ilding
s an
d oth
er fix
ed s
tructu
res
Clini
c10
Feb
201
931
Jan
202
3HF
RGNo
t par
t of a
pro
gram
me
NWDo
H
3
6 00
0
-
3 9
03
6 27
3
5
824
NWDo
H/PS
/44/
19-H
TRa
mok
okas
tad C
linic-
HT2.
Con
cept
Mos
es K
otane
(NW
375)
Mac
hiner
y an
d Eq
uipm
ent
Clini
c10
Feb
201
931
Jan
202
3HF
RGNo
t par
t of a
pro
gram
me
NWDo
H
2 5
00
-
-
2
500
-
NWDo
H/PS
/1/1
9Bo
phelo
ng P
sych
iatric
Hos
pital
Phas
e III
4. D
esign
Doc
umen
tation
Build
ings
and
other
fixed
stru
cture
s01
Apr
201
631
Mar
202
3No
t par
t of a
pro
gram
me
NWDo
H
54
5 00
0
69
648
5
2 97
2
66
418
4
0 82
8
NWDo
H/PS
/1/1
9 HT
Boph
elong
Psy
chiat
ric H
ospit
al Ph
ase
III HT
2. C
once
pt M
achin
ery
and
Equip
men
t01
Apr
201
731
Mar
202
3No
t par
t of a
pro
gram
me
NWDo
H
1
2 00
0
-
6 0
00
6 00
0
3
000
NWDo
H/PS
/1/1
9 QA
Boph
elong
Psy
chiat
ric H
ospit
al Ph
ase
III OD
/QA
1. In
itiatio
nBu
ilding
s an
d oth
er fix
ed s
tructu
res
01 A
pr 2
017
31 M
ar 2
023
Not p
art o
f a p
rogr
amm
eNW
DoH
-
-
-
-
-
DPW
/054
/08-
HTBo
phelo
ng P
sych
iatric
Hos
pital
Phas
e II -
HT
5. W
orks
Mac
hiner
y an
d Eq
uipm
ent
01 A
pr 2
015
31 M
ar 2
021
Not p
art o
f a p
rogr
amm
eNW
DoH
14
000
9 61
6
3
500
-
-
NWDo
H/PS
/07/
15Ne
w M
akgo
bistad
CHC
1. In
itiatio
nRa
tlou
(NW
381)
Bu
ilding
s an
d oth
er fix
ed s
tructu
res
CHC
01 A
pr 2
017
31 J
ul 20
24HF
RGNo
t par
t of a
pro
gram
me
NWDo
H
17
3 00
0
-
-
-
-
NWDo
H/PS
/03/
17M
otsw
edi C
linic
3. D
esign
Dev
elopm
ent
Build
ings
and
other
fixed
stru
cture
s6
Aug
2016
31 M
ay 2
022
Not p
art o
f a p
rogr
amm
eNW
DoH
62
000
1
2 07
1
5
800
23
000
4
2 00
0
NWDo
H/PS
/03/
17 H
TM
otsw
edi C
linic
HT1.
Initia
tion
Mac
hiner
y an
d Eq
uipm
ent
10 N
ov 2
018
31 M
ay 2
022
Not p
art o
f a p
rogr
amm
eNW
DoH
4
000
-
1 5
00
2 50
0
-
NWDo
H/PS
/03/
17 O
D/QA
Mots
wed
i Clin
ic OD
/QA
1. In
itiatio
nBu
ilding
s an
d oth
er fix
ed s
tructu
res
10 N
ov 2
018
31 M
ay 2
022
Not p
art o
f a p
rogr
amm
eNW
DoH
-
-
-
-
-
NWDo
H/PS
/10/
18Ra
pulan
a Cl
inic
3. D
esign
Dev
elopm
ent
Build
ings
and
other
fixed
stru
cture
s1
Aug
2016
30 J
un 2
022
HFRG
Not p
art o
f a p
rogr
amm
eNW
DoH
42
000
2 00
0
5
113
28
837
1 00
0
NWDo
H/PS
/10/
18 H
TRa
pulan
a Cl
inic
HT1.
Initia
tion
Mac
hiner
y an
d Eq
uipm
ent
1 Au
g 20
1630
Jun
202
2HF
RGNo
t par
t of a
pro
gram
me
NWDo
H
2 5
00
-
2
000
500
-
NWDo
H/PS
/10/
18 O
D/QA
Rapu
lana
Clini
c OD
/QA
1. In
itiatio
nBu
ilding
s an
d oth
er fix
ed s
tructu
res
1 Au
g 20
1630
Jun
202
2HF
RGNo
t par
t of a
pro
gram
me
NWDo
H
-
-
-
-
-
NWDo
H/PS
/3/1
8Ko
pela
Clini
c2.
Con
cept
Tsw
aing
(NW
382)
Build
ings
and
other
fixed
stru
cture
sCl
inic
1 Au
g 20
1631
Aug
202
2HF
RGNo
t par
t of a
pro
gram
me
NWDo
H
4
7 00
0
500
2 8
98
5 30
0
2
900
NWDo
H/PS
/3/1
8Ko
pela
Clini
c-HT
2.
Con
cept
Tsw
aing
(NW
382)
Mac
hiner
y an
d Eq
uipm
ent
Clini
c1
Aug
2016
31 A
ug 2
022
HFRG
Not p
art o
f a p
rogr
amm
eNW
DoH
2
500
-
-
1 5
00
1 00
0
NWDo
H/PS
/3/1
8Ko
pela
Clini
c-OD
/QA
2. C
once
ptTs
wain
g (N
W38
2)Bu
ilding
s an
d oth
er fix
ed s
tructu
res
Clini
c1
Aug
2016
31 A
ug 2
022
HFRG
Not p
art o
f a p
rogr
amm
eNW
DoH
-
-
-
-
-
NWDo
H/PS
/42/
19M
atlod
ing C
linic
4. D
esign
Doc
umen
tation
Build
ings
and
other
fixed
stru
cture
s10
Feb
201
931
Jan
202
3No
t par
t of a
pro
gram
me
NWDo
H
4
1 00
0
-
-
-
-
NWDo
H/PS
/42/
19-H
TM
atlod
ing C
linic-
HT
2. C
once
pt M
achin
ery
and
Equip
men
t10
Feb
201
931
Jan
202
3No
t par
t of a
pro
gram
me
NWDo
H
2
500
-
-
2 50
0
-
NWDo
H/PS
/021
/11
Maq
uass
i Hills
CHC
- AB
M2.
Con
cept
Maq
uass
i Hills
Build
ings
and
other
fixed
stru
cture
s01
Mar
202
331
Jul
2024
Not p
art o
f a p
rogr
amm
eNW
DoH
190
000
2 55
6
-
4 5
00
7
3 00
0
NWDo
H/PS
/021
/11-
HTM
aqua
ssi H
ills C
HC-H
T2.
Con
cept
Maq
uass
i Hills
Mac
hiner
y an
d Eq
uipm
ent
01 M
ar 2
023
31 A
ug 2
025
Not p
art o
f a p
rogr
amm
eNW
DoH
5
000
-
-
-
3 0
00
NWDo
H/PS
/021
/11-
OD/Q
AM
aqua
ssi H
ills C
HC-O
D/QA
2. C
once
ptM
aqua
ssi H
illsBu
ilding
s an
d oth
er fix
ed s
tructu
res
01 M
ar 2
023
31 A
ug 2
025
Not p
art o
f a p
rogr
amm
eNW
DoH
-
-
-
-
-
NWDo
H/PS
/02/
11
Joub
erton
Ext
ensio
n 19
CHC
5.
Wor
ksM
atlos
ana
Build
ings
and
other
fixed
stru
cture
sCH
C 01
Apr
i 201
631
Mar
202
0HF
RGNo
t par
t of a
pro
gram
me
NWDo
H
17
4 95
7
2
58 8
64
3 0
00
-
-
NWDo
H/PS
/180
/11
- HT
Joub
erton
Ext
ensio
n 19
CHC
- HT
2. C
once
ptM
atlos
ana
Mac
hiner
y an
d Eq
uipm
ent
CHC
1 Au
g 20
1731
Mar
202
1HF
RGNo
t par
t of a
pro
gram
me
NWDo
H
1
5 00
0
9
000
3 0
00
3 00
0
-
NWDo
H/PS
/019
/11
New
Sek
hing
CHC
5. W
orks
Build
ings
and
other
fixed
stru
cture
s10
Oct
2012
31 J
ul 20
20No
t par
t of a
pro
gram
me
NWDo
H
16
0 00
0
1
58 1
68
1 0
00
-
-
NWDo
H/PS
/019
/11-
HTSe
khing
CHC
HT
5. W
orks
Mac
hiner
y an
d Eq
uipm
ent
01 A
pr 2
016
31 J
ul 20
20No
t par
t of a
pro
gram
me
NWDo
H
1
3 05
9
6
059
7 0
00
-
-
NWDo
H/PS
/10/
15Ne
w G
anye
sa C
HC -
ABM
1. In
itiatio
nBu
ilding
s an
d oth
er fix
ed s
tructu
res
01 O
ct 20
1631
Mar
202
4No
t par
t of a
pro
gram
me
NWDo
H
18
9 00
0
-
5
000
1
550
5
0 00
0
NWDo
H/PS
/10/
15-H
TNe
w G
anye
sa C
HC H
T1.
Initia
tion
Mac
hiner
y an
d Eq
uipm
ent
01 J
ul 20
1831
Mar
202
4No
t par
t of a
pro
gram
me
NWDo
H
8 0
00
-
-
-
3 50
0
NWDo
H/PS
/10/
15-O
D/QA
New
Gan
yesa
CHC
OD/
QA1.
Initia
tion
Build
ings
and
other
fixed
stru
cture
s01
Oct
2016
31 M
ar 2
024
Not p
art o
f a p
rogr
amm
eNW
DoH
2
000
-
-
-
-
NWDo
H/PS
/10/
19M
anthe
CHC
Upg
rade
- AB
M2.
Con
cept
Build
ings
and
other
fixed
stru
cture
s27
Dec
201
830
Sep
202
3No
t par
t of a
pro
gram
me
NWDo
H
60
000
-
5 8
00
45 0
00
41 3
67
NWDo
H/PS
/10/
19 H
TM
anthe
CHC
Upg
rade
HT
2. C
once
pt M
achin
ery
and
Equip
men
t4
Nov
2019
31 M
ay 2
023
Not p
art o
f a p
rogr
amm
eNW
DoH
3 00
0
-
-
100
1
100
Tota
l New
infra
stru
ctur
e as
sets
2
376
116
556
654
131
713
262
160
311
843
Proj
ect
No.
Proj
ect n
ame
Proj
ect
Stat
us (F
IDPM
)M
unic
ipal
ity /
Regi
on
Econ
omic
Cla
ssifi
catio
n (B
uild
ing
and
Othe
r Fix
ed S
truct
ures
, Goo
ds &
Serv
ices
, Pla
nt, M
achi
nary
&
Equi
pmen
t, CO
E)
MTE
F
2020
/21
MTE
F
Forw
ard
estim
ates
Mor
etel
e (N
W37
1)CH
CHF
RGNo
t par
t of a
pro
gram
me
Type
of i
nfra
stru
ctur
e
Proj
ect d
urat
ion
Sour
ce
of
fund
ing
Budg
et
prog
ram
me
nam
e
Impl
emen
ting
Agen
t
Tot
al p
roje
ct
cost
Not p
art o
f a p
rogr
amm
e
Mafi
keng
(NW
383)
Hosp
ital
HFRG
Exp
endi
ture
to
date
from
prev
ious
yea
rs
Ratlo
u (N
W38
1)Cl
inic
HFRG
Mor
etel
e (N
W37
1)
Mor
etel
e (N
W37
1)CH
CHF
RG
Ram
otshe
re M
oiloa
(NW
385)
(NW
385)
Clini
cHF
RG
Mafi
keng
(NW
383)
Cl
inic
CHC
HFRG
Gre
ater
Tau
ng (
NW39
4)
(NW
394)
CHC
HFRG
Kagis
ano
Molo
po (N
W39
7)CH
CHF
RG

Department of Health
128
NW
DoH
/PS
/016/1
2 -
HT
Boite
kong C
HC
HT
5.
Work
sR
uste
nburg
(N
W373)
Machin
ery
and E
quip
ment
CH
C01 S
ep 2
011
31 M
ar
2021
HF
RG
Not part o
f a p
rogra
mm
eN
WD
oH
6 5
41
1 0
41
5
500
-
-
NW
DoH
/PS
/017/1
1-M
OU
Job S
him
ankane T
abane H
ospita
l (M
ate
rnal
Obste
tric
s U
nit
(MO
U)
3.
Desig
n D
ev
elo
pm
ent
Build
ings a
nd o
ther
fixed s
tructu
res
01 A
pr
2015
01 S
ep 2
018
HF
RG
Not part o
f a p
rogra
mm
eN
WD
oH
336 0
00
22 0
84
-
-
2 5
00
NW
DoH
/PS
/06/1
8Job S
him
ankane T
abane H
ospita
l (
Upgra
de
Gy
no W
ard
)4.
Desig
n D
ocum
enta
tion
Build
ings a
nd o
ther
fixed s
tructu
res
01 S
ep 2
018
31 O
ct 2021
HF
RG
Not part o
f a p
rogra
mm
eN
WD
oH
20 0
00
2 0
00
9
600
2 4
00
-
NW
DoH
/PS
/06/1
8 H
TJS
T H
ospita
l (
Upgra
de G
yno W
ard
) H
T4.
Desig
n D
ocum
enta
tion
Machin
ery
and E
quip
ment
01 S
ep 2
018
31 O
ct 2021
HF
RG
Not part o
f a p
rogra
mm
eN
WD
oH
2 0
00
-
1
500
5
00
-
NW
DoH
/PS
/017/1
1-H
T
Job S
him
ankane T
abane H
ospita
l H
T (
Menta
l &
Theatre)
4.
Desig
n D
ocum
enta
tion
Machin
ery
and E
quip
ment
01 S
ep 2
011
31 M
ar
2021
HF
RG
Not part o
f a p
rogra
mm
eN
WD
oH
20 1
89
4 1
89
1
5 0
00
-
-
NW
DoH
/PS
/61/1
9O
ffice a
ccom
modatio
n for
Com
munity
Health
Work
ers
- A
BM
2.
Concept
Boja
nala
Build
ings a
nd o
ther
fixed s
tructu
res
Hospita
ls16 O
ct 2019
31 M
ar
2021
HF
RG
Not part o
f a p
rogra
mm
eN
WD
oH
1 0
00
5
0
950
-
-
NW
DoH
/PS
/67/1
9E
MR
S -
Additi
onal space -
AB
M2.
Concept
Boja
nala
Build
ings a
nd o
ther
fixed s
tructu
res
EM
RS
16 O
ct 2019
31 M
ar
2021
HF
RG
Not part o
f a p
rogra
mm
eN
WD
oH
5
00
5
0
450
-
-
DO
H029/P
S/1
1G
elu
kspan H
ospita
l -
Upgra
din
g o
f H
ospita
l 3.
Desig
n D
ev
elo
pm
ent
Build
ings a
nd o
ther
fixed s
tructu
res
01 J
une 2
016
31 M
ar
2022
HF
RG
Not part o
f a p
rogra
mm
eN
WD
oH
80 1
00
11 0
00
5
854
10 0
00
45 0
00
DO
H029/P
S/1
1 H
TG
elu
kspan H
ospita
l -
Upgra
din
g o
f H
ospita
l H
T3.
Desig
n D
ev
elo
pm
ent
Machin
ery
and E
quip
ment
01 A
ug 2
018
31 M
ar
2022
HF
RG
Not part o
f a p
rogra
mm
eN
WD
oH
5 0
00
-
1
500
3 5
00
-
DO
H029/P
S/1
1 Q
A/O
DG
elu
kspan H
ospita
l -
Upgra
din
g o
f H
ospita
l
QA
/OD
1.
Initi
atio
nB
uild
ings a
nd o
ther
fixed s
tructu
res
01 A
ug 2
018
31 M
ar
2022
HF
RG
Not part o
f a p
rogra
mm
eN
WD
oH
-
-
-
-
-
DoH
/023/P
S/1
1M
mabath
o N
urs
ing C
olle
ge (
Mm
acon)
-
Mm
acon P
hase 1
5.
Work
sB
uild
ings a
nd o
ther
fixed s
tructu
res
05 F
eb 2
016
31 A
ug 2
020
HF
RG
Not part o
f a p
rogra
mm
eN
WD
oH
311 0
00
290 6
24
7
000
5 0
00
-
DoH
/023/P
S/1
1M
mabath
o N
urs
ing C
olle
ge P
hase 1
- H
T5.
Work
s M
achin
ery
and E
quip
ment
1 A
pr
2017
31 A
ug 2
020
HF
RG
Not part o
f a p
rogra
mm
eN
WD
oH
8 0
00
1 5
00
6
500
-
-
NW
DoH
/PS
/01/2
0M
mabath
o N
urs
ing C
olle
ge (
Mm
acon)
-
Com
ple
tion
1.
Initi
atio
nB
uild
ings a
nd o
ther
fixed s
tructu
res
11 F
ebr
2020
31 J
ul 2021
HF
RG
Not part o
f a p
rogra
mm
eN
WD
oH
90 0
00
-
5
200
4 0
00
-
NW
DO
H/P
S/1
3/1
5Logageng C
linic
- U
pgra
din
g o
f C
linic
1.
Initi
atio
nB
uild
ings a
nd o
ther
fixed s
tructu
res
1 A
pr
2018
31 O
ct 2023
HF
RG
Not part o
f a p
rogra
mm
eN
WD
oH
36 0
00
-
-
2 5
00
10 2
47
NW
DO
H/P
S/1
3/1
5 H
TLogageng C
linic
- U
pgra
din
g o
f C
linic
HT
1.
Initi
atio
n M
achin
ery
and E
quip
ment
1 A
pr
2018
31 O
ct 2023
HF
RG
Not part o
f a p
rogra
mm
eN
WD
oH
2 0
00
-
-
500
1 0
00
NW
DO
H/P
S/1
3/1
5Logageng C
linic
- U
pgra
din
g o
f C
linic
OD
/QA
1.
Initi
atio
nB
uild
ings a
nd o
ther
fixed s
tructu
res
1 A
pr
2018
31 O
ct 2023
HF
RG
Not part o
f a p
rogra
mm
eN
WD
oH
-
-
-
-
-
DP
W239/0
6D
ela
rey
vill
e B
ulk
Pharm
acy
- U
pgra
din
g o
f
Pharm
acy
4.
Desig
n D
ocum
enta
tion
Build
ings a
nd o
ther
fixed s
tructu
res
6 A
ug 2
016
31 O
ct 2021
HF
RG
Not part o
f a p
rogra
mm
eN
WD
oH
43 0
00
4 0
00
1
0 9
21
5 7
50
5 0
00
DP
W239/0
6 H
TD
ela
rey
vill
e B
ulk
Pharm
acy
- U
pgra
din
g o
f
Pharm
acy
HT
4.
Desig
n D
ocum
enta
tion
Machin
ery
and E
quip
ment
19 D
ec 2
018
31 J
ul 2021
HF
RG
Not part o
f a p
rogra
mm
eN
WD
oH
2 0
00
-
1
000
1 0
00
-
DP
W239/0
6 Q
A/O
DD
ela
rey
vill
e B
ulk
Pharm
acy
- U
pgr.
of
Pharm
acy
OD
/QA
4.
Desig
n D
ocum
enta
tion
Build
ings a
nd o
ther
fixed s
tructu
res
19 D
ec 2
018
31 J
ul 2021
HF
RG
Not part o
f a p
rogra
mm
eN
WD
oH
-
-
-
-
-
NW
DoH
/PS
/05/1
5D
eelp
an C
linic
- U
pgra
din
g o
f C
linic
3.
Desig
n D
ev
elo
pm
ent
Build
ings a
nd o
ther
fixed s
tructu
res
22 S
ep 2
016
30 J
un 2
024
HF
RG
Not part o
f a p
rogra
mm
eN
WD
oH
36 0
00
-
800
5
00
19 5
10
NW
DoH
/PS
/05/1
5 H
TD
eelp
an C
linic
- U
pgra
din
g o
f C
linic
HT
3.
Desig
n D
ev
elo
pm
ent
Machin
ery
and E
quip
ment
1 N
ov
2017
30 J
un 2
024
HF
RG
Not part o
f a p
rogra
mm
eN
WD
oH
2 0
00
-
-
-
2 0
00
NW
DoH
/PS
/05/1
5 O
D/Q
AD
eelp
an C
linic
- U
pgra
din
g o
f C
linic
OD
/QA
1.
Initi
atio
nB
uild
ings a
nd o
ther
fixed s
tructu
res
1 N
ov
2017
30 J
un 2
024
HF
RG
Not part o
f a p
rogra
mm
eN
WD
oH
-
-
-
-
-
NW
DoH
/PS
/003/1
7M
afik
eng P
rov
incia
l H
ospita
l -
Upgra
de R
enal
Unit
3.
Desig
n D
ev
elo
pm
ent
Build
ings a
nd o
ther
fixed s
tructu
res
1 A
ug 2
017
30 J
un 2
022
HF
RG
Not part o
f a p
rogra
mm
eN
WD
oH
18 0
00
5
00
1
900
4 9
00
10 0
00
NW
DoH
/PS
/003/1
7 H
TM
afik
eng P
rov
incia
l H
ospita
l -
Upgra
de R
enal
Unit
HT
3.
Desig
n D
ev
elo
pm
ent
Machin
ery
and E
quip
ment
28 D
ec 2
018
30 J
un 2
022
HF
RG
Not part o
f a p
rogra
mm
eN
WD
oH
2 5
00
-
-
2
500
-
DPW
177
Lic
hte
nburg
(G
enera
l D
eLara
y H
ospita
l)3.
Desig
n D
ev
elo
pm
ent
Dits
obtla
(N
W384)
(NW
384)
Build
ings a
nd o
ther
fixed s
tructu
res
Hospital
01 N
ov
2015
30 A
pr
2026
HF
RG
Not part o
f a p
rogra
mm
eN
WD
oH
770 0
00
42 4
62
-
-
-
NW
DoH
/PS
/62/1
9O
ffice a
ccom
modatio
n for
Com
munity
Health
Work
ers
- A
BM
1.
Initi
atio
nN
gaka M
odiri M
ole
ma
Build
ings a
nd o
ther
fixed s
tructu
res
Hospita
ls16 O
ct 2019
31 M
ar
2021
HF
RG
Not part o
f a p
rogra
mm
eN
WD
oH
1 0
00
5
0
950
-
-
NW
DoH
/PS
/65/1
9M
PH
- A
dditi
onal clin
ical space a
nd m
oth
ers
accom
modatio
n -
AB
M2.
Concept
Mafik
eng (
NW
383)
Build
ings a
nd o
ther
fixed s
tructu
res
Hospita
l16 O
ct 2019
31 M
ar
2021
HF
RG
Not part o
f a p
rogra
mm
eN
WD
oH
4 0
00
2
00
3 8
00
-
-
NW
DoH
/PS
/76/1
9M
afik
eng P
rov
.Hospita
l M
enta
l U
nit
- U
pgra
din
g2.
Concept
Mafik
eng (
NW
383)
Build
ings a
nd o
ther
fixed s
tructu
res
Hospital
16 O
ct 2019
31 M
ar
2021
HF
RG
Not part o
f a p
rogra
mm
eN
WD
oH
5 0
00
3
00
4 7
00
-
-
NW
DoH
/PS
/66/1
9M
agogoe C
linic
additi
onal space -
AB
M2.
Concept
Mafik
eng (
NW
383)
Build
ings a
nd o
ther
fixed s
tructu
res
Clin
ic
16 O
ct 2019
31 M
ar
2021
HF
RG
Not part o
f a p
rogra
mm
eN
WD
oH
1 0
00
1
00
900
-
-
NW
DoH
/PS
/68/1
9E
MR
S -
Additi
onal space -
AB
M2.
Concept
Ngaka M
odiri M
ole
ma
Build
ings a
nd o
ther
fixed s
tructu
res
EM
RS
16 O
ct 2019
31 M
ar
2021
HF
RG
Not part o
f a p
rogra
mm
eN
WD
oH
5
00
5
0
450
-
-
NW
DoH
/PS
/08/1
8P
otc
hefs
troom
Hospita
l U
pgra
de (
Casualty
)4.
Desig
n D
ocum
enta
tion
Build
ings a
nd o
ther
fixed s
tructu
res
01 S
ep 2
018
31 M
ay
2022
HF
RG
Not part o
f a p
rogra
mm
eN
WD
oH
48 0
00
2 4
87
1
0 0
00
28 1
00
-
NW
DoH
/PS
/08/1
8 H
TP
otc
hefs
troom
Hosp.
Upgra
de (
Casualty
) H
T4.
Desig
n D
ocum
enta
tion
Machin
ery
and E
quip
ment
01 S
ep 2
018
31 M
ay
2022
HF
RG
Not part o
f a p
rogra
mm
eN
WD
oH
5 0
00
-
5
000
-
-
NW
DoH
/PS
/11/1
8P
otc
hefs
troom
Hospita
l U
pgra
de (
Arc
hiv
es)
3.
Desig
n D
ev
elo
pm
ent
Build
ings a
nd o
ther
fixed s
tructu
res
01 S
ep 2
018
31 O
ct 2022
HF
RG
Not part o
f a p
rogra
mm
eN
WD
oH
24 0
00
-
1
900
10 2
00
11 9
00
NW
DoH
/PS
/11/1
8 H
TP
otc
hefs
troom
H.
Upgra
de (
Arc
hiv
es)
HT
3.
Desig
n D
ev
elo
pm
ent
Machin
ery
and E
quip
ment
27 D
ec 2
018
31 O
ct 2022
HF
RG
Not part o
f a p
rogra
mm
eN
WD
oH
1 0
00
-
-
1
000
-
DP
W238/0
6V
ente
rsdorp
Bulk
Pharm
acy
- U
pgra
de
Pharm
acy
4.
Desig
n D
ocum
enta
tion
Build
ings a
nd o
ther
fixed s
tructu
res
6 A
ug 2
016
31 M
ar
2022
HF
RG
Not part o
f a p
rogra
mm
eN
WD
oH
42 5
00
4 0
00
7
189
21 5
50
-
DP
W238/0
6 H
TV
ente
rsdorp
Bulk
Pharm
acy
- U
pgra
din
g H
T4.
Desig
n D
ocum
enta
tion
Machin
ery
and E
quip
ment
19 D
ec 2
018
31 M
ar
2022
HF
RG
Not part o
f a p
rogra
mm
eN
WD
oH
2 0
00
-
1
000
5
00
-
DP
W238/0
6 Q
A/O
DV
ente
rsdorp
Bulk
Pharm
acy
- U
pgra
din
g Q
A/O
D1.
Initi
atio
nB
uild
ings a
nd o
ther
fixed s
tructu
res
19 D
ec 2
018
31 M
ar
2022
HF
RG
Not part o
f a p
rogra
mm
eN
WD
oH
-
-
-
-
-
NW
DoH
/024/P
S/1
1E
xcels
ius N
urs
ing C
olle
ge
- E
xcels
ius N
urs
ing
Colle
ge P
hase 1
5.
Work
sB
uild
ings a
nd o
ther
fixed s
tructu
res
01 J
un 2
016
31 O
ct 2020
HF
RG
Not part o
f a p
rogra
mm
eN
WD
oH
297 3
84
289 6
88
3
500
-
-
DoH
/024/P
S/1
1 H
TE
xcels
ius N
.C.
Phase 1
- H
T5.
Work
s M
achin
ery
and E
quip
ment
01 J
un 2
016
31 O
ct 2020
HF
RG
Not part o
f a p
rogra
mm
eN
WD
oH
8 0
00
7 5
00
500
-
-
NW
DoH
/PS
/004/1
5M
arc
us Z
enzile
- U
pgra
de o
f C
linic
4.
Desig
n D
ocum
enta
tion
Tlo
kw
e (
NW
402)
Build
ings a
nd o
ther
fixed s
tructu
res
Clin
ic01 J
un 2
016
30 J
un 2
021
HF
RG
Not part o
f a p
rogra
mm
eN
WD
oH
14 5
00
1 0
00
7
350
4 9
00
-
NW
DoH
/PS
/004/1
5M
arc
us Z
enzile
- U
pgra
de o
f C
linic
HT
4.
Desig
n D
ocum
enta
tion
Machin
ery
and E
quip
ment
18 J
an 2
019
30 J
un 2
021
HF
RG
Not part o
f a p
rogra
mm
eN
WD
oH
1 0
00
-
500
5
00
-
NW
DoH
/PS
/004/1
5S
tev
e T
shw
ete
- U
pgra
de C
linic
4.
Desig
n D
ocum
enta
tion
Tlo
kw
e (
NW
402)
Build
ings a
nd o
ther
fixed s
tructu
res
Clin
ic01 J
un 2
016
30 J
un 2
021
HF
RG
Not part o
f a p
rogra
mm
eN
WD
oH
16 0
00
2 0
00
500
5 4
00
-
NW
DoH
/PS
/004/1
5S
tev
e T
shw
ete
- U
pgra
de C
linic
HT
4.
Desig
n D
ocum
enta
tion
Tlo
kw
e (
NW
402)
Machin
ery
and E
quip
ment
Clin
ic18 J
an 2
019
30 J
un 2
021
HF
RG
Not part o
f a p
rogra
mm
eN
WD
oH
1 0
00
-
7
350
5
00
-
NW
DoH
/PS
/002/1
7P
rom
osa -
Upgra
de o
f C
linic
2.
Concept
Build
ings a
nd o
ther
fixed s
tructu
res
01 A
pr
2017
31 M
ar
2024
HF
RG
Not part o
f a p
rogra
mm
eN
WD
oH
36 0
00
-
-
1
000
11 4
27
NW
DoH
/PS
/002/1
7 H
TP
rom
osa -
Upgra
de o
f C
linic
HT
2.
Concept
Machin
ery
and E
quip
ment
01 S
ep 2
018
31 M
ar
2024
HF
RG
Not part o
f a p
rogra
mm
eN
WD
oH
2 0
00
-
-
-
5
00
NW
DoH
/PS
/002/1
7 O
D/Q
AP
rom
osa -
Upgra
de o
f C
linic
OD
/QA
1.
Initi
atio
nB
uild
ings a
nd o
ther
fixed s
tructu
res
01 S
ep 2
018
31 M
ar
2024
HF
RG
Not part o
f a p
rogra
mm
eN
WD
oH
-
-
-
-
-
NW
DoH
/PS
/9/1
9N
ic B
odenste
in H
osp.
Upgra
de
2.
Concept
Wolm
ara
nsta
dB
uild
ings a
nd o
ther
fixed s
tructu
res
Hospita
l20 D
ec 2
018
31 J
ul 2025
HF
RG
Not part o
f a p
rogra
mm
eN
WD
oH
133 0
00
-
-
-
4 0
00
NW
DoH
/PS
/63/1
9O
ffice a
ccom
modatio
n for
Com
munity
Health
Work
ers
- A
BM
2.
Concept
Dr
Kenneth
Kaunda
Build
ings a
nd o
ther
fixed s
tructu
res
Hospita
ls16 O
ct 2019
31 M
ar
2021
HF
RG
Not part o
f a p
rogra
mm
eN
WD
oH
1 0
00
5
0
950
-
-
NW
DoH
/PS
/69/1
9E
MR
S -
Additi
onal space -
AB
M2.
Concept
Dr
Kenneth
Kaunda
Build
ings a
nd o
ther
fixed s
tructu
res
EM
RS
16 O
ct 2019
31 M
ar
2021
HF
RG
Not part o
f a p
rogra
mm
eN
WD
oH
5
00
5
0
450
-
-
NW
DoH
/PS
/74/1
9W
itrand H
ospita
l M
enta
l U
nit
- U
pgra
din
g2.
Concept
Tlo
kw
e (
NW
402)
Build
ings a
nd o
ther
fixed s
tructu
res
Hospital
16 O
ct 2019
31 M
ar
2021
HF
RG
Not part o
f a p
rogra
mm
eN
WD
oH
5 0
00
3
00
4 7
00
-
-
NW
DoH
/PS
/75/1
9P
otc
h.
Hospita
l M
enta
l U
nit
- U
pgra
din
g2.
Concept
City
of M
atlo
sana (
NW
403)
Build
ings a
nd o
ther
fixed s
tructu
res
Hospital
16 O
ct 2019
31 M
ar
2021
HF
RG
Not part o
f a p
rogra
mm
eN
WD
oH
5 0
00
3
00
4 7
00
-
-
NW
DoH
/PS
/73/1
9T
aung H
ospita
l M
enta
l U
nit
- U
pgra
din
g2.
Concept
Kagis
ano M
olo
po (
NW
397)
Build
ings a
nd o
ther
fixed s
tructu
res
Hospital
16 O
ct 2019
31 M
ar
2021
HF
RG
Not part o
f a p
rogra
mm
eN
WD
oH
5 0
00
3
00
4 7
00
-
-
NW
DoH
/PS
/64/1
9O
ffice a
ccom
modatio
n for
Com
munity
Health
Work
ers
- A
BM
2.
Concept
Dr
Ruth
Segom
ots
i M
om
pat
Build
ings a
nd o
ther
fixed s
tructu
res
Hospita
ls16 O
ct 2019
31 M
ar
2021
HF
RG
Not part o
f a p
rogra
mm
eN
WD
oH
1 0
00
5
0
950
-
-
NW
DoH
/PS
/70/1
9E
MR
S -
Additi
onal space -
AB
M2.
Concept
Dr
Ruth
Segom
ots
i M
om
pati
Build
ings a
nd o
ther
fixed s
tructu
res
EM
RS
16 O
ct 2019
31 M
ar
2021
HF
RG
Not part o
f a p
rogra
mm
eN
WD
oH
5
00
5
0
450
-
-
NW
DoH
/PS
/77/1
9G
any
esa H
ospita
l S
ew
er
Tre
atm
ent P
lant
2.
Concept
Kagis
ano M
olo
po
Build
ings a
nd o
ther
fixed s
tructu
res
Hospita
l17 O
ct 2019
31 J
ul 2022
HF
RG
Not part o
f a p
rogra
mm
eN
WD
oH
15 0
00
500
3 3
50
10 0
00
1 1
50
To
tal
Up
gra
des a
nd
ad
dit
ion
s
2 4
67 7
14
688 4
75
149 5
14
126 7
00
124 2
34
Mafik
eng (
NW
383)
Nurs
ing C
olle
ge
2.
Up
gra
des a
nd
ad
dit
ion
s
Ruste
nburg
(N
W373)
Hospita
l
Mafik
eng (
NW
383)
Hospita
l
Ratlo
u (
NW
381)
Clin
ic
Tsw
ain
g (
NW
382)
(NW
382)
Pharm
acy
Tsw
ain
g (
NW
382)
Clin
ic
Mafik
eng (
NW
383)
Hospita
l
Tlo
kw
e (
NW
402)
Hospita
l
Vente
rsdorp
(N
W401)
Pharm
acy
City
of M
atlo
sana (
NW
403)
Colle
ge
Tlo
kw
e (
NW
402)
Clin
ic

2020/21 Estimates of Provincial Revenue and Expenditure
129
NW
Do
H/P
S/0
2/1
7K
oste
r H
osp
ital R
eh
abili
tatio
n1
. In
itia
tion
Kgetleng R
ivie
r (N
W374)
Build
ing
s a
nd
oth
er
fixe
d s
tru
ctu
res
Ho
spita
l0
1 A
pr
20
173
1 J
ul 2
024
HF
RG
No
t pa
rt o
f a p
rog
ram
me
NW
Do
H123 0
00
-
-
2 0
00
5 0
00
NW
Do
H/P
S/1
2/1
9S
eso
be
Clin
ic G
en
era
tor
4.
De
sig
n D
ocu
me
nta
tion
Ma
chin
ery
an
d E
qu
ipm
en
t0
9 S
ep
20
193
1 M
ar
20
21H
FR
GN
ot p
art
of a
pro
gra
mm
eN
WD
oH
5
00
-
500
-
-
NW
Do
H/P
S/1
1/1
9S
eso
be
Clin
ic R
eh
abili
tatio
n3
. D
esi
gn D
ev
elo
pm
en
tB
uild
ing
s a
nd
oth
er
fixe
d s
tru
ctu
res
28
De
c 2
018
28
Fe
b 2
021
HF
RG
No
t pa
rt o
f a p
rog
ram
me
NW
Do
H 6 2
00
375
2 5
13
1 1
50
-
NW
Do
H/P
S/1
3/1
9S
ea
par
ankw
e C
linic
Gen
era
tor
4.
De
sig
n D
ocu
me
nta
tion
Ma
kap
anst
ad
M
ach
ine
ry a
nd
Equ
ipm
en
tC
linic
28
De
c 2
018
31
Ma
r 2
021
HF
RG
No
t pa
rt o
f a p
rog
ram
me
NW
Do
H 5
00
-
500
-
-
NW
Do
H/P
S/3
6/1
9JS
T M
en
tal U
nit
Re
furb
ish
me
nt
4.
De
sig
n D
ocu
me
nta
tion
Build
ing
s a
nd
oth
er
fixe
d s
tru
ctu
res
22
Ja
n 2
019
31
Oct
20
20H
FR
GN
ot p
art
of a
pro
gra
mm
eN
WD
oH
2 0
00
500
1 5
00
-
-
NW
Do
H/P
S/1
12/
19
JS
T H
osp
ital -
Re
furb
ish
Th
eat
res
HV
AC
2.
Co
nce
pt
Goo
ds
an
d S
erv
ice
s1
1 N
ov
20
193
1 M
ar
20
21H
FR
GN
ot p
art
of a
pro
gra
mm
eN
WD
oH
9 0
00
7 5
00
1 5
00
-
-
NW
Do
H/P
S/1
0/2
0L
ebo
tloan
e C
HC
Park
ho
me
4.
De
sig
n D
ocu
me
nta
tion
Mo
rete
le (
NW
37
1)B
uild
ing
s a
nd
oth
er
fixe
d s
tru
ctu
res
CH
C1
2 F
eb
20
203
1 J
ul 2
021
HF
RG
No
t pa
rt o
f a p
rog
ram
me
NW
Do
H 6 0
00
-
6
000
-
-
NW
Do
H/P
S/4
8/1
9R
am
oko
kast
ad
Clin
ic P
ark
ho
me
4.
De
sig
n D
ocu
me
nta
tion
Mo
ses
Kota
ne
(NW
37
5)B
uild
ing
s a
nd
oth
er
fixe
d s
tru
ctu
res
Clin
ic2
2 J
ul 2
019
31
Ju
l 20
20H
FR
GN
ot p
art
of a
pro
gra
mm
eN
WD
oH
6 0
00
3 5
00
2
000
-
-
NW
Do
H/P
S/1
1/2
0M
oru
leng
Clin
ic P
ark
ho
me
4.
De
sig
n D
ocu
me
nta
tion
Moses K
ota
ne (
NW
375)
Build
ing
s a
nd
oth
er
fixe
d s
tru
ctu
res
Cln
ic1
2 F
eb
20
203
1 J
ul 2
021
HF
RG
No
t pa
rt o
f a p
rog
ram
me
NW
Do
H 6 0
00
-
3
000
-
-
NW
Do
H/P
S/1
2/2
0G
ate
wa
y C
linic
Park
ho
me
4.
De
sig
n D
ocu
me
nta
tion
Ru
ste
nbu
rg (
NW
37
3)B
uild
ing
s a
nd
oth
er
fixe
d s
tru
ctu
res
Cln
ic1
2 F
eb
20
203
1 J
ul 2
021
HF
RG
No
t pa
rt o
f a p
rog
ram
me
NW
Do
H 6 0
00
-
3
000
-
-
NW
Do
H/P
S/1
3/2
0T
lhab
ane
Clin
ic P
ark
ho
me
4.
De
sig
n D
ocu
me
nta
tion
Ru
ste
nbu
rg (
NW
37
3)B
uild
ing
s a
nd
oth
er
fixe
d s
tru
ctu
res
Cln
ic1
2 F
eb
20
203
1 J
ul 2
021
HF
RG
No
t pa
rt o
f a p
rog
ram
me
NW
Do
H 6 0
00
-
3
000
-
-
NW
Do
H/P
S/5
7/1
9S
tatu
tory
co
mp
lian
ce o
f UV
lig
hts
at H
osp
itals
an
d a
sse
ssm
en
t of O
HS
Co
mp
lian
ce2
. C
on
cep
tB
oja
na
laG
oo
ds
an
d S
erv
ice
sH
osp
itals
16
Oct
20
193
1 J
ul 2
020
HF
RG
No
t pa
rt o
f a p
rog
ram
me
NW
Do
H 2
00
5
0
150
-
-
NW
Do
H/P
S/7
1/1
9B
oite
kon
g C
HC
- R
efu
rbis
h M
en
tal H
ea
lth U
nit
4.
De
sig
n D
ocu
me
nta
tion
Ru
ste
nbu
rg (
NW
37
3)B
uild
ing
s a
nd
oth
er
fixe
d s
tru
ctu
res
CH
C1
6 O
ct 2
019
31
Ma
r 2
021
HF
RG
No
t pa
rt o
f a p
rog
ram
me
NW
Do
H 1 5
00
5
00
1 0
00
-
-
NW
Do
H/P
S/1
04/
19
Re
furb
ish
Me
dic
al G
as S
yste
ms
4.
De
sig
n D
ocu
me
nta
tion
Boja
na
laG
oo
ds
an
d S
erv
ice
sH
osp
itals
29
Oct
20
193
1 M
ar
20
21H
FR
GN
ot p
art
of a
pro
gra
mm
eN
WD
oH
4 5
00
-
3 0
00
1 5
00
-
NW
Do
H/P
S/0
7/2
0B
rits
Ho
spita
l - C
hill
as R
ep
lace
me
nt
4.
De
sig
n D
ocu
me
nta
tion
Ma
dib
eng
(N
W3
72)
Goo
ds
an
d S
erv
ice
sH
osp
ital
12
Fe
b 2
020
31
Ma
r 2
021
HF
RG
No
t pa
rt o
f a p
rog
ram
me
NW
Do
H 9 5
00
-
9 5
00
-
-
NW
Do
H/P
S/1
4/1
5Its
ose
ng
CH
C -
Re
furb
ish
wa
ter
su
ppl
y n
etw
ork
4.
De
sig
n D
ocu
me
nta
tion
Dits
ob
otla
(N
W3
84)
G
oo
ds
an
d S
erv
ice
sC
HC
01
Ju
n 2
017
31
Ju
l 20
20H
FR
GN
ot p
art
of a
pro
gra
mm
eN
WD
oH
3 2
99
799
2 5
00
-
-
NW
Do
H/P
S/3
9/1
9M
ed
ica
l Sto
res R
efu
rbis
hm
en
t4
. D
esi
gn D
ocu
me
nta
tion
Build
ing
s a
nd
oth
er
fixe
d s
tru
ctu
res
24
Ja
n 2
019
31
Ja
n 2
021
HF
RG
No
t pa
rt o
f a p
rog
ram
me
NW
Do
H 2 5
00
300
2 2
00
-
-
NW
Do
H/P
S/9
2/1
9M
ed
ica
l Sto
res R
efu
rbis
me
nt o
f HV
AC
4.
De
sig
n D
ocu
me
nta
tion
Goo
ds
an
d S
erv
ice
s1
8 O
ct 2
019
31
Ma
r 2
021
HF
RG
No
t pa
rt o
f a p
rog
ram
me
NW
Do
H 2 0
00
-
2 0
00
-
-
NW
Do
H/P
S/3
4/1
9Z
ee
rust
Ho
spita
l - R
efu
rbis
h H
VA
C4
. D
esi
gn D
ocu
me
nta
tion
Goo
ds
an
d S
erv
ice
s2
2 J
an
20
193
1 M
ar
20
21H
FR
GN
ot p
art
of a
pro
gra
mm
eN
WD
oH
2 5
00
-
2 5
00
-
-
NW
Do
H/P
S/9
3/1
9Z
ee
rust
Ho
spita
l - P
acka
ged
Mo
rtu
ary
3.
De
sig
n D
ev
elo
pm
en
tB
uild
ing
s a
nd
oth
er
fixe
d s
tru
ctu
res
18
Oct
20
193
1 M
ar
20
21H
FR
GN
ot p
art
of a
pro
gra
mm
eN
WD
oH
3 0
00
-
3 0
00
-
-
NW
Do
H/P
S/3
7/1
9M
PH
Re
furb
ish
HV
AC
4.
De
sig
n D
ocu
me
nta
tion
Goo
ds
an
d S
erv
ice
s2
2 J
an
20
193
1 M
ar
20
21H
FR
GN
ot p
art
of a
pro
gra
mm
eN
WD
oH
4 5
00
500
4 0
00
-
-
NW
Do
H/P
S/9
1/1
9M
PH
Re
fpla
ce
Auto
cla
ve
s2
. C
on
cep
t M
ach
ine
ry a
nd
Equ
ipm
en
t1
8 O
ct 2
019
31
Ma
r 2
021
HF
RG
No
t pa
rt o
f a p
rog
ram
me
NW
Do
H 8
00
-
800
-
-
NW
Do
H/P
S/4
0/1
9M
PH
Re
furb
ish
Kitc
he
n, L
aun
dre
y a
nd
pa
cka
ged
mo
rtu
ary
3.
De
sig
n D
ev
elo
pm
en
tB
uild
ing
s a
nd
oth
er
fixe
d s
tru
ctu
res
22
Ja
n 2
019
30
No
v 2
020
HF
RG
No
t pa
rt o
f a p
rog
ram
me
NW
Do
H 9 0
00
2 5
00
6 5
00
-
-
NW
Do
H/P
S/3
8/1
9L
ich
ten
burg
Ho
spita
l Re
furb
ish
HV
AC
3.
De
sig
n D
ev
elo
pm
en
tG
oo
ds
an
d S
erv
ice
s2
2 J
an
20
193
1 M
ay
20
21H
FR
GN
ot p
art
of a
pro
gra
mm
eN
WD
oH
9 8
00
300
9 5
00
-
-
NW
Do
H/P
S/8
9/1
9L
itch
enb
urg
Ho
spita
l Packa
ged
Mo
rtu
ary
3.
De
sig
n D
ev
elo
pm
en
tB
uild
ing
s a
nd
oth
er
fixe
d s
tru
ctu
res
18
Oct
20
193
1 M
ar
20
21H
FR
GN
ot p
art
of a
pro
gra
mm
eN
WD
oH
2 5
00
-
2 5
00
-
-
NW
Do
H/P
S/9
0/1
9L
ich
ten
burg
Ho
spita
l Re
furb
ish
Kitc
he
n a
nd
Laundre
y3
. D
esi
gn D
ev
elo
pm
en
tB
uild
ing
s a
nd
oth
er
fixe
d s
tru
ctu
res
18
Oct
20
193
1 M
ar
20
21H
FR
GN
ot p
art
of a
pro
gra
mm
eN
WD
oH
3 2
00
-
3 2
00
-
-
NW
Do
H/P
S/0
9/2
0B
op
hel
ong
Psy
ch
iatric
Ho
spita
l - R
efu
rbis
h H
ot
Wa
ter
sy
ste
m.
2.
Co
nce
pt
Ma
fike
ng
(NW
38
3)G
oo
ds
an
d S
erv
ice
sH
osp
ital
12
Fe
b 2
020
31
Ma
r 2
021
HF
RG
No
t pa
rt o
f a p
rog
ram
me
NW
Do
H 3 2
00
-
5 1
60
-
-
NW
Do
H/P
S/4
5/1
9D
ee
lpa
n C
linic
- P
ark
ho
me
4.
De
sig
n D
ocu
me
nta
tion
Tsw
ain
g (
NW
38
2)B
uild
ing
s a
nd
oth
er
fixe
d s
tru
ctu
res
Clin
ic2
8 J
un
20
193
1 M
ar
20
21H
FR
GN
ot p
art
of a
pro
gra
mm
eN
WD
oH
7 5
00
500
2 5
00
-
-
NW
Do
H/P
S/4
6/1
9K
op
ela
Clin
ic P
ark
ho
me
4.
De
sig
n D
ocu
me
nta
tion
Tsw
ain
g (
NW
38
2)B
uild
ing
s a
nd
oth
er
fixe
d s
tru
ctu
res
Clin
ic2
8 J
un
20
193
1 M
ar
20
21H
FR
GN
ot p
art
of a
pro
gra
mm
eN
WD
oH
7 5
00
5
00
2
500
-
-
NW
Do
H/P
S/4
9/1
9M
atlo
din
g C
linic
Park
ho
me
4.
De
sig
n D
ocu
me
nta
tion
Ra
tlou (
NW
38
1)B
uild
ing
s a
nd
oth
er
fixe
d s
tru
ctu
res
Clin
ic2
2 J
ul 2
019
31
Ma
r 2
021
HF
RG
No
t pa
rt o
f a p
rog
ram
me
NW
Do
H 5 5
00
2 5
00
3
000
-
-
NW
Do
H/P
S/5
6/1
9M
ots
we
di C
linic
Park
ho
me
4.
De
sig
n D
ocu
me
nta
tion
Ra
mo
tsh
ere
Mo
iloa
(N
W3
85)
(NW
38
5)B
uild
ing
s a
nd
oth
er
fixe
d s
tru
ctu
res
Clin
ic1
6 O
ct 2
019
31
Ma
r 2
021
HF
RG
No
t pa
rt o
f a p
rog
ram
me
NW
Do
H 5 5
00
2 5
00
3
000
-
-
NW
Do
H/P
S/5
0/1
9R
ap
ula
na
Clin
ic P
ark
ho
me
4.
De
sig
n D
ocu
me
nta
tion
Ma
fike
ng
(NW
38
3)B
uild
ing
s a
nd
oth
er
fixe
d s
tru
ctu
res
Clin
ic2
2 J
ul 2
019
31
Ma
r 2
021
HF
RG
No
t pa
rt o
f a p
rog
ram
me
NW
Do
H 5 5
00
2 5
00
2
500
-
-
NW
Do
H/P
S/1
9/1
9L
ich
ten
burg
Ho
spita
l Gen
era
tor
4.
De
sig
n D
ocu
me
nta
tion
Dits
ob
tla (
NW
38
4) (
NW
38
4) M
ach
ine
ry a
nd
Equ
ipm
en
tH
osp
ital
28
De
c 2
018
31
Ma
r 2
021
HF
RG
No
t pa
rt o
f a p
rog
ram
me
NW
Do
H 5
00
-
500
-
-
NW
Do
H/P
S/8
4/1
9T
hu
son
g H
osp
ital G
en
era
tor
4.
De
sig
n D
ocu
me
nta
tion
Dits
ob
otla
(N
W3
84)
M
ach
ine
ry a
nd
Equ
ipm
en
tH
osp
ital
18
Oct
20
193
1 M
ar
20
21H
FR
GN
ot p
art
of a
pro
gra
mm
eN
WD
oH
5
00
-
500
-
-
NW
Do
H/P
S/5
8/1
9S
tatu
tory
co
mp
lian
ce o
f UV
lig
hts
at H
osp
itals
an
d a
sse
ssm
en
t of O
HS
Co
mp
lian
ce2
. C
on
cep
tN
ga
ka M
od
iri M
ole
ma
Goo
ds
an
d S
erv
ice
sH
osp
itals
16
Oct
20
193
1 J
ul 2
020
HF
RG
No
t pa
rt o
f a p
rog
ram
me
NW
Do
H 2
00
5
0
150
-
-
NW
Do
H/P
S/7
2/1
9B
op
hel
ong
PH
- S
tate
Patie
nt W
ard
s
Re
furb
ish
me
nt
2.
Co
nce
pt
Ma
fike
ng
(NW
38
3)
Build
ing
s a
nd
oth
er
fixe
d s
tru
ctu
res
Ho
spita
ls1
6 O
ct 2
019
31
Ma
r 2
021
HF
RG
No
t pa
rt o
f a p
rog
ram
me
NW
Do
H 2 0
00
2
00
1 8
00
-
-
NW
Do
H/P
S/1
05/
19
Re
furb
ish
Me
dic
al G
as S
yste
ms
4.
De
sig
n D
ocu
me
nta
tion
Ng
aka
Mo
diri
Mo
lem
aG
oo
ds
an
d S
erv
ice
sH
osp
itals
29
Oct
20
193
1 M
ar
20
21H
FR
GN
ot p
art
of a
pro
gra
mm
eN
WD
oH
1 7
50
3
00
1 4
50
-
-
NW
Do
H/P
S/1
13/
19
EM
RS
- R
efu
rbis
h fo
r C
all
Ce
ntre
2.
Co
nce
pt
Ma
fike
ng
(NW
38
3)
Build
ing
s a
nd
oth
er
fixe
d s
tru
ctu
res
EM
RS
11
No
v 2
019
31
Ma
r 2
021
HF
RG
No
t pa
rt o
f a p
rog
ram
me
NW
Do
H 1 0
00
2
00
800
-
-
NW
Do
H/P
S/2
0/1
9T
sh
epo
ng
MD
R G
en
era
tor
4.
De
sig
n D
ocu
me
nta
tion
Ma
chin
ery
an
d E
qu
ipm
en
t2
8 D
ec
20
183
1 M
ar
20
20H
FR
GN
ot p
art
of a
pro
gra
mm
eN
WD
oH
6
00
-
600
-
-
NW
Do
H/P
S/9
4/1
9T
sh
epo
ng
Ho
spita
l - R
ep
lace
Ch
illers
3.
De
sig
n D
ev
elo
pm
en
tG
oo
ds
an
d S
erv
ice
s1
8 O
ct 2
019
31
Ma
r 2
022
HF
RG
No
t pa
rt o
f a p
rog
ram
me
NW
Do
H 12 5
00
-
9 0
00
3 5
00
-
NW
Do
H/P
S/1
4/2
0Jo
ube
rto
n C
linic
Park
ho
me
4.
De
sig
n D
ocu
me
nta
tion
Build
ing
s a
nd
oth
er
fixe
d s
tru
ctu
res
Cln
ic1
2 F
eb
20
203
1 J
ul 2
021
HF
RG
No
t pa
rt o
f a p
rog
ram
me
NW
Do
H 6 0
00
-
4
000
-
-
NW
Do
H/P
S/2
5/1
9JB
Ma
rks C
HC
Gen
era
tor
4.
De
sig
n D
ocu
me
nta
tion
City
of M
atlo
san
a (N
W4
03)
M
ach
ine
ry a
nd
Equ
ipm
en
tH
ospital
28
De
c 2
018
31
Ma
r 2
021
HF
RG
No
t pa
rt o
f a p
rog
ram
me
NW
Do
H 6
00
-
600
-
-
NW
Do
H/P
S/0
8/2
0N
ic B
od
ens
tein
Ho
sp.
Re
furb
ish
Th
eat
re H
VA
C3
. D
esi
gn D
ev
elo
pm
en
tW
olm
ara
nst
ad
Goo
ds
an
d S
erv
ice
sH
osp
ital
12
Fe
b 2
020
31
Ma
r 2
021
HF
RG
No
t pa
rt o
f a p
rog
ram
me
NW
Do
H 3 5
00
-
3 5
00
-
-
NW
Do
H/P
S/1
8/1
9Leeudorin
gsta
d C
HC
Genera
tor
4.
De
sig
n D
ocu
me
nta
tion
City
of M
atlo
san
a (N
W4
03)
M
ach
ine
ry a
nd
Equ
ipm
en
tC
HC
28
De
c 2
018
31
Ma
r 2
021
HF
RG
No
t pa
rt o
f a p
rog
ram
me
NW
Do
H 5
00
-
600
-
-
NW
Do
H/P
S/5
9/1
9S
tatu
tory
co
mp
lian
ce o
f UV
lig
hts
at H
osp
itals
an
d a
sse
ssm
en
t of O
HS
Co
mp
lian
ce2
. C
on
cep
tD
r K
en
net
h K
au
nda
Goo
ds
an
d S
erv
ice
sH
osp
itals
16
Oct
20
193
1 J
ul 2
020
HF
RG
No
t pa
rt o
f a p
rog
ram
me
NW
Do
H
200
50
150
-
-
NW
Do
H/P
S/1
06/
19
Re
furb
ish
Me
dic
al G
as S
yste
ms
4.
De
sig
n D
ocu
me
nta
tion
Dr
Ken
net
h K
au
nda
Goo
ds
an
d S
erv
ice
sH
osp
itals
29
Oct
20
193
1 M
ar
20
21H
FR
GN
ot p
art
of a
pro
gra
mm
eN
WD
oH
3 1
00
3
00
3 0
00
100
-
NW
Do
H/P
S/1
7/1
9M
oro
kw
en
g C
HC
Gen
era
tor
4.
De
sig
n D
ocu
me
nta
tion
Bra
y M
ach
ine
ry a
nd
Equ
ipm
en
tC
HC
28
De
c 2
018
31
Ma
r 2
021
HF
RG
No
t pa
rt o
f a p
rog
ram
me
NW
Do
H 3
50
-
350
-
-
NW
Do
H/P
S/2
1/1
9T
au
ng H
osp
ital G
en
era
tor
4.
De
sig
n D
ocu
me
nta
tion
Kag
isa
no
Mo
lop
o (
NW
39
7) M
ach
ine
ry a
nd
Equ
ipm
en
tH
osp
ital
28
De
c 2
018
31
Ma
r 2
021
HF
RG
No
t pa
rt o
f a p
rog
ram
me
NW
Do
H 1 5
00
-
1 5
00
-
-
NW
Do
H/P
S/2
2/1
9P
ud
um
oe
CH
C G
en
era
tor
4.
De
sig
n D
ocu
me
nta
tion
Le
kwa
Te
em
an
e (
NW
39
6) M
ach
ine
ry a
nd
Equ
ipm
en
tH
osp
ital
28
De
c 2
018
31
Ma
r 2
021
HF
RG
No
t pa
rt o
f a p
rog
ram
me
NW
Do
H 3
50
-
350
-
-
NW
Do
H/P
S/2
3/1
9C
oko
ny
an
ye
CH
C G
en
era
tor
4.
De
sig
n D
ocu
me
nta
tion
Le
kwa
Te
em
an
e (
NW
39
6) M
ach
ine
ry a
nd
Equ
ipm
en
tH
osp
ital
28
De
c 2
018
31
Ma
r 2
021
HF
RG
No
t pa
rt o
f a p
rog
ram
me
NW
Do
H 3
50
-
350
-
-
NW
Do
H/P
S/1
5/2
0B
ray
CH
C G
en
era
tor
4.
De
sig
n D
ocu
me
nta
tion
Ma
chin
ery
an
d E
qu
ipm
en
tC
HC
13
Fe
b 2
020
31
Ma
r 2
021
HF
RG
No
t pa
rt o
f a p
rog
ram
me
NW
Do
H 4
00
-
400
-
-
NW
Do
H/P
S/3
5/1
9S
we
ize
r R
en
eke
Ho
spita
l - R
efu
rbis
h H
VA
C4
. D
esi
gn D
ocu
me
nta
tion
Ma
mu
sa
Mu
nic
ipalit
yG
oo
ds
an
d S
erv
ice
sH
osp
ital
22
Ja
n 2
019
31
Ma
r 2
021
HF
RG
No
t pa
rt o
f a p
rog
ram
me
NW
Do
H 2 5
00
250
250
2 2
50
-
NW
Do
H/P
S/9
7/1
9C
hrist
iana
Ho
spita
l HV
AC
an
d R
efrig
era
tion
refu
rbis
me
nt
4.
De
sig
n D
ocu
me
nta
tion
Le
kwa
Te
em
an
e (
NW
39
6)G
oo
ds
an
d S
erv
ice
sH
osp
ital
18
Oct
20
193
1 M
ar
20
21H
FR
GN
ot p
art
of a
pro
gra
mm
eN
WD
oH
1 5
00
-
1 5
00
-
-
NW
Do
H/P
S/9
6/1
9Jo
e M
oro
long
Ho
spita
l - H
VA
C R
efu
rbis
hm
en
t4
. D
esi
gn D
ocu
me
nta
tion
Goo
ds
an
d S
erv
ice
s1
8 O
ct 2
019
31
Ma
r 2
021
HF
RG
No
t pa
rt o
f a p
rog
ram
me
NW
Do
H
3 0
00
-
3 0
00
-
-
NW
Do
H/P
S/0
2/2
0Jo
e M
oro
long
Ho
spita
l - R
ep
lace
pe
rime
ter
lights
3.
De
sig
n D
ev
elo
pm
en
tB
uild
ing
s a
nd
oth
er
fixe
d s
tru
ctu
res
12
Fe
b 2
020
31
Ma
r 2
021
HF
RG
No
t pa
rt o
f a p
rog
ram
me
NW
Do
H
3 4
50
-
3 4
50
-
-
NW
Do
H/P
S/9
5/1
9G
an
ye
sa H
osp
ital -
Re
furb
ish
me
nt o
f HV
AC
an
d
Re
frig
era
tion
3.
De
sig
n D
ev
elo
pm
en
tK
ag
isa
no
Mo
lop
o
Goo
ds
an
d S
erv
ice
sH
osp
ital
18
Oct
20
193
1 M
ar
20
21H
FR
GN
ot p
art
of a
pro
gra
mm
eN
WD
oH
1 5
00
-
1 5
00
-
-
NW
Do
H/P
S/6
0/1
9S
tatu
tory
co
mp
lian
ce o
f UV
lig
hts
at H
osp
itals
an
d a
sse
ssm
en
t of O
HS
Co
mp
lian
ce3
. D
esi
gn D
ev
elo
pm
en
tD
r R
uth
Seg
om
ots
i M
om
pa
tiG
oo
ds
an
d S
erv
ice
s v
16
Oct
20
193
1 J
ul 2
020
HF
RG
No
t pa
rt o
f a p
rog
ram
me
NW
Do
H 2
00
5
0
150
-
-
NW
Do
H/P
S/1
07/
19
Re
furb
ish
Me
dic
al G
as S
yste
ms
4.
De
sig
n D
ocu
me
nta
tion
Dr
Ru
th S
eg
om
ots
i M
om
pa
tiG
oo
ds
an
d S
erv
ice
sH
osp
itals
29
Oct
20
193
1 M
ar
20
21H
FR
GN
ot p
art
of a
pro
gra
mm
eN
WD
oH
1 7
50
3
00
1 4
50
-
-
To
tal
Re
furb
ish
me
nt
an
d r
eh
ab
ilit
ati
on
31
4 49
9
27
024
1
35
42
3
1
0 5
00
5 0
00
Seso
be
Clin
ic
3.
Re
furb
ish
me
nt
an
d r
eh
ab
ilit
ati
on
Ru
ste
nbu
rg (
NW
37
3)
Hos
pita
l
Ma
fike
ng
(NW
38
3)
Me
dic
al S
tore
s
Ra
mo
tsh
ere
Mo
iloa
Ho
spita
l
Ma
fike
ng
(NW
38
3)
Ho
spita
l
Dits
ob
tla (
NW
38
4) (
NW
38
4)H
osp
ital
City
of M
atlo
san
a (N
W4
03)
Hospital
Na
led
i (N
W3
92)
Hospital

Department of Health
130 N
WD
oH/0
04/1
3S
tatu
tory
Mai
nten
ance
- B
ojan
ala
5. W
orks
Boj
anal
aG
oods
and
Ser
vic
esH
ospi
tals
& P
HC
's01
Apr
201
631
Aug
202
3H
FR
GN
ot p
art o
f a p
rogr
amm
eN
WD
oH
35 3
35
20 8
92
2 7
19
2 2
50
2 7
38
NW
DoH
/PS
/03/
16G
ener
ator
s T
erm
Con
tract
Pha
se 1
- B
ojan
ala
5. W
orks
Goo
ds a
nd S
erv
ices
01 A
pr 2
016
30 N
ov 2
020
HF
RG
Not
par
t of a
pro
gram
me
NW
Do
H 4 9
24
1 8
07
465
-
-
NW
DoH
/PS
/23/
19G
ener
ator
s T
erm
Con
tract
Pha
se 2
- B
ojan
ala
5. W
orks
Goo
ds a
nd S
erv
ices
01 J
ul 2
019
31 A
ug 2
023
HF
RG
Not
par
t of a
pro
gram
me
NW
Do
H 5 2
50
-
1 3
95
1 8
60
1 9
80
NW
DoH
/PS
/006
/17
HV
AC
Ter
m C
ontra
ct-
Boj
anal
a 5.
Wor
ksB
ojan
ala
Goo
ds a
nd S
erv
ices
Hos
pita
ls &
PH
C's
01 J
ul 2
017
31 M
ay 2
023
HF
RG
Not
par
t of a
pro
gram
me
NW
Do
H 12 6
67
9
45
3 2
50
2 0
00
3 6
60
NW
DoH
/PS
/78/
19T
rans
form
er a
nd S
witc
hgea
r T
erm
Con
tract
-
Boj
anal
a 2.
Con
cept
Boj
anal
aG
oods
and
Ser
vic
esH
ospi
tals
& P
HC
's17
Oct
201
931
May
202
3H
FR
GN
ot p
art o
f a p
rogr
amm
eN
WD
oH
5 0
00
-
1 0
00
2 0
00
2 0
00
NW
DoH
/PS
/85/
19F
ire e
quip
men
t Ter
m C
ontra
ct -
Boj
anal
a 2.
Con
cept
Boj
anal
aG
oods
and
Ser
vic
esH
ospi
tals
& P
HC
's18
Oct
201
931
May
202
3H
FR
GN
ot p
art o
f a p
rogr
amm
eN
WD
oH
3 0
00
-
400
1 3
00
1 3
00
NW
DoH
/PS
/03/
20U
PS
Mai
nten
ance
Ter
m C
ontra
ct -
Boj
anal
a 2.
Con
cept
Boj
anal
aG
oods
and
Ser
vic
esH
ospi
tals
& P
HC
's12
Feb
202
031
May
202
3H
FR
GN
ot p
art o
f a p
rogr
amm
eN
WD
oH
5 0
00
-
400
500
1 3
00
NW
DoH
/PS
/01/
16D
ay to
day
mai
nten
ance
- B
ojan
ala
2. C
once
pt B
ojan
ala
Goo
ds a
nd S
erv
ices
Hos
pita
ls &
PH
C's
01 A
pr 2
016
31 A
ug 2
023
HF
RG
Not
par
t of a
pro
gram
me
NW
Do
H 19 0
27
11 2
50
2 5
41
2 5
41
2 6
95
NW
DoH
/PS
/01/
18K
oste
r H
ospi
tal M
aint
enan
ce2.
Con
cept
Kge
tleng
Riv
ier
(NW
374)
B
uild
ings
and
oth
er fi
xed
stru
ctur
esH
ospi
tal
01 S
ep 2
017
31 A
ug 2
022
HF
RG
Not
par
t of a
pro
gram
me
NW
Do
H 34 5
00
-
5 4
24
29 0
76
-
NW
DoH
/PS
/04/
18/B
JST
Hos
pita
l RA
MP
C5.
Wor
ksG
oods
and
Ser
vic
es6
Aug
201
831
Jul 2
021
HF
RG
Not
par
t of a
pro
gram
me
NW
Do
H 45 1
00
3 2
00
39 4
00
2 5
00
-
NW
DoH
/PS
/04/
18/C
JST
Hos
pita
l RA
MP
D1.
Initi
atio
nG
oods
and
Ser
vic
es6
Aug
201
830
Apr
202
2H
FR
GN
ot p
art o
f a p
rogr
amm
eN
WD
oH
26 2
00
200
3 0
00
11 8
82
1 0
00
NW
DoH
/PS
/32/
19M
oses
Kot
ane
Hos
pita
l Mai
nten
ance
Pha
se 2
1. In
itiat
ion
Mos
es K
otan
e (N
W37
5)
Bui
ldin
gs a
nd o
ther
fix
ed s
truct
ures
Hos
pita
l10
Dec
201
828
Feb
202
3H
FR
GN
ot p
art o
f a p
rogr
amm
eN
WD
oH
43 2
00
-
1 7
00
10 9
82
4 4
00
NW
DoH
/PS
/03/
18S
war
trugg
ens
Hos
pita
l Mai
nten
ance
1. In
itiat
ion
Sw
artru
ggen
s B
uild
ings
and
oth
er fi
xed
stru
ctur
esH
ospi
tal
01 S
ep 2
018
31 O
ct 2
023
HF
RG
Not
par
t of a
pro
gram
me
NW
Do
H 9 7
00
-
-
400
4 8
85
NW
DoH
/PS
/33/
19JS
T H
ospi
tal M
aint
enan
ce1.
Initi
atio
n R
uste
nbur
g (N
W37
3)
Bui
ldin
gs a
nd o
ther
fix
ed s
truct
ures
Hos
pita
l10
Dec
201
831
Oct
202
3H
FR
GN
ot p
art o
f a p
rogr
amm
eN
WD
oH
26 4
00
-
500
1 2
00
1 2
00
NW
DoH
/PS
/108
/19
Mai
nten
ance
on
prio
ritiz
ed c
linic
s -
Boj
anal
a2.
Con
cept
Boj
anal
aG
oods
and
Ser
vic
esC
linic
s5
Nov
201
931
Mar
202
1H
FR
GN
ot p
art o
f a p
rogr
amm
eN
WD
oH
7 5
00
-
2 5
00
2 5
00
2 5
00
NW
DoH
/005
/13
Sta
tuto
ry M
aint
enan
ce -
NM
M5.
Wor
ksN
gaka
Mod
iri M
olem
aG
oods
and
Ser
vic
esH
ospi
tals
& P
HC
's01
Apr
201
631
Mar
202
3H
FR
GN
ot p
art o
f a p
rogr
amm
eN
WD
oH
32 6
53
22 5
17
3 6
59
2 2
50
2 3
11
NW
DoH
/PS
/24/
19G
ener
ator
s T
erm
Con
tract
Pha
se 2
-
NM
M5.
Wor
ksN
gaka
Mod
iri M
olem
aG
oods
and
Ser
vic
esH
ospi
tals
& P
HC
's14
jan
2019
30 J
un 2
023
HF
RG
Not
par
t of a
pro
gram
me
NW
Do
H 7 0
00
1 1
90
1 8
90
1 8
90
1 8
70
NW
DoH
/PS
/007
/17
HV
AC
Ter
m C
ontra
ct
- N
MM
5. W
orks
Nga
ka M
odiri
Mol
ema
Goo
ds a
nd S
erv
ices
Hos
pita
ls &
PH
C's
01 J
ul 2
017
31 M
ay 2
023
HF
RG
Not
par
t of a
pro
gram
me
NW
Do
H 8 3
58
1 2
60
1 7
40
1 8
00
1 7
60
NW
DoH
/PS
/79/
19T
rans
form
er a
nd S
witc
hgea
r T
erm
Con
tract
-
NM
M2.
Con
cept
Nga
ka M
odiri
Mol
ema
Goo
ds a
nd S
erv
ices
Hos
pita
ls &
PH
C's
17 O
ct 2
019
31 M
ay 2
023
HF
RG
Not
par
t of a
pro
gram
me
NW
Do
H 5 0
00
-
1 0
00
1 5
00
2 0
00
NW
DoH
/PS
/86/
19F
ire e
quip
men
t Ter
m C
ontra
ct2.
Con
cept
Nga
ka M
odiri
Mol
ema
Goo
ds a
nd S
erv
ices
Hos
pita
ls &
PH
C's
18 O
ct 2
019
31 M
ay 2
023
HF
RG
Not
par
t of a
pro
gram
me
NW
Do
H 3 0
00
-
400
1 3
00
2 0
00
NW
DoH
/PS
/04/
20U
PS
Mai
nten
ance
Ter
m C
ontra
ct
- N
MM
2. C
once
ptB
ojan
ala
Goo
ds a
nd S
erv
ices
Hos
pita
ls &
PH
C's
12 F
eb 2
020
31 M
ay 2
023
HF
RG
Not
par
t of a
pro
gram
me
NW
Do
H 5 0
00
-
400
500
1 3
00
NW
DoH
/PS
/02/
16D
ay to d
ay m
ain
tenance -
NM
M5.
Wor
ksN
gaka
Mod
iri M
olem
aG
oods
and
Ser
vic
esH
ospi
tals
& P
HC
's01
Apr
201
631
Mar
202
3H
FR
GN
ot p
art o
f a p
rogr
amm
eN
WD
oH
17 5
83
12 1
25
2
425
2 5
00
2 6
00
NW
DoH
/PS
/29/
19M
aint
enan
ce L
ehur
utsh
e H
ospi
tal P
hase
22.
Con
cept
Ram
otsh
ere
Moi
loa
Bui
ldin
gs a
nd o
ther
fix
ed s
truct
ures
Hos
pita
l10
Dec
201
830
Sep
202
2H
FR
GN
ot p
art o
f a p
rogr
amm
eN
WD
oH
49 6
00
5 0
00
5
200
3 3
50
2 0
00
NW
DoH
/PS
/82/
19M
aint
enan
ce M
PH
Pha
se II
1. In
itiat
ion
Maf
iken
g (N
W38
3)
Bui
ldin
gs a
nd o
ther
fix
ed s
truct
ures
Hos
pita
l18
Oct
201
930
Sep
202
0H
FR
GN
ot p
art o
f a p
rogr
amm
eN
WD
oH
32 0
00
5 0
00
11 0
00
5 0
00
3 0
00
NW
DoH
/PS
/83/
19M
aint
enan
ce Z
eeru
st H
ospi
tal
1. In
itiat
ion
Ram
otsh
ere
Moi
loa
Bui
ldin
gs a
nd o
ther
fix
ed s
truct
ures
Hos
pita
l18
Oct
201
930
Sep
202
0H
FR
GN
ot p
art o
f a p
rogr
amm
eN
WD
oH
25 0
00
10 0
50
-
-
3 0
00
NW
DoH
/PS
/109
/19
Mai
nten
ance
on
prio
ritiz
ed c
linic
s -
NM
M2.
Con
cept
Nga
ka M
odiri
Mol
ema
Goo
ds a
nd S
erv
ices
Clin
ics
5 N
ov 2
019
31 M
ar 2
021
HF
RG
Not
par
t of a
pro
gram
me
NW
Do
H 1 6
50
7 5
00
2 5
00
2 5
00
2 5
00
NW
DoH
/007
/12
Sta
tuto
ry M
aint
enan
ce -
DR
KK
5. W
orks
Dr
Ken
neth
Kau
nda
Goo
ds a
nd S
erv
ices
Hos
pita
ls &
PH
C's
01 A
pr 2
016
31 M
ar 2
023
HF
RG
Not
par
t of a
pro
gram
me
NW
Do
H 29 0
52
19 7
45
3
177
2 2
50
2 9
39
NW
DoH
/PS
/25/
19G
ener
ator
s T
erm
Con
tract
Pha
se 2
-
DR
KK
5. W
orks
Dr
Ken
neth
Kau
nda
Goo
ds a
nd S
erv
ices
Hos
pita
ls &
PH
C's
14 ja
n 20
1931
May
202
3H
FR
GN
ot p
art o
f a p
rogr
amm
eN
WD
oH
4 0
00
1 0
50
1
620
1 6
20
2 5
00
NW
DoH
/PS
/008
/17
HV
AC
Ter
m C
ontra
ct
- D
R K
K5.
Wor
ksD
r K
enne
th K
aund
aG
oods
and
Ser
vic
esH
ospi
tals
& P
HC
's01
Jul
201
731
Mar
202
3H
FR
GN
ot p
art o
f a p
rogr
amm
eN
WD
oH
10 3
34
1 1
25
1 5
60
1 6
20
1 5
40
NW
DoH
/PS
/80/
19T
rans
form
er a
nd S
witc
hgea
r T
erm
Con
tract
-
DR
KK
2. C
once
ptD
r K
enne
th K
aund
aG
oods
and
Ser
vic
esH
ospi
tals
& P
HC
's17
Oct
201
931
May
202
3H
FR
GN
ot p
art o
f a p
rogr
amm
eN
WD
oH
5 0
00
-
1 0
00
1 5
00
2 0
00
NW
DoH
/PS
/87/
19F
ire e
quip
men
t Ter
m C
ontra
ct2.
Con
cept
Dr
Ken
neth
Kau
nda
Goo
ds a
nd S
erv
ices
Hos
pita
ls &
PH
C's
17 O
ct 2
019
31 M
ay 2
023
HF
RG
Not
par
t of a
pro
gram
me
NW
Do
H 3 0
00
-
400
1 3
00
1 3
00
NW
DoH
/PS
/05/
20U
PS
Mai
nten
ance
Ter
m C
ontra
ct
- D
R K
K2.
Con
cept
Boj
anal
aG
oods
and
Ser
vic
esH
ospi
tals
& P
HC
's12
Feb
202
031
May
202
3H
FR
GN
ot p
art o
f a p
rogr
amm
eN
WD
oH
5 0
00
-
400
500
1 3
00
NW
DoH
/PS
/15/
16D
ay to
day
mai
nten
ance
-
DR
KK
5. W
orks
Dr
Ken
neth
Kau
nda
Goo
ds a
nd S
erv
ices
Hos
pita
ls &
PH
C's
01 A
pr 2
016
31 M
ar 2
023
HF
RG
Not
par
t of a
pro
gram
me
NW
Do
H 15 6
43
10
632
2
787
2
662
2
850
NW
DoH
/PS
/17/
16 -
1M
aint
enan
ce o
n W
itran
d H
ospi
tal
5. W
orks
Tlo
kwe
(NW
402)
Bui
ldin
gs a
nd o
ther
fix
ed s
truct
ures
Hospita
l22
Sep
201
631
Mar
202
1H
FR
GN
ot p
art o
f a p
rogr
amm
eN
WD
oH
16 2
50
8 5
97
5
400
-
-
NW
DoH
/PS
/110
/19
Mai
nten
ance
on
prio
ritiz
ed c
linic
s3.
Des
ign
Dev
elop
men
tD
r K
enne
th K
aund
aG
oods
and
Ser
vic
esC
linic
s5
Nov
201
931
Mar
202
1H
FR
GN
ot p
art o
f a p
rogr
amm
eN
WD
oH
30 0
00
-
2 5
00
2 5
00
25 0
00
NW
DoH
/006
/12
Sta
tuto
ry M
aint
enan
ce -
RS
M
3. D
esig
n D
evel
opm
ent
Dr
Rut
h S
egom
otsi
Mom
pati
Goo
ds a
nd S
erv
ices
Hos
pita
ls &
PH
C's
01 A
pr 2
016
31 M
ar 2
023
HF
RG
Not
par
t of a
pro
gram
me
NW
Do
H 27 4
16
21 5
23
1
768
2 2
50
2 1
00
NW
DoH
/PS
/19/
16G
ener
ator
s T
erm
Con
tract
Pha
se 1
- R
SM
3.
Des
ign
Dev
elop
men
tG
oods
and
Ser
vic
es01
Apr
201
630
Nov
202
0H
FR
GN
ot p
art o
f a p
rogr
amm
eN
WD
oH
4 4
14
2 3
31
375
-
-
NW
DoH
/PS
/26/
19G
ener
ator
s T
erm
Con
tract
Pha
se 2
- R
SM
3.
Des
ign
Dev
elop
men
tG
oods
and
Ser
vic
es01
Jul
201
931
Aug
202
3H
FR
GN
ot p
art o
f a p
rogr
amm
eN
WD
oH
4 6
00
-
1
125
1 5
60
1 4
85
NW
DoH
/PS
/009
/17
HV
AC
Ter
m C
ontra
ct -
RS
M
3. D
esig
n D
evel
opm
ent
Dr
Rut
h S
egom
otsi
Mom
pati
Goo
ds a
nd S
erv
ices
Hos
pita
ls &
PH
C's
01 J
ul 2
017
31 M
ar 2
023
HF
RG
Not
par
t of a
pro
gram
me
NW
Do
H 6 4
00
8
65
1 2
60
1 3
44
1 2
96
NW
DoH
/PS
/81/
19T
rans
form
er a
nd S
witc
hgea
r T
erm
Con
tract
-
RS
M
3. D
esig
n D
evel
opm
ent
Dr
Rut
h S
egom
otsi
Mom
pati
Goo
ds a
nd S
erv
ices
Hos
pita
ls &
PH
C's
17 O
ct 2
019
31 M
ay 2
023
HF
RG
Not
par
t of a
pro
gram
me
NW
Do
H 5 0
00
-
1 0
00
1 5
00
2 0
00
NW
DoH
/PS
/88/
19F
ire e
quip
men
t Ter
m C
ontra
ct2.
Con
cept
Dr
Rut
h S
egom
otsi
Mom
pati
Goo
ds a
nd S
erv
ices
Hos
pita
ls &
PH
C's
18 O
ct 2
019
31 M
ay 2
023
HF
RG
Not
par
t of a
pro
gram
me
NW
Do
H 3 0
00
-
400
1 3
00
1 3
00
NW
DoH
/PS
/06/
20U
PS
Mai
nten
ance
Ter
m C
ontra
ct -
RS
M
2. C
once
ptB
ojan
ala
Goo
ds a
nd S
erv
ices
Hos
pita
ls &
PH
C's
12 F
eb 2
020
31 M
ay 2
023
HF
RG
Not
par
t of a
pro
gram
me
NW
Do
H 5 0
00
-
400
500
1 3
00
NW
DoH
/PS
/16/
16D
ay to d
ay m
ain
tenance -
RS
M
5. W
orks
Nal
edi L
ocal
Mun
icip
ality
Goo
ds a
nd S
erv
ices
Hospita
l01
Apr
201
631
Mar
202
3H
FR
GN
ot p
art o
f a p
rogr
amm
eN
WD
oH
14 7
62
11 5
90
2
029
2 5
50
2 6
00
NW
DoH
/PS
/30/
19M
aint
enan
ce a
t Tau
ng H
ospi
tal -
RS
M
2. C
once
ptK
agis
ano
Mol
opo
(NW
397)
Bui
ldin
gs a
nd o
ther
fix
ed s
truct
ures
Hospita
l10
Dec
201
831
Jul
202
2H
FR
GN
ot p
art o
f a p
rogr
amm
eN
WD
oH
36 8
00
-
2 7
76
11 7
00
22 0
00
NW
DoH
/PS
/114
/19
Sch
wei
zer
Rei
neke
Hos
p. C
ompl
ete
Mai
nten
ance
3. D
esig
n D
evel
opm
ent
Mam
usa
Mun
icip
ality
Bui
ldin
gs a
nd o
ther
fix
ed s
truct
ures
Hospita
l12
Nov
201
931
Mar
202
1H
FR
GN
ot p
art o
f a p
rogr
amm
eN
WD
oH
3 5
00
-
2 2
00
9
50
-
NW
DoH
/PS
/18/
16 -
3M
aint
enan
ce o
n T
lakg
amen
g C
HC
2. C
once
ptK
agis
ano
Mol
opo
(NW
397)
Bui
ldin
gs a
nd o
ther
fix
ed s
truct
ures
CH
C02
Feb
201
731
Mar
202
2H
FR
GN
ot p
art o
f a p
rogr
amm
eN
WD
oH
11 2
00
1 6
50
2 8
50
3 0
00
-
NW
DoH
/PS
/31/
19M
aint
enan
ce o
n G
any
esa
Hos
pita
l2.
Con
cept
Kag
isan
o M
olop
o (N
W39
7)B
uild
ings
and
oth
er fi
xed
stru
ctur
esH
ospita
l10
Dec
201
831
Jul
202
2H
FR
GN
ot p
art o
f a p
rogr
amm
eN
WD
oH
29 6
00
-
3 0
50
2 0
50
1 0
00
NW
DoH
/PS
/111
/19
Mai
nten
ance
on
prio
ritiz
ed c
linic
s -
RS
M
2. C
once
ptD
r R
uth
Seg
omot
si M
ompa
tiG
oods
and
Ser
vic
esC
linic
s5
Nov
201
931
Mar
202
1H
FR
GN
ot p
art o
f a p
rogr
amm
eN
WD
oH
6 5
00
-
2 5
00
2 5
00
1 5
00
NW
DoH
/PS
/45/
19
Min
or
Maite
nance o
f 18 c
linic
s b
y P
ublic
Work
s
5. W
orks
Various
Goo
ds a
nd S
erv
ices
Clin
ics
01 A
pr 2
019
30 M
ar 2
021
HF
RG
Not
par
t of a
pro
gram
me
NW
Do
H10 0
00
5 4
78
4 5
22
-
-
NW
DoH
/PS
/17/
15M
aint
enan
ce o
f Offi
ce P
ark
build
ing
4. D
esig
n D
ocum
enta
tion
Maf
iken
gB
uild
ings
and
oth
er fi
xed
stru
ctur
esO
ffice
01 A
pr 2
015
31 M
ar 2
023
HF
RG
Not
par
t of a
pro
gram
me
NW
Do
H 49 8
17
36 7
14
6
501
6 5
01
6 8
20
Tota
l M
ain
ten
ance
an
d r
epai
rs80
5 93
5
224
236
146
508
145
238
13
6 82
9
Tota
l In
fras
tru
ctu
re t
ran
sfer
s -
curr
ent
-
-
-
-
-
Tota
l In
fras
tru
ctu
re t
ran
sfer
s -
cap
ital
-
-
-
-
-
Tota
l In
fras
tru
ctu
re p
aym
ents
fo
r fi
nan
cial
ass
ets
Tota
l In
fras
tru
ctu
re l
ease
s
Gra
nt M
anag
emen
t3.
Des
ign
Dev
elop
men
tK
agis
ano-
Mol
opo
Goo
ds a
nd S
erv
ices
N/A
1 A
pr 2
015
31 M
ar 2
023
HF
RG
Not
par
t of a
pro
gram
me
NW
Do
H
114
960
93
492
3
4 00
0
36
000
36
000
Tota
l N
on
in
fras
tru
ctu
re11
4 96
0
93 4
92
34 0
00
36 0
00
36
000
Tota
l: H
ealt
h I
nfr
astr
uct
ure
6 07
9 22
4
1
589
881
59
7 15
8
58
0 59
8
613
906
Rus
tenb
urg
(NW
373)
Hos
pita
l
4. M
ain
ten
ance
an
d r
epai
rs
Boj
anal
aH
ospi
tals
& P
HC
's
9. N
on
in
fras
tru
ctu
re
Dr
Rut
h S
egom
otsi
Mom
pati
Hos
pita
ls &
PH
C's
5. I
nfr
astr
uct
ure
tra
nsf
ers
- cu
rren
t
6. I
nfr
astr
uct
ure
tra
nsf
ers
- ca
pit
al
7. I
nfr
astr
uct
ure
pay
men
ts f
or
fin
anci
al a
sset
s
8. I
nfr
astr
uct
ure
lea
ses