Vortex Penetration Depth of Organic Superconductors: I ...
16
Phys. Rev. Lett. I Vortex Penetration Depth of Organic Superconductors: %ECEIVFD Evidence for Vortex Lattice Meltin N. H. Tea,"'R. W. Giannetta,"' M. B. Salamon,"' J. M. Williams. (2), H. H. Wang,'" and U. Geiser, (21 JUL 29 1997 OSTI 'Department of Physics and The Science and Technology Center for Superconductivity, University of Illinois at Urbana-Champaign, 1 1 10 W. Green, Urbana, Illinois 61801 Chemistry and Materials Science Division, Argonne National Laboratory, Argonne, Illinois 60439 2 Abstract We observe a crossover field H* in the temperature and magnetic field dependence of the rf vortex penetration depth in K-(ET)~CU[N(CN)~]B~ for fikll6 - axis. We find that H* can be described quantitatively by the 3D Lindemann melting theory; thus, it corresponds to-. the melting of the vortex lattice in K-(ET)~CUW(CN)~]B~ and lies very close to the irreversibility line. In the vortex-liquid state, we argue that the saturation of the vortex penetration depth in a magnetic field results from the finite size of the sample. Our results do not have the scaling form predicted by the the Coffey-Clem model' in contrast to previous findings. PACS numbers: 74.60.Ge, 74.25.H, 74.70.G
Transcript of Vortex Penetration Depth of Organic Superconductors: I ...
Phys. Rev. Lett.
I
Vortex Penetration Depth of Organic Superconductors:
%ECEIVFD Evidence for Vortex Lattice Meltin
N. H. Tea,"'R. W. Giannetta,"' M. B. Salamon,"' J. M. Williams. (2), H. H. Wang,'" and U. Geiser, (21
JUL 2 9 1997 O S T I
'Department of Physics and The Science and Technology Center for Superconductivity, University of Illinois at Urbana-Champaign, 1 1 10 W. Green, Urbana, Illinois 61801
Chemistry and Materials Science Division, Argonne National Laboratory, Argonne, Illinois 60439
2
Abstract
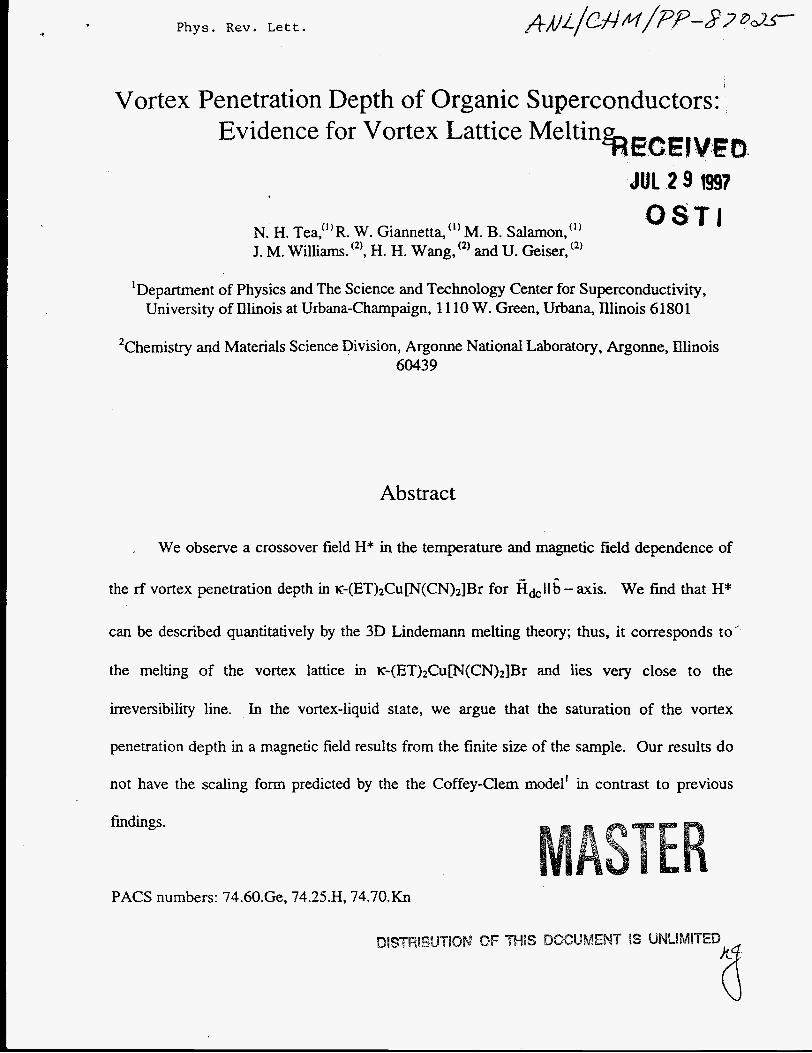
We observe a crossover field H* in the temperature and magnetic field dependence of
the rf vortex penetration depth in K-(ET)~CU[N(CN)~]B~ for fikll6 - axis. We find that H*
can be described quantitatively by the 3D Lindemann melting theory; thus, it corresponds to-.
the melting of the vortex lattice in K-(ET)~CUW(CN)~]B~ and lies very close to the
irreversibility line. In the vortex-liquid state, we argue that the saturation of the vortex
penetration depth in a magnetic field results from the finite size of the sample. Our results do
not have the scaling form predicted by the the Coffey-Clem model' in contrast to previous
findings.
PACS numbers: 74.60.Ge, 74.25.H, 74.70.G

Portions ofthis documat m ~ y be fliegible in tlectmnic image prodtlcts. Images sire produced 16pm the best available original dOCUIDmt

r ..
Many superconductors of current interest are highly anisotropic and in the extreme . type-I1 limit. Both cuprate high-temperature superconductors (HTSC) and many organic
superconductors are in h s class. In the HTSC case, theories and experiments have conf-med
the existence of a line in the field-temperature phase diagram along which the vortex lattice of
the mixed phase melts.24 Thermal fluctuations enhanced by the high T,, large anisotropy, and
quenched disorder: combine to destroy the long range order of the vortex lattice well below
the nominal upper critical field line, &z(T), leaving-a vortex-liquid state in which the vortices
move independently and the dc electrical resistance is finite. Even in N b with low T, = 9.2 K
and cubic symmetry, several recent experiments6 have indicated that vortex lattice melting
occurs below &2(T).
In this letter, we consider whether vortex lattice melting occurs in an organic
superconductor. Organic superconductors based on the ET electron-donor molecules, where
ET stands for bis(ethylenedithio)-tetratbiafulvalene, have transition temperatures roughly an
order of magnitude lower than the HTSC, yet they are are even more strongly in the type-II
limit. We report here measurements of the vortex penetration depth of the layered organic
compound, K-(ET)~CU[N(CN),]B~, that support the melting theory. At a fixed temperature,
we find that the field-dependent change of the penetration depth, Ah(H), for gk-L ac-planes
increases to a shoulder at low magnetic fields, and then rises rapidly to saturation at fields (< 1
T) much below I&(T). We define a crossover field H*(T) located near the shoulder and find
that it does not follow H* = ( ~ t ) ~ ~ , as would be expected if H* marks the the crossover from
a pinning dominated to a thermally activated flux-flow (TAFF) regime. We argue that the
crossover at H*(T) and the saturation of AX are strong indications of vortex lattice melting.
I
This new picture provides a natural explanation of the data that is more consistent with the
body of recent experimental work on other layered superconductors, and is the first
experimental evidence for vortex lattice melting in K-(ET)~CU[N(CN)~]B~. The Coffey-Clem
(CC) theory, that treats the electrodynamics of 3D Abrikosov vortices in a periodic potential
and includes the effect of thermal activation, has been employed previously to explain similar
data, but will be shown to be inconsistent with our results and with earlier magnetization data’
on a similar organic compound.
Our measurements were performed on a singlecrystal K-(ET)~CUW(CN),]B~
superconductor with dimensions 1.25 x 1 x 0.5 mm3. Its transition temperature at ambient
pressure is - 12 K and is the highest T, of any organic superconductor reported to date. The
initial discovery and crystal growth have been described elsewhere.8 The temperature and
magnetic field dependence of the rf penetration depth were measured with the use of an ultra-
stable tunneldiode resonator’ operating at a frequency of -10 MHz. In this technique, we
measure the shift in the oscillator frequency which is directly proportional to M(H,T). The
resonator has a frequency stability of 0.02 parts per million which corresponds to‘ a resolution’
of 0.2 Hz or -2 A. The rf field is always parallel to the conducting a-c planes and
perpendicular to the dc magnetic field. In this case, the supercurrent induced by the rf field
flows both in the plane and perpendicular to the plane so that h = (wht + thJ where w and t
are the width and the thickness of the sample respectively. We choose y = hJi+ - 29 which is
in the range of reported values 13 I y I 65 and w/t - 0.5; thus, we are measuring kl with
about 6.5% contribution from &.
2

Figure 1 shows AA(H,T) = h(H,T) - h(O,T) for gdC I ac-planes at various temperatures
below T,. Ail the data were taken after zero field cooling to avoid trapped flux; however, no
hysteresis was observed at any temperature upon increasing the field to 1 T and then returning
r
the field to zero. The overall behavior of Ah is similar at all temperatures. The lower critical
I field, Hcl, in our sample is very small; thus, there is no signature of crossing in our data.
Using the Ginzburg-Landau expression, we estimate poH$ = *In K = 7 x lo-’ T where 4 4
K = ?,/E, = 400 and h,. = 38 pm (Ref. 10); thus, we are always in the mixed state. In practice, it
is very difficult to measure H& because of the huge demagnetization effect.
In Fig. 2a, we plot M(H) and a(Al)/aH vs. H at T = 8 K. We define H* to be the
position of the peak in a(Ah)/aH and A.h*(T) = Ah(H*,T). The resultant H*(T) is plotted vs.
1-t, where t = T/Tc, on a logarithmic scale in Fig. 2b. The dashed line corresponds to H* - (1-
t)” as expected for the TAFF model, and clearly, H* does not follow the 3/2 power law of the
TAFF model, especially close to T,. We now consider whether H* represents the melting of
the vortex lattice. Experiments on HTSC find that the vortex lattice melting line Bm(T)
coincides with or lies very close to the so-called irreversibility line observed in dc-
magnetization measurements. S m a angle neutron scattering experiments3 on
Biz.,sSrl.ssCaCuZO8+, have provided direct observation of the melting of the vortex lattice; this
melting transition is found to be first order.4 In Fig. 2b, the squares are the values of Hm(T)
determined from dc-magnetization measurements by Lang, et al.” Within experimental error,
the data for Him(T) coincide with our results for H*(T). W-e therefore associate H*(T) in K-
3
(ET)2Cu[N(CN)2]Br with the melting of the vortex lattice and give the following justifkations.
1) For K-ET~CU[N(CN)~]B~, thermal fluctuations are important. The figure of merit for I
fluctuation effects is given by the Ginzburg number G = A(T,h2/-&)2 = AG’ where A is a
constant, h is the London penetration depth and y is the anisotropy. For K-
(ET)2Cu[N(CN)2]Br, b ( 0 ) = 5 A, CdO) = 37 A, 5 = ((1(0)&O))”3, h = (hl(0)&O))”3 =
12 pm, and y = 29, we findGbrganic - and
BSCCO (GLSCCO- 0.1); note that G’,Gmic - 101oG’m. However, the thermal energy
which lies between YBCO (G‘ma-
(-kBT) for K-(ET)~CU[N(GN)~]B~ is about one order of magnitude lower than the high-T,
superconductors. One may ask if the effect of thermal fluctuations is strong enough to destroy
the vortex lattice. The answer is affirmative because the vortex pinning strength in organic
superconductors is six to nine orders of magnitude weaker than in YBCO.’’ 2) K-
(ET)2Cu[N(CN)2]Br is strongly anisotropic (y = 29) due to its layered structure. 3) K h/5 =
400 so that K - ( E T ) ~ C ~ ~ ( C N ) ~ ] B ~ is an extreme type-II superconductor. Thus, the flux lines
are very elastic and can wander more easily. 4) Quenched disorder also helps to destroy the
long range order of the vortex lattice. Disorder plays a very important role in the
superconductivity of K-(ET)ICU(N(CN)~]B~. Kwok, et d.13 observed a reduction in T, by
about 10% from the disorder induced when they quenched their sample from room to helium
temperature in less than five minutes.
The superconducting-layer spacing of K-(ET)~CUW(CN)~]B~ is s = 15 A and, using the
BCS expression b(T)=0.7&(0)/[1-t]’” with b(0) = 5 A, we expect a 3D-2D crossover,
when ~ ( T Z D ) = s, which occurs at TzD = 0.93TC = 11.2 K. Thus, K-(ET)~CU[N(CN)~]B~
4

behaves as a quasi-2D superconductor over nearly the entire temperature range below T,.
However, this does not mean that the vortex structure in the mixed phase is two dimensional.
When a magnetic field is applied perpendicular to the layers in layered superconductors, an
c
individual vortex is composed of a stack of pancake vortices in the layers connected between
layers by Josephson v~rt ices . '~ In weak fields, the interplanar interaction (tilt modulus) of the
stack is larger than the intraplane interaction (shear modulus); hence, these pancake vortices
align themselves to form a 3D flux line. In the high-field regime, the planar interaction
between the pancake vortices dominates and the pancake vortices do not arrange in a straight
line, but form a zig-zag pattern. Thus, there is a change of vortex structure from a 3D pancake
flux line to 2D pancake vortices with little or no alignment. This dimensional change in vortex
pinning has been observed in the BSCCO supercond~ctor.~ Using the same criterion, we find
that the crossover field is roughly BZD = @,,/(sY)~ = 1.1 T for K-(ET)~CU[N(CN)~]B~, where we
take y = 29. Because our fields are less than 1 T, we are always in the 3D vortex limit, in
which case, the melting transition can be described by the Lindemann criterion. If H*(T) is
indeed the melting line, we should be able to fit it to the 3D melting function based on the-
Lindemann ~riterion, '~
where
5

and cL is the Lindemann number which is a constant -0.2. c
We take
Ai(') = h;(O) / d1- t n and allow n and y to vary. The fit of Eq. 1 to H*(T), which is shown
as the solid line in Fig.,2b, yields n = 5.62 and given the range of reported values for the in-
plane penetration depth 0.67 pm I &(O) 5 1.5 pm, the anisotropy is 13 I y I 65. For the
simple two-fluid model, n = 4 and Lee, et a.L3 and R. Cubitt, et a.L3 obtained n = 3.3 for
BSCCO. The value of y determined from microwave measurements is = 25." The anisotropy
is very sensitive to the mosaic spread of the sample and other imperfections and as a result, can
be a factor of 2 or more higher. Thus, the fitting parameters are in reasonable agreement with
2 4 other experiments. Since BLD = l l y hi,, the large in-plane L(0) and anisotropy of K-
(ET)2Cup(CN)2]Br push the melting line far below &2. This makes it plausible to associate
H*(T) with flux lattice melting for the organic superconductors.
We can now address the saturation of Ah at fields H* < H << Kz. In the melting
scenario, the flux lines form a lattice below H*(T) so that Ah represents the change in the
effective penetration depth, ?w, arising from the bending of the vortices. Above H*(T), where
the flux lines are in the liquid state, each flux line moves independently leading to a finite
electrical resistance. The corresponding rf skin depth hiq will be much larger than although
still less than the normal-state skin depth. Once &,q is greater than or equal to half the sample
thickness, w/2, the magnetic energy stored in the coil will not change with field. As a result,
we observe little frequency shift with increasing magnetic field, and Ak appears to saturate.
While our technique measures only the relative change of the frequency, we can roughly
calibrate the coil to give a measure of the actual Ah values. The largest frequency shift
6

observed is Af,, z 27 kHz at T = 5 K. Assuming the rf field to be uniform over the surface of
the sample, we equate the fractional change in frequency to the fractional change in the filling
of the coil, AfSat/fo = A&&;uN,,i, giving A L = 0.06 mm. The factor of two accounts for both
sides of the sample. The total kat(H, 5K) = h(5 K) + A L t = 0.10 mm which is about a half of
w/2 where hl(T = 5 K) = 0.04 mm (see Ref. 10). The conversion factor is then = 2.2 p&.
r
If we now set h(H > Hm, T) = w/2 at all temperatures, we can extract the actual
penetration depth from the expression h(H = 0, T) = Xl(T = 0) + [w/2 - A.h(H,T)]/2. Using
the above geometrical factor of 2.2 UmMi and assuming Xl(T = 0) = 38 pm (Ref. lo), we can
determine the absolute value of h(H = 0, T); we plot this in Fig. 3. One can test the prediction
using H* and h(H = 0, T) as extracted from the data. 1/4 1 of Eq. 1, that h, = Bo 3D (t B, 1
The solid Line is a guide to the eyes; clearly, h(H = 0, T) is consistent with Eq. 1, lending
further support for vortex lattice melting in K-(ET)~CU[N(CN)~]B~. We can also estimate the
anisotropy from the slope of Fig. 3,B;I4 ; the value of y obtained is = 23 which is consistent
with y from our fit of H* to Eq. 1.
Finally, we comment on the purported scaling behavior of the vortex penetration depth.
Sridhar, et al.16 argued that Ah(T,H)/AA*(T) is a universal function of H/H* where M*(T) is a
temperature-dependent flux-flow skin depth, and they demonstrated that this form is contained
within the CC theory. Within the CC theory, the scaling form Ah(T,H)/Ah*(T) = f(wt,,, wH*)
is valid only for T << Tc, where the normal skin depth is much greater than the London
penetration depth. In Fig. 4, we test this scaling relation at seven temperatures. While Sridhar,
et al. found this scaling to hold for K-(ET)~CU(NCS)~ in the range 5 K < T I Tc (= 8.9 K), our
7

data do not collapse into a single curve over similar temperature range. Sndhar, et al. chose
H* and A.h* near the saturation value, and because their data do not give a clear indication of
the Crossover fields, reasonable data collapsing is possible. Mansky, et al.' also observed the
shoulder features similiar to ours in K-(ET)~CU(NCS)~ using ac-magnetization measurements.
Perhaps the data of Sridhar, et al. do not show clear evidence of the melting line due to
stronger pinning by defects. While the CC theory is able to explain the electrodynamics of 3D
Abrikosov vortices, it does not include the possibility of flux-lattice melting; therefore, it is not
applicable close to the melting line.
r
In summary, we have measured the temperature and magnetic field dependence of the
effective penetration depth in the mixed state of K-(ET)~CU@(CN)$~ for gk I ac-planes and
have shown that the crossover field H* is quantitatively consistent with the 3D Lindemann
melting theory. Our result is significant because it is the first experimental evidence for vortex
lattice melting in the ET family of organic superconductors. We do not find the scaling
behavior as reported previously16 and suggest that the Coffey-Clem theory must be modified to
account for pancake vortices and the melting of the vortex lattice in layered superconductors.
NHT would like to thank Stuart DeSoto, Keith O'Hara, M. W. Coffey, and Margaret
Hubbard for many helpful discussions. This work was supported by the National Science
Foundation (NSF) Grant No. DMR 89-20538 and NSF Grant No. STC 88-09854 through the
Science and Technology Center for Superconductivity (NHT, RWG, and MBS) and by the
Department of Energy, Division of Materials Research under Contract No. W-3 1-109-ENG-38
(HHW, UG, and JMW).
8

References c
1. M. W. Coffey and J. R. Clem, Phys. Rev. Lett. 67,386 (1991).
2. D. J. Bishop, et al., Science 255,165 (1992).
3. R. Cubitt, et al.) Nature 365,407 (1993).
S. L. Lee, et al., Phys. Rev. Lett. 71,3862 (1993).
K. Harada, et al., Phys. Rev. Lett. 71,3371 (1993).
4. E. Zeldov, et al., Nature 375,373 (1995).
5. D. S . Fisher, et al., Phys. Rev. B 43, 130 (1991).
6. J. W. Lynn, et al., Phys. Rev. Lett. 72, 3413 (1994).
M. F. Schmidt, et al., Phys. Rev. Lett. 70,2162 (1993).
7. P. A. Mansky, et al., Phys. Rev. B 50, 15929 (1994).
8. A. M. ani, et al., Inorg. Chem. 29,2555 (1990).
9. C. Van DeGrift, Rev. Sci. Instrum. 46,599 (1975).
10. M. Dressel, et al., Phys. Rev. B 50, 13603 (1994).
1 1 . M. Lang, et al., Phys. Rev. B 49, 15227 (1994).
12. D-H. Wu and S. Sridhar, Phys. Rev. Lett. 65, 2074 (1990). They found that the pinning constants for YBCO are K; = 2 x lo5 N/m2 and KB- 2 x lo" N/m2. In Ref. 7, the pinning
constants for organic superconductors are K~ = lo4 N/m2 and K~ = 5 x II 1 N/m2.
13. VI. K. Kwok, et al., Phys. Rev. B 42, 8686 (1990).
14. G . Blatter, et al, Rev. Mod. Phys. 66, 1125 (1994).
15. A. Houghton, et al., Phys. Rev. B 40,6763 (1990).
16. S. Sridhar, et al., Phys. Rev. Lett. 68, 2220 (1992).
9

. Figure Captions . c
Fig. 1. A plot of AX(H, T) VS. H of K - ( E T ) ~ C U ~ ( C N ) ~ ] B ~ (T, - 12 K) for GdC 1 planes at various ternperatures4.2,4.6,5,5.5,6,6.5,7,7.5,8,9,9.5, 10, 10.5, 11, 11.5, 13 K.
Fig. 2. (a) Determination of pJ3*(T) from the peak position of d(M)/dH. (b) Open circle is a plot of pJ-I* at several temperatures below T,. Open square is Bin(T) from Ref. 11. The dashed line is a fit of p.,,H* = ( l-t)3R to the data (open circles). The solid line is a fit to the 3D melting function (Eq. 1 in text).
Fig. 3. A plot of AL(T, H = 0) vs. (t2bH*)-1’4, see text for detail.
Fig. 4. A plot of L\;L(T, H)/Ah*(T) vs. WH* for several temperatures below T,.
DISCLAIMER
This report was prepared as an account of work sponsored by an agency of the United States Government. Neither the United States Government nor any agency thereof, nor any of their employees, makes any warranty, express or implied, or assumes any legal liability or responsi- bility for the accuracy, completeness, or usefulness of any information, apparatus, product, or process disclosed, or represents that its use would not infringe privately owned rights. Refer- ence herein to any specific commercial product, process, or service by trade name, trademark, manufacturer, or otherwise does not necessarily constitute or imply its endorsement, recom- mendation, or favoring by the United States Government or any agency thereof. The views and opinions of authors expressed herein do not necessarily state or reflect those of the United States Government or any agency thereof.
10

30000
25000
e 20000 cn Y .I
C 3
d el W
5000
5000
0
0.0 0.2 0.4 0.6 0.8 1 .o 1.2
H (T)

30000
25000
20000
15000
10000
5000
0
- I I I I
0.0
1 00
IO- ’
10-2
I 0-3
104
t
0.2 0.4 0.6 0.8
1 e+6
1 e+6
8e+5
. 6e+5
. 4e+5
- 2e+5
- Oe+O 1 .o
0.01 0.10 1 .oo log( 14)

n E
F 0
I f I x
2 U
W
60
55
50
45
40
35
30
T = 1 1 K
1.4 1.6 1.8 2.0 2.2 2.4 2.6 2.8 3.0 3.2 3.4 3.6 (t2p,H*)-”4 (T -1 /4 )

c
2.0
1.8 -
1.6 -
1.4 -
1.2 -
1.0 -
0.8 -
0.6
0.4
0.2
* . . . . . . . . . * . . . . .
0.0 0 2 3
wH*
4
4.2K 5K 6K 7K 8K 9K 1 OK
5 6