NASA TM-108852: Parametric study on laminar flow for finite wings at supersonic speeds

NASA/TP-2003-211950
Vortex Flows at Supersonic Speeds
Richard M. Wood, Floyd J. Wilcox, Jr., Steven X. S. Bauer, and Jerry M. AllenLangley Research Center, Hampton, Virginia
March 2003
The NASA STI Program Office . . . in Profile
Since its founding, NASA has been dedicated to the advancement of aeronautics and space science. The NASA Scientific and Technical Information (STI) Program Office plays a key part in helping NASA maintain this important role.
The NASA STI Program Office is operated by Langley Research Center, the lead center for NASA
’
s scientific and technical information. The NASA STI Program Office provides access to the NASA STI Database, the largest collection of aeronautical and space science STI in the world. The Program Office is also NASA
’
s institutional mechanism for disseminating the results of its research and development activities. These results are published by NASA in the NASA STI Report Series, which includes the following report types:
•
TECHNICAL PUBLICATION. Reports of completed research or a major significant phase of research that present the results of NASA programs and include extensive data or theoretical analysis. Includes compilations of significant scientific and technical data and information deemed to be of continuing reference value. NASA counterpart of peer-reviewed formal professional papers, but having less stringent limitations on manuscript length and extent of graphic presentations.
•
TECHNICAL MEMORANDUM. Scientific and technical findings that are preliminary or of specialized interest, e.g., quick release reports, working papers, and bibliographies that contain minimal annotation. Does not contain extensive analysis.
•
CONTRACTOR REPORT. Scientific and technical findings by NASA-sponsored contractors and grantees.
•
CONFERENCE PUBLICATION. Collected papers from scientific and technical conferences, symposia, seminars, or other meetings sponsored or co-sponsored by NASA.
•
SPECIAL PUBLICATION. Scientific, technical, or historical information from NASA programs, projects, and missions, often concerned with subjects having substantial public interest.
TECHNICAL TRANSLATION. English-language translations of foreign scientific and technical material pertinent to NASA
’
s mission.
Specialized services that complement the STI Program Office
’
s diverse offerings include creating custom thesauri, building customized databases, organizing and publishing research results . . . even providing videos.
For more information about the NASA STI Program Office, see the following:
•
Access the NASA STI Program Home Page at
http://www.sti.nasa.gov
•
Email your question via the Internet to [email protected]
•
Fax your question to the NASA STI Help Desk at (301) 621-0134
•
Telephone the NASA STI Help Desk at (301) 621-0390
•
Write to:NASA STI Help DeskNASA Center for AeroSpace Information7121 Standard DriveHanover, MD 21076-1320

National Aeronautics andSpace Administration
Langley Research CenterHampton, Virginia 23681-2199
NASA/TP-2003-211950
Vortex Flows at Supersonic Speeds
Richard M. Wood, Floyd J. Wilcox, Jr., Steven X. S. Bauer, and Jerry M. AllenLangley Research Center, Hampton, Virginia
March 2003
Available from:
NASA Center for AeroSpace Information (CASI) National Technical Information Service (NTIS)7121 Standard Drive 5285 Port Royal RoadHanover, MD 21076-1320 Springfield, VA 22161-2171(301) 621-0390 (703) 605-6000
Acknowledgments
The authors would like to thank Mr. Peter Covell and Dr. James Campbell of NASA LaRC for their contributionsof photographic material used in this paper. Their assistance is greatly appreciated and is respectfully acknowledged.
The authors would also like to thank the research and technical staff assigned to and those who supported theresearch conducted at the NASA LaRC UPWT from 1970 to 1990. Their professionalism and support are greatlyappreciated and are respectfully acknowledged.
iii
Contents
Abstract ................................................................................................................................................................ 1Introduction.......................................................................................................................................................... 1Nomenclature....................................................................................................................................................... 2Background and History...................................................................................................................................... 3
High-Speed Wing and Wing-Body Vortex Flows ......................................................................................... 4Flow Classification..................................................................................................................................... 5
High-Speed Missile Vortex Flows ................................................................................................................. 5Other High-Speed Vortex Flows .................................................................................................................... 6Low-Speed Vortex Flows ............................................................................................................................... 6
Recent Supersonic Research at Langley Research Center ................................................................................ 6Resultant Vortex Structures ............................................................................................................................ 6
Flat Plates and Cavities .............................................................................................................................. 7General Description of Cavity Flow Fields .......................................................................................... 7Flow Visualization of Cavity Flow Fields ............................................................................................ 8
Surface Flows on Cavity Floor ......................................................................................................... 8Off-Surface Cavity Flow Fields...................................................................................................... 10
Bodies and Missiles .................................................................................................................................. 12Axisymmetric Body ............................................................................................................................. 12Nonaxisymmetric Body ....................................................................................................................... 13
Wings and Aircraft ................................................................................................................................... 14Sharp Leading-Edge Wings................................................................................................................. 14
Interfering Vortex Structures .......................................................................................................... 15Blunt Leading-Edge Wings ................................................................................................................. 15Multibody Aircraft ............................................................................................................................... 16
Designed Vortex Structures .......................................................................................................................... 17Fundamental Aerodynamic Characteristics of Delta Wings................................................................... 17Vortex Flow Characteristics of Delta Wings........................................................................................... 18
Zero-Thick Wings ................................................................................................................................ 18Thick Wings ......................................................................................................................................... 19Cambered Wings.................................................................................................................................. 20
Wing Design ...................................................................................................................................................... 22Design Philosophy ........................................................................................................................................ 22Design Observations ..................................................................................................................................... 23Design Approach........................................................................................................................................... 23Design Results............................................................................................................................................... 24
Concluding Remarks ......................................................................................................................................... 24References.......................................................................................................................................................... 25Tables ................................................................................................................................................................. 34Figures................................................................................................................................................................ 39

Abstract
A review of research conducted at the National Aeronautics andSpace Administration (NASA) Langley Research Center (LaRC) intohigh-speed vortex flows during the 1970s, 1980s, and 1990s is presented.The data are for flat plates, cavities, bodies, missiles, wings, and aircraftwith Mach numbers of 1.5 to 4.6. Data are presented to show the typesof vortex structures that occur at supersonic speeds and the impact ofthese flow structures on vehicle performance and control. The data showthe presence of both small- and large-scale vortex structures for a vari-ety of vehicles, from missiles to transports. For cavities, the data showvery complex multiple vortex structures exist at all combinations of cav-ity depth-to-length ratios and Mach numbers. The data for missiles showthe existence of very strong interference effects between body and/or finvortices. Data are shown that highlight the effect of leading-edge sweep,leading-edge bluntness, wing thickness, location of maximum thickness,and camber on the aerodynamics of and flow over delta wings. Finally,a discussion of a design approach for wings that use vortex flows forimproved aerodynamic performance at supersonic speeds is presented.
Introduction
After a half century of high-speed vortex flowresearch there still exists a need for a thoroughunderstanding as well as an efficient predictioncapability of three-dimensional separated flows(vortex) at supersonic speeds. The extensiveamount of previous research has contributedgreatly to understanding these complex flowstructures; however, in order to support the designof future aerospace vehicles, which is the primaryaim of aerodynamics according to Kucheman1978 (ref. 1), design guidelines and tools must beavailable.
Research remains focused on the same threevehicle types as that which guided previous ef-forts in the 1960s and 1970s. These vehicles aresupersonic cruise aircraft (ref. 2), missiles (ref. 3),and reentry/blunt bodies (ref. 3). In addition tothe similarity in vehicle focus, there is also greatsimilarity in the design approach used for eachvehicle type. In fact, many of the present designsare derivatives of the preferred shapes from the1960s and 1970s. Despite significant focus bythe research community on the vortex flow forthese vehicles, the design approach has remainedfocused on maximizing attached flow at all flightconditions. The design philosophy continues toonly grudgingly accept separated flows (vortex),
with an assumed penalty, at off-design conditions.It is clear from recent design efforts that we haveyet to step out of the design assumptions and con-straints of the 1960s in order to explore newdesign concepts that exploit vortex flows forimproved aerodynamics.
Research into vortex flows at supersonicspeeds began in the 1940s with the initial researcheffort being directed toward simple bodies andwings (refs. 4–29). This work was an effort tosupport the exploration of supersonic flight forrockets, missiles, and aircraft, such as the X-15(ref. 30). In the late 1950s and early 1960s, thestudy of hypersonic reentry vehicles began tocontribute to the body of knowledge in high-speedvortex flows (ref. 31); as a result, the envelope ofresearch was extended well into the hypersonicregime. By the 1970s, there was a significantresearch effort within the United States aerospacecommunity that focused toward aerothermody-namic issues, such as those related to the lee-sidevortex flows on the Space Shuttle (refs. 30 and31). Also, in the 1960s and 1970s, there was arenewed focus on leading-edge vortex sheddingon slender vehicles configured for supersoniccruise flight. This research was conducted at asimilar level of urgency in both the United Statesand Europe due to the desire to develop the firstcommercially viable supersonic civil transport

2
aircraft (ref. 30). The 1980s brought a refocus onthe aerothermodynamics of hypersonic flight withthe National Aero-Space Plane (NASP) Program(ref. 30). The late 1980s and the 1990s againbrought focus on supersonic flight with the High-Speed Research (HSR) Program (ref. 2). In the1990s, there was also a renewed interest in hyper-sonic lifting bodies as evident by the new series ofX planes (ref. 31). In addition to these researchactivities, there has also been significant effortdirected toward supersonic military aircraft andmissiles. Examples of these vehicles include thecentury series fighters, SR-71, as well as allpresent day fighters and missiles (ref. 30).
This paper focuses on vortex structures as theyrelate to aerospace vehicle design. Specifically,this paper reviews the research conducted intohigh-speed vortex flows during the 1970s, 1980s,and 1990s at the National Aeronautics and SpaceAdministration (NASA) Langley Research Center(LaRC). During this time period, there was asignificant effort to improve the aerodynamics ofa variety of vehicles: the research community atNASA LaRC explored the off-body flow field ofaerospace vehicles at supersonic speeds. Theseinvestigations made extensive use of on-body andoff-body flow visualization test techniques and asa result the majority of the data presented in thispaper is primarily comprised of qualitative visu-alization information. This paper shows bothpublished and unpublished experimental data forflat plates, cavities, bodies, missiles, wings, andaircraft. However, in order to place NASALaRC’s recent high-speed research into perspec-tive, the first section of the paper provides ahistorical review of the extensive body of high-speed vortex flow research from the 1940s to thepresent. Also presented in this initial section is abrief review of the low-speed vortex flowresearch at NASA LaRC in the 1960s and 1970s(ref. 32).
Nomenclature
AR wing aspect ratio, b2/S
b wing span, in.
c wing reference chord, in.
CD drag coefficient, Drag/qS
CL lift coefficient, Lift/qS
CL,α lift-curve slope at 0° angle of attack
Cl rolling moment coefficient, Rollingmoment/qSb
Cm pitching moment coefficient, Pitchingmoment/qSc
CN normal force coefficient, Normal force/qS
CNF missile fin normal force coefficient
Cp surface static pressure coefficient
CFD computational fluid dynamics
DVS design vortex structure
d missile body diameter, in.
HSR high-speed research
h cavity reference height, in.
L reference length or cavity length, in.
LaRC Langley Research Center
L/D lift-drag ratio
LE leading edge
LEX leading-edge extension
L/h length-to-height ratio
M Mach number
MN component of Mach number normal to
wing leading edge, M cos ΛLE (1 +
sin2 α tan2 ΛLE)1/2
M∞ free-stream Mach number
NASA National Aeronautics and SpaceAdministration
NASP National Aero-Space Plane
NFW natural flow wing
psfa pounds per square foot, absolute

3
R Reynolds number
RVS resultant vortex structure
rpm revolutions per minute
S reference area, in2 (= wing planform areafor wings and aircraft, = body cross sec-tional area for missiles)
trap trapezoidal
UPWT Unitary Plan Wind Tunnel
U∞ free-stream velocity, ft/sec
w cavity width, in.
x axial distance, in.
y span distance, in.
yv spanwise position of vortex core, in.
z vertical distance, in.
α angle of attack, deg
αN angle of attack normal to wing leading
edge, tan−1 (tan α /cos ΛLE)
β Mach number parameter, (M2 − 1)1/2
δ fin deflection angle, positive leading edgeup, deg
δF wing leading-edge flap deflection, posi-
tive leading edge down, deg
δROLL differential canard deflection angle, (port
canard deflection angle) - (starboard ca-nard deflection angle), deg
η local semispan position, y/(b/2)
ηV vortex action line, yv/(b/2)
Λ, ΛLE wing leading-edge sweep angle, deg
φ roll angle, deg
°F degree Fahrenheit
Background and History
Within nature many mechanisms exist thatensure our environment consists of smooth andcontinuous fields of fluid and energy. These natu-rally occurring flow-control mechanisms exist atall scales and in all fluid and energy media. Anexample of these mechanisms is an expansion fanin a high-speed fluid flow that is analogous to thediffraction of energy at a physical discontinuityfor an electromagnetic energy wave. For fluids,one of the most dramatic and powerful mecha-nisms is the vortex. The vortex is also one of themost consistently occurring fluid flow features innature.
A vortex is created whenever a moving fluidencounters an abrupt discontinuity or whenever astationary fluid is abruptly impacted by a movingboundary. This discontinuity or boundary maytake the form of a physical surface, interactingfluids, or an abrupt gradient (temperature, veloc-ity, pressure, density, or other flow parameter) inthe parent fluid. Whatever the cause, the resultingflow feature is a coherent, viscous structurewithin the parent body of fluid in which the fluidelements have angular velocities with orientationsthat vary over 360°. Though simple in definition,the vortex can be a contradiction in its existence.When a vortex is formed, it can be powerful,benign, stable, unstable, and forgiving. All vortexstructures have the unique capability to addenergy to the local flow; they can also serve asa dividing boundary between two regions ofdissimilar structured flow. The vortex maybe thought of as nature’s flow-control devicebecause of its ability to reduce or eliminate largeflow fluctuations, flow gradients, and flowseparations.
Vortices may be both naturally occurring orman-made. Naturally occurring vortex structuresare observed within the universe in the form of aspiral galaxy (fig. 1), on other planets as evidentby Jupiter’s Great Red Spot (fig. 2), and in a vari-ety of very large-scale atmospheric structures onEarth such as hurricanes and tornadoes (fig. 3).Naturally forming vortex structures also exist assmall-scale fluid structures such as an eddy that

4
may occur near a rock in a brook or in the wakeof an oar. Large eddies or whirlpools are seenin a fast moving river rapid and the famous“Maelstrom Whirlpool” off the Lofoten Islands,Norway. Nature has also managed to integratevortex flows into the life of various living things.These vortex structures enhance the flight per-formance of birds and insects and the swimmingperformance of fish and mammals. However, theone common characteristic in each of these natu-ral vortex structures is that they are all low-speedflows (i.e., velocities below the speed of sound).
Man-made vortex structures can exist as bothlow-speed and high-speed phenomena, wherehigh speed is defined as velocities greater than thespeed of sound. Man-made vortex structures mayalso be divided into two categories: (1) thoseresulting from man’s interaction with the envi-ronment—we shall refer to these as a resultantvortex structure (RVS), and (2) those that aredesigned to perform a prescribed function byman—we shall refer to these as a design vortexstructure (DVS). Common RVSs are the whirl-pool in your sink and the tip vortex from the wingof an aircraft, as seen in figure 4 (ref. 33). Thesetwo RVSs can be contrasted with common DVSssuch as the whirlpool in your toilet bowl and thenew generation of cyclone-type vacuum cleanerson the market today. Engineers have used DVSsto perform a variety of functions from particleseparation (ref. 34) to correcting aircraft flightstability and control issues for military fighteraircraft at low speed and high angles of attack(refs. 32, 35, and 36).
The previous discussion reviewed the diversevortex structures used by man and those thatoccur in nature. One of the most diverse envi-ronments in which vortex structures are observedis within the aerospace community wherein asingle aerospace vehicle may have low-speed,high-speed, resultant, and design vortex struc-tures. A review of the literature shows that thediversity in observed vortex structures on aero-space vehicles is independent of vehicle flightspeed. To focus the discussion, the remainder ofthis paper concentrates on man-made vortexstructures occurring about aircraft at high speed
(supersonic). Not discussed are hypersonic flowsand associated aerothermodynamic effects. Alsonote that data and flow visualization images pre-sented within the paper are all time averaged (i.e.,steady state).
To assist the reader in interpreting the infor-mation presented, a cross-reference between thereferences cited in the paper and the associatedfigures is contained in table 1.
High-Speed Wing and Wing-Body VortexFlows
Vortex flows at supersonic speeds have beenstudied for over half a century by many recogniz-able aerodynamicists including: Jones 1947a(ref. 4), 1947b (ref. 5); Stanbrook 1959 (ref. 37);Squire 1960 (ref. 38); Stanbrook and Squire 1964(ref. 39); Kucheman 1962 (ref. 40), 1971 (ref. 41),1965 (ref. 42), 1978 (ref. 1); von Karman 1962(ref. 43); Squire 1967 (ref. 44), 1976 (ref. 45),1963 (ref. 46), 1976 (ref. 47); Peake and Tobak1982 (ref. 48), 1980 (ref. 49); Tobak and Peake1982 (ref. 50). While most of the early investiga-tions were motivated by the design of efficientsupersonic vehicles (refs. 51–97), it is interestingto note that, with the exception of Maskell(ref. 25) and Kucheman (ref. 1), vortex flowswere not viewed as desirable flow types buta resultant phenomenon that must be managedat off-design conditions. Both Kucheman andMaskell recognized that the separated vortex flowabout a slender aircraft satisfies all of the neces-sary requirements and criteria for efficient aircraftdesign (ref. 1).
The historical body of data for wings andbodies is immense and covers a broad range ofgeometries and flow conditions. Summary dis-cussions of most of these data are presented inreferences 35, 48, 49, and 98–101. A review ofthese data shows that all man-made vortex struc-tures related to aircraft fall into two broad classesas discussed by Smith in 1975 (ref. 102). Thefirst class is sharp-edge separations, such as thatfrom a sharp forebody chine or sharp leading edgeof a swept wing, as in figure 5. The second gen-eral class is associated with smooth-wall vortex
5
structure, such as that from an axisymmetric bodyat high angle of attack (fig. 6). The smooth-walltype also includes the vortex structures emanatingfrom wing-body junctures and other smooth-wallprotuberances. Note the separation patterns pre-sented in figures 5 and 6 as reflecting the conicalnature of vortex separation at supersonic speeds.
The sketch shown in figure 5 is for a thin,sharp-edged delta wing at angle of attack. A re-view of the sharp-edge separation sketch showsthat the secondary vortex structures are smooth-wall separation types. As noted in the figure, theprimary separation line is at the sharp leadingedge of the wing with a primary reattachment linelocated along a straight line that emanates fromthe apex and lies inboard of the wing leadingedge. Inboard of the primary reattachment linethe flow direction on the surface is streamwisewhile outboard of the primary reattachment linethe flow is spanwise. The spanwise flow is accel-erated under the primary vortex and then under-goes an abrupt recompression and eventualsmooth-wall type separation, then forms the sec-ondary vortex. As shown in the figure, thissmooth-wall separation point is labeled the sec-ondary separation line. Outboard of the smooth-wall vortex is a secondary reattachment line. Thispattern of smooth-wall vortex and flow reattach-ment has been observed to repeat itself outboardof the secondary vortex and result in a tertiarysmooth-wall vortex.
The sketch in figure 6 is for a slender cone(smooth wall) at angle of attack and shows that asmooth-wall vortex is generated from a shock-boundary layer interaction. The sketch in figure 6shows that all separations, including secondaryand tertiary vortex flows, are of the smooth-walltype. For the situation depicted in figure 6, thesmooth-wall vortex results from the flow on thewindward side of the body expanding around thesides to the leeward side of the body and eventu-ally recompressing and turning streamwise. Asthe angle of attack is increased, the recompressionbecomes more abrupt; a shock is formed and theflow separates and forms a vortex. This is theprimary separation line. Inboard of the primary
separation line is the primary reattachment line.The resultant surface flow directions andsecondary separation characteristics are similar tothe sharp-edge separation discussed previously.Additional detailed discussions and explanationsof these two flow separation types are found innumerous reports (see refs. 49 and 50).
Flow Classification
An area of particular interest that has receivedmuch focus over the past 30 years is in the classi-fication of vortex flows on the lee side of deltawings. Several of the first efforts were by Leein 1955 (ref. 8), Squire (ref. 38), Sutton (ref. 103),and Hall and Rogers (ref. 20) in 1960. Squire’sresearch in 1960 (ref. 38) is very noteworthy inthat he was able to define the boundary betweenattached and separated flow as a function of Machnumber and angle of attack (see fig. 7). Addi-tional classification work has been reported bySquire, Jones, and Stanbrook in 1963 (ref. 47);Squire in 1976 (ref. 45); Szodruch in 1978(ref. 104); and Szodruch and Peake in 1980(ref. 105). With each subsequent effort, therewere additional flow types defined as shown infigure 8. In the 1980s, the work of Miller andWood in 1984 (ref. 106) and Wood in 1985(refs. 107–109) and 1987 (ref. 110), as depicted infigure 9, connected and refined the variousboundaries. In 1987, Ganzer (ref. 111)—and in1989, Covell (ref. 112)—extended the flow classi-fication boundaries of Miller and Wood on the leeside of delta wings to higher angles of attack andMach numbers. Additional discussion and detailof the flow classification efforts at LaRC are pre-sented later in this paper.
High-Speed Missile Vortex Flows
The high-speed vortex flow research related tomissiles has been focused on developing an un-derstanding of the interference effects betweenbody and fins. This focus was driven by the needto eliminate uncertainty in the control lawsand flight characteristics. Early missile researchfocused primarily on isolated axisymmetric

6
bodies, such as Allen in 1951 (ref. 21) and Rogersin 1952 (ref. 27), in which there were one or twopairs of vortex structures. In the 1960s and1970s, nonaxisymmetric bodies with a limitednumber of fins were investigated (refs. 113, 114,and 115); these concepts would have three or fourpairs of vortex structures. By the 1980s, vortex-flow research for missiles investigated both axi-symmetric and nonaxisymmetric bodies with fiveto six pairs of vortex structures. Examples ofthese studies are the work of Allen in 1979 and1983 (refs. 116 and 117).
Other High-Speed Vortex Flows
With the exception of a laminar boundarylayer, vortex structures exist in most flow fields.This is especially true for aircraft at high speeds.A brief review of the literature shows that in ad-dition to the investigation of large-scale vortexstructures there has also been a wide variety ofresearch into much smaller scale structures. Anexample of these efforts includes research ofboundary layer instabilities (ref. 18), vortex gen-erators (refs. 118, 119, and 120), and wing-bodyjuncture flows (refs. 37 and 121). Research hasalso been conducted on vortex breakdown(ref. 122), vortex flow asymmetry (ref. 123), andvortex/shock interaction (refs. 124 and 125) atsupersonic speeds.
Low-Speed Vortex Flows
Over the same time period the high-speed re-search was performed, there was an equal numberof investigations into low-speed vortex flows.The main difference between the two researchefforts is that a primary focus of the low-speedresearch has been in the use of vortex flows toimprove aerodynamic performance (ref. 32). Thelow-speed community focused on the use of vor-tex flow to improve the low-speed aerodynamicefficiency of slender aircraft and lifting-bodyvehicles as well as to improve the maneuverabil-ity of fighters at high angles of attack (ref. 35).There have been a number of documents summa-rizing the low-speed vortex flow and separated-flow research efforts from the 1950s to 1980s (seerefs. 49, 50, and 126–128).
Recent Supersonic Research atLangley Research Center
From 1970 to the 1990s, researchers at LaRCwere actively involved in the experimental studyof vortex structures at supersonic speeds asa means to improve vehicle performance andmaneuverability (refs. 129–148). This section ofthe paper summarizes the body of work at LaRCwith a view toward vehicle design and flow con-trol. A review of the types of resultant anddesigned vortex structures at supersonic speedswill be presented as well as a discussion on thebenefits of these flow structures to vehicle per-formance. The information presented will coversmall- and large-scale structures for a variety ofvehicles from missiles to transports. The paperpresents an extensive amount of flow visualiza-tion data with some supporting pressure data andforce and moment results. The data to bepresented have been obtained in the LaRCUnitary Plan Wind Tunnel (UPWT), which is acontinuous flow, variable pressure, supersonicwind tunnel. The tunnel contains two test sectionsthat are approximately 4 ft square and 7 ft long.Each test section covers only part of the Machnumber range of the tunnel. The nozzle ahead ofeach test section consists of an asymmetric slidingblock that allows continuous Mach numbervariation during tunnel operations from 1.5 to 2.9in the low Mach number test section (#1) andfrom 2.3 to 4.6 in the high Mach number testsection (#2). A complete description of thefacility can be found in reference 149.
Resultant Vortex Structures
The research emphasis at LaRC during thistime period has been on developing a thoroughunderstanding not only of the aerodynamics ofhigh-speed vehicles but also of the associatedflow features and mechanisms that produce theresultant aerodynamics (refs. 129–138). In the1970s and 1980s, the only tool available for thesestudies was the wind tunnel. Through the use ofvarious test techniques, the aerodynamicist couldexplore the aerodynamics and fluid dynamics ofaerodynamic concepts and components. In the

7
1990s, computational methods have become con-tributors to the investigation of these flow fields(refs. 58, 64, 72, 76, 77, 95, 109, 122, and 123);however, the wind tunnel remains the primaryexploratory tool.
Computational fluid dynamics (CFD) can beused to predict when a vortex will be generatedand to track the vortex downstream (the velocityvector’s direction, or spin, is maintained fardownstream of the generation of the vortex);however, the vortex will dissipate very rapidlyunless a great deal of care is used to adapt thevolume grid to cluster points in the vicinity of thevortex. Therefore, CFD should be used as aqualitative tool for tracking vortices and can onlybe used as a quantitative tool near the vortex gen-eration point.
The efforts to understand fluid dynamics aswell as aerodynamics have been driven by theneed for additional types of data to support thedevelopment of advanced computational tools. Attimes the efforts have been driven by the devel-opment of advanced computational tools in orderto support specific design and analysis needs.
As mentioned previously, the flow about anyvehicle will usually contain one or more resultantvortex structures that may or may not contributeto the resultant aerodynamics. However, throughthe routine use of various flow visualization tech-niques to explore the flow fields, an improvedunderstanding of vortex flow physics and inter-fering flow fields has been developed. As a re-sult, the aerodynamic community is betterequipped to both routinely account for the effectsof vortex flows in the analysis of aerodynamicdata and include vortex flow effects in the designprocess.
To provide insight into the diversity of vortexstructures that are present at high speed, reviewsof typical resultant vortex structures about flatplates and cavities, bodies and missiles, and wingsand aircraft are presented in the following sec-tions. Flow visualization data will be the primaryformat, but where appropriate, pressure and forcedata are shown to reflect the impact of the vortex
structure on the aerodynamic behavior of thevehicle.
Flat Plates and Cavities
Around 1980, LaRC began studying problemsrelated to the carriage and release of weaponsfrom aircraft at supersonic speeds. These studieswere in support of the development of a super-sonic cruise fighter aircraft. One of the earlystudies showed that the separation characteristicsof a store exiting a cavity were primarily a resultof the cavity flow field (ref. 139). Because of thesignificant influence of the cavity flow field onthe store separation characteristics, a series ofstudies were initiated to document the flow fieldinside cavities in order to better understand storeseparation characteristics. The results of thesestudies showed that even simple rectangular boxcavities located in a flat plate have complicatedthree-dimensional flow fields containing multiplevortices. The remainder of this section describessome of the studies conducted at LaRC to under-stand cavity flow fields at supersonic speeds.
General Description of Cavity Flow Fields.Before describing the nature of vortex flows incavities, it is sometimes helpful to describe thegeneral nature of cavity flow fields. Numerousstudies have been performed and reported in theliterature that define the basic differences betweenthe flow fields of shallow and deep cavities atsupersonic speeds (refs. 140–147). These flowfields have been termed closed- and open-cavityflow and correspond to flows in shallow and deepcavities, respectively. The type of flow field thatexists has been shown to depend primarily on thecavity length-to-height ratio (L/h). The flow fieldof cavities with L/h >~ 13 is generally referred toas closed-cavity flow and is characterized by aflow that separates and expands over the cavityleading edge, impinges and attaches to the cavityfloor, then separates and exits at the rear of thecavity (see fig. 10). The corresponding pressuredistribution shows a decrease in pressure at theforward section of the cavity as the flow separatesand expands into the cavity, an increase in pres-sure as the flow impinges on the cavity floor, apressure plateau as the flow passes along the

8
cavity floor, and an increase in pressure as theflow exits ahead of the rear face. For cavitieswith L/h <~ 10, the flow field is generally referredto as open-cavity flow and is characterized by aflow that passes over the cavity without anyappreciable expansion into the cavity (see fig. 10).Typical pressure distributions show a slight posi-tive pressure coefficient over most of the cavityfloor with a slight increase in pressure at the rearof the cavity caused by flow impingement at thetop of the cavity rear face. Cavities with openflow typically have flow-induced pressure oscil-lations. This aeroacoustic effect can producetones severe enough to cause damage to the air-craft structure, store structure, or electronicequipment.
Cavity flows that exist in the region betweenopen- and closed-cavity flow (10 <~ L/h <~ 13) aregenerally referred to as transitional cavity flows.Transitional cavity flow can be divided into twoseparate types of flow: transitional closed andtransitional open. If the L/h of a cavity withclosed flow is decreased, eventually the impinge-ment shock and exit shock will collapse and forma single shock wave. The corresponding pressuredistribution shows a low-pressure region at theforward section of the cavity as the flow separatesand expands into the cavity with a steady increasein pressure toward the rear of the cavity. Thistype of flow field is referred to as transitionalclosed flow (see fig. 10). As the L/h of the cavityis reduced still further, the high-pressure region atthe rear of the cavity vents to the low-pressureregion at the forward section of the cavity, thenabruptly switches the flow field so that the singleshock wave present for transitional closed flowvanishes, thereby indicating that the flow does notimpinge on the cavity floor. For this case, theflow is turned through a series of expansion andcompression waves and the flow field is referredto as transitional open-cavity flow (see fig. 10).The pressure distribution generally shows a slightnegative pressure coefficient at the forward sec-tion of the cavity, which indicates that the flow ispartially expanding into the cavity; the pressurethen increases steadily toward the rear of the cav-ity but does not reach as high a peak at the rear ofthe cavity as the transitional closed-flow case. It
should be emphasized that the L/h values usedabove to describe the various flow fields are onlygeneral guidelines for estimating the type of flowfield that exists for a given cavity. Because pres-sure distributions in the cavity are used to definethe cavity flow fields, they are one of the bestmethods for determining the type of flow fieldthat exists in a given cavity.
Flow Visualization of Cavity Flow Fields. Vari-ous types of flow visualization have been used todocument the surface flow and off-surface flowfields of cavities. These techniques includeschlieren, vapor screen, oil flow, and coloredwater flow.
The results describing the surface flow fieldsof cavities using a colored-water technique andthose describing the off-surface flow fields usinga vapor-screen technique are discussed in thissection.
Surface Flows on Cavity Floor. During onecavity flow-field test, water was injected throughpressure measurement orifices located on themodel surface in an attempt to visualize vorticesthat typically form above certain cavityconfigurations. Because of the low static pressurein the tunnel, it was anticipated that the waterwould vaporize as it exited the orifice and theresulting vapor would be entrained into thevortices and render them visible. This techniquedid not work, and the water instead flowed alongthe model surface. Although the water wasdifficult to discern against the model surface, itwas obvious that the water was being entrained bythe model surface flows and had a fast response tothe cavity flow unsteadiness. This impetus led tothe development of a technique that uses coloredwater as a medium to visualize surface flows overwind tunnel models (ref. 148).
The colored-water surface-flow visualizationtechnique basically involves injecting coloredwater through the pressure measurement orificetubes installed in a wind tunnel model. The col-ored water exits the orifices and flows along themodel surface to form streaklines. The resultingflow patterns are then photographed. For the test

9
data presented, colored water was injectedthrough pressure orifices located along the floorof the cavity and on the flat plate surface ahead ofthe cavity.
The wind tunnel model used in this investiga-tion (fig. 11) consisted of a rectangular box cavitymounted in a flat plate. The rear face of the cav-ity was attached to a remotely controlled electricaldrive mechanism that allowed the rear face tomove and thus vary the length of the cavity whilethe tunnel was in operation. The cavity height (h)and width (w) were 0.5 in. and 2.5 in., respec-tively, and were held constant throughout theentire test while the cavity length (L) was variedfrom 12 in. to approximately 0.5 in. The cavityleading edge was 10.4 in. aft of the flat plateleading edge. The boundary layer on the platewas turbulent, having been tripped at the plateleading edge with sand grit. All of the tests wereconducted with the cavity at an angle of attackand sideslip of 0°.
The test results presented in this section of thepaper were conducted at the conditions shown intable 2 in the low Mach number test section of theUPWT (ref. 149). The model was verticallymounted in the wind tunnel to allow video andstill photographic data to be obtained through thetest section windows. Because the model wasvertically mounted, gravity forces could influencethe colored-water streaklines. However, resultsfrom the test showed that water injected on theflat plate surface flowed in essentially a straightline, thus indicating a negligible influence ofgravity forces. The model was painted white forgood contrast with the colored water and wasilluminated with three flood lamps.
Shown in figure 12 is a series of photographsacquired as the cavity length was decreased at aMach number of 1.50. Also included in figure 12are sketches of the streaklines indicating thedirection of flow. The free-stream flow is fromleft to right and the scale located on the flat plateabove the cavity indicates the cavity length ininches. Colored water was injected from twoorifices located on the flat plate ahead of thecavity and from three orifices located on the cav-
ity floor approximately 3 in. aft of the forwardface. For the cavity with L/h = 24.0 (closedflow), the streaklines on the flat plate surfacecurve into the forward section of the cavity andindicate that the flow is expanding into the low-pressure region. At the rear of the cavity, thesestreaklines curve away from the cavity as the flowexits from the high-pressure region. On the cavityfloor, two vortices have formed ahead of the rearface as indicated by a merging of the center cavityfloor streaklines with each of the two side cavitystreaklines. Note, the water color for thesestreaklines (yellow—middle orifice, blue—outside orifices) was chosen so that as the streak-lines merged to form vortices, a new color (green)was formed. The formation of new colors fromthe merging of flows greatly enhances the dataanalysis. The upper vortex has a counterclock-wise rotation and the lower vortex has a clock-wise rotation. As the cavity length is reducedfrom L/h = 24.0 to L/h ≈ 17, these vortices main-tain the same rotation direction. At L/h ≈ 13, thevortices start to dissipate and begin to form in theopposite direction as indicated by the smallamount of green water moving up the center ofthe cavity. The flow pattern on the floor of thecavity represents the starting point of these vortexstructures. As the cavity length is reduced stillfurther, but before the vortices can completelyform in the opposite direction, the flow field rap-idly switches from transitional closed to openflow (L/h ≈ 12); the streaklines on the cavity floorflow upstream and the streaklines on the flat platesurface do not curve into the cavity.
Shown in figure 13 is a set of photographsillustrating cavity surface flows at a Mach numberof 2.16. The primary difference between the re-sults at Mach 1.50 and 2.16 is in the details of theformation of the vortices at the rear of the cavity.For L/h = 24.0 (closed flow), the two vorticesahead of the rear face have the same rotationdirection as the Mach 1.50 case. However, incontrast to the M∞ = 1.50 case, some of theblue/green water has broken away from the vor-tices and entered the yellow colored water at therear of the cavity, indicating that the vortices arestarting to form in the opposite direction. As thecavity L/h is decreased to approximately 17, the

10
two vortices at the rear of the cavity have dissi-pated and two new vortices, that together span theentire cavity width, have formed. These two newvortices have rotation in the opposite direction tothe original vortices. At an L/h of approximately14, these two vortices cover nearly one half of theentire cavity floor. Decreasing the cavity lengthstill further to an L/h of approximately 13, theflow rapidly switches from transitional closedto open flow and the blue and yellow waterstreaklines flow upstream. The flow reversalindicates that a large recirculation region existsinside the cavity for open flow.
Figure 14 shows a close-up of the rear portionof the cavity for L/h = 24.0 at both M∞ = 1.50 and2.16. These photographs illustrate the significanteffect of Mach number on the cavity flow field.Yellow tinted water is being injected from anorifice located on the cavity floor 3.25 in. down-stream of the cavity forward face and blue tintedwater is being injected 0.50 in. forward of the rearcavity face. At both Mach numbers, the bluetinted water from the rearmost orifice flows up-stream and merges with the yellow tinted center-line water flow before being entrained into thevortices at the edges of the cavity. The flowfields at these two conditions are very similar; theprimary difference is the spreading of the center-line flow field at a cavity length between 9.5 and10.0 in. At M∞ = 2.16, the mixing of the yellowand blue water to form green occurs in a bluntcurved area near the L = 9.75 in. point. Incontrast, at M∞ = 1.50, the mixing of the yellowand blue water occurs at a sharp point nearL = 10.0 in. The spreading of the flow atM = 2.16 is the start of the vortices that eventuallyform in the opposite direction to the edge vorticesas the cavity length is decreased.
Vortices can also form at the forward sectionof the cavity. Figure 15 shows colored-watersurface flows at the forward section of the cavityat M∞ = 1.50 for two different L/h values that arein the open-cavity flow region. For the L/h ≈ 10case, blue tinted water was injected from an ori-fice on the cavity floor 1.75 in. aft of the forwardface. The water flows upstream and forms twocounterrotating vortices in the corners behind the
cavity forward face. As the cavity length wasdecreased further to an L/h of approximately 2.2,the two counterrotating vortices have each splitinto two counterrotating vortices for a total offour vortices that span the cavity width. The bluetinted water for this case was injected 2 in. aheadof the cavity on the flat plate surface.
Figures 12–15 illustrate some of the complexvortical surface flows in cavities at supersonicspeeds. Even though the exact cause or causes ofthese vortices are basically unknown, it is clearthat their impact on cavity aerodynamics and storeseparation from the cavities can be significant.
Off-Surface Cavity Flow Fields. The vapor-screen technique has been used to visualize off-surface flows in cavities. This technique consistsof injecting water into the tunnel circuit until afog is formed in the test section. The fog is aresult of the water vapor condensing as the statictemperature of the air decreases in the expandingflow of the tunnel nozzle. A thin light sheet ispassed across the test section illuminating the fog.Figure 16 shows a sketch of the vapor-screenapparatus as set up in the UPWT. Typically, thelight sheet remains stationary while the model istraversed longitudinally through the light sheet.In recent years, a laser-based system generatedthe light sheet instead of a Mercury vapor lamp,which was used routinely in years past. Photo-graphs of the fog and light sheet are recorded witha still camera located inside the test section ormounted on the tunnel access doors. A completedescription of the vapor-screen technique used inthe UPWT is presented in reference 150.
Two types of flow phenomena that can bevisualized with the vapor-screen technique areshock waves and vortices. Shock waves are re-vealed by the variation of the illuminated lightsheet intensity. Vortices are revealed by darkareas where no particulates exist to reflect lightfrom the light sheet.
Shown in figure 17 are vapor-screenphotographs illustrating both open- and closed-cavity flow (ref. 146). The model used for these

11
tests was a flat plate with a cavity mounted in thecenter of the plate and is similar to the plate usedin the colored-water flow photographs shown inthe previous section. The cavity was 12 in. long,2.5 in. wide, and the height was 1.88 in. and0.50 in. for the open- and closed-cavity flowcases, respectively. The photographs view thecavity from downstream of the model lookingupstream. Four photographs are presented foreach case at four longitudinal locations alongthe cavity length. For the open-cavity flow case(L/h = 6.4), no vortices or shock waves are visiblealong the entire length of the cavity. In contrast,at x = 6.0 in. for the closed-cavity flow case(L/h = 24.0), two well formed vortices havedeveloped along the cavity edges. These vorticesare a result of the flow expanding into the cavityat the cavity sharp leading edge and along thecavity sharp side edges just downstream of theforward cavity face. The colored-water flowphotograph in figure 13 for L/h = 24.0 shows thered tinted water, which was injected on the flatplate surface ahead of the cavity, curving into thecavity, thus illustrating how the sharp-edgevortices actually develop. In addition to the edgevortices at x = 6.0 in., the impingement shock thatforms as the flow impinges on the cavity floor canalso be seen. At x = 12 in., which is at the cavityrear face, the two edge vortices are still presentand both the impingement and exit shocks can beseen. Downstream of the cavity on the flat platesurface at x = 14 in., the edge vortices can still beseen although they are starting to dissipate. Thesevapor-screen photographs illustrate the complexthree-dimensional flow field of cavities.
The vortices that form along the cavity sharpedges for closed flow, as shown in the vapor-screen photographs, can affect the pressuredistributions on the cavity rear face. Shown infigure 18 are lateral pressure distributions acrossthe rear face of a cavity at four L/h values(ref. 140). These data were obtained on the sameflat plate used in the colored-water flowphotographs. To vary the cavity L/h, the cavitylength was varied while the cavity heightremained constant. At an L/h of 24.0 and 16.0,the cavity flow field would have closed flow. Thedata for these two cases show significant lateral
pressure gradients across the rear face. Thesepressure gradients are generally symmetricalabout the cavity centerline with the peak pressuresoccurring off the cavity centerline. Reference 140attributes these gradients to the impingement ofthe cavity-edge vortices on the rear face. Incontrast, the data for L/h = 4.0 show a muchreduced pressure level and smaller gradients thanfor the closed-flow cases. At L/h = 1.0, the lateralpressure gradients have essentially disappeared.
Vapor-screen photographs have also beenobtained in a cavity with a generic ogive cylinderinside the cavity (ref. 151). The purpose of thistest was to provide a database on a generic storeseparating from a generic weapons bay. Fig-ure 19 shows a schematic of the model mountedin the UPWT test section. The cavity was locatedin a flat plate that was vertically mounted andspanned the entire test section from floor toceiling. The cavity was 5.768 in. wide, 29.362 in.long, and 2.432 in. high. The store was mountedon the tunnel model support system, which hasthe capability to traverse the test section from sideto side thereby moving the model into and out ofthe cavity. The store was 24.028 in. long and1.20 in. in diameter with an ogive nose radiusof 11.51 in. Figure 20 shows vapor-screenphotographs of the cavity with and without doorsat M∞ = 2.65 with L/h = 12.07. For the casewithout doors, two well formed sharp-edgevortices can be seen at the cavity side edge. Inaddition, one of two smooth-wall vortices on thestore can be seen. The vortices on the store arecaused by the flow expanding into the cavity,which places the store in a localized upwashregion. In other words, the store appears to be atan angle of attack. The second vapor-screenphotograph shows the cavity with doors. Thedoors are opened parallel to the cavity sidewallsand are half as tall as the cavity width so that ifthey were closed the cavity would be covered.The results for this case are similar to the doors-off case except that the cavity side-edge vorticeshave been replaced by vortices emanatingfrom the outer edges of the cavity door. Thesmooth-wall vortices on the store are also betterdefined than the no doors case. These vapor-screen photographs illustrate the resultant vortex

12
structures inside cavities that can have asignificant influence on the separation charac-teristics of stores as they exit the cavity.
Bodies and Missiles
In this section of the paper, vortex patterns andtheir measured effects on the aerodynamics ofbodies and missiles are examined. The vorteximages shown here are from vapor-screen imagestaken at supersonic speeds from tests in theUPWT. The material presented starts with simpleshapes and effects and transitions to more com-plex geometries and flow fields. All flow visuali-zation data presented in this section have beenobtained with the vapor-screen flow visualizationtechnique discussed previously.
Axisymmetric Body. The vortex structuresobserved on bodies and missiles include bothsmooth-wall and sharp-edge separation on thebodies and sharp-edge separation on the missilefins. For the present discussion forward-body finsare labeled canards, mid-body fins are labeledwings, and aft-body fins are labeled tails.
Figure 21 shows a simple axisymmetric bodywith cruciform wings mounted in the UPWThigh-speed test section. The flow-field images onthis model were obtained in support of the studydocumented in reference 152. The model hasbeen painted black to prevent reflection from thelaser light sheet that was used to make the vorteximages visible. Also shown in this figure are aceiling-mounted still camera and a strut-mountedvideo camera that were used to record the vapor-screen images.
Tests on this model were performed with andwithout the wings attached. Figure 22 shows acomposite of three vapor-screen images at differ-ent longitudinal stations on the body withoutwings. These data are for Mach 2.5 and 14° angleof attack. Two symmetric body (smooth-wall)vortices can be seen that originate on the nose andcontinue to grow down the length of the body.The feeding sheet, which permits these vortices tocontinue to grow, can also be seen.
Figure 23 shows this configuration with thewings attached at a roll angle of 0° (tails in +orientation) for the same test conditions as thoseof figure 22. Note that the horizontal wings breakup the feeding sheet for the body vortices, whichno longer continue to grow over the rest of thebody. The horizontal wings themselves develop avortex along the leading edge (sharp-edge separa-tion) that becomes detached downstream of thewing trailing edge. Note that only the flowstructures on the left-hand side of the model arevisible because the vertical wings block the laserfrom illuminating the right-hand side of themodel. The top and bottom (vertical) wings pro-duce no vortices because they are not at incidenceto the oncoming flow at this roll angle. The lastimage (x/L = 0.96) shows that at the base of thebody there are two body vortices that appearsmaller than those on the body alone. Thereduced size of the body vortices is a result oftheir feeding sheet being cut by the wing. Thisimage also shows two stronger sharp-edge vor-tices that originate from the horizontal wings.
Figure 24 shows data from a tail-body con-figuration similar to those shown in figure 23.The data illustrate the effects that the body vor-tices can have on the tail loads (ref. 153). Thisfigure shows the measured normal force coeffi-cient on a single tail as it is rolled from windwardto leeward at three angles of attack. The Machnumber is 2.0 and there are no tail deflections.The dotted circle highlights the region of forcereversal due to these interfering vortex flows.Note that when the tail orientation approaches aroll angle of 180° at α = 20°, the normal force onthe tail becomes negative, that is, in the down-ward direction even though the configurationangle of attack is 20°. This force reversal effectoccurs when the tail is rotated to a location thatpositions body vortices on the lower surface ofthe tail. This effect is not present in the α = 5°data because the body vortices are too weak atthis angle of attack. Also, the effect is greatlyreduced at α = 35° because the vortices havemoved far enough away from the body that theyhave a smaller effect on the tails. These dataemphasize the importance of designing the body

13
and tails to maximize positive vortex-interferenceeffects.
Figure 25 shows a photograph of a variant ofthe Sidewinder missile model mounted in theUPWT low-speed test section. Data from thismodel are used to illustrate canard-tail vortex-interference effects that can occur even at lowangles of attack. Figure 26 shows the rollingmoment on this configuration for a −10° canardroll deflection (5° on each horizontal canard).Data are shown for several tail fin spans, includ-ing tail off. The Mach number is 2.5 and the con-figuration roll angle is 0° (ref. 154). For the tail-off case, the canard deflections produce a rollingmoment coefficient on the entire configuration ofabout −1.1. For the tail-on case the data showthat as tail span increases, the configuration roll-ing moment control authority decreases at lowangles of attack and changes sign near α = 0° forthe larger tails. (It should be noted that tail size Cis close to the size of the current Sidewinder mis-sile tail fins.) Thus, the canards produce both adownwash and an upwash as well as a vortex flowfield that interacts with the tails at low angles ofattack to produce a tail rolling moment oppositeto that generated by the canards. For the largertail sizes, the vortex-induced rolling momentnegates the rolling moment input from thecanards, and near α = 0°, a small rolling momentin the opposite direction is produced.
The next three figures (figs. 27–29) showvapor-screen vortex images on a Sparrow missilemodel at Mach 2.36 with no wing or tail deflec-tions. These images are taken from refer-ence 116. Figure 27 shows the longitudinal vor-tex development on the configuration at α = 11.4°and a roll angle of 0°. This figure shows a vortexpattern similar to that seen on the missile modelshown in figures 22 and 23. This pattern of vor-tex structure remains unchanged as the vorticesflow aft over the tail fins. Figure 28 shows theeffects of roll angle on this configuration. Vor-tices that were not present on the upper and lower(vertical) wings at a 0° roll angle show up as rollangle increases. The vortex pattern is asymmetricfor φ = 22.5° but becomes symmetric again aboutthe vertical plane at φ = 45°. Now, however, vor-
tices are visible from all four forward wings aswell as from the body. Figure 29 shows theeffects of angle of attack on the size of the vor-tices for this configuration at the base of the bodyat a roll angle of 0°. The vortices get larger withincreasing angle of attack but move farther awayfrom the body.
Figure 30 shows a cruciform canard-tail con-figuration somewhat similar to the Sidewindermissile variant shown earlier, except that the tailsection of this configuration is mounted on bear-ings that are free to roll in response to the aerody-namic loads (ref. 155). Figure 31 shows theeffects that the canard flow field has on this typeof configuration. In this figure, the Mach numberis 2.5, the roll angle of the fixed section of themodel (ahead of the tail section) is 0°, and a rolldeflection of 10° is input from the canards (5° oneach horizontal canard). Three cases are shown:(1) the tail section is fixed in place in the + ori-entation (tails aligned with the canards),(2) the tail section is fixed in place in the x orien-tation (tails 45° offset from the canards), and(3) the tail section is free to roll. The canard flowfield causes the free-to-roll tails to spin at about1000 rpm at low angles of attack. This spin ratestays fairly constant with angle of attack untilabout α = 6°, when it begins to decrease and stopsat about α = 12°. Note that for small angles ofattack the configuration rolling moment for eitherof the fixed-tail configurations is very small, aswas seen in the Sidewinder variant model shownearlier. For the free-to-roll tail configuration,however, the canard roll deflection remains effec-tive and fairly constant with angle of attack.Note, moreover, that the rolling tail has very littleeffect on the configuration pitching moment.Thus, the free-to-roll tail produces the desiredconfiguration rolling moment without reducingthe longitudinal stability of the configuration.
Nonaxisymmetric Body. Figure 32 shows anelliptic body (with a major-to-minor axis ratioof 3) mounted in the UPWT high-speed testsection (ref. 117). The data of figure 33 showvapor-screen vortex patterns obtained on thisbody along with sketches of the observed smooth-wall vortex structures at Mach 2.5, α = 20°, and

14
roll angles of 0° and 45°. At φ = 0°, the bodyvortices are symmetric and the feeding sheetforms at the side edge of the body. As shown onthe right side of this figure, at φ = 45°, the size ofboth vortices decreases with roll angle and themore windward feeding sheet moves close to thebody surface. The more leeward vortex moves faraway from the body. A review of the force dataof reference 117 shows that these vorticesincrease the lifting efficiency of this elliptic body.
The elliptical configuration shown in figure 32had a companion configuration with the sameelliptical mid-body but transitioned from a blunthemispherical nose into a circular base. Vapor-screen images of the vortex structures for thisconfiguration are shown in figure 34. For a 0°roll angle, the smooth-wall vortices emanatingfrom the side of the body are similar to those seenon the completely elliptical body with sharp nose.However, the data of figure 34 show the additionof a thin vertical smooth-wall separation (vortex)originating on the blunt nose and continuingdown the leeward centerline of the body. Atφ = 45°, the side vortices shift in a similar way tothat seen on the completely elliptical body but thethin vortex from the blunt nose remains perpen-dicular to the plane of the body. At the aft end ofthe body, the thin nose vortex actually attachesitself to the leeward side vortex feeding sheet.
Figure 35 shows vapor-screen photographsdepicting vortex patterns on a chined forebodymodel at Mach 2.0 and 20° angle of attack. Alsoshown in the figure is a photograph of the modelmounted in the UPWT low-speed test section(ref. 138). A review of the model photographshows the existence of a metric break runningcircumferentially around the model at an x/L of0.64. The portion of the model aft of the metricbreak was used to minimize base effects on theforebody flow field and forebody aerodynamics.The vortex structure shown in the figure is a resultof a sharp-edge separation occurring at the chine.Note that the feeding sheet of the body vortices isseen to emanate from the chine edge of the body.It appears that the metric break disrupts the bodyvortex feeding sheet and a second smaller vortexbegins to grow along the chine side edge down-stream of the metric break.
Wings and Aircraft
A review of existing experimental data forwings and wing-body geometries, refer-ences 156–168, reveals that a wide array of vortexflow structures are present at both low- and high-lift conditions. To highlight the various types ofvortex structures present on wings and wing-bodygeometries, as well as the effect of flow condi-tions, various data are presented in figures 36through 45.
All of the data presented in figures 36 through45 have been obtained in the UPWT over a Machnumber range of 1.6 to 3.5. The observed struc-tures are a combination of both sharp-edge flowseparation type and smooth-wall flow separationtype, see figures 5 and 6, respectively. The sharp-edge vortex types shown in the figures includeleading-edge vortex formation from a sharp-edgewing, leading-edge extension (LEX) or strake, tipvortex formation from a wing or canard, and thevortex from a sharp wing-body juncture disconti-nuity. The various types of smooth-wall (shock-induced) separations, such as from the side of aslender body, on the lee side of a wing, and at ablended wing-body juncture region, contrast thesharp-edge separations.
Sharp Leading-Edge Wings. Presented in fig-ures 36 and 37 are data obtained for variableleading-edge sweep (ogee) wings with sharpleading edges, references 158 and 165, respec-tively. Both of the concepts shown in figures 36and 37 have been designed for efficient super-sonic cruise and improved performance at liftcoefficients above cruise. The data presented infigure 36 are for a highly cambered wing, with aleading-sweep angle that varies from 82.09° to65.5°, at 5° angle of attack, and a Mach numberof 2.4. The data presented in figure 37 are for amildly cambered wing, with a leading-sweepangle that varies from 79.5° to 60°, a canard at12° angle of attack, and a Mach number of 1.8.
As discussed in reference 158, the designobjective for the wing shown in figure 36 was toemploy wing camber to eliminate or delay wingleading-edge vortex formation to high-lift coeffi-cients in order to improve high-lift performance.

15
Vapor-screen photographs of figure 36 show thesimultaneous existence of both a smooth-wallvortex emanating from the very low sweep noseregion of the highly cambered ogee wing and asharp-edge leading-edge vortex. It may appearcounterintuitive that a wing with a sharp leading-edge geometry will have a smooth-wall separa-tion; however, the combination of very low sweepat the nose and a very high Mach number createsa flow condition rather similar to that which oc-curs for a blunt body. The flow at the apex re-mains attached as it expands around the sharpleading edge but then undergoes a rapid recom-pression that separates the flow. This sharp-edged vortex resides on the surface of the geome-try and is also referred to as a leading-edgebubble.
A review of additional data from reference 158shows similar vortex-flow features for a referenceuncambered wing. The uncambered wing has thesame vortex-flow structure as the cambered wingbut has a 16-percent loss in aerodynamic per-formance compared with the cambered wing. Thedata of reference 158 show that these vortexstructures are noninterfering phenomena thatoccur over a wide range of flow conditions. Thesimilarity in vortex-flow characteristics for thecambered and uncambered wings supports theargument that the existence of vortex flow doesnot always degrade aerodynamic performance ofcambered wings at supersonic speeds.
The design objective for the ogee wing shownin figure 37 was to employ the downwash from acanard to eliminate or delay wing leading-edgevortex formation in order to improve performanceat cruise (CL = 0.1). Similar to the observationsfrom figure 36, the vapor-screen photographs offigure 37 also show the existence of two noninter-fering vortex structures on the lee side of thewing. However, unlike the data of figure 36,these structures are both sharp-edge vortex struc-tures that emanate from the canard tip and thewing leading edge. Despite the existence of thesetwo vortex structures, the data of reference 165show that the wing with canard has improveddrag-due-to-lift characteristics at all lift condi-tions, in contrast to the wing without canard.
Shown in figure 38 are the lee-side vortexflow characteristics of another design study fora wing with canard (ref. 166). This study alsoattempted to use canard downwash to suppressvortex formation on the main wing in an effort toimprove cruise performance (CL = 0.1). Thedesign study of reference 166 was performed ona 70°/20° sweep cranked arrow with a 55° sweptcanard for a Mach number of 1.8. Both thecanard and wing had sharp leading edges. Thephotographs of figure 38 show the existence oftwo noninterfering vortex structures on the leeside of the wing. These structures are both sharp-edge vortex structures that emanate from thecanard tip and the wing leading edge. Additionaldata of reference 166 show similar wing flowfeatures were present on the wing without canardconfiguration. Despite the existence of these twovortex structures, the data of reference 166 showthat the wing with canard has improved drag-due-to-lift characteristics at all lift conditions in con-trast to the wing without canard.
Interfering Vortex Structures. Presented in fig-ure 39 are data for a 70° swept delta wing with an82.6° strake at an angle of attack of 10° and aMach number of 3.5 (ref. 160). These data showthe development of a smooth-wall vortex struc-ture emanating from the forebody and a sharp-edge strake vortex structure. The data show thestrake vortex structure completely enveloping theweaker forebody vortex prior to the start of thewing leading edge. The smooth-wall forebodyvortex structure of figure 39 is relatively weakand thus it is easily dominated and consumed bythe strake vortex structure. The significance ofinteracting vortex flows is a function of the down-stream geometry of the subject vehicle; therefore,general conclusions cannot be drawn.
Blunt Leading-Edge Wings. Compared with thepreviously discussed vortex structures, the nextthree figures show relatively weak vortex struc-tures that may exist on blunt leading-edge wingsand wing-body geometries. The vortex structurespresented in figures 40, 41, and 42 are primarilysmooth-wall vortex flows resulting from winglee-side shock-induced separation and wing-bodyjuncture flows.
16
Depicted in figure 40 is a vapor-screen photo-graph for a cambered, blunt leading-edge 70°/66°cranked-arrow wing-body at an angle of attack of10° and a Mach number of 1.8 (ref. 167). Alsoshown in the figure are the trimmed drag charac-teristics at Mach 1.8 for the cambered and a refer-ence flat wing. The vapor-screen image for thecambered wing shows the presence of a shock-induced (smooth-wall) vortex structure residing at50 percent of the local semispan. The drag dataof figure 40 show that at this condition the cam-bered wing has improved performance comparedwith the uncambered wing. A review of addi-tional aerodynamic and flow visualization datafrom reference 167 indicates that the separatedvortex-flow structure on the wing does notdegrade the aerodynamic performance.
Similar observations and conclusions, as thoseof figure 40, can be drawn from the informationpresented in figures 41 and 42 as well as the sup-porting data contained in references 157 and 161,respectively. Figure 41 shows results for a 55°swept delta wing-body with an uncambered bluntleading-edge wing at various lift coefficients anda Mach number of 2.16. At the higher lift coeffi-cients, the data show the existence of a shock-induced vortex structure as well as a wing-bodyjuncture vortex. The data of figure 42 also showthat a shock-induced vortex structure is presentfor the 50° swept delta wing-body with an un-cambered blunt leading-edge wing at 12° angle ofattack at a Mach number of 1.6. Note, the wing-body juncture vortex structure observed in fig-ure 41 is not present in figure 42 due to a combi-nation of the lower Mach number and improvedblending of the wing-body juncture. The aerody-namic data and additional flow visualization dataof references 157 and 161 show that despitethe existence of smooth-wall vortex structuresboth wings provide excellent aerodynamicperformance.
Multibody Aircraft. The final two figures dis-cussed in this section contain data taken fromreference 162. These data are for a multibodyconcept employing a sharp leading-edge 65° deltawing outboard panel (fig. 43) and a multibody
concept employing a 20° trapezoidal (trap) wingoutboard panel with a sharp leading edge(fig. 44). The pair of axisymmetric bodies sepa-rates the outboard wing panels from a common60° swept inboard wing panel with a sharp lead-ing edge. The data of figures 43 and 44 are for anangle of attack of 16° at a Mach number of 2.16.The data presented in both figures show the exis-tence of a very complex combination of shocksand flow separation. Sketches of the Schlierenshock patterns and oil-flow patterns are includedin the figures to aid the reader in interpreting thecomplex flow features seen in the vapor-screenphotographs. The flow separation structures offigures 43 and 44 consist of sharp-edge andsmooth-wall vortex structures as well as nonvor-tex flow separation caused by shock-boundarylayer interactions. The data of figure 43 showsharp-edge wing leading-edge vortex structuresfrom both the inboard and outboard wing panels,a shock-induced vortex structure (which hasmerged with the inboard wing vortex), and asmooth-wall vortex structure emanating fromeach of the forebodies. The observed flow fea-tures for the 20° trap multibody concept (seefig. 44) are very similar to those observed for the65° delta multibody concept (see fig. 43) with theexception of the outboard wing panel vortexstructure. The data of figure 44 show the exis-tence of a smooth-wall shock-induced vortexstructure for the 20° swept wing. The data offigures 43 and 44 and additional results from ref-erence 162 show that despite the numerous vortexstructures that exist for these concepts, they havevery good aerodynamic performance comparedwith existing single-body aircraft.
The data presented in figures 36 through 44show that a wide variety of resultant vortex-flowstructures can exist on vehicles at high speed. Anassessment of these data with additional resultsfrom references 156, 159, 163, and 164 showsthat despite the existence of vortex structures,aerodynamic performance is not degraded. Alsonote that the vortex structures discussed wereobserved to be steady and stable at all combina-tions of Mach number and angle of attack atwhich data were obtained.

17
Designed Vortex Structures
The design of efficient supersonic aircraft hashistorically focused on maintaining attached flowover the full vehicle under the assumption thatattached flow (refs. 169–179) would produceoptimum performance. The attached-flow designapproach assumes that the flow will only separateat the trailing edge of the wing. However, it iswell-known that for a vehicle in flight there arenumerous vortex structures present. Examples ofthese structures are vortices that emanate from thewing tips, wing-body juncture, shock-boundarylayer interaction, and vehicle base (rearward fac-ing step). Each vortex structure listed is of theresultant type.
In the early 1980s, it was postulated that forslender geometries improved aerodynamic per-formance could be achieved at cruise through theuse of a leading-edge vortex structure (refs. 176and 179–181). It was further argued that theresulting geometry would be lighter and lesscomplex than a highly twisted and cambereddesign. In an effort to address this goal, a para-metric study was conducted on a family of deltawing models at Mach numbers from 1.6 to 4.6.The delta wing planform was selected because ofthe extensive historical data available for analysisand the ease in which simple and robust geomet-ric and flow parameters can be used to extendthese results to other geometries.
In this section, the effects that leading-edgesweep, leading-edge bluntness, wing thickness,location of maximum thickness, and camber haveon the aerodynamics of and flow over delta wingsare discussed and the methods for visualizingthese flow fields are examined. The subsequentdiscussion first reviews and characterizes theaerodynamics (ref. 181) and then the flow fieldsfor delta wings, such as separation bubble, classi-cal vortex, and vortex with shock (refs. 106–112).This is ensued by a wing design discussionwherein the understanding of the character of theflow over such wings is highlighted.
Fundamental Aerodynamic Characteristics ofDelta Wings
At supersonic speeds, the aerodynamics ofdelta wings has historically been correlated withparameters relating to the leading-edge flow con-dition and wing leading-edge sweep. These cor-relation parameters have typically been derivedfrom linear theory and have not been based uponexperimental observations.
To establish a point of reference for the subse-quent discussion a brief review of several correla-tion parameters is presented. Figure 45 (ref. 181)graphically depicts the range of several of theseparameters for the Mach number and wingleading-edge sweep discussed in this section.Figure 45(a) shows the variation in aspect ratio(A) of delta wings with the leading-sweep angle(Λ) and figure 45(b) illustrates the relationshipbetween Mach number (M) and the leading-edgesweep parameter (β cot Λ). Note that β isthe supersonic Mach parameter (M2 − 1)1/2. Aleading-edge sweep parameter value of 1.0 corre-sponds to a sonic leading-edge (LE) condition.Thus, a subsonic LE condition occurs for β cot Λvalues < 1.0 and a supersonic LE condition forvalues > 1.0. A supersonic wing LE conditionindicates that the flow normal to the wing leadingedge is supersonic and based upon a two-dimensional airfoil analysis a large wave dragpenalty would result. However, it is well-knownthat this wave drag penalty is never manifested onrepresentative swept wings. This is because thenotion of a subsonic and supersonic LE conditionis not a description of the governing physics but adescription of the relationship of the Mach angleto the wing leading-edge sweep angle. Despitethe limitations and inherent restrictions of lineartheory to model the aerodynamics of wings domi-nated by vortex flows, the parameters justdiscussed are still useful for the correlation ofaerodynamic and flow-field observations at lowangles of attack.
Presented in figure 46 (ref. 181) is the varia-tion in lift-curve slope with β cot Λ for thin, thick,

18
sharp, and blunt delta wings. Presented in fig-ure 46(a) are sketches of representative airfoils forthe data presented in figures 46(b) and 46(c). Thelift data of figure 46(b) are for sharp leading-edgewings that vary in thickness only. The data offigure 46(c) are for thin wings which vary inleading-edge bluntness only. The observed flowfields for the lift data presented in figures 46(b)and 46(c) vary from attached flow to sharp-edgevortex separation. Note that at supersonic speeds,the zero-lift lift-curve slope is typically main-tained to lift coefficients greater than 0.30. Thus,the lift-curve slope is a direct indicator of the dragdue to lift of these slender wings for low to mod-erate lift conditions. This linear behavior of wingsupersonic lifting characteristics allows for anefficient assessment of the aerodynamics over abroad Mach and angle-of-attack range because thesupersonic drag of a swept wing is inversely pro-portional to the lifting characteristics.
For reference purposes, linear theory estimatesare presented in figures 46(b) and 46(c). Theseestimates are independent of wing thickness andleading-edge bluntness. Note that the data forall wings collapse to a narrow band at values ofβ cot Λ below 0.5. At these small values ofβ cot Λ (i.e., small disturbances) linear theorydoes an acceptable job of matching the experi-mental data. However, at higher values of β cot Λlinear theory overpredicts the lift-curve slopeof thin, sharp leading-edge delta wings (seefig. 46(b)) but more closely matches the trends forblunt leading-edge (see fig. 46(c)) and thick deltawings (see fig. 46(b)). These data suggest that theaerodynamic performance of thin, slender wingsat supersonic speeds and low β cot Λ is a functionof Mach number and angle of attack but lesssensitive to wing geometry and flow field.
Vortex Flow Characteristics of Delta Wings
As discussed previously, the supersonic flowover delta wings at angle of attack is dominatedby nonlinear separated vortex flows. A review ofexisting data shows that the experimental studiesof lee-side flow-field characteristics of deltawings have used the Mach number and angle ofattack normal to the wing leading edge (ref. 38) as
the primary correlation parameter. Unlike theβ cot Λ parameter discussed above, the MN andαN parameters account for angle of attack as wellas planform geometry in defining the flow condi-tions at the wing leading edge.
The next three sections discuss the flow overdelta wings in supersonic flow fields. The firstsection describes the flow over zero-thicknesswings. The two subsequent sections discuss theeffect of thickness and camber on the flow struc-tures over delta wings and how these can be usedto design wings.
Zero-Thick Wings. The flow over flat, zero-thickness wings can be characterized as attached(both upper and lower surfaces) for an angle ofattack of 0°. At angles of attack greater than 0°,these wings follow the classification patterndefined for lee-side flows in figure 47 (ref. 106).The flow structures represented in figure 47 are acombination of sharp-edge and smooth-wall vor-tex structures. Note the flow classification resultsdepicted in figure 47 are the same as those pre-sented in figure 9. The results from figure 9 arepresented at this point in the paper to assist thereader.
The right side of the figure shows results forMN greater than 1.0. For high values of MN andlow-lift (near α = 0°) conditions (region 1), thevalue of the cross-flow velocity is low, thus sub-critical with the primary flow in the streamwisedirection. As lift increases, the flow turning angleabout the leading edge increases, resulting in anincrease in the magnitude of the inboard flowcomponent. This inboard flow eventually recom-presses and turns streamwise. As lift increasesfurther, the cross-flow velocity increases to thepoint that a cross-flow shock occurs that turns theflow streamwise. The occurrence of a cross-flowshock is an indication of the existence of non-linear supercritical-type cross flow. Furtherincreases in lift result in shock-induced separationof the boundary layer and the formation of asmooth-wall separation (see region 2). Furtherincreases in angle of attack show the shock-induced bubble/vortex migrating to the leadingedge. With still further increases in angle of

19
attack this smooth-wall bubble/vortex structuretransforms into a sharp-edge vortex as the feedsheet emanates from the sharp leading edge(see region 3). This structure eventually lifts offthe surface and cross-flow shocks form (seeregion 4). These shocks may be located on thevortex upper surface, underneath the vortex, andhorizontally between the two counterrotating pairof vortex structures. The vortex structure, whichlies underneath the primary vortex structure,interacts with the boundary layer and results in asmooth-wall vortex (secondary) structure.
The left side of figure 47 shows results for MNless than 1.0. For low values of MN and low-lift(small angle of attack) conditions the flow thatoccurs on the lee side of a wing is a leading-edgeseparation characterized by a viscous, rotationalmass of air that resides inboard of the wing lead-ing edge. At low-lift conditions, a leading-edgebubble develops (see region 6). This bubble liftsoff the wing surface and becomes a vortex withincreasing angle of attack (see region 5). As an-gle of attack is increased further, a secondaryvortex and then a vortex with a shock occur. Thevortex body is connected to the wing surface viathe feed sheet that is a viscous flow region ema-nating from the wing boundary layer near thewing leading edge. The shape and position of theviscous vortex system are dependent upon theflow field external to the vortex that interacts withthe vortex system until an equilibrium conditionis established. The vortex system acts as a physi-cal boundary to the external flow field. The free-stream flow expands around the wing leadingedge and follows the contour of the vortex systemundergoing an expansion followed by a compres-sion as the flow turns about the vortex. This“induced flow field,” influenced by the viscousvortex system, is characterized by a stagnationpoint or reattachment line on the wing upper sur-face inboard of the vortex body. Inboard of thisinduced flow field is the potential flow field,where the flow is attached in the streamwisedirection.
Example vapor-screen photographs for severaltypes of complex vortex-flow structures depictedin figure 47 are discussed next. The specific MN
and αN conditions for these data points aregraphically depicted in figure 48 and the associ-ated data for each of the conditions are presentedin figures 49 and 50. Figure 49 contains a seriesof vapor-screen photographs on the zero-thickness, 75° delta wing model in the UPWT(ref. 112). The images in this figure representconditions that are above and below MN = 1.0, asdepicted in figure 48. Three angles of attack areshown for Mach numbers 2.4, 3.4, and 4.6 (seefigs. 49(a), 49(b), and 49(c), respectively). Areview of the data of figure 49 shows a primaryvortex only for the Mach 2.4, α = 8° andMach 3.4, α = 8° conditions. At Mach 4.6 andα = 8° the data show the existence of a separationbubble with shock. The existence of primaryvortex with shock, secondary vortex, and tertiaryvortex structures is observed for Mach 2.4 and 3.4at α = 16° and 24°. At Mach 4.6 and α = 16° and24°, separation bubbles with shock that extend tothe centerline of the model are observed. Withthe exception of Mach 2.4, α = 8° and Mach 3.4,α = 8°, each image contains at least one cross-flow shock and for most of the images severalcross-flow shock structures are present.
Figure 50 presents a series of vapor-screenphotographs for a zero-thickness, 52.5° delta wingmodel in the UPWT (ref. 112). The images inthis figure represent conditions that are aboveMN = 1.0, as depicted in figure 48. Three anglesof attack are shown for Mach numbers 2.4, 3.4,and 4.6 (see figs. 50(a), 50(b), and 50(c), respec-tively). The vapor-screen photographs of fig-ure 50 show the existence of both smooth-wallseparations (i.e., shock-boundary layer interac-tion) and sharp-edge separations. With theexception of the image for Mach 2.4 and α = 8°,the data show the existence of leading-edge sepa-ration bubbles and/or vortices. These vortexstructures are seen to increase in size and extendspanwise toward the centerline of the model withincreases in angle of attack and Mach number.The flow fields shown contain at least one cross-flow shock structure and for most of the imagesseveral cross-flow shock structures are present.
Thick Wings. The effect of wing thickness onthe wing leading-edge vortex position is shown in

20
figure 51 (ref. 181). The vortex action line shownin figure 51 is represented as a fraction of thelocal wing semispan. The vortex action line is theposition at which the vortex-induced normal-forcevector should be placed to give the same wingbending moment as that produced by the vortexpressure loading on the wing upper surface. Thedata clearly show an outboard movement of thevortex with the increasing of wing local surfaceslope at the leading edge. The thick-wing surfacepressure data of figure 52 (ref. 181) also indicatethat the wing upper leading-edge surface slopeacts to delay the onset of flow separation at ahigher angle of attack. At a constant angle ofattack of 8°, the data of figures 51 and 52 showthat increasing leading-edge surface slope resultsin a weaker vortex that is located farther outboardas compared with a lower leading-edge surfaceslope. The data indicate that wing leading-edgesurface slope and not thickness is the dominantmechanism controlling vortex formation, strength,and position. Despite the noticeable effects on thelee-side flow characteristics among the threewings, a review of additional data contained inreference 181 shows that there were no noticeablechanges on the total wing lifting characteristics.
A review of thick delta-wing lifting character-istics of figure 46 shows that for values of β cot Λbelow 0.5, the lift-curve-slope data show insensi-tivity to thickness. The figure also shows that forvalues of β cot Λ above 0.5 there is an increase inthe lift-curve slope over the flat, zero-thick deltadata, but only a minor variation due to largechanges in thickness. The data of figure 46 alsoindicate that the leading-edge radius affects theflow and resultant vortex formation the same asthe leading-edge angle or thickness.
Figure 53 (ref. 138) shows oil-flow photo-graphs on the lee side of three 60° delta wingmodels. The first is a flat-topped (zero-thick)wing, the second has a circular arc airfoil, and thethird has a diamond airfoil. At 0° angle of attack,all three wings have attached flow. At 8° angle ofattack, the circular arc and diamond airfoils haveattached flow on the upper surface and the flatwing has a sharp-edge vortex separation. For thethick wings, there is a cross-flow component that
flows inboard and normal to the leading-edgesweep. Inboard of the leading edge the cross flowis recompressed and turns streamwise. At 16°, allthree wings have leading-edge separation (sharp-edge vortex). The location of the vortex actionline for the flat wing occurs farther inboard thanfor the two thick wings, as was observed previ-ously in figure 50.
Figure 54 (ref. 138) illustrates the effectsleading-edge sweep and airfoil shape have on thelee-side flow characteristics of delta wings atM = 1.70 and 8° angle of attack. The six imagesin this figure include three 52.5° delta wing mod-els and three 75° delta wing models, top and bot-tom rows, respectively. The figure also has threecolumns comparing a flat wing, a circular arc, anda diamond airfoil model (as was done in fig. 53).Once again, it is clearly evident that the flat wingshave their vortex action lines occurring fartherinboard than the thicker circular arc and diamondairfoil wings.
Finally, even at 0° angle of attack, a thickwing can have vortex flow. For example, fig-ure 55 is an oil-flow photograph of a 75° deltawith a diamond airfoil. The oil flow shows thatthe leading edge is attached; however, the flowdownstream of the maximum thickness line hasseparated and has an oil-flow pattern similar tothe oil-flow photographs seen for flat wings atangle of attack. Upon an initial review it isunclear if this separation is of the sharp-edge orsmooth-wall type. However, a review of the pre-dicted surface pressure coefficient plots shown atthree x/L locations (0.6, 0.8, and 0.95) indicatesthat the flow expands over the ridge, then recom-presses through a cross-flow shock. These pres-sure data clearly indicate that the separationmechanism is a smooth-wall type. The flowdirection inboard of the shock is streamwise. Thiseffect will also be seen in the next section wheninvestigating the effects of camber.
Cambered Wings. After wing planform selec-tion, the geometric parameter usually optimizedduring design of a supersonic aircraft is the cam-ber and twist distribution. The next series of fig-ures illustrate the effect of a camber (leading-edge

21
flap deflection) on the flow characteristics on theupper surface of a highly swept, sharp leading-edge delta wing at supersonic speeds. All of thedata presented in this section were obtained on a75° delta wing with deflectable leading-edgeflaps. Photographs of the wind tunnel modelinstalled in the UPWT are shown in figure 56(ref. 110). The data obtained for this model arepresented in figures 57 through 59. The data offigures 57 and 58 represent the two families offlow types found in the investigation documentedin reference 110. The first family of data istermed “single-feature” flow type and is presentedin figure 57. The second family of data is the“double-feature” flow type (see fig. 58). Single-feature flow types have only one major flowstructure that emanates from either the leadingedge or the flap hinge line. Double-feature flowtypes have two major flow structures: one ema-nating from the leading edge and one emanatingfrom the flap hinge line. The data presented arevapor-screen images, surface pressure coefficientvalues, and flow-field sketches. To aid the readerin interpreting the complex flow features seenin the vapor-screen photographs of figures 57and 58, sketches were created by tracing thenegatives of the vapor-screen photographs.
Figure 57 (ref. 110) shows six sets of vapor-screen images, surface pressure coefficient values,and flow-field sketches of the 75° swept deltawings at various Mach numbers and angles ofattack with a single flow feature.
The data are discussed from left to right andtop to bottom, starting with the upper left figure.The effect of camber is modeled as a leading-edgeflap deflection. The first image in figure 57 is fora 5° leading-edge flap, δF, setting at M∞ = 1.7 andα = 0°. The data show attached flow (i.e., no darkregions evident in the vapor-screen photographand only a small negative pressure coefficient, Cp,located at the hinge line). The second image pre-sented is for a change in α only to 6°. The datashow a leading-edge bubble (i.e., a small darkregion at the leading edge on the flap and a largeregion of negative Cp values that encompass theflap). The third image presented is for anotherchange in α only to 12°. The data indicate the
existence of a classical vortex with a feed sheet,secondary separation (bubble), and a shocklocated between the wing upper surface and theleading-edge vortex. The corresponding pressuredistributions show that low pressures persist wellinboard of the flap hinge line. The fourth imagewas taken for the same wing geometry but at aMach number of 2.0 and an angle of attack of 16°.The data show a leading-edge vortex, a cross-flowshock (on top of the vortex), a secondary vortexon the hinge line, and a shock underneath theprimary leading-edge vortex. The fifth image wasobtained for a 10° leading-edge flap deflectionangle at M∞ = 2.8 and α = 0°. The data show theexistence of a hinge-line separation bubble (i.e., asmall dark region on the wing inboard of thehinge line). The final image in this figure is ahinge-line vortex and was taken at M∞ = 2.4 at anangle of attack of 6° for a 10° leading-edge flapdeflection angle. The vapor-screen photographindicates the hinge-line vortex by a circular darkregion about halfway from the centerline to thehinge line. There is also evidence of a feed sheeton the photograph. The surface pressures indicatesuction pressures inboard of the hinge line withnegligible loads on the flap.
Figure 58 (ref. 110) shows six sets of double-feature flow types observed on the same 75° deltawing model. The first image is for a 5° leading-edge flap deflection at M∞ = 1.7 and α = 5° andshows two separation bubbles, one located at theleading edge on the flap and the other at the hingeline. The surface Cp values show that the separa-tion bubble located on the flap produces muchlower values of Cp than the one at the hinge line.By increasing the flap angle to 10°, the Machnumber to 2.4, and the angle of attack to 8°, thesecond image indicates that the hinge-line separa-tion bubble has lifted off the surface to become avortex. The third image provides roughly thesame pressure loading on the upper surface; how-ever, there exists a separation bubble at the lead-ing edge with a cross-flow shock lying on top of itfollowed by a hinge-line separation bubble. Thisoccurred at a Mach number of 2.8, an angle ofattack of 6°, with a δF of 5°. The fourth imagehas higher pressure loading due to the fact that thehinge-line separation bubble has been replaced
22
with a vortex. In this case, the δF was set at 10°,the angle of attack was 10°, and the Mach numberwas 2.4. The fifth and sixth images were taken ata Mach number of 2.8. The first was at an angleof attack of 12° with δF = 10°. A lambda shock isquite evident on the flap followed by a stronghinge-line vortex. The last image (angle of attackof 16° with a δF of 15°) has a shock located on theoutboard flap followed again by a strong hinge-line vortex with shock.
It is clear from the data of figures 57 to 59that, unlike the effect of thickness or leading-edgeradius, the effect of camber does not result in auniform progression in the location of the vortexor the strength of the vortex. However, once flowseparation occurs at the wing leading edge(α > 10°), the flow behaves similar to that for thinflat wings. Increasing wing camber (i.e., δF de-flection) delays the formation of a wing leading-edge vortex. Figure 59 is a map of the lee-sideflow type for variations in flap deflection angleand angle of attack. This result was derived fromall of the data reported in reference 59. The datashow that five distinct flow types exist on the leeside of the cambered delta wings at supersonicspeeds. The data of figure 59 also show that thereare both low-lift and high-lift (α varies between0° and 8°) conditions in which a vortex resides ona deflected leading-edge flap at supersonicspeeds, clearly suggesting that improved aerody-namic performance is available for wings withvortex flow.
Despite the differences in the vortex-flowstructure over the upper surface of flat and cam-bered wings, the lift-curve slopes are very similar(ref. 181) suggesting a similarity in upper surfaceloading. A designer may take the similarity inloading into account when engineering a wingupper surface that will efficiently use this loadingto create improved performance across the liftrange.
Wing Design
In the previous sections of this paper, a varietyof vortex-flow structures have been shownto exist on a wide variety of vehicles and
simple shapes. In the previous section entitled“Designed Vortex Structures,” data have beenshown that indicate significant aerodynamic per-formance improvements are available by consid-ering vortex flows as a primary design feature.This final section of the paper briefly discussesthe idea of designing wings that use vortex flowsfor improved aerodynamic performance at super-sonic speeds.
Design Philosophy
Until the middle 1990s, most supersonic wingdesign activities used linear-theory design meth-ods. However, it has only been in the last fewyears that the trend has been to use Euler andNavier-Stokes methods for design. These meth-ods are typically coupled with numerical optimi-zation techniques and use highly constrainedmodels to modify the geometry in the designprocess. Even though the design community ismoving to the routine use of more advanced com-putational methods, the philosophy and under-standing behind the design approach is primarilyfounded in linear thinking. Designs of supersonicaircraft continue to employ traditional linear-theory rules for planform, airfoil selection,camber shapes, and the integration of aircraftcomponents (i.e., wing, body, tails, and nacelles).The location of maximum airfoil thickness (typi-cally located at 40- to 50-percent chord) and thechoice of sharp leading edges (especially whenthe leading-edge sweep implies a supersonicleading-edge condition) continue to be zero- orfirst-order design guidelines.
It is critical that nonphysical constraints orlimitation of theory or tools not restrict the designof a vehicle. Aerodynamic design must be basedupon physical observation and knowledge. Apossible philosophy for design is that postulatedby Kucheman (ref. 1):
“Flow fields suitable for efficient aerody-namic design must be steady, stable andcontrollable, changing quantitatively withchanges in attitude and Mach number whileremaining qualitatively of the same typethroughout the whole flight range.”
23
In review of this philosophy, it is clear thatvortex flow design easily satisfies the criteria;however, the authors prefer not to be bound by asingle-feature flow type in the design process.Perhaps a natural extension to the Kuchemanphilosophy is reflected in the following quoteoffered by the authors:
“The induced effect of flow fields suitablefor efficient aerodynamic design must besteady, stable and controllable, changingquantitatively with changes in attitude andMach number while remaining qualita-tively of the same type throughout thewhole flight range.”
It is this philosophy upon which the subsequentdiscussion is based.
Design Observations
The supersonic aerodynamics of a sharpleading-edge swept wing dominated by vortexflow is nearly identical to that for a blunt leading-edge wing with fully attached flow and the sameMach and angle of attack (ref. 182). In a similarfashion, the transonic and subsonic aerodynamicsof thin swept wings are also fairly insensitive tosmall geometric variations, such as wing leading-edge shape. These observations allow the de-signer to configure the geometric details of a wingbased upon the loading and not the specific flowfield.
To configure a wing for multiple design con-ditions (other than zero lift), it has been found thathigher performance (lower drag and higher lift)can be achieved by adding bluntness/thicknessto the wing leading edge and varying the maxi-mum airfoil thickness location between 20- and60-percent chord (ref. 182).
In figure 60, several useful (linear-theorybased) design boundaries are outlined. Thecurves of interest to most designers are the lineartheory 0-percent leading-edge thrust curve and thelinear theory 100-percent leading-edge thrustcurves. For zero-thickness flat wings, 0-percentleading-edge thrust defines the linear theory pre-
dicted drag performance of a wing with attachedflow conditions. However, it is well-known thatfor a thin, sharp, leading-edge swept wing at an-gle of attack the flow will separate at the leadingedge and form a vortex. The resulting perform-ance level for this case is defined as 100-percentvortex lift. This curve accurately represents theperformance level that is achieved by a thin un-cambered (zero-thickness, flat) wing designed touse the leading-edge vortex. The third linear-theory based curve depicted in figure 60 is the100-percent leading-edge thrust curve. This curveis the linear-theory “best” design. This curve alsoassumes an unachievable level of attached flow atthe wing leading edge. Note, it is this curve thatexisting designs are measured against.
Also shown in figure 60 are new boundaries,which reflect nonlinear viscous effects that areknown to be present. This boundary has beendefined through a review and analysis of existingexperimental data (refs. 181 and 182). A moredetailed discussion of this curve is provided inreference 182 in which the natural flow wing(NFW) design philosophy is presented. Thisdesign concept uses the naturally occurring flowover a wing and shapes the underlying surfacecontours to take advantage of the surface pres-sures generated by those flow structures.
Design Approach
Figure 61 illustrates how the NFW approachcan be applied to delta wings. A typical wingdesign will choose a maximum airfoil thicknesslocation and apply this to the entire wing. Thisresults in a wing that has a geometry conicalabout the wing tip (solid line on left-hand side offigure). However, as was seen in the previoussections of this paper, the flow field on the leeside of highly swept wings is actually conicalabout the apex of the wing. That is, the flow overa wing at moderate to high-lift conditions may becharacterized by an expansion over the leadingedge that is followed by a recompression to amore positive pressure as the flow moves inboardand aft. This recompression line lies along a raythat emanates from the wing apex. The shadedregions on the figure indicate the low-pressure(expanded flow) regions on the wing. If one

24
applies the surface pressures to the surface ge-ometry, one can resolve a lift and drag compo-nent. Thus, four regions of drag can be obtained.Forward of the maximum thickness line, the sur-face has forward-facing slope. Near the leadingedge where the flow is expanding, the pressuresare low, thus, a low pressure acting on a forward-facing slope would provide a thrust or low drag.Therefore, region B in the figure would be a low-drag region. However, region A, where the flowhas recompressed to higher pressures, would be ahigh-drag region because high pressures acting ona forward-facing slope will generate a positivedrag value. Aft of the maximum thickness line,the slope of the surface is aft-facing. Thus, nearthe leading edge, in the expanded-flow region, thedrag would again be high because low pressuresacting on an aft-facing surface will produce posi-tive drag values. And finally, in regions wherethe flow has recompressed and the slopes are aft-facing, one would expect to obtain low drag orthrust because high pressure acting on an aft-facing surface would generate low positive oreven negative values of drag (i.e., thrust). Thus, agoal of the designer would be to reduce the sizesof regions A and C while maximizing the sizes ofregions B and D. On the right side of figure 61 isa drawing of the natural flow airfoil maximumthickness line. The maximum thickness locationapproaches the apex and actually would falldownstream of the trailing edge at the tip (seefig. 62). With this approach, one would reducethe size of region A and completely eliminateregion C.
Design Results
The NFW approach was applied to a 65°swept delta wing (ref. 182) and the resultinggeometries that were tested in the UPWT areshown in figure 63. It should be noted that thenatural flow wing is sharp and thin inboard, be-coming thicker with a blunt leading edge out-board. It was noted in previous sections that athin, sharp leading edge moved the vortex actionline more inboard compared with a wing havingincreased bluntness or thickness. However, amore blunt leading edge provided for more at-tached flow and also leading-edge thrust. The
sharp leading edge at the apex and the thin airfoilsection at the centerline of the NFW designallows the vortex to set up stronger and maintainstrength as if it were a wing that was sharp to thetip. The added bluntness and thickness outboardprovides additional surface area and improvedsurface slopes to reduce drag. Figure 64 showsoil-flow photographs of the three wings tested inthe study. The NFW design had an oil accumula-tion line that ran parallel with the leading edge.This coincides with the location of the airfoilmaximum thickness location. The predicted andexperimentally determined performance agreedvery well and is shown in figure 65. The NFWdesign philosophy has recently been used inseveral advanced concepts, including the nowdefunct national High-Speed Research (HSR)Program (ref. 2).
Concluding Remarks
An overview of the high-speed vortex flowexperimental research conducted at LangleyResearch Center (LaRC) during the 1970s, 1980s,and 1990s has been presented. Data have beenshown for flat plates, cavities, bodies, missiles,wings, and aircraft for a Mach number range of1.5 to 4.6. These data are presented and discussedin the context of the design of future vehicles. Inorder to provide perspective on these researchresults, a brief historical review of the extensivebody of high-speed vortex flow research from the1940s has also been presented.
Data presented show that a wide variety ofsharp-edge and smooth-wall resultant vortexstructures occurs on all vehicles at supersonicspeeds. The data also show the presence of bothsmall- and large-scale vortex structures for avariety of vehicles from missiles to transports.These vortex structures have historically beenviewed as unfavorable flow features. In an effortto evaluate this viewpoint, the subject data havebeen analyzed to determine the impact of thesevarious flow structures on vehicle performanceand control. The preliminary analysis of thesedata indicated that these vortex structures are notdetrimental and in fact have the potential toprovide very significant positive-interference

25
benefits. The data for the resultant vortex struc-tures indicated that all of the flows are steady,stable, and controllable, changing quantitativelywith changes in attitude and Mach number whileremaining qualitatively of the same type.
For cavities, the data show complex multiple-vortex structures at all combinations of cavitydepth-to-length ratios and Mach number. Thedata showed that the cavity flow fields, vortexstructures, and resultant aerodynamics are steady,stable, and remained qualitatively similar withchanges in Mach number for both open- andclosed-cavity flow.
The data presented have shown that missiles athigh angles of attack can have multiple sets ofcounterrotating vortex structures that flow aftover the vehicle and interact with the downstreamcontrol surfaces. For missiles in roll, the com-plexity of the vortex dominated flow fields andresulting interference patterns increases dramati-cally. Data have been shown that demonstrate thecapability of these interference effects to influ-ence vehicle flight performance. Analysis pre-sented indicates that significant improvements inthe flight characteristics can be achieved throughthe management of these interference effects.The data also showed that these vortex dominatedflow fields are controllable.
For wings and aircraft, the data highlight theeffects that leading-edge sweep, leading-edgebluntness, wing thickness, location of maximumthickness, and camber have on vortex formationand the resultant aerodynamics. The data pre-sented for the lee-side flow fields for delta wingsshowed that the vortex flow structures develop ina logical and continuous fashion with changes inwing geometry, Mach number, and angle of at-tack. Wing and wing-body aerodynamic data andflow field have been shown that indicate aerody-namic performance improvements are availableby considering vortex flows as a primary designfeature.
Finally, a design approach for wings/aircraft,which use vortex flows, to improve aerodynamicperformance at supersonic speeds was presented
and discussed. The subject design approach usesthe observation that the loading on thin, sweptwings at supersonic speeds is minimally affectedby the lee-side flow-field characteristics. Datawere presented that show the performance of awing, with a lee-side vortex, produced with thisdesign approach exceeds that which may beachieved by traditional design methods.
This paper has provided a brief overview ofthe high-speed vortex flow research at LaRC inthe hope of stimulating the aerodynamic commu-nity to investigate the potential of vortex flows toimprove the aerodynamic performance and con-trol of future aircraft.
References
1. Kucheman, D.: The Aerodynamic Design of Air-craft. Pergamon Press, 1978.
2. First NASA/Industry High-Speed Research Con-figuration Aerodynamics Workshop. R. M. Wood,ed. NASA/CP-209690/PT1, 1999.
3. Barret, C.: Lifting Body Stability and Control.NASA TM-1999-209255, 1999.
4. Jones, R. T.: Estimated Lift-Drag Ratios at Super-sonic Speed. NACA TN-1350, 1947a.
5. Jones, R. T.: Effects of Sweep-Back on BoundaryLayer and Separation. NACA Report No. 884,1947b.
6. Riebe, J. M.; and Fikes, J. E.: Preliminary Aero-dynamic Investigation of the Effect of Camber on a60° Delta Wing With Round and Beveled LeadingEdges. NACA RM L9F10, 1949.
7. Vincenti, W. G.: Comparison Between Theory andExperiment for Wings at Supersonic Speeds.NACA Rep. 1033, 1949.
8. Lee, G. H.: Note on the Flow Around Delta WingsWith Sharp Leading Edges. R.&M. No. 3070,British ARC, 1955.
9. Love, E. S.: Investigations at Supersonic Speeds of22 Triangular Wings Representing Two AirfoilSections for Each of 11 Apex Angles. NACARep. 1238, 1955.
26
10. Michael, W. H., Jr.: Flow Studies on Drooped-Leading-Edge Delta Wings at Supersonic Speed.NACA TN-3614, 1956.
11. Michael, W. H., Jr.: Flow Studies on Flat PlateDelta Wings at Supersonic Speed. NACATN-3472, 1955.
12. Brown, C. E.; and Michael, W. H., Jr.: On SlenderDelta Wings With Leading Edge Separation.NACA TN-3430, 1955.
13. Boatright, W. B.: Experimental Study and Analysisof Loading and Pressure Distributions on DeltaWings Due to Thickness and to Angle of Attack atSupersonic Speeds. NACA RM L56I14, 1956.
14. Sacks, A. H.: Vortex Interference Effects on theAerodynamics of Slender Airplanes and Missiles.Jour. Aero. Sci., vol. 24, no. 6, June 1957,pp. 393–412.
15. Smith, F. M.: Experimental and Theoretical Aero-dynamic Characteristics of Two Low-Aspect-RatioDelta Wings at Angles of Attack to 50° at a MachNumber of 4.07. NACA RM L57E02, 1957.
16. Nielsen, J. N.: The Effects of Body Vortices andthe Wing Shock-Expansion Field on the Pitch-UpCharacteristics of Supersonic Airplanes. NACARM A57L23, 1958.
17. Boatright, W. B.: An Analysis of Pressure Studiesand Experimental and Theoretical Downwash andSidewash Behind Five Pointed-Tip Wings at Super-sonic Speeds. NACA Rep. 1380, 1958.
18. Chapman, D. R.; Kuehn, D. M.; and Larson, H. K.:Investigation of Separated Flows in Supersonicand Subsonic Streams With Emphasis on the Effectof Transition. NACA Rep. 1356, 1958.
19. Mueller, J. N.; and Grimaud, J. E.: Effects of Twistand Camber and Thickness on the AerodynamicCharacteristics of a 75° Swept Arrow Wing at aMach Number of 2.91. NACA TM X-138, 1959.
20. Hall, I. M.; and Rogers, E. W. W.: The FlowPatterns on a Tapered Sweptback Wing at MachNumbers Between 0.6 and 1.6. R.&M. No. 3271,Part 1, British ARC, 1960.
21. Allen, H. J.; and Perkins, E. W.: A Study of theEffects of Viscosity on Flow Over Slender InclinedBodies of Revolution. NACA Rep. 1048, 1951.
22. Boyd, V. W.; and Phelps, E. R.: A Comparisonof Experimental and Theoretical Loading OverTriangular Wings at Supersonic Speeds. NACATIB-2591, 1951.
23. Hatch, V. E.; and Hargrave, L. E.: Effects ofReynolds Number on the Aerodynamic Character-istics of a Delta Wing at Mach Number 2.41.NACA TIB-2919, 1951.
24. Maskell, E. C.: Flow Separation in Three-Dimensions. Aero. Rep. 1565, British RAE, 1955.
25. Maskell, E. C.; and Kucheman, D.: ControlledSeparation in Aerodynamic Design. TM 463,British RAE, 1956.
26. Maskell, E. C.; and Weber, J.: On the Aerody-namic Design of Swept Wings. Jour. of RoyalAero. Soc., vol. 63, Dec. 1959, pp. 709–721.
27. Rogers, E. W. E.; and Berry, C. J.: Experiments atM = 1.41 on Elliptic Cones With Subsonic LeadingEdges. R.&M. No. 3042, British ARC, 1952.
28. Stewart, H. J.: The Lift of a Delta Wing at Super-sonic Speeds. Q. Appl. Math., vol. 4, no. 3, 1946,pp. 246–254.
29. Ellis, D. G.; and Stollery, J. L.: The Behaviourand Performance of Leading-Edge Vortex Flaps.Proceedings of the 16th Congress of the Interna-tional Council of the Aeronautical Sciences. ICASPaper 88-4.5.2, 1988.
30. Harris, R. V., Jr.: On the Threshold—Outlookfor Supersonic and Hypersonic Aircraft.AIAA-89-2071, Aug. 1989.
31. Reed, R. D.: Wingless Flight: The Lifting BodyStory. NASA SP-4220, 1997.
32. Lamar, J. E.; and Campbell, J. F.: Recent Studiesat NASA-Langley of Vortical Flows InteractingWith Neighboring Surfaces. AGARD CP-342,Paper 10, 1983.

27
33. Campbell, J. F.; and Chambers, J. R.: Patterns inthe Sky—Natural Visualization of Aircraft FlowFields. NASA SP-514, 1994.
34. Ogawa, A.: Vortex Flow. CRC Press, 1993.
35. High Angle-of-Attack Aerodynamics, Wendt, J. F.,ed., AGARD LS-121, March 1982.
36. Rom, J.: High Angle of Attack Aerodynamics—Subsonic, Transonic, and Supersonic Flows. NewYork Springer-Verlag, 1992.
37. Stanbrook, A.: Experimental Observation of Vor-tices in Wing-Body Junctions. R.&M. No. 3114,British ARC, 1959.
38. Squire, L. C.: Flow Regimes Over Delta Wings atSupersonic and Hypersonic Speeds. Aero. Quart.,vol. 27, Feb. 1976, pp. 1–14.
39. Stanbrook, A.; and Squire, L. C.: Possible Typesof Flow at Swept Leading Edges. Aero. Quart.,vol. 15, pt. 1, Feb. 1964, pp. 72–82.
40. Kucheman, D.: Aircraft Shapes and TheoreticalAerodynamics for Flight at Supersonic Speeds.Von Karman: Advances in Aeronautical Sciences,Proceeding of the Second International Con-gress in the Aeronautical Sciences, Zurich.12–16 Sept., 1960, vol. 3, 1962, pp. 221–252.
41. Kucheman, D.: On the Possibilities of DesigningWings That Combine Vortex Flows With ClassicalAerofoil Flows. Tech. Memo. Aero. 1363, BritishRAE, Oct. 1971.
42. Kucheman, D.; and Weber, J.: Vortex Motions.ZAMM, vol. 7, no. 8, 1965, pp. 457–474.
43. Von Karman, T.; Ballantyne, A. M.; Dexter, R. R.;Bock, G.; Dryden, H. L.; and Roy, M.: Advancesin Aeronautical Sciences. Proceedings of the Sec-ond International Congress in the AeronauticalSciences, Zurich, 12–16 September, 1960, vol. 3,1962.
44. Squire, L. C.: Camber Effects on the Non-LinearLift of Slender Wings With Sharp Leading Edges.CP No. 924, British ARC, 1967.
45. Squire, L. C.: Flow Regimes Over Delta Wings atSupersonic and Hypersonic Speeds. Aero. Quart.,vol. 27, pt. 1, Feb. 1976.
46. Squire, L. C.: Pressure Distributions and FlowPatterns on Some Conical Shapes With SharpEdges and Symmetrical Cross-Sections at M = 4.0.R.&M. No. 3340, British ARC, 1963.
47. Squire, L. C.; Jones, J. G.; and Stanbrook, A.: AnExperimental Investigation of the Characteristicsof Some Plane and Cambered 65° Delta Wings atMach Numbers From 0.7 to 2.0. R.&M. No. 3305,British ARC, 1963.
48. Peake, D. J.; and Tobak, M.: Three-DimensionalFlows About Simple Components at Angle ofAttack. Paper No. 2, AGARD Lecture SeriesNo. 121 on High Angle-of-Attack Aerodynamics.Mar. 1982.
49. Peake, D. J.; and Tobak, M.: Three-DimensionalInteractions and Vortical Flows With Emphasis onHigh Speeds. NASA TM-81169, 1980.
50. Tobak, M.; and Peake, D. J.: Topology of Three-Dimensional Separated Flows. Ann. Rev. Fluid.Mech., vol. 14, 1982, pp. 61–85.
51. Bannink, W. J.; and Nebbeling, C.: Investigationof the Expansion Side of a Delta Wing at Super-sonic Speeds. AIAA J., vol. 11, no. 8, Aug. 1973,pp. 1151–1156.
52. Bashkin, V. A.: Experimental Study of Flow AboutFlat Delta Wings at M = 5 and Angles of AttackFrom 0 to 70° . Izvestiya Akademiya Nauk SSSRMekhanika Zhidkosti I Gaza, vol. 23, 1967,pp. 102–108.
53. Brown, C. E.; McLean, F. E.; and Klunker, E. B.:Theoretical and Experimental Studies of Camberedand Twisted Wings Optimized for Flight atSupersonic Speeds. Von Karman: Advances inAeronautical Sciences, Proceedings of the SecondInternational Congress in the AeronauticalSciences, Zurich, 12–16 September, 1960, vol. 3,1962, pp. 415–431.
54. Carafoli, E.: Wing Theory in Supersonic Flow.Pergamon Press Int. Series of Monographs inAero. and Astro., vol. 7, 1969.

28
55. Cleary, J. W.: Lee-Side Flow Phenomena on SpaceShuttle Configurations at Hypersonic Speeds.Part 1: Flow Separation and Flow Field ViscousPhenomena of a Delta-Wing Shuttle Orbiter Con-figuration. NASA TM X-2507/L-8136-Vol. 2,1972.
56. Cross, E. J.; and Hankey, W. L.: Investigation ofthe Leeward Side of a Delta Wing at HypersonicSpeeds. J. of Spacecr. and Rockets, vol. 6, no. 2,Feb. 1969, pp. 185–190.
57. Danavant, J. C.; Narayan, K. Y.; and Walberg,G. D.: A Survey of Leeside Flow and HeatTransfer on Delta Planform Configurations.AIAA-76-118, Jan. 1976.
58. Degani, D.; and Schiff, L. B.: Computation ofSupersonic Viscous Flows Around Pointed Bodiesat Large Incidence. AIAA-83-0034, Jan. 1983.
59. Delery, J. M.: Physics of Vortical Flows. J.of Aircr., vol. 29, no. 5, Sept.–Oct. 1992,pp. 856–876.
60. Delery, J.; Horowitz, E.; Leuchter, O.; andSolignac, J. L.: Fundamental Studies on VortexFlows. Rech. Aerosp., vol. 2, 1984.
61. Fellows, K. A.; and Carter, E. C.: Results andAnalysis of Pressure Measurements on Two Iso-lated Slender Wings and Slender Wing-Body Com-binations at Supersonic Speeds, Part 1—Analysis.CP No. 1131, British ARC, 1970.
62. Fournier, R. H.; and Spencer, B., Jr.: AerodynamicCharacteristics at Mach Numbers From 1.50 to4.63 of a Variable-Geometry Lifting Reentry Con-cept Employing Elevator and Body Base Flaps forControl. NASA TM X-1351, 1967.
63. Ganzer, U.; Hoder, H.; and Szodruch, J.: On theAerodynamics of Hypersonic Cruise Vehicles atOff-Design Conditions. 1978, Vol. I - Fuel Con-servation, Hyp. Veh., Environ. Effects, Materialsand Struc., Comp. Aero., Wind Tunnels, FlightTesting, Stability and Control. ICAS Proceedings.J. Singer and R. Staufenbiel, eds., 1978,pp. 152–161.
64. Goodsell, A. M.; and Melton, J. E.: Transonic andSupersonic Euler Computations of Vortex Domi-nated Flow Fields About a Generic Fighter.NASA TP 3156, 1991.
65. Gunko, I. U. P.; and Mazhul, I. I.: Investigation ofthe Regimes of Flow Past the Upper Surface ofDelta Wings With Shock Waves Separated Fromthe Leading Edges. Akademiia Nauk SSSR, 1979.
66. Hefner, J. N.: Lee-Surface Heating and FlowPhenomena on Space Shuttle Orbiters at LargeAngles of Attack and Hypersonic Speeds. NASATN D-7088, 1972.
67. Hemsch, M. J.: Semi-Empirical Methods for Con-ventional and Unconventional Missiles. AGARDRep. No. 754, Paper 4, 1988.
68. Larsson, P. O.: A Note on Supersonic and Tran-sonic Flow Around Delta Wings. Royal Institute ofTechnology, CN-154394, 1954.
69. Linde, M.: The Flow on the Lee-Side of a DeltaWing at Mach 7. The Second Joint Europe/U.S.Short Course in Hypersonics, 1989.
70. McRae, D. S.; Peake, D. J.; and Fisher, D. F.: AComputational and Experimental Study of HighReynolds Number Viscous/Inviscid InteractionAbout a Cone at High Angle of Attack. AIAA-80-1422, July 1980.
71. Morris, O. A.: Aerodynamic Characteristics inPitch at a Mach Number of 2.01 of Several Wing-Body Combinations With Wedge-Shaped BodiesLocated Above and Below a 54.5° Swept DeltaWing. NASA TN D-1823, 1963.
72. Murman, E. M.; Powell, K. G.; Miller, D. S.; andWood, R. M.: Comparison of Computations andExperimental Data for Leading-Edge Vortices—Effects of Yaw and Vortex Flaps. AIAA-86-0439,Jan. 1986.
73. Narayan, K. Y.; and Hartman, K.: Transonic andSupersonic Flow Past a 65° Delta Wing WithRound Leading Edges—Analysis of ExperimentalData. DFVLR-FB 88-44, Oct. 1988.
74. Narayan, K. Y.: Lee-Side Flowfield and HeatTransfer of a Delta Wing at M = 10.0. AIAA J.,vol. 16, no. 2, p. 160.
75. Nastase, A.: Some Considerations on Leading-Edge Vortices on Wings in Supersonic Flow.Fluid Dynamic Research 3, 1988, pp. 387–391.
29
76. Newsome, R. W.; and Kandil, O. A.: VorticalFlow Aerodynamics-Physical Aspects and Nu-merical Simulation. AIAA-87-0205, Jan. 1987.
77. Newsome, R. W.; and Thomas, J. L.: Computationof Leading-Edge Vortex Flows. NASA CP-2416,1985.
78. Oberkampf, W. L.; and Bartel, T. J.: SupersonicFlow Measurements in the Body Vortex Wake ofan Ogive Nose Cylinder. AIAA-78-787, April1978.
79. Pagan, D.; and Molton, P.: Basic Experiment on aSupersonic Vortex Flow Around a Missile Body.AIAA-91-0287, Jan. 1991.
80. Povinelli, L. A.; and Povinelli, F. P.: VortexEnhancement of Jet Penetration in SupersonicFlow. AIAA-69-664, June 1969.
81. Rao, D. M.; and Whitehead, A. H.: Lee-Side Vor-tices on Delta Wings at Hypersonic Speeds. AIAAJ., vol. 10, Nov. 1972, pp. 1458–1465.
82. Reding, J. P.; and Ericsson, L. E.: Effects of DeltaDynamics. J. of Spacecr. & Rockets, vol. 10,no. 7, July 1973, pp. 421–428.
83. Richards, I. C.: Supersonic Flow Past a SlenderDelta Wing. An Experimental InvestigationCovering the Incidence Range −5° < a < 50° .Aeronaut. Q., March 1976.
84. Schrader, K. F.; Reynolds, G. A.; and Novak, C. J.:Effects of Mach Number and Reynolds Number onLeading-Edge Vortices at High Angle-of-Attack.AIAA-88-0122, Jan. 1988.
85. Smith, J. H. B.: Improved Calculations of LeadingEdge Separation From Slender, Thin, Delta Wings.Proc. Roy. Soc. A., vol. 306, 1968, pp. 67–90.
86. Smith, L. G.; and Maurice, M. S.: Laser Veloci-metry Measurements of Supersonic Vortex Flowson Simple Razor-Edged Delta Wing. AIAA-91-1684, June 1991.
87. Snyder, M. H., Jr.: On the Theory of the DeltaWing. AR 66-4, Wichita State University, Sept.1966.
88. Sorrells, R. B., III; and Landrum, E. J.: Theoreti-cal and Experimental Study of Twisted and Cam-
bered Delta Wings Designed for a Mach Numberof 3.5. NASA TN D-8247, 1976.
89. Stallings, R. L.; and Lamb, M.: Wing-Alone Char-acteristics for High Angles of Attack at SupersonicSpeeds. NASA TP-1889, 1981.
90. Stallings, R. L.; Lamb, M.; and Watson, C. B.:Effect of Reynolds Number on Stability Character-istics of a Cruciform Wing-Body at SupersonicSpeeds. NASA TP-1683, 1980.
91. Stallings, R. L.: Low Aspect Ratio Wings at HighAngles of Attack. Tactical Missile Aerodynamics.AIAA Prog. In Astro. and Aero., vol. 104, 1986,pp. 89–128.
92. Szodruch, J.; and Ganzer, U.: On the Lee-SideFlow Over Delta Wings at High Angle of Attack.AGARD CP-247, 1978.
93. Szodruch, J.; and Squire, L. C.: Pressure Distribu-tion on the Suction Surface of Some Delta Wingsat M = 3.5. No. 35-008, British ARC, 1974.
94. Thomann, H.: Measurement of Heat Transfer,Recovery Temperature and Pressure Distributionon Delta Wings at M = 3. FFA Rep. 93, Sweden,1962.
95. Thomas, J. L.; and Newsome, R. W.: Navier-Stokes Computations of Lee-Side Flows OverDelta Wings. AIAA-86-1049, May 1986.
96. Xing, W. F.; and Marenbach, G.: Periodic VortexShedding in the Supersonic Wake of a PlanarPlate. NASA TM-77854, 1985.
97. Zubin, M. A.; and Osteapenko, N. A.: T h eExperimental Investigation of Some Characteris-tics of the Supersonic Flow Around Delta Wings.Akademiia Nauk SSSR, 1975.
98. Aerodynamics of Vortical Type Flows in ThreeDimensions. Young, A. D., ed., AGARD CP-342,April 1983.
99. Fifty Years of Aeronautical Research. NASAEP-45, 1968.
100. Introduction to Vortex Dynamics. Von KarmanInstitute for Fluid Dynamics, Lecture Series1986-08, Vol. 2, Wendt, J. F., ed., May 1986.

30
101. Vortex Flow Aerodynamics—Vol. II, Campbell,J. F., ed., NASA CP-2417, 1985.
102. Smith, J. H. B.: A Review of Separation inSteady Three-Dimensional Flow. AGARDCP-168, May 1975.
103. Sutton, E. P.: Some Observations of the FlowOver a Delta Winged Model With 55-degLeading-Edge Sweep, at Mach Numbers Between0.4 and 1.8. R.&M. No. 3190. British ARC,1960.
104. Szodruch, J.: Reynolds Number Influence onLeeside Flowfields. AIAA J., vol. 16, no. 12,1978, pp. 1306–1309.
105. Szodruch, J. G.; and Peake, D. J.: Leeward FlowOver Delta Wings at Supersonic Speeds. NASATM-81187, 1980.
106. Miller, D. S.; and Wood, R. M.: Leeside FlowsOver Delta Wings at Supersonic Speeds. J.Aircr., vol. 21, no. 9, Sept. 1984, pp. 680–686.
107. Wood, R. M.; and Miller, D. S.: Impact of Air-foil Profile on the Supersonic Aerodynamics ofDelta Wings. AIAA-85-4073, Oct. 1985.
108. Wood, R. M.; and Miller, D. S.: FundamentalAerodynamic Characteristics of Delta WingsWith Leading Edge Vortex Flows. J. Aircr.,vol. 22, no. 6, June 1985, pp. 479–485.
109. Wood, R. M.; and Miller, D. S.: Assessment ofPreliminary Prediction Techniques for WingLeading-Edge Vortex Flows at SupersonicSpeeds. J. Aircr., vol. 22, no. 6, June 1985,pp. 473–478.
110. Wood, R. M.; and Watson, C. B.: Study of Lee-Side Flows Over Conically Cambered DeltaWings at Supersonic Speeds. NASA TP-2660,Parts 1 and 2, 1987.
111. Ganzer, U.; and Szodruch, J.: Vortex FormationOver Delta, Double-Delta and Wave Rider Con-figurations at Supersonic Speeds. AGARD,Aerodynamics of Hypersonic Lifting Vehicles.Nov. 1987.
112. Covell, P. F.; and Wesselman, G.: Flow FieldCharacteristics and Normal-Force Correlations
for Delta Wings From Mach 2.4 to 4.6.AIAA-89-0026, Jan. 1989.
113. Rainbird, W. J.: The External Flow Field AboutYawed Circular Cones. AGARD CP-30, 1968.
114. Rainbird, W. J.: Turbulent Boundary LayerGrowth and Separation on a Yawed 12.5 Cone atMach Numbers 1.8 and 4.25. AIAA J., vol. 6,no. 12, Dec. 1968, pp. 2410–2416.
115. Graves, E. B.; and Fournier, R. H.: Effect ofNose Bluntness and Afterbody Shape on Aerody-namic Characteristics of a Monoplanar MissileConcept With Bodies of Circular and EllipticalCross Sections at a Mach Number of 2.50.NASA TM-80055, 1979.
116. Allen, J. M.; and Dillenius, F. E.: Vortex Devel-opment on Slender Missiles at SupersonicSpeeds. AIAA-79-0360, Jan. 1979.
117. Allen, J. M.; and Pittman, J. L.: Analysis ofSurface Pressure Distributions on Two EllipticMissile Configurations. AIAA-83-1841, July1983.
118. Gartling, D. K.: Tests of Vortex Generatorsto Prevent Separation of Supersonic Flowin a Compression Corner. ARL-TR-70-44, U.S.Army, 1970.
119. Hazelwood, R.: An Investigation of CavityVortex Generators in Supersonic Flow. NASACR-198202, 1996.
120. Samimy, M.; Reeder, M.; and Zaman, K.: Super-sonic Jet Mixing Enhancement by Vortex Gen-erations. AIAA-91-2263, June 1991.
121. Greene, G. C.; Lamar, J. E.; and Kubendran,L. R.: Aircraft Vortices: Juncture, Wing, andWake. AIAA-88-3742, Jan. 1988.
122. Kandil, O. A.; Kandil, H. A.; and Liu, C. H.:Three-Dimensional Supersonic Vortex Break-down. AIAA-93-0526, Jan. 1993.
123. Siclari, M. J.: Asymmetric Separated Flows atSupersonic Speeds. AIAA-90-0595, Jan. 1990.
124. Metwally, O. M.: The Interaction of a Super-sonic Streamwise Vortex and a Normal ShockWave. Thesis, Univ. of Cranfield, Aug. 1989.
31
125. Settles, G. S.; and Cattafesta, L.: SupersonicShock Wave/Vortex Interaction. NASACR-192917, 1993.
126. Campbell, J. F.; Osborn, R. F.; and Foughner,J. T., Jr.: Vortex Flow Aerodynamics, Vol. II.NASA CR-2417, 1985.
127. Marchman, J. F.; Plentovich, E. B.; and Manor,D.: Performance Improvement of Delta Wings atSubsonic Speeds Due to Vortex Flaps. AIAA-80-1802, Aug. 1980.
128. Erickson, G. E.; Schreiner, J. A.; and Rogers,L. W.: Multiple Vortex and Shock Interactions atSubsonic, Transonic, and Supersonic Speeds.AIAA-90-3023, Aug. 1990.
129. Erickson, G. E.; Schreiner, J. A.; and Rogers,L. W.: Canard-Wing Vortex Interactions at Sub-sonic Through Supersonic Speeds. AIAA-90-2814, Aug. 1990.
130. McGrath, B. E.: Computational Study of a Coni-cal Wing Having Unit Aspect Ratio at SupersonicSpeeds. AIAA-93-3505, Aug. 1993.
131. McMillin, S. N.: Navier Stokes Solutions forLeeside Flows Over Supersonic Delta Wings—AValidation Study. Thesis, George WashingtonUniv., July 1989.
132. McMillin, S. N.; Thomas, J. L.; and Murman,E. M.: Euler and Navier-Stokes Leeside FlowsOver Supersonic Delta Wings. J. Aircr., vol. 26,no. 5, May 1989, pp. 452–458.
133. Miller, D. S.; and Wood, R. M.: Lee-Side FlowOver Delta Wings at Supersonic Speeds. NASATP-2430, 1985.
134. Powell, K. G.; Murman, E. M.; Wood, R. M.; andMiller, D. S.: A Comparison of Experimentaland Numerical Results for Delta Wings WithVortex Flaps. AIAA-86-1840, June 1986.
135. Rose, O. J.; and Pittman, J. L.: An Euler Analy-sis of Leading Edge Vortex Flows on aForebody-Strake at Supersonic Speeds. AIAA-89-0343, Jan. 1989.
136. Shrout, B. L.; and Robins, A. W.: LongitudinalAerodynamic Characteristics of an Elliptical
Body With a Horizontal Tail at Mach NumbersFrom 2.3 to 4.63. NASA TP-2024, 1982.
137. Wood, R. M.; Byrd, J. E.; Krieger, W. B.; andForrest, D. K.: Experimental Investigation ofthe Aerodynamic Characteristics of Eight Fore-body Geometries at Supersonic Speeds. NASATM-4625, 1997.
138. Wood, R. M.; Byrd, J. E.; and Wesselman, G. F.:Influence of Airfoil Geometry on Delta WingLeading-Edge Vortices and Vortex-InducedAerodynamics at Supersonic Speeds. NASATP-3105, 1992.
139. Stallings, R. L., Jr.: Store Separation From Cavi-ties at Supersonic Flight Speeds. J. Spacecr. &Rockets , vol. 20, no. 2, Mar.–Apr. 1983,pp. 129–132.
140. Stallings, R. L., Jr.; and Wilcox, F. J., Jr.:Experimental Cavity Pressure Distributions atSupersonic Speeds. NASA TP-2683, 1987.
141. Charwat, A. F.; Roos, J. N.; Dewey, F. C., Jr.;and Hitz, J. A.: An Investigation of SeparatedFlows. Part I: The Pressure Field. J. Aeronaut.Sci., vol. 28, no. 6, June 1961, pp. 457–470.
142. McDearman, R. W.: Investigation of the Flow ina Rectangular Cavity in a Flat Plate at a MachNumber of 3.55. NASA TN D-523, 1960.
143. Kaufman, L. G., II; Maciulaitis, A.; and Clark,R. L.: Mach 0.6 to 3.0 Flows Over RectangularCavities. AFWAL-TR-82-3112, U.S. Air Force,May 1983.
144. McGregor, O. W., Jr.: Aerodynamic Drag ofTwo-Dimensional Rectangular Notches in Tran-sonic and Supersonic Turbulent Flow (WithEmphasis on the Effect of Self-Induced PressureOscillations). Ph.D. Diss., Univ. of Illinois, Oct.1969.
145. Nestler, D. E.: An Experimental Study of CavityFlow on Sharp and Blunt Cones at Mach 8.AIAA-81-0335, Jan. 1981.
146. Blair, A. B., Jr.; and Stallings, R. L., Jr.:Supersonic Axial-Force Characteristics of aRectangular-Box Cavity With Various Length-to-Depth Ratios in a Flat Plate. NASA TM-87659,1986.

32
147. Wilcox, F. J., Jr.: Experimental Measurements ofInternal Store Separation Characteristics atSupersonic Speeds. The Store Carriage, Inter-national and Release Conference, Royal Aero.Soc., Bath, United Kingdom, Apr. 4–6, 1990.
148. Wilcox, Floyd J., Jr.: Use of a Colored WaterFlow Visualization Technique in a SupersonicWind Tunnel to Investigate Cavity Flow Fields.Flow Visualization VI—Proceedings of the SixthInternational Symposium on Flow Visualiza-tion. October 5–9, 1992, Yokohama, Japan;Springer-Verlag, Germany, 1992, pp. 41–45.
149. Jackson, Charlie M., Jr.; Corlett, William A.; andMonta, William J.: Description and Calibrationof the Langley Unitary Plan Wind Tunnel.NASA TP-1905, 1981.
150. Morris, Odell A.; Corlett, William A.; Wassum,Donald L.; and Babb, C. Donald: Vapor-ScreenTechnique for Flow Visualization in the LangleyUnitary Plan Wind Tunnel. NASA TM-86384,1985.
151. Stallings, Robert L., Jr.; Wilcox, Floyd J., Jr.; andForrest, Dana K.: Measurements of Forces,Moments, and Pressures on a Generic StoreSeparating From a Box Cavity at SupersonicSpeeds. NASA TP-3110, 1991.
152. Birch, T.; Allen, J.; and Wilcox, F.: Force,Surface Pressure and Flowfield Measurements onSlender Missile Configurations at SupersonicSpeeds. AIAA-2000-4207, Aug. 2000.
153. Allen, J. M.; Shaw, D. S.; and Sawyer, W. C.:Analysis of Selected Data From the TriserviceData Base. AIAA-89-0478, Jan. 1989.
154. Blair, A. B., Jr.; Allen, J. M.; and Hernandez, G.:Effect of Tail-Fin Span on Stability and ControlCharacteristics of a Canard-Controlled Missileat Supersonic Mach Numbers. NASA TP-2157,1983.
155. Blair, A. B., Jr.: Supersonic AerodynamicsCharacteristics of a Maneuvering Canard-Controlled With Fixed and Free-Rolling TailFins. SAE Paper 901993, Oct. 1990.
156. Covell, P. F.; Miller, D. S.; and Wood, R. M.:An Investigation of Leading-Edge Flap Per-
formance on Delta and Double-Delta Wings atSupersonic Speeds. AIAA-86-0315, Jan. 1986.
157. Covell, P. F.; Wood, R. M.; and Miller, D. S.:Investigation of Leading-Edge Flap Performanceon Delta and Double-Delta Wings at SupersonicSpeeds. NASA TP-2656, 1987.
158. Darden, C. M.: Effect of Leading-Edge LoadConstraints on the Design and Performance ofSupersonic Wings. NASA TP-2446, 1985.
159. Darden, C. M.: Effect of Milling MachineRoughness and Wing Dihedral on the SupersonicAerodynamic Characteristics of a Highly SweptWing. NASA TP-2918, 1989.
160. Johnson, S. K: Flow Field Study at Engine InletStations of Two High-Speed Cruise Aircraft.NASA TP-2861, 1989.
161. Hernandez, G.; Wood, R. M.; and Covell, P. F.:Effect of Leading- and Trailing-Edge Flaps onClipped Delta Wings With and Without WingCamber at Supersonic Speeds. NASA TM-4542,1994.
162. McMillin, S. N.; Bauer, S. X. S.; and Howell,D. T.: Effect of Planform and Body on Super-sonic Aerodynamics of Multibody Configura-tions. NASA TP 3212, 1992.
163. McMillin, S. N.; and Wood, R. M.: PlanformEffects on the Supersonic Aerodynamics ofMultibody Configurations. NASA TP-2762,1987.
164. Robins, A. W.; Carlson, H. W.; and Mack, R. J.:Supersonic Wings With Significant Leading-EdgeThrust at Cruise. NASA TP-1632, 1980.
165. Robins, A. W.; Lamb, M.; and Miller, D. S.:Aerodynamic Characteristics at Mach Numbersof 1.5, 1.8, and 2.0 of a Blended Wing-BodyConfiguration With and Without IntegralCanards. NASA TP-1427, 1979.
166. Shrout, B. L.: Effect of a Canard and WingLeading-Edge Flaps on the Longitudinal Aero-dynamic Performance of a Cranked Wing atSupersonic Speeds. NASA TM-89126, 1987.

33
167. Wood, R. M.; Miller, D. S.; Raney, D. L.; andRoesch, M. T.: A Low Lift Wing Camber DesignApproach for Fighter Aircraft. NASA TP-2465,1985.
168. Wood, R. M.; Rose, O. J.; and McMillin,S. N.: Effect of Body Cross-Sectional Shape onthe Supersonic Aerodynamics of MultibodyConfigurations. NASA TP-2587, 1986.
169. Carlson, H. W.; and Mann, M. J.: Survey andAnalysis of Research on Supersonic Drag-Due-to-Lift Minimization With Recommendations forWing Design. NASA TP-3202, 1992.
170. Johnson, M. E.: A Design and Analysis ofManeuver Wing Flaps at Supersonic Speeds WithAttainable Leading-Edge Thrust Considerations.NASA CR-3939, 1985.
171. Kulfan, R. M.: Real Flow Limitations inSupersonic Airplane Design. AIAA-78-147, Jan.1978.
172. Mason, W. H.: A Wing Concept for SupersonicManeuvering. NASA CR-3763, 1983.
173. Mason, W. H.; Siclari, M. J.; and Miller, D. S.:A Supersonic Maneuver Wing Designed forNonlinear Attached Flow. AIAA-83-0425, Jan.1983.
174. Maskell, E. C.: On the Principals of Aero-dynamic Design. Progress in Aero. Sci., vol. 1,no. 1, 1961, pp. 1–7.
175. Miller, D. S.; Landrum, E. J.; Townsend, J. C.;and Mason, W. H.: Pressure and Force Data fora Flat Wing and a Warped Conical Wing Havinga Shockless Recompression at Mach 1.62. NASATP-1759, 1981.
176. Miller, D. S.; and Wood, R. M.: AerodynamicDesign Considerations for Efficient High-LiftSupersonic Wings. AIAA-85-4076, Oct. 1985.
177. Nelson, C. P.: Effects of Wing Planform onHSCT Off-Design Aerodynamics. AIAA-92-2629-CP, 1992.
178. Seddon, J.; and Spence, A.: The Use of KnownFlow Fields as an Approach to the Design ofHigh Speed Aircraft. AGARD Fluid Dyn. Spec.Meeting, May 1968.
179. Covell, R. F.; Wood, R. M.; and Miller, D. S.:Investigation of the Vortex Flap Concept on a75-deg. Sweep Delta Wing at Supersonic Speeds.AIAA-87-2475, Aug. 1987.
180. Kulfan, R. M.: Wing Geometry Effects onLeading Edge Vortices. AIAA-79-1872, Aug.1979.
181. Wood, R. M.: Supersonic Aerodynamics of DeltaWings. NASA TP-2771, 1988.
182. Wood, R. M.; and Bauer, S. X. S.: The NaturalFlow Wing-Design Concept. NASA TP-3193,1992.
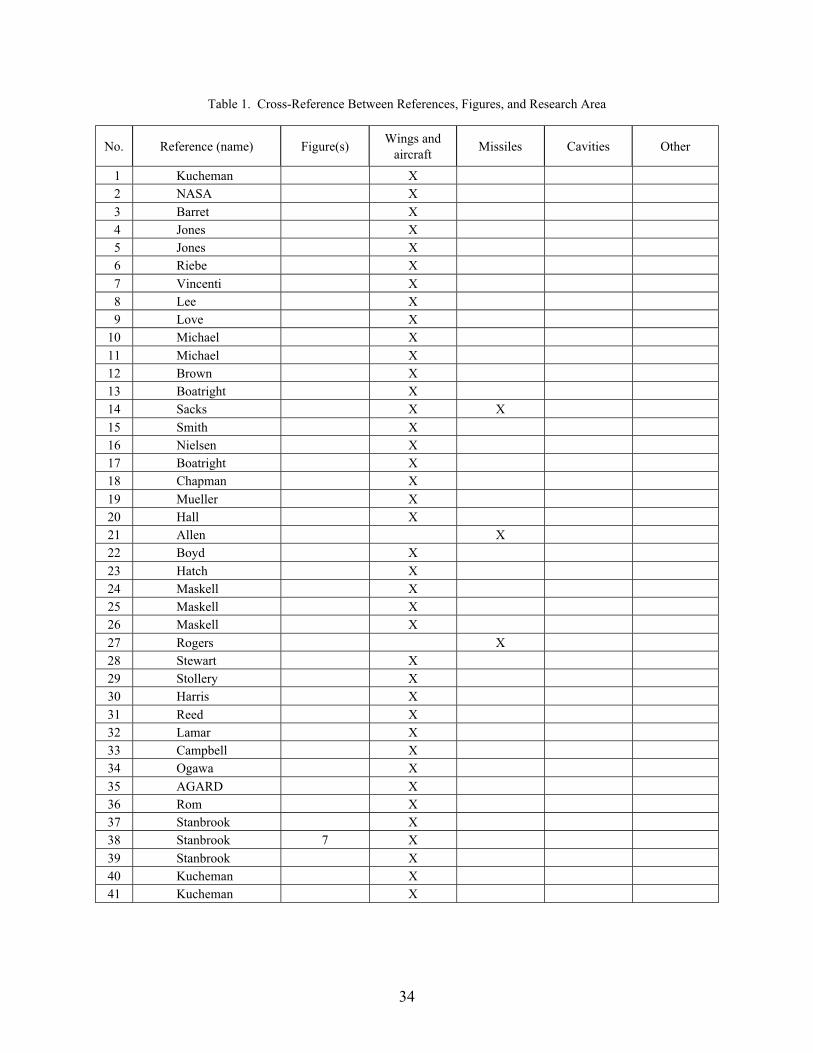
34
Table 1. Cross-Reference Between References, Figures, and Research Area
No. Reference (name) Figure(s)Wings and
aircraftMissiles Cavities Other
1 Kucheman X 2 NASA X 3 Barret X 4 Jones X 5 Jones X 6 Riebe X 7 Vincenti X 8 Lee X 9 Love X10 Michael X11 Michael X12 Brown X13 Boatright X14 Sacks X X15 Smith X16 Nielsen X17 Boatright X18 Chapman X19 Mueller X20 Hall X21 Allen X22 Boyd X23 Hatch X24 Maskell X25 Maskell X26 Maskell X27 Rogers X28 Stewart X29 Stollery X30 Harris X31 Reed X32 Lamar X33 Campbell X34 Ogawa X35 AGARD X36 Rom X37 Stanbrook X38 Stanbrook 7 X39 Stanbrook X40 Kucheman X41 Kucheman X
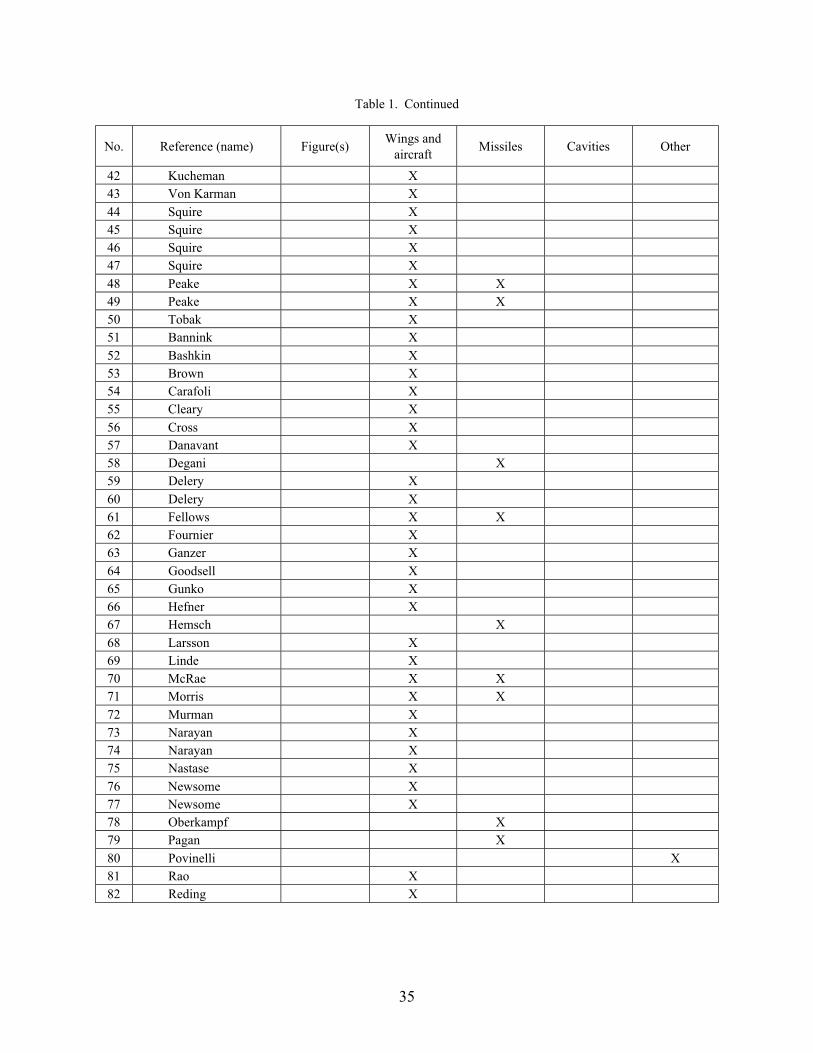
35
Table 1. Continued
No. Reference (name) Figure(s)Wings and
aircraftMissiles Cavities Other
42 Kucheman X43 Von Karman X44 Squire X45 Squire X46 Squire X47 Squire X48 Peake X X49 Peake X X50 Tobak X51 Bannink X52 Bashkin X53 Brown X54 Carafoli X55 Cleary X56 Cross X57 Danavant X58 Degani X59 Delery X60 Delery X61 Fellows X X62 Fournier X63 Ganzer X64 Goodsell X65 Gunko X66 Hefner X67 Hemsch X68 Larsson X69 Linde X70 McRae X X71 Morris X X72 Murman X73 Narayan X74 Narayan X75 Nastase X76 Newsome X77 Newsome X78 Oberkampf X79 Pagan X80 Povinelli X81 Rao X82 Reding X

36
Table 1. Continued
No. Reference (name) Figure(s)Wings and
aircraftMissiles Cavities Other
83 Richards X 84 Schrader X 85 Smith X 86 Smith X 87 Snyder X 88 Sorrells X 89 Stallings X 90 Stallings X X 91 Stallings X 92 Szodruch X 93 Szodruch X 94 Thomann X 95 Thomas X 96 Xing X 97 Zubin X 98 AGARD X X 99 Degani X100 Von Karman Institute X101 NASA X102 AGARD X X103 Sutton X104 Szodruch X105 Szodruch 8 X10⁶ Miller 9 X10⁷ Wood X108 Wood X109 Wood X110 Wood 56,57,58,59 X111 Ganzer X112 Covell 49,50,51 X113 Rainbird X114 Rainbird X115 Graves X116 Allen 28,29 X117 Allen 32,33,34 X118 Gartling X119 Hazelwood X120 Samimy X121 Greene X X122 Kandil X X123 Siclari X
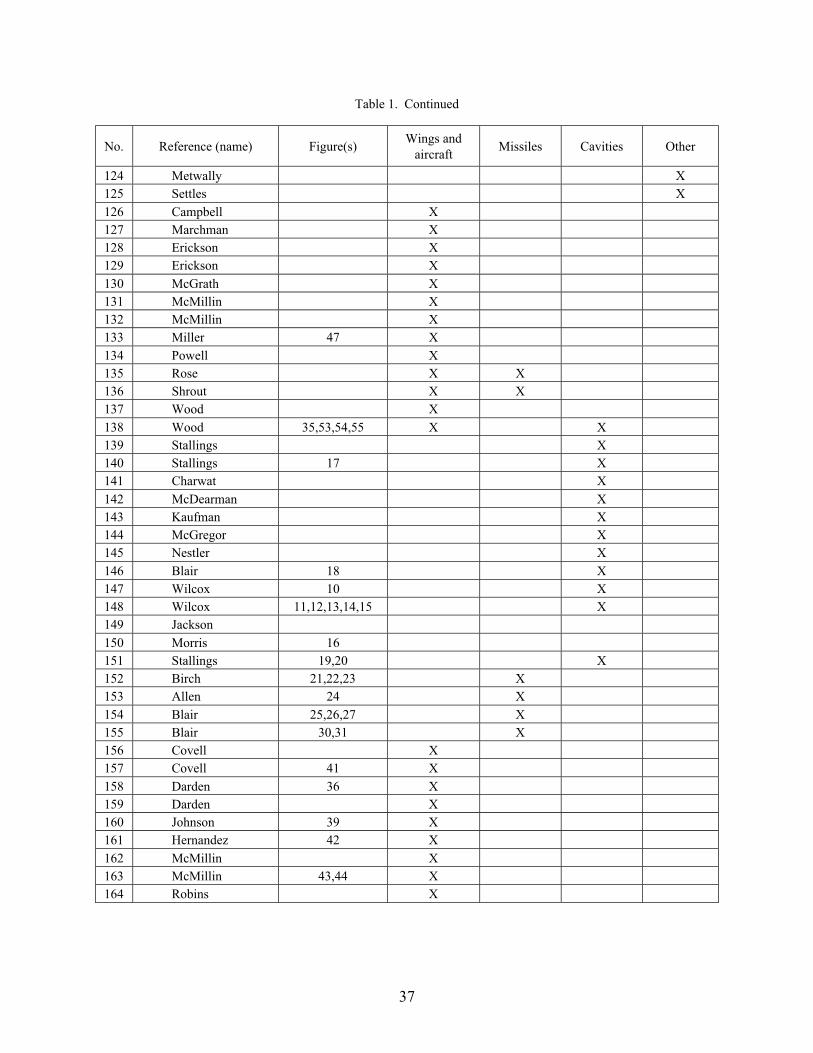
37
Table 1. Continued
No. Reference (name) Figure(s)Wings and
aircraftMissiles Cavities Other
124 Metwally X125 Settles X126 Campbell X127 Marchman X128 Erickson X129 Erickson X130 McGrath X131 McMillin X132 McMillin X133 Miller 47 X134 Powell X135 Rose X X136 Shrout X X137 Wood X138 Wood 35,53,54,55 X X139 Stallings X140 Stallings 17 X141 Charwat X142 McDearman X143 Kaufman X144 McGregor X145 Nestler X146 Blair 18 X147 Wilcox 10 X148 Wilcox 11,12,13,14,15 X149 Jackson150 Morris 16151 Stallings 19,20 X152 Birch 21,22,23 X153 Allen 24 X154 Blair 25,26,27 X155 Blair 30,31 X156 Covell X157 Covell 41 X158 Darden 36 X159 Darden X160 Johnson 39 X161 Hernandez 42 X162 McMillin X163 McMillin 43,44 X164 Robins X

38
Table 1. Concluded
No. Reference (name) Figure(s)Wings and
aircraftMissiles Cavities Other
165 Robins X166 Shrout X167 Wood X168 Wood X169 Carlson X170 Johnson X171 Kulfan X172 Mason X173 Mason X174 Maskell X175 Miller X176 Miller X177 Nelson X178 Seddon X179 Covell X180 Kulfan X181 Wood 45,46,51,52 X182 Wood 60,61,62,63,64,65 X
Table 2. Colored Water Flow Test Conditions
Machnumber
Reynoldsnumber,
1/ft
Totalpressure,
psfa
Totaltemperature,
°F
1.50 2.0 × 10⁶ 1051 125
2.16 2.0 × 10⁶ 1349 125

39
Figure 1. Photograph of galaxy M100.(http://nssdc.gsfc.nasa.gov/photo_gallery/photogallery-astro-galaxy.html#galaxies)
Figure 2. Photograph of Great Red Spot on Jupiter.(http://nssdc.gsfc.nasa.gov/photo_gallery/photogallery-jupiter.html#spot)
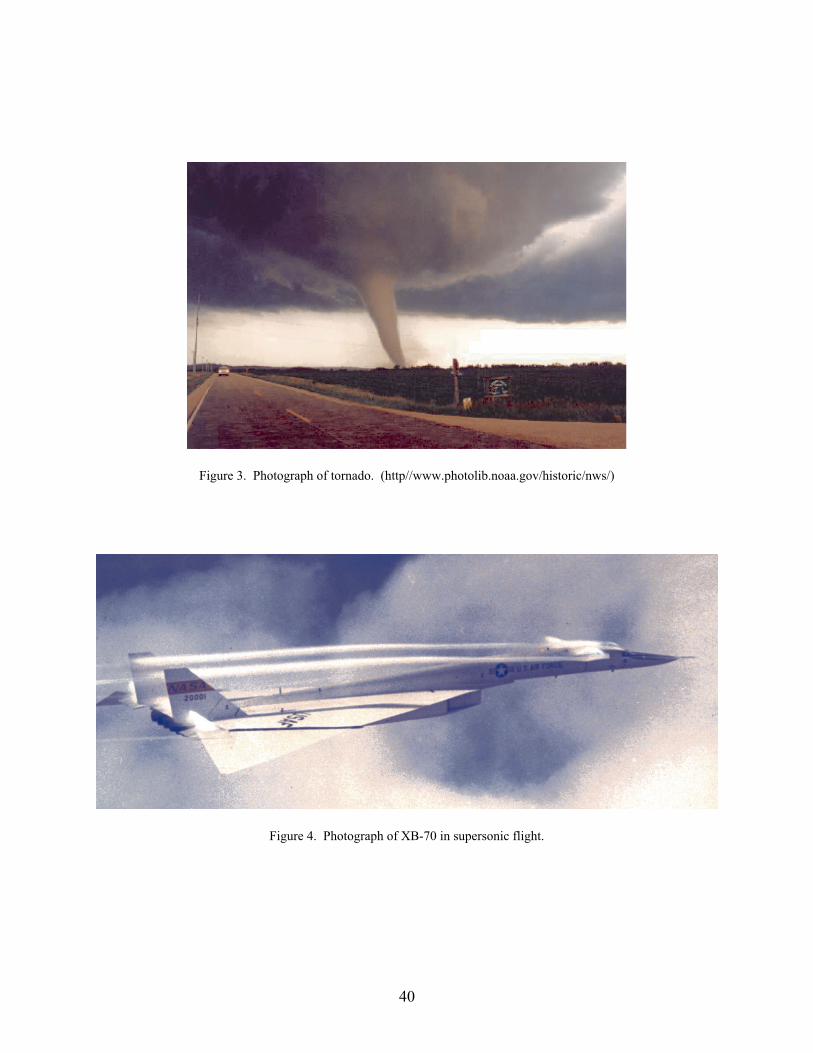
40
Figure 3. Photograph of tornado. (http//www.photolib.noaa.gov/historic/nws/)
Figure 4. Photograph of XB-70 in supersonic flight.
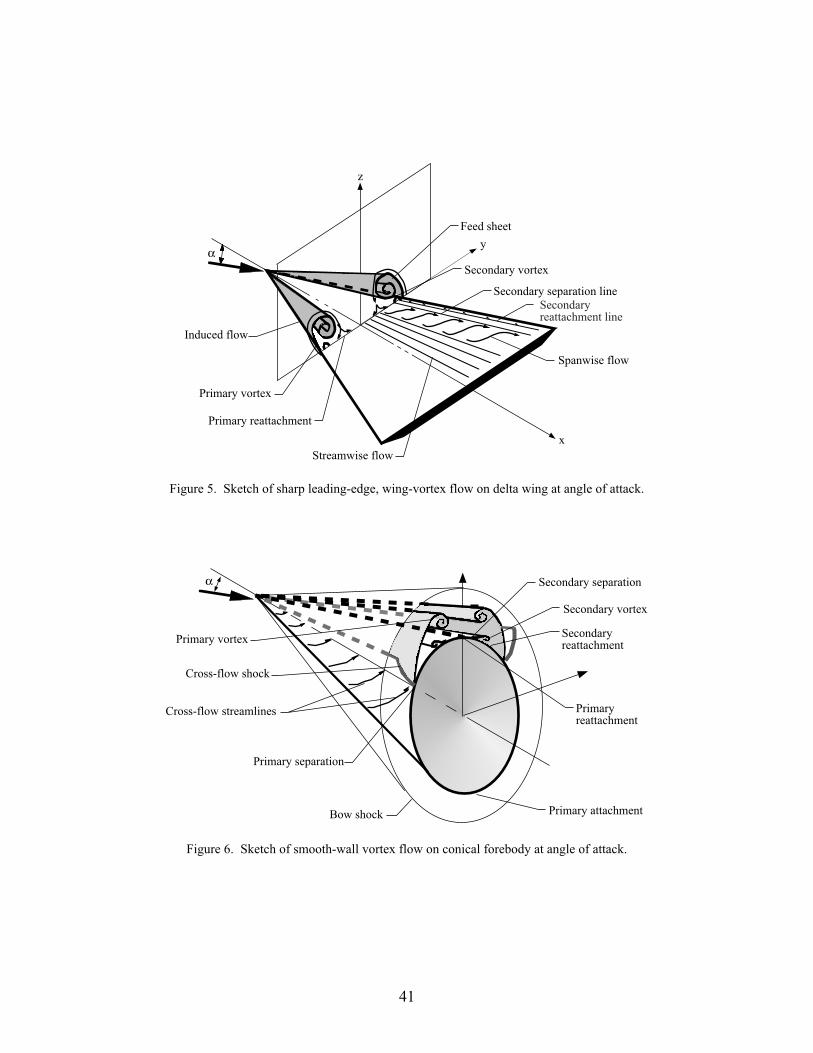
41
α
z
y
x
Feed sheet
Secondary vortex
Spanwise flow
Primary reattachment
Primary vortex
Induced flow
Secondary separation line
Streamwise flow
Secondaryreattachment line
Figure 5. Sketch of sharp leading-edge, wing-vortex flow on delta wing at angle of attack.
α
Primary attachment
Secondary vortex
Primary separation
Secondary separation
Bow shock
Primary vortex
Cross-flow shock
Cross-flow streamlines Primary reattachment
Secondary reattachment
Figure 6. Sketch of smooth-wall vortex flow on conical forebody at angle of attack.

42
αN = tan−1 (tan α/cos ΛLE)
50
40
30
20
10
0 1 2 3
Separated
Attached
MN = M cos ΛLE (1 + sin2 α tan2 ΛLE).5
Figure 7. Stanbrook-Squire lee-side vortex flow classification for delta wings.
1
6
54
3
2
1 Centerline shock
6 Leading-edge separation with shock
5 Shock-induced separation
3 Leading-edge separation
2 Leading-edge separation
Stan
broo
k -
Squi
re
αN = tan−1 (tan α/cos ΛLE)
50
40
30
20
10
0 1 2 3
MN = M cos ΛLE (1 + sin2 α tan2 ΛLE).5
4 Separation with shock
Figure 8. Stanbrooke-Peake lee-side vortex flow classification for delta wings.

43
Stan
broo
k -
Squi
re
5
6
43
2
1
1 Vortex with shock
5 Shock with no separation
4 Shock-induced separation
3 Classical vortex
2 Separation bubble with shock
6 Separated bubble
αN = tan−1 (tan α/cos ΛLE)
50
40
30
20
10
0 1 2 3
MN = M cos ΛLE (1 + sin2 α tan2 ΛLE).5
Figure 9. Miller-Wood lee-side vortex flow classification for delta wings.
Closed-cavity flowL/h 13
Open-cavity flowL/h 10
+
0
−
Expansionwaves Expansion
waves
ExpansionwavesImpingement
shock Exit shock Shock
Transitional closed-cavity flow
10 L/h 13
Transitional open-cavity flow
10 L/h 13
ExpansionwavesExpansion
waves
Expansionwaves Expansion
waves
Impingement/exitshock
Compressionwaves
Cp
+
0
−
Cp
+
0
−
Cp
+
0
−
Cp
∼<∼>
∼<∼< ∼< ∼<
Figure 10. Flow-field sketches and typical pressure distributions of rectangular box cavities at supersonic speeds(ref. 147).
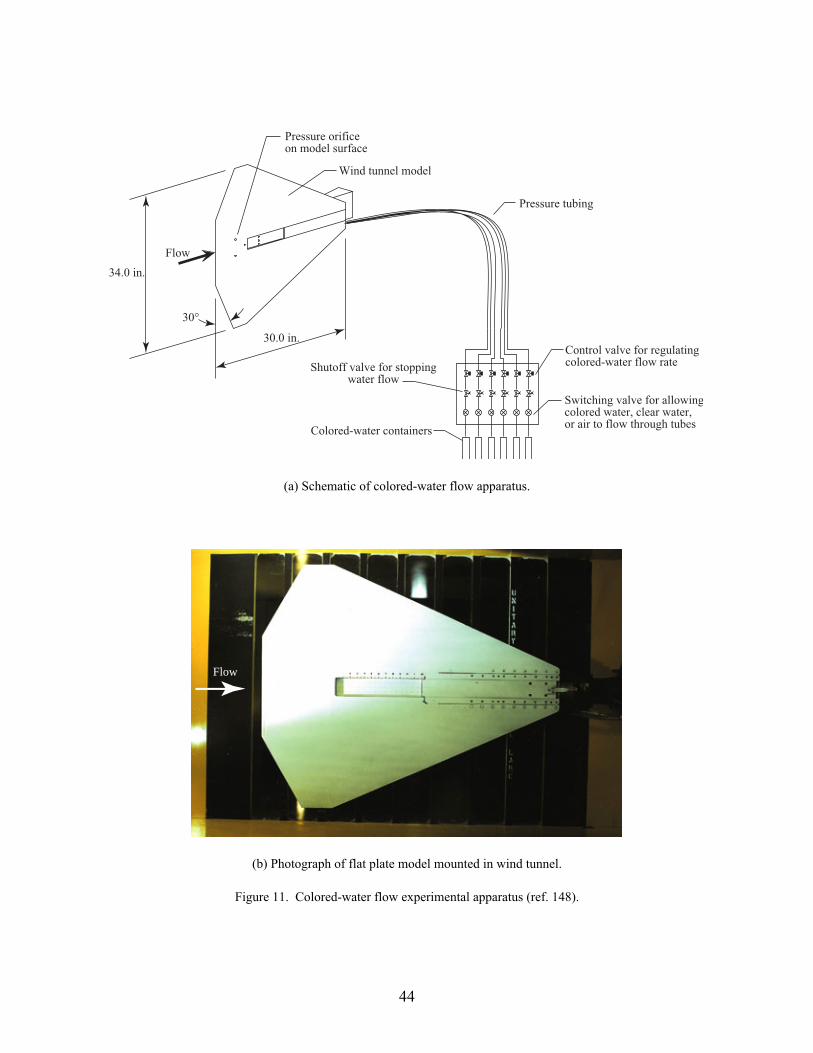
44
Control valve for regulatingcolored-water flow rateShutoff valve for stopping
water flow
Switching valve for allowingcolored water, clear water,or air to flow through tubes
Colored-water containers
Pressure tubing
Wind tunnel model
Pressure orificeon model surface
30°
34.0 in.
30.0 in.
Flow
(a) Schematic of colored-water flow apparatus.
Flow
(b) Photograph of flat plate model mounted in wind tunnel.
Figure 11. Colored-water flow experimental apparatus (ref. 148).

45
L/h = 24.0
L/h 17
L/h 13
L/h 12
1 2 3 4 5 6 7 8
1 2 3 4 5 6
1 2 3 4 5 6
1 2 3 4 5 6 7 8 9 10 11 12
FlowFlow
FlowFlow
FlowFlow
FlowFlow
Blue tinted waterinjected at this orifice
Red tinted water injected from orificeon flat plate 6 in. ahead of cavity
Yellow tinted waterinjected at this orifice
Blue tinted waterinjected at this orifice
Yellow tinted waterinjected at this orifice
Blue tinted waterinjected at this orifice
Yellow tinted waterinjected at this orifice
Blue tinted waterinjected at this orifice
Yellow tinted waterinjected at this orifice
Rotating vortex,cw (green)
Rotating vortex,ccw (green)
Rotating vortex,cw (green)
Rotating vortex,ccw (green)
Rotating vortex, cw (mostly blue, some green)
Rotating vortex, ccw (mostly blue, some green)
Blue tinted water migrating upstream (green)
~~
~~
~~
Figure 12. Visualization of surface flow fields on cavity floor at M∞ = 1.50 using colored-water technique(ref. 148); cavity height = 0.5 in.

46
L/h = 24.0
L/h 17
L/h 14
L/h 13
Blue tinted waterinjected at this orifice
Yellow tinted waterinjected at this orifice
Rotating vortex, cw (mostly blue, some green)
Blue tinted waterinjected at this orifice
Yellow tinted waterinjected at this orifice
Rotating vortex,ccw (green)
Rotating vortex,cw (green)
Blue tinted waterinjected at this orifice
Red tinted water injected from orificeon flat plate 6 in. ahead of cavity
Yellow tinted waterinjected at this orifice
Rotating vortex,cw (green)
Rotating vortex,ccw (green)
Blue tinted waterinjected at this orifice
Yellow tinted waterinjected at this orifice
Rotating vortex,ccw (green)
1 2 3 4 5 6 7 8
1 2 3 4 5 6 7
1 2 3 4 5 6
1 2 3 4 5 6 7 8 9 10 11 12
FlowFlow
FlowFlow
FlowFlow
FlowFlow
~~
~~
~~
Figure 13. Visualization of surface flow fields on cavity floor at M∞ = 2.16 using colored-water technique(ref. 148); cavity height = 0.5 in.

47
7 8 9 10 11 12
7 8 9 10 11 12
Rotating vortex,ccw (green)
Rotating vortex,cw (green)
Blue tinted waterinjected at this orifice
Blue tinted waterinjected at this orifice
Yellow tinted water injected from orificelocated on cavity floor at 3.25 in. = 1.50
= 2.16
Flow Flow
Flow Flow
Rotating vortex,ccw (green)
Yellow tinted water injected from orificelocated on cavity floor at 3.25 in.
Rotating vortex,cw (green)
M∞
M∞
Figure 14. Visualization of cavity floor field at rear of cavity; L/h = 24.0, cavity height = 0.5 in.
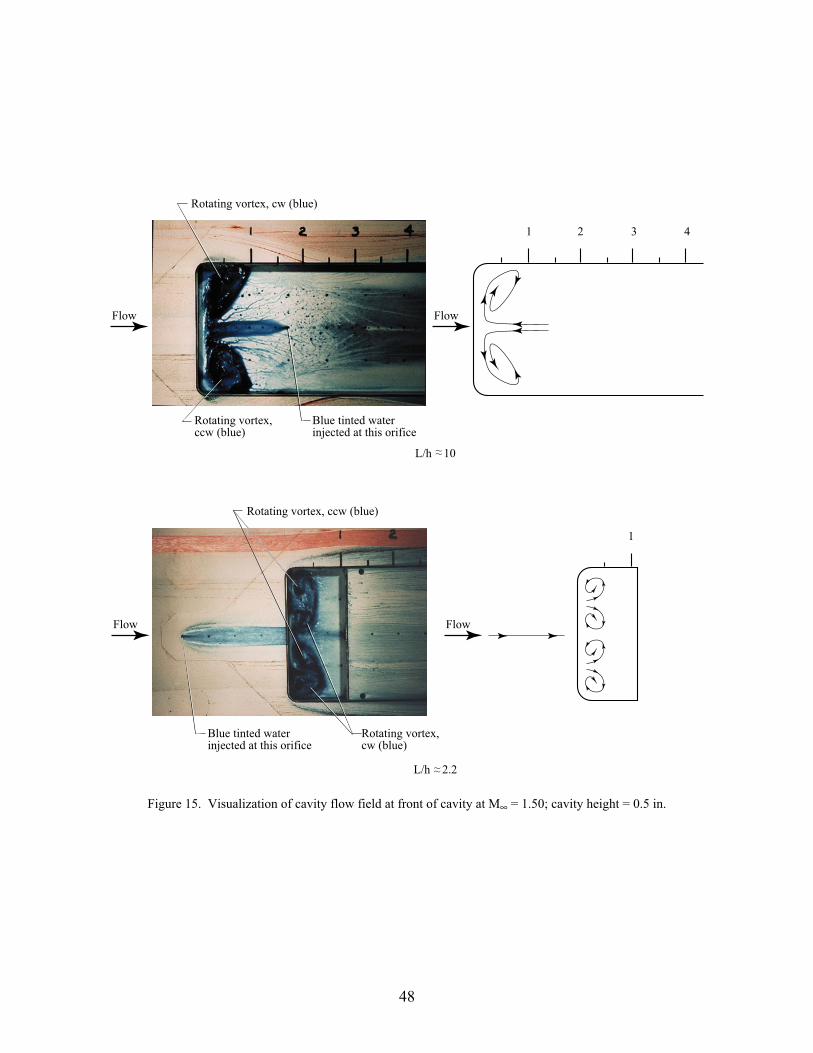
48
1 2 3 4
Flow Flow
Rotating vortex,ccw (blue)
Rotating vortex, cw (blue)
Blue tinted waterinjected at this orifice
L/h 10
Flow Flow
Rotating vortex, ccw (blue)
Rotating vortex,cw (blue)
Blue tinted waterinjected at this orifice
1
L/h 2.2
~~
~~
Figure 15. Visualization of cavity flow field at front of cavity at M∞ = 1.50; cavity height = 0.5 in.

49
Camera housing(mounted inside tunnel)
Light source(mounted outside tunneland shines through a test section window)
Test section windows
Model shadow
Vortices
Light sheet
Flow
Figure 16. Vapor-screen apparatus setup in Langley UPWT (ref. 150).
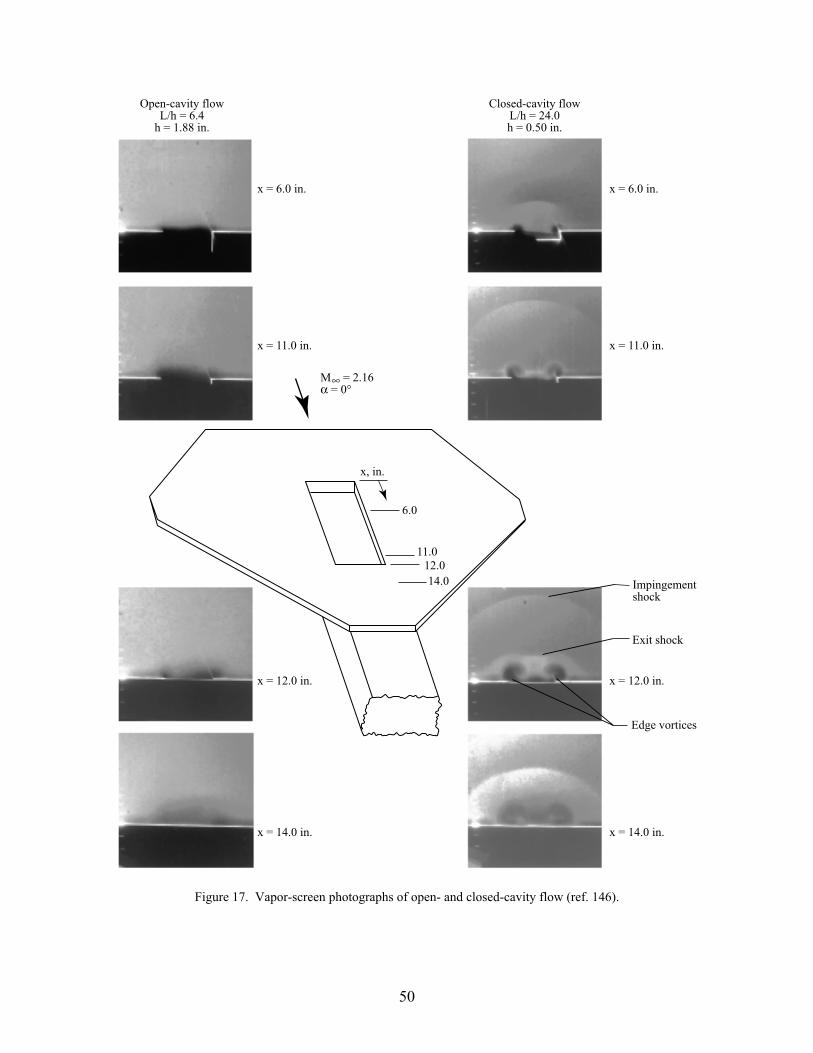
50
x, in.
6.0
11.012.014.0
M = 2.16α = 0°
x = 6.0 in.
x = 11.0 in.
x = 12.0 in.
x = 14.0 in.
x = 6.0 in.
x = 11.0 in.
x = 12.0 in.
x = 14.0 in.
Open-cavity flowL/h = 6.4
h = 1.88 in.
Closed-cavity flowL/h = 24.0h = 0.50 in.
Edge vortices
Impingementshock
Exit shock
∞
Figure 17. Vapor-screen photographs of open- and closed-cavity flow (ref. 146).

51
−1.0 1.000
.2
.4
.6
.8
1.0
z−1.0 1.00
z−1.0 1.00
z−1.0 1.00
z
Cp
1.50
2.16
2.86
M∞
L/h = 24.0 L/h = 16.0 L/h = 4.0 L/h = 1.0
Flow
2.50 in.
+z
0.25 in.
0.50 in.
Figure 18. Lateral pressure distribution measured on cavity rear face (ref. 140); cavity width = 2.5 in.
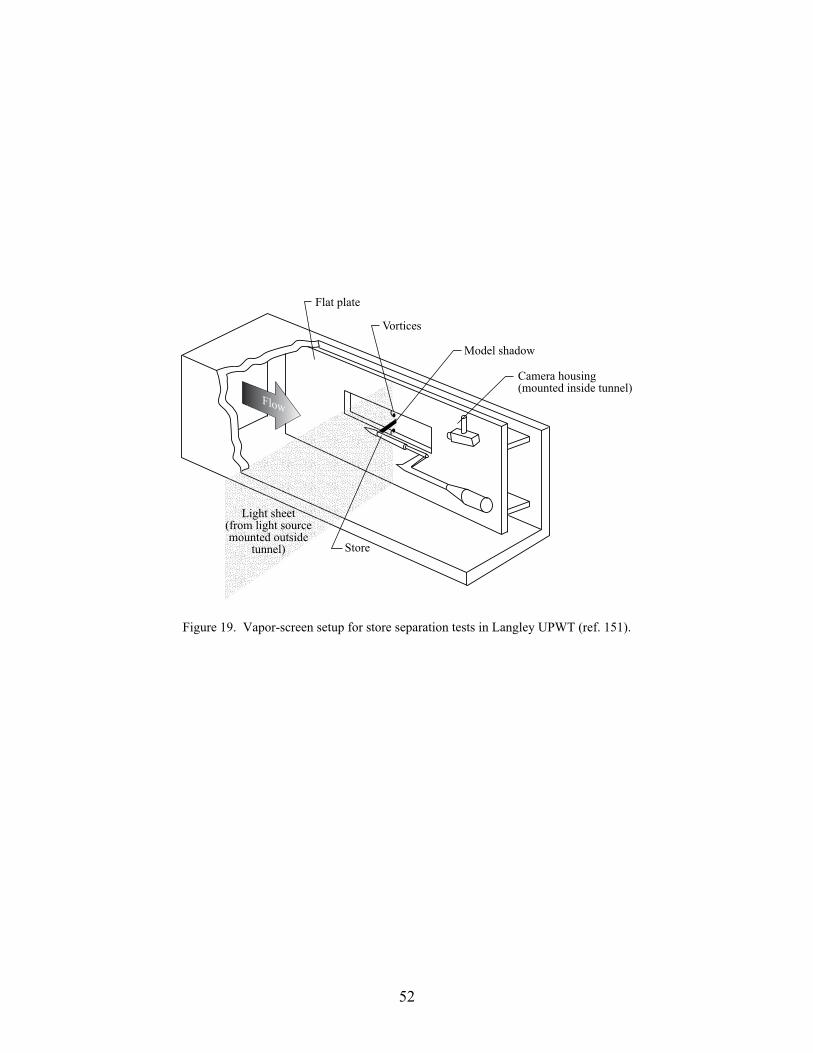
52
Flow
Camera housing(mounted inside tunnel)
Vortices
Flat plate
Light sheet(from light sourcemounted outside
tunnel) Store
Model shadow
Figure 19. Vapor-screen setup for store separation tests in Langley UPWT (ref. 151).
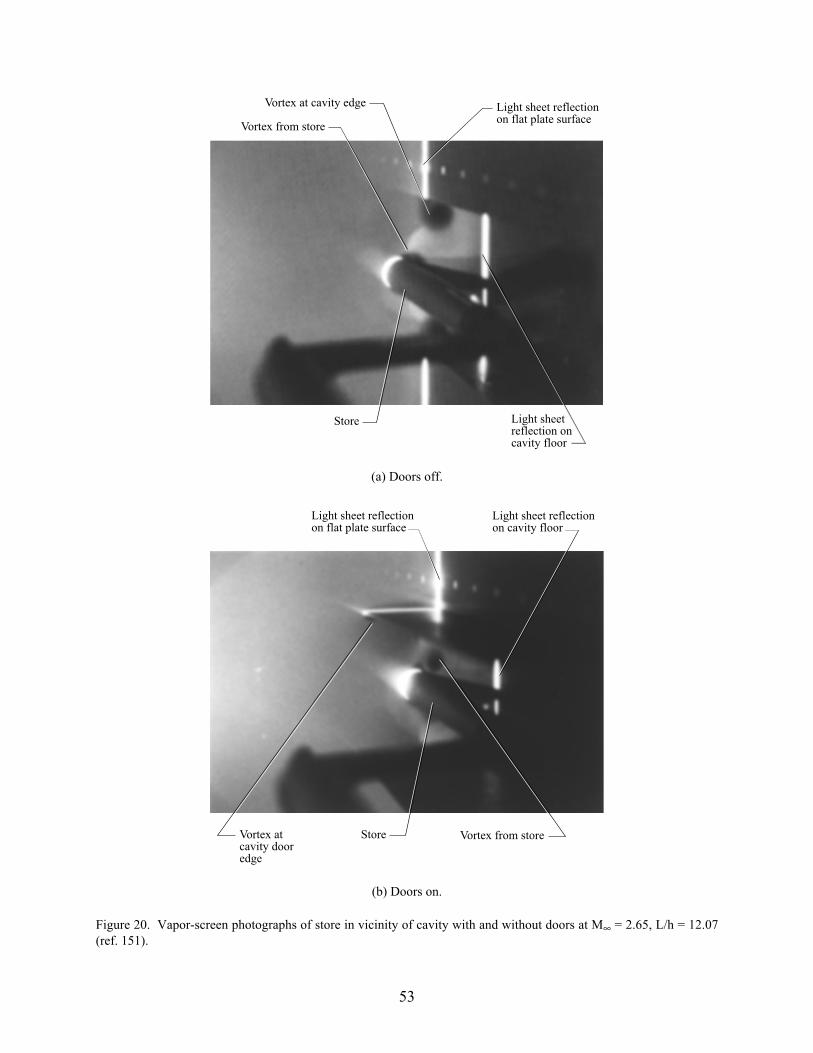
53
Light sheet reflectionon flat plate surface
Vortex at cavity edge
Vortex from store
Light sheet reflection on cavity floor
Store
(a) Doors off.
Light sheet reflectionon flat plate surface
Vortex at cavity door edge
Vortex from store
Light sheet reflectionon cavity floor
Store
(b) Doors on.
Figure 20. Vapor-screen photographs of store in vicinity of cavity with and without doors at M∞ = 2.65, L/h = 12.07(ref. 151).

54
Still camera
Video camera
Figure 21. Photograph of wing-body missile model in Langley UPWT (ref. 152).
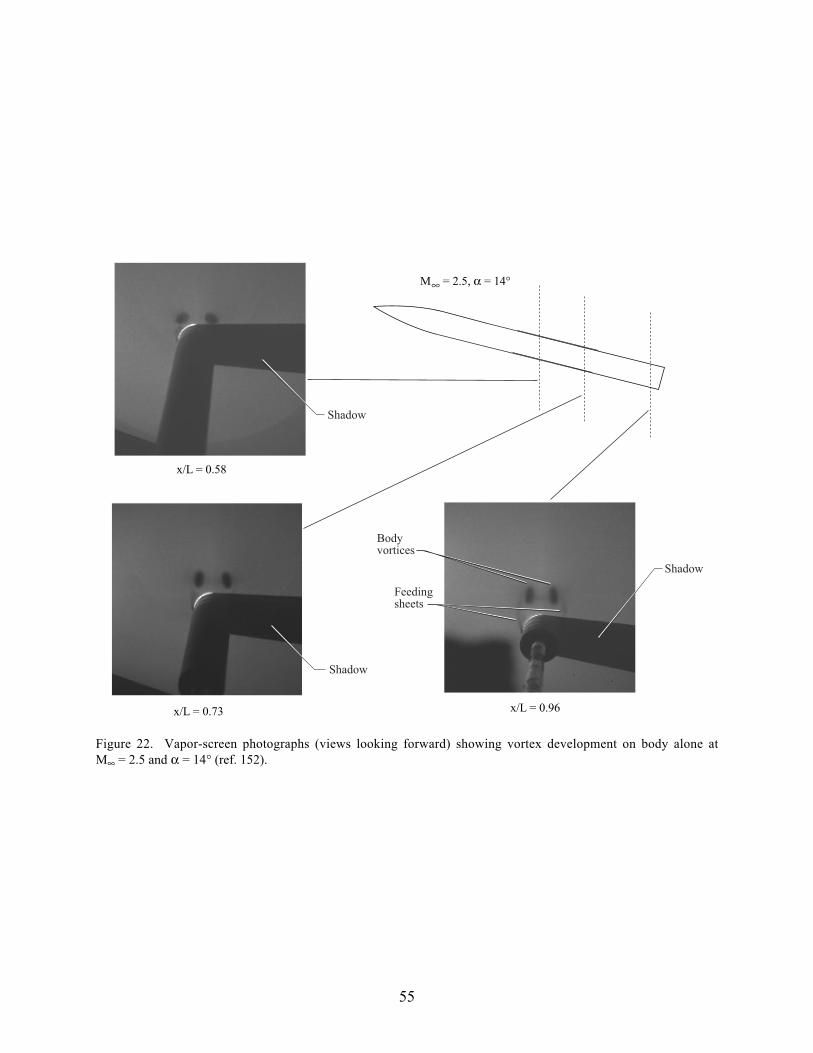
55
M = 2.5, α = 14°
x/L = 0.58
x/L = 0.73 x/L = 0.96
Feedingsheets
Bodyvortices
Shadow
Shadow
Shadow
∞
Figure 22. Vapor-screen photographs (views looking forward) showing vortex development on body alone atM∞ = 2.5 and α = 14° (ref. 152).

56
M = 2.5, α = 14°, φ = 0°
x/L = 0.58
x/L = 0.73 x/L = 0.96
Body vortex
Shadow
Shadow
ShadowWing vortex
∞
Figure 23. Vapor-screen photographs (views looking forward) showing vortex development on body-wing missilemodel at M∞ = 2.5 and α = 14° (ref. 152).

57
5
20
35
1.4
−.2
CNF
0φ
φCNF
Body vortices
α, deg
Region offorce reversal
180
Figure 24. Plot of fin normal force coefficient as function of fin roll position at M∞ = 2.0 (ref. 153).
Figure 25. Photograph of variant of Sidewinder missile model in Langley UPWT (ref. 154).

58
A
B
C
D
Tail
off
α, deg
0 5 10 15 20−2.5
−2.0
−1.5
−1.0
−.05
0
.5
Cl
M = 2.5, φ = 0°, δROLL = −10°
δ = −5°
δ = 5°
∞
Figure 26. Effect of tail span on Sidewinder missile variant rolling moment at M∞ = 2.5 (ref. 154).
x/L = .42
x/L = .60x/L = .74
x/L = .88x/L = 1.02
φ = 0°
δ = 0°
Bodyvortex
Wingvortex
Wingvortex
Wingvortex
Bodyvortex
Bodyvortex
M = 2.36 α = 11.4°
x/L = .28
Bodyvortex
∞
Figure 27. Vapor-screen photographs (views looking forward) showing vortex development on Sparrow missile atM∞ = 2.36 and α = 11.4° (ref. 116).
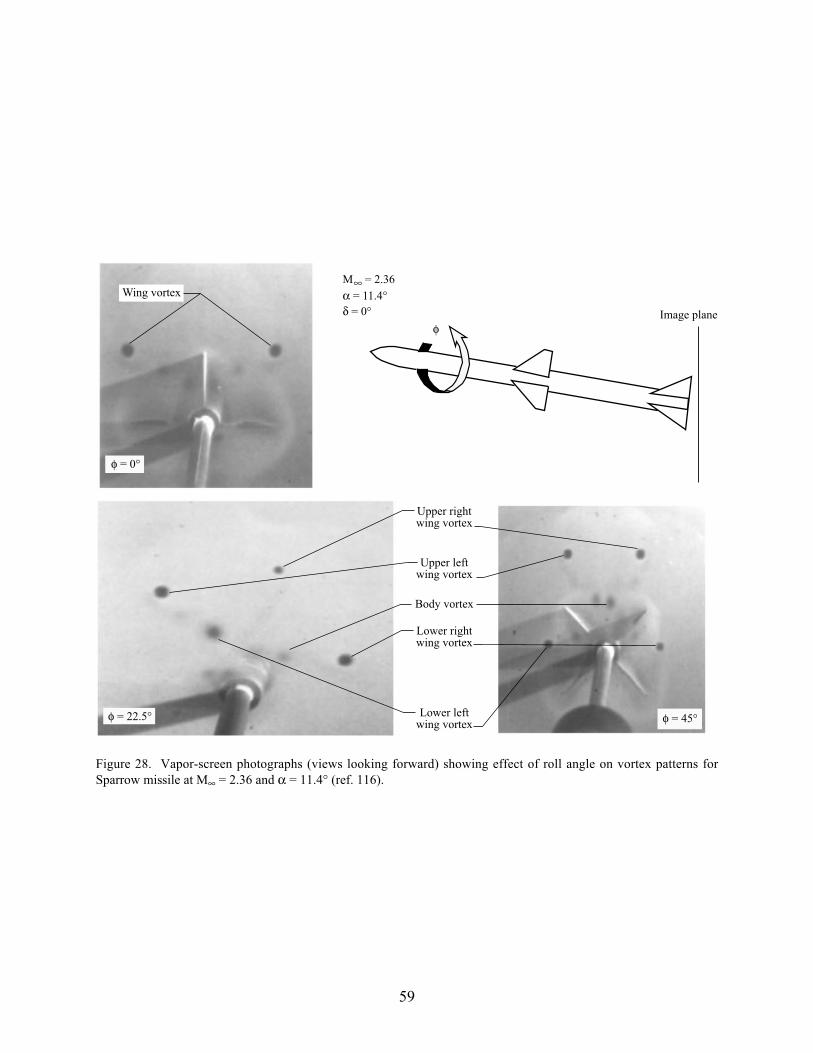
59
φImage plane
Upper rightwing vortex
Upper leftwing vortex
Lower rightwing vortex
Lower leftwing vortex
Body vortex
Wing vortex
δ = 0°
φ = 0°
φ = 22.5° φ = 45°
α = 11.4°M = 2.36∞
Figure 28. Vapor-screen photographs (views looking forward) showing effect of roll angle on vortex patterns forSparrow missile at M∞ = 2.36 and α = 11.4° (ref. 116).
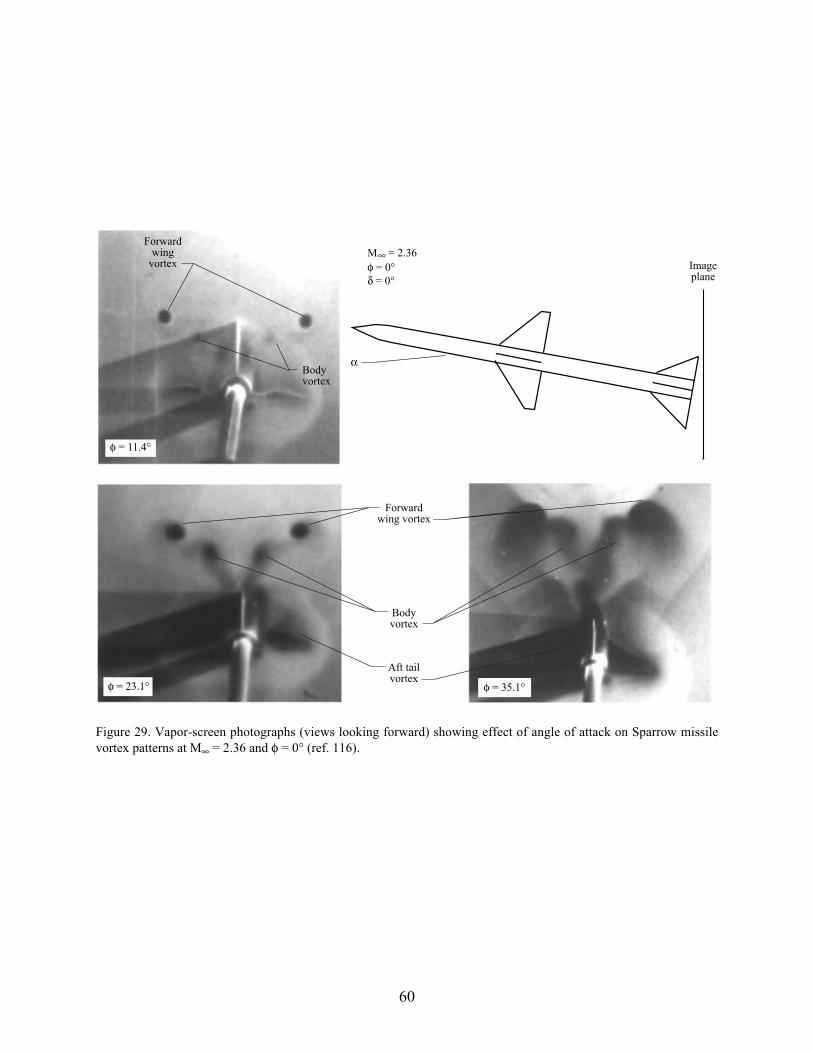
60
Imageplane
Forwardwing vortex
Aft tailvortex
Bodyvortex
Forwardwing
vortex
Bodyvortex
δ = 0°
α
φ = 35.1°φ = 23.1°
φ = 11.4°
φ = 0°M = 2.36∞
Figure 29. Vapor-screen photographs (views looking forward) showing effect of angle of attack on Sparrow missilevortex patterns at M∞ = 2.36 and φ = 0° (ref. 116).
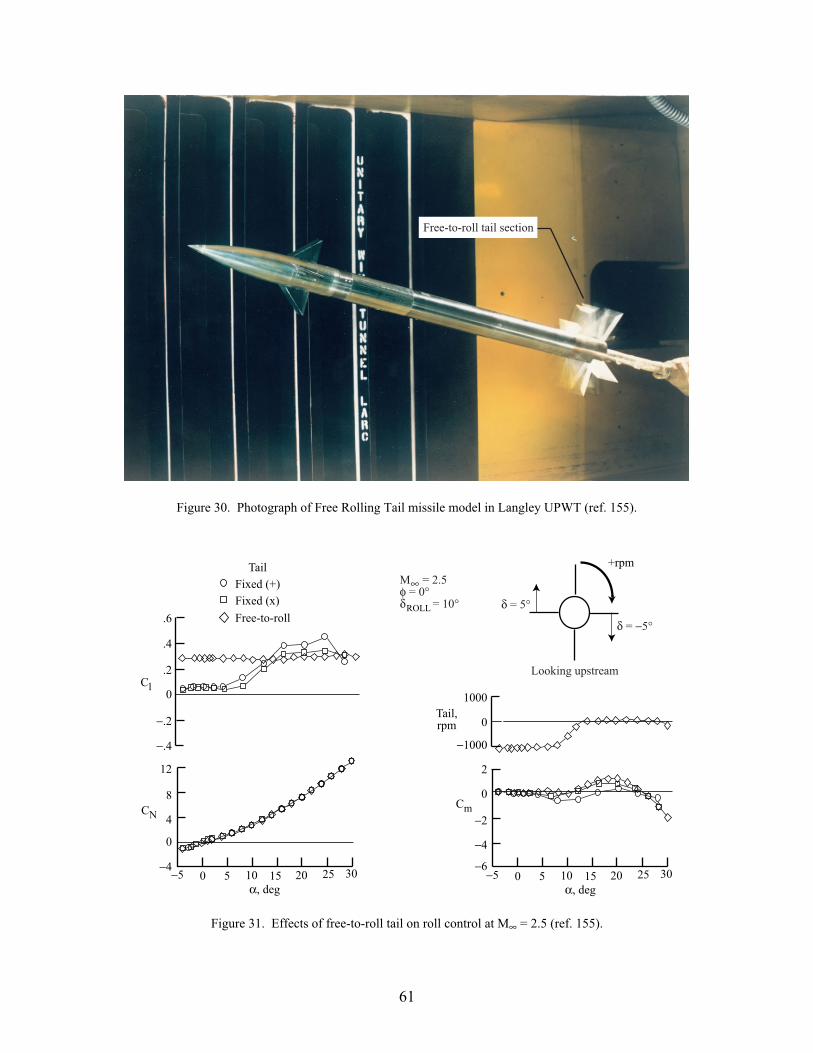
61
Free-to-roll tail section
Figure 30. Photograph of Free Rolling Tail missile model in Langley UPWT (ref. 155).
M = 2.5φ = 0°δ = 10°
TailFixed (+)Fixed (x)
Free-to-roll
1000
−1000
0Tail,rpm
−6
δ = −5°
δ = 5°
2
0
−2
−4
Cm
−5 0 5 10 15 20 25 30α, deg
CN
12
8
4
0
−4
−.4
.6
.4
.2
0
−.2
Cl
−5 0 5 10 15 20 25 30α, deg
+rpm
Looking upstream
ROLL
∞
Figure 31. Effects of free-to-roll tail on roll control at M∞ = 2.5 (ref. 155).

62
Figure 32. Photograph of sharp-nose 3-to-1 elliptical body model in Langley UPWT (ref. 117).
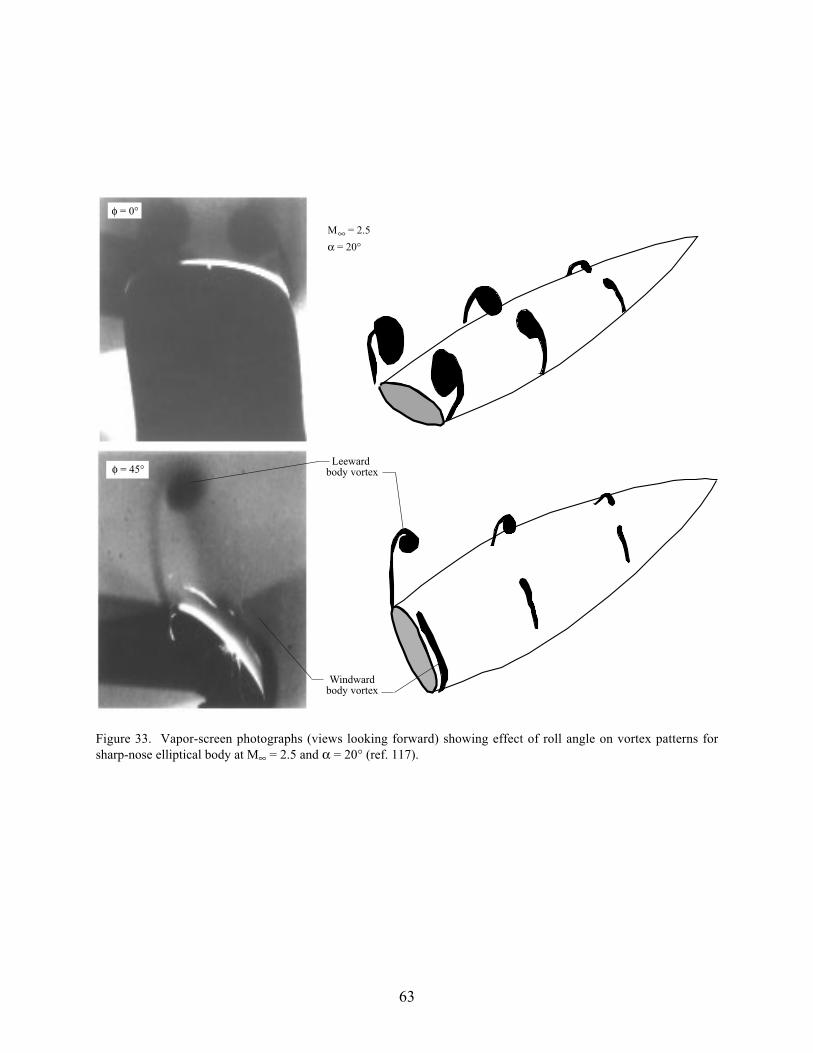
63
M = 2.5
α = 20°
Leeward body vortex
Windwardbody vortex
φ = 0°
φ = 45°
∞
Figure 33. Vapor-screen photographs (views looking forward) showing effect of roll angle on vortex patterns forsharp-nose elliptical body at M∞ = 2.5 and α = 20° (ref. 117).

64
M = 2.5α = 20°
Leeward body vortex
Windwardbody vortex
φ = 0°
φ = 45°
∞
Figure 34. Vapor-screen photographs (views looking forward) showing effect of roll angle on vortex patterns forblunt-nose elliptical body at M∞ = 2.5 and α = 20° (ref. 117).
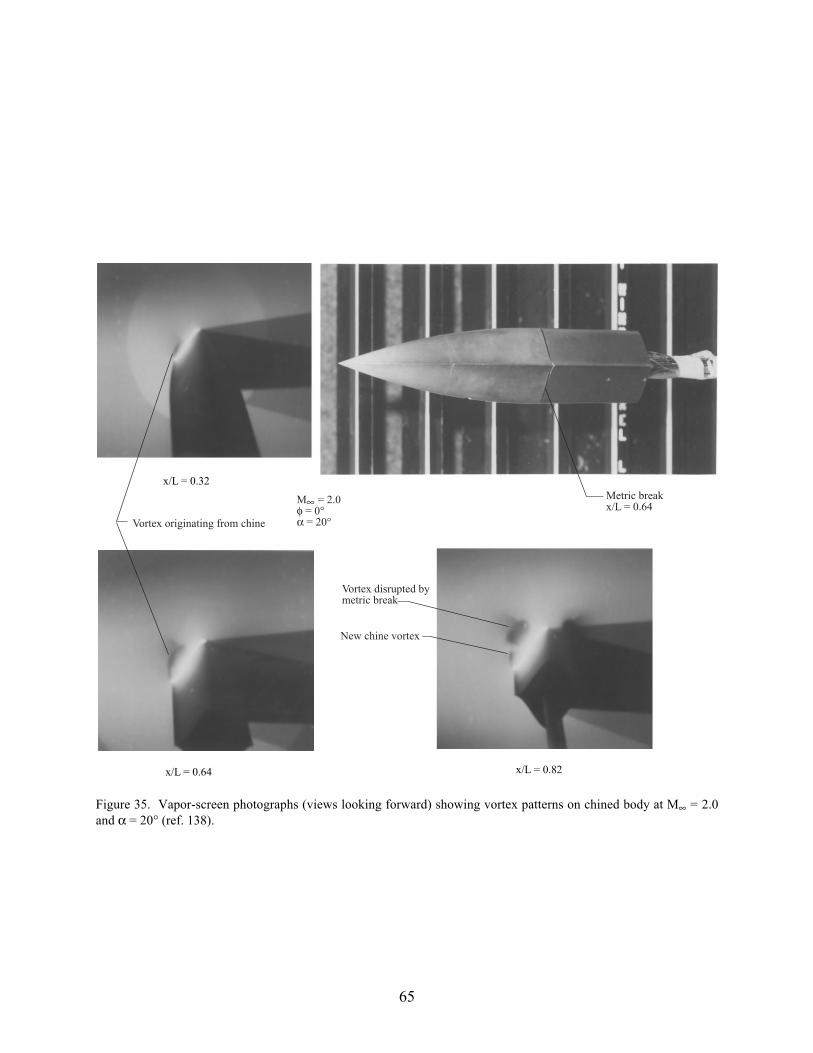
65
x/L = 0.32
x/L = 0.64 x/L = 0.82
M = 2.0 φ = 0°α = 20°Vortex originating from chine
Vortex disrupted bymetric break
New chine vortex
Metric breakx/L = 0.64∞
Figure 35. Vapor-screen photographs (views looking forward) showing vortex patterns on chined body at M∞ = 2.0and α = 20° (ref. 138).

66
x/L = 0.76
Separation bubble
Nosevortex
U∞
Figure 36. Lee-side flow characteristics for ogee planform wing at Mach 2.4 and angle of attack of 5° (ref. 158).
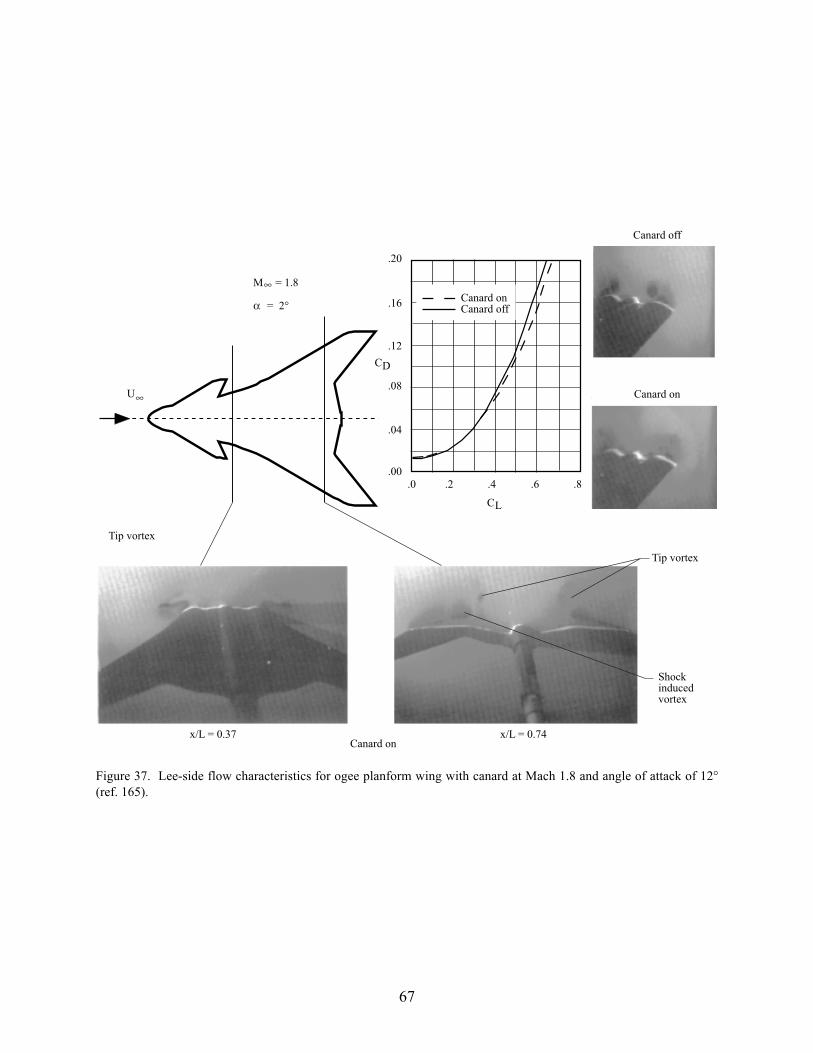
67
.20
.16
.12
.08
.04
.00.0 .2 .4 .6 .8
CL
CD
x/L = 0.37 x/L = 0.74Canard on
Tip vortex
Tip vortex
Shockinducedvortex
M = 1.8
= 2°
U Canard on
Canard off
αCanard onCanard off
∞
∞
Figure 37. Lee-side flow characteristics for ogee planform wing with canard at Mach 1.8 and angle of attack of 12°(ref. 165).
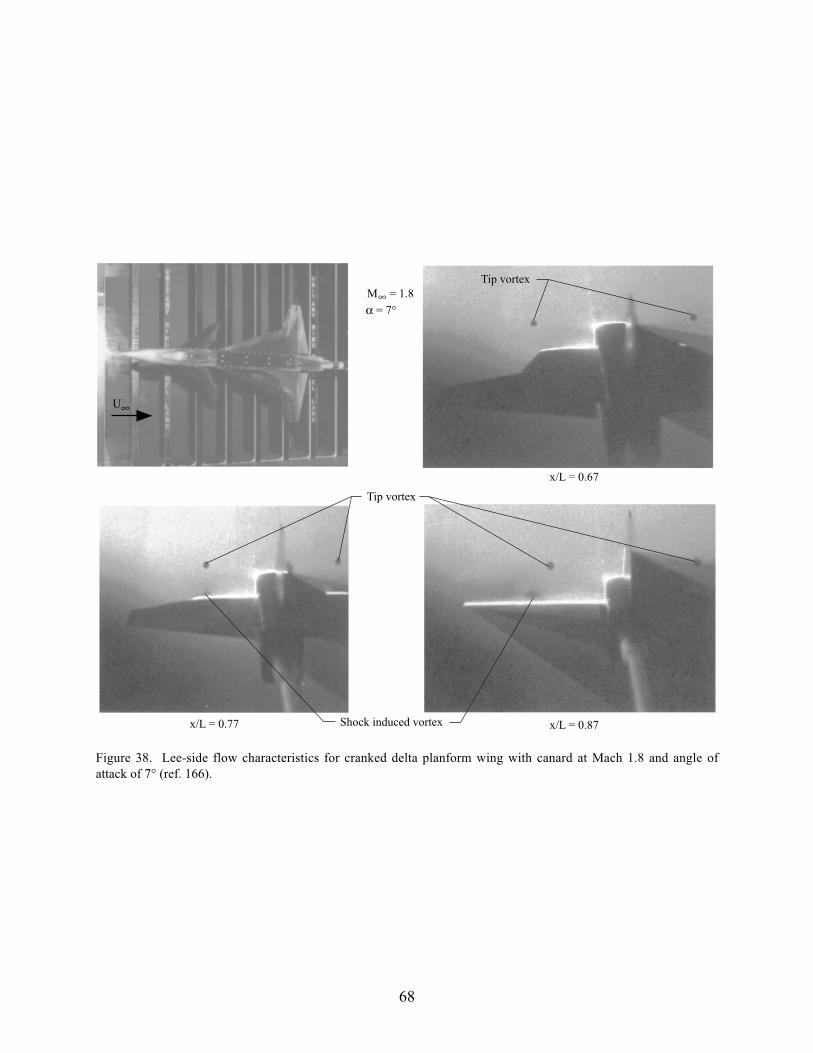
68
x/L = 0.67
Tip vortex
x/L = 0.77 x/L = 0.87
Tip vortex
Shock induced vortex
M = 1.8
α = 7°
U∞
∞
Figure 38. Lee-side flow characteristics for cranked delta planform wing with canard at Mach 1.8 and angle ofattack of 7° (ref. 166).

69
M = 3.5α = 10°
U∞
Body vortexWing vortex
x/L = 0.38 x/L = 0.58
Wing and body vortex
∞
Figure 39. Lee-side flow characteristics for delta planform wing with strake and body at Mach 3.5 and angle ofattack of 10° (ref. 160).

70
M = 1.8
α = 10°
.12
.08
.04
0−.2 0 .2 .4
Uncambered
Cambered
CD
CL
Shock
Vortex
U∞ ∞
Figure 40. Lee-side flow characteristics for cranked arrow planform wing with body at Mach 1.8 and angle of attackof 10° (ref. 167).
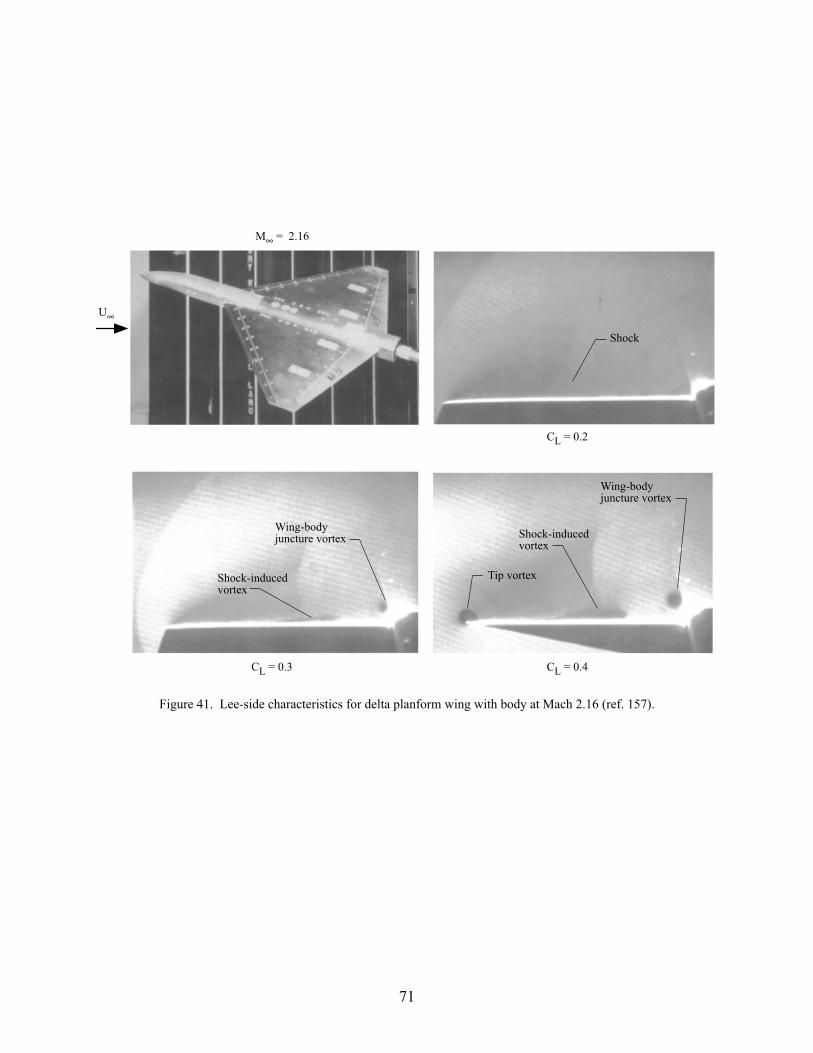
71
CL = 0.3 CL = 0.4
CL = 0.2
Tip vortex
Shock
Shock-induced vortex
Wing-body juncture vortex Shock-induced
vortex
Wing-body juncture vortex
M∞ = 2.16
U∞
Figure 41. Lee-side characteristics for delta planform wing with body at Mach 2.16 (ref. 157).

72
x/L = 0.3 x/L = 0.9
M∞ = 1.6α = 12°
Shock-inducedvortex
Shock-inducedvortex
U∞
Figure 42. Lee-side flow characteristics for delta planform wing with body at Mach 1.6 and angle of attack of 12°(ref. 161).

73
M∞ = 2.16
α = 16.0°
Body vortex
Shock-inducedvortex Wing vortex
Wing vortex
Wing vortex
Body vortex
Sketch ofschlierenshock patterns
Shock-inducedvortex
Sketch of oil flowpatterns
U∞
Figure 43. Lee-side flow characteristics for delta planform wing with multiple bodies at Mach 2.16 and angle ofattack of 16° (ref. 163).

74
M∞ = 2.16
α = 16.0°
Shock-induced vortex
Body vortex Wing vortex
Body vortex
Sketch ofschlierenshock patterns
Sketch of oil flowpatterns
U∞
Figure 44. Lee-side flow characteristics for trapezoidal planform wing with multiple bodies at Mach 2.16 and angleof attack of 16° (ref. 163).
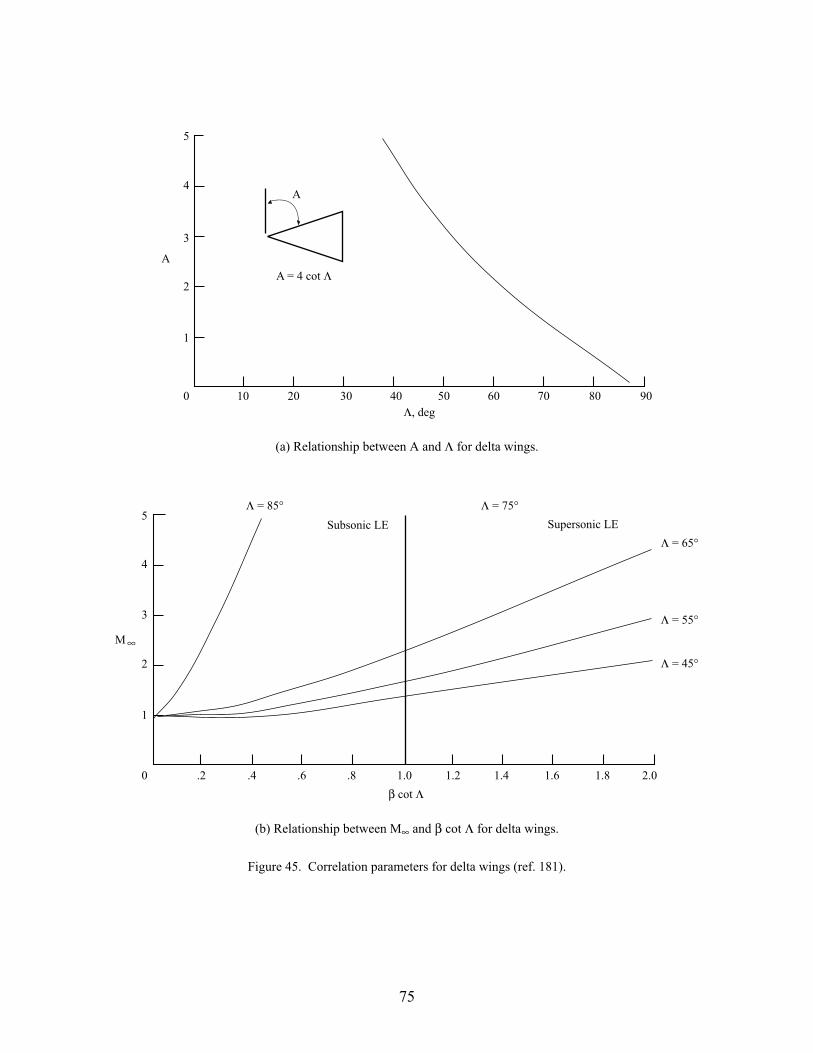
75
A
Λ, deg0 10 20 30 40 50 60 908070
1
2
3
4
5
A = 4 cot Λ
A
(a) Relationship between A and Λ for delta wings.
.20 .4 .6 .8 1.0 1.2 1.4 1.6 1.8 2.0
Λ = 45°
Λ = 55°
Λ = 65°
Λ = 85° Λ = 75°
Subsonic LE Supersonic LE
β cot Λ
M
1
2
3
4
5
∞
(b) Relationship between M∞ and β cot Λ for delta wings.
Figure 45. Correlation parameters for delta wings (ref. 181).

76
Sharp
Blunt
Thin
Thick
(a) Sketches of representative airfoils.
Figure 46. Lift characteristics of delta wings at supersonic speeds (ref. 181).

77
.08
.04
0 1 2 3
Linear theory
Thick wing
Wing withzero thickness
β cot Λ
CL , deg−1
Wing LE sweep Mach number48.00−73.1063.43−82.8760.00−71.6076.00−84.6076.0045.00−64.0065.0063.4360.0068.40
1.62−2.411.60−4.604.071.96−3.301.30−2.801.55−2.321.51−2.001.534.041.60−1.90
,α
(b) Lift characteristics of sharp leading-edge delta wings with varying thicknesses.
Lineartheory
Wing withzero thickness
Wing LE sweep Mach number
76.00−84.6065.0036.40−70.6063.26
1.96−3.301.51−2.001.43−1.711.30−2.22
.08
.04
0 1 2 3β cot Λ
CL , deg−1,α
(c) Lift characteristics of thin delta wings with varying leading-edge bluntness.
Figure 46. Concluded.
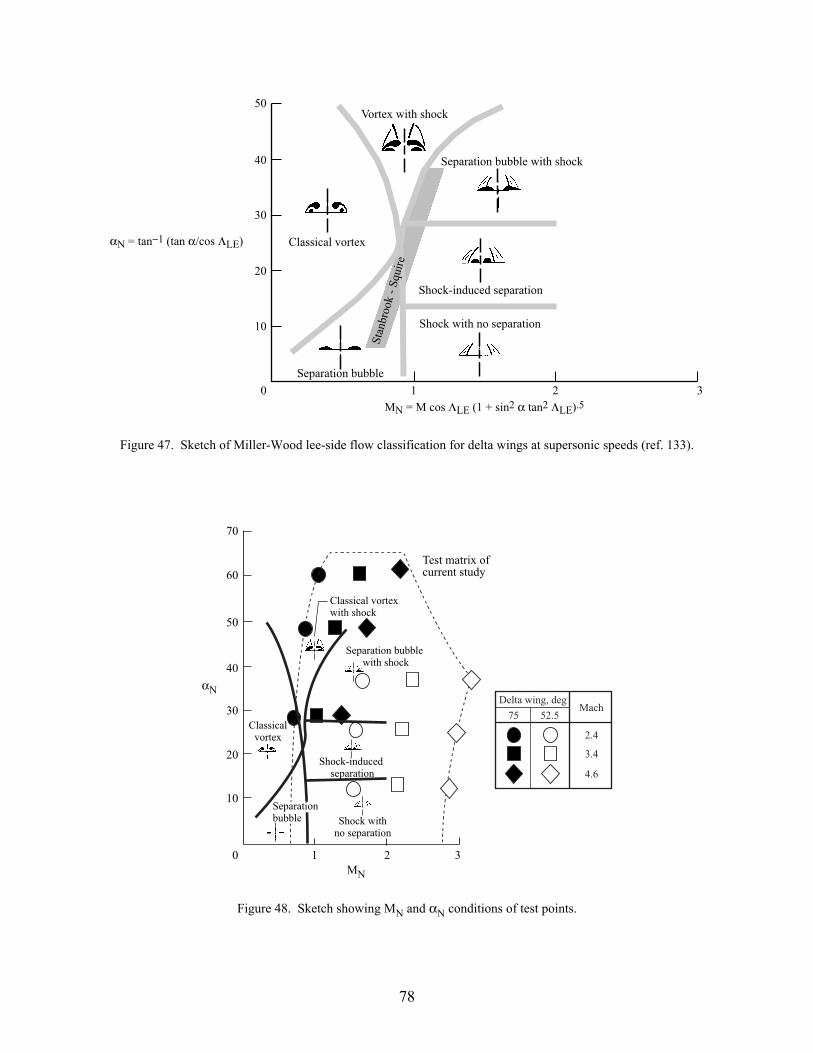
78
Separation bubble
Classical vortex
Vortex with shock
Separation bubble with shock
Shock-induced separation
Shock with no separation
Stan
broo
k - S
quir
e
αN = tan−1 (tan α/cos ΛLE)
50
40
30
20
10
0 1 2 3MN = M cos ΛLE (1 + sin2 α tan2 ΛLE).5
Figure 47. Sketch of Miller-Wood lee-side flow classification for delta wings at supersonic speeds (ref. 133).
Classicalvortex
Classical vortex with shock
Separation bubble with shock
Shock-induced separation
Shock withno separation
αN
50
40
30
20
10
1 2 3MN
0
60
70
Delta wing, degMach
75 52.5
2.4
3.4
4.6
Test matrix ofcurrent study
Separation bubble
Figure 48. Sketch showing MN and αN conditions of test points.

79
αN
MN
70
0 3
α = 24°α = 16°
α = 8°
Primary vortex
Secondary vortex
Cross-flow shock
Primary vortex
(a) M∞ = 2.4.
Secondary vortex
Cross-flow shock
Primary vortex αN
MN
70
0 3
α = 24°α = 16°
α = 8°
Secondary vortex
Cross-flow shock
Primary vortex
(b) M∞ = 3.4.
Figure 49. Vapor-screen photographs of 75° delta wing model in Langley UPWT at α = 8°, 16°, and 24° (ref. 112).

80
Bubble
Cross-flow shock
Bubble
Cross-flow shock
αN
MN
70
0 3
α = 24°α = 16°
α = 8°
(c) M∞ = 4.6.
Figure 49. Concluded.
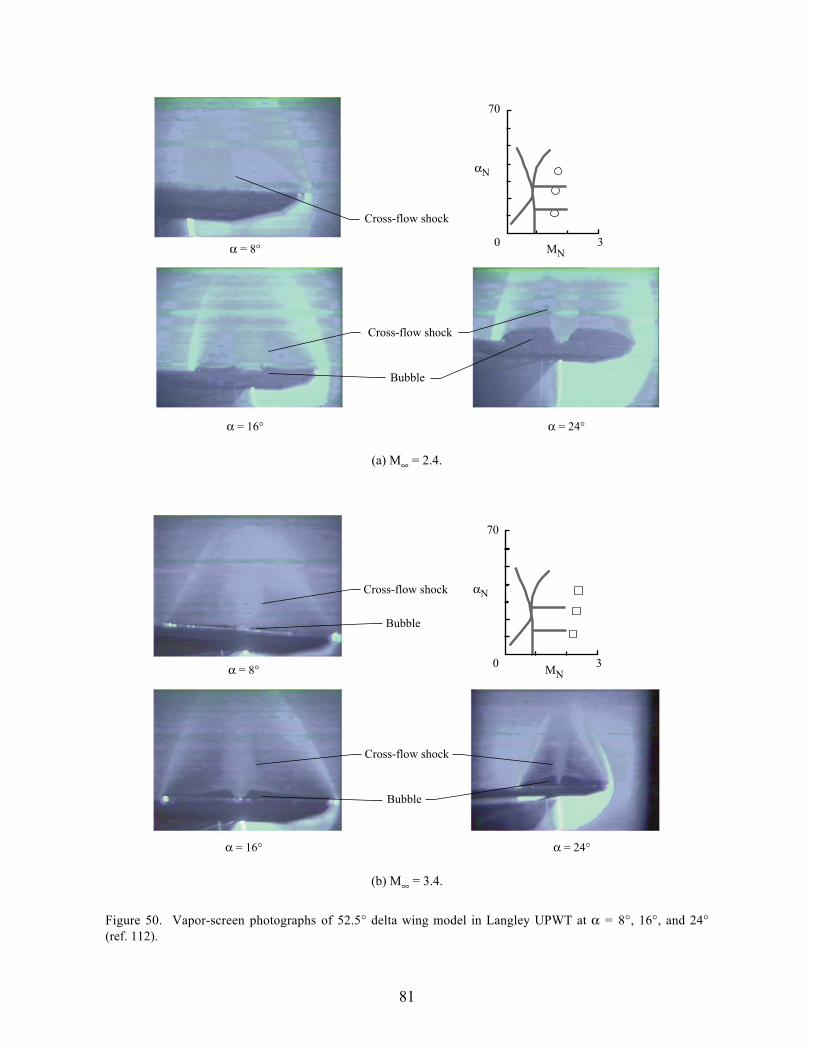
81
Cross-flow shock
Bubble
Cross-flow shock
αN
MN
70
0 3
α = 24°α = 16°
α = 8°
(a) M∞ = 2.4.
Bubble
Cross-flow shock
Bubble
Cross-flow shock αN
MN
70
0 3
α = 24°α = 16°
α = 8°
(b) M∞ = 3.4.
Figure 50. Vapor-screen photographs of 52.5° delta wing model in Langley UPWT at α = 8°, 16°, and 24°(ref. 112).

82
Bubble
Cross-flow shock
Bubble
Cross-flow shock αN
MN
70
0 3
α = 24°α = 16°
α = 8°
(c) M∞ = 4.6.
Figure 50. Concluded.

83
Wings with zero thickness
Vortex action line
Cross section,delta wing
Wing slopeangle, deg
60°
30°
30°
50 60 70 80
1.5 2.0 2.5 3.020151050
.9
1.0
.8
.7
.6
.5
.4
ηv
.9
1.0
.8
.7
.6
.5
.4
ηv
Λ = 75°, α = 8°
M = 2.0, α = 8°
Λ = 75°, M = 2.0
Mα, deg
Λ, deg
∞
∞
∞
Figure 51. Location of vortex action line for thick delta wings at supersonic speeds (ref. 182).
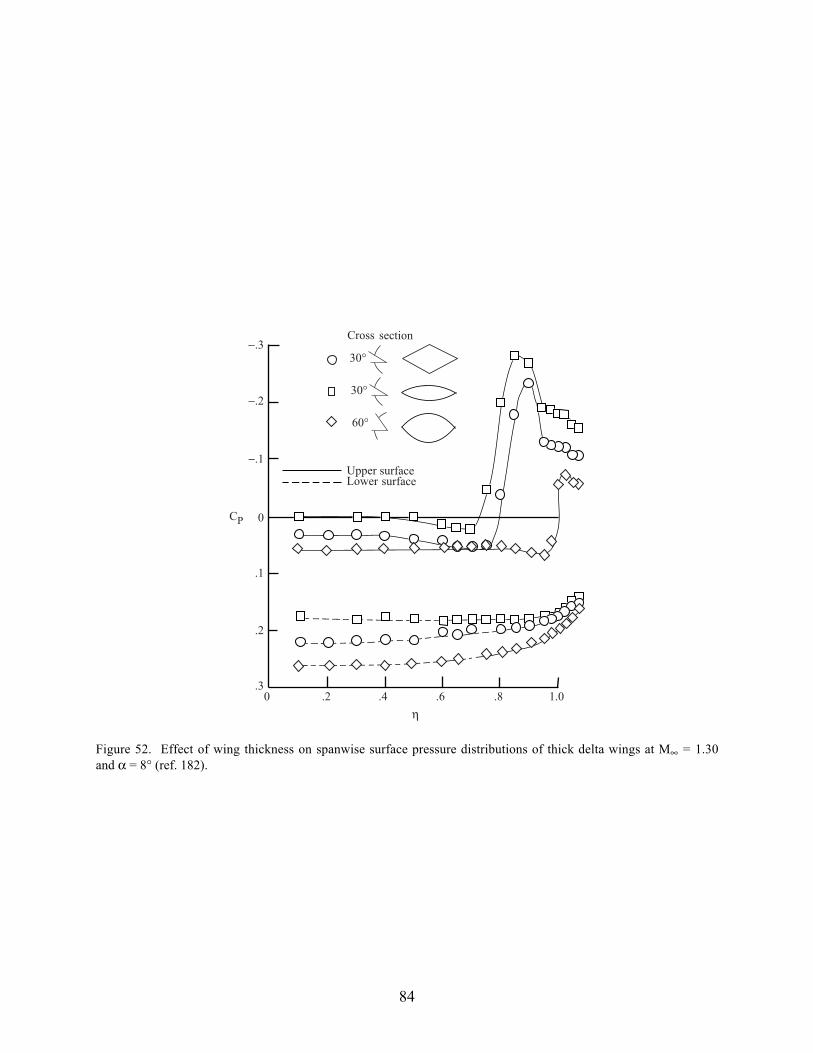
84
Upper surfaceLower surface
Cross section−.3
−.2
−.1
0
.1
.2
.30 .2 .4 .6 .8 1.0
CP
η
60°
30°
30°
Figure 52. Effect of wing thickness on spanwise surface pressure distributions of thick delta wings at M∞ = 1.30and α = 8° (ref. 182).
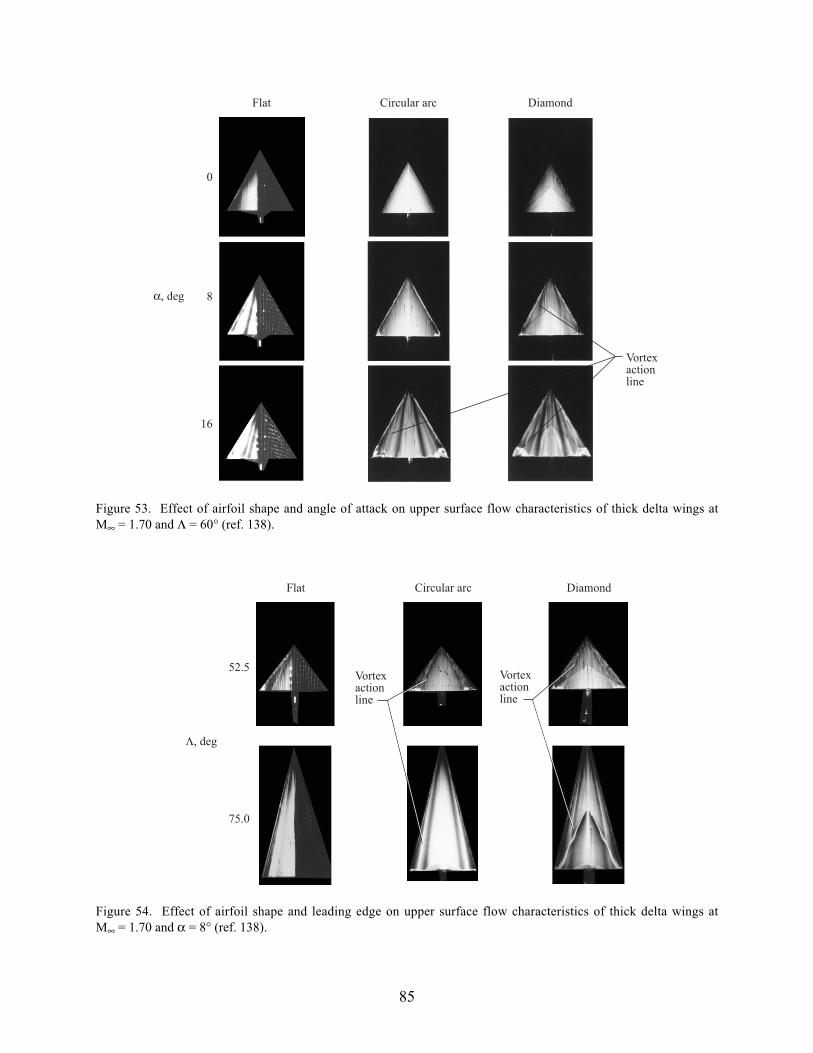
85
16
8
0
α, deg
Flat Circular arc Diamond
Vortex actionline
Figure 53. Effect of airfoil shape and angle of attack on upper surface flow characteristics of thick delta wings atM∞ = 1.70 and Λ = 60° (ref. 138).
75.0
52.5
Λ, deg
Flat Circular arc Diamond
Vortex actionline
Vortex actionline
Figure 54. Effect of airfoil shape and leading edge on upper surface flow characteristics of thick delta wings atM∞ = 1.70 and α = 8° (ref. 138).

86
Shock Ridge line
Cp
Cp
Cp
.1
0
−.1
−.20 1.75
0 2.5
Shock Ridge line.1
0
−.1
−.2
3.00z
ShockRidge line
.1
0
−.1
−.2
x/L = 0.6
x/L = 0.8
x/L = 0.95Λ = 75°
Figure 55. Effect of airfoil shape on upper surface flow characteristics of a 75° swept delta wing with diamondairfoil at M∞ = 2.00 and α = 0° (ref. 138).
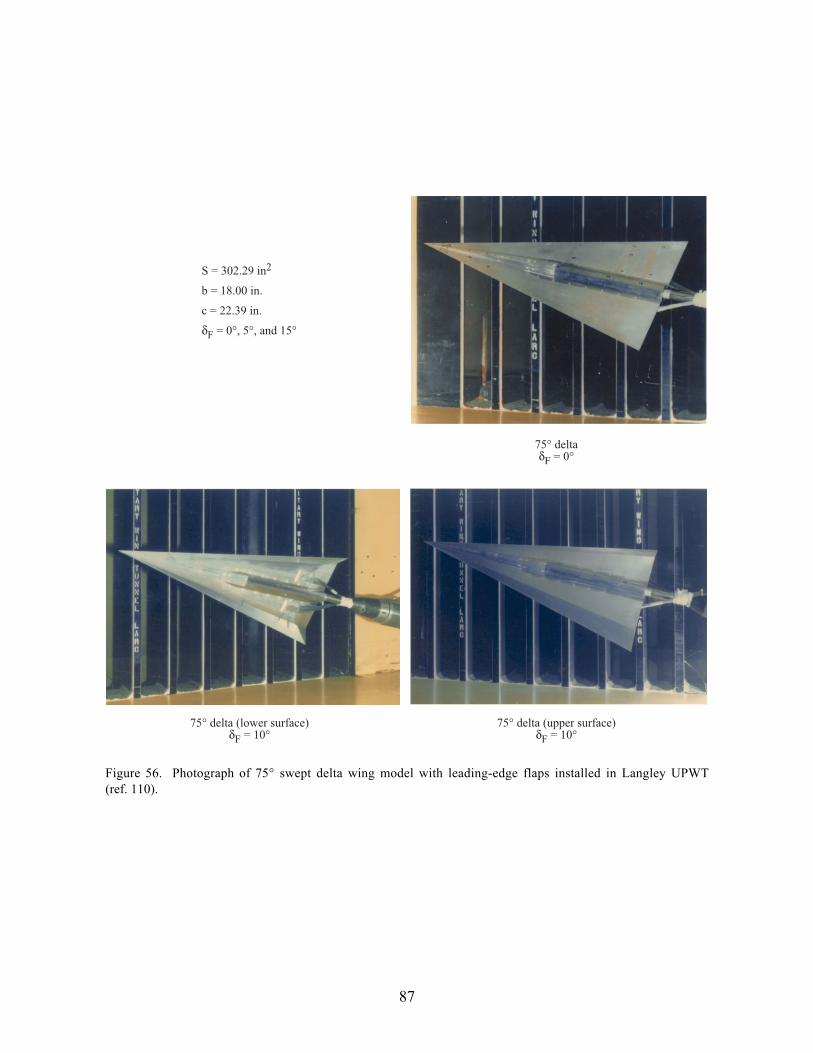
87
75° deltaδF = 0°
75° delta (upper surface)δF = 10°
75° delta (lower surface)δF = 10°
S = 302.29 in2
b = 18.00 in.
c = 22.39 in.
δF = 0°, 5°, and 15°
Figure 56. Photograph of 75° swept delta wing model with leading-edge flaps installed in Langley UPWT(ref. 110).

88
Hinge-linevortex
Hinge-linevortex
Secondaryseparation Shock
Leading-edgevortex
Cross-flowshock
Leading-edgebubble
Leading-edge vortex
FeedsheetSecondaryvortex
Shock
(−)
0(+)
(−)
0(+)
(−)
0(+)
Cp Cp Cp
(−)
0(+)
(−)
0(+)
(−)
0(+)
Cp Cp Cp
Attached flow
Λ = 75°δF = 5°M = 1.7α = 0°
Λ = 75°δF = 5°M = 1.7α = 6°
Λ = 75°δF = 5°M = 1.7α = 12°
Λ = 75°δF = 5°M = 2.0α = 16°
Λ = 75°δF = 10°M = 2.8α = 0°
Λ = 75°δF = 10°M = 2.4α = 6°
∞ ∞ ∞
∞ ∞ ∞
Figure 57. Wing upper surface pressure distributions and vapor-screen photographs of lee-side flow characteristicsfor single-feature flow types observed on 75° swept delta wing with leading-edge flaps (ref. 110).
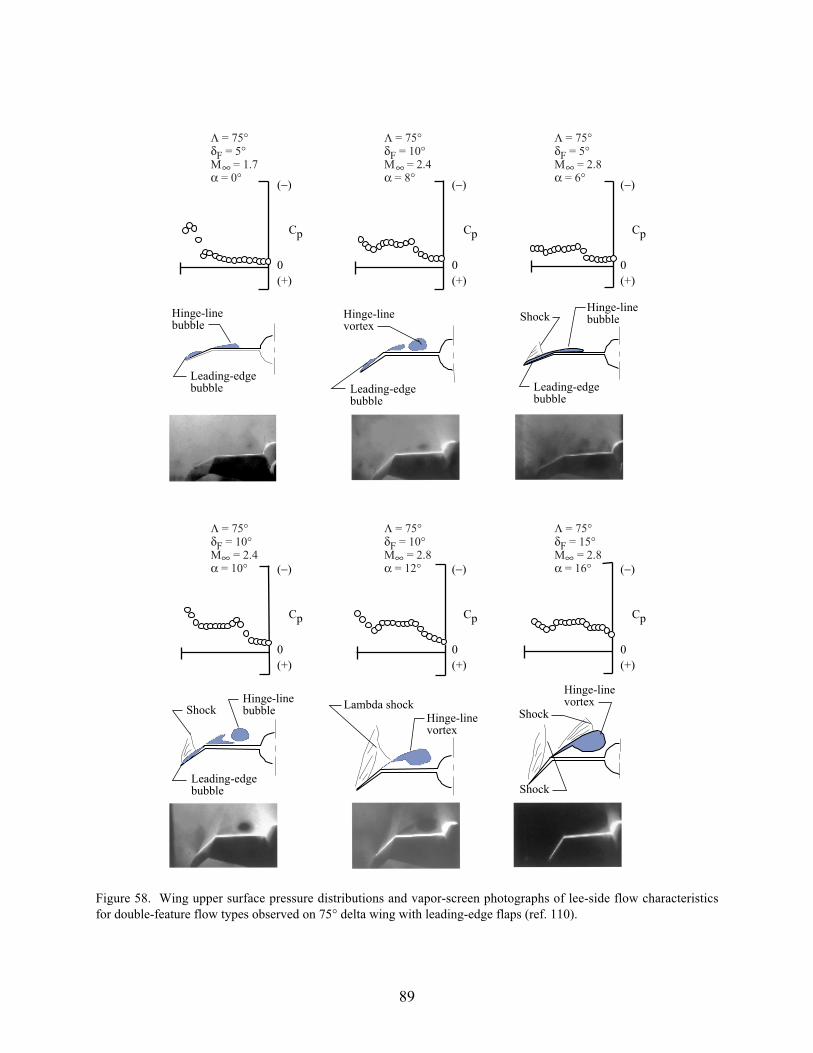
89
Leading-edgebubble
Hinge-linebubble
Hinge-linevortex
Leading-edgebubble
Shock
Leading-edgebubble
Hinge-linebubble
Hinge-linevortex
Hinge-linebubbleShock
Leading-edgebubble Shock
Shock
Hinge-linevortexLambda shock
(−)
0(+)
Cp
(−)
0(+)
Cp
(−)
0(+)
Cp
(−)
0(+)
Cp
(−)
0(+)
Cp
(−)
0(+)
Cp
Λ = 75°δF = 5°M = 1.7α = 0°
Λ = 75°δF = 10°M = 2.4α = 8°
Λ = 75°δF = 5°M = 2.8α = 6°
Λ = 75°δF = 10°M = 2.4α = 10°
Λ = 75°δF = 10°M = 2.8α = 12°
Λ = 75°δF = 15°M = 2.8α = 16°
∞ ∞ ∞
∞ ∞ ∞
Figure 58. Wing upper surface pressure distributions and vapor-screen photographs of lee-side flow characteristicsfor double-feature flow types observed on 75° delta wing with leading-edge flaps (ref. 110).
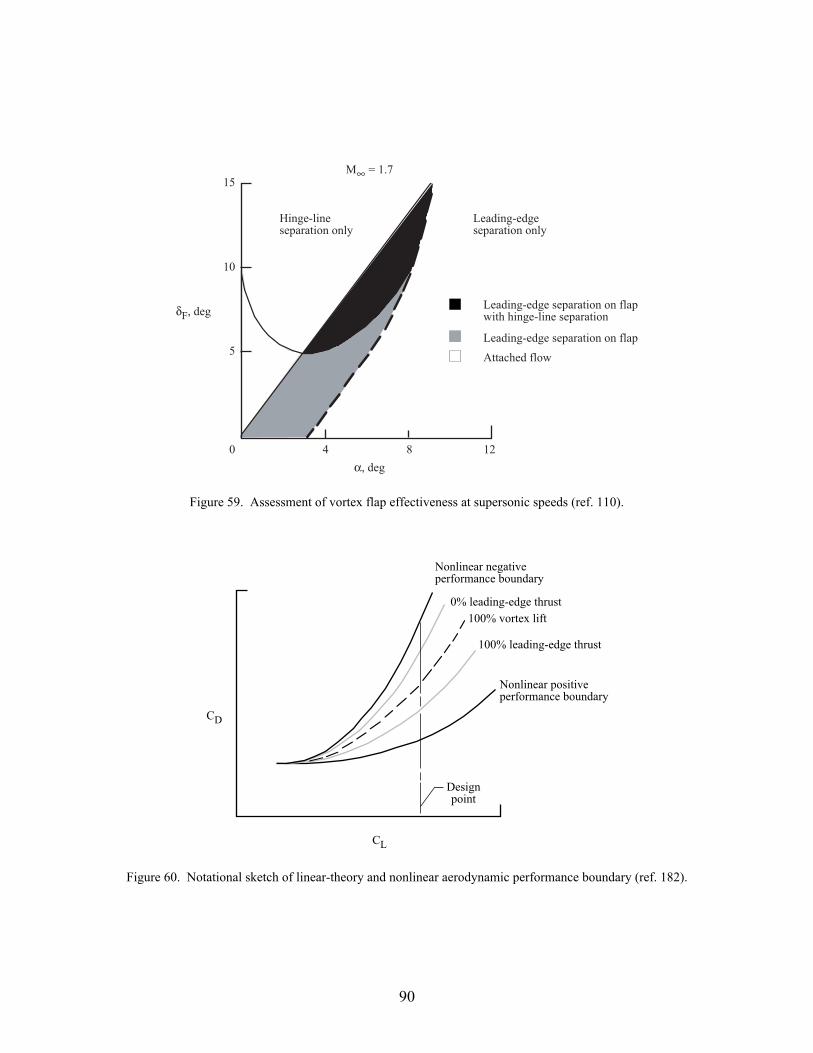
90
Leading-edgeseparation only
Leading-edge separation on flapwith hinge-line separation
Leading-edge separation on flap
Attached flow
Hinge-lineseparation only
α, deg
δF, deg
M = 1.7
5
0
10
15
4 8 12
∞
Figure 59. Assessment of vortex flap effectiveness at supersonic speeds (ref. 110).
0% leading-edge thrust
100% leading-edge thrust
100% vortex lift
Nonlinear positiveperformance boundary
Designpoint
CD
Nonlinear negativeperformance boundary
CL
Figure 60. Notational sketch of linear-theory and nonlinear aerodynamic performance boundary (ref. 182).
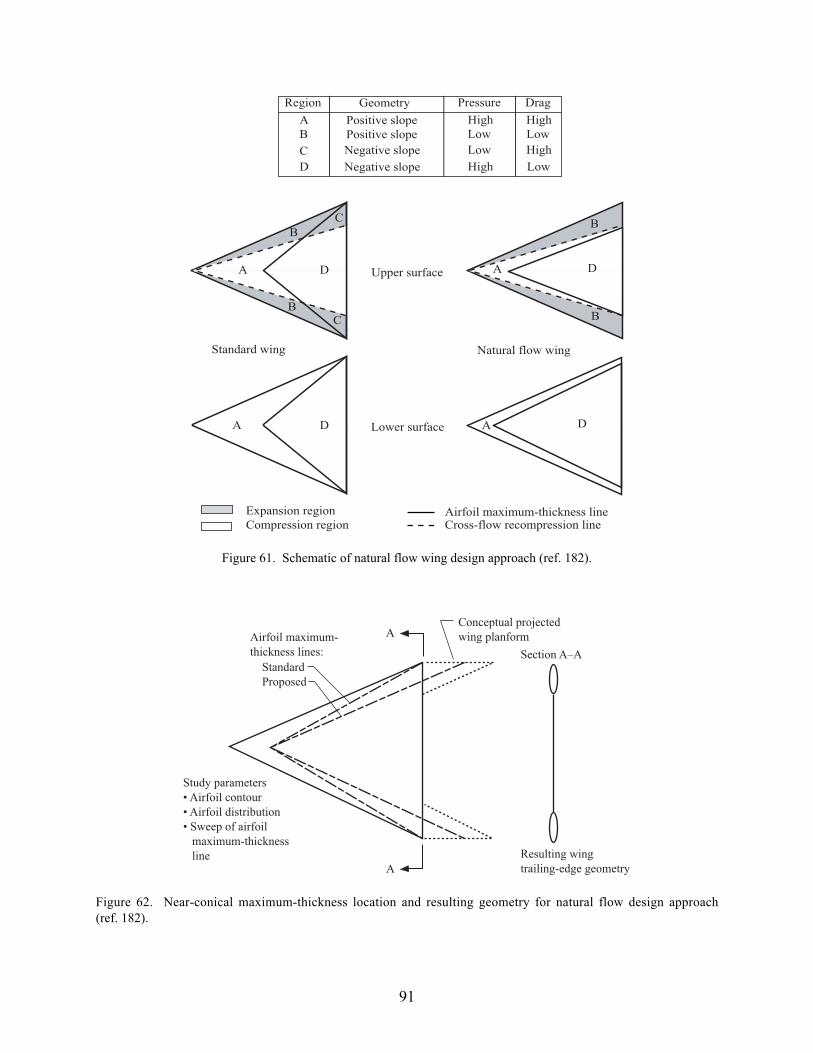
91
Standard wing Natural flow wing
Upper surface
Lower surface
A
BC
CB
D A
B
B
D
A D A D
Region
ABCD
Geometry
Positive slopePositive slopeNegative slopeNegative slope
Pressure
HighLowLowHigh
Drag
HighLowHighLow
Expansion regionCompression region
Airfoil maximum-thickness lineCross-flow recompression line
Figure 61. Schematic of natural flow wing design approach (ref. 182).
A
A
Section A–A
Resulting wingtrailing-edge geometry
Conceptual projectedwing planformAirfoil maximum-
thickness lines:StandardProposed
Study parameters• Airfoil contour• Airfoil distribution• Sweep of airfoil maximum-thickness line
Figure 62. Near-conical maximum-thickness location and resulting geometry for natural flow design approach(ref. 182).

92
Spanwise cuts Streamwise cuts
Baseline
Near-conical
Natural flow
(a) Spanwise and streamwise cuts.
Baseline
Natural flow
Near-conical
Upper and lower surface
Upper and lower surface
Lower surface
(b) Elevation cuts.
Figure 63. Geometric details of baseline, near-conical, and natural flow 65° delta wing models (ref. 182).
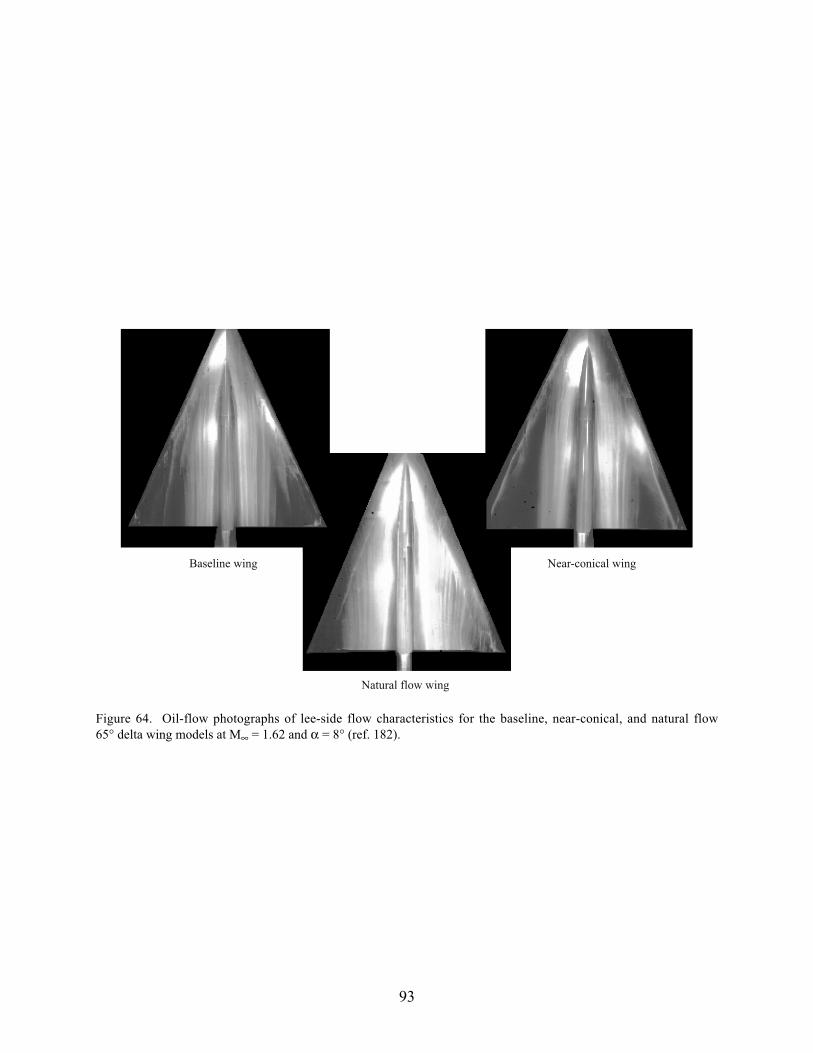
93
Baseline wing
Natural flow wing
Near-conical wing
Figure 64. Oil-flow photographs of lee-side flow characteristics for the baseline, near-conical, and natural flow65° delta wing models at M∞ = 1.62 and α = 8° (ref. 182).
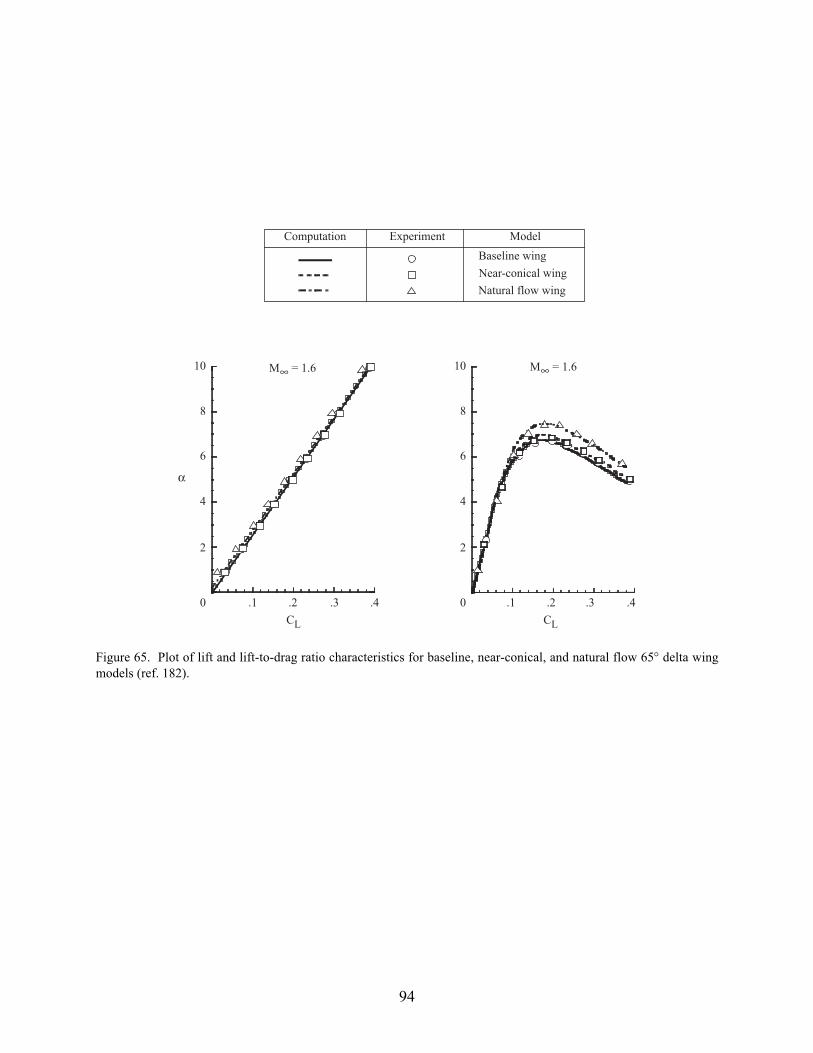
94
CL
.1 .2 .3 .4
α
CL
0
2
4
6
8
10
0
2
4
6
8
10
.1 .2 .3 .4
Baseline wing
Near-conical wing
Natural flow wing
Computation Experiment Model
M = 1.6 M = 1.6∞∞
Figure 65. Plot of lift and lift-to-drag ratio characteristics for baseline, near-conical, and natural flow 65° delta wingmodels (ref. 182).

REPORT DOCUMENTATION PAGE Form ApprovedOMB No. 0704-0188
2. REPORT TYPE
Technical Publication 4. TITLE AND SUBTITLE
Vortex Flows at Supersonic Speeds5a. CONTRACT NUMBER
6. AUTHOR(S)
Wood, Richard M.; Wilcox, Floyd J., Jr.; Bauer, Steven X. S.; and Allen, Jerry M.
7. PERFORMING ORGANIZATION NAME(S) AND ADDRESS(ES)
NASA Langley Research CenterHampton, VA 23681-2199
9. SPONSORING/MONITORING AGENCY NAME(S) AND ADDRESS(ES)
National Aeronautics and Space AdministrationWashington, DC 20546-0001
8. PERFORMING ORGANIZATION REPORT NUMBER
L-18008
10. SPONSOR/MONITOR'S ACRONYM(S)
NASA
13. SUPPLEMENTARY NOTESWood, Wilcox, Bauer, and Allen, Langley Research CenterAn electronic version can be found at http://techreports.larc.nasa.gov/ltrs/ or http://techreports.larc.nasa.gov/cgi-bin/NTRS
12. DISTRIBUTION/AVAILABILITY STATEMENTUnclassified - UnlimitedSubject Category 02Availability: NASA CASI (301) 621-0390 Distribution: Standard
19a. NAME OF RESPONSIBLE PERSON
STI Help Desk (email: [email protected])
14. ABSTRACT
A review of research conducted at the National Aeronautics and Space Administration (NASA) Langley Research Center (LaRC) into high-speed vortex flows during the 1970s, 1980s, and 1990s is presented. The data are for flat plates, cavities, bodies, missiles, wings, and aircraft with Mach numbers of 1.5 to 4.6. Data are presented to show the types of vortex structures that occur at supersonic speeds and the impact of these flow structures on vehicle performance and control. The data show the presence of both small- and large-scale vortex structures for a variety of vehicles, from missiles to transports. For cavities, the data show very complex multiple vortex structures exist at all combinations of cavity depth to length ratios and Mach number. The data for missiles show the existence of very strong interference effects between body and/or fin vortices. Data are shown that highlight the effect of leading-edge sweep, leading-edge bluntness, wing thickness, location of maximum thickness, and camber on the aerodynamics of and flow over delta wings. Finally, a discussion of a design approach for wings that use vortex flows for improved aerodynamic performance at supersonic speeds is presented.
15. SUBJECT TERMS
Vortex flows; Supersonic aerodynamics; Wings; Missiles; Cavities; Flow visualization; Aerodynamic design; NASA Langley; Unitary Plan Wind Tunnel
18. NUMBER OF PAGES
100
19b. TELEPHONE NUMBER (Include area code)
(301) 621-0390
a. REPORT
U
c. THIS PAGE
U
b. ABSTRACT
U
17. LIMITATION OF ABSTRACT
UU
Prescribed by ANSI Std. Z39.18Standard Form 298 (Rev. 8-98)
3. DATES COVERED (From - To)
5b. GRANT NUMBER
5c. PROGRAM ELEMENT NUMBER
5d. PROJECT NUMBER
5e. TASK NUMBER
5f. WORK UNIT NUMBER
706-51-21-10
11. SPONSOR/MONITOR'S REPORT NUMBER(S)
NASA/TP-2003-211950
16. SECURITY CLASSIFICATION OF:
The public reporting burden for this collection of information is estimated to average 1 hour per response, including the time for reviewing instructions, searching existing data sources, gathering and maintaining the data needed, and completing and reviewing the collection of information. Send comments regarding this burden estimate or any other aspect of this collection of information, including suggestions for reducing this burden, to Department of Defense, Washington Headquarters Services, Directorate for Information Operations and Reports (0704-0188), 1215 Jefferson Davis Highway, Suite 1204, Arlington, VA 22202-4302. Respondents should be aware that notwithstanding any other provision of law, no person shall be subject to any penalty for failing to comply with a collection of information if it does not display a currently valid OMB control number.PLEASE DO NOT RETURN YOUR FORM TO THE ABOVE ADDRESS.
1. REPORT DATE (DD-MM-YYYY)
03 - 200301-