Voronoi Diagrams - MITweb.mit.edu/alexmv/Public/6.850-lectures/lecture08.pdf · March 1, 2005...
82
March 1, 2005 Lecture 8: Voronoi Diagrams Voronoi Diagrams (Slides mostly by Allen Miu)
Transcript of Voronoi Diagrams - MITweb.mit.edu/alexmv/Public/6.850-lectures/lecture08.pdf · March 1, 2005...
March 1, 2005 Lecture 8: Voronoi Diagrams
Voronoi Diagrams
(Slides mostly by Allen Miu)

March 1, 2005 Lecture 8: Voronoi Diagrams
Post Office: What is the area of service?
q
q : free point
e
e : Voronoi edge
v
v : Voronoi vertex
pi
pi : site points

March 1, 2005 Lecture 8: Voronoi Diagrams
Definition of Voronoi Diagram
• Let P be a set of n distinct points (sites) in the plane.
• The Voronoi diagram of P is the subdivision of the plane into n cells, one for each site.
• A point q lies in the cell corresponding to a site pi ∈ P iff ||q-pi || < ||q-pj ||, for each pi ∈ P, j ≠ i.

March 1, 2005 Lecture 8: Voronoi Diagrams
Demo
http://www.diku.dk/students/duff/Fortune/http://wwwpi6.fernuni-hagen.de/GeomLab/VoroGlide/

March 1, 2005 Lecture 8: Voronoi Diagrams
Jeff’s Erickson Web Page
See also the implementation page from Christopher Gold's site www.Voronoi.com.
Enough already!!
Delaunay triangulations and farthest point Delaunay triangulations using 3d convex hulls by Daniel Mark Abrahams-Gessel, fortunately stolen by Anirudh Modi before the original page was taken off the Web. This is the best one!
Convex hulls, Delaunay triangulations, Voronoi diagrams, and proximity graphs by James E. Baker, Isabel F. Cruz, Luis D. Lejter, Giuseppe Liotta, and Roberto Tamassia. Source code is available.
Incremental Delaunay triangulations and Voronoi diagrams by Frank Bossen
Voronoi Diagram/Delaunay Triangulation by Paul Chew uses a randomized incremental algorithm with "brute force" point location.
2-Site Voronoi diagrams by Matt Dickerson, from the Middlebury College Undergraduate Research Project in Computational Geometry
The convex hull/Voronoi diagram applet from the GeomNet project provides a secure Java wrapper for existing (non-Java) code. The applet calls qhull to build its convex hulls and Steve Fortune's sweep2 to build its Voronoi diagrams. A forms interface to the same programs is also available.
VoroGlide, by Christian Icking, Rolf Klein, Peter Köllner, and Lihong Ma. Smoothly maintains the convex hull, Voronoi diagram, and Delaunay triangulation as points are moved, illustrates incremental construction of the Delaunay triangulation, and includes a recorded demo. Now on a faster server!
Delaunay triangulations by Geoff Leach compares several (very) naïve algorithms. Source code is available.
Bisectors and Voronoi diagrams under convex (polygonal) distance functions by Lihong Ma. The diagram is updated on the fly while sites or vertices of the unit ball are inserted, deleted, or dragged around. Very cool!
Delaunay triangulations and Dirichlet tesselations and a short applet-enhanced tutorial by Eric C. Olson
The Voronoi Game by Dennis Shasha. Try to place points to maximize the area of your Voronoi regions.
Higher-order Voronoi diagrams by Barry Schaudt
Tessy, yet another interactive Voronoi/Delaunay demo from Keith Voegele. Java not required.
ModeMap, by David Watson, draws Voronoi diagrams, Delaunay triangulations, natural neighbor circles (circumcircles of Delaunay triangles), and (for the very patient) radial density contours on the sphere. Don't give it more than 80 points.
Delaunay Triangulation from Zhiyuan Zhao's JAVA Gallery of Geometric Algorithms
Delaunay Triangulation Demo at ESSI, Université de Nice/Sophia-Antipolis, France. X terminal required instead of Java. Extremely slow, at least on this side of the Atlantic.

March 1, 2005 Lecture 8: Voronoi Diagrams
Outline• Definitions and Examples• Properties of Voronoi diagrams• Complexity of Voronoi diagrams• Constructing Voronoi diagrams
– Intuitions– Data Structures– Algorithm
• Running Time Analysis• Demo• Duality and degenerate cases

March 1, 2005 Lecture 8: Voronoi Diagrams
Voronoi Diagram Example:1 site
March 1, 2005 Lecture 8: Voronoi Diagrams
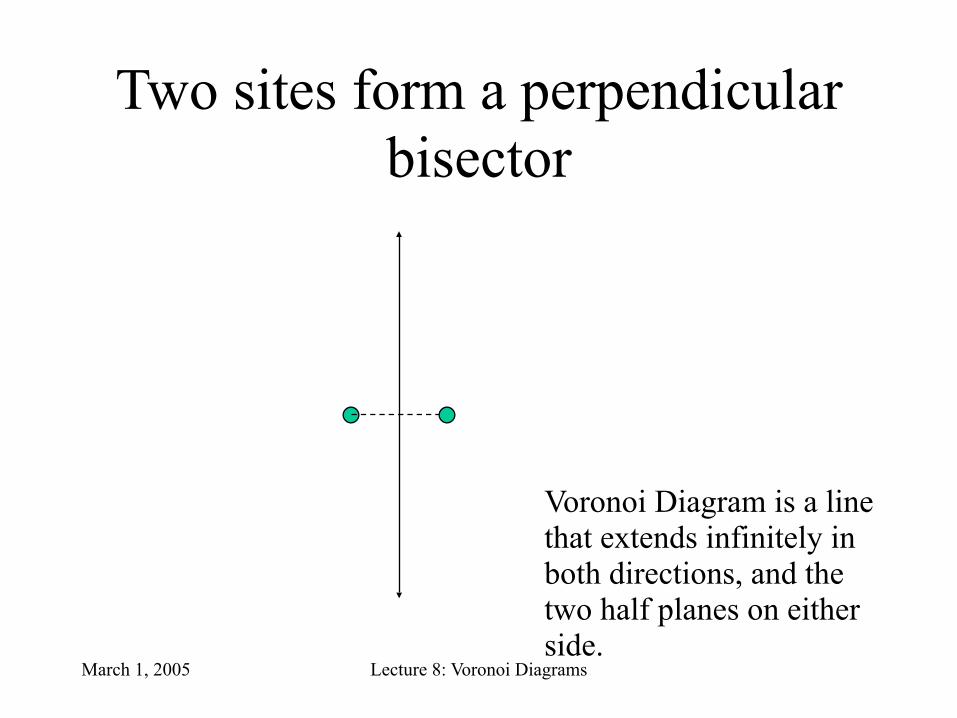
Two sites form a perpendicular bisector
Voronoi Diagram is a linethat extends infinitely in both directions, and thetwo half planes on eitherside.

March 1, 2005 Lecture 8: Voronoi Diagrams
Collinear sites form a series of parallel lines

March 1, 2005 Lecture 8: Voronoi Diagrams
Non-collinear sites form Voronoi half lines that meet at a vertex
A Voronoi vertex is the center of an empty circle touching 3 or more sites.
v
Half lines
A vertex hasdegree ≥ 3

March 1, 2005 Lecture 8: Voronoi Diagrams
Voronoi Cells and Segments
v

March 1, 2005 Lecture 8: Voronoi Diagrams
Voronoi Cells and Segments
v
Unbounded CellBounded Cell
Segment

March 1, 2005 Lecture 8: Voronoi Diagrams
Pop quiz
vWhich of the following is true for2-D Voronoi diagrams?
Four or more non-collinear sites are…1. sufficient to create a bounded cell2. necessary to create a bounded cell3. 1 and 24. none of above

March 1, 2005 Lecture 8: Voronoi Diagrams
Pop quiz
vWhich of the following is true for2-D Voronoi diagrams?
Four or more non-collinear sites are…1. sufficient to create a bounded cell2. necessary to create a bounded cell3. 1 and 24. none of above

March 1, 2005 Lecture 8: Voronoi Diagrams
Degenerate Case: no bounded cells!
v

March 1, 2005 Lecture 8: Voronoi Diagrams
Summary of Voronoi Properties A point q lies on a Voronoi edge between sites pi and pj
iff the largest empty circle centered at q touches only pi and pj
– A Voronoi edge is a subset of locus of points equidistant from pi and pj
e
e : Voronoi edge
v
v : Voronoi vertex
pi
pi : site points

March 1, 2005 Lecture 8: Voronoi Diagrams
Summary of Voronoi Properties A point q is a vertex iff the largest empty circle
centered at q touches at least 3 sites– A Voronoi vertex is an intersection of 3 more segments,
each equidistant from a pair of sites
e
e : Voronoi edge
vv : Voronoi vertex
pi
pi : site points

March 1, 2005 Lecture 8: Voronoi Diagrams
Voronoi diagrams have linear complexity {v, e = O(n)}
Intuition: Not all bisectors are Voronoi edges!
e
e : Voronoi edge
pi
pi : site points

March 1, 2005 Lecture 8: Voronoi Diagrams
Voronoi diagrams have linear complexity {v, e = O(n)}
Claim: For n ≥ 3, v ≤ 2n − 5 and e ≤ 3n − 6Proof: (General Case)• Euler’s Formula: for connected, planar graphs,
v – e + f = 2 Where:v is the number of verticese is the number of edgesf is the number of faces

March 1, 2005 Lecture 8: Voronoi Diagrams
Voronoi diagrams have linear complexity {v, e = O(n)}
Claim: For n ≥ 3, v ≤ 2n − 5 and e ≤ 3n − 6Proof: (General Case)• For Voronoi graphs, f = n (v +1) – e + n = 2
epi
p∞
To apply Euler’s Formula, we“planarize” the Voronoi diagram by connecting half lines to an extra vertex.

March 1, 2005 Lecture 8: Voronoi Diagrams
Voronoi diagrams have linear complexity {v, e = O(n)}
Moreover,
and
so
together with
we get, for n ≥ 3

March 1, 2005 Lecture 8: Voronoi Diagrams
A really degenerate case
• The graph has “loops”, i.e., edges from p∞ to itself • The “standard” Euler formula does not apply• But:
– One can extend Euler formula to loops (each loop creates a new face) and show that it still works
– Or, one can recall that the Voronoi diagram for this case has still a linear complexity
…

March 1, 2005 Lecture 8: Voronoi Diagrams
Outline• Definitions and Examples• Properties of Voronoi diagrams• Complexity of Voronoi diagrams• Constructing Voronoi diagrams
– Intuitions– Data Structures– Algorithm
• Running Time Analysis• Demo• Duality and degenerate cases

March 1, 2005 Lecture 8: Voronoi Diagrams
Constructing Voronoi Diagrams
Given a half plane intersection algorithm…

March 1, 2005 Lecture 8: Voronoi Diagrams
Constructing Voronoi Diagrams
Given a half plane intersection algorithm…

March 1, 2005 Lecture 8: Voronoi Diagrams
Constructing Voronoi Diagrams
Given a half plane intersection algorithm…

March 1, 2005 Lecture 8: Voronoi Diagrams
Constructing Voronoi Diagrams
Given a half plane intersection algorithm…
Repeat for each site
Running Time: O( n2 log n )

March 1, 2005 Lecture 8: Voronoi Diagrams
Faster Algorithm
• Fortune’s Algorithm:– Sweep line approach– Voronoi diagram constructed as horizontal line
sweeps the set of sites from top to bottom– Incremental construction:
• maintains portion of diagram which cannot change due to sites below sweep line,
• keeps track of incremental changes for each site (and Voronoi vertex) it “sweeps”
March 1, 2005 Lecture 8: Voronoi Diagrams
Algorithms Outline
• Ideas• Data structures• Events

March 1, 2005 Lecture 8: Voronoi Diagrams
InvariantWhat is the invariant we are looking for?
Maintain a representation of the locus of points q that are closer to some site pi above the sweep line than to
the line itself (and thus to any site below the line).
ev
pi
Sweep Line
q

March 1, 2005 Lecture 8: Voronoi Diagrams
Beach lineWhich points are closer to a site above the sweep line than to
the sweep line itself?
Sweep Line
pi
q
The set of parabolic arcs form a beach-line that bounds the locus of all such points
Equidistance

March 1, 2005 Lecture 8: Voronoi Diagrams
EdgesBreak points trace out Voronoi edges.
Equidistance
Sweep Line
pi
q

March 1, 2005 Lecture 8: Voronoi Diagrams
Arcs flatten out as sweep line moves down.
Sweep Line
pi
q

March 1, 2005 Lecture 8: Voronoi Diagrams
Eventually, the middle arc disappears.
Sweep Line
pi
q

March 1, 2005 Lecture 8: Voronoi Diagrams
We have detected a circle that is empty (contains no sites) and touches 3 or more sites.
Circle Event
Sweep Line
pi
q
Voronoi vertex!

March 1, 2005 Lecture 8: Voronoi Diagrams
Beach Line Properties
• Voronoi edges are traced by the break points as the sweep line moves down.– Emergence of a new break point(s) (from
formation of a new arc or a fusion of two existing break points) identifies a new edge
• Voronoi vertices are identified when two break points meet (fuse).– Decimation of an old arc identifies new vertex

March 1, 2005 Lecture 8: Voronoi Diagrams
Algorithms Outline
• Ideas• Data structures• Events
March 1, 2005 Lecture 8: Voronoi Diagrams
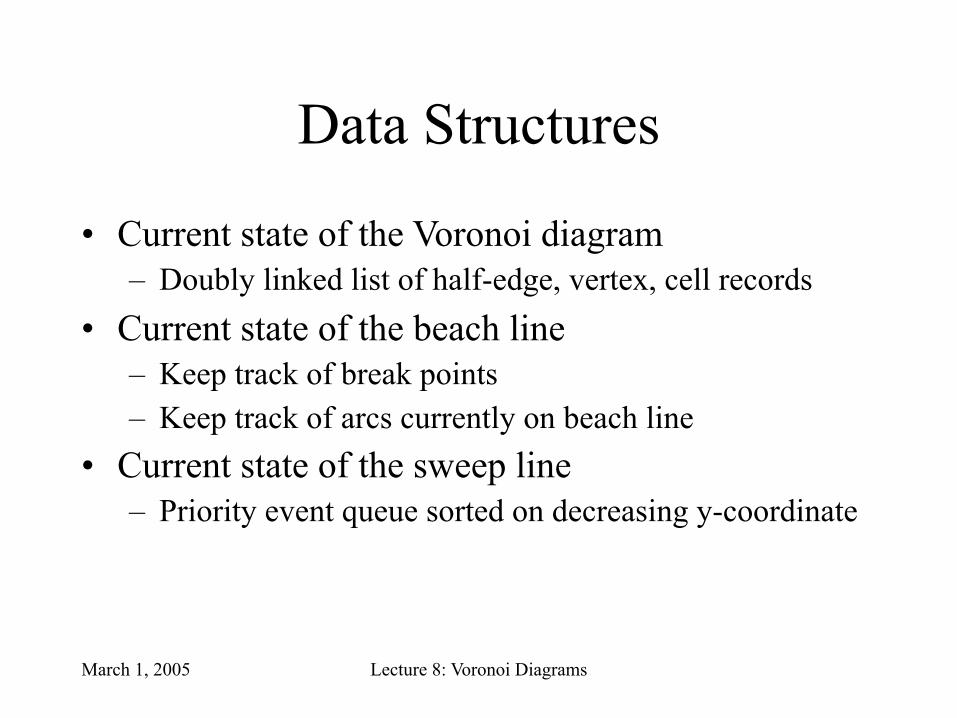
Data Structures
• Current state of the Voronoi diagram– Doubly linked list of half-edge, vertex, cell records
• Current state of the beach line– Keep track of break points– Keep track of arcs currently on beach line
• Current state of the sweep line– Priority event queue sorted on decreasing y-coordinate

March 1, 2005 Lecture 8: Voronoi Diagrams
Doubly Linked List (D)• Goal: a simple data structure that allows an
algorithm to traverse a Voronoi diagram’s segments, cells and vertices
ev
Cell(pi)

March 1, 2005 Lecture 8: Voronoi Diagrams
Doubly Linked List (D)• Divide segments into uni-directional half-edges• A chain of counter-clockwise half-edges forms a cell• Define a half-edge’s “twin” to be its opposite half-edge of the
same segment
ev
Cell(pi)
March 1, 2005 Lecture 8: Voronoi Diagrams
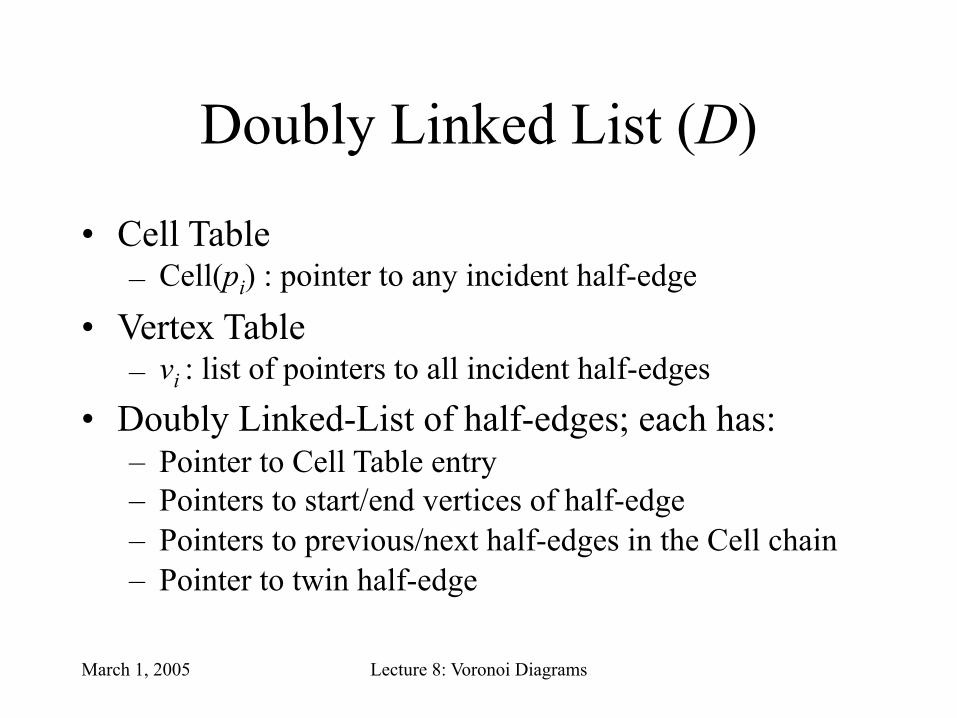
Doubly Linked List (D)
• Cell Table– Cell(pi) : pointer to any incident half-edge
• Vertex Table– vi : list of pointers to all incident half-edges
• Doubly Linked-List of half-edges; each has:– Pointer to Cell Table entry– Pointers to start/end vertices of half-edge– Pointers to previous/next half-edges in the Cell chain– Pointer to twin half-edge
March 1, 2005 Lecture 8: Voronoi Diagrams
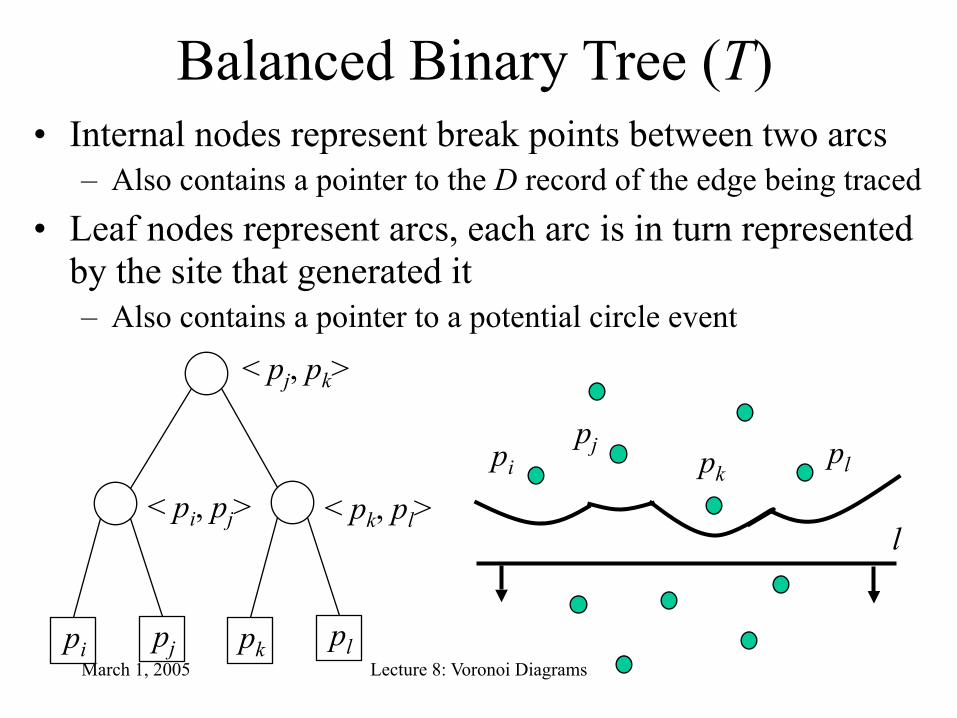
Balanced Binary Tree (T)• Internal nodes represent break points between two arcs
– Also contains a pointer to the D record of the edge being traced• Leaf nodes represent arcs, each arc is in turn represented
by the site that generated it– Also contains a pointer to a potential circle event
pi pj pk pl
< pj, pk>
< pi, pj> < pk, pl>
pipj pk
pl
l

March 1, 2005 Lecture 8: Voronoi Diagrams
Event Queue (Q)
• An event is an interesting point encountered by the sweep line as it sweeps from top to bottom– Sweep line makes discrete stops, rather than a
continuous sweep• Consists of Site Events (when the sweep line
encounters a new site point) and Circle Events (when the sweep line encounters the bottom of an empty circle touching 3 or more sites).
• Events are prioritized based on y-coordinate

March 1, 2005 Lecture 8: Voronoi Diagrams
Summarizing Data Structures
• Current state of the Voronoi diagram– Doubly linked list of half-edge, vertex, cell records
• Current state of the beach line– Keep track of break points
• Inner nodes of binary search tree; represented by a tuple– Keep track of arcs currently on beach line
• Leaf nodes of binary search tree; represented by a site that generated the arc
• Current state of the sweep line– Priority event queue sorted on decreasing y-coordinate
March 1, 2005 Lecture 8: Voronoi Diagrams
Algorithms Outline
• Ideas• Data structures• Events

March 1, 2005 Lecture 8: Voronoi Diagrams
Circle EventAn arc disappears whenever an empty circle touches
three or more sites and is tangent to the sweep line.
Sweep line helps determine that the circle is indeed empty.
Circle Event!Sweep Line
piq
Voronoi vertex!

March 1, 2005 Lecture 8: Voronoi Diagrams
Site EventA new arc appears when a new site appears.
l

March 1, 2005 Lecture 8: Voronoi Diagrams
Site EventA new arc appears when a new site appears.
l

March 1, 2005 Lecture 8: Voronoi Diagrams
Site EventOriginal arc above the new site is broken into two
Number of arcs on beach line is O(n)
l

March 1, 2005 Lecture 8: Voronoi Diagrams
Event Queue Summary• Site Events are
– given as input– represented by the (x,y)-coordinate of the site point
• Circle Events are– represented by the (x,y)-coordinate of the lowest point of an
empty circle touching three or more sites– computed on the fly (intersection of the two bisectors in between
the three sites)– “anticipated”: these newly generated events may represented by
the (x,y)-coordinate of the lowest point of an empty circle touching three or more sites; they can be false and need to be removed later
• Event Queue prioritizes events based on their y-coordinates

March 1, 2005 Lecture 8: Voronoi Diagrams
“Algorithm”
1. Initialize • Event queue Q all site events• Binary search tree T ∅• Doubly linked list D ∅
2. While Q not ∅,• Remove event (e) from Q with largest y-
coordinate• HandleEvent(e)

March 1, 2005 Lecture 8: Voronoi Diagrams
Handling Site Events
1. Locate the existing arc (if any) that is above the new site
2. Break the arc by replacing the leaf node with a sub tree representing the new arc and its break points
3. Add two half-edge records in the doubly linked list
4. Check for potential circle event(s), add them to event queue if they exist

March 1, 2005 Lecture 8: Voronoi Diagrams
Handling Circle Events
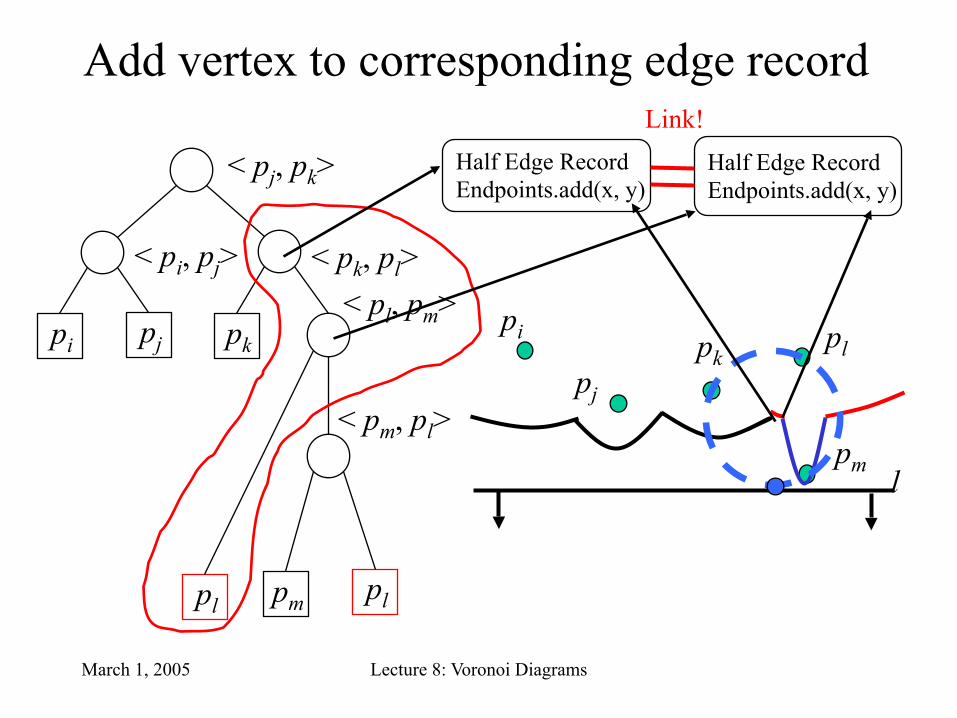
1. Add vertex to corresponding edge record in doubly linked list
2. Delete from T the leaf node of the disappearing arc and its associated circle events in the event queue
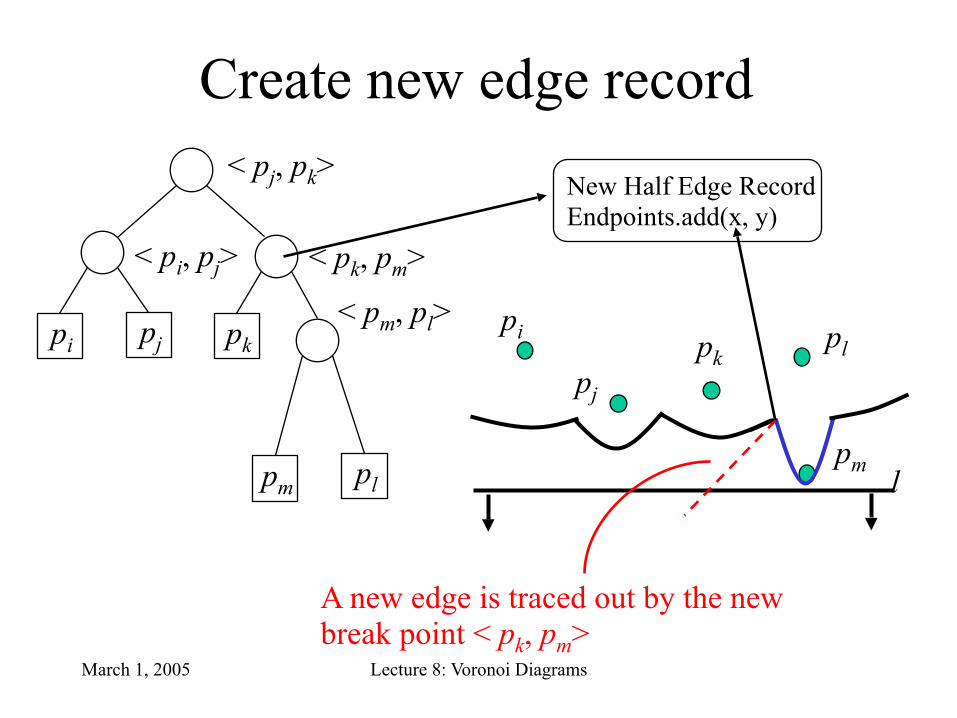
3. Create new edge record in doubly linked list4. Check the new triplets formed by the former
neighboring arcs for potential circle events

March 1, 2005 Lecture 8: Voronoi Diagrams
Outline• Definitions and Examples• Properties of Voronoi diagrams• Complexity of Voronoi diagrams• Constructing Voronoi diagrams
– Intuitions– Data Structures– Algorithm
• Running Time Analysis• Demo• Duality and degenerate cases

March 1, 2005 Lecture 8: Voronoi Diagrams
Handling Site Events
1. Locate the leaf representing the existing arc that is above the new site
– Delete the potential circle event in the event queue2. Break the arc by replacing the leaf node with a
sub tree representing the new arc and break points
3. Add a new edge record in the link list4. Check for potential circle event(s), add them
to queue if they exist– Store in the corresponding leaf of T a pointer to the
new circle event in the queue
Running Time
O(log n)
O(1)
O(1)
O(1)

March 1, 2005 Lecture 8: Voronoi Diagrams
Handling Circle Events
1. Delete from T the leaf node of the disappearing arc and its associated circle events in the event queue
2. Add vertex record in doubly link list3. Create new edge record in doubly
link list4. Check the new triplets formed by the
former neighboring arcs for potential circle events
Running Time
O(log n)
O(1)
O(1)
O(1)

March 1, 2005 Lecture 8: Voronoi Diagrams
Total Running Time
• Each new site can generate at most two new arcs →beach line can have at most 2n – 1 arcs
• Each “false circle event” can be charged to a real event → O(n) events
• Site/Circle Event Handler O(log n)
O(n log n) total running time
March 1, 2005 Lecture 8: Voronoi Diagrams
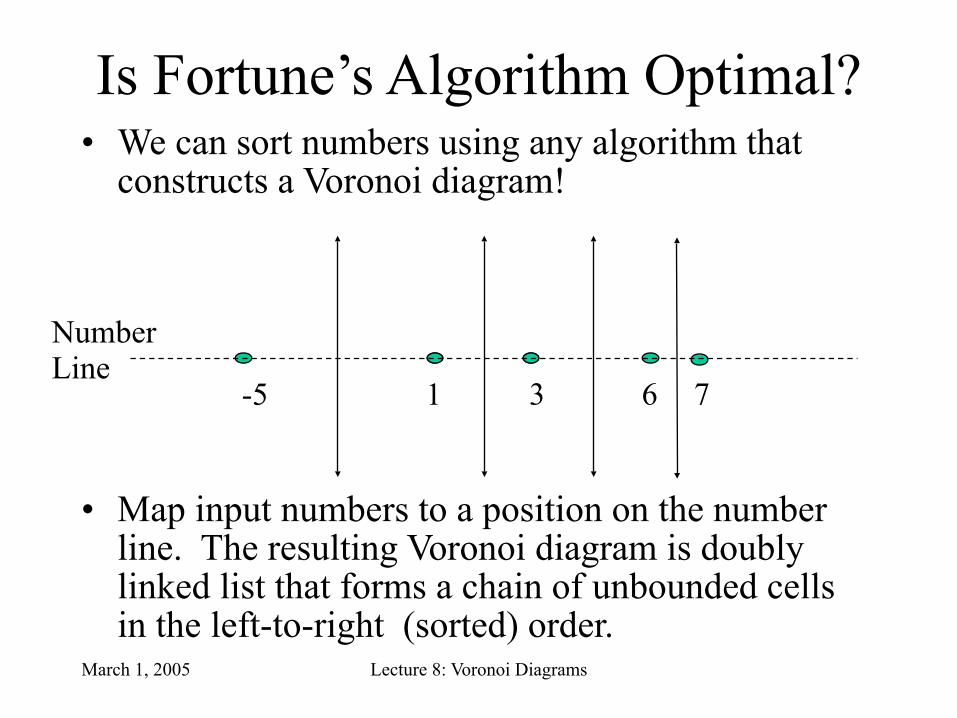
Is Fortune’s Algorithm Optimal?• We can sort numbers using any algorithm that
constructs a Voronoi diagram!
• Map input numbers to a position on the number line. The resulting Voronoi diagram is doubly linked list that forms a chain of unbounded cells in the left-to-right (sorted) order.
-5 1 3 6 7
NumberLine

March 1, 2005 Lecture 8: Voronoi Diagrams
Remaining slides for the curious

March 1, 2005 Lecture 8: Voronoi Diagrams
A Circle Event
pi pj pk
< pj, pk>
< pi, pj> < pk, pl>
pi
pj
pkpl
lpm
pm pl
< pl, pm>
< pm, pl>
pl
March 1, 2005 Lecture 8: Voronoi Diagrams
Add vertex to corresponding edge record
pi pj pk
< pj, pk>
< pi, pj> < pk, pl>
pi
pj
pkpl
lpm
pm pl
< pl, pm>
< pm, pl>
pl
Half Edge RecordEndpoints.add(x, y)
Half Edge RecordEndpoints.add(x, y)
Link!

March 1, 2005 Lecture 8: Voronoi Diagrams
Deleting disappearing arc
pi pj pk
< pj, pk>
< pi, pj>
pi
pj
pkpl
lpm
pm pl
< pm, pl>

March 1, 2005 Lecture 8: Voronoi Diagrams
Deleting disappearing arc
pi pj pk
< pj, pk>
< pi, pj>
pi
pj
pkpl
lpmpm pl
< pm, pl>
< pk, pm>
March 1, 2005 Lecture 8: Voronoi Diagrams
Create new edge record
pi pj pk
< pj, pk>
< pi, pj>
pi
pj
pkpl
lpmpm pl
< pm, pl>
< pk, pm>
New Half Edge RecordEndpoints.add(x, y)
A new edge is traced out by the new break point < pk, pm>

March 1, 2005 Lecture 8: Voronoi Diagrams
Check the new triplets for potential circle events
pi pj pk
< pj, pk>
< pi, pj>
pi
pj
pkpl
lpmpm pl
< pm, pl>
< pk, pm>
Q y…new circle event

March 1, 2005 Lecture 8: Voronoi Diagrams
Minor Detail
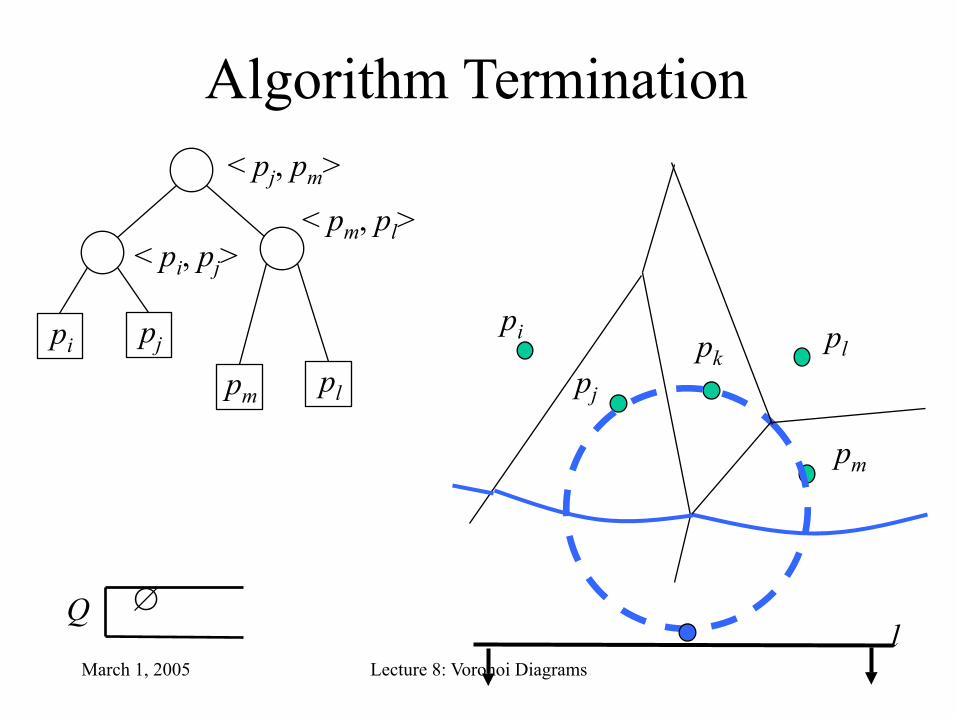
• Algorithm terminates when Q = ∅, but the beach line and its break points continue to trace the Voronoi edges– Terminate these “half-infinite” edges via a
bounding box

March 1, 2005 Lecture 8: Voronoi Diagrams
Algorithm Termination
pi pj pk
< pj, pk>
< pi, pj>
pi
pj
pkpl
l
pmpm pl
< pm, pl>
< pk, pm>
Q ∅
March 1, 2005 Lecture 8: Voronoi Diagrams
Algorithm Termination
pi pj
< pj, pm>
< pi, pj>
pi
pj
pkpl
l
pm
pm pl
< pm, pl>
Q ∅

March 1, 2005 Lecture 8: Voronoi Diagrams
Algorithm Termination
pi pj
< pj, pm>
< pi, pj>
pi
pj
pkpl
l
pm
pm pl
< pm, pl>
Q ∅
Terminate half-lines with a bounding box!

March 1, 2005 Lecture 8: Voronoi Diagrams
Outline• Definitions and Examples• Properties of Voronoi diagrams• Complexity of Voronoi diagrams• Constructing Voronoi diagrams
– Intuitions– Data Structures– Algorithm
• Running Time Analysis• Demo• Duality and degenerate cases

March 1, 2005 Lecture 8: Voronoi Diagrams
Degenerate Cases
• Events in Q share the same y-coordinate– Can additionally sort them using x-coordinate
• Circle event involving more than 3 sites– Current algorithm produces multiple degree 3
Voronoi vertices joined by zero-length edges– Can be fixed in post processing

March 1, 2005 Lecture 8: Voronoi Diagrams
Degenerate Cases
• Site points are collinear (break points neither converge or diverge)– Bounding box takes care of this
• One of the sites coincides with the lowest point of the circle event– Do nothing

March 1, 2005 Lecture 8: Voronoi Diagrams
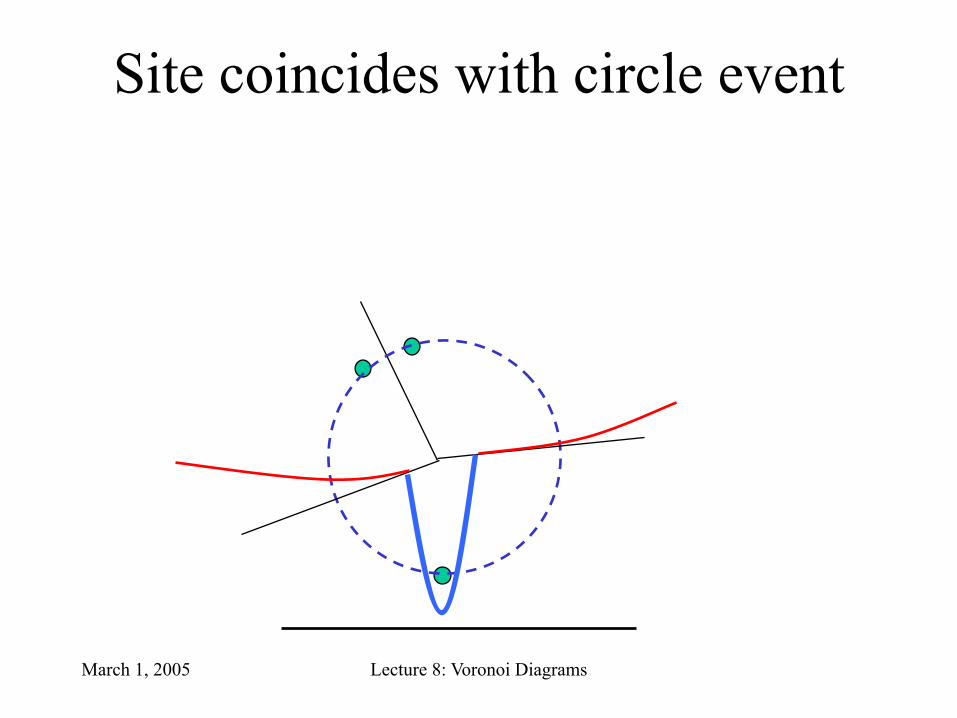
Site coincides with circle event: the same algorithm applies!
1. New site detected2. Break one of the arcs an infinitesimal distance
away from the arc’s end point
March 1, 2005 Lecture 8: Voronoi Diagrams
Site coincides with circle event

March 1, 2005 Lecture 8: Voronoi Diagrams
Locate the existing arc that is above the new site
pi pj pk pl
< pj, pk>
< pi, pj> < pk, pl>
• The x coordinate of the new site is used for the binary search• The x coordinate of each breakpoint along the root to leaf path is computed on the fly
pipj pk
pl
lpm

March 1, 2005 Lecture 8: Voronoi Diagrams
Break the Arc
pi pj pk
< pj, pk>
< pi, pj> < pk, pl>
Corresponding leaf replaced by a new sub-tree
pipj pk
pl
lpm
pm pl
< pl, pm>
< pm, pl>
pl
Different arcs can be induced by the same site!

March 1, 2005 Lecture 8: Voronoi Diagrams
Add a new edge record in the doubly linked list
pi pj pk
< pj, pk>
< pi, pj> < pk, pl>
pm pl
< pl, pm>
< pm, pl>
pl
pipj pk
pl
lpm
New Half Edge RecordEndpoints ∅
Pointers to two half-edge records
lpm

March 1, 2005 Lecture 8: Voronoi Diagrams
Checking for Potential Circle Events• Scan for triple of consecutive arcs and
determine if breakpoints converge– Triples with new arc in the middle do not have
break points that converge

March 1, 2005 Lecture 8: Voronoi Diagrams
Checking for Potential Circle Events• Scan for triple of consecutive arcs and
determine if breakpoints converge– Triples with new arc in the middle do not have
break points that converge

March 1, 2005 Lecture 8: Voronoi Diagrams
Checking for Potential Circle Events• Scan for triple of consecutive arcs and
determine if breakpoints converge– Triples with new arc in the middle do not have
break points that converge

March 1, 2005 Lecture 8: Voronoi Diagrams
Converging break points may not always yield a circle event
• Appearance of a new site before the circle event makes the potential circle non-empty
l
(The original circle event becomes a false alarm)

March 1, 2005 Lecture 8: Voronoi Diagrams
Handling Site Events
1. Locate the leaf representing the existing arc that is above the new site
– Delete the potential circle event in the event queue2. Break the arc by replacing the leaf node with a
sub tree representing the new arc and break points
3. Add a new edge record in the doubly linked list4. Check for potential circle event(s), add them to
queue if they exist– Store in the corresponding leaf of T a pointer to the
new circle event in the queue


![A parallel algorithm for constructing Voronoi diagrams ... › manage › uploadfile › File › ... · Fortune [7] proposed a sweepline algorithm for constructing Voronoi diagrams.](https://static.fdocuments.in/doc/165x107/5f1169120273b0207c355cef/a-parallel-algorithm-for-constructing-voronoi-diagrams-a-manage-a-uploadfile.jpg)