Vorlesung Klimawandel 10 07 - uni-mainz.de SS 07/lecture... · 1 climate change 2007 Joachim...
15
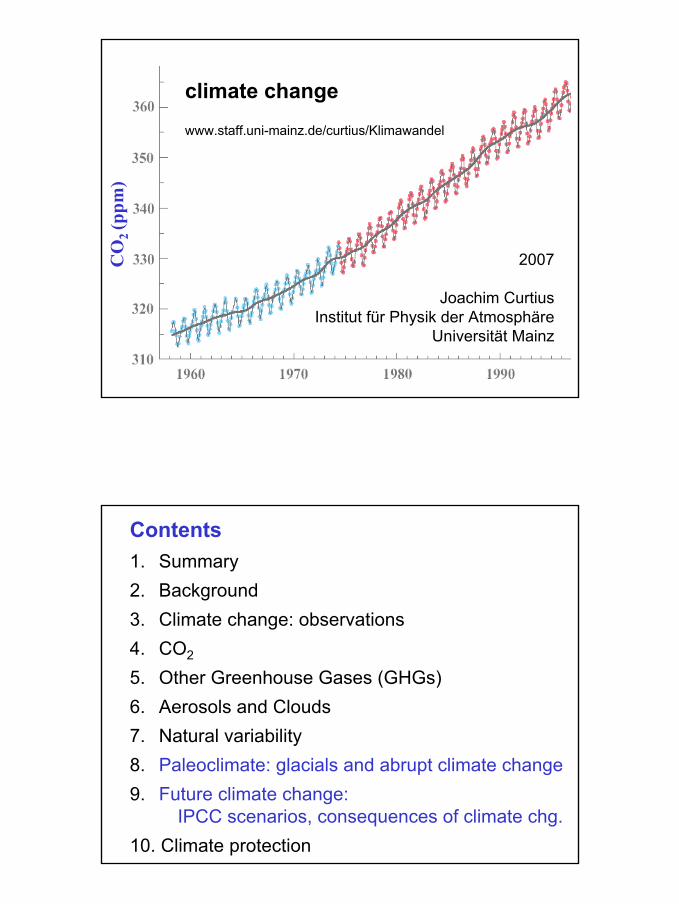
climate change www.staff.uni-mainz.de/curtius/Klimawandel 2007 Joachim Curtius Institut für Physik der Atmosphäre Universität Mainz CO 2 (ppm) Contents 1. Summary 2. Background 3. Climate change: observations 4. CO 2 5. Other Greenhouse Gases (GHGs) 6. Aerosols and Clouds 7. Natural variability 8. Paleoclimate: glacials and abrupt climate change 9. Future climate change: IPCC scenarios, consequences of climate chg. 10. Climate protection
-
Upload
doannguyet -
Category
Documents
-
view
220 -
download
0
Transcript of Vorlesung Klimawandel 10 07 - uni-mainz.de SS 07/lecture... · 1 climate change 2007 Joachim...
1
climate changewww.staff.uni-mainz.de/curtius/Klimawandel
2007
Joachim CurtiusInstitut für Physik der Atmosphäre
Universität Mainz
CO
2 (p
pm)
Contents1. Summary2. Background3. Climate change: observations4. CO2
5. Other Greenhouse Gases (GHGs)6. Aerosols and Clouds7. Natural variability8. Paleoclimate: glacials and abrupt climate change9. Future climate change:
IPCC scenarios, consequences of climate chg.10. Climate protection
2
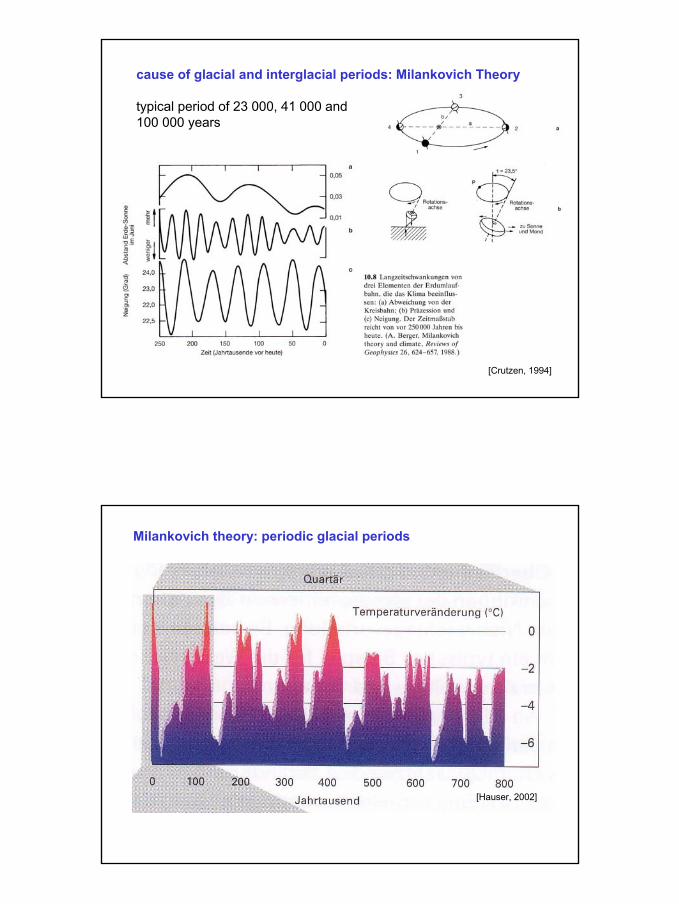
cause of glacial and interglacial periods: Milankovich Theory
typical period of 23 000, 41 000 and100 000 years
[Crutzen, 1994]
Milankovich theory: periodic glacial periods
[Hauser, 2002]
3
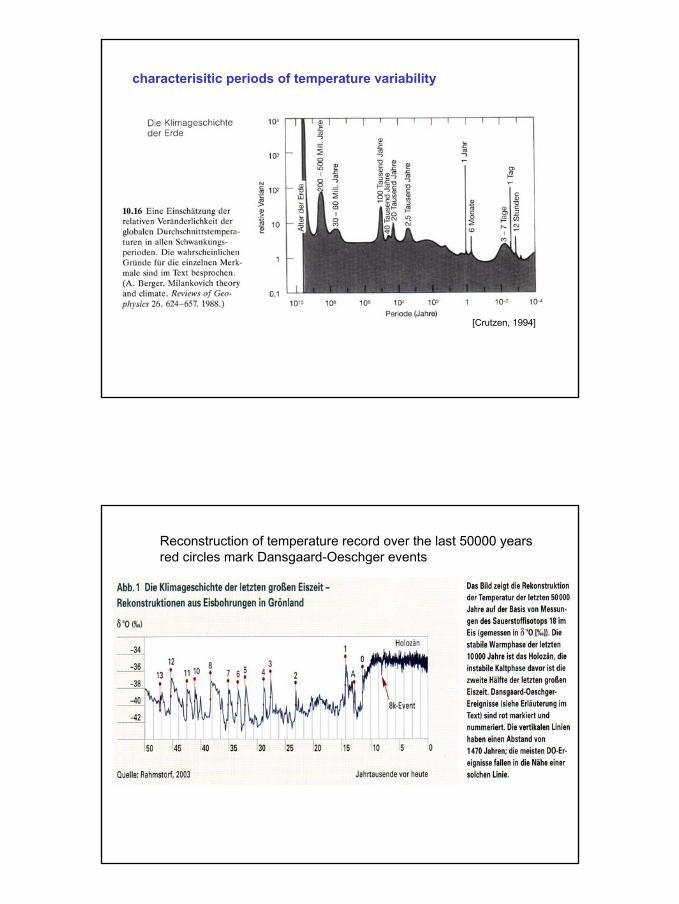
characterisitic periods of temperature variability
[Crutzen, 1994]
Reconstruction of temperature record over the last 50000 yearsred circles mark Dansgaard-Oeschger events
4
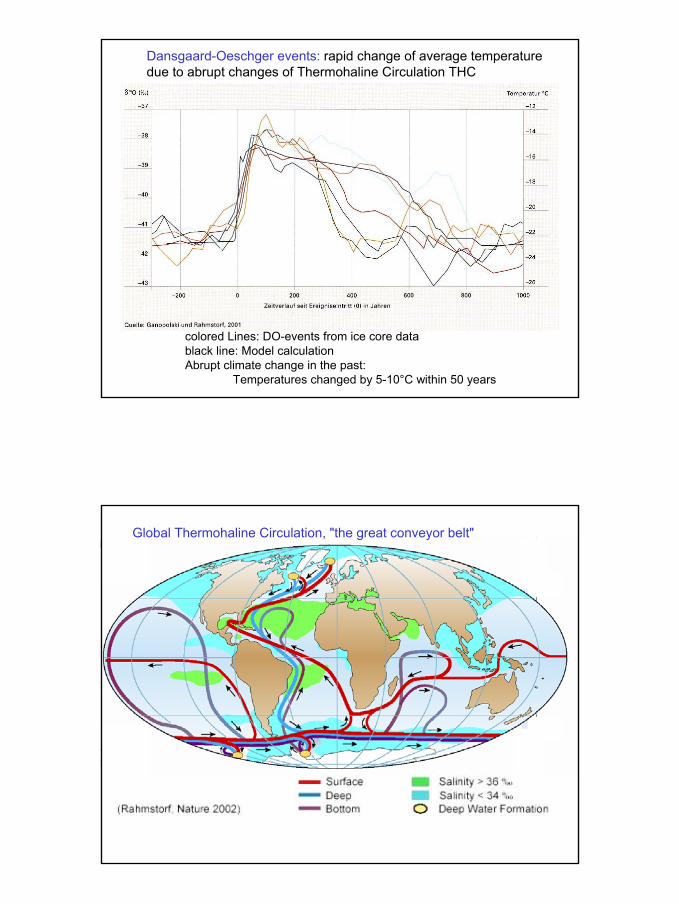
colored Lines: DO-events from ice core datablack line: Model calculationAbrupt climate change in the past:
Temperatures changed by 5-10°C within 50 years
Dansgaard-Oeschger events: rapid change of average temperaturedue to abrupt changes of Thermohaline Circulation THC
Global Thermohaline Circulation, "the great conveyor belt"

5
Gulf Stream and Meridional Overturning Circulation
driving forces: Wind + heat fluxes + salinity
part of the thermohalinecirculation (THC), meridional over-turning circulation (MOC)
Gulf Stream: ca. 37 Sv (1 Sverdrup = 106 m3 s-1),
North Atlantic Deep Waterformation: ~15 Sv
warms (Northern) Europe by 5-10°C, energytransport of ~1.3 PW, "~250 000 nuclearpower plants"
[Rahmstorf, Nature, 2002]
same time series in more detail...
not only local but global eventsHeinrich-Events: massive iceberg drift?

6
climate and climate changeduring the last glacial period:influence of ocean circulation
Hypothesized explanation for DO-events:
During last glacial periodonly one stablemode of ocean circulation(second panel). External forcing(e.g. weak change offreshwater flux) leads tosudden switching of thecirculation (DO-Event) andslow recovery over severalcenturies. Period: 1470 a = 210 x 87 a(de-Vries x Gleißberg-cycle?)
Alternatively, current stopscompletely (after H-event, lowest panel). H-events probablycaused by massive iceberg discharge(~10%) in Northern America.
[Rahmstorf, Nature, 2002]

7
NADW= North Atlantic Deep Water FormationBifurcation "switching", today: far from bifurcation point?
[Rahmstorf, Nature, 2002]
Abrupt climate change: "Switch"
Heinrich-Events
8
Kerr, Science, October 2005:
conclusions of an expert workshop in July 2005:
“A few years ago, people thought the [Atlantic circulation]could collapse almost like The Day After Tomorrow,” saidpaleoclimatologist Julia Hargreaves of the Frontier Research Center for Global Change in Yokohama, Japan. “But a veryrapid collapse now seems fairly unlikely under global warming.”
and
Lately, the most sophisticated and realistic model simulations of awarmer world have failed to drive the MOC anywhere nearcollapse. For example, climate modeler Peter Gent of theNational Center for Atmospheric Research (NCAR) in Boulder,Colorado, told the workshop how the latest version of the NCAR climatemodel responded to greenhouse gas increases like those expected in thenext century or two. Over a range of rates of greenhouse strengthening, the model’s MOC slowed by an average of 25% to 30%. “That is not a collapse,” said Gent.
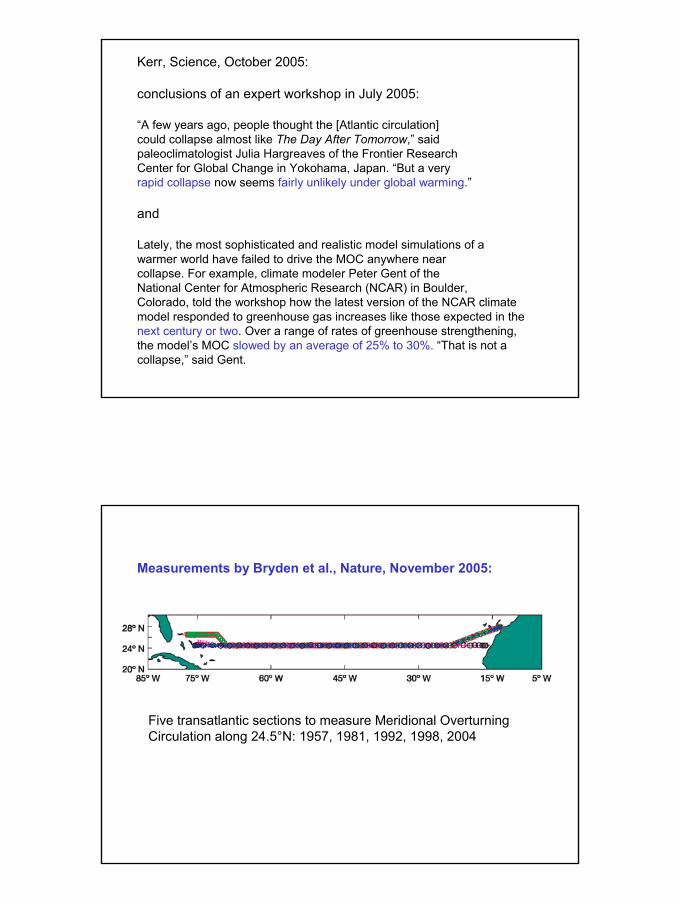
Measurements by Bryden et al., Nature, November 2005:
Five transatlantic sections to measure Meridional OverturningCirculation along 24.5°N: 1957, 1981, 1992, 1998, 2004
9
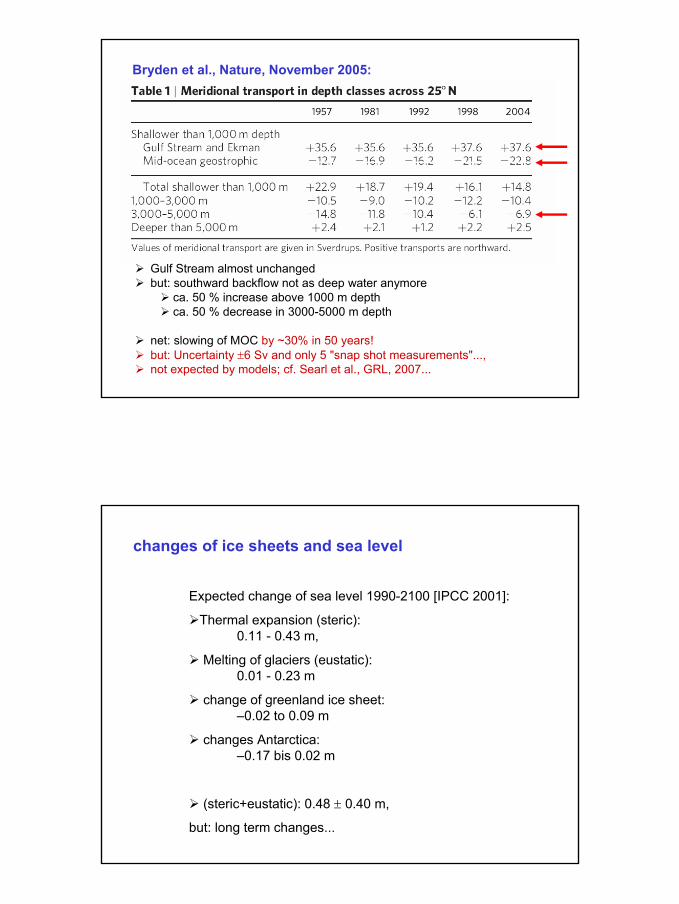
Bryden et al., Nature, November 2005:
Gulf Stream almost unchangedbut: southward backflow not as deep water anymore
ca. 50 % increase above 1000 m depthca. 50 % decrease in 3000-5000 m depth
net: slowing of MOC by ~30% in 50 years!but: Uncertainty ±6 Sv and only 5 "snap shot measurements"...,not expected by models; cf. Searl et al., GRL, 2007...
Expected change of sea level 1990-2100 [IPCC 2001]:
Thermal expansion (steric): 0.11 - 0.43 m,
Melting of glaciers (eustatic): 0.01 - 0.23 m
change of greenland ice sheet: –0.02 to 0.09 m
changes Antarctica: –0.17 bis 0.02 m
(steric+eustatic): 0.48 ± 0.40 m,
but: long term changes...
changes of ice sheets and sea level

10
time series of global mean sea level
[IPCC 2007]
correlation between CO2 and sea level
[Alley et al., Nature, 2005]
11
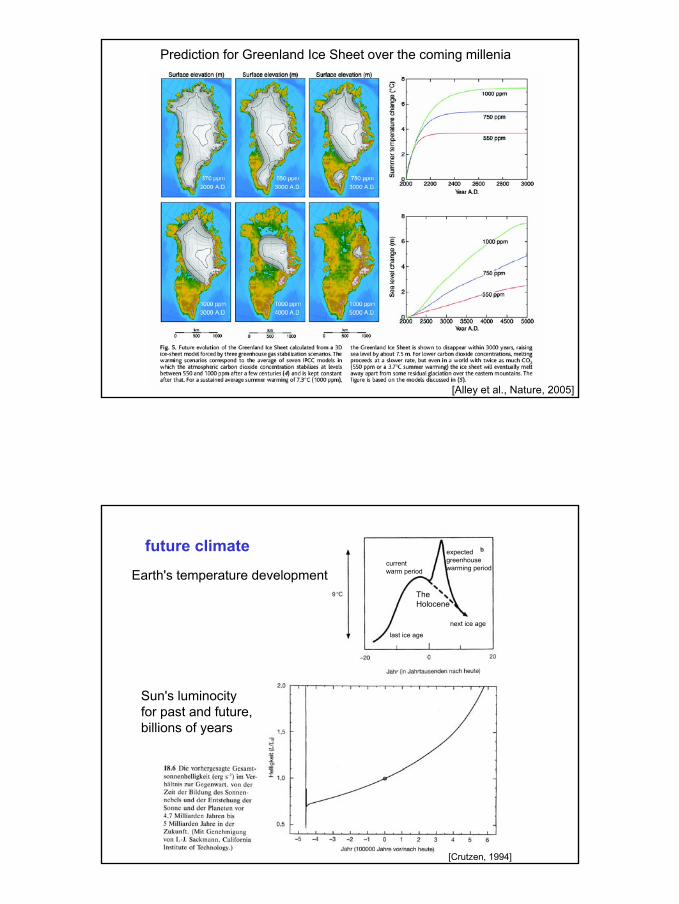
[Alley et al., Nature, 2005]
Prediction for Greenland Ice Sheet over the coming millenia
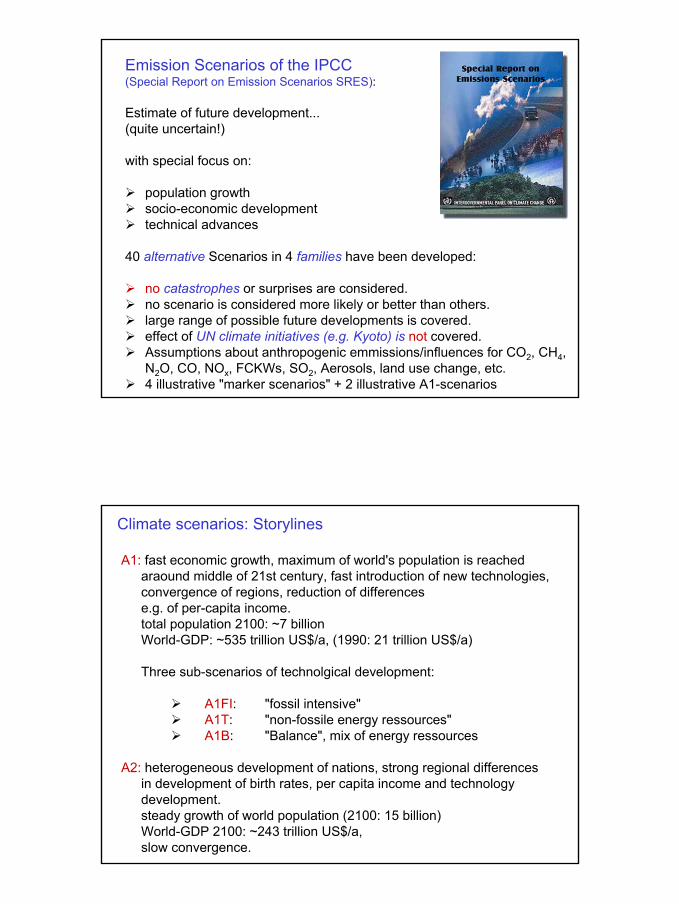
future climate
[Crutzen, 1994]
Sun's luminocityfor past and future,billions of years
Earth's temperature development
last ice age
currentwarm period
expectedgreenhousewarming period
next ice age
TheHolocene
12
Emission Scenarios of the IPCC (Special Report on Emission Scenarios SRES):
Estimate of future development... (quite uncertain!)
with special focus on:
population growthsocio-economic developmenttechnical advances
40 alternative Scenarios in 4 families have been developed:
no catastrophes or surprises are considered. no scenario is considered more likely or better than others.large range of possible future developments is covered.effect of UN climate initiatives (e.g. Kyoto) is not covered.Assumptions about anthropogenic emmissions/influences for CO2, CH4,N2O, CO, NOx, FCKWs, SO2, Aerosols, land use change, etc. 4 illustrative "marker scenarios" + 2 illustrative A1-scenarios
A1: fast economic growth, maximum of world's population is reachedaraound middle of 21st century, fast introduction of new technologies, convergence of regions, reduction of differencese.g. of per-capita income. total population 2100: ~7 billionWorld-GDP: ~535 trillion US$/a, (1990: 21 trillion US$/a)
Three sub-scenarios of technolgical development:
A1FI: "fossil intensive"A1T: "non-fossile energy ressources"A1B: "Balance", mix of energy ressources
A2: heterogeneous development of nations, strong regional differencesin development of birth rates, per capita income and technology development.steady growth of world population (2100: 15 billion)World-GDP 2100: ~243 trillion US$/a, slow convergence.
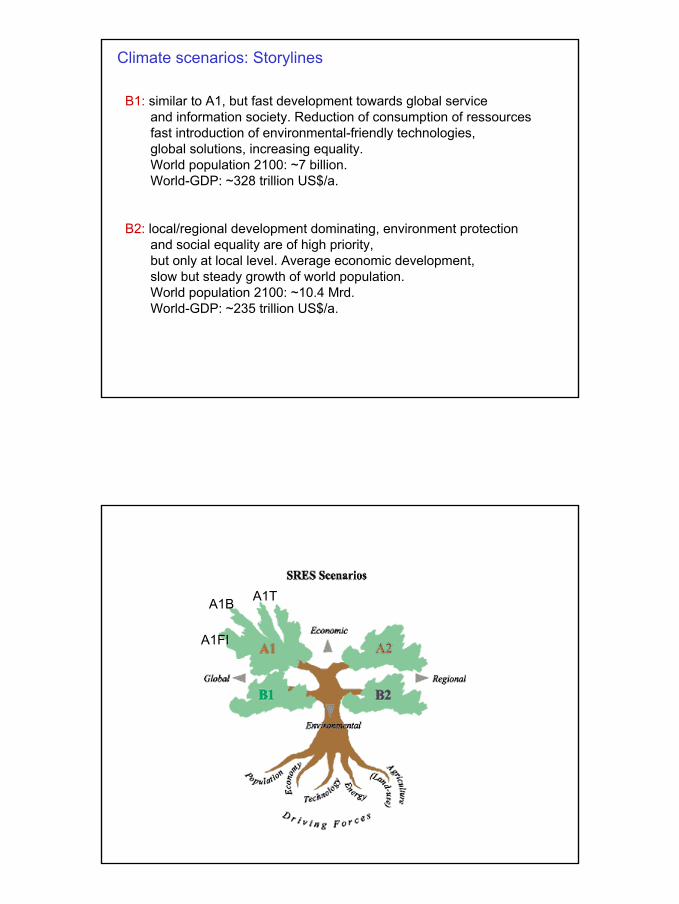
Climate scenarios: Storylines
13
B1: similar to A1, but fast development towards global serviceand information society. Reduction of consumption of ressourcesfast introduction of environmental-friendly technologies,global solutions, increasing equality. World population 2100: ~7 billion. World-GDP: ~328 trillion US$/a.
B2: local/regional development dominating, environment protectionand social equality are of high priority, but only at local level. Average economic development, slow but steady growth of world population.World population 2100: ~10.4 Mrd. World-GDP: ~235 trillion US$/a.
Climate scenarios: Storylines
A1FI
A1B A1T
14
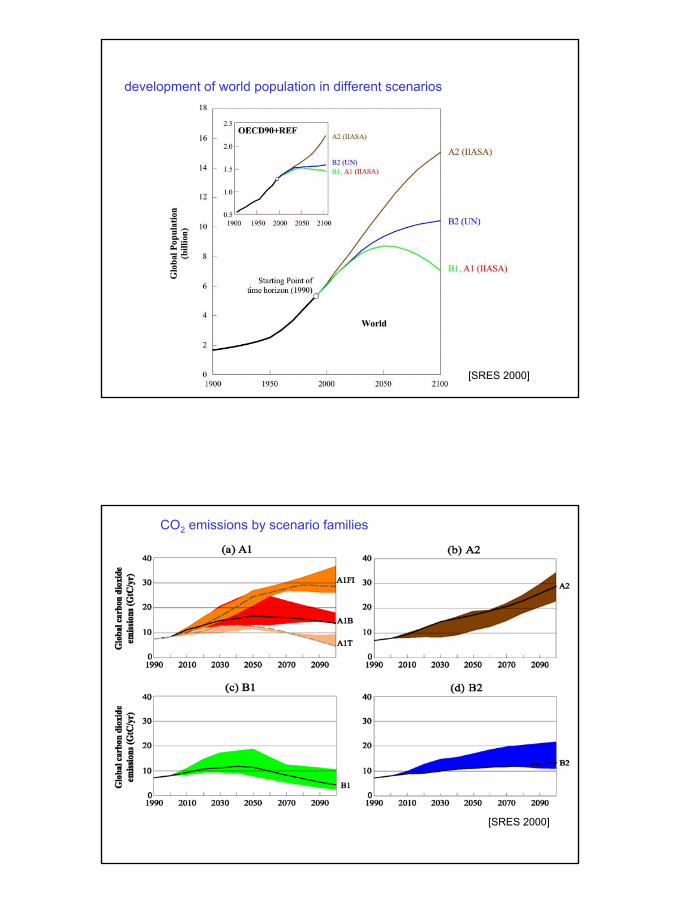
development of world population in different scenarios
[SRES 2000]
CO2 emissions by scenario families
[SRES 2000]
15
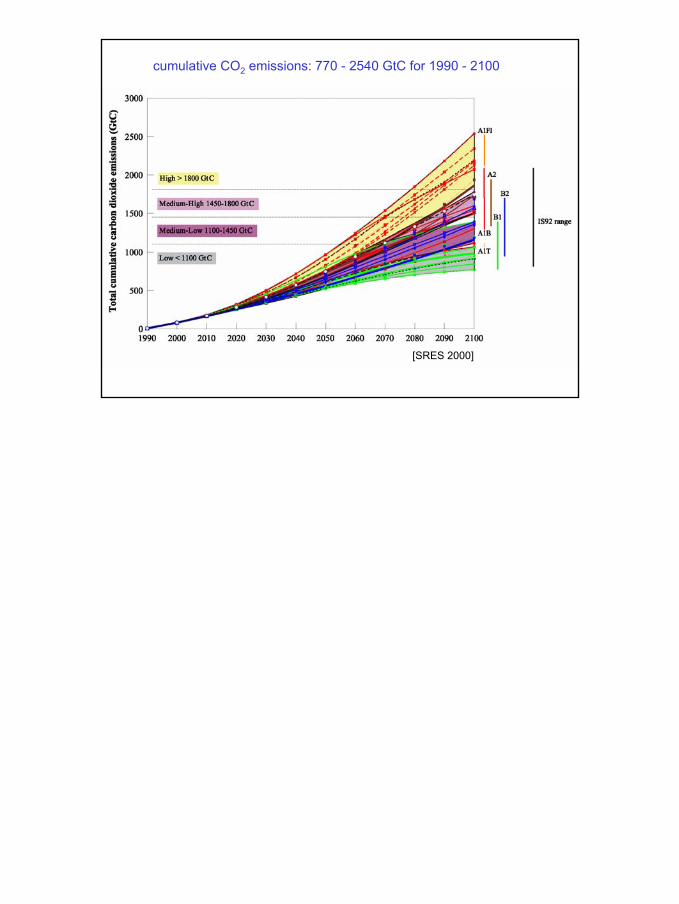
cumulative CO2 emissions: 770 - 2540 GtC for 1990 - 2100
[SRES 2000]