Volvo Group · - Volvo +24% - Renault Trucks +15% Total market outlook for 2016: 280,000 ... 2015:...
23
Volvo Group Headquarters Volvo Group FOURTH QUARTER 2015 MARTIN LUNDSTEDT Fourth quarter 2015 1
Transcript of Volvo Group · - Volvo +24% - Renault Trucks +15% Total market outlook for 2016: 280,000 ... 2015:...

Volvo Group Headquarters
Volvo Group FOURTH QUARTER 2015 MARTIN LUNDSTEDT
Fourth quarter 2015 1
Volvo Group Headquarters Fourth quarter 2015 2
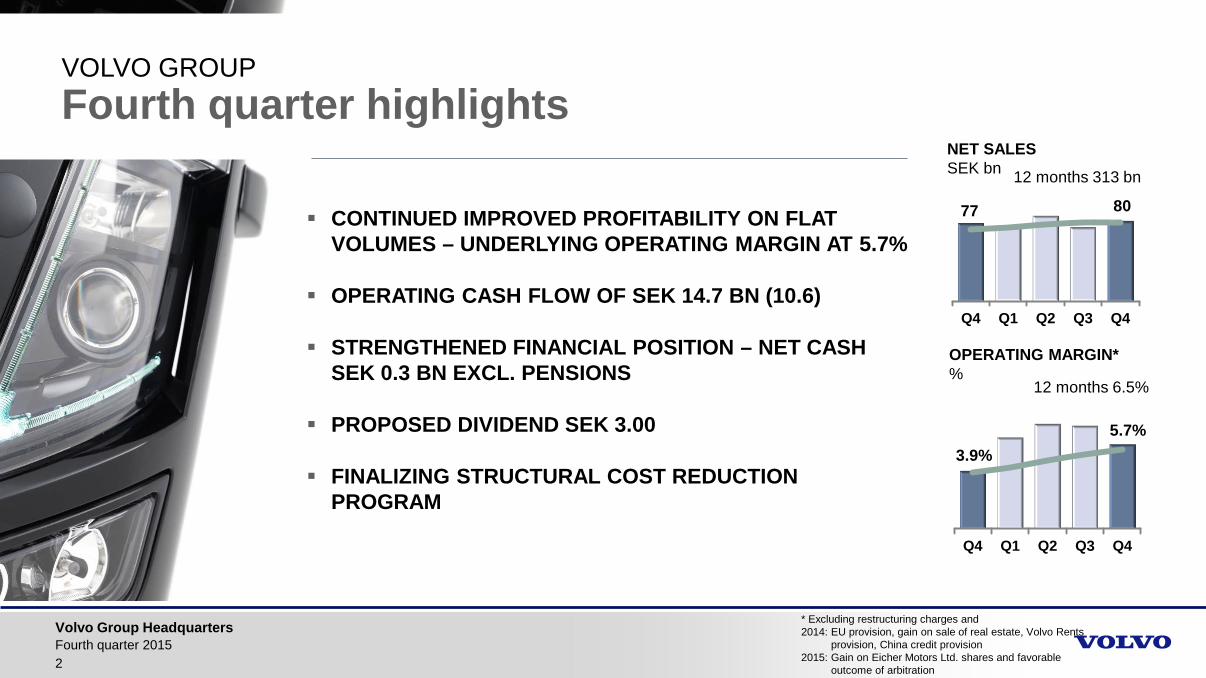
CONTINUED IMPROVED PROFITABILITY ON FLAT VOLUMES – UNDERLYING OPERATING MARGIN AT 5.7%
OPERATING CASH FLOW OF SEK 14.7 BN (10.6)
STRENGTHENED FINANCIAL POSITION – NET CASH SEK 0.3 BN EXCL. PENSIONS
PROPOSED DIVIDEND SEK 3.00
FINALIZING STRUCTURAL COST REDUCTION PROGRAM
NET SALES SEK bn
Q4 Q1 Q2 Q3 Q4
12 months 313 bn
77 80
OPERATING MARGIN* %
Q4 Q1 Q2 Q3 Q4
12 months 6.5%
3.9% 5.7%
* Excluding restructuring charges and 2014: EU provision, gain on sale of real estate, Volvo Rents provision, China credit provision 2015: Gain on Eicher Motors Ltd. shares and favorable outcome of arbitration
VOLVO GROUP Fourth quarter highlights

Volvo Group Headquarters
3
Total market increased by 19% in 2015
Market shares 2015: - Volvo 15.7% (-0.9) - Renault Trucks 8.1% (0.3)
Net order intake improved by 20% in Q4 - Volvo +24% - Renault Trucks +15%
Total market outlook for 2016: 280,000 units (+4% vs. 2015)
TRUCKS EUROPE Improving demand
ORDERS & DELIVERIES Book-to-bill Q4: 99%
Q4 Q1 Q2 Q3 Q4 Q1 Q2 Q3 Q4
Orders Deliveries
26’ 26’
00 01 02 03 04 05 06 07 08 09 10 11 12 13 14 15 16
Forecast: 2016: 280’
TOTAL MARKET (heavy-duty) 2015: 270’ trucks
Fourth quarter 2015

Volvo Group Headquarters
4
Total market increased by 12% in 2015
Market shares 2015: - Volvo 12.2% (+0.3) - Mack 7.4% (-0.8)
Net order intake decreased by 58% in Q4 - Market correction in long-haulage - Dealer destocking - Extraordinary high order intake last year
Increasing captive components - Volvo – engines 92%, I-Shift 82% - Mack – engines 99%, Highway mDRIVE 73% Vocational mDRIVE 6%
Total market outlook for 2016: 260,000 units (-14% vs. 2015)
TRUCKS NORTH AMERICA Declining from high levels
ORDERS & DELIVERIES Book-to-bill Q4: 68%
Q4 Q1 Q2 Q3 Q4 Q1 Q2 Q3 Q4
Orders Deliveries
15’ 10’
00 01 02 03 04 05 06 07 08 09 10 11 12 13 14 15 16
Forecast: 2016: 260’
TOTAL MARKET (heavy-duty) 2015: 302’ trucks
Fourth quarter 2015
Volvo Group Headquarters
5
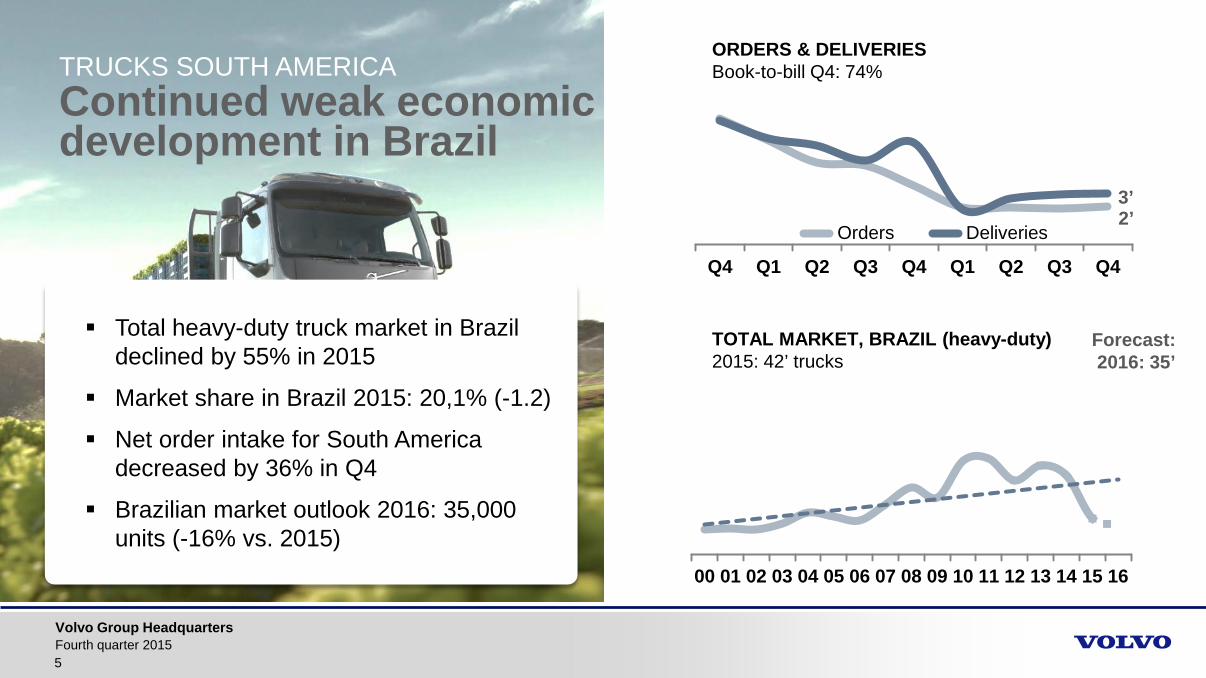
Total heavy-duty truck market in Brazil declined by 55% in 2015
Market share in Brazil 2015: 20,1% (-1.2)
Net order intake for South America decreased by 36% in Q4
Brazilian market outlook 2016: 35,000 units (-16% vs. 2015)
TRUCKS SOUTH AMERICA Continued weak economic development in Brazil
ORDERS & DELIVERIES Book-to-bill Q4: 74%
Q4 Q1 Q2 Q3 Q4 Q1 Q2 Q3 Q4
Orders Deliveries
00 01 02 03 04 05 06 07 08 09 10 11 12 13 14 15 16
Forecast: 2016: 35’
TOTAL MARKET, BRAZIL (heavy-duty) 2015: 42’ trucks
Fourth quarter 2015
2’ 3’

Volvo Group Headquarters
6
China’s medium- and heavy-duty market down 24% in 2015
Many markets impacted by Chinese slow-down
Gaining market shares
Japanese demand remains healthy
UD Trucks’ HD market share in Japan 2015: 18.3% (-0.5)
TRUCKS ASIA Mixed market development
ORDERS & DELIVERIES Book-to-bill Q4: 84%
Q4 Q1 Q2 Q3 Q4 Q1 Q2 Q3 Q4
Orders Deliveries
MARKET OUTLOOK medium- & heavy-duty
03 04 05 06 07 08 09 10 11 12 13 14 15 16
China India Japan 2015: 751’
2016: 750’
Forecasts:
2015: 278’ 2016: 315’
2015: 90’ 2016: 90’
Fourth quarter 2015
9’ 7’

Volvo Group Headquarters
7
Markets YTD November: - Europe: -6% (excl. Russia 3%) - North America: +1% - China: -48%
Deliveries down by 26% mainly due to low demand in China, Russia and Brazil
Net order intake decreased by 18%
Continued sales activities to improve market and product mix
Market share gain on heavy machines of 1.8 percentage points
Introducing new products at Bauma fair
CONSTRUCTION EQUIPMENT Continued headwind in BRC
01 02 03 04 05 06 07 08 09 10 11 12 13 14 15 16
China Asia, excl China
TOTAL MARKET
01 02 03 04 05 06 07 08 09 10 11 12 13 14 15 16
Europe North America
ORDERS & DELIVERIES Book-to-bill Volvo Q4: 115%
Q4 Q1 Q2 Q3 Q4 Q1 Q2 Q3 Q4
Orders Deliveries9’
Forecast Europe 2016: -5% to +5%
Forecast China 2016: -20% to -10%
Forecast Asia 2016: -10% to 0%
Fourth quarter 2015
10’
Forecast N America 2016: -10% to 0%

Volvo Group Headquarters
8
Continued good demand in North America, recovery in Europe and weak demand in Brazil
Deliveries up 9%, orders up 24% in Q4
Launch of Volvo 9800 coach in Mexico
Preparing for introduction of hybrid buses in India
BUSES VOLVO PENTA
Fourth quarter 2015
Industrial engines - Stable mature markets and declining emerging markets
Marine engines – flat markets
Net order intake decreased by 8% in Q4
Strengthened market position in all segments
Launch of new D16 engine for marine commercial application

Volvo Group Headquarters
Volvo Group FOURTH QUARTER 2015 JAN GURANDER
Fourth quarter 2015 9

Volvo Group Headquarters
10
VOLVO GROUP Sales growth in North America and Europe - partly offset by decline in South America and Africa
NET SALES SEK bn
Fourth quarter 2015
FX impact: +3 bn
+3.1
+3.7
Q4 2014
77.5 79.6
Other markets
-1.4
Q4 2015
-0.4
South America
Asia
-2.9
North America
Europe

Volvo Group Headquarters
VOLVO GROUP Earnings improvement driven by Trucks and Buses
+ Trucks + Buses + Customer Finance + Penta
11
OPERATING INCOME* SEK M
Fourth quarter 2015 *Excluding restructuring charges **2014: EU provision 3,790 and credit provision China 660 2015: Arbitration case 809
FX impact: +1.201 M
- Volvo CE – China credit provision of SEK 158 M
Corporate & other
-1
Cust. Finance
+62
Volvo Penta
+50
Buses
+351
Volvo CE
-36
Trucks
5,382
One- timers
Q4 2015**
+809
Q4 2014
3,021
One- timers
Q4 2014**
+4,450
+1,126
-1,429 Q4
2015 Q4
2015
4,573
Q4 2014

Volvo Group Headquarters
VOLVO GROUP Earnings improvement on slightly lower volumes
+ Higher R&D capitalization + Lower selling expenses + Europe and North America earnings + Currency
- Lower volumes - Lower earnings in Brazil
12
OPERATING INCOME* SEK M
Fourth quarter 2015
Cash R&D
+1,282
Gross income
Q4 2014
Q4 2015
5,382
One- timers
Q4 2015**
+809
Q4 2015
3,021
One- timers
Q4 2014**
+4,450
Q4 2014
-1,429
4,573
Other
-434
Admin.
-121 -9
Selling
+121
R&D capitaliz.
+713
FX impact: +1.201 M
*Excluding restructuring charges **2014: EU provision 3,790 and credit provision China 660 2015: Arbitration case 809

Volvo Group Headquarters
Q4 Q1 Q2 Q3 Q4 Q1 Q2 Q3 Q4
TRUCKS Profitability improvement trend continues - on flat volumes
NET SALES SEK bn
52 54 55
OPERATING MARGIN* %
Q4 Q1 Q2 Q3 Q4 Q1 Q2 Q3 Q4
7.9% 6.0% 5.7%
12 months 7.6%
OPERATING INCOME* SEK bn
Q4 Q1 Q2 Q3 Q4 Q1 Q2 Q3 Q4
3.0 4.4
3.2
12 months 16.2 bn Currency: +679 M
13 Fourth quarter 2015
12 months 214 bn Currency: +2.1 bn
* Excluding restructuring charges and 2014: EU provision, gain on sale of real estate 2015: gain on Eicher Motors Ltd. shares and favorable outcome of arbitration case

Volvo Group Headquarters
TRUCKS Improved earnings in Europe and North America
Fourth quarter 2015
+ Higher R&D capitalization + Lower selling expenses + Europe and North America + Currency SEK +679 M
- Negative product mix - Brazil
OPERATING INCOME SEK M
OPERATING INCOME SEK M
14
*Excluding restructuring charges **Excluding restructuring charges and 2014: EU provision, 2015: arbitration case
3,248**
EU provision +3,790
Q4 2014 -542*
Arbitration case
4,374**
-772
Q4 2015
5,146*

Volvo Group Headquarters
CONSTRUCTION EQUIPMENT Adapting to declining sales volumes
NET SALES SEK bn
Q4 Q1 Q2 Q3 Q4 Q1 Q2 Q3 Q4
13 12 11
OPERATING MARGIN* %
Q4 Q1 Q2 Q3 Q4 Q1 Q2 Q3 Q4
-1.7% -6.6% 2.1%
12 months 4.1%
OPERATING INCOME* SEK M
Q4 Q1 Q2 Q3 Q4 Q1 Q2 Q3 Q4
272 -191 -815
12 months 2.1 bn Currency: +148 M
* Excluding restructuring charges
Fourth quarter 2015
12 months 51 bn Currency: +0.6 bn
15

Volvo Group Headquarters
CONSTRUCTION EQUIPMENT Improved product and market mix, partly offset by volume drop
*Excluding restructuring charges **Excluding restructuring charges and China credit provisions
- Lower volumes, deliveries down 26% - Low capacity utilization - Lower earnings in China
OPERATING INCOME SEK M
OPERATING INCOME SEK M + Favorable product and market mix
+ Reduced operating expenses + Currency SEK +148 M
16
+660
Q4 2014 -815*
-155**
China credit
provision -33**
+158
-191*
Fourth quarter 2015
China credit
provision
Q4 2015

Volvo Group Headquarters
NET SALES SEK bn
Q4 Q1 Q2 Q3 Q4 Q1 Q2 Q3 Q4
1.8 2.0 2.2
OPERATING INCOME* SEK M
Q4 Q1 Q2 Q3 Q4 Q1 Q2 Q3 Q4
72 140 90
12 months 1,102 M Currency: +22 M
NET SALES SEK bn
Q4 Q1 Q2 Q3 Q4 Q1 Q2 Q3 Q4
5.5 5.9 7.3
Q4 Q1 Q2 Q3 Q4 Q1 Q2 Q3 Q4
OPERATING INCOME* SEK M
50
331
-58
12 months 882 M Currency: +269 M
* Excluding restructuring charges
BUSES VOLVO PENTA
Fourth quarter 2015
12 months 24 bn Currency: +0.4 bn
12 months 9 bn Currency: +0.1 bn
17

Volvo Group Headquarters
CUSTOMER FINANCE Continued profitability improvement
NEW FINANCING SEK bn
Q4 Q1 Q2 Q3 Q4 Q1 Q2 Q3 Q4
15.0 16.2 14.9
ROE 12 months, %
Q4 Q1 Q2 Q3 Q4 Q1 Q2 Q3 Q4
13.4% 12.5% 12.1%
OPERATING INCOME* SEK M
Q4 Q1 Q2 Q3 Q4 Q1 Q2 Q3 Q4
397 534 472
12 months 2,006 M
Fourth quarter 2015 * Excluding restructuring charges
12 months 55 bn
18

Volvo Group Headquarters
VOLVO GROUP – INDUSTRIAL OPERATIONS Improved cash flow
OPERATING CASH FLOW SEK bn, 12 months SEK 18.3 bn
Q4 Q1 Q2 Q3 Q4 Q1 Q2 Q3 Q4
10.3 10.6 14.7
Q4 Q1 Q2 Q3 Q4 Q1 Q2 Q3 Q4
2.4
INVESTMENTS IN PPE SEK bn, 12 months SEK 5.9 bn
2.3 2.0
Acc
ount
sre
ceiv
able
Inve
ntor
ies
Trad
epa
yabl
es
Oth
er
Tota
lch
ange
CASH FLOW EFFECT FROM CHANGES IN WORKING CAPITAL SEK bn
1.3 2.2
5.0
1.3
Fourth quarter 2015
9.8
19

Volvo Group Headquarters Fourth quarter 2015
SEK bn
2012 2013 2014 2015
Targeted reduction 2016 vs
2012
Structural cost reduction in Gross Income - - -1.0 -2.5
Cash R&D 16.9 15.9 15.2 14.8
Selling expenses 27.9 28.5 27.4 27.7
Administrative expenses 5.6 5.9 5.4 5.8
Total reduction vs. 2012 -0.1 -3.3 -4.6 -10
Total reduction vs. 2012 excl. currency -6.8
VOLVO GROUP
Structural cost to be reduced by SEK 10 bn – facing currency-headwind
Implemented by end 2015 with full-year effect in 2016
20

Volvo Group Headquarters
FX impact: +5.1 bn
OPERATING INCOME* SEK M
Fourth quarter 2015
Admin.
+5,417
2015
25,652
One- timers 2015**
2015
20,235 -361
Selling
-246
R&D capitaliz.
+891
Cash R&D
+397
Gross income
+8,925
2014
11,802
One- timers 2014**
Other
-1,173
+3,409
2014
8,393
*Excluding restructuring charges **2014: EU provision -3,790, credit provision China -660, property sale +815, Rents provision +226 2015: Arbitration case +809, Eicher shares +4,608
VOLVO GROUP Earnings improvement in FY 2015
2014: Sales 283 bn Op. Margin* 4.2%
2015: Sales 313 bn Op. Margin* 6.5%

Volvo Group Headquarters Fourth quarter 2015 22
FOUNDATION LAID IN 2015
- Earnings improvement
- Improved cash flow
- Strengthened financial position
NEW ORGANIZATION IN 2016 TO DRIVE ORGANIC GROWTH AND FURTHER IMPROVE PROFITABILITY
VOLVO GROUP Summary

Volvo Group Headquarters
Fourth quarter 2015 Volvo Group
Third quarter 2015 23