Volumetrically-Derived Global Navigation Satellite System …€¦ · constellations operate in...
52
Bryan W. Welch Glenn Research Center, Cleveland, Ohio Volumetrically-Derived Global Navigation Satellite System Performance Assessment From the Earth’s Surface Through the Terrestrial Service Volume and the Space Service Volume NASA/TM—2016-219398 November 2016 https://ntrs.nasa.gov/search.jsp?R=20160013863 2020-04-24T07:40:26+00:00Z
Transcript of Volumetrically-Derived Global Navigation Satellite System …€¦ · constellations operate in...

Bryan W. WelchGlenn Research Center, Cleveland, Ohio
Volumetrically-Derived Global Navigation Satellite System Performance Assessment From the Earth’s Surface Through the Terrestrial Service Volume and the Space Service Volume
NASA/TM—2016-219398
November 2016
https://ntrs.nasa.gov/search.jsp?R=20160013863 2020-04-24T07:40:26+00:00Z

NASA STI Program . . . in Profile
Since its founding, NASA has been dedicated to the advancement of aeronautics and space science. The NASA Scientific and Technical Information (STI) Program plays a key part in helping NASA maintain this important role.
The NASA STI Program operates under the auspices of the Agency Chief Information Officer. It collects, organizes, provides for archiving, and disseminates NASA’s STI. The NASA STI Program provides access to the NASA Technical Report Server—Registered (NTRS Reg) and NASA Technical Report Server—Public (NTRS) thus providing one of the largest collections of aeronautical and space science STI in the world. Results are published in both non-NASA channels and by NASA in the NASA STI Report Series, which includes the following report types: • TECHNICAL PUBLICATION. Reports of
completed research or a major significant phase of research that present the results of NASA programs and include extensive data or theoretical analysis. Includes compilations of significant scientific and technical data and information deemed to be of continuing reference value. NASA counter-part of peer-reviewed formal professional papers, but has less stringent limitations on manuscript length and extent of graphic presentations.
• TECHNICAL MEMORANDUM. Scientific
and technical findings that are preliminary or of specialized interest, e.g., “quick-release” reports, working papers, and bibliographies that contain minimal annotation. Does not contain extensive analysis.
• CONTRACTOR REPORT. Scientific and technical findings by NASA-sponsored contractors and grantees.
• CONFERENCE PUBLICATION. Collected papers from scientific and technical conferences, symposia, seminars, or other meetings sponsored or co-sponsored by NASA.
• SPECIAL PUBLICATION. Scientific,
technical, or historical information from NASA programs, projects, and missions, often concerned with subjects having substantial public interest.
• TECHNICAL TRANSLATION. English-
language translations of foreign scientific and technical material pertinent to NASA’s mission.
For more information about the NASA STI program, see the following:
• Access the NASA STI program home page at http://www.sti.nasa.gov
• E-mail your question to [email protected] • Fax your question to the NASA STI
Information Desk at 757-864-6500
• Telephone the NASA STI Information Desk at 757-864-9658 • Write to:
NASA STI Program Mail Stop 148 NASA Langley Research Center Hampton, VA 23681-2199

Bryan W. WelchGlenn Research Center, Cleveland, Ohio
Volumetrically-Derived Global Navigation Satellite System Performance Assessment From the Earth’s Surface Through the Terrestrial Service Volume and the Space Service Volume
NASA/TM—2016-219398
November 2016
National Aeronautics andSpace Administration
Glenn Research Center Cleveland, Ohio 44135

Acknowledgments
I would like to express my gratitude to James Miller, Deputy Director of Policy & Strategic Communications within the Space Communications and Navigation Program, for the opportunity to participate in the International Committee on Global Navigation Satellite Systems (GNSS)’ Working Group B’s efforts to illustrate the benefits to the space user within the Terrestrial and Space Service Volumes that utilizes a multiple GNSS based methodology.
Available from
Level of Review: This material has been technically reviewed by technical management.
NASA STI ProgramMail Stop 148NASA Langley Research CenterHampton, VA 23681-2199
National Technical Information Service5285 Port Royal RoadSpringfield, VA 22161
703-605-6000
This report is available in electronic form at http://www.sti.nasa.gov/ and http://ntrs.nasa.gov/

NASA/TM—2016-219398 1
Volumetrically-Derived Global Navigation Satellite System Performance Assessment From the Earth’s Surface Through the Terrestrial Service Volume and the Space Service Volume
Bryan W. Welch
National Aeronautics and Space Administration Glenn Research Center Cleveland, Ohio 44135
Abstract NASA is participating in the International Committee on Global Navigation Satellite Systems
(GNSS) (ICG)’s efforts towards demonstrating the benefits to the space user from the Earth’s surface through the Terrestrial Service Volume (TSV) to the edge of the Space Service Volume (SSV), when a multi-GNSS solution space approach is utilized. The ICG Working Group: Enhancement of GNSS Performance, New Services and Capabilities has started a three phase analysis initiative as an outcome of recommendations at the ICG-10 meeting, in preparation for the ICG-11 meeting. The first phase of that increasing complexity and fidelity analysis initiative was recently expanded to compare nadir-facing and zenith-facing user hemispherical antenna coverage with omnidirectional antenna coverage at different distances of 8,000 km altitude and 36,000 km altitude. This report summarizes the performance using these antenna coverage techniques at distances ranging from 100 km altitude to 36,000 km to be all encompassing, as well as the volumetrically-derived system availability metrics.
Introduction The region of space nearby the Earth is divided into two specific regions, defined as the Terrestrial
Service Volume (TSV) and the Space Service Volume (SSV) (Ref. 1). The TSV is defined from the Earth’s surface up to an altitude of 3,000 km, while the SSV is defined from the altitude of 3,000 km to the geostationary altitude of roughly 36,000 km. These two regions of space are illustrated in Figure 1. Navigation system performance is vastly different in these two regions of space, as many of the GNSS constellations operate in Medium Earth Orbit (MEO) at an altitude around 20,000 km. Space users in the TSV can expect to observe GNSS satellites with a zenith-facing antenna just as a ground user on the Earth’s surface, though a nadir-facing antenna can also provide comparable performance above specific minimum altitudes, such that Earth blockage effects are minimized. However, space users in the SSV will observe dramatically different numbers of GNSS satellites, both dependent on the space user altitude but also its antenna location. At the maximum altitude within the SSV at 36,000 km, space users will not be able to observe MEO GNSS satellites with a zenith-facing antenna, but rather, will be required to observe GNSS satellites with a nadir-facing antenna which have signals crossing over the Earth’s limb (Ref. 2).
Analysis (Ref. 3) previously reported the geometrical coverage performance of four global and two regional GNSS constellations, solely using a nadir-facing antenna at the altitude of 36,000 km altitude. The trade space of the global GNSS constellation includes the United States’ Global Position System (GPS) (Refs. 4 and 5), European Galileo (Ref. 6), Russian Global Navigation Satellite System (GLONASS) (Ref. 7), and Chinese BeiDou (Ref. 8). The trade space of the regional GNSS constellations include Indian Regional Navigation Satellite System (IRNSS) (Ref. 9) and the Japanese Quasi-Zenith Satellite System (QZSS) (Ref. 10). Due to the nature of the main antenna beam of those GNSS constellations being directed nadir, along with the fact that side-lobe antenna performance is unspecified, visibility is restricted to the portion of the antenna beam that extends beyond the Earth blockage, as seen in Figure 2.

NASA/TM—2016-219398 2
Figure 1.—Earth Terrestrial and Space Service Volume Regions
Figure 2.—GNSS Visibility Limitations

NASA/TM—2016-219398 3
That ultimately limits the visible number of GNSS spacecraft that can be in view of the space users at all altitudes. The results of this paper utilize previously developed analytical techniques (Ref. 3) for deriving the visibility Figures of Merit with the concept of analyzing individual GNSS constellations separate from the combined multi-GNSS system. However, this work extends that capability by performing those analyses at distances ranging from above the Earth’s surface through the edge of the SSV, using nadir-facing, zenith-facing, and omnidirectional user antenna constraints, as well as calculating a volumetrically-derived system availability metric, as a means to combine the performance characteristics over the various altitudes analyzed.
Analysis Methodology and Assumptions This paper is an expanded effort of the results reported previously (Ref. 3), where the antenna
constraint was limited to a nadir-facing hemispherical coverage at a distance of only 36,000 km altitude. These efforts build on those same Keplarian orbital simulation assumptions, equal area-based grid of points and beamwidths to assess the full distance range from the Earth’s surface using additional user antenna constraints of zenith-facing hemispherical coverage and omnidirectional coverage. All orbital simulation assumptions and orbital Keplarian parameters can be found in Reference 3.
The table of the GNSS transmit beamwidths is provided in Table 1 for both the L1 (1575.42 MHz) and L5 (1176.45 MHz) frequency bands that this study also analyzes against. Note that for the BeiDou constellation, the beamwidth is defined separately for the satellites in MEO or Geostationary (GEO) / Inclined Geosynchronous Orbit (IGSO). Also, for IRNSS, L1 beamwidth is not applicable, as IRNSS does not transmit the L1 frequency band. It is also important to note that all L5 beamwidths are larger than their constellation’s L1 beamwidth, as that will directly impact performance results.
Similarly to the previous study (Ref. 3), access is derived and limited from purely geometrical limitations from two perspectives. The space user in the SSV grid needs to be within the specified beamwidth angle of the GNSS transmitter beam, which may preclude access due to Earth blockage, as seen in Figure 3. Also, the GNSS transmitter needs to be within the space user’s antenna field of view, which is now defined to either be nadir-facing hemispherical, zenith-facing hemispherical, or omnidirectional. These three space user fields of view considerations are shown in Figure 4 through Figure 6, respectively. Previous specialized definitions for the IRNSS pointing vector (Ref. 3) also apply in this analysis effort, as that is an artifact of that constellation design and implementation.
TABLE 1.—GNSS TRANSMITTER BEAMWIDTHS GNSS Constellation L1 Beamwidth,
degree L5 Beamwidth,
degree
BeiDou 25 (MEO) 19 (GEO/IGSO)
28 (MEO) 22 (GEO/IGSO)
Galileo 20.5 23.5
GLONASS 20 28 GPS 23.5 26
IRNSS Not Applicable 16
QZSS 22 24

NASA/TM—2016-219398 4
Figure 3.—GNSS Transmitter Geometrical Access Considerations
Figure 4.—Space User Nadir-Facing Antenna Geometrical Access Considerations

NASA/TM—2016-219398 5
Figure 5.—Space User Zenith-Facing Antenna Geometrical Access Considerations
Figure 6.—Space User Omnidirectional Antenna Geometrical Access Considerations

NASA/TM—2016-219398 6
The overall simulation methodology is performed in multiple steps, which are listed below, to derive the Figures of Merit for a particular altitude:
1. Propagate orbit position vectors into Earth-Centered Earth-Fixed frame coordinates over scenario
time instances. 2. Calculate angle off GNSS boresight vector to all SSV grid points over scenario time instances. 3. Calculate angle off SSV nadir boresight vector to all GNSS orbit positions over scenario time
instances. 4. Determine yes/no access using maximum GNSS beamwidth consideration, Earth blockage
consideration, and SSV hemispherical/omnidirectional beamwidth consideration over scenario time instances for all SSV grid points.
5. Calculate Figures of Merit from access determination over scenario time instances over all SSV grid points.
Following the calculation of the System Availability (SA) metric over a matrix of data X that spans
the range of time instants NT by the range of grid points NP containing the number of available satellites in view at individual grid-time points, as shown below in Equations (1) and (2), the set of SA metrics for a particular minimum number of satellites in view are utilized together to derive the Volumetric System Availability parameter.
( ) ( )∑∑= =
=T PN
i
N
jPTNjiY
NNNSA
1 1minmin ,,1
(1)
( ) ( ) ≥
=otherwise,0,,1
,, minmin
NjiXNjiY (2)
The Volumetric System Availability (VSA) is defined as the weighted average of the various SA terms, where the weighting is proportional to the slice of the volume in the TSV or SSV that the SA represents using sequential altitudes Altk–1 and Altk for a range of altitudes NA, compared to the overall volume of the SSV. This is defined in Equation (3), where the weighting term is defined in Equation (4), using the definition of RE as utilized in the orbital propagation routines.
( ) ( ) ( )∑=
−=AN
kkkk AltAltWAltNSANVSA
11minmin ,, (3)
( ) ( ) ( )( ) ( )33
31
3
1000,36
,EE
kEkEkk
RRAltRAltRAltAltW
−+
+−+= −
− (4)
This additional term can only be derived in this type of analysis, where results are compared not only over a spherical surface, but over a range of spherical surfaces defined to represent the volume of space, which is an additional metric not previously available to be defined in Reference 3.

NASA/TM—2016-219398 7
Access Results
The simulation results that are analyzed for this study are the various Figures of Merit (FoM) as defined in Reference 3, with the additional computation of the new VSA metrics. The Figures of Merit are defined as System Availability and Maximum Outage time, with the minimum number of satellites under consideration being either one or four satellites for each FoM. Since the grid points are defined as having equal area pertaining to each grid point, averaging of performance over the grid points can be done using a pure mean calculation, without additional weighting factors needing to be applied pertaining to the area of the spherical surface that corresponds to each grid point. For the Volumetric System Availability, weighting factors do need to be applied, as the weighting for each grid point over the Earth’s surface corresponds to a different volume of space at different altitudes. As stated, the constellations being considered are the six individual constellations, as well as a combined multi-GNSS constellation consisting of all individual constellations, at either the L1 or L5 frequency bands, independently. Therefore, a system performance assessment is not, for example, of using the L1 frequency band performance of BeiDou, Galileo, GLONASS, GPS and QZSS combined with the L5 frequency band performance of IRNSS. Finally, for the purpose of IRNSS, which does not support the L1 frequency band, tabulated SA results are shown as 0, while Maximum Outage times are reported as the duration of the simulations, in minutes, with a value of 20160 minutes.
Summary tables of the Volumetric System Availability parameters for the two frequency bands, each reporting the three antenna field of view considerations, are provided in Table 2 and Table 3, for the L1 frequency band and L5 frequency band respectively. Visualizations of the SA metrics, as well as the maximum outage time metrics are provided in Appendix A, while the tabulated data used in those plots are provided in Appendix B. It should also be noted that the tabulated data uses a rounding down scheme to the tenth’s decimal place, such that 100 percent System Availability does not mean 99.9999 percent System Availability, which would be reported as 99.9 percent System Availability.
TABLE 2.—L1 VOLUMETRIC SYSTEM AVAILABILITY RESULTS Satellites in view
Antenna configuration
BeiDou Galileo GLONASS GPS IRNSS QZSS All
1 Nadir-facing 99.3 88.8 70.4 95.1 0 37.1 99.9
1 Zenith-facing 11.5 7.1 4.2 6.4 0 5.9 15
1 Omnidirectional 99.3 88.9 70.5 95.1 0 41.2 99.9
4 Nadir-facing 46.2 9.2 3.5 20.6 0 3.3 98.1 4 Zenith-facing 3.4 1.5 0.8 1.6 0 0.8 5.8
4 Omnidirectional 47.5 10.6 4.6 21.2 0 5.7 98.2
TABLE 3.—L5 VOLUMETRIC SYSTEM AVAILABILITY RESULTS Satellites in view
Antenna configuration
BeiDou Galileo GLONASS GPS IRNSS QZSS All
1 Nadir-facing 99.9 97.9 99.2 98.7 48.5 41.9 99.9 1 Zenith-facing 13.5 8.4 6.3 7.2 5.4 6.8 18.2
1 Omnidirectional 99.9 97.9 99.2 98.7 52.4 46.4 100
4 Nadir-facing 68.6 21.9 38 39.1 4 5 99.9
4 Zenith-facing 4.6 2.3 2.2 2.1 1.5 1 7.8 4 Omnidirectional 69.4 22.8 38.2 39.3 5.4 8.1 99.9

NASA/TM—2016-219398 8
Results in Table 2 and Table 3 summarize the Volumetric System Availability findings, which are comprised of data illustrated in plots in Appendix A and tabulated in Appendix B. Several key findings are observed in these data. For any given antenna configuration, the larger L5 beamwidth, compared to the L1 beamwidth, provides higher performance capabilities. Also, the omnidirectional antenna provides the combination of zenith-facing and nadir-facing hemispherical coverage capabilities, and can be considered an upper bound on the performance of that particular constellation using the specified beamwidths. The nadir-facing antenna orientation is shown to have a reduction in performance for low altitudes within the typical TSV region of space, which is due to the Earth blockage accounting for a larger percentage of the field of view of that sensor. Finally, the zenith-facing antenna orientation is shown to have its performance reduce as a function of the user orbital altitude, due to the reduced portion of its field of view which intersects the nominal GNSS beamwidth. In that case, altitudes above the GNSS altitude will not see any System Availability due to the geometrical constraints completely blocking the intersection of those signals, which is the primary reason why the VSA for the zenith-facing antenna is so low. If the VSA term had been calculated solely for the TSV, then the data in Appendix B shows that it would be a much higher value than what is was calculated for in the TSV/SSV spatial region combination.
Conclusions and Next Steps The analysis presented in this paper documents the navigation performance at many altitude levels
within the TSV and SSV using individual GNSS constellations and a combined multi-GNSS constellation at the individual L1 and L5 frequency bands. This data is also calculated for three different space user antenna orientations, those being nadir-facing, zenith-facing, and omnidirectional, where the nadir-facing and zenith-facing configurations only provided hemispherical coverage. This paper also derives a new metric which illustrates the weighted-average performance over the TSV and SSV altitudes. The results show that no individual constellation can provide the nominal four satellite coverage at all points in time over all altitudes. The combination of the six GNSS platforms shows that with the use of the L5 frequency band, 100 percent volumetric coverage is possible for a single satellite, while global four satellite volumetric coverage is nearly possible, at 99.9 percent, given the constraint that the space user has an omnidirectional or nadir-facing antenna. Performance with a zenith-facing antenna is severely degraded in altitudes near and above that of the GNSS orbit. The results are very promising towards meeting the needs of space users in the TSV and SSV.
It is important to note that this study was limited to geometrical access considerations, which does not take into account aspects of access pertaining to received signal to noise ratios at the space user, which is also dependent on the space user receiver antenna gain pattern. Future work will need to take into account minimum signal to noise ratio thresholds to determine if a GNSS spacecraft is visible, which should ideally be derived in terms of both initial acquisition signal levels and tracking signal levels, where the tracking signal levels are lower than what is required for initial acquisition. Future work should also recognize the differences in modulation and coding formats of the various GNSS constellation signals, where a specific signal to noise threshold value of one constellation does not mean the same signal to noise threshold value for another constellation. Future work should also take advantage of the transmitter side lobe signals, which requires that the GNSS transmitter antenna pattern is known, to increase the number of potential spacecraft in view of the SSV user. Finally, it is important to note that the methodologies created and reported in this document can be utilized beyond the scope of navigation system coverage analysis, such as for space communication architecture analysis, though for that particular application, the minimum number of satellites in view would nominally be 1 satellite, aside from the use case of launch vehicle tracking, which may require even more signals in view than what is desired for navigation purposes.

NASA/TM—2016-219398 9
Appendix A.—Figure of Merit Performance Plots A.1 L1 Nadir-Facing Antenna Performance
Figure 7.—L1 Frequency Band Nadir-Facing 1 Satellite System Availability Performance
Figure 8.—L1 Frequency Band Nadir-Facing 4 Satellite System Availability Performance
NASA/TM—2016-219398 10
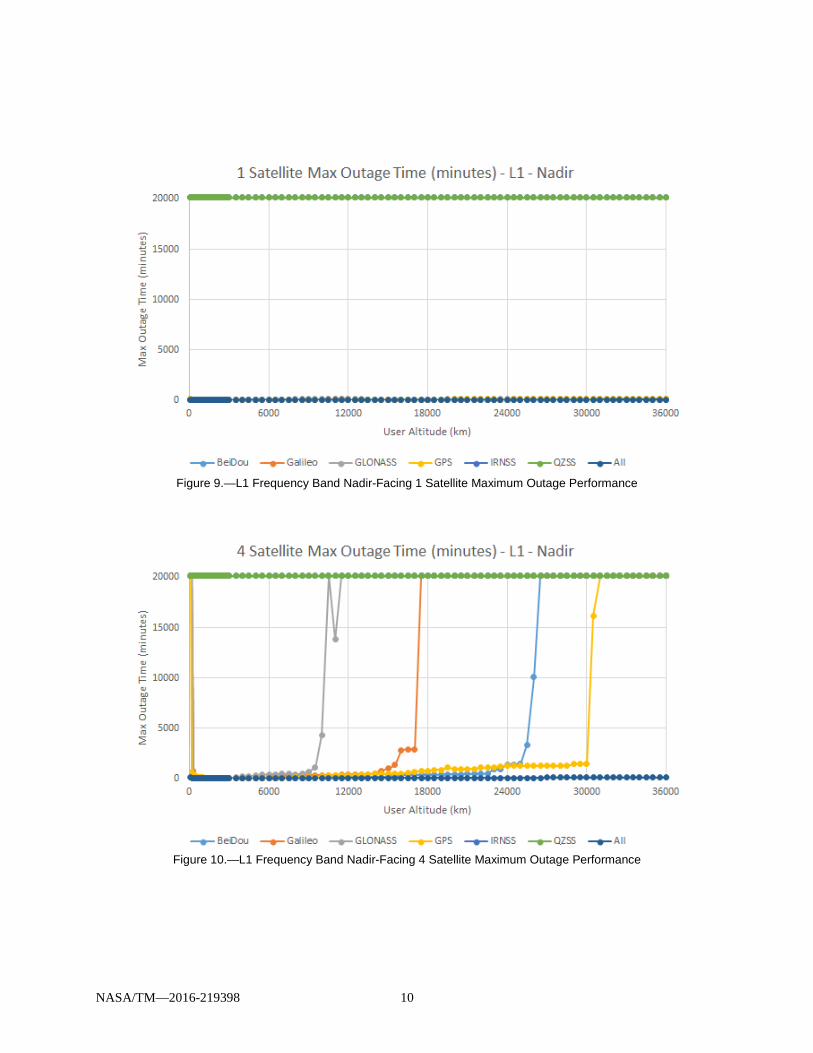
Figure 9.—L1 Frequency Band Nadir-Facing 1 Satellite Maximum Outage Performance
Figure 10.—L1 Frequency Band Nadir-Facing 4 Satellite Maximum Outage Performance
NASA/TM—2016-219398 11
A.2 L1 Zenith-Facing Antenna Performance
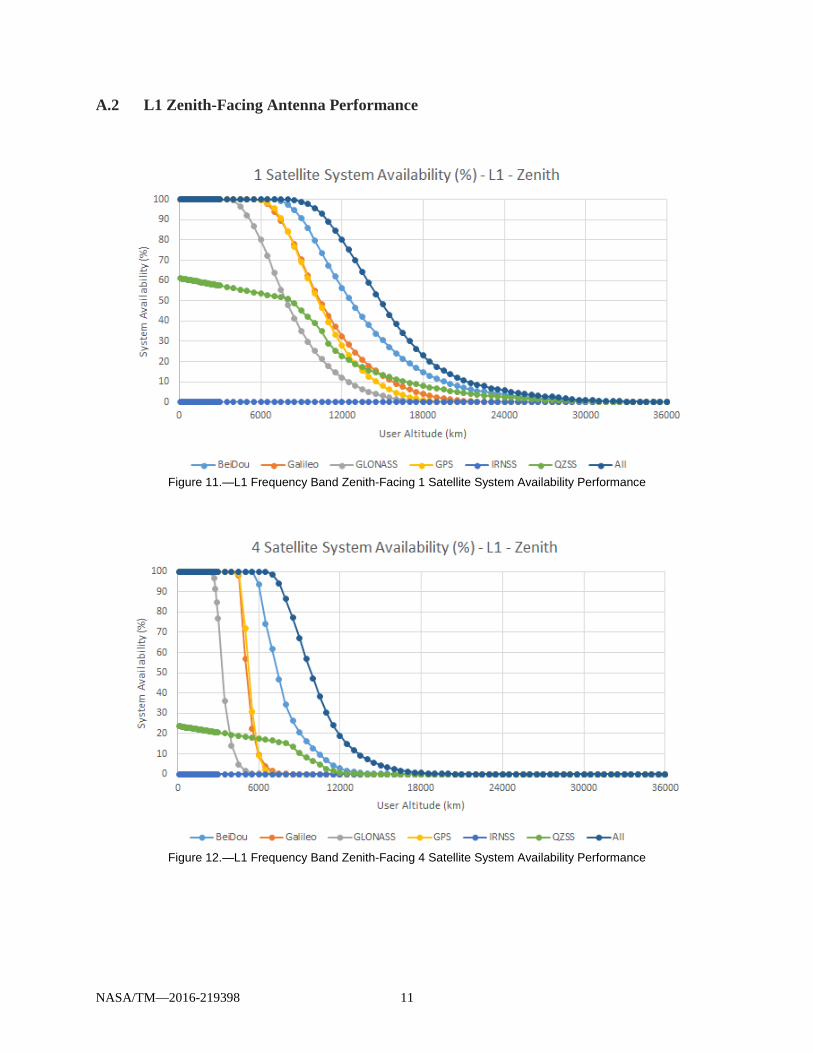
Figure 11.—L1 Frequency Band Zenith-Facing 1 Satellite System Availability Performance
Figure 12.—L1 Frequency Band Zenith-Facing 4 Satellite System Availability Performance

NASA/TM—2016-219398 12
Figure 13.—L1 Frequency Band Zenith-Facing 1 Satellite Maximum Outage Performance
Figure 14.—L1 Frequency Band Zenith-Facing 4 Satellite Maximum Outage Performance

NASA/TM—2016-219398 13
A.3 L1 Omnidirectional Antenna Performance
Figure 15.—L1 Frequency Band Omnidirectional 1 Satellite System Availability Performance
Figure 16.—L1 Frequency Band Omnidirectional 4 Satellite System Availability Performance
NASA/TM—2016-219398 14
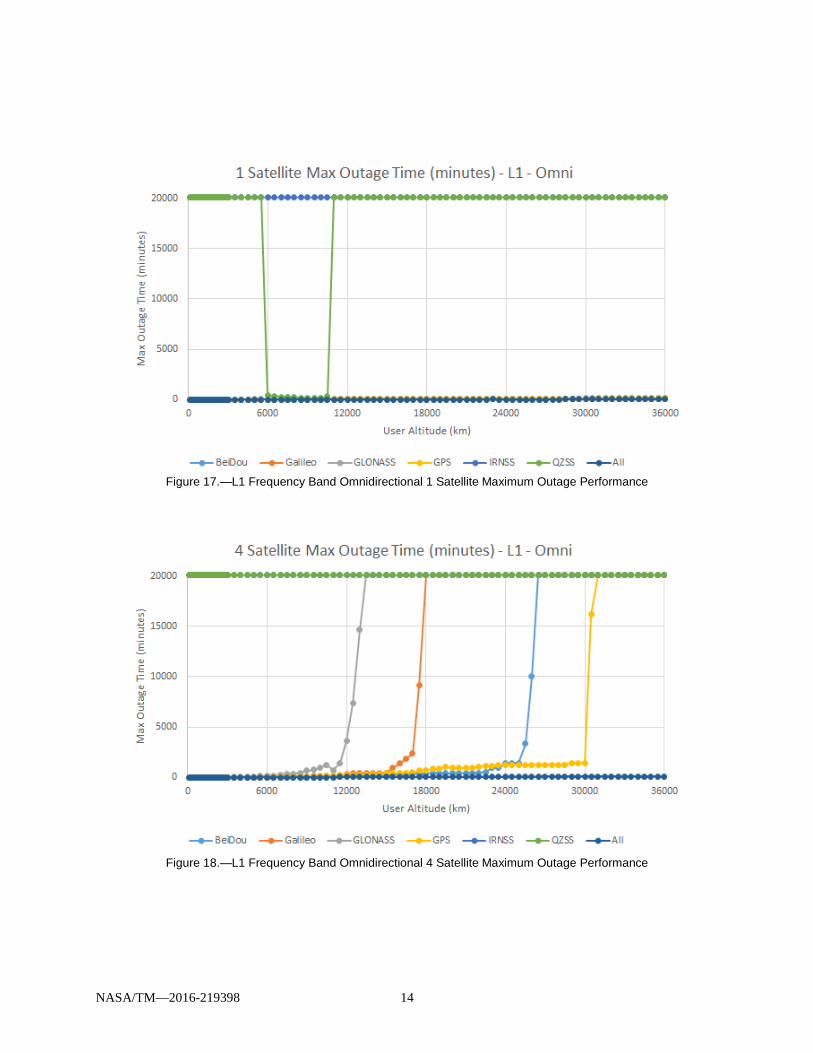
Figure 17.—L1 Frequency Band Omnidirectional 1 Satellite Maximum Outage Performance
Figure 18.—L1 Frequency Band Omnidirectional 4 Satellite Maximum Outage Performance

NASA/TM—2016-219398 15
A.4 L5 Nadir-Facing Antenna Performance
Figure 19.—L5 Frequency Band Nadir-Facing 1 Satellite System Availability Performance
Figure 20.—L5 Frequency Band Nadir-Facing 4 Satellite System Availability Performance

NASA/TM—2016-219398 16
Figure 21.—L5 Frequency Band Nadir-Facing 1 Satellite Maximum Outage Performance
Figure 22.—L5 Frequency Band Nadir-Facing 4 Satellite Maximum Outage Performance

NASA/TM—2016-219398 17
A.5 L5 Zenith-Facing Antenna Performance
Figure 23.—L5 Frequency Band Zenith-Facing 1 Satellite System Availability Performance
Figure 24.—L5 Frequency Band Zenith-Facing 4 Satellite System Availability Performance

NASA/TM—2016-219398 18
Figure 25.—L5 Frequency Band Zenith-Facing 1 Satellite Maximum Outage Performance
Figure 26.—L5 Frequency Band Zenith-Facing 4 Satellite Maximum Outage Performance

NASA/TM—2016-219398 19
A.6 L5 Omnidirectional Antenna Performance
Figure 27.—L5 Frequency Band Omnidirectional 1 Satellite System Availability Performance
Figure 28.—L5 Frequency Band Omnidirectional 4 Satellite System Availability Performance

NASA/TM—2016-219398 20
Figure 29.—L5 Frequency Band Omnidirectional 1 Satellite Maximum Outage Performance
Figure 30.—L5 Frequency Band Omnidirectional 4 Satellite Maximum Outage Performance

NASA/TM—2016-219398 21
Appendix B.—Tabulated Figure of Merit Performance Data B.1 L1 Nadir-Facing Antenna Performance
TABLE 4.—L1 FREQUENCY BAND NADIR-FACING 1 SATELLITE SYSTEM AVAILABILITY PERFORMANCE
NASA/TM—2016-219398 22
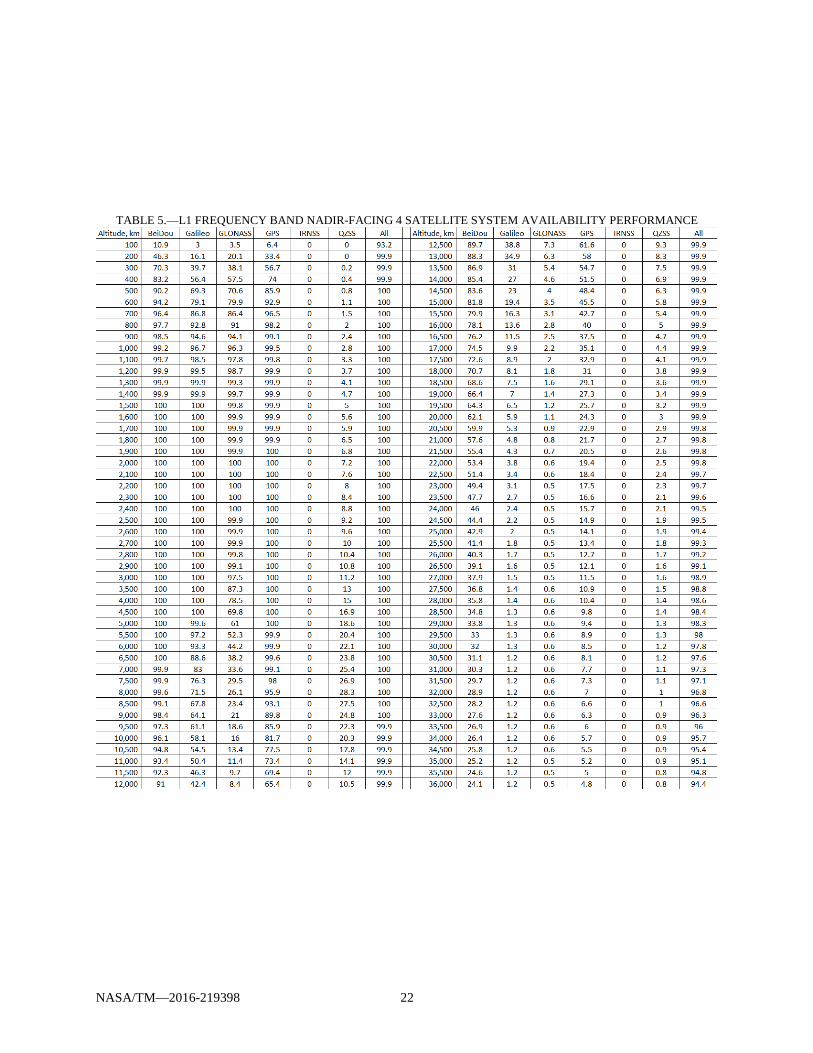
TABLE 5.—L1 FREQUENCY BAND NADIR-FACING 4 SATELLITE SYSTEM AVAILABILITY PERFORMANCE
NASA/TM—2016-219398 23
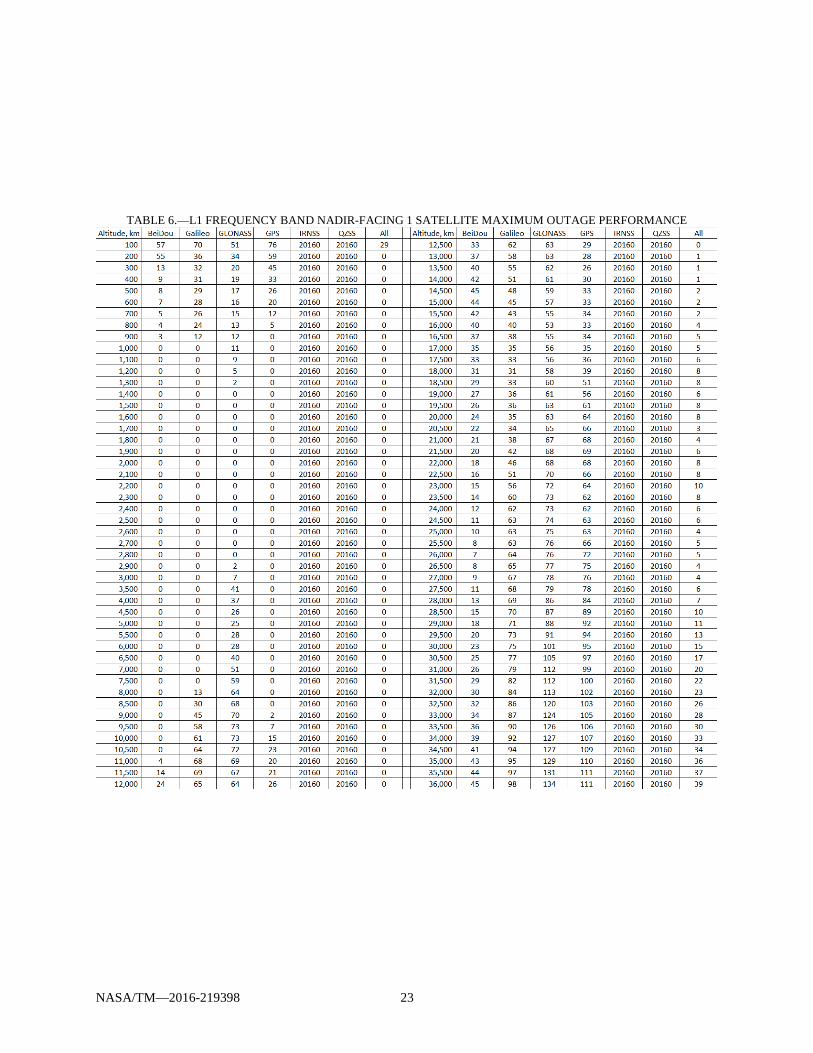
TABLE 6.—L1 FREQUENCY BAND NADIR-FACING 1 SATELLITE MAXIMUM OUTAGE PERFORMANCE
NASA/TM—2016-219398 24
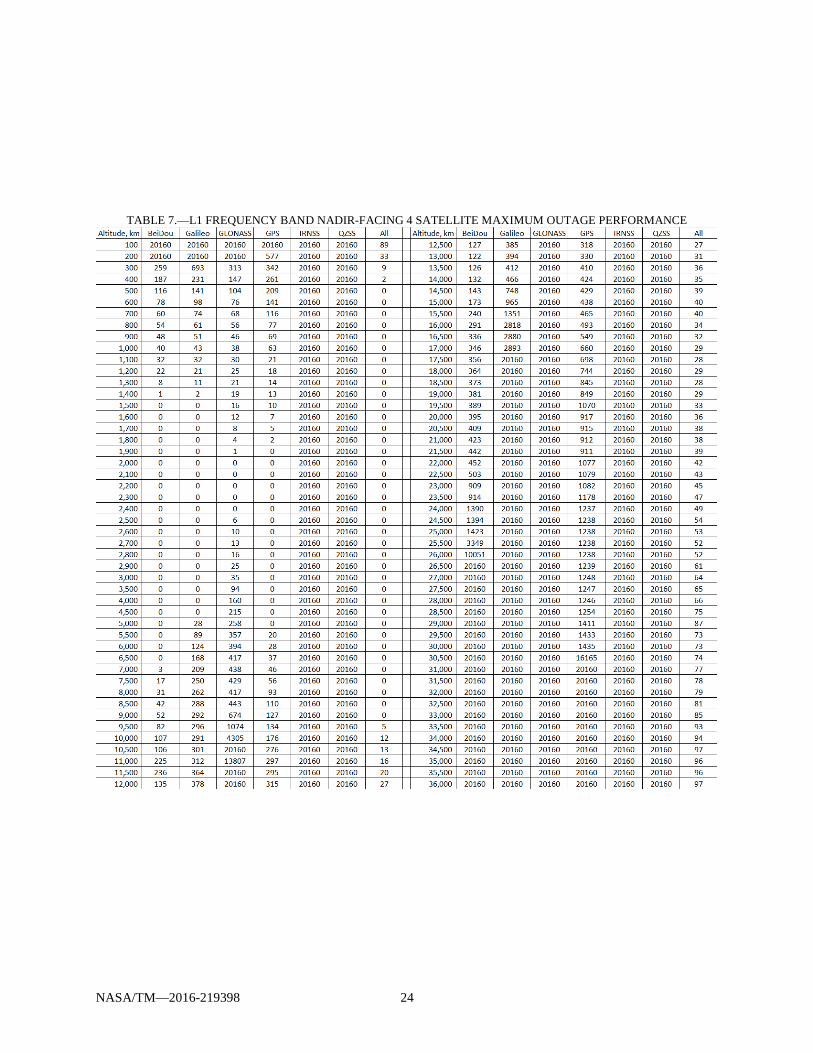
TABLE 7.—L1 FREQUENCY BAND NADIR-FACING 4 SATELLITE MAXIMUM OUTAGE PERFORMANCE

NASA/TM—2016-219398 25
B.2 L1 Zenith-Facing Antenna Performance
TABLE 8.—L1 FREQUENCY BAND ZENITH-FACING 1 SATELLITE SYSTEM AVAILABILITY PERFORMANCE
NASA/TM—2016-219398 26
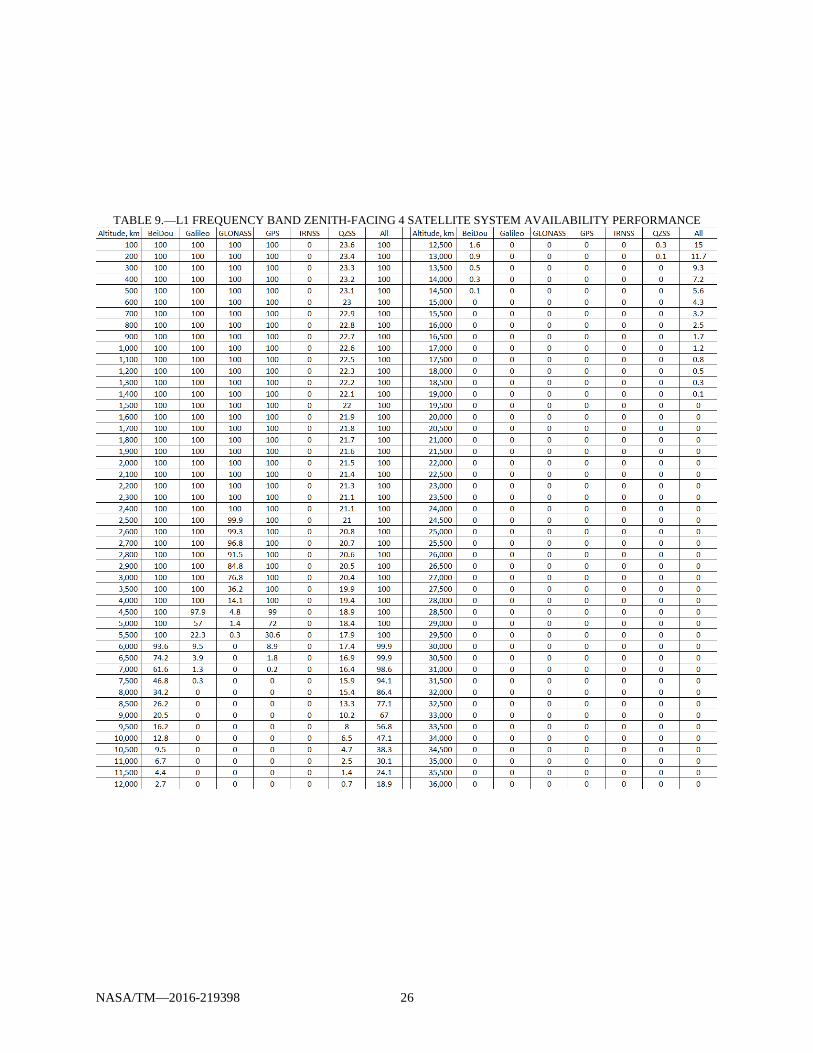
TABLE 9.—L1 FREQUENCY BAND ZENITH-FACING 4 SATELLITE SYSTEM AVAILABILITY PERFORMANCE

NASA/TM—2016-219398 27
TABLE 10.—L1 FREQUENCY BAND ZENITH-FACING 1 SATELLITE MAXIMUM OUTAGE PERFORMANCE

NASA/TM—2016-219398 28
TABLE 11.—L1 FREQUENCY BAND ZENITH-FACING 4 SATELLITE MAXIMUM OUTAGE PERFORMANCE

NASA/TM—2016-219398 29
B.3 L1 Omnidirectional Antenna Performance
TABLE 12.—L1 FREQUENCY BAND OMNIDIRECTIONAL 1 SATELLITE SYSTEM AVAILABILITY PERFORMANCE

NASA/TM—2016-219398 30
TABLE 13.—L1 FREQUENCY BAND OMNIDIRECTIONAL 4 SATELLITE SYSTEM AVAILABILITY PERFORMANCE

NASA/TM—2016-219398 31
TABLE 14.—L1 FREQUENCY BAND OMNIDIRECTIONAL 1 SATELLITE MAXIMUM OUTAGE PERFORMANCE

NASA/TM—2016-219398 32
TABLE 15.—L1 FREQUENCY BAND OMNIDIRECTIONAL 4 SATELLITE MAXIMUM OUTAGE PERFORMANCE

NASA/TM—2016-219398 33
B.4 L5 Nadir-Facing Antenna Performance
TABLE 16.—L5 FREQUENCY BAND NADIR-FACING 1 SATELLITE SYSTEM AVAILABILITY PERFORMANCE

NASA/TM—2016-219398 34
TABLE 17.—L5 FREQUENCY BAND NADIR-FACING 4 SATELLITE SYSTEM AVAILABILITY PERFORMANCE

NASA/TM—2016-219398 35
TABLE 18.—L5 FREQUENCY BAND NADIR-FACING 1 SATELLITE MAXIMUM OUTAGE PERFORMANCE

NASA/TM—2016-219398 36
TABLE 19.—L5 FREQUENCY BAND NADIR-FACING 4 SATELLITE MAXIMUM OUTAGE PERFORMANCE

NASA/TM—2016-219398 37
B.5 L5 Zenith-Facing Antenna Performance
TABLE 20.—L5 FREQUENCY BAND ZENITH-FACING 1 SATELLITE SYSTEM AVAILABILITY PERFORMANCE
NASA/TM—2016-219398 38
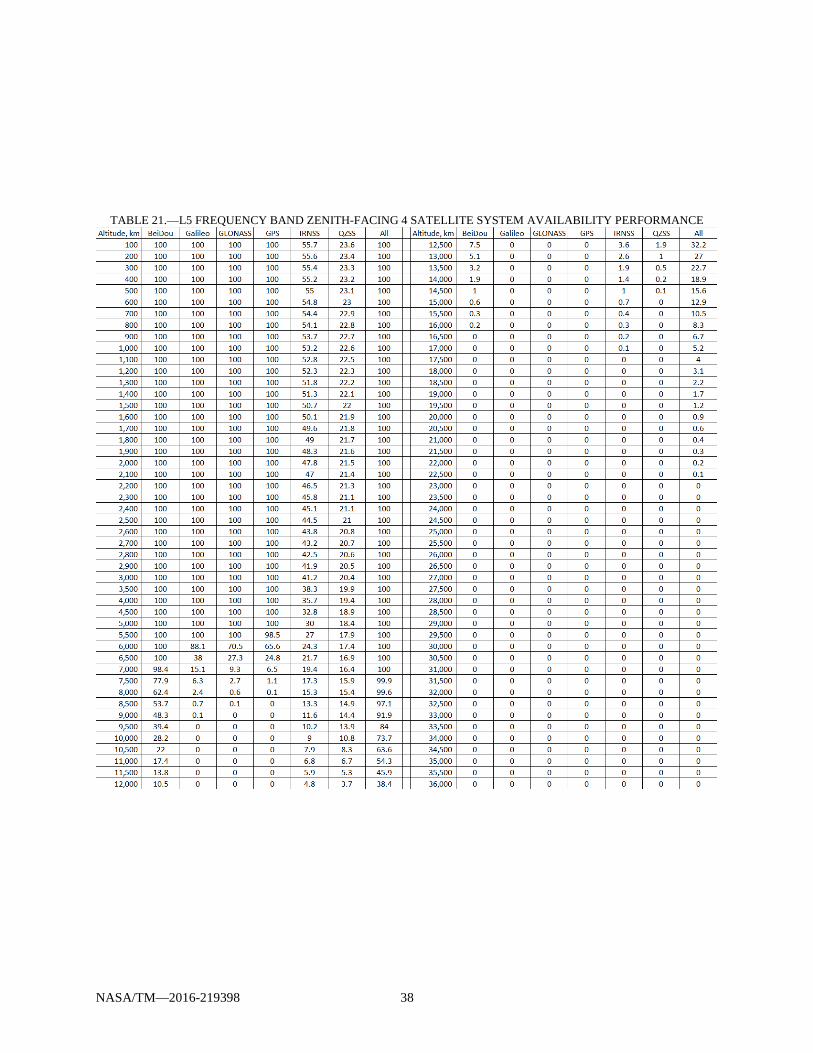
TABLE 21.—L5 FREQUENCY BAND ZENITH-FACING 4 SATELLITE SYSTEM AVAILABILITY PERFORMANCE

NASA/TM—2016-219398 39
TABLE 22.—L5 FREQUENCY BAND ZENITH-FACING 1 SATELLITE MAXIMUM OUTAGE PERFORMANCE

NASA/TM—2016-219398 40
TABLE 23.—L5 FREQUENCY BAND ZENITH-FACING 4 SATELLITE MAXIMUM OUTAGE PERFORMANCE

NASA/TM—2016-219398 41
B.6 L5 Omnidirectional Antenna Performance
TABLE 24.—L5 FREQUENCY BAND OMNIDIRECTIONAL 1 SATELLITE SYSTEM AVAILABILITY PERFORMANCE

NASA/TM—2016-219398 42
TABLE 25.—L5 FREQUENCY BAND OMNIDIRECTIONAL 4 SATELLITE SYSTEM AVAILABILITY PERFORMANCE

NASA/TM—2016-219398 43
TABLE 26.—L5 FREQUENCY BAND OMNIDIRECTIONAL 1 SATELLITE MAXIMUM OUTAGE PERFORMANCE
NASA/TM—2016-219398 44
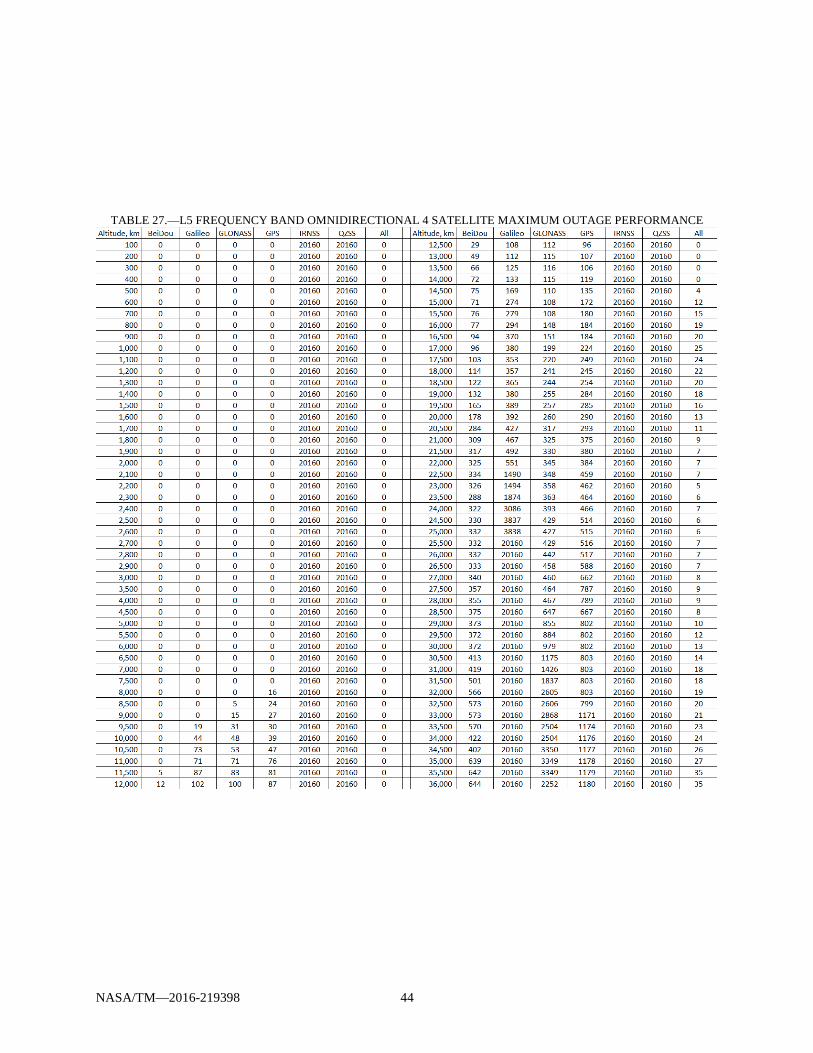
TABLE 27.—L5 FREQUENCY BAND OMNIDIRECTIONAL 4 SATELLITE MAXIMUM OUTAGE PERFORMANCE

NASA/TM—2016-219398 45
References International Committee on Global Navigation Satellite Systems (ICG). (2016, June 29). Retrieved from http://www.unoosa.org/oosa/en/ourwork/icg/icg.html
Bauer, F., Parker, J., Valdez, J., “GPS Space Service Volume: Ensuring Consistent Utility Across GPS Design Builds for Space Users,” 15th National Space-Based Positioning, Navigation, and Timing Advisory Board Meeting, Jun 11-12, 2015.
Welch, B., “Geometrical-Based Navigation System Performance Assessment in the Space Service Volume Using a Multiglobal Navigation Satellite System Methodology,” NASA/TM—2016-219143, September 2016.
“Interface Specification IS-GPS-200 Rev H,” September 24, 2013 “Interface Specification IS-GPS-705 Rev D,” September 24, 2013. “European GNSS (Galileo) Open Service Signal In Space Interface Control Document,” November 2015.
“GLONASS Signal In Space Interface Control Document,” Version 5.1, 2008. “BeiDou Navigation Satellite System Signal In Space Interface Control Document Open Service Signal (Version 2.0),” December 2013.
“IRNSS Signal-In-Space Interface Control Document (ICD) for Standard Positioning Service (SPS),” September 2014.
“Quasi-Zenith Satellite System Interface Specification Satellite Positioning, Navigation, and Timing Service (IS-QZSS-PNT-001),” Draft Version, March 2016.