VOLUMETRIC SURVEY OF LAKE CONROE - Home | Texas …LAKE CONROE HYDROGRAPHIC SURVEY REPORT...
33
VOLUMETRIC SURVEY OF LAKE CONROE Prepared for: SAN JACINTO RIVER AUTHORITY Prepared by: The Texas Water Development Board March 10, 2003 Texas Water Development Board
Transcript of VOLUMETRIC SURVEY OF LAKE CONROE - Home | Texas …LAKE CONROE HYDROGRAPHIC SURVEY REPORT...

VOLUMETRIC SURVEYOF
LAKE CONROE
Prepared for:
SAN JACINTO RIVER AUTHORITY
Prepared by:
The Texas Water Development Board
March 10, 2003
Texas Water Development Board

Craig D. Pedersen, Executive Administrator
Texas Water Development Board
William B. Madden, Chairman Noe Fernandez, Vice-ChairmanCharles W. Jenness Charles L. GerenLynwood Sanders Elaine M. Barrón, M.D.
Authorization for use or reproduction of any original material contained in this publication, i.e. notobtained from other sources, is freely granted. The Board would appreciate acknowledgement.
This report was prepared by the Hydrographic Survey group:
Scot Sullivan, P.E.Duane ThomasSteve SeguraSteve HuttonWayne Elliott
Marc RobichaudFor more information, please call (512) 936-0848
Published and Distributedby the
Texas Water Development BoardP.O. Box 13231
Austin, Texas 78711-3231
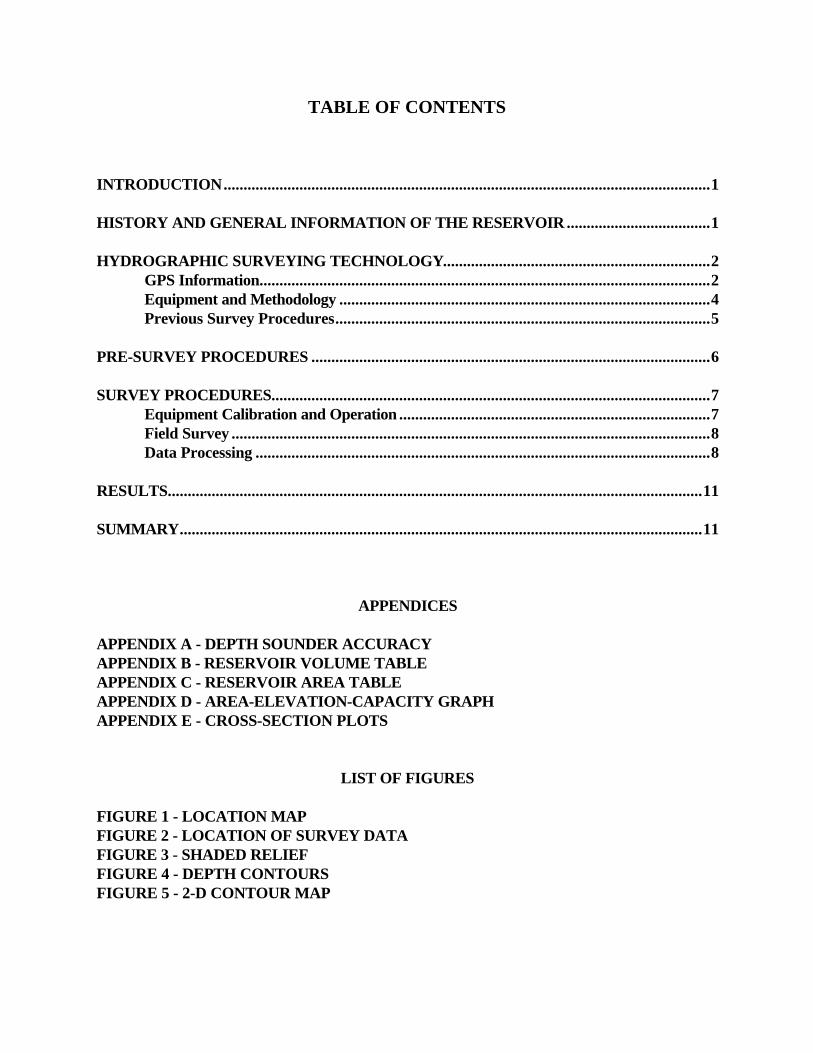
TABLE OF CONTENTS
INTRODUCTION..........................................................................................................................1
HISTORY AND GENERAL INFORMATION OF THE RESERVOIR ....................................1
HYDROGRAPHIC SURVEYING TECHNOLOGY...................................................................2GPS Information.................................................................................................................2Equipment and Methodology .............................................................................................4Previous Survey Procedures..............................................................................................5
PRE-SURVEY PROCEDURES ....................................................................................................6
SURVEY PROCEDURES..............................................................................................................7Equipment Calibration and Operation ..............................................................................7Field Survey ........................................................................................................................8Data Processing ..................................................................................................................8
RESULTS......................................................................................................................................11
SUMMARY...................................................................................................................................11
APPENDICES
APPENDIX A - DEPTH SOUNDER ACCURACYAPPENDIX B - RESERVOIR VOLUME TABLEAPPENDIX C - RESERVOIR AREA TABLEAPPENDIX D - AREA-ELEVATION-CAPACITY GRAPHAPPENDIX E - CROSS-SECTION PLOTS
LIST OF FIGURES
FIGURE 1 - LOCATION MAPFIGURE 2 - LOCATION OF SURVEY DATAFIGURE 3 - SHADED RELIEFFIGURE 4 - DEPTH CONTOURSFIGURE 5 - 2-D CONTOUR MAP

1
LAKE CONROEHYDROGRAPHIC SURVEY REPORT
INTRODUCTION
Staff of the Hydrographic Survey Unit of the Texas Water Development Board (TWDB)
conducted a hydrographic survey on Lake Conroe during the period of March 4 through April
3, 1996. The purpose of the survey was to determine the capacity of the lake at the
conservation pool elevation and to establish baseline information for future surveys. From this
information, future surveys will be able to determine sediment deposition locations and rates
over time. Survey results are presented in the following pages in both graphical and tabular
form. All elevations presented in this report will be reported in feet above mean sea level based
on the National Geodetic Vertical Datum of 1929 (NGVD '29) unless noted otherwise.
According to previous records, the initial surface area of Lake Conroe at the conservation pool
elevation of 201.0 feet was 20,985 acres with a corresponding initial capacity of 430,260 acre-
feet.
HISTORY AND GENERAL INFORMATION OF THE RESERVOIR
Lake Conroe is located on the West Fork of the San Jacinto River in Walker and
Montgomery Counties, approximately seven miles northwest of Conroe, Tx. The water rights
to Lake Conroe are owned by the San Jacinto River Authority and the City of Houston. The
lake and dam facility are maintained by the San Jacinto River Authority. Inflows to the lake
originate over a 445 square mile drainage area. At the conservation capacity pool elevation, the
lake is approximately 19 miles long and five miles wide at its widest point and has approximately
150 miles of shoreline.
Construction of Lake Conroe began in February, 1970 and was completed in January,

2
1973. Freese, Nichols and Endress Engineering Inc. designed the project and H. B. Zachery
Company was the general contractor. The project cost an estimated $30,000,000. Conroe Dam
is an earthfill embankment, 11,300 feet in length including the levees. The crest elevation of the
dam is 212.0 feet and has a height of 82 feet above the old riverbed. A controlled spillway is
located near the center of the embankment. The spillway is a concrete ogee crest, 200 feet in
length with a crest elevation of 173.0 feet. Control for the spillway consists of five tainter gates,
40 feet by 30 feet with the top elevation of 202.5 feet. Low flow releases are made through a
separate multi-gated inlet tower. Two of the gates are four feet by six feet, the third gate is five
feet by five feet. The invert for the lowest outlet in the control tower is 144.5. Discharges are
through a 10 foot diameter concrete conduit through the dam.
Permit Number 1962 was issued June 9, 1960 to the San Jacinto River Authority
authorizing the impoundment of 380,400 acre-feet of water. The annual allotted diversions were
66,000 acre-feet for municipal use, 28,500 for industrial use and 5,500 acre-feet for mining use.
On August 31, 1965 the permit was amended to allow the relocation of the dam and to increase
the impoundment capacity to 430,260 acre-feet. Certificate of Adjudication Number 10-4963
was issued by the Texas Water Commission on February 25, 1987. The Certificate gave the San
Jacinto River Authority and the City of Houston diversion rights and uses as stated in the
amended permit including the right to use the impounded waters of Lake Conroe for non-
consumptive recreational purposes.
HYDROGRAPHIC SURVEYING TECHNOLOGY
The following sections will describe the equipment and methodology used to conduct this
hydrographic survey. Some of the theory behind Global Positioning System (GPS) technology
and its accuracy are also addressed.
GPS Information

3
The following is a brief and simple description of Global Positioning System (GPS)
technology. GPS is a new technology that uses a network of satellites, maintained in precise
orbits around the earth, to determine locations on the surface of the earth. GPS receivers
continuously monitor the broadcasts from the satellites to determine the position of the receiver.
With only one satellite being monitored, the point in question could be located anywhere on a
sphere surrounding the satellite with a radius of the distance measured. The observation of two
satellites decreases the possible location to a finite number of points on a circle where the two
spheres intersect. With a third satellite observation, the unknown location is reduced to two
points where all three spheres intersect. One of these points is obviously in error because its
location is in space, and it is ignored. Although three satellite measurements can fairly
accurately locate a point on the earth, the minimum number of satellites required to determine
a three dimensional position within the required accuracy is four. The fourth measurement
compensates for any time discrepancies between the clock on board the satellites and the clock
within the GPS receiver.
GPS technology was developed in the 1960s by the United States Air Force and the
defense establishment. After program funding in the early 1970s, the initial satellite was
launched on February 22, 1978. A four year delay in the launching program occurred after the
Challenger space shuttle disaster. In 1989, the launch schedule was resumed. Full operational
capability will be reached when the NAVSTAR (NAVigation System with Time And Ranging)
satellite constellation is composed of 24 Block II satellites. At the time of the survey, the system
had achieved initial operational capability. A full constellation of 24 satellites, in a combination
of Block I (prototype) and Block II satellites, was fully functional. The NAVSTAR satellites
provide data based on the World Geodetic System (WGS '84) spherical datum. WGS '84 is
essentially identical to NAD '83.
The United States Department of Defense (DOD) is currently responsible for
implementing and maintaining the satellite constellation. In an attempt to discourage the use of
these survey units as a guidance tool by hostile forces, the DOD has implemented means of false
signal projection called Selective Availability (S/A). Positions determined by a single receiver
4
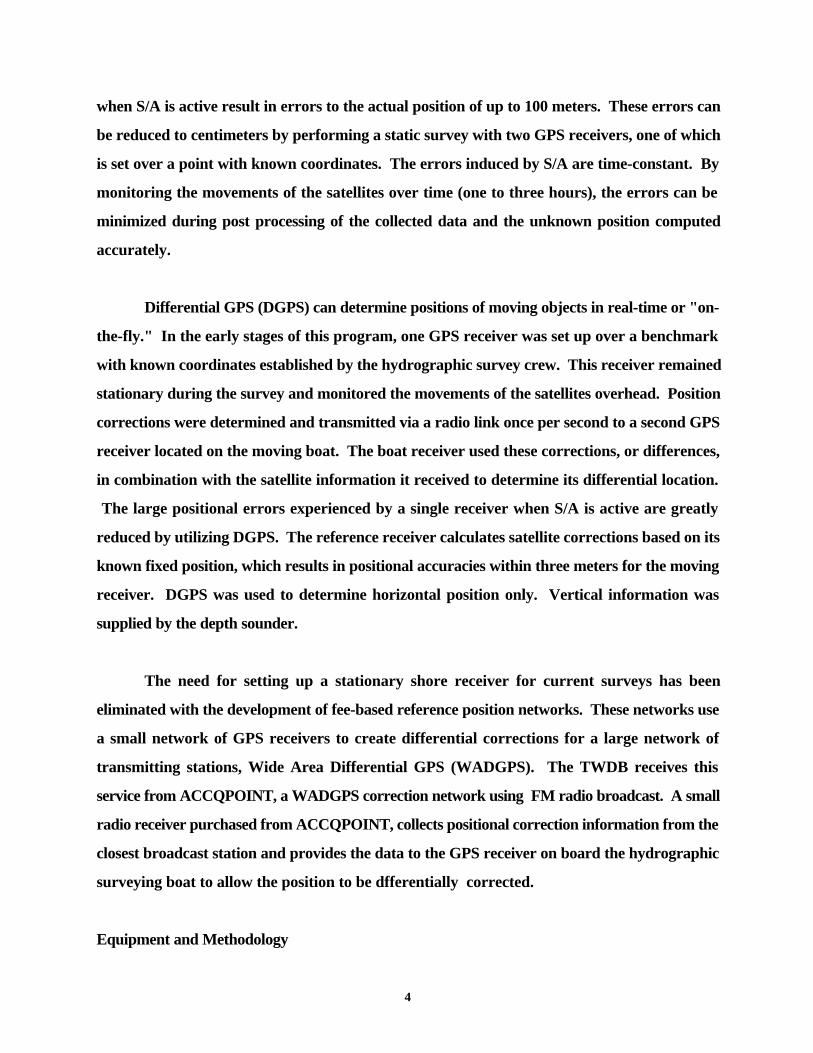
when S/A is active result in errors to the actual position of up to 100 meters. These errors can
be reduced to centimeters by performing a static survey with two GPS receivers, one of which
is set over a point with known coordinates. The errors induced by S/A are time-constant. By
monitoring the movements of the satellites over time (one to three hours), the errors can be
minimized during post processing of the collected data and the unknown position computed
accurately.
Differential GPS (DGPS) can determine positions of moving objects in real-time or "on-
the-fly." In the early stages of this program, one GPS receiver was set up over a benchmark
with known coordinates established by the hydrographic survey crew. This receiver remained
stationary during the survey and monitored the movements of the satellites overhead. Position
corrections were determined and transmitted via a radio link once per second to a second GPS
receiver located on the moving boat. The boat receiver used these corrections, or differences,
in combination with the satellite information it received to determine its differential location.
The large positional errors experienced by a single receiver when S/A is active are greatly
reduced by utilizing DGPS. The reference receiver calculates satellite corrections based on its
known fixed position, which results in positional accuracies within three meters for the moving
receiver. DGPS was used to determine horizontal position only. Vertical information was
supplied by the depth sounder.
The need for setting up a stationary shore receiver for current surveys has been
eliminated with the development of fee-based reference position networks. These networks use
a small network of GPS receivers to create differential corrections for a large network of
transmitting stations, Wide Area Differential GPS (WADGPS). The TWDB receives this
service from ACCQPOINT, a WADGPS correction network using FM radio broadcast. A small
radio receiver purchased from ACCQPOINT, collects positional correction information from the
closest broadcast station and provides the data to the GPS receiver on board the hydrographic
surveying boat to allow the position to be dfferentially corrected.
Equipment and Methodology

5
The equipment used in the performance of the hydrographic survey consisted of a 23-foot
aluminum tri-hull SeaArk craft with cabin, equipped with twin 90-Horsepower Johnson outboard
motors. Installed within the enclosed cabin are an Innerspace Helmsman Display (for
navigation), an Innerspace Technology Model 449 Depth Sounder and Model 443 Velocity
Profiler, a Trimble Navigation, Inc. 4000SE GPS receiver, an ACCQPOINT FM receiver, and
an on-board computer. Power was provided by a water-cooled generator through an in-line
uninterruptible power supply. Reference to brand names does not imply endorsement by the
TWDB.
The GPS equipment, survey vessel, and depthsounder combine together to provide an
efficient hydrographic survey system. As the boat travels across the lake surface, the depth
sounder gathers approximately ten readings of the lake bottom each second. The depth readings
are stored on the survey vessel's on-board computer along with the corrected positional data
generated by the boat's GPS receiver. The daily data files collected are downloaded from the
computer and brought to the office for editing after the survey is completed. During editing, bad
data is removed or corrected, multiple data points are averaged to get one data point per second,
and average depths are converted to elevation readings based on the daily recorded lake
elevation on the day the survey was performed. Accurate estimates of the lake volume can be
quickly determined by building a 3-D model of the reservoir from the collected data. The level
of accuracy is equivalent to or better than previous methods used to determine lake volumes,
some of which are discussed below.
Previous Survey Procedures
Originally, reservoir surveys were conducted with a rope stretched across the reservoir
along pre-determined range lines. A small boat would manually pole the depth at selected
intervals along the rope. Over time, aircraft cable replaced the rope and electronic depth
sounders replaced the pole. The boat was hooked to the cable, and depths were again recorded
at selected intervals. This method, used mainly by the Soil Conservation Service, worked well

6
for small reservoirs.
Larger bodies of water required more involved means to accomplish the survey, mainly
due to increased size. Cables could not be stretched across the body of water, so surveying
instruments were utilized to determine the path of the boat. Monumentation was set for the end
points of each line so the same lines could be used on subsequent surveys. Prior to a survey,
each end point had to be located (and sometimes reestablished) in the field and vegetation
cleared so that line of sight could be maintained. One surveyor monitored the path of the boat
and issued commands via radio to insure that it remained on line while a second surveyor
determined depth measurement locations by turning angles. Since it took a major effort to
determine each of the points along the line, the depth readings were spaced quite a distance
apart. Another major cost was the land surveying required prior to the reservoir survey to
locate the range line monuments and clear vegetation.
Electronic positioning systems were the next improvement. If triangulation could
determine the boat location by electronic means, then the boat could take continuous depth
soundings. A set of microwave transmitters positioned around the lake at known coordinates
would allow the boat to receive data and calculate its position. Line of site was required, and
the configuration of the transmitters had to be such that the boat remained within the angles of
30 and 150 degrees in respect to the shore stations. The maximum range of most of these
systems was about 20 miles. Each shore station had to be accurately located by survey, and the
location monumented for future use. Any errors in the land surveying resulted in significant
errors that were difficult to detect. Large reservoirs required multiple shore stations and a crew
to move the shore stations to the next location as the survey progressed. Land surveying was
still a major cost.
Another method used mainly prior to construction utilized aerial photography to generate
elevation contours which could then be used to calculate the volume of the reservoir. Fairly
accurate results could be obtained, although the vertical accuracy of the aerial topography was
generally one-half of the contour interval or + five feet for a ten-foot contour interval. This

7
method could be quite costly and was only applicable in areas that were not inundated.
PRE-SURVEY PROCEDURES
The reservoir's surface area was determined prior to the survey by digitizing with AutoCad
software the lake's conservation pool boundary from USGS quad sheets. The name of the quad
sheets are as follows: COWL SPUR, TX. 1958 (Photorevised 1976), SHEPARD HILL, TX. 1958
(Photorevised 1976), KEENAN, TX. 1962 (Photorevised 1976), SAN JACINTO, TX. 1959
(Photorevised 1976), MONTGOMERY, TX. 1959 (Photorevised 1976) and MOORE GROVE,
TX. 1959 (Photorevised 1976). The graphic boundary file created was then transformed into
the proper datum, from NAD '27 datum to NAD '83, using Environmental Systems Research
Institutes's (ESRI) Arc/Info project command with the NADCOM parameters. The area of the
lake boundary was checked to verify that the area was the same in both datums.
The survey layout was designed by placing survey track lines at 500 foot intervals across
the lake. The survey design for this lake required approximately 455 survey lines to be placed
along the length of the lake. Survey setup files were created using Coastal Oceangraphics, Inc.
“Hypack” software for each group of track lines that represent a specific section of the lake.
The setup files were copied onto diskettes for use during the field survey.
SURVEY PROCEDURES
The following procedures were followed during the hydrographic survey of Lake Conroe
performed by the TWDB. Information regarding equipment calibration and operation, the field
survey, and data processing is presented.
Equipment Calibration and Operation

8
During the survey, the onboard GPS receiver was set to a horizontal mask of 10° and a
PDOP (Position Dilution of Precision) limit of 7 to maximize the accuracy of horizontal positions.
An internal alarm sounds if the PDOP rises above seven to advise the field crew that the
horizontal position has degraded to an unacceptable level.
At the beginning of each surveying day, the depth sounder was calibrated with the
Innerspace Velocity Profiler. The Velocity Profiler calculates an average speed of sound
through the water column of interest for a designated draft value of the boat (draft is the
vertical distance that the boat penetrates the water surface). The draft of the boat was
previously determined to average 1.2 ft. The velocity profiler probe is placed in the water to
moisten and acclimate the probe. The probe is then raised to the water surface where the depth
is zeroed. The probe is lowered on a cable to just below the maximum depth set for the water
column, and then raised to the surface. The unit displays an average speed of sound for a given
water depth and draft, which is entered into the depth sounder. The depth value on the depth
sounder was then checked manually with a measuring tape to ensure that the depth sounder was
properly calibrated and operating correctly. During the survey of Lake Conroe, the speed of
sound in the water column varied daily between 4780 and 4889 feet per second. Based on the
measured speed of sound for various depths, and the average speed of sound calculated for the
entire water column, the depth sounder is accurate to within +0.2 feet, plus an estimated error
of +0.3 feet due to the plane of the boat for a total accuracy of +0.5 feet for any instantaneous
reading. These errors tend to be minimized over the entire survey, since some are plus readings
and some are minus readings. Further information on these calculations is presented in Appendix
A.
Field Survey
Data was collected on Lake Conroe during the period of March 4 through April 3, 1996.
Approximately 233,751 data points were collected over the 348 miles traveled along the pre-
planned survey lines and the random data-collection lines. These points were stored digitally on
the boat's computer in 495 data files. Data were not collected in areas of shallow water (depths

9
less than 3.0 ft.) or with significant obstructions unless these areas represented a large amount
of water. Random data points were collected, when determined necessary by the field crew.
Figure 2 shows the actual location of the data collection points.
While collecting data, TWDB staff observed the lake bottom to be fairly uniform
upstream of the dam in the main reservoir area yet the old creek and river channels could still
be distingushed on the analog charts. Lake Conroe was fairly clear of navigational hazards such
as stumps in the main body of the lake. The crew did encounter large areas of stumps and
shallows in the upper reaches of Caney Creek and certain areas upstream of the bridges of
County Roads 1097 and 1375. A large part of the down time during the data collection was due
to the inclimate weather, especially high winds.
The collected data were stored in individual data files for each pre-plotted range line or
random data collection event. These files were downloaded to diskettes at the end of each day
for future processing.
Data Processing
The collected data were down-loaded from diskettes onto the TWDB's computer
network. Tape backups were made for future reference as needed. To process the data, the
EDIT routine in the Hypack Program was run on each raw data file. Data points such as depth
spikes or data with missing depth or positional information were deleted from the file. The depth
information collected every 0.1 seconds was averaged to get one reading for each second of data
collection. A correction for the lake elevation at the time of data collection was also applied to
each file during the EDIT routine. During the survey, the water surface ranged daily from
200.70 to 200.93 feet. After all changes had been made to the raw data file, the edited file was
saved with a different extension. After all the files were edited, the edited files were combined
into a single data file, representative of the lake, to be used with the GIS software to develop
a model of the lake's bottom surface.

10
The resulting DOS data file was imported into the UNIX operating system used to run
Environmental System Research Institutes's (ESRI) Arc/Info GIS software. The latitude and
longitude coordinates of each point were then converted to decimal degrees by a UNIX awk
command. The awk command manipulates the data file format into a MASS points format for
use by the GIS software. The graphic boundary file previously digitized was also imported.
The boundary and MASS points files were graphically edited using the Arc/Edit module.
The MASS points file was converted into a point coverage and plotted along with the boundary
file. If data points were collected outside the boundary file, the boundary was modified to
include the data points. Also, the boundary near the edges of the lake in areas of significant
sedimentation was down-sized to reflect the observations of the field crew. The resulting
boundary shape was considered to be the acreage at the conservation pool elevation of the lake.
This was calculated as 20,118 acres for Lake Conroe. The Board does not represent the
boundary, as depicted in this report, to be a detailed actual boundary. Instead, it is a graphical
approximation of the actual boundary used solely to compute the volume and area of the lake.
The boundary does not represent the true land versus water boundary of the lake. An aerial
topographic map of the upper four feet of the lake or an aerial photo taken when the lake is at
the conservation pool elevation would more closely define the present boundary. However, the
minimal increase in accuracy does not appear to offset the cost of those services at this time.
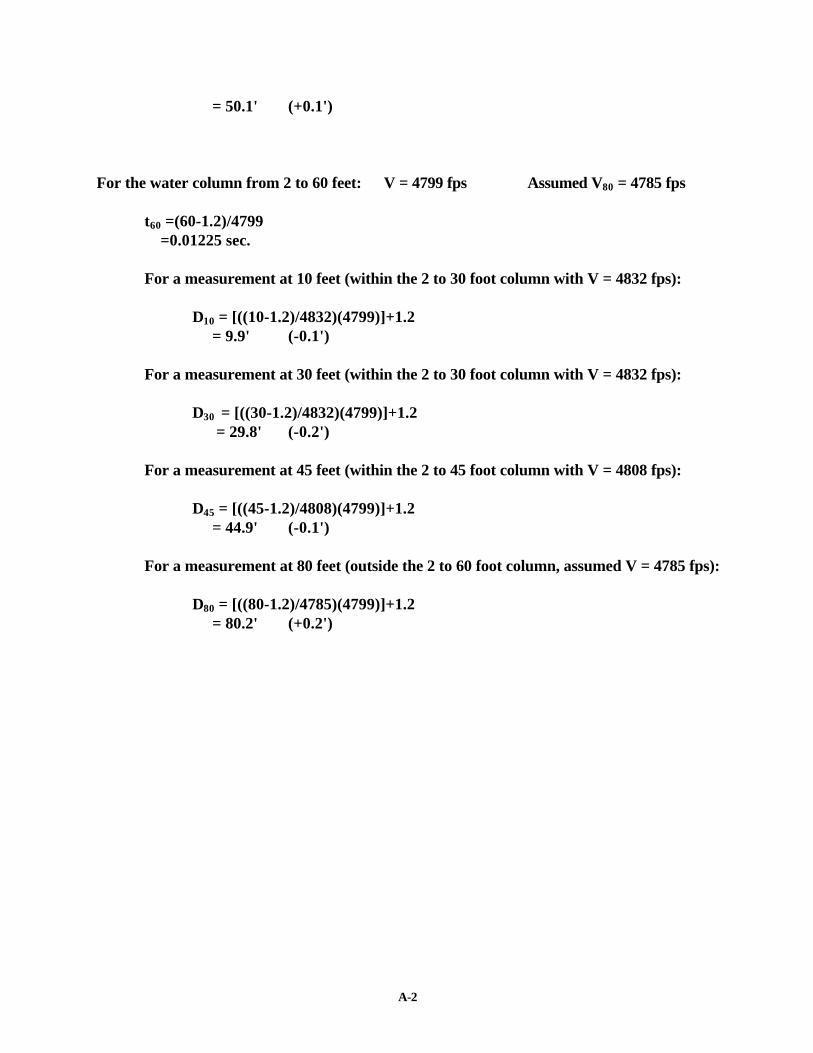
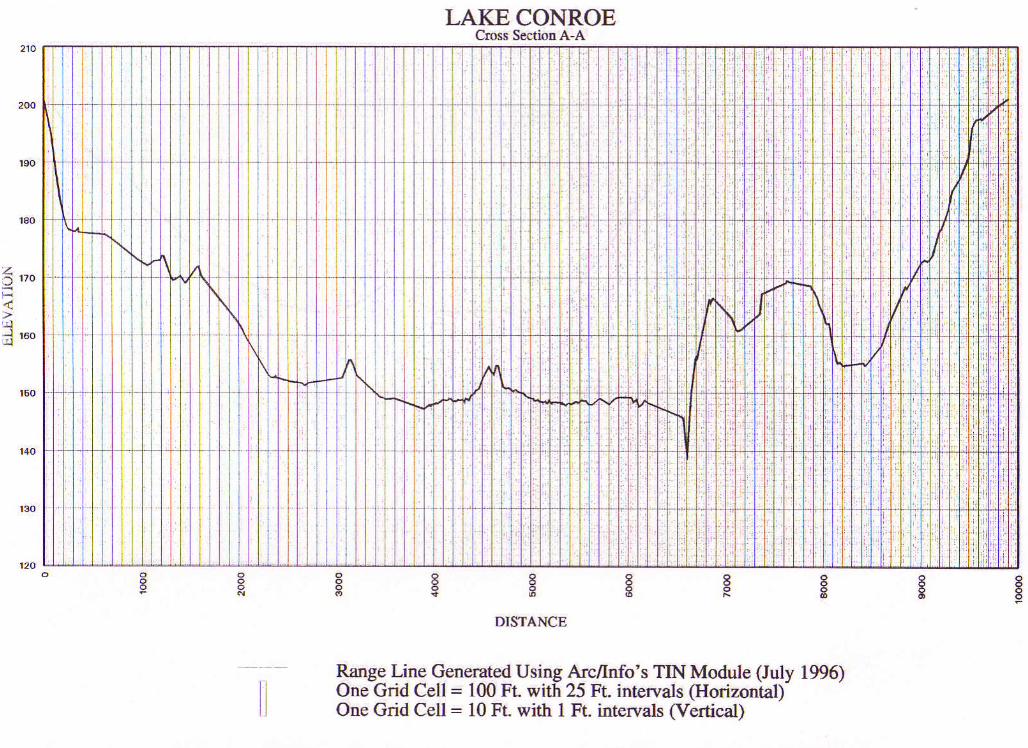
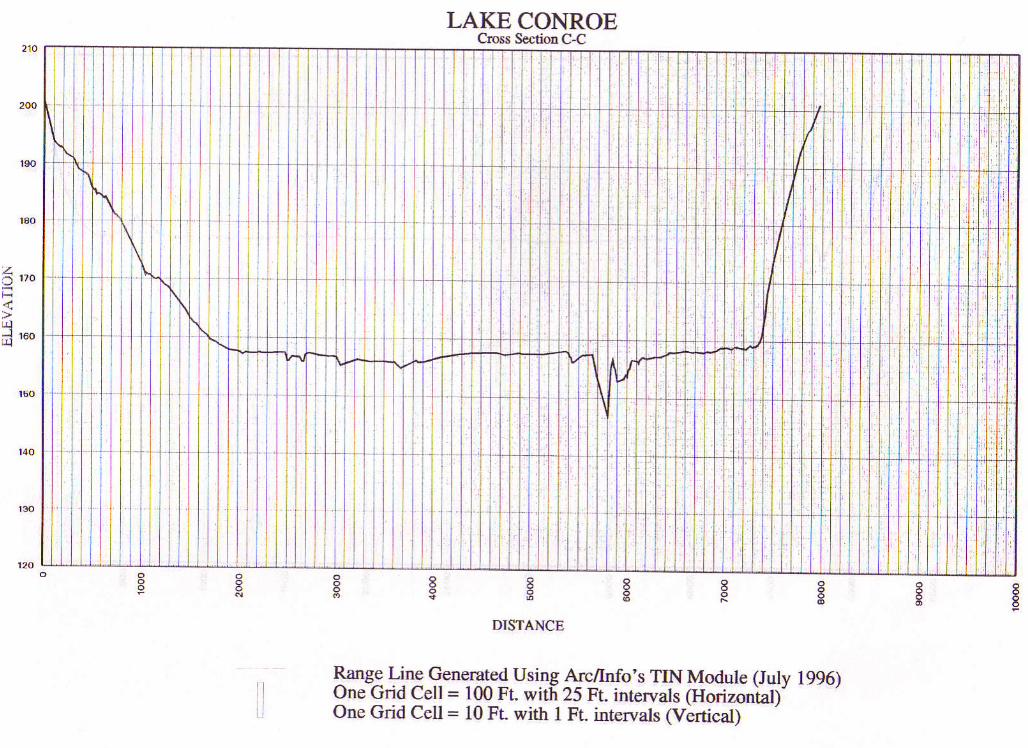
The edited MASS points and modified boundary file were used to create a Digital Terrain
Model (DTM) of the reservoir's bottom surface using Arc/Info's TIN module. The module builds
an irregular triangulated network from the data points and the boundary file. This software uses
a method known as Delauney's criteria for triangulation. A triangle is formed between three
non-uniformly spaced points, including all points along the boundary. If there is another point
within the triangle, additional triangles are created until all points lie on the vertex of a triangle.
All of the data points are preserved for use in determining the solution of the model by using this
method. The generated network of three-dimensional triangular planes represents the actual
bottom surface. Once the triangulated irregular network (TIN) is formed, the software then
calculates elevations along the triangle surface plane by solving the equations for elevation along

11
each leg of the triangle. Information for the entire reservoir area can be determined from the
triangulated irregular network created using this method of interpolation.
There were some areas where values could not be calculated by interpolation because
of a lack of information along the boundary of the reservoir. "Flat triangles" were drawn at
these locations. Arc/Info does not use flat triangle areas in the volume or contouring features
of the model. Approximately 3,936 additional points were required for interpolation and
contouring of the entire lake surface. The TIN product calculated the surface area and volume
of the entire reservoir at one-tenth of a foot intervals from the three-dimensional triangular
plane surface representation. The computed reservoir volume table is presented in Appendix
B and the area table in Appendix C. An elevation-area-volume graph is presented in Appendix
D.
Other presentations developed from the model include a shaded relief map and a shaded
depth range map. To develop the shaded relief map, the three-dimensional triangular surface
was modified by a GRIDSHADE command. Colors were assigned to different elevation values
of the grid. Using the command COLORRAMP, a set of colors that varied from navy to yellow
was created. The lower elevation was assigned the color of navy, and the lake conservation pool
elevation was assigned the color of yellow. Different color shades were assigned to the different
depths in between. Figure 4 presents the resulting depth shaded representation of the lake.
Figure 5 presents a similar version of the same map, using bands of color for selected depth
intervals. The color increases in intensity from the shallow contour bands to the deep water
bands.
The DTM was then smoothed and linear smoothing algorithms were applied to the
smoothed model to produce smoother contours. The resulting contour map of the bottom surface
at ten-foot intervals is presented in Figure 6.
RESULTS
12
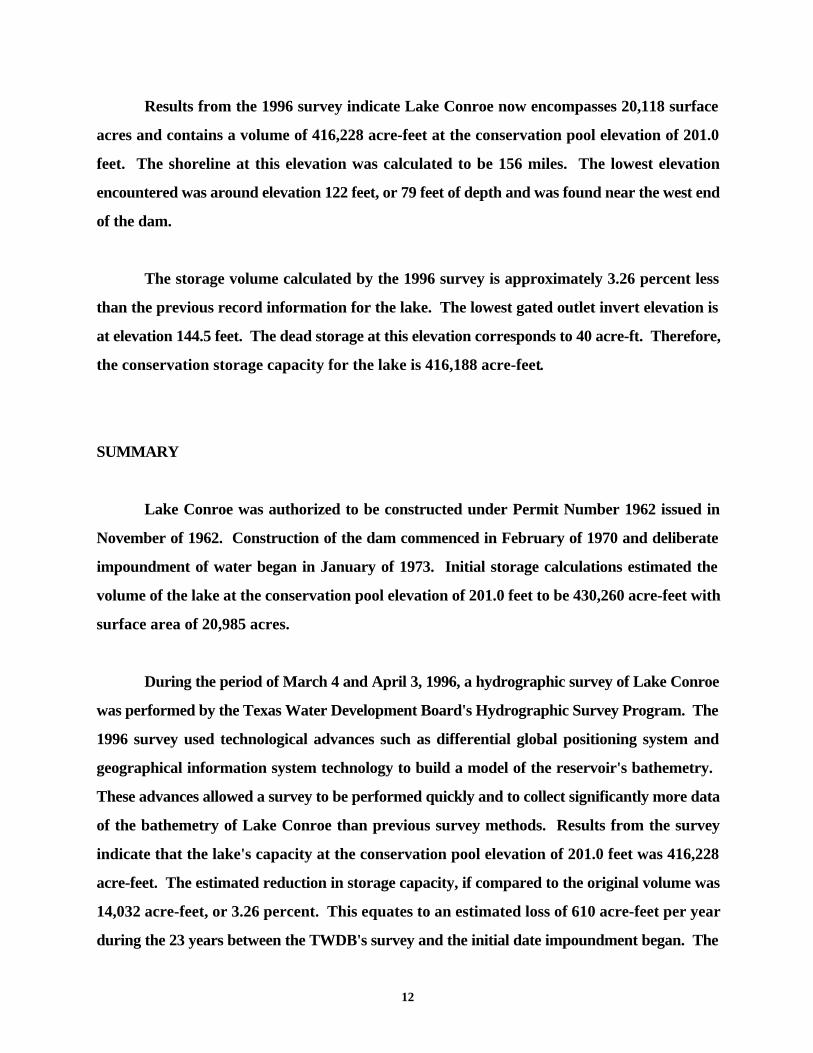
Results from the 1996 survey indicate Lake Conroe now encompasses 20,118 surface
acres and contains a volume of 416,228 acre-feet at the conservation pool elevation of 201.0
feet. The shoreline at this elevation was calculated to be 156 miles. The lowest elevation
encountered was around elevation 122 feet, or 79 feet of depth and was found near the west end
of the dam.
The storage volume calculated by the 1996 survey is approximately 3.26 percent less
than the previous record information for the lake. The lowest gated outlet invert elevation is
at elevation 144.5 feet. The dead storage at this elevation corresponds to 40 acre-ft. Therefore,
the conservation storage capacity for the lake is 416,188 acre-feet.
SUMMARY
Lake Conroe was authorized to be constructed under Permit Number 1962 issued in
November of 1962. Construction of the dam commenced in February of 1970 and deliberate
impoundment of water began in January of 1973. Initial storage calculations estimated the
volume of the lake at the conservation pool elevation of 201.0 feet to be 430,260 acre-feet with
surface area of 20,985 acres.
During the period of March 4 and April 3, 1996, a hydrographic survey of Lake Conroe
was performed by the Texas Water Development Board's Hydrographic Survey Program. The
1996 survey used technological advances such as differential global positioning system and
geographical information system technology to build a model of the reservoir's bathemetry.
These advances allowed a survey to be performed quickly and to collect significantly more data
of the bathemetry of Lake Conroe than previous survey methods. Results from the survey
indicate that the lake's capacity at the conservation pool elevation of 201.0 feet was 416,228
acre-feet. The estimated reduction in storage capacity, if compared to the original volume was
14,032 acre-feet, or 3.26 percent. This equates to an estimated loss of 610 acre-feet per year
during the 23 years between the TWDB's survey and the initial date impoundment began. The

13
annual deposition rate of sediment in the conservation pool can be estimated at 1.37 acre-ft per
square mile of drainage area.
It is difficult to compare the original design information and the survey performed by the
TWDB because little is know about the procedures and data used in calculating the original
storage information. However, the TWDB considers the 1996 survey to be a significant
improvement over previous survey procedures and recommends that the same methodology be
used in five to ten years or after major flood events to monitor changes to the lake's storage
capacity. The second survey will remove any noticeable errors between the original design data
and the 1996 survey and will facilitate accurate calculations of sedimentation rates and storage
losses presently occurring in Lake Conroe.

A-1
CALCULATION OF DEPTH SOUNDER ACCURACY
This methodology was extracted from the Innerspace Technology, Inc. Operation Manual for
the Model 443 Velocity Profiler.
For the following examples, t = (D - d)/V
where: tD = travel time of the sound pulse, in seconds (at depth = D)D = depth, in feetd = draft = 1.2 feetV = speed of sound, in feet per second
To calculate the error of a measurement based on differences in the actual versusaverage speed of sound, the same equation is used, in this format:
D = [t(V)]+d
For the water column from 2 to 30 feet: V = 4832 fps
t30 = (30-1.2)/4832 = 0.00596 sec.
For the water column from 2 to 45 feet: V = 4808 fps
t45 =(45-1.2)/4808 =0.00911 sec.
For a measurement at 20 feet (within the 2 to 30 foot column with V = 4832 fps):
D20 = [((20-1.2)/4832)(4808)]+1.2 = 19.9' (-0.1')
For a measurement at 30 feet (within the 2 to 30 foot column with V = 4832 fps):
D30 = [((30-1.2)/4832)(4808)]+1.2 = 29.9' (-0.1')
For a measurement at 50 feet (within the 2 to 60 foot column with V = 4799 fps):
D50 = [((50-1.2)/4799)(4808)]+1.2
A-2
= 50.1' (+0.1')
For the water column from 2 to 60 feet: V = 4799 fps Assumed V80 = 4785 fps
t60 =(60-1.2)/4799 =0.01225 sec.
For a measurement at 10 feet (within the 2 to 30 foot column with V = 4832 fps):
D10 = [((10-1.2)/4832)(4799)]+1.2 = 9.9' (-0.1')
For a measurement at 30 feet (within the 2 to 30 foot column with V = 4832 fps):
D30 = [((30-1.2)/4832)(4799)]+1.2 = 29.8' (-0.2')
For a measurement at 45 feet (within the 2 to 45 foot column with V = 4808 fps):
D45 = [((45-1.2)/4808)(4799)]+1.2 = 44.9' (-0.1')
For a measurement at 80 feet (outside the 2 to 60 foot column, assumed V = 4785 fps):
D80 = [((80-1.2)/4785)(4799)]+1.2 = 80.2' (+0.2')

,IEXAS IITER DEVELOPHEN'I BOARO
RESETYOIT VOLUIiE TASLE
J! t 12
ELEVATION INCRETIENT IS OXE TEIiIN F&T
. 5 . 6 . 7 , a
1996
LA(E COIIROE APTIL 1996 SURVEY
voLUt'tE ll actE-tEEl. 9EIEV, IEET
'l15
1361371t81t9110141112143
145
1401191501 5 115?15315/.155156157158159160161162163
1651 6167168169170171172173
1 n1761f717817916!181182183
. 0
112357
1 9
5 166
217
697109216232315!17741655t62
8410102731240411nO1735720214?33U268513063314750391604586t469t954580601616627272715795118688t
103127'| 19361?11421508291409021513t0
1l
235a
2A3l
911 5 5260442n 1
1 1 1 9164523914271129151926910858t
126311501817629?051623718272163103015178396164435449464,1913607606690073580802494765395599
1039861128/,3122128131818141951152111
112l5E
1 l
,796
1632741&766
1147174421743367(105
562170864762
1067912860r5266179052082224055275A21141015510
5000055510613606E3Z710188096?8412696118
10485011t755121078112E1111296315t481
. l
112359
z?3660
l0r1n289
80112!61811
346545lE575t
891110846130911t5211818321110?139127952118543601!4053945344505365608{l6196?6816771nA816808920597241
105719114668124032133808143999111552
1.I
236
2tl863
1071 8 1305517040
12871880?640l56l46325497
91211109t13325157761846521443217372A!253?2403648141004456455107556653625646880675396424048998898069
1065921155471249901518091450391556?6
l
I
2
1 525
1 1 1190t?1544af9
1339194927263644
603775679307
1 1 1 0 71156016033147492175825042247013265036920111?346t5151617572306117f
760768115590n698901
107171I 1 6 5 1 0'125953
1358151$042156704
112
1 01 6
427A
1 1 9200!!9572919
1595?0192813376'161E07rJ1
11r21137961629?19016220n2543129080310643n63
468605216357810$no7009576760$81291t6999Z37
1083541171361269201568241171291577E6
l
1
1
2
1 01 7
125211357602960
111f20902902t8681,47
7A9A96a4
112J81403816114191262239925742294633348137E0812120
5271258t9161105
n11Eu61692366
1005761092131r6167t?7890137836148179158470
1 t1 t2 Zl l
7 71 1 1 11 8 1 8zE t0
7A A21az 119
1n 397632 &4
1005 1017tt05 1163?164 ZZ39299? 30843972 40745110 52356471 66218066 4479An 10A74
r195E 121E011260 1152116419 1708619619 1991522724 2105126136 26193298t0 302403!901 t4424t8255 3470642898 4338047E92 4E41453265 538?1t8980 t957065024 65&671394 7205578111 7883885165 8612a93168 93971
101123 10??n11086 111014119301 1202101284(6 129E45110E55 1398n119232 150289159959 161051

RESEiVOIT VOLUIiE TABLE p€se 2
LAXE CONROE APRIL 1995 SURVEY
€LEV. FEEI
1{r4185186187188189190191192195'194
195196197198't99
200zol
. 0
1621171f53?6184911196920209372722216z!55402t 9215?6341427E113295341tw126325147t4242335998!76111396740116228
. 1
'163?17
17446816609519E14421064222t567236891250610?&4442796122914915107J6t27156344144361791379970l9E55l
ACRE-FEEI
. 2
164t51175611187?74199371?119172218€1234U6?52039266315? 4 1 1 1 5?96152!1?a5Z328830545EE{]361t883E1613100572
. 3
'165460
176759188458200607213195?261992t9605?53t 4426m22A?6?429801631t973330510317620165590383662402500
16657217'7910189661201E45214474?275212109692v45326923328/�119299586t15601332195149367367197585515404434
'167ffi
1n0&19086220308421576522&17212t34
2707002456193011613172!113388735112215900E3a77n1068n
168808'tEo??7'19?065
2043352120552301742437102576a727217J247184302712318€7J1355E3r52884170821tE9237406551
$n3z181391193272205t8a218149?31512?150472591122rj6502&37153041293ZOr17t!n85t54654372&4t91105110?9t
ELEVATIOII IICiEfiETI IS OIIE TENTH F@T
. 5 . 6 . 7 . E , 9
171060 172192142560 1$E5194/.83 195699206a15 208106219((4 220950252450 231193216169 ?47651260512 261977275133 276620290251 291193!0592t 30n2132218 3?J424338992 210704356129 358211374469 t76?94392974 594656112264 414242
Lt

T€XAS IIAI€R DCVELOPI.IENI SOARO
iESERVOIR AREA TASLE
Jul 12 1996
LAKE COilNOE APRIL 19196 SURVEY
REA IN ACRES
ELEV. FEE' .O .1 .2 . 3ELEVAIIOX IIICRETIENT IS ONE TENTII F@I
. a. 5
1!51361371t61!9140141
143
115116
148
1501 5 11521531511551561 r f15815916016116216116416516616716416917017117?173
1 A1761 n17E
1E0161182161
11I2
91 526
129221ll5159609n6938
108112A7151017392001
247127153007
3516t9t142731552447052705610594862706626705176128125856791L91119 ?
1027410624
I
1
1
2
1 0
4881
1172ll!461E626
952109813101 5 t 1176120102279?49227443039
1617l9E543014541$495306
59806502666t71olnol81708615908591819906
1030710658
112z
1 01 7295 185
145
359406
811966
1 1 1 61t l51571178/2056230125112n0t071338?1680
1329
514156416011631667047158775482118661912795219919
1054310692
123
1 11 6l0
89151
371501660830981
1 l ] 41t6Z1592180620812324
2798110614113712105241551612a992537557146041637067f972137E0942564712916895629W2
1037910725
11
. 23
71 1'19
32
9316?267taz5 1 5
u7995
1 1 5 5139216131E2921072315?56028273119311037444065
46725011.540857516075
67n72727457a29A47629?049602
10055104r410760
1175
7
20
6098
171278391510
86310091lZJ1117163118542133236525842E56
t46a3m4 1 1 8110947035074544157856107611?6420B3a7904814188119244
1007610/.4810795
I12lt8
t 3
6l104180289406545708an
10?l1 1 9 31142165t18842158?l47260828at1ZA41497341241t1143617315120,47'5E186140&74&271417950E385665992479588
1 0 1 1 71048210430
I12l,8
1 3?z!9
1091903014 1 8560
895105612151468167619162183210E
29143237t5z538484144
51545509585?617?6515
71707995o1?9890893259731
101561 0 5 1 810866
1I
2l5
23
701 1 62001 1 2411575
91010501214149016961944220721tO
294432643555384312151193
t197554258456201
6952
80188/�74895693659r/4
101951055310904
112359
1 524
n
211
445t9!75892\
10651?U1 5 1 017161978223221112687297'l29E35853917
152218335234,5765917623765897401759580E1852090009403981E
102131058910941

iESERVOIR AIEA TABLE tsg. 2
LAft CONROE ^PRIL 1tt96 SURVEY
AREA llt ACRES EIEV Ot INCRENEIi tS OliE tEttH f00t, t . 6 . 7 . 8. 0
10960113771179�612225t2(62t108213489139261143314i561550116[741{5551722117901t83511908720118
. 1
I t0251t415I t8!71229)12724131221353213972144471t009
161501671417U5179521E4t019161
1106311{551187912t141276513162Lt74t402014539t50631561516'�t86167n17]!43lVtnr845919i235
.3
t02114971l9ZZ12t541280613202156t6't4069
14592I
1 815669142t41682817436'1804,
t85mt9r|0
11140115!?I l%612404'tz8l�,
132421166114120146.44151n15n51610116884r750618069185t819386
. 9
I t3t9117'�3t2l8?12636t10421t44713E81r4379169041r447'1.o17
165966171tl170,�31t31aIEEO9t9E25
1841851861871la189't90
t91192t95
19'1 %19ft9Et99200201
1 1 1 8 1115E11200812151128451328213705t[ i1146961t22t15n2161591693817582161!418608t9t0l
1122111625120511249'129251tt2213748142221474815261tt84116418l69rc176591a1V)1855819t81
11261116681?09112t46l?9�64r36!1tn2142731680013337159021&75170451n2818224187081962
11300I t7101?1t712592t30ut1t4041383614325't4852
15!9315%0165361m991nulE?3�'tE75819743

nuJL!I,IJcc
;-i
IL
oLllff
fitrul
trE.lo
0
2,000
4,000
6,000
8,000
10,000
12,000
14,000
16,000
18,000
20,000
22,000
440,000
400,000
360,000
320,000
280,000
240,000
200,000
160,000
120,000
80,000
40,000
0130 140 150 160 170 180 190
ELEVATTON (FEET)
SURFACE AREA CAPACITY_._ _. jF-_
LAKE CONROEApril 1996 SURVEY
Prepared by: TWDB Juty 1996
200 210
\ov=o E
.r:.F
EY
X(
J
> 9
.67
o7
E=
vF
Fg
.:E S
t\nF
Elt
F5
o:
:
tl
x-
-v
o)
i)
Fl
t_ r'!
;^\J V
Uzooos
3
volJY
Aq
]g
Y<
AE
\J3
M5
{Fl

6o\==
v=
:.f; ?:
*F
eg
6>
a7
tl ':
vF
F
,14.1
8 g
.a
ch
<,?
.=!rn
#
E B
.E
=-
-
.ajj
E()O
Y^!,/
\,/
JA
A
Uzo
o9
z <,'
EE
NO
IJVA
S'II
3
\
\
T
:.
T
raYn
zz
rr./ (,l
X6
{
6oooa
o\o\e=
e E
^o
oo
z
r.F
?Y
=(
):;
r:z
e.6
'z
a7
E?
VF
FI4
c': :l
((l
oo
os
lo
El
< #
.E,.,
<R
rEi:
bo.e -t
tr.e !
*
f
i6'i
i/, -
+l'
I q
^f&
=>
<-
6--r
Et
i
x
00ot \J
=
=
Ev
v
Y^\/
r!'c
{tit 0.)
(oo
zUrqX

6:.| "
Y=
O:h
: F
ae
6>
o7
E=
eF
FJ
E.':iC
,'-
i3>
.ts.s 6
... tFd
ii boE
->
E
=E
3
E}
EH
Q
^I&
E-
^
cI
rl
EA
O
tov
v
zz
" v,{
.{
-u
ri
IaaIIIaIIIIIaiIt
aO,
o\>.8
9 E
^
E.e
Ez
9>
,a
EN
'^'-
Pd
.! 6
E*
r !
X a
.!:
V)rE
A^E
*
.g.E
€5
,t !
ax
F.
;><
^6 \r) -'rE
t
l
E, o.r q.r
zF
oooos E
'z
a-
\J'P
t{
!-
v,<

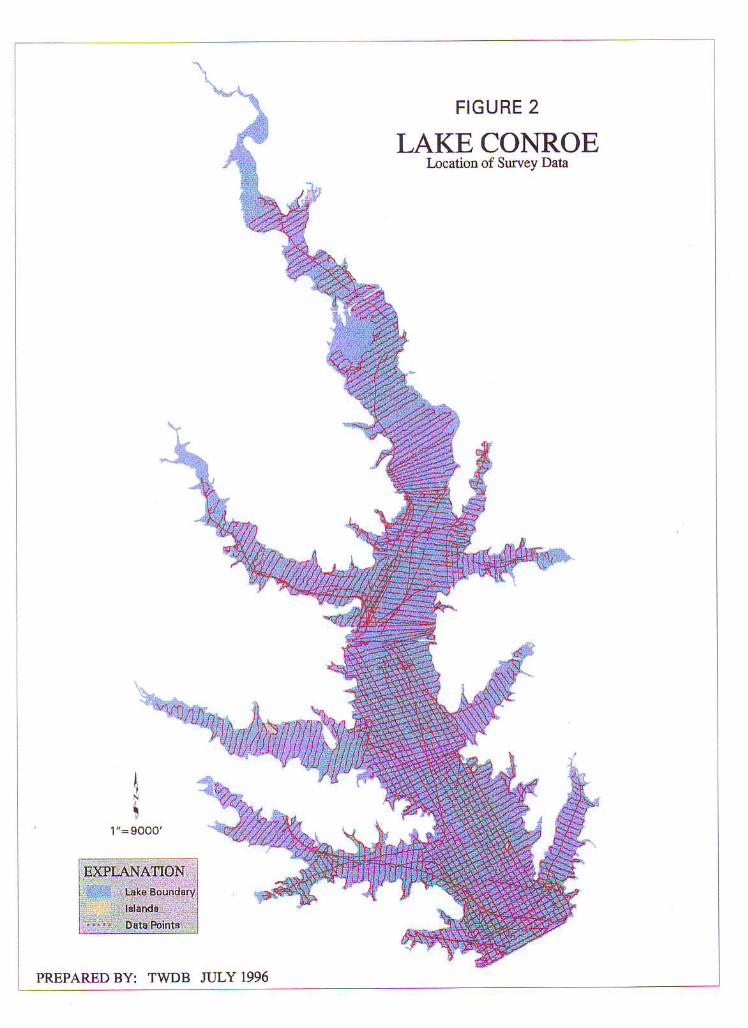
FIGURE 2
LAKE CONROEIrcation of Survey Daia
?RSPARBD BY: TWDB JULY 1996
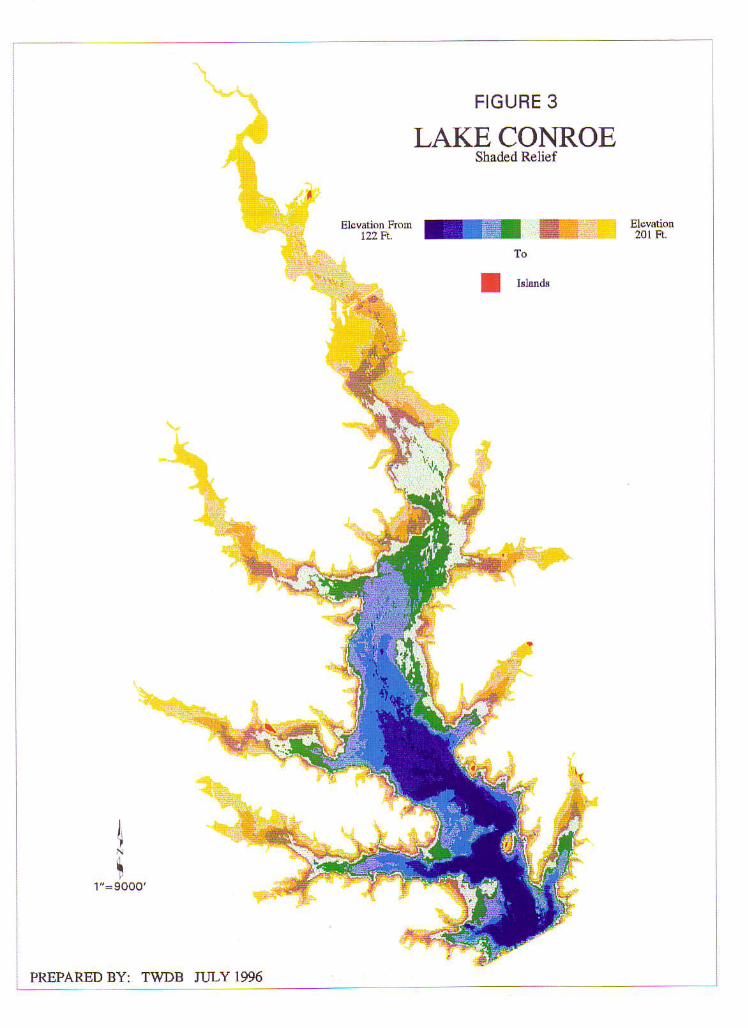
FIGURE 3
LAKE CONROEShaded Relief
Elcvation Fmd. lZZ ft. *l{i 20lFt .
I
t1"=9000'
JIILY 1996PREPARED BY: TWDB
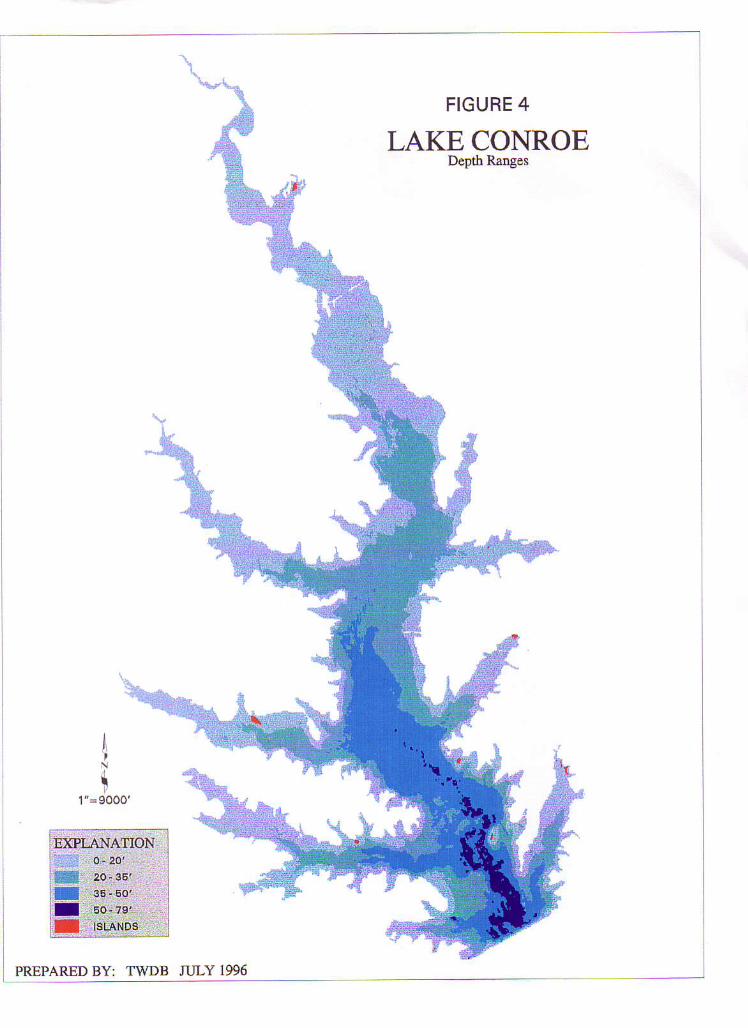
FIGURE 4
I-A,KE CONROEDepd RaDges
I$
1"-90OO'
PREPARm BY: TWDB JIJLY 1996

D-D
C-C
B-B
A-A
EXPLANATIONIslands
10 Ft. Contour Lines
5 Ft. Contour Lines
Normal Pool Elevation201 Ft.
Cross Section Line
PREPARED BY: TWDB JULY 1996
MONTGOMERY ANDWALKER COUNTIES
E-E
LAKE CONROEContour Map