
VOLUME NO 6 ISSUE NO 11 (NOVEMBER ISSN 2231-1009
104
VOLUME NO. 6 (2016), ISSUE NO. 11 (NOVEMBER) ISSN 2231-1009 A Monthly Double-Blind Peer Reviewed (Refereed/Juried) Open Access International e-Journal - Included in the International Serial Directories Indexed & Listed at: Ulrich's Periodicals Directory ©, ProQuest, U.S.A., EBSCO Publishing, U.S.A., Cabell’s Directories of Publishing Opportunities, U.S.A., Google Scholar, Open J-Gage, India [link of the same is duly available at Inflibnet of University Grants Commission (U.G.C.)], Index Copernicus Publishers Panel, Poland with IC Value of 5.09 & number of libraries all around the world. Circulated all over the world & Google has verified that scholars of more than 5000 Cities in 187 countries/territories are visiting our journal on regular basis. Ground Floor, Building No. 1041-C-1, Devi Bhawan Bazar, JAGADHRI – 135 003, Yamunanagar, Haryana, INDIA http://ijrcm.org.in/
Transcript of VOLUME NO 6 ISSUE NO 11 (NOVEMBER ISSN 2231-1009
VOLUME NO. 6 (2016), ISSUE NO. 11 (NOVEMBER) ISSN 2231-1009
A Monthly Double-Blind Peer Reviewed (Refereed/Juried) Open Access International e-Journal - Included in the International Serial Directories
Indexed & Listed at:
Ulrich's Periodicals Directory ©, ProQuest, U.S.A., EBSCO Publishing, U.S.A., Cabell’s Directories of Publishing Opportunities, U.S.A., Google Scholar,
Open J-Gage, India [link of the same is duly available at Inflibnet of University Grants Commission (U.G.C.)],
Index Copernicus Publishers Panel, Poland with IC Value of 5.09 & number of libraries all around the world.
Circulated all over the world & Google has verified that scholars of more than 5000 Cities in 187 countries/territories are visiting our journal on regular basis.
Ground Floor, Building No. 1041-C-1, Devi Bhawan Bazar, JAGADHRI – 135 003, Yamunanagar, Haryana, INDIA
http://ijrcm.org.in/
VOLUME NO. 6 (2016), ISSUE NO. 11 (NOVEMBER) ISSN 2231-1009
INTERNATIONAL JOURNAL OF RESEARCH IN COMPUTER APPLICATION & MANAGEMENT A Monthly Double-Blind Peer Reviewed (Refereed/Juried) Open Access International e-Journal - Included in the International Serial Directories
http://ijrcm.org.in/
ii
CONTENTS
Sr. No.
TITLE & NAME OF THE AUTHOR (S)
Page No.
1. CLOUD BASED TECHNO-ECONOMY MODEL FOR RURAL SECTOR
RUCHIR SAXENA & DR. RIPURANJAN SINHA 1
2. EVALUATION OF FINANCIAL PERFORMANCE OF STEEL INDUSTRY OF INDIA
V. KASTHURI & DR. R. VENKATACHAM 8
3. IMPACT OF I.T. IN HUMAN RESOURCE PRACTICES AND COMPETENCY
DEEPAK KUMAR, DR. NIRDOSH KUMAR AGARWAL & DR. SUBODH NALWAYA 14
4. A STUDY OF CUSTOMER PREFERENCES OF MOBILE BANKING AND BARRIERS IN ADOPTION OF MOBILE
BANKING SERVICES IN SELECTED CO-OPERATIVE BANKS IN PUNE CITY
SHRI AMOL D LONDHE & P. CHATTOPADHYAY
17
5. DATA MINING AND IDS (INTRUSION DETECTION SYSTEM)
P. RAMACHANDRAN & DR. R. BALASUBRAMANIAN 22
6. IDENTIFICATION OF HIPOS AMONGST HIGH PERFORMING EMPLOYEES AND THEIR DEVELOPMENT
ADITH DEV AKKARA, VIDHAN SHARMA, VAISHALI RAJANI, DR. RAVINDER KAUR 25
7. DIGITAL MARKETING: THE SUCCESS MANTRA
V.SRAVANI CHARI 30
8. TEXTILE EXPORTERS IN INDIA: A CASE STUDY OF TIRUPUR
DR. G. YOGANANDAN 33
9. A STUDY ON INVESTMENT PATTERN OF GOVERNMENT EMPLOYEES AND PRIVATE EMPLOYEES IN
COIMBATORE CITY
DR. K. KANNIAMMAL & JANNET.A
37
10. IMPACT OF TURNOVER RATIOS ON PROFITABILITY: SPECIAL REFERENCE TO TWO AND THREE
WHEELERS SECTOR IN INDIA
V.SANGEETHA & DR. M. KRISHNAVENI
41
11. THE CAUSATIVE EFFECT OF ADVERTISEMENT ON SALES
JAKKIREDDY SURESH REDDY & MULINTI CHINNA PULLAIAH 48
12. DIGITAL DIVIDE: CONSEQUENCES AND REMEDIAL MEASURES
M MAQBOOL PALA 52
13. SCHEDULING BASED NOTIFIED TRACKING BY RAILWAY NETWORK USING MOBILE USER APPLICATION
S. ARUNKUMAR 54
14. THE IMPACT OF EMPLOYEE EMPOWERMENT ON JOB SATISFACTION: A COMPARATIVE STUDY
BETWEEN PUBLIC AND PRIVATE SECTOR FIRMS IN KERALA
BINDU R
56
15. ANALYSIS AND GROWTH OF SIKKIM HANDLOOM AND HANDICRAFTS INDUSTRY
TENZING DORJEE BHUTIA & RISHI THAPA 59
16. ASSESSMENT OF THE IMPACT OF COMPUTERIZED ACCOUNTING INFORMATION SYSTEMS ON AUDIT
RISK: THE CASE OF AUTHORIZED ACCOUNTANTS ENGAGED IN NEKEMTE TOWN
KENO TELILA MIJENA
63
17. BANK SELECTION CRITERIA EMPLOYED BY CORPORATE CUSTOMERS: A CASE STUDY ON TEN SELECTED
COMMERCIAL BANKS IN ADDIS ABABA CITY ETHIOPIA
MUSE BEYENE
68
18. PANCHAYATI RAJ IN HIMACHAL PRADESH: AN INTRODUCTION
KHEM RAJ 85
19. A STUDY ON CONSUMERS’ BEHAVIOUR IN BUYING GOODS ONLINE WITH REFERENCE TO
THOOTHUKUDI DISTRICT
R. ANANTHA LAXMI
89
20. URBAN DEVELOPMENT WITH DIVERSIFICATION OF FUND: A CASE STUDY
RUPAK KARMAKAR 93
REQUEST FOR FEEDBACK & DISCLAIMER 96

VOLUME NO. 6 (2016), ISSUE NO. 11 (NOVEMBER) ISSN 2231-1009
INTERNATIONAL JOURNAL OF RESEARCH IN COMPUTER APPLICATION & MANAGEMENT A Monthly Double-Blind Peer Reviewed (Refereed/Juried) Open Access International e-Journal - Included in the International Serial Directories
http://ijrcm.org.in/
iii
CHIEF PATRON PROF. K. K. AGGARWAL
Chairman, Malaviya National Institute of Technology, Jaipur (An institute of National Importance & fully funded by Ministry of Human Resource Development, Government of India)
Chancellor, K. R. Mangalam University, Gurgaon
Chancellor, Lingaya’s University, Faridabad
Founder Vice-Chancellor (1998-2008), Guru Gobind Singh Indraprastha University, Delhi
Ex. Pro Vice-Chancellor, Guru Jambheshwar University, Hisar
FOUNDER PATRON
LATE SH. RAM BHAJAN AGGARWAL Former State Minister for Home & Tourism, Government of Haryana
Former Vice-President, Dadri Education Society, Charkhi Dadri
Former President, Chinar Syntex Ltd. (Textile Mills), Bhiwani
FORMER CO-ORDINATOR
DR. S. GARG Faculty, Shree Ram Institute of Business & Management, Urjani
ADVISORS
PROF. M. S. SENAM RAJU Director A. C. D., School of Management Studies, I.G.N.O.U., New Delhi
PROF. S. L. MAHANDRU Principal (Retd.), Maharaja Agrasen College, Jagadhri
EDITOR
PROF. R. K. SHARMA Professor, Bharti Vidyapeeth University Institute of Management & Research, New Delhi
EDITORIAL ADVISORY BOARD
DR. RAJESH MODI Faculty, Yanbu Industrial College, Kingdom of Saudi Arabia
PROF. PARVEEN KUMAR Director, M.C.A., Meerut Institute of Engineering & Technology, Meerut, U. P.
PROF. H. R. SHARMA Director, Chhatarpati Shivaji Institute of Technology, Durg, C.G.
PROF. MANOHAR LAL Director & Chairman, School of Information & Computer Sciences, I.G.N.O.U., New Delhi
PROF. ANIL K. SAINI Chairperson (CRC), Guru Gobind Singh I. P. University, Delhi
PROF. R. K. CHOUDHARY Director, Asia Pacific Institute of Information Technology, Panipat
DR. ASHWANI KUSH Head, Computer Science, University College, Kurukshetra University, Kurukshetra

VOLUME NO. 6 (2016), ISSUE NO. 11 (NOVEMBER) ISSN 2231-1009
INTERNATIONAL JOURNAL OF RESEARCH IN COMPUTER APPLICATION & MANAGEMENT A Monthly Double-Blind Peer Reviewed (Refereed/Juried) Open Access International e-Journal - Included in the International Serial Directories
http://ijrcm.org.in/
iv
DR. BHARAT BHUSHAN Head, Department of Computer Science & Applications, Guru Nanak Khalsa College, Yamunanagar
DR. VIJAYPAL SINGH DHAKA Dean (Academics), Rajasthan Institute of Engineering & Technology, Jaipur
DR. SAMBHAVNA Faculty, I.I.T.M., Delhi
DR. MOHINDER CHAND Associate Professor, Kurukshetra University, Kurukshetra
DR. MOHENDER KUMAR GUPTA Associate Professor, P. J. L. N. Government College, Faridabad
DR. SHIVAKUMAR DEENE Asst. Professor, Dept. of Commerce, School of Business Studies, Central University of Karnataka, Gulbarga
DR. BHAVET Faculty, Shree Ram Institute of Engineering & Technology, Urjani
ASSOCIATE EDITORS
PROF. ABHAY BANSAL Head, Department of Information Technology, Amity School of Engineering & Technology, Amity University, Noida
PROF. NAWAB ALI KHAN Department of Commerce, Aligarh Muslim University, Aligarh, U.P.
ASHISH CHOPRA Sr. Lecturer, Doon Valley Institute of Engineering & Technology, Karnal
FORMER TECHNICAL ADVISOR
AMITA Faculty, Government M. S., Mohali
FINANCIAL ADVISORS
DICKIN GOYAL Advocate & Tax Adviser, Panchkula
NEENA Investment Consultant, Chambaghat, Solan, Himachal Pradesh
LEGAL ADVISORS
JITENDER S. CHAHAL Advocate, Punjab & Haryana High Court, Chandigarh U.T.
CHANDER BHUSHAN SHARMA Advocate & Consultant, District Courts, Yamunanagar at Jagadhri
SUPERINTENDENT
SURENDER KUMAR POONIA
VOLUME NO. 6 (2016), ISSUE NO. 11 (NOVEMBER) ISSN 2231-1009
INTERNATIONAL JOURNAL OF RESEARCH IN COMPUTER APPLICATION & MANAGEMENT A Monthly Double-Blind Peer Reviewed (Refereed/Juried) Open Access International e-Journal - Included in the International Serial Directories
http://ijrcm.org.in/
v
CALL FOR MANUSCRIPTS We invite unpublished novel, original, empirical and high quality research work pertaining to the recent developments & practices in the areas of Com-
puter Science & Applications; Commerce; Business; Finance; Marketing; Human Resource Management; General Management; Banking; Economics;
Tourism Administration & Management; Education; Law; Library & Information Science; Defence & Strategic Studies; Electronic Science; Corporate Gov-
ernance; Industrial Relations; and emerging paradigms in allied subjects like Accounting; Accounting Information Systems; Accounting Theory & Practice;
Auditing; Behavioral Accounting; Behavioral Economics; Corporate Finance; Cost Accounting; Econometrics; Economic Development; Economic History;
Financial Institutions & Markets; Financial Services; Fiscal Policy; Government & Non Profit Accounting; Industrial Organization; International Economics
& Trade; International Finance; Macro Economics; Micro Economics; Rural Economics; Co-operation; Demography: Development Planning; Development
Studies; Applied Economics; Development Economics; Business Economics; Monetary Policy; Public Policy Economics; Real Estate; Regional Economics;
Political Science; Continuing Education; Labour Welfare; Philosophy; Psychology; Sociology; Tax Accounting; Advertising & Promotion Management;
Management Information Systems (MIS); Business Law; Public Responsibility & Ethics; Communication; Direct Marketing; E-Commerce; Global Business;
Health Care Administration; Labour Relations & Human Resource Management; Marketing Research; Marketing Theory & Applications; Non-Profit Or-
ganizations; Office Administration/Management; Operations Research/Statistics; Organizational Behavior & Theory; Organizational Development; Pro-
duction/Operations; International Relations; Human Rights & Duties; Public Administration; Population Studies; Purchasing/Materials Management; Re-
tailing; Sales/Selling; Services; Small Business Entrepreneurship; Strategic Management Policy; Technology/Innovation; Tourism & Hospitality; Transpor-
tation Distribution; Algorithms; Artificial Intelligence; Compilers & Translation; Computer Aided Design (CAD); Computer Aided Manufacturing; Computer
Graphics; Computer Organization & Architecture; Database Structures & Systems; Discrete Structures; Internet; Management Information Systems; Mod-
eling & Simulation; Neural Systems/Neural Networks; Numerical Analysis/Scientific Computing; Object Oriented Programming; Operating Systems; Pro-
gramming Languages; Robotics; Symbolic & Formal Logic; Web Design and emerging paradigms in allied subjects.
Anybody can submit the soft copy of unpublished novel; original; empirical and high quality research work/manuscript anytime in M.S. Word format
after preparing the same as per our GUIDELINES FOR SUBMISSION; at our email address i.e. [email protected] or online by clicking the link online
submission as given on our website (FOR ONLINE SUBMISSION, CLICK HERE).
GUIDELINES FOR SUBMISSION OF MANUSCRIPT
1. COVERING LETTER FOR SUBMISSION:
DATED: _____________
THE EDITOR
IJRCM
Subject: SUBMISSION OF MANUSCRIPT IN THE AREA OF .
(e.g. Finance/Mkt./HRM/General Mgt./Engineering/Economics/Computer/IT/ Education/Psychology/Law/Math/other, please
specify)
DEAR SIR/MADAM
Please find my submission of manuscript titled ‘___________________________________________’ for likely publication in one of
your journals.
I hereby affirm that the contents of this manuscript are original. Furthermore, it has neither been published anywhere in any language
fully or partly, nor it is under review for publication elsewhere.
I affirm that all the co-authors of this manuscript have seen the submitted version of the manuscript and have agreed to inclusion of
their names as co-authors.
Also, if my/our manuscript is accepted, I agree to comply with the formalities as given on the website of the journal. The Journal has
discretion to publish our contribution in any of its journals.
NAME OF CORRESPONDING AUTHOR :
Designation/Post* :
Institution/College/University with full address & Pin Code :
Residential address with Pin Code :
Mobile Number (s) with country ISD code :
Is WhatsApp or Viber active on your above noted Mobile Number (Yes/No) :
Landline Number (s) with country ISD code :
E-mail Address :
Alternate E-mail Address :
Nationality :
* i.e. Alumnus (Male Alumni), Alumna (Female Alumni), Student, Research Scholar (M. Phil), Research Scholar (Ph. D.), JRF, Research Assistant, Assistant
Lecturer, Lecturer, Senior Lecturer, Junior Assistant Professor, Assistant Professor, Senior Assistant Professor, Co-ordinator, Reader, Associate Profes-
sor, Professor, Head, Vice-Principal, Dy. Director, Principal, Director, Dean, President, Vice Chancellor, Industry Designation etc. The qualification of
author is not acceptable for the purpose.

VOLUME NO. 6 (2016), ISSUE NO. 11 (NOVEMBER) ISSN 2231-1009
INTERNATIONAL JOURNAL OF RESEARCH IN COMPUTER APPLICATION & MANAGEMENT A Monthly Double-Blind Peer Reviewed (Refereed/Juried) Open Access International e-Journal - Included in the International Serial Directories
http://ijrcm.org.in/
vi
NOTES:
a) The whole manuscript has to be in ONE MS WORD FILE only, which will start from the covering letter, inside the manuscript. pdf.
version is liable to be rejected without any consideration.
b) The sender is required to mention the following in the SUBJECT COLUMN of the mail:
New Manuscript for Review in the area of (e.g. Finance/Marketing/HRM/General Mgt./Engineering/Economics/Computer/IT/
Education/Psychology/Law/Math/other, please specify)
c) There is no need to give any text in the body of the mail, except the cases where the author wishes to give any specific message
w.r.t. to the manuscript.
d) The total size of the file containing the manuscript is expected to be below 1000 KB.
e) Only the Abstract will not be considered for review and the author is required to submit the complete manuscript in the first
instance.
f) The journal gives acknowledgement w.r.t. the receipt of every email within twenty-four hours and in case of non-receipt of
acknowledgment from the journal, w.r.t. the submission of the manuscript, within two days of its submission, the corresponding
author is required to demand for the same by sending a separate mail to the journal.
g) The author (s) name or details should not appear anywhere on the body of the manuscript, except on the covering letter and the
cover page of the manuscript, in the manner as mentioned in the guidelines.
2. MANUSCRIPT TITLE: The title of the paper should be typed in bold letters, centered and fully capitalised.
3. AUTHOR NAME (S) & AFFILIATIONS: Author (s) name, designation, affiliation (s), address, mobile/landline number (s), and email/al-
ternate email address should be given underneath the title.
4. ACKNOWLEDGMENTS: Acknowledgements can be given to reviewers, guides, funding institutions, etc., if any.
5. ABSTRACT: Abstract should be in fully Italic printing, ranging between 150 to 300 words. The abstract must be informative and eluci-
dating the background, aims, methods, results & conclusion in a SINGLE PARA. Abbreviations must be mentioned in full.
6. KEYWORDS: Abstract must be followed by a list of keywords, subject to the maximum of five. These should be arranged in alphabetic
order separated by commas and full stop at the end. All words of the keywords, including the first one should be in small letters, except
special words e.g. name of the Countries, abbreviations etc.
7. JEL CODE: Provide the appropriate Journal of Economic Literature Classification System code (s). JEL codes are available at www.aea-
web.org/econlit/jelCodes.php. However, mentioning of JEL Code is not mandatory.
8. MANUSCRIPT: Manuscript must be in BRITISH ENGLISH prepared on a standard A4 size PORTRAIT SETTING PAPER. It should be free
from any errors i.e. grammatical, spelling or punctuation. It must be thoroughly edited at your end.
9. HEADINGS: All the headings must be bold-faced, aligned left and fully capitalised. Leave a blank line before each heading.
10. SUB-HEADINGS: All the sub-headings must be bold-faced, aligned left and fully capitalised.
11. MAIN TEXT:
THE MAIN TEXT SHOULD FOLLOW THE FOLLOWING SEQUENCE:
INTRODUCTION
REVIEW OF LITERATURE
NEED/IMPORTANCE OF THE STUDY
STATEMENT OF THE PROBLEM
OBJECTIVES
HYPOTHESIS (ES)
RESEARCH METHODOLOGY
RESULTS & DISCUSSION
FINDINGS
RECOMMENDATIONS/SUGGESTIONS
CONCLUSIONS
LIMITATIONS
SCOPE FOR FURTHER RESEARCH
REFERENCES
APPENDIX/ANNEXURE
The manuscript should preferably be in 2000 to 5000 WORDS, But the limits can vary depending on the nature of the manuscript.

VOLUME NO. 6 (2016), ISSUE NO. 11 (NOVEMBER) ISSN 2231-1009
INTERNATIONAL JOURNAL OF RESEARCH IN COMPUTER APPLICATION & MANAGEMENT A Monthly Double-Blind Peer Reviewed (Refereed/Juried) Open Access International e-Journal - Included in the International Serial Directories
http://ijrcm.org.in/
vii
12. FIGURES & TABLES: These should be simple, crystal CLEAR, centered, separately numbered & self-explained, and the titles must be
above the table/figure. Sources of data should be mentioned below the table/figure. It should be ensured that the tables/figures are
referred to from the main text.
13. EQUATIONS/FORMULAE: These should be consecutively numbered in parenthesis, left aligned with equation/formulae number placed
at the right. The equation editor provided with standard versions of Microsoft Word may be utilised. If any other equation editor is
utilised, author must confirm that these equations may be viewed and edited in versions of Microsoft Office that does not have the
editor.
14. ACRONYMS: These should not be used in the abstract. The use of acronyms is elsewhere is acceptable. Acronyms should be defined
on its first use in each section e.g. Reserve Bank of India (RBI). Acronyms should be redefined on first use in subsequent sections.
15. REFERENCES: The list of all references should be alphabetically arranged. The author (s) should mention only the actually utilised
references in the preparation of manuscript and they may follow Harvard Style of Referencing. Also check to ensure that everything
that you are including in the reference section is duly cited in the paper. The author (s) are supposed to follow the references as per
the following:
• All works cited in the text (including sources for tables and figures) should be listed alphabetically.
• Use (ed.) for one editor, and (ed.s) for multiple editors.
• When listing two or more works by one author, use --- (20xx), such as after Kohl (1997), use --- (2001), etc., in chronologically ascending
order.
• Indicate (opening and closing) page numbers for articles in journals and for chapters in books.
• The title of books and journals should be in italic printing. Double quotation marks are used for titles of journal articles, book chapters,
dissertations, reports, working papers, unpublished material, etc.
• For titles in a language other than English, provide an English translation in parenthesis.
• Headers, footers, endnotes and footnotes should not be used in the document. However, you can mention short notes to elucidate
some specific point, which may be placed in number orders before the references.
PLEASE USE THE FOLLOWING FOR STYLE AND PUNCTUATION IN REFERENCES:
BOOKS
• Bowersox, Donald J., Closs, David J., (1996), "Logistical Management." Tata McGraw, Hill, New Delhi.
• Hunker, H.L. and A.J. Wright (1963), "Factors of Industrial Location in Ohio" Ohio State University, Nigeria.
CONTRIBUTIONS TO BOOKS
• Sharma T., Kwatra, G. (2008) Effectiveness of Social Advertising: A Study of Selected Campaigns, Corporate Social Responsibility, Edited
by David Crowther & Nicholas Capaldi, Ashgate Research Companion to Corporate Social Responsibility, Chapter 15, pp 287-303.
JOURNAL AND OTHER ARTICLES
• Schemenner, R.W., Huber, J.C. and Cook, R.L. (1987), "Geographic Differences and the Location of New Manufacturing Facilities,"
Journal of Urban Economics, Vol. 21, No. 1, pp. 83-104.
CONFERENCE PAPERS
• Garg, Sambhav (2011): "Business Ethics" Paper presented at the Annual International Conference for the All India Management Asso-
ciation, New Delhi, India, 19–23
UNPUBLISHED DISSERTATIONS
• Kumar S. (2011): "Customer Value: A Comparative Study of Rural and Urban Customers," Thesis, Kurukshetra University, Kurukshetra.
ONLINE RESOURCES
• Always indicate the date that the source was accessed, as online resources are frequently updated or removed.
WEBSITES
• Garg, Bhavet (2011): Towards a New Gas Policy, Political Weekly, Viewed on January 01, 2012 http://epw.in/user/viewabstract.jsp
VOLUME NO. 6 (2016), ISSUE NO. 11 (NOVEMBER) ISSN 2231-1009
INTERNATIONAL JOURNAL OF RESEARCH IN COMPUTER APPLICATION & MANAGEMENT A Monthly Double-Blind Peer Reviewed (Refereed/Juried) Open Access International e-Journal - Included in the International Serial Directories
http://ijrcm.org.in/
1
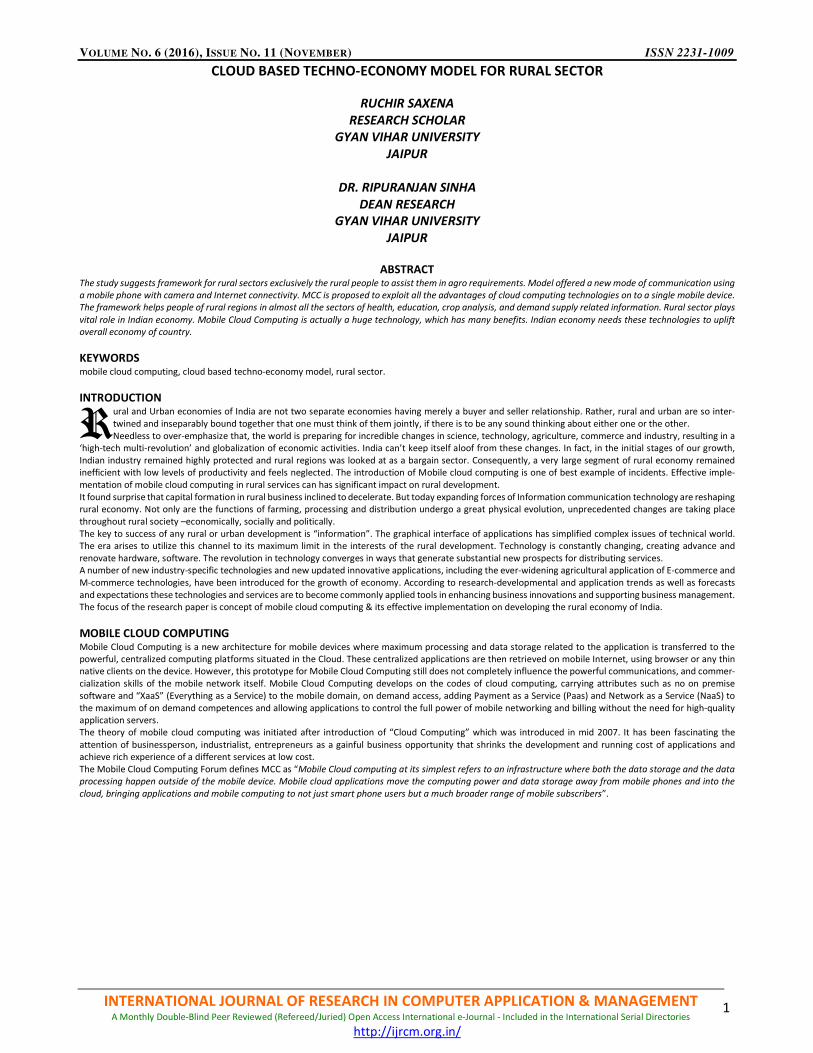
CLOUD BASED TECHNO-ECONOMY MODEL FOR RURAL SECTOR
RUCHIR SAXENA
RESEARCH SCHOLAR
GYAN VIHAR UNIVERSITY
JAIPUR
DR. RIPURANJAN SINHA
DEAN RESEARCH
GYAN VIHAR UNIVERSITY
JAIPUR
ABSTRACT The study suggests framework for rural sectors exclusively the rural people to assist them in agro requirements. Model offered a new mode of communication using
a mobile phone with camera and Internet connectivity. MCC is proposed to exploit all the advantages of cloud computing technologies on to a single mobile device.
The framework helps people of rural regions in almost all the sectors of health, education, crop analysis, and demand supply related information. Rural sector plays
vital role in Indian economy. Mobile Cloud Computing is actually a huge technology, which has many benefits. Indian economy needs these technologies to uplift
overall economy of country.
KEYWORDS mobile cloud computing, cloud based techno-economy model, rural sector.
INTRODUCTION ural and Urban economies of India are not two separate economies having merely a buyer and seller relationship. Rather, rural and urban are so inter-
twined and inseparably bound together that one must think of them jointly, if there is to be any sound thinking about either one or the other.
Needless to over-emphasize that, the world is preparing for incredible changes in science, technology, agriculture, commerce and industry, resulting in a
‘high-tech multi-revolution’ and globalization of economic activities. India can’t keep itself aloof from these changes. In fact, in the initial stages of our growth,
Indian industry remained highly protected and rural regions was looked at as a bargain sector. Consequently, a very large segment of rural economy remained
inefficient with low levels of productivity and feels neglected. The introduction of Mobile cloud computing is one of best example of incidents. Effective imple-
mentation of mobile cloud computing in rural services can has significant impact on rural development.
It found surprise that capital formation in rural business inclined to decelerate. But today expanding forces of Information communication technology are reshaping
rural economy. Not only are the functions of farming, processing and distribution undergo a great physical evolution, unprecedented changes are taking place
throughout rural society –economically, socially and politically.
The key to success of any rural or urban development is “information”. The graphical interface of applications has simplified complex issues of technical world.
The era arises to utilize this channel to its maximum limit in the interests of the rural development. Technology is constantly changing, creating advance and
renovate hardware, software. The revolution in technology converges in ways that generate substantial new prospects for distributing services.
A number of new industry-specific technologies and new updated innovative applications, including the ever-widening agricultural application of E-commerce and
M-commerce technologies, have been introduced for the growth of economy. According to research-developmental and application trends as well as forecasts
and expectations these technologies and services are to become commonly applied tools in enhancing business innovations and supporting business management.
The focus of the research paper is concept of mobile cloud computing & its effective implementation on developing the rural economy of India.
MOBILE CLOUD COMPUTING Mobile Cloud Computing is a new architecture for mobile devices where maximum processing and data storage related to the application is transferred to the
powerful, centralized computing platforms situated in the Cloud. These centralized applications are then retrieved on mobile Internet, using browser or any thin
native clients on the device. However, this prototype for Mobile Cloud Computing still does not completely influence the powerful communications, and commer-
cialization skills of the mobile network itself. Mobile Cloud Computing develops on the codes of cloud computing, carrying attributes such as no on premise
software and “XaaS” (Everything as a Service) to the mobile domain, on demand access, adding Payment as a Service (Paas) and Network as a Service (NaaS) to
the maximum of on demand competences and allowing applications to control the full power of mobile networking and billing without the need for high-quality
application servers.
The theory of mobile cloud computing was initiated after introduction of “Cloud Computing” which was introduced in mid 2007. It has been fascinating the
attention of businessperson, industrialist, entrepreneurs as a gainful business opportunity that shrinks the development and running cost of applications and
achieve rich experience of a different services at low cost.
The Mobile Cloud Computing Forum defines MCC as “Mobile Cloud computing at its simplest refers to an infrastructure where both the data storage and the data
processing happen outside of the mobile device. Mobile cloud applications move the computing power and data storage away from mobile phones and into the
cloud, bringing applications and mobile computing to not just smart phone users but a much broader range of mobile subscribers”.
R

VOLUME NO. 6 (2016), ISSUE NO. 11 (NOVEMBER) ISSN 2231-1009
INTERNATIONAL JOURNAL OF RESEARCH IN COMPUTER APPLICATION & MANAGEMENT A Monthly Double-Blind Peer Reviewed (Refereed/Juried) Open Access International e-Journal - Included in the International Serial Directories
http://ijrcm.org.in/
2
FIGURE 1: MOBILE CLOUD COMPUTING (MCC) ARCHITECTURE
Source: Mobile Cloud Computing Forum
The universal architecture of Mobile Cloud Computing is presented in Fig.1 Mobile devices are coupled with mobile networks by, access point, satellite, or base
transceiver station (BTS), which called base stations that control and establish the connections and working interfaces between the mobile devices and networks.
Information (e.g., ID and location) and any other request from mobile users are transferred to the central processors that are connected to servers providing
mobile network services. The network operators deliver services to mobile users as Authentication, Authorization, and Accounting based on the home agent and
user’s data stored in databases. After that, the user’s requests are transmitted to cloud via the Internet. The cloud managers process the requests to provide
information to mobile users with the corresponding cloud services. These facilities are evolved with the thoughts of service oriented architecture, virtualization
and utility computing.
REVIEW OF LITERATURE According to Shubham Chatterjee and Asoke Nath (2015) cloud computing technology motivate the flow of information and knowledge beyond the border of
economic and social status. It improves transparency, accountability, efficiency, and speed. Could Computing can help to improve living standard of remote rural
regions by providing education, commercials and social benefits. Cloud can handle local requirements of rural people.
According to Mitsuyoshi hori, Eiji Kawashima, Tomihiro Yamazaki (2015) rural development has huge potential that is not explored because lack of information
technology implementation. Because of rural economic scenario, which is very poor in terms of monetary conditions, physical implementation hurdles, cloud
technology is best suited for upliftment of rural sector. There is yet a huge space of implementing new cloud techniques.
Rakesh Patel and Mili Patel (2013) proves that cloud computing can drive down cost of rural e-services. They proved that cloud could reduce the gaps between
poor rural and rich urban India and creates the same level for all Indians.
As per Kuldeep Sambrekar and V.S. Rajpurohit (2014) cloud is doing well in some sectors but difficulties still exists because of high infrastructure cost etc. Mobile
cloud is a technique that can use cloud computing technology on to a simple smart phones and reduce demand of high cost infrastructure and provide complex
algorithms in simple understandable form.
OBJECTIVE OF RESEARCH The main objective of paper towards establishment of framework of mobile cloud technology, for ensuring sustainability and boost of rural economy.
RESEARCH METHODOLOGY This study is an exploratory research. The study is on “Cloud Based Techno-Economy Model for Rural Sector” which particularly covers the rural business. Primary
data was collected through survey method. Close-ended questionnaire was prepared. Respondents were involved in rural business directly or indirectly.
SAMPLING
For the study purpose primary data was collected through questionnaire from the peoples of rural regions who contribute in rural economy directly or indirectly
through ITC. Sample Size of 87 was taken, out of which 50 best relevant respondents were analyzed. 11 statements were selected and included in questionnaire.
The secondary data was collected from official websites, national and international journals, annual reports, books, websites etc.
CHALLENGES IN RURAL DEVELOPMENT India is a country of villages. Villages are the units of rural society and the centre of culture. Definition of rural area (by Planning Commission, Insurance Regulatory
Development Association IRDA)[2]:
“THAT WHICH IS NOT URBAN”
� Population of less than 5000.
� At least 75% of the male workforce engaged in agriculture activities.
� Absence of a municipality / corporation.
� Density of population is less than 400 per sq/km.
“Swadeshi”, the heart of Gandhi’s vision, doesn’t mean spinning wheel and wearing khadi, it means local self reliance on the village to rejuvenate rural India and
mobile cloud computing may be fuel to force this dream.
According to IMF world economic outlook India’s economy grew at an annual rate of 7.336% in 2015.
VOLUME NO. 6 (2016), ISSUE NO. 11 (NOVEMBER) ISSN 2231-1009
INTERNATIONAL JOURNAL OF RESEARCH IN COMPUTER APPLICATION & MANAGEMENT A Monthly Double-Blind Peer Reviewed (Refereed/Juried) Open Access International e-Journal - Included in the International Serial Directories
http://ijrcm.org.in/
3
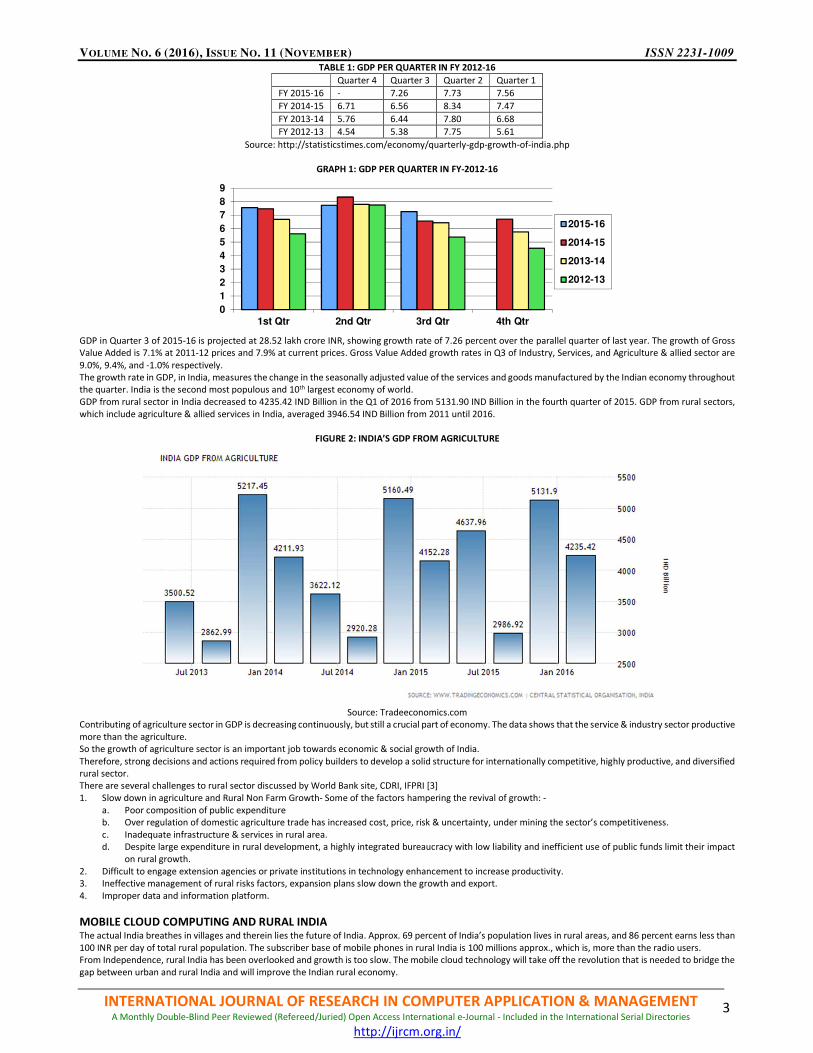
TABLE 1: GDP PER QUARTER IN FY 2012-16
Quarter 4 Quarter 3 Quarter 2 Quarter 1
FY 2015-16 - 7.26 7.73 7.56
FY 2014-15 6.71 6.56 8.34 7.47
FY 2013-14 5.76 6.44 7.80 6.68
FY 2012-13 4.54 5.38 7.75 5.61
Source: http://statisticstimes.com/economy/quarterly-gdp-growth-of-india.php
GRAPH 1: GDP PER QUARTER IN FY-2012-16
GDP in Quarter 3 of 2015-16 is projected at 28.52 lakh crore INR, showing growth rate of 7.26 percent over the parallel quarter of last year. The growth of Gross
Value Added is 7.1% at 2011-12 prices and 7.9% at current prices. Gross Value Added growth rates in Q3 of Industry, Services, and Agriculture & allied sector are
9.0%, 9.4%, and -1.0% respectively.
The growth rate in GDP, in India, measures the change in the seasonally adjusted value of the services and goods manufactured by the Indian economy throughout
the quarter. India is the second most populous and 10th largest economy of world.
GDP from rural sector in India decreased to 4235.42 IND Billion in the Q1 of 2016 from 5131.90 IND Billion in the fourth quarter of 2015. GDP from rural sectors,
which include agriculture & allied services in India, averaged 3946.54 IND Billion from 2011 until 2016.
FIGURE 2: INDIA’S GDP FROM AGRICULTURE
Source: Tradeeconomics.com
Contributing of agriculture sector in GDP is decreasing continuously, but still a crucial part of economy. The data shows that the service & industry sector productive
more than the agriculture.
So the growth of agriculture sector is an important job towards economic & social growth of India.
Therefore, strong decisions and actions required from policy builders to develop a solid structure for internationally competitive, highly productive, and diversified
rural sector.
There are several challenges to rural sector discussed by World Bank site, CDRI, IFPRI [3]
1. Slow down in agriculture and Rural Non Farm Growth- Some of the factors hampering the revival of growth: -
a. Poor composition of public expenditure
b. Over regulation of domestic agriculture trade has increased cost, price, risk & uncertainty, under mining the sector’s competitiveness.
c. Inadequate infrastructure & services in rural area.
d. Despite large expenditure in rural development, a highly integrated bureaucracy with low liability and inefficient use of public funds limit their impact
on rural growth.
2. Difficult to engage extension agencies or private institutions in technology enhancement to increase productivity.
3. Ineffective management of rural risks factors, expansion plans slow down the growth and export.
4. Improper data and information platform.
MOBILE CLOUD COMPUTING AND RURAL INDIA The actual India breathes in villages and therein lies the future of India. Approx. 69 percent of India’s population lives in rural areas, and 86 percent earns less than
100 INR per day of total rural population. The subscriber base of mobile phones in rural India is 100 millions approx., which is, more than the radio users.
From Independence, rural India has been overlooked and growth is too slow. The mobile cloud technology will take off the revolution that is needed to bridge the
gap between urban and rural India and will improve the Indian rural economy.
0
1
2
3
4
5
6
7
8
9
1st Qtr 2nd Qtr 3rd Qtr 4th Qtr
2015-16
2014-15
2013-14
2012-13

VOLUME NO. 6 (2016), ISSUE NO. 11 (NOVEMBER) ISSN 2231-1009
INTERNATIONAL JOURNAL OF RESEARCH IN COMPUTER APPLICATION & MANAGEMENT A Monthly Double-Blind Peer Reviewed (Refereed/Juried) Open Access International e-Journal - Included in the International Serial Directories
http://ijrcm.org.in/
4
Under digital India Bharat Sanchar Nigam Ltd is providing high-speed Internet connectivity up to the grass root level of rural India, which makes data connectivity
faster and allows rural sectors to log into the cloud. Mobile cloud technology is an advantage over any other technology because:
� Minimum initial cost makes Mobile cloud computing attractive for rural regions.
� It will reduce the costs of education, primary health care services, e-governance.
� Easy to manage. No need of creating huge infrastructure like power and air-conditioning to run the data centers and no need of keeping licenses etc.
� Scalability makes quick rural diffusion a reality; easily increase the number of users and sites at a nominal cost.
� The Mobile cloud computing will support non- English speaking literate villagers to join the information revolution and contribute to strengthen the country’s
economy
Mobile cloud computing will permit information communication technology to be infused into the far most level of rural India and make information accessible
and available to the poorest of the poor to improve their life style by empowering them with knowledge generates from there smart phones connected to the
cloud.
They can access many services like weather forecast, agriculture information, e-learning, agri-market updates, health services and many more in real time at
affordable cost without going anywhere.
PROBLEM STATEMENT By all the above discussion based on secondary data we proposed a model using Mobile Cloud Computing Technology which can be used in rural sectors so that
information sharing globally and locally, information management, local and global communication can be attained easily and flexibly.
PROPOSED MOBILE CLOUD COMPUTING MODEL Paper presents a model for rural India using mobile cloud computing technology. The model is divided in two-tier application model. First tier is Front end for the
users with simple graphical user interface to full fill requirements of the user with ease and fast. Second tier is used to as database to store all the useful and
related information on cloud.
FIGURE 3
The front end is a module, which can communicate with the end user for their requirements and provide related services any time anywhere in India. The system
can provide many services like
1) It can provide real time information of demand and supply from all the regions of the country. Which helps to analyze returns on their products. Minimize
the role of mediators between demand and supply.
2) Because of Mobile technology used in system it helps rural people to collect information from database through smart phone in their own local languages
easily with audio video facilities as well.
3) Model provide live chat facilities with scientists, experts and researchers, through which people from rural business sectors can share their technical problems
and take solution at the same time as well and also can take expert trainings. The system can also provide rural business related global information like new
tools and technologies, new methods of farming, cattle farming etc. successfully implemented in all over the world.
4) It also helps in real time research. Researchers can extract data from data bank directly with ease. They can access live data from fields directly through
audio-video facility and implement their suggestion without delay. Results can store in same database for future use.
The second tier or backend is a centralized database is on cloud, stores all agro business related information, which is made available to the entire user anytime
anywhere in the world. The major objective to store information centrally on cloud is to spread the information to grass root level and made available with ease
so users can analyze and act accordingly. For this purpose, second tier stores minimum following information in database:
1) Information related to all crops cultivated in the all regions so they can analyze and react easily.
2) It can store data related to growth of product from regular interval from different regions, which will help to compare two different products, and clears the
picture. For example, farmer can check the growth of a crop region wise and compare it from past.
3) Weather is the major factor in rural economy; it can store weather information and also forecast region wise.
4) It also stores data related to local entrepreneurs, farmers, wagers so government can analyze and make policies accordingly to provide maximum benefits.
Information can use to minimize unemployment, reducing farmers suicide activities, migration from rual to urban etc.
5) Database can store solutions for common problems of rural community which can easily accessible. There is a provision to store new questions in database
experts will provide solution on it.
• Mobile devices like phones with camera and audio video facilities, tablets etc.
End User
• Network services like Internet connections provided by operators to connect with application service provider i.e., First tier of model
Mobile Network
• E-tranings
• Research
• Live Chats
• Weather Forecasting
• Demand & Supply
Ist Tier i.e. User Interface
IInd Tier i.e.
Cloud

VOLUME NO. 6 (2016), ISSUE NO. 11 (NOVEMBER) ISSN 2231-1009
INTERNATIONAL JOURNAL OF RESEARCH IN COMPUTER APPLICATION & MANAGEMENT A Monthly Double-Blind Peer Reviewed (Refereed/Juried) Open Access International e-Journal - Included in the International Serial Directories
http://ijrcm.org.in/
5
RESEARCH ANALYSIS & INTERPRETATION In the present part the analysis of general opinion of respondents towards the objectives of proposed Framework as explained earlier a set of 11 statements were
selected and included in questionnaire. 50 Respondents were interviewed by using interview schedule and their opinions were collected and presented through
tables and graphical representations.
I. FAST COMMUNICATION AT LOW COST AND EASY TO OPERATE
TABLE 2
Provides Fast Communication Low Cost Easy to Operate
Strongly Agree 56% 24% 18%
Agree 30% 60% 68%
Neither nor 2% 0% 0%
Disagree 10% 10% 12%
Strongly Disagree 2% 6% 2%
Total 100% 100% 100%
GRAPH 2
The table and bar chart reveals that majority of users 56% Strongly Agree and only 2% Strongly Disagree with the objective that with Participation of mobile cloud
computing will improve communication between market and users directly.
The table and bar chart reveals that majority of respondents 24% Strongly Agree, 60% Agree and only 6% Strongly Disagree with the statement that information
available at low cost rather than other technology.
The table and bar chart reveals that majority of people 86% Agree and only 2% Strongly Disagree with the statement that getting information is an easy task in
regards of operating technologies rather than other technology.
II: EXPERT ADVICE AT REAL TIME, WHICH HELPS IN FARM MANAGEMENT AND REDUCES RISK
TABLE 3
Real Time Information Expert Availability Agro Management Risk Management
Strongly Agree 18% 16% 34% 8%
Agree 66% 64% 50% 74%
Neither nor 0% 0% 2% 2%
Disagree 10% 14% 10% 12%
Strongly Disagree 6% 6% 4% 4%
Total 100% 100% 100% 100%
GRAPH 3
The table and bar chart shows that respondents feel after implementation of framework users gets proper solution from geographically far expert at real time
84% user have positive approach is compare to negative of 6% which is strongly disagree with the statement
Graph and table shows that management of Agro business will improve and risk will reduce after upgrading existing system to proposed model. Majority of users
84% agreed and 4% disagreed with the statement.
0%
10%
20%
30%
40%
50%
60%
70%
80%
Fast Communication Low Cost Easy Operation
Strongly Agree
Agree
Neither nor
Disagree
Strongly Disagree
0%
10%
20%
30%
40%
50%
60%
70%
80%
Real Time Information Expert Availability Agro Management Risk Management
Strongly Agree
Agree
Neither nor
Disagree
Strongly Disagree
VOLUME NO. 6 (2016), ISSUE NO. 11 (NOVEMBER) ISSN 2231-1009
INTERNATIONAL JOURNAL OF RESEARCH IN COMPUTER APPLICATION & MANAGEMENT A Monthly Double-Blind Peer Reviewed (Refereed/Juried) Open Access International e-Journal - Included in the International Serial Directories
http://ijrcm.org.in/
6
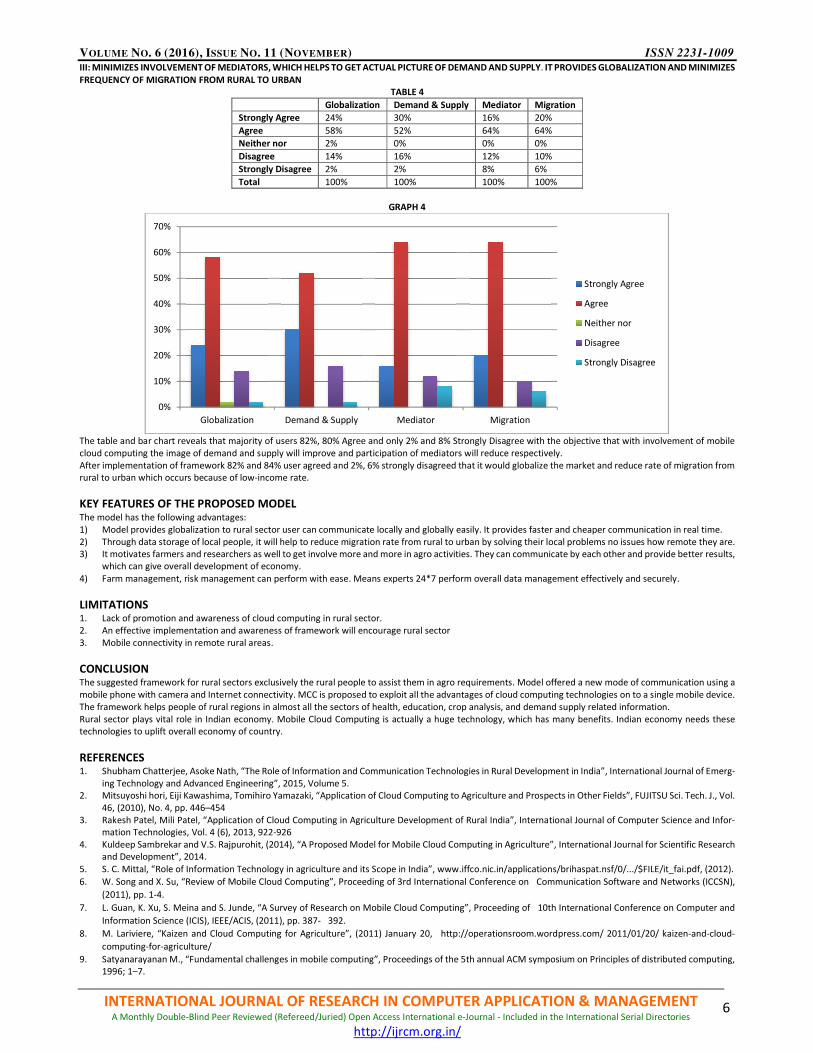
III: MINIMIZES INVOLVEMENT OF MEDIATORS, WHICH HELPS TO GET ACTUAL PICTURE OF DEMAND AND SUPPLY. IT PROVIDES GLOBALIZATION AND MINIMIZES
FREQUENCY OF MIGRATION FROM RURAL TO URBAN
TABLE 4
Globalization Demand & Supply Mediator Migration
Strongly Agree 24% 30% 16% 20%
Agree 58% 52% 64% 64%
Neither nor 2% 0% 0% 0%
Disagree 14% 16% 12% 10%
Strongly Disagree 2% 2% 8% 6%
Total 100% 100% 100% 100%
GRAPH 4
The table and bar chart reveals that majority of users 82%, 80% Agree and only 2% and 8% Strongly Disagree with the objective that with involvement of mobile
cloud computing the image of demand and supply will improve and participation of mediators will reduce respectively.
After implementation of framework 82% and 84% user agreed and 2%, 6% strongly disagreed that it would globalize the market and reduce rate of migration from
rural to urban which occurs because of low-income rate.
KEY FEATURES OF THE PROPOSED MODEL The model has the following advantages:
1) Model provides globalization to rural sector user can communicate locally and globally easily. It provides faster and cheaper communication in real time.
2) Through data storage of local people, it will help to reduce migration rate from rural to urban by solving their local problems no issues how remote they are.
3) It motivates farmers and researchers as well to get involve more and more in agro activities. They can communicate by each other and provide better results,
which can give overall development of economy.
4) Farm management, risk management can perform with ease. Means experts 24*7 perform overall data management effectively and securely.
LIMITATIONS 1. Lack of promotion and awareness of cloud computing in rural sector.
2. An effective implementation and awareness of framework will encourage rural sector
3. Mobile connectivity in remote rural areas.
CONCLUSION The suggested framework for rural sectors exclusively the rural people to assist them in agro requirements. Model offered a new mode of communication using a
mobile phone with camera and Internet connectivity. MCC is proposed to exploit all the advantages of cloud computing technologies on to a single mobile device.
The framework helps people of rural regions in almost all the sectors of health, education, crop analysis, and demand supply related information.
Rural sector plays vital role in Indian economy. Mobile Cloud Computing is actually a huge technology, which has many benefits. Indian economy needs these
technologies to uplift overall economy of country.
REFERENCES 1. Shubham Chatterjee, Asoke Nath, “The Role of Information and Communication Technologies in Rural Development in India”, International Journal of Emerg-
ing Technology and Advanced Engineering”, 2015, Volume 5.
2. Mitsuyoshi hori, Eiji Kawashima, Tomihiro Yamazaki, “Application of Cloud Computing to Agriculture and Prospects in Other Fields”, FUJITSU Sci. Tech. J., Vol.
46, (2010), No. 4, pp. 446–454
3. Rakesh Patel, Mili Patel, “Application of Cloud Computing in Agriculture Development of Rural India”, International Journal of Computer Science and Infor-
mation Technologies, Vol. 4 (6), 2013, 922-926
4. Kuldeep Sambrekar and V.S. Rajpurohit, (2014), “A Proposed Model for Mobile Cloud Computing in Agriculture”, International Journal for Scientific Research
and Development”, 2014.
5. S. C. Mittal, “Role of Information Technology in agriculture and its Scope in India”, www.iffco.nic.in/applications/brihaspat.nsf/0/.../$FILE/it_fai.pdf, (2012).
6. W. Song and X. Su, “Review of Mobile Cloud Computing”, Proceeding of 3rd International Conference on Communication Software and Networks (ICCSN),
(2011), pp. 1-4.
7. L. Guan, K. Xu, S. Meina and S. Junde, “A Survey of Research on Mobile Cloud Computing”, Proceeding of 10th International Conference on Computer and
Information Science (ICIS), IEEE/ACIS, (2011), pp. 387- 392.
8. M. Lariviere, “Kaizen and Cloud Computing for Agriculture”, (2011) January 20, http://operationsroom.wordpress.com/ 2011/01/20/ kaizen-and-cloud-
computing-for-agriculture/
9. Satyanarayanan M., “Fundamental challenges in mobile computing”, Proceedings of the 5th annual ACM symposium on Principles of distributed computing,
1996; 1–7.
0%
10%
20%
30%
40%
50%
60%
70%
Globalization Demand & Supply Mediator Migration
Strongly Agree
Agree
Neither nor
Disagree
Strongly Disagree
VOLUME NO. 6 (2016), ISSUE NO. 11 (NOVEMBER) ISSN 2231-1009
INTERNATIONAL JOURNAL OF RESEARCH IN COMPUTER APPLICATION & MANAGEMENT A Monthly Double-Blind Peer Reviewed (Refereed/Juried) Open Access International e-Journal - Included in the International Serial Directories
http://ijrcm.org.in/
7
10. www.tradeeconomics.com
11. http://statisticstimes.com/economy/quarterly-gdp-growth-of-india.php
12. W. Song and X. Su, “Review of Mobile Cloud Computing”, Proceeding of 3rd International Conference on Communication Software and Networks (ICCSN),
(2011), pp. 1-4.
13. M. Yuan, “Mobile Computing”, Harbin: Harbin Industrialization University, (2008), pp. 2-10. 14. https://cloudanddevopsworld.com/#pane2

VOLUME NO. 6 (2016), ISSUE NO. 11 (NOVEMBER) ISSN 2231-1009
INTERNATIONAL JOURNAL OF RESEARCH IN COMPUTER APPLICATION & MANAGEMENT A Monthly Double-Blind Peer Reviewed (Refereed/Juried) Open Access International e-Journal - Included in the International Serial Directories
http://ijrcm.org.in/
8
EVALUATION OF FINANCIAL PERFORMANCE OF STEEL INDUSTRY OF INDIA
V. KASTHURI
RESEARCH SCHOLAR
DEPARTMENT OF ECONOMICS
ERODE ARTS & SCIENCE COLLEGE
ERODE
DR. R. VENKATACHAM
PRINCIPAL
ERODE ARTS & SCIENCE COLLEGE
ERODE
ABSTRACT Iron and Steel Industry is importance for the economic development of a country in terms of foreign exchange, employment generation, infrastructure development
and technology. It is one of the most energy intensive sectors in Indian economy. The Steel Industry is a fundamental sector for development of nation. The level of
per capita consumption of steel is treated as an important index of the level of socioeconomic development and standard of living of the people in any country. At
present, India is world’s second largest producer of steel. High demand of Iron and steel by sectors like, Infrastructure, Automobile and Real estate have given a
boost to Iron and Steel Industry in India. Combined with huge production to the export of Iron and steel has also grown by 12.5%.
KEYWORDS steel industry, iron industry.
INTRODUCTION teel is fundamental to the development of any nation. The level of per capita consumption of steel is treated as an important index of the level of socio-
economic development and standard of living of the people in any country. It is a product of a large and technologically complex industry having strong
forward and backward linkages in terms of material flows and income generation. All major industrial economies are characterized by the existence of a
strong Iron and Steel Industry and the growth of many of these economies has been largely shaped by the strength of their steel industry in their initial stages of
development. Iron and Steel Industry was revolution in the liberalization of the industrial sector and has made rapid strides since then. The new Greenfield plants
represent the latest in technology.
STATEMENT OF THE PROBLEM Iron and Steel Industry is importance for the economic development of a country in terms of foreign exchange, employment generation, infrastructure develop-
ment and technology. It is one of the most energy intensive sectors in India economy. The government is planning a massive enhancement of the iron and steel
production capacity of India with the modernization of the existing iron and steel plants.
OBJECTIVES OF THE STUDY 1. To evaluate the financial performance of Steel Industry in India.
2. To measure the liquidity position of Steel Industry in India.
3. To analyze the profitability position of Steel Industry in India.
HYPOTHESES OF THE STUDY In the light of objectives, the hypotheses of the study are as follows:
H1: There is no significant impact of sales on liquidity position of Steel Industry in India.
H2: There is no significant impact of sales on profitability position of Steel Industry in India.
H3: There is no significant impact of sales on solvency position of Steel Industry in India.
The term ‘financial performance analysis also known as analysis and interpretation of financial statements’, refers to the process of determining financial strength
and weaknesses of the firm by establishing strategic relationship between the items of the balance sheet, profit and loss account and other operative data.
“Financial performance analysis is a process of evaluating the relationship between component parts of a financial statement to obtain a better understanding of
a firm’s position and performance. The purpose of financial analysis is to diagnose the information contained in financial statements so as to judge the profitability
and financial soundness of the firm. Just like a doctor examines his patient by recording his body temperature, blood pressure etc. Before making this conclusion,
regarding the illness and before giving his treatment.
A financial analyst analyses the financial statements with various tools of analysis before commenting upon the financial health or weaknesses of an enterprise.
The analysis and interpretation of financial statements is essential to bring out the mystery behind the figures in financial statements. Financial statements analysis
is an attempt to determine the significance and meaning of the financial statement data so that forecast may be made of the future earnings, ability to pay interest
and debt maturities (both current and long term) and profitability of a sound divided policy.
Financial performance refers to the act of performing financial activity. In broader sense, financial performance refers to the degree to which financial objectives
being or has been accomplished. It is the process of measuring the results of a firm's policies and operations in monetary terms. It is used to measure firm's overall
financial health over a given period of time and can also be used to compare similar firms across the same industry or to compare industries or sectors in aggre-
gation. In short, the firm itself as well as various interested groups such as managers, shareholders, creditors, tax authorities, and others.
Ratio analysis is a technique of analysis and interpretation of financial statement. It is the process of establishing and interpreting various ratios for helping in
making certain decisions. It is the only means of better understanding of financial strengths and weakness of a firm.
There are various ratios which can be calculated from the information given in the financial statements, but in the study we select the appropriate data and
calculate only a few appropriate ratios. The important ratios taken are liquidity ratio, long term solvency activity and profitability ratios. To measure firm's overall
financial health over a given period of time and can also be used to compare similar firms across the same industry or to compare industries or sectors in aggre-
gation. In short, the firm itself as well as various interested groups such as managers, shareholders, creditors, tax authorities, and others.
Ratio analysis is a technique of analysis and interpretation of financial statement. It is the process of establishing and interpreting various ratios for helping in
making certain decisions. It is the only means of better understanding of financial strengths and weakness of a firm. There are various ratios which can be calculated
S

VOLUME NO. 6 (2016), ISSUE NO. 11 (NOVEMBER) ISSN 2231-1009
INTERNATIONAL JOURNAL OF RESEARCH IN COMPUTER APPLICATION & MANAGEMENT A Monthly Double-Blind Peer Reviewed (Refereed/Juried) Open Access International e-Journal - Included in the International Serial Directories
http://ijrcm.org.in/
9
from the information given in the financial statements, but in the study we select the appropriate data and calculate only a few appropriate ratios. The important
ratios taken are liquidity ratio, long term solvency activity and profitability ratios.
RESEARCH DESIGN Research design constitutes the blueprint for the collection, measurement and analysis of data. The research applied in the study is Analytical Research Design.
Analytical study is a system of procedures and techniques of analysis applied to quantitative data. It may consist of a system of mathematical models or statistical
techniques applicable to numeric data.
SOURCES OF DATA
For the study secondary data is used. The data are collected from the Centre for Monitoring the Indian economy (CMIE), journals, magazine, Bulletins, library
sources.
DATA ANALYSIS
The Performance analysis of select Iron and Steel Industry in India were analyzed for the period of ten years from 2006-07 to 2015-2016 with the help of the
following tools and techniques.
TOOLS USED FOR THE STUDY
In order to “Evaluation of financial performance of steel industry of India, a number of financial and statistical tools have been applied. Financial tools include
liquidity, profitability and solvency ratios have been applied.
OPERATIONAL DEFINITIONS
Current Ratio: The current ratio is a liquidity ratio which estimates the ability of a company to pay back short-term obligations. This ratio is also known as cash
asset ratio, cash ratio, and liquidity ratio. A higher current ratio indicates the higher capability of a company to pay back its debts. The formula used for computing
current ratio is: current Assets / current liabilities.
Quick Ratio: The quick ratio also referred as the “acid test ratio” or the “quick assets ratio”, this ratio is a gauge of the short term liquidity of a firm. The quick ratio
is helpful in measuring a company’s short term debts with its most liquid assets.
Debt-to-equity ratio: The debt-to-equity ratio is quantification of a firm’s financial leverage estimated by dividing the total liabilities by stockholders’ equity. This
ratio indicates the proportion of equity and debt used by the company to finance its assets.
Interest Coverage ratio: Measures your ability to meet interest payment obligations with business income. Ratios close to 1 indicates company having difficulty
generating enough cash flow to pay interest on its debt. Ideally, a ratio should be over 1.5.
Net profit ratio (NP ratio) is a popular profitability ratio that shows relationship between net profit after tax and net sales. It is computed by dividing the net profit
(after tax) by net sales. For the purpose of this ratio, net profit is equal to gross profit minus operating expenses and income tax. All non-operating revenues and
expenses are not taken into account because the purpose of this ratio is to evaluate the profitability of the business from its primary operations. Examples of non-
operating revenues include interest on investments and income from sale of fixed assets. Examples of non-operating expenses include interest on loan and loss
on sale of assets.
REVIEW OF LITERATURE Anshan Lakshmi (2003) “A Study of the Financial Performance with Reference to Steel Industries Kerala Ltd”. This study covered from 1977- 1998 to 2001-2002,
the objectives of the study was to analyze and evaluate the working capital management, to analyze the liquidity position of the company, to evaluate the receiv-
ables, payables and cash management and to suggest ways and means to improve the present date of working capital. The major tools used for the analysis say
that the working capital management was every author suggested that the inventory management have to be corrected.
Bardia (2004) in the study on “Liquidity and Management – A case study of Steel Authority of India Limited” analyzed the management of liquidity position of
Steel Authority of India Limited, one of the largest public sector steel manufacturing companies of India for the period 1991-92 to 2001-02. The study assessed the
liquidity maintained by the steel giant and examined the liquidity position of the company based on some important parameters mainly employed for measuring
liquidity. The study has applied comprehensive rank test for comparing the liquidity position of the company. Spearman’s rank correlation has been applied to
extent of relationship between liquidity and profitability. The study concluded that the liquidity and profitability more in the same direction and Spearman’s rank
correlation coefficient and students ‘t’ test showed a significant positive association between liquidity and profitability of the company during the period under
study.
Sudipta Ghosh (2008) has conducted a case study in liquidity management of Tata Iron and Steel Company (TISCO). During the period of the study, it was found
that the liquidity position of the company, on the basis of current ratio as well as quick ratio, was not satisfactory. It indicated that the share of current assets in
total assets of the company, on an average, was 29.1 percent during the period of study. The fluctuation in the liquidity position over different years of the study
period might be a point for investigation into the financial efforts of the company. It was suggested that to maintain overall control of liquidity position, the
company should give special attention to the management of current assets. He found that the degree of influence of liquidity on its profitability was low and
insignificant.
Khatik S.K, Varghese Titto (2013) “Financial analysis of steel authority of India limited” states that financial analysis is used to analyze whether an entity is stable,
solvent, liquid or profitable enough to be invested in financial analysis is just like doctor who examine the fitness of the human body. For analysis of the financial
position of the SAIL, gross profit ratio, net profit and operating ratio, productivity investment and solvency ratios are calculated.
Asha Sharma (2013) his study examined that impact on liquidity as well profitability. The impact on effectiveness and profitability of working capital was tried to
find out by measuring the fluctuation in fixed assets, current assets and sales. For this purpose, conducted five years’ data from 2008 to 2012 of two major
companies in public and private sector of steel industry like Steel Authority of India and Tata Steel Ltd., was undertaken. SAIL and TCS had perfect correlation
between its fixed and current ratio and as well they had a perfect correlation with its liquidity and profitability. Keeping in view the miniature amount of finance
literature, particularly in profitability, liquidity and working capital, the present study investigates the relationship of the aggressive and conservative financial
performance analysis and financial polices and how its impact on profitability. It further examines that efficiency of working capital utilization among the working
capital practices of the firms across the different industries.
PROFILE OF THE STEEL INDUSTRY
Steel is considered to be the backbone for the development of modern economy and human civilization. The level of consumption of steel is considered as a vital
index to measure the socio-economic development and standard life of people of the country. This product is the outcome of the large and technological complex
industry poisoning in terms of material flows and incomes that are strong. The economic status of industries is strong ended by the existence of strong steel
industry and the development of these industries at the initial stage is shaped by the steel industry. Industrial sector has made rapid steps with the help of steel
industry using it as vanguards. The latest technology used by the green field plant has increased the output and the industry has improved the global economy.
The new plants have also brought a great regional dispersion in the western region and earned the domestic supply position. The domestic steel industry has faced
new challenges and due to the high cost of commissioning of new projects, the developed markets face many problems. The domestic demand too has not
improved to significant level. The litmus test of the steel industry will be to surmount these difficulties and remain globally competitive.
ANALYSIS AND INTERPRETATION On the basis of secondary data which have been taken from the Centre for Monitoring the Indian economy (CMIE), the results of the present study are presented
here as under:

VOLUME NO. 6 (2016), ISSUE NO. 11 (NOVEMBER) ISSN 2231-1009
INTERNATIONAL JOURNAL OF RESEARCH IN COMPUTER APPLICATION & MANAGEMENT A Monthly Double-Blind Peer Reviewed (Refereed/Juried) Open Access International e-Journal - Included in the International Serial Directories
http://ijrcm.org.in/
10
TABLE 1: ACCOUNTING RATIOS OF STEEL INDUSTRY IN INDIA
Year CR LR NPR DER ICR
2006 1.08 0.71 0.09 1.22 1.82
2007 1.22 0.87 0.16 1.04 1.90
2008 1.12 0.74 0.17 1.05 1.92
2009 0.95 0.61 0.13 1.11 1.61
2010 0.97 0.63 0.13 1.04 1.76
2011 1.01 0.56 0.08 1.04 1.67
2012 0.93 0.47 0.09 1.03 1.47
2013 0.88 0.43 0.08 1.17 1.24
2014 0.76 0.36 0.05 1.27 1.24
2015 0.75 0.35 0.06 1.27 1.23
Source: Centre for Monitoring the Indian economy from 2006-07 to 2015-16.
CR = Current Ratio, DER = Debt Equity Ratio, LR = Liquid Ratio, ICR = Interest Coverage Ratio, NPR = Net Profit Ratio
Table 1 presents the description of financial ratios of Steel Industry of India from 2006-07 to 2015-16. Liquidity position was seemingly not good during study
period as it was below to standard. Profitability position has been measure with the help of net profit ratio. It was 0.09 per cent in 2006-07. In 2015-16, profitability
position of the industry is declined as net profit ratio was per cent 0.03 per cent. It shows a decreasing trend in rest of the study period. Solvency position of steel
industry of India has been checked through debt equity ratio. It shows a positive trend of solvency because of positive shareholder’s fund during the study period.
The industry is managing its shareholder’s fund during the study period. During the study period interest coverage ratio suggests a company can comfortably
afford to pay for its debt.
FIGURE 1: CURRENT RATIO OF STEEL INDUSTRY OF INDIA
Source: Centre for Monitoring the Indian economy from 2006-07 to 2015-16.
The above figure presents the trend of current of Steel Industry of India from 2006-07 to 2015-16. It was 1.08 times in 2006-07 which fluctuate during the study
period and reached to 0.75 times in 2015-16.
FIGURE 2: LIQUID RATIO OF STEEL INDUSTRY OF INDIA
Source: Centre for Monitoring the Indian economy from 2006-07 to 2015-16.
The above figure shows the liquid ratio of Steel Industry of India from 2006-07 to 2015-16. Liquid ratio was 0.71 times in 2006-07 the next year liquidity position
has increased. After that it shows decreasing trend in rest of the study period.
FIGURE 3: NET PROFIT RATIO OF STEEL INDUSTRY OF INDIA
Source: Centre for Monitoring the Indian economy from 2006-07 to 2015-16.
1.081.22
1.12
0.95 0.97 1.010.93 0.88
0.76 0.75
0
0.2
0.4
0.6
0.8
1
1.2
1.4
2006 2007 2008 2009 2010 2011 2012 2013 2014 2015
Current Ratio
0.71
0.87
0.74
0.61 0.630.56
0.470.43
0.36 0.35
0
0.2
0.4
0.6
0.8
1
2006 2007 2008 2009 2010 2011 2012 2013 2014 2015
Liquid Ratio
0.090.10 0.11
0.07
0.090.08
0.05
0.03 0.03 0.03
0.00
0.02
0.04
0.06
0.08
0.10
0.12
2006 2007 2008 2009 2010 2011 2012 2013 2014 2015
Net Profit Ratio

VOLUME NO. 6 (2016), ISSUE NO. 11 (NOVEMBER) ISSN 2231-1009
INTERNATIONAL JOURNAL OF RESEARCH IN COMPUTER APPLICATION & MANAGEMENT A Monthly Double-Blind Peer Reviewed (Refereed/Juried) Open Access International e-Journal - Included in the International Serial Directories
http://ijrcm.org.in/
11
Figure 3 shows the net profit ratio of Steel Industry of India from 2006-07 to 2015-16. Instead of negative shareholders fund the company earned positive profit
during the study period. From 2006-07 to 2010-11 increasing trend except 2009-10. In remaining study period net profit ratio was decline and finally it reached to
0.03 in 2015-16.
FIGURE 4: DEBT EQUITY RATIO OF STEEL INDUSTRY OF INDIA
Source: Centre for Monitoring the Indian economy from 2006-07 to 2015-16.
Figure 4 shows the trend of debt equity of Steel Industry of India from 2006-07 to 2015-16. The trend shows a positive trend during the study period. The reason
behind the positive debt equity ratio is because of positive shareholders fund. It was 1.22 in 2006-07 which is decreased up to 2008-09. During 2009-10 debt equity
ratio was increased. After that debt equity ratio was declined and finally it was reached to 1.27 in 2015-16.
FIGURE 5: INTEREST COVERAGE RATIO OF STEEL INDUSTRY OF INDIA
Source: Centre for Monitoring the Indian economy from 2006-07 to 2015-16.
The above figure shows the interest coverage ratio of Steel Industry of India from 2006-07 to 2015-16. It indicates the ability of company to pay its interest charges
the trend of ICR shows that the industry generates its adequate profit to pay interest charges. It was 1.82 times in 2006-07 which reached to 1.23 times in 2015-
16. Initially interest coverage ratio was increased after 2009-10 some fluctuation in given ratio.
TABLE 2: DESCRIPTIVE STATISTICS OF SALES AND FINANCIAL RATIOS OF STEEL INDUSTRY OF INDIA
Descriptive Statistics
Mean Std. Deviation N
SALES 225134.46 55953.28 10
CR 0.96 0.14 10
LR 0.57 0.17 10
NPR 0.06 0.03 10
DER 1.12 0.09 10
ICR 1.58 0.27 10
Source: Centre for Monitoring the Indian economy from 2006-07 to 2015-16.
Table 2 presents the statistical description of sales and different accounting ratios of Steel industry of India from 2006-07 to 2015-16. The mean value of sales was
Rs. 225134.46 during the study period and standard deviation of sales was 55953.28. The mean value of liquidity ratio was 0.57 during the study period while debt
equity ratio shows a positive mean value of 1.12 indicated positive shareholder’s fund.
TABLE 3: CORRELATIONS BETWEEN SALES AND CURRENT RATIO OF STEEL INDUSTRY OF INDIA FROM 2006-07 TO 2015-16
Correlation
CR SALES
Pearson Correlation CR 1.000 -.834
SALES -.834 1.000
Sign (2 tailed) CR .003
SALES .003
N CR 10 10
SALES 10 10
Source: CMIE
Table 3 presents the correlation between sales and current ratio of Steel Industry of India from 2006-07 to 2015-16. From the analysis it is cleared that there is a
negative relationship exists between sales and current ratio of the industry. The value of correlation is 0.834 which indicates that there is a strong negative
correlation among these variables.
1.22
1.04 1.051.11
1.04 1.04 1.03
1.171.27 1.27
0
0.2
0.4
0.6
0.8
1
1.2
1.4
2006 2007 2008 2009 2010 2011 2012 2013 2014 2015
Debt-Equity Ratio
1.82 1.90 1.92
1.611.76 1.67
1.471.24 1.24 1.23
0.00
0.50
1.00
1.50
2.00
2.50
2006 2007 2008 2009 2010 2011 2012 2013 2014 2015
Interest Coverage Ratio
VOLUME NO. 6 (2016), ISSUE NO. 11 (NOVEMBER) ISSN 2231-1009
INTERNATIONAL JOURNAL OF RESEARCH IN COMPUTER APPLICATION & MANAGEMENT A Monthly Double-Blind Peer Reviewed (Refereed/Juried) Open Access International e-Journal - Included in the International Serial Directories
http://ijrcm.org.in/
12
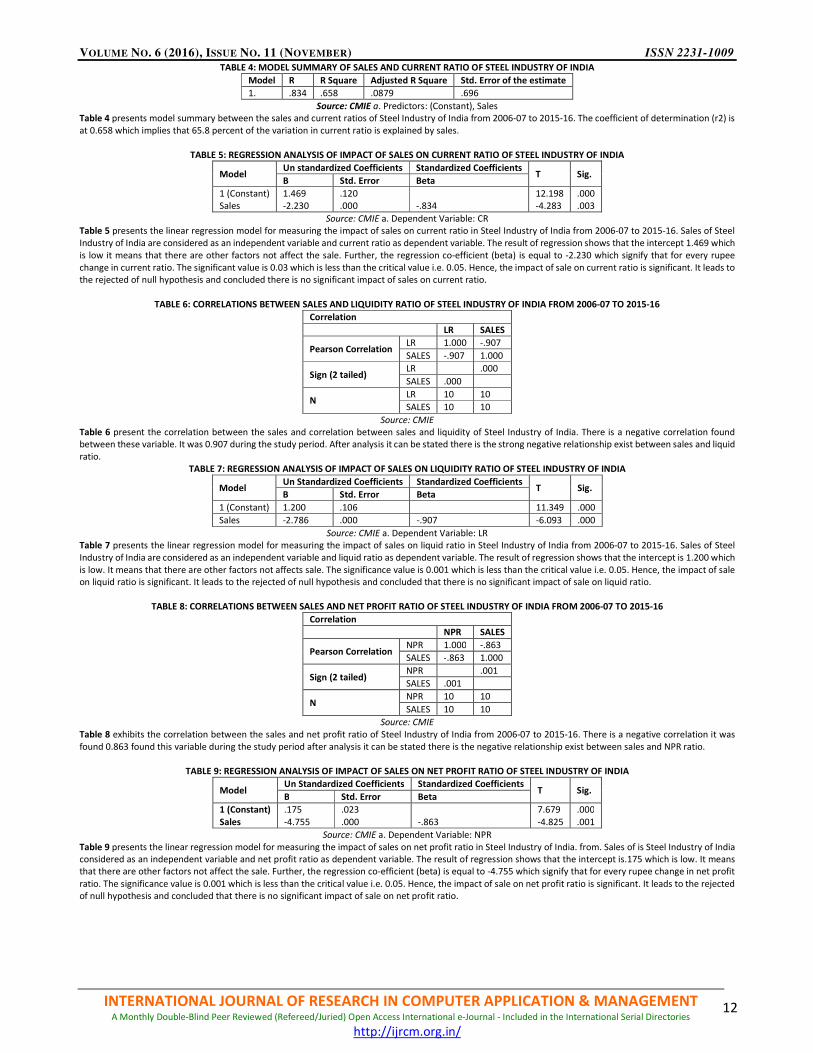
TABLE 4: MODEL SUMMARY OF SALES AND CURRENT RATIO OF STEEL INDUSTRY OF INDIA
Model R R Square Adjusted R Square Std. Error of the estimate
1. .834 .658 .0879 .696
Source: CMIE a. Predictors: (Constant), Sales
Table 4 presents model summary between the sales and current ratios of Steel Industry of India from 2006-07 to 2015-16. The coefficient of determination (r2) is
at 0.658 which implies that 65.8 percent of the variation in current ratio is explained by sales.
TABLE 5: REGRESSION ANALYSIS OF IMPACT OF SALES ON CURRENT RATIO OF STEEL INDUSTRY OF INDIA
Model Un standardized Coefficients Standardized Coefficients
T Sig. B Std. Error Beta
1 (Constant)
Sales
1.469
-2.230
.120
.000
-.834
12.198
-4.283
.000
.003
Source: CMIE a. Dependent Variable: CR
Table 5 presents the linear regression model for measuring the impact of sales on current ratio in Steel Industry of India from 2006-07 to 2015-16. Sales of Steel
Industry of India are considered as an independent variable and current ratio as dependent variable. The result of regression shows that the intercept 1.469 which
is low it means that there are other factors not affect the sale. Further, the regression co-efficient (beta) is equal to -2.230 which signify that for every rupee
change in current ratio. The significant value is 0.03 which is less than the critical value i.e. 0.05. Hence, the impact of sale on current ratio is significant. It leads to
the rejected of null hypothesis and concluded there is no significant impact of sales on current ratio.
TABLE 6: CORRELATIONS BETWEEN SALES AND LIQUIDITY RATIO OF STEEL INDUSTRY OF INDIA FROM 2006-07 TO 2015-16
Correlation
LR SALES
Pearson Correlation LR 1.000 -.907
SALES -.907 1.000
Sign (2 tailed) LR .000
SALES .000
N LR 10 10
SALES 10 10
Source: CMIE
Table 6 present the correlation between the sales and correlation between sales and liquidity of Steel Industry of India. There is a negative correlation found
between these variable. It was 0.907 during the study period. After analysis it can be stated there is the strong negative relationship exist between sales and liquid
ratio.
TABLE 7: REGRESSION ANALYSIS OF IMPACT OF SALES ON LIQUIDITY RATIO OF STEEL INDUSTRY OF INDIA
Model Un Standardized Coefficients Standardized Coefficients
T Sig. B Std. Error Beta
1 (Constant) 1.200 .106 11.349 .000
Sales -2.786 .000 -.907 -6.093 .000
Source: CMIE a. Dependent Variable: LR
Table 7 presents the linear regression model for measuring the impact of sales on liquid ratio in Steel Industry of India from 2006-07 to 2015-16. Sales of Steel
Industry of India are considered as an independent variable and liquid ratio as dependent variable. The result of regression shows that the intercept is 1.200 which
is low. It means that there are other factors not affects sale. The significance value is 0.001 which is less than the critical value i.e. 0.05. Hence, the impact of sale
on liquid ratio is significant. It leads to the rejected of null hypothesis and concluded that there is no significant impact of sale on liquid ratio.
TABLE 8: CORRELATIONS BETWEEN SALES AND NET PROFIT RATIO OF STEEL INDUSTRY OF INDIA FROM 2006-07 TO 2015-16
Correlation
NPR SALES
Pearson Correlation NPR 1.000 -.863
SALES -.863 1.000
Sign (2 tailed) NPR .001
SALES .001
N NPR 10 10
SALES 10 10
Source: CMIE
Table 8 exhibits the correlation between the sales and net profit ratio of Steel Industry of India from 2006-07 to 2015-16. There is a negative correlation it was
found 0.863 found this variable during the study period after analysis it can be stated there is the negative relationship exist between sales and NPR ratio.
TABLE 9: REGRESSION ANALYSIS OF IMPACT OF SALES ON NET PROFIT RATIO OF STEEL INDUSTRY OF INDIA
Model Un Standardized Coefficients Standardized Coefficients
T Sig. B Std. Error Beta
1 (Constant)
Sales
.175
-4.755
.023
.000
-.863
7.679
-4.825
.000
.001
Source: CMIE a. Dependent Variable: NPR
Table 9 presents the linear regression model for measuring the impact of sales on net profit ratio in Steel Industry of India. from. Sales of is Steel Industry of India
considered as an independent variable and net profit ratio as dependent variable. The result of regression shows that the intercept is.175 which is low. It means
that there are other factors not affect the sale. Further, the regression co-efficient (beta) is equal to -4.755 which signify that for every rupee change in net profit
ratio. The significance value is 0.001 which is less than the critical value i.e. 0.05. Hence, the impact of sale on net profit ratio is significant. It leads to the rejected
of null hypothesis and concluded that there is no significant impact of sale on net profit ratio.
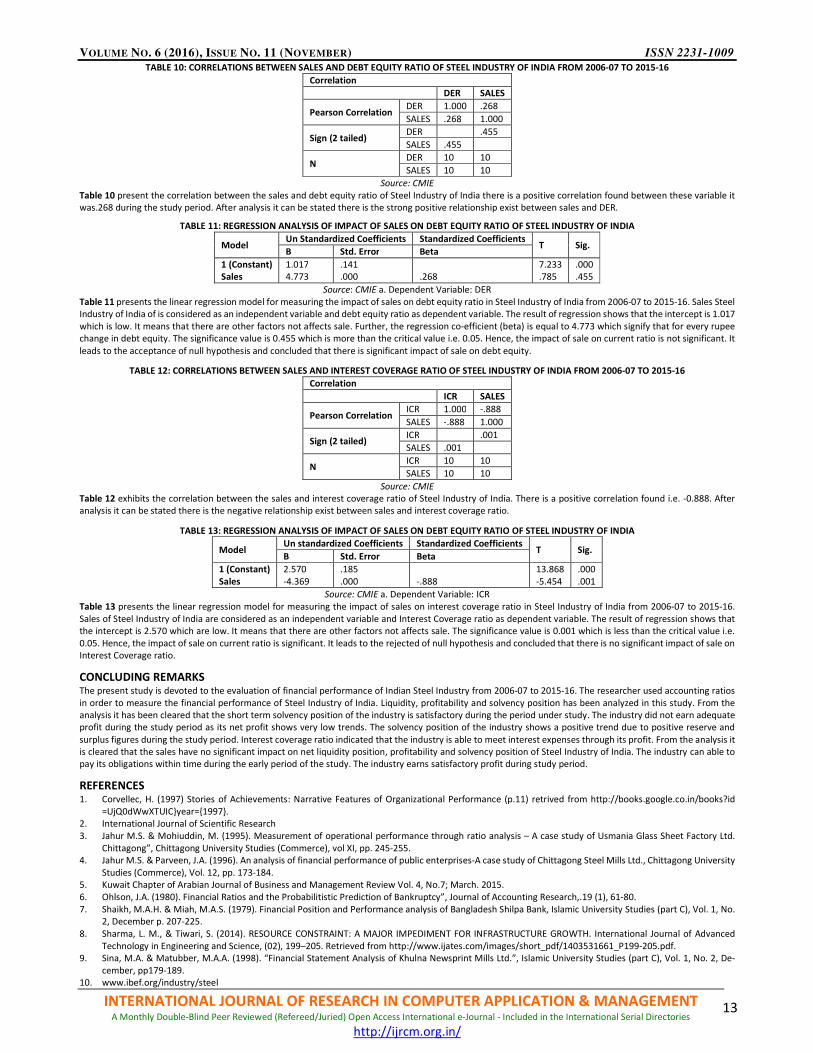
VOLUME NO. 6 (2016), ISSUE NO. 11 (NOVEMBER) ISSN 2231-1009
INTERNATIONAL JOURNAL OF RESEARCH IN COMPUTER APPLICATION & MANAGEMENT A Monthly Double-Blind Peer Reviewed (Refereed/Juried) Open Access International e-Journal - Included in the International Serial Directories
http://ijrcm.org.in/
13
TABLE 10: CORRELATIONS BETWEEN SALES AND DEBT EQUITY RATIO OF STEEL INDUSTRY OF INDIA FROM 2006-07 TO 2015-16
Correlation
DER SALES
Pearson Correlation DER 1.000 .268
SALES .268 1.000
Sign (2 tailed) DER .455
SALES .455
N DER 10 10
SALES 10 10
Source: CMIE
Table 10 present the correlation between the sales and debt equity ratio of Steel Industry of India there is a positive correlation found between these variable it
was.268 during the study period. After analysis it can be stated there is the strong positive relationship exist between sales and DER.
TABLE 11: REGRESSION ANALYSIS OF IMPACT OF SALES ON DEBT EQUITY RATIO OF STEEL INDUSTRY OF INDIA
Model Un Standardized Coefficients Standardized Coefficients
T Sig. B Std. Error Beta
1 (Constant)
Sales
1.017
4.773
.141
.000
.268
7.233
.785
.000
.455
Source: CMIE a. Dependent Variable: DER
Table 11 presents the linear regression model for measuring the impact of sales on debt equity ratio in Steel Industry of India from 2006-07 to 2015-16. Sales Steel
Industry of India of is considered as an independent variable and debt equity ratio as dependent variable. The result of regression shows that the intercept is 1.017
which is low. It means that there are other factors not affects sale. Further, the regression co-efficient (beta) is equal to 4.773 which signify that for every rupee
change in debt equity. The significance value is 0.455 which is more than the critical value i.e. 0.05. Hence, the impact of sale on current ratio is not significant. It
leads to the acceptance of null hypothesis and concluded that there is significant impact of sale on debt equity.
TABLE 12: CORRELATIONS BETWEEN SALES AND INTEREST COVERAGE RATIO OF STEEL INDUSTRY OF INDIA FROM 2006-07 TO 2015-16
Correlation
ICR SALES
Pearson Correlation ICR 1.000 -.888
SALES -.888 1.000
Sign (2 tailed) ICR .001
SALES .001
N ICR 10 10
SALES 10 10
Source: CMIE
Table 12 exhibits the correlation between the sales and interest coverage ratio of Steel Industry of India. There is a positive correlation found i.e. -0.888. After
analysis it can be stated there is the negative relationship exist between sales and interest coverage ratio.
TABLE 13: REGRESSION ANALYSIS OF IMPACT OF SALES ON DEBT EQUITY RATIO OF STEEL INDUSTRY OF INDIA
Model Un standardized Coefficients Standardized Coefficients
T Sig. B Std. Error Beta
1 (Constant)
Sales
2.570
-4.369
.185
.000
-.888
13.868
-5.454
.000
.001
Source: CMIE a. Dependent Variable: ICR
Table 13 presents the linear regression model for measuring the impact of sales on interest coverage ratio in Steel Industry of India from 2006-07 to 2015-16.
Sales of Steel Industry of India are considered as an independent variable and Interest Coverage ratio as dependent variable. The result of regression shows that
the intercept is 2.570 which are low. It means that there are other factors not affects sale. The significance value is 0.001 which is less than the critical value i.e.
0.05. Hence, the impact of sale on current ratio is significant. It leads to the rejected of null hypothesis and concluded that there is no significant impact of sale on
Interest Coverage ratio.
CONCLUDING REMARKS The present study is devoted to the evaluation of financial performance of Indian Steel Industry from 2006-07 to 2015-16. The researcher used accounting ratios
in order to measure the financial performance of Steel Industry of India. Liquidity, profitability and solvency position has been analyzed in this study. From the
analysis it has been cleared that the short term solvency position of the industry is satisfactory during the period under study. The industry did not earn adequate
profit during the study period as its net profit shows very low trends. The solvency position of the industry shows a positive trend due to positive reserve and
surplus figures during the study period. Interest coverage ratio indicated that the industry is able to meet interest expenses through its profit. From the analysis it
is cleared that the sales have no significant impact on net liquidity position, profitability and solvency position of Steel Industry of India. The industry can able to
pay its obligations within time during the early period of the study. The industry earns satisfactory profit during study period.
REFERENCES 1. Corvellec, H. (1997) Stories of Achievements: Narrative Features of Organizational Performance (p.11) retrived from http://books.google.co.in/books?id
=UjQ0dWwXTUIC}year={1997}.
2. International Journal of Scientific Research
3. Jahur M.S. & Mohiuddin, M. (1995). Measurement of operational performance through ratio analysis – A case study of Usmania Glass Sheet Factory Ltd.
Chittagong”, Chittagong University Studies (Commerce), vol XI, pp. 245-255.
4. Jahur M.S. & Parveen, J.A. (1996). An analysis of financial performance of public enterprises-A case study of Chittagong Steel Mills Ltd., Chittagong University
Studies (Commerce), Vol. 12, pp. 173-184.
5. Kuwait Chapter of Arabian Journal of Business and Management Review Vol. 4, No.7; March. 2015.
6. Ohlson, J.A. (1980). Financial Ratios and the Probabilitistic Prediction of Bankruptcy”, Journal of Accounting Research,.19 (1), 61-80.
7. Shaikh, M.A.H. & Miah, M.A.S. (1979). Financial Position and Performance analysis of Bangladesh Shilpa Bank, Islamic University Studies (part C), Vol. 1, No.
2, December p. 207-225.
8. Sharma, L. M., & Tiwari, S. (2014). RESOURCE CONSTRAINT: A MAJOR IMPEDIMENT FOR INFRASTRUCTURE GROWTH. International Journal of Advanced
Technology in Engineering and Science, (02), 199–205. Retrieved from http://www.ijates.com/images/short_pdf/1403531661_P199-205.pdf.
9. Sina, M.A. & Matubber, M.A.A. (1998). “Financial Statement Analysis of Khulna Newsprint Mills Ltd.”, Islamic University Studies (part C), Vol. 1, No. 2, De-
cember, pp179-189.
10. www.ibef.org/industry/steel
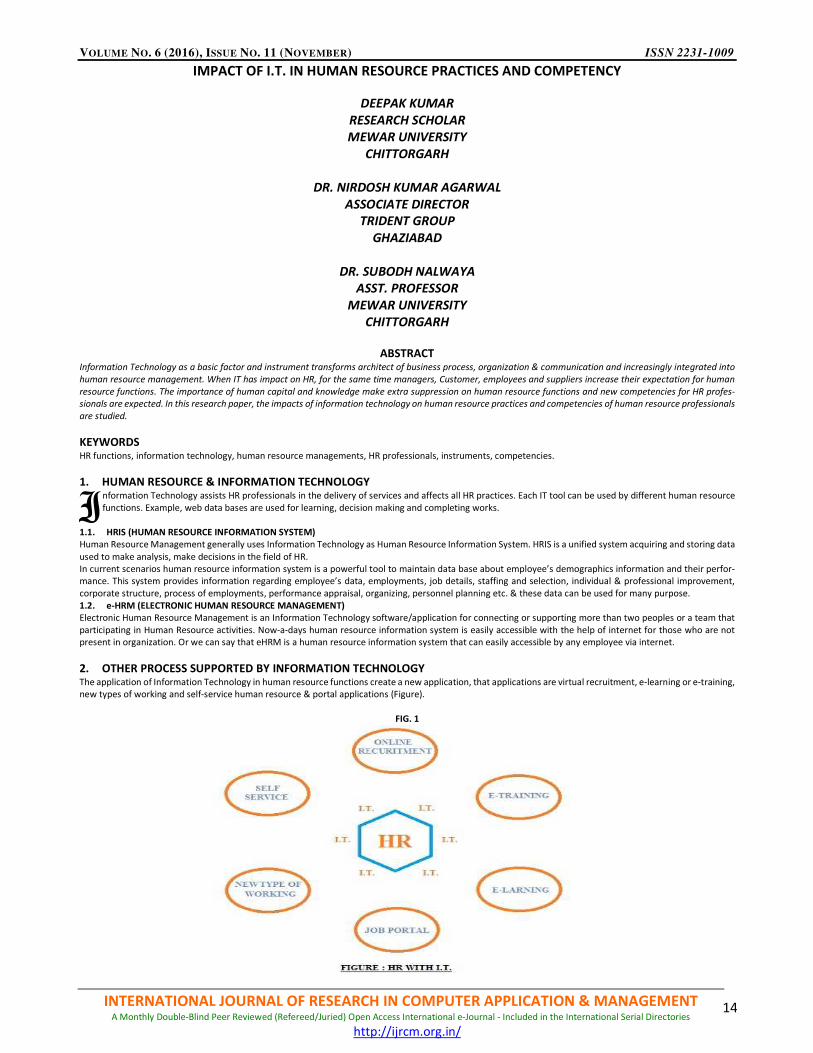
VOLUME NO. 6 (2016), ISSUE NO. 11 (NOVEMBER) ISSN 2231-1009
INTERNATIONAL JOURNAL OF RESEARCH IN COMPUTER APPLICATION & MANAGEMENT A Monthly Double-Blind Peer Reviewed (Refereed/Juried) Open Access International e-Journal - Included in the International Serial Directories
http://ijrcm.org.in/
14
IMPACT OF I.T. IN HUMAN RESOURCE PRACTICES AND COMPETENCY
DEEPAK KUMAR
RESEARCH SCHOLAR
MEWAR UNIVERSITY
CHITTORGARH
DR. NIRDOSH KUMAR AGARWAL
ASSOCIATE DIRECTOR
TRIDENT GROUP
GHAZIABAD
DR. SUBODH NALWAYA
ASST. PROFESSOR
MEWAR UNIVERSITY
CHITTORGARH
ABSTRACT Information Technology as a basic factor and instrument transforms architect of business process, organization & communication and increasingly integrated into
human resource management. When IT has impact on HR, for the same time managers, Customer, employees and suppliers increase their expectation for human
resource functions. The importance of human capital and knowledge make extra suppression on human resource functions and new competencies for HR profes-
sionals are expected. In this research paper, the impacts of information technology on human resource practices and competencies of human resource professionals
are studied.
KEYWORDS HR functions, information technology, human resource managements, HR professionals, instruments, competencies.
1. HUMAN RESOURCE & INFORMATION TECHNOLOGY nformation Technology assists HR professionals in the delivery of services and affects all HR practices. Each IT tool can be used by different human resource
functions. Example, web data bases are used for learning, decision making and completing works.
1.1. HRIS (HUMAN RESOURCE INFORMATION SYSTEM)
Human Resource Management generally uses Information Technology as Human Resource Information System. HRIS is a unified system acquiring and storing data
used to make analysis, make decisions in the field of HR.
In current scenarios human resource information system is a powerful tool to maintain data base about employee’s demographics information and their perfor-
mance. This system provides information regarding employee’s data, employments, job details, staffing and selection, individual & professional improvement,
corporate structure, process of employments, performance appraisal, organizing, personnel planning etc. & these data can be used for many purpose.
1.2. e-HRM (ELECTRONIC HUMAN RESOURCE MANAGEMENT)
Electronic Human Resource Management is an Information Technology software/application for connecting or supporting more than two peoples or a team that
participating in Human Resource activities. Now-a-days human resource information system is easily accessible with the help of internet for those who are not
present in organization. Or we can say that eHRM is a human resource information system that can easily accessible by any employee via internet.
2. OTHER PROCESS SUPPORTED BY INFORMATION TECHNOLOGY The application of Information Technology in human resource functions create a new application, that applications are virtual recruitment, e-learning or e-training,
new types of working and self-service human resource & portal applications (Figure).
FIG. 1
I
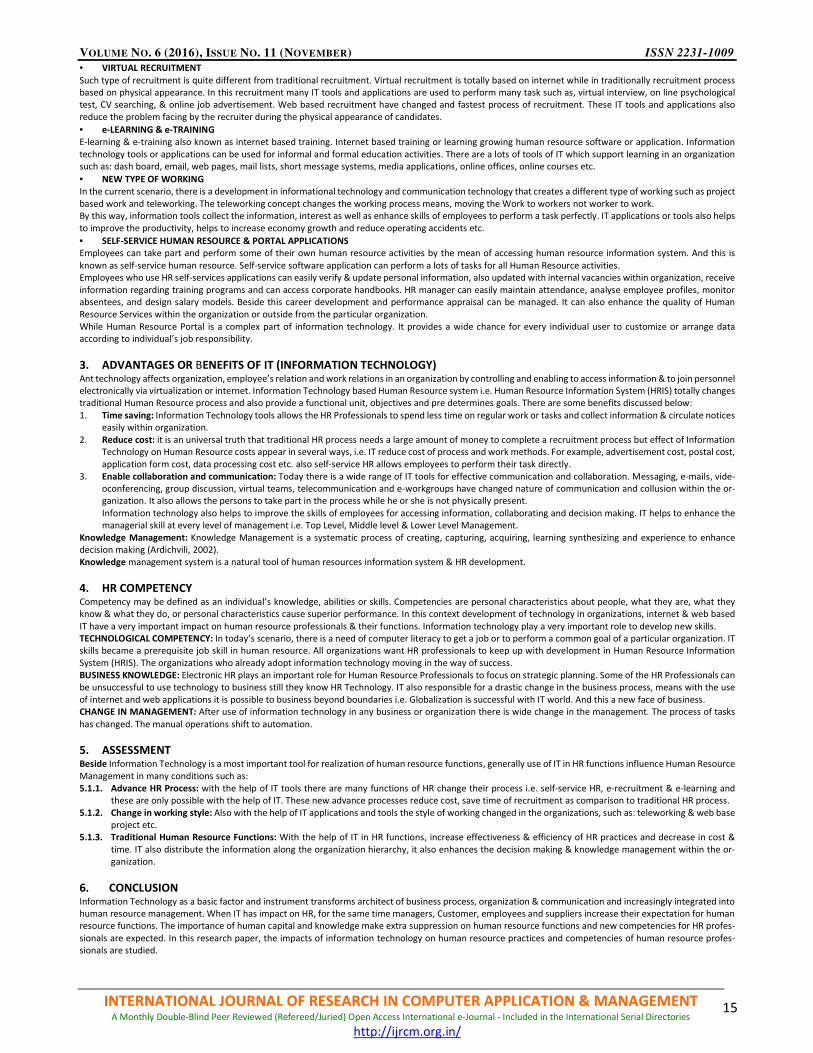
VOLUME NO. 6 (2016), ISSUE NO. 11 (NOVEMBER) ISSN 2231-1009
INTERNATIONAL JOURNAL OF RESEARCH IN COMPUTER APPLICATION & MANAGEMENT A Monthly Double-Blind Peer Reviewed (Refereed/Juried) Open Access International e-Journal - Included in the International Serial Directories
http://ijrcm.org.in/
15
• VIRTUAL RECRUITMENT
Such type of recruitment is quite different from traditional recruitment. Virtual recruitment is totally based on internet while in traditionally recruitment process
based on physical appearance. In this recruitment many IT tools and applications are used to perform many task such as, virtual interview, on line psychological
test, CV searching, & online job advertisement. Web based recruitment have changed and fastest process of recruitment. These IT tools and applications also
reduce the problem facing by the recruiter during the physical appearance of candidates.
• e-LEARNING & e-TRAINING
E-learning & e-training also known as internet based training. Internet based training or learning growing human resource software or application. Information
technology tools or applications can be used for informal and formal education activities. There are a lots of tools of IT which support learning in an organization
such as: dash board, email, web pages, mail lists, short message systems, media applications, online offices, online courses etc.
• NEW TYPE OF WORKING
In the current scenario, there is a development in informational technology and communication technology that creates a different type of working such as project
based work and teleworking. The teleworking concept changes the working process means, moving the Work to workers not worker to work.
By this way, information tools collect the information, interest as well as enhance skills of employees to perform a task perfectly. IT applications or tools also helps
to improve the productivity, helps to increase economy growth and reduce operating accidents etc.
• SELF-SERVICE HUMAN RESOURCE & PORTAL APPLICATIONS
Employees can take part and perform some of their own human resource activities by the mean of accessing human resource information system. And this is
known as self-service human resource. Self-service software application can perform a lots of tasks for all Human Resource activities.
Employees who use HR self-services applications can easily verify & update personal information, also updated with internal vacancies within organization, receive
information regarding training programs and can access corporate handbooks. HR manager can easily maintain attendance, analyse employee profiles, monitor
absentees, and design salary models. Beside this career development and performance appraisal can be managed. It can also enhance the quality of Human
Resource Services within the organization or outside from the particular organization.
While Human Resource Portal is a complex part of information technology. It provides a wide chance for every individual user to customize or arrange data
according to individual’s job responsibility.
3. ADVANTAGES OR BENEFITS OF IT (INFORMATION TECHNOLOGY) Ant technology affects organization, employee’s relation and work relations in an organization by controlling and enabling to access information & to join personnel
electronically via virtualization or internet. Information Technology based Human Resource system i.e. Human Resource Information System (HRIS) totally changes
traditional Human Resource process and also provide a functional unit, objectives and pre determines goals. There are some benefits discussed below:
1. Time saving: Information Technology tools allows the HR Professionals to spend less time on regular work or tasks and collect information & circulate notices
easily within organization.
2. Reduce cost: it is an universal truth that traditional HR process needs a large amount of money to complete a recruitment process but effect of Information
Technology on Human Resource costs appear in several ways, i.e. IT reduce cost of process and work methods. For example, advertisement cost, postal cost,
application form cost, data processing cost etc. also self-service HR allows employees to perform their task directly.
3. Enable collaboration and communication: Today there is a wide range of IT tools for effective communication and collaboration. Messaging, e-mails, vide-
oconferencing, group discussion, virtual teams, telecommunication and e-workgroups have changed nature of communication and collusion within the or-
ganization. It also allows the persons to take part in the process while he or she is not physically present.
Information technology also helps to improve the skills of employees for accessing information, collaborating and decision making. IT helps to enhance the
managerial skill at every level of management i.e. Top Level, Middle level & Lower Level Management.
Knowledge Management: Knowledge Management is a systematic process of creating, capturing, acquiring, learning synthesizing and experience to enhance
decision making (Ardichvili, 2002).
Knowledge management system is a natural tool of human resources information system & HR development.
4. HR COMPETENCY Competency may be defined as an individual’s knowledge, abilities or skills. Competencies are personal characteristics about people, what they are, what they
know & what they do, or personal characteristics cause superior performance. In this context development of technology in organizations, internet & web based
IT have a very important impact on human resource professionals & their functions. Information technology play a very important role to develop new skills.
TECHNOLOGICAL COMPETENCY: In today’s scenario, there is a need of computer literacy to get a job or to perform a common goal of a particular organization. IT
skills became a prerequisite job skill in human resource. All organizations want HR professionals to keep up with development in Human Resource Information
System (HRIS). The organizations who already adopt information technology moving in the way of success.
BUSINESS KNOWLEDGE: Electronic HR plays an important role for Human Resource Professionals to focus on strategic planning. Some of the HR Professionals can
be unsuccessful to use technology to business still they know HR Technology. IT also responsible for a drastic change in the business process, means with the use
of internet and web applications it is possible to business beyond boundaries i.e. Globalization is successful with IT world. And this a new face of business.
CHANGE IN MANAGEMENT: After use of information technology in any business or organization there is wide change in the management. The process of tasks
has changed. The manual operations shift to automation.
5. ASSESSMENT Beside Information Technology is a most important tool for realization of human resource functions, generally use of IT in HR functions influence Human Resource
Management in many conditions such as:
5.1.1. Advance HR Process: with the help of IT tools there are many functions of HR change their process i.e. self-service HR, e-recruitment & e-learning and
these are only possible with the help of IT. These new advance processes reduce cost, save time of recruitment as comparison to traditional HR process.
5.1.2. Change in working style: Also with the help of IT applications and tools the style of working changed in the organizations, such as: teleworking & web base
project etc.
5.1.3. Traditional Human Resource Functions: With the help of IT in HR functions, increase effectiveness & efficiency of HR practices and decrease in cost &
time. IT also distribute the information along the organization hierarchy, it also enhances the decision making & knowledge management within the or-
ganization.
6. CONCLUSION Information Technology as a basic factor and instrument transforms architect of business process, organization & communication and increasingly integrated into
human resource management. When IT has impact on HR, for the same time managers, Customer, employees and suppliers increase their expectation for human
resource functions. The importance of human capital and knowledge make extra suppression on human resource functions and new competencies for HR profes-
sionals are expected. In this research paper, the impacts of information technology on human resource practices and competencies of human resource profes-
sionals are studied.

VOLUME NO. 6 (2016), ISSUE NO. 11 (NOVEMBER) ISSN 2231-1009
INTERNATIONAL JOURNAL OF RESEARCH IN COMPUTER APPLICATION & MANAGEMENT A Monthly Double-Blind Peer Reviewed (Refereed/Juried) Open Access International e-Journal - Included in the International Serial Directories
http://ijrcm.org.in/
16
REFERENCES BOOKS
1. A. Naag; Strategic management
2. Alexander Alonso, Debra J. Cohen; Defining HR Success: Critical Competencies for HR professionals
3. Ardichvili, A. (2002); Knowledge management
4. Dr. Nirmal Bagchi; Management Information System
5. Kahate (Third edition); Information Technology
6. Manuj Darbari, Ahailendra Tahilyani, Foundation of Information Technology
7. R.K. Madhukar; Business communication
8. V.S.P. Rao; Human Resource Management
9. Yeung, A.K. (1996) Competencies for HR Professionals: An Interview with Richard E. Boyatzis, Human Resource Management
WEBSITES
10. http://ermt.net/docs/papers/Volume_3/3_March2014/V3N3-161.pdf
11. http://www.hrpayrollsystems.net/hris/
12. https://en.wikipedia.org/wiki/Human_resource_management_system
13. www.comparehris.com/HRIS-overview

VOLUME NO. 6 (2016), ISSUE NO. 11 (NOVEMBER) ISSN 2231-1009
INTERNATIONAL JOURNAL OF RESEARCH IN COMPUTER APPLICATION & MANAGEMENT A Monthly Double-Blind Peer Reviewed (Refereed/Juried) Open Access International e-Journal - Included in the International Serial Directories
http://ijrcm.org.in/
17
A STUDY OF CUSTOMER PREFERENCES OF MOBILE BANKING AND BARRIERS IN ADOPTION OF MOBILE
BANKING SERVICES IN SELECTED CO-OPERATIVE BANKS IN PUNE CITY
SHRI AMOL D LONDHE
RESEARCH OFFICER
VAIKUNTH MEHTA NATIONAL INSTITUTE OF CO-OPERATIVE MANAGEMENT
PUNE
P. CHATTOPADHYAY
PROFESSOR
VAIKUNTH MEHTA NATIONAL INSTITUTE OF CO-OPERATIVE MANAGEMENT
PUNE
ABSTRACT Our country has the fastest growing telecom network in the world with its high population and development potential. The major operators the mobile space are
Airtel, Vodafone, idea, Telenor, Reliance, Tata DOCOMO, BSNL, Aircel, Tata Indicom, MTNL are India. The total number of mobile phone subscribers reached 930.20
million as the September 2014 However, rural India still lack strong infrastructure. India’s public sector telecom company BSNL is the 7th largest telecom company
in the world Thus, the increase prevalence of mobile phone in India provides exiting opportunities for the growth of the mobile banking (m-banking). Financial
services are generally complex and consumer demands lot of security and trust before the customer can even think of using the technology. Over time and due date
to adoption of new technologies bank have changed from paper-based banking solutions providers to the providers of latest of the technologies like online banking,
Mobile banking etc. Even now, in India traditional branch-based banking remains the most widely adopted method of conduction banking transactions. The picture
is slowly set to change with commercial banks are undergoing a rapid change majorly driven by the information and telecommunication (ICT) technology. The
private banks like ICICI bank were pioneers in Mobile banking services in India. Co-operatives banks are following the commercial banks and private banks at a
much slower pace. Today many commercial and co-operative banks have launched mobile banking using ICT Technology and now they can reach out to customers
and provide them with not only general information about services but also offers the opportunity of performing interactive retail banking transaction anytime,
anywhere. Today, State bank of India is the market leader in mobile banking services in India with 1.35 crore users and a market share of 46 Percent in terms of
number of transactions. “Mobile Banking is an application of mobile computing which provide customers with the support needed to be able to bank anywhere,
anytime, using a mobile handled device and a mobile service such as a Short Message Services (SMS)”. Mobile banking facility removes the space and time limita-
tions form banking activities. Unlike traditional form of banking, mobile banking has emerged as more convenient and user friendly form of banking. Technology
plays an important role in banking sector. Mobile Phone is the common technology that becomes part of every individual in this information era. As India is the
second largest telecom market in the world and have high potential for expanding banking services using mobile. Mobile banking focuses on customer requirement
of anytime, anywhere banking concept into reality. Yet there are a number of issues and threats in mobile banking system and major problem in the non-adoption
by the customers.
KEYWORDS mobile banking, co-operatives banks, mobile banking customers, mobile banking service.
INTRODUCTION
ife is so busy these days anything which saves your time is lifesaver. Mobile banking plays a vital role in the banking sector in India and also in all parts of
the world’s banking sector. Mobile banking is a service provided by the banks to all the accounts holders of the banks. In recent era co-operative banks has
also implemented mobile banking in their banks. Today’s almost all are using mobile phone and that to Smartphone with various application support for
the fast growing mobile subscribes and huge amount of young and middle age group people who work for more than 8 hours has hardly time to visit bank branch
in office hours. Today mainly every bank provides their customized application for mobile phone which helps to reduce the transactional cost and also to reduce
crowed in the bank branch.
Mobile banking is the term commonly used by the banks where all facilities of banks are provided on the finger tip of the customer, where customer can avail the
service of the banks such as financial services, do financial transaction, view balance, view mini statement of account, request cheque book, Make payments,
transfer funds to beneficiary, and recharge mobile phone via mobile device. The total no of Smartphone users at the end for financial year was around 162millions
and expected to grow to 625 million by 2019-2020. Mobile banking services can be operated by customers through his mobile handset by using an application
provided by the banks to facilitate the customer. Today many commercial and co-operative bank has launched mobile banking using ICT information and telecom-
munication technology and they reach out to customer and provide them with not only general information about services but also offers the opportunity of
performing inter active retail banking transaction anytime and anywhere.
Mobile Banking focus on the customer’s requirement of anytime, anywhere banking into reality yet there is no of issues and threats in the non adoption by the
customers of co-operative banks
The data provided by Reserve Bank of India shows that transaction on internet banking platform done by customer of commercial bank stood to Rs 6 lakhs crores
while that of co-operative banks stood at Rs. 18862 crore in the month of April 2015.
The Trend in Mobile banking is as fallows.
TABLE 1
Year No of users (Million) Volume (Millions) Value (Millions)
2011-2012 12.96 25.56 18.21
2012-2013 22.51
(73.96%)
53.31
(108.56%)
59.90
(228.94%)
2013-2014 35.53
(57.84)
94.71
(77.66%)
224.38
(274.59)
OBJECTIVES 1. To study the prospects of mobile banking in India with reference to Pune city.
2. To study the influence of demographic variables on mobile banking used in selected co-operative banks.
3. To find out the facilities offered by selected co-operative banks through mobile banking
4. To explore the perception of mobile banking service in selected co-operative banks.
5. To list the barriers faced by co-operative banks customers in using mobile banking and make suggestion base on the finding.
L
VOLUME NO. 6 (2016), ISSUE NO. 11 (NOVEMBER) ISSN 2231-1009
INTERNATIONAL JOURNAL OF RESEARCH IN COMPUTER APPLICATION & MANAGEMENT A Monthly Double-Blind Peer Reviewed (Refereed/Juried) Open Access International e-Journal - Included in the International Serial Directories
http://ijrcm.org.in/
18
RESEARCH METHODOLOGY AND HYPOTHESIS Young and middle age group of customers prefer to use mobile banking more than senior citizen
Preference for use of mobile banking is not associated with level of education and income level of customer.
Customer perception of mobile banking in terms of ease of use is not associated, security issues, trial ability complexity to use mobile banking.
The research is empirical in nature and for the study purpose two co-operative banks is selected for the study from Pune City. A convenience sampling method
and willingness of bank management to share data is used to collect the primary data. A sample of 101 respondents is collected from two co-operative banks in
Pune City for research study. Data of 50 customers per bank is collected in structured questionnaire. The data collected is compiled and analyzed with electronic
spread sheet MS. Excel, statistical techniques like percentage, average, descriptive analysis, chi-square test. For the secondary data various books, magazine,
research paper, newspaper, journals, bank reports, and RBI website etc is used for the study. The action plan for the study was to review the books and relevant
literature, designing of questionnaire, collection of data, analysis of collected data and interpretation of data, finding and conclusion, suggestions and recommen-
dations, the purpose of the study to identify the benefits and problems faced by the customers of the co-operative bank in using mobile banking and make
suggestion based on findings and conclusion.
LIMITATIONS 1. Study is limited to co-operative banks in Pune city only.
2. Study is limited to mobile banking and not internet banking.
3. Study is limited to existing customer only
HISTORY OF MOBILE BANKING IN INDIA A report of the Cellular Operator Authority of India show that mobile banking started way back, regarding entry of cell phone into India, despite that it was in the
year 1992 that telecommunication sector in India liberalized to bridge the gap through Government spending and to provide additional resources for the nation’s
telecom sector and private sector was allowed participate. In 1994 India was licensed to provide cellular mobile services granted by the government of India for
the metropolitan city of Delhi, Mumbai, Kolkata and Chennai. Kolkata become the first metro to have cellular network in 1995. In the year 1997, TRAI was set up
for the regulation of telecommunication sector in India. March, 1999 National Telecom Policy (NTP) was announced. Development since inception of mobile
technology such as 1G, 2G, 3G, 4G are as follows:
1st Generation: first generation network is wireless telephone technology using analog signals into digital and introduced in 1980’s. The 1st generation commercially
available cellular network using 1G standard was introduced by NTT Nippon Telegraph telephone in 1979 in Japan. The wireless network was used for voice calling
only
2nd Generation: 2nd Generation network was commercially launched for the GSM standard in 1991 by Radiolinja currently known as Elisa Oyj in Finland. 2nd Gener-
ation helped to enhance data service and also introduce Short Message Service (SMS), CDMA, WAP (Wireless Application Protocal), MMS (Multimedia Messaging
Service), where in voice communication was digitally encrypted along with internet service. 2G capabilities are achieved by allowing multiuser on single channel
via multiplexing. 2G is defined as Digital Narrow Band Circuit Data
3rd Generation: 3rd Generation network also known a Digital Broadband Pocket Data this type of wireless network has multimedia service support along with
streaming and popularly universally accessed. 3G provide Greater security and privacy. The first Commercial 3G network was launched by NTT DOCOMO in Japan
in 2001
4th Generation: 4th Generation wireless also known as Digital Broadband Packet all IP Very High throughputs. The 4G technology introduced in the year 2009 which
provide WiMAX, LTE (Long Term Evolution) Technology with fixed internet support.
The following applications is indigenous designed by co-operative banks in providing mobile banking services to its customers, these are “Now Go Mobile” and
Freedom from conventional banking “GOMO”. These application provies all the services such as Account balance, fund transfer, M. Payment, Mini Statement,
Recharge Facility, IMPS, Change pin, Stop Payment, Cheque Book request, Cheque Status.
LITERATURE REVIEW Gurmeet singh Saini (2014) This study is based on primary data collection from 150 Respondents Delhi city. There is no particular classification on types of banks
customers whose data has been collected. 61.35 percent respondents felt that mobile banking was less costly and time saving and 58.16 percent respondent felt
that they would like to try it out. The paper looks at factors as to why customer are not using mobile banking and enlists reason like mobile banking is difficult to
use mobile banking is not available. However, the major concern of respondents was privacy and security issues in mobile banking. Creating awareness of mobile
banking through education is important. The study does not mention which banks are considered in the sample.
V Devadevan (2013) the main aim of the study is to identify the mindset of people and analysis the security issues in Mobile banking amongst the banking
customers in India. Online transaction questionnaire was needed to collect primary data from 65 customers. The study found that about 25 percent respondents
used mobile banking facility while 75 percent did not use it the study also found that few banks offered mobile banking in the form of SMS Banking. Security issue
is very important for customer point of view. The awareness how to use mobile banking and what are the security mechanisms to be followed by the customers
has to be addressed for effective usage of mobile banking There is need for customer friendly banking software that can be used in local language.
Sunil Kumar Mishra (2013), This research paper is based only on secondary data collected from different websites, research papers and magazines. The paper
enlists the facilities provided by mobile banking services, advantages and disadvantage of mobile banking services and mobile banking service used worldwide.
The paper concludes that banks are developing and offering mobile banking services to customers to cut of operations despite which customers do not use mobile
banking for various reasons.
Vishal Goyal (2012), The paper classified into five main categories viz. m-banking overview and conceptual issues, features and benefits of mobile banking, current
operating practices of commercial banks, Mobile banking/payments practices in Indian commercial banks and challenges in India- strategic legal and ethical issues.
This paper provides useful anatomy of young m-banking literature to anyone interested in m-banking. The study has collected primary data from customers from
PSU and Private Banks but has left out co-operative banks.
Bamoriya (2012), The study strives to find out the problems of customers leading to low rate of mobile banking. This problem could b taken up by banks to come
up with solutions to enhance the rate of mobile banking. The study analyses data collected from 100 bank customers in Indore. Data was collected using question-
naire the study found that 80percent male used mobile banking as compared to 20percent female overall 61 percent users agreed that mobile banking was better
than traditional banking but customers were deterred from using mobile banking due to factors such as security concerns, network problem, difficulty in handling
mobile phone, insufficient operations guidance and cost per transactions. The study found that 86 percent respondents use mobile banking to check balance of
their accounts, as customers prefer information based services rather than financial services provided by the banks.
Archana Sharma (2012), this study is extracted from survey conducted in Ghaziabad in Uttar Pradesh. The sample size was 100 bank customers from whom primary
data was collected with the help of questionnaire. This study shows that more males use mobile banking as compared to females and customers in the age group
of 20-29 years used mobile banking most. 81 percent respondents were willing to use mobile banking if they could first use it on trial basis to see its offering.
Adoption of mobile banking appeared to be influenced by its trial ability and compatibility the study points out the facts that banks need to increase the awareness
of mobile banking.
Bamoriya (2011), The study suggests that from customers perspective mobile handset operability, security / privacy and standardization of services are the critical
issues. Checking balance through mobile banking was most used services whereas checking status of demand draft or cheque was least used services. The study

VOLUME NO. 6 (2016), ISSUE NO. 11 (NOVEMBER) ISSN 2231-1009
INTERNATIONAL JOURNAL OF RESEARCH IN COMPUTER APPLICATION & MANAGEMENT A Monthly Double-Blind Peer Reviewed (Refereed/Juried) Open Access International e-Journal - Included in the International Serial Directories
http://ijrcm.org.in/
19
also suggested that majority of respondents were indifferent towards perceived utilities of mobile banking in comparison to retail banking and internet banking.
This study is based on public sector banks and private banks. It has not considered co-operative banks.
INDIAN TELECOM SECTOR India is the second largest telecom sector in the world with total subscribers for the financial year 2014 is (933.00) million as compared to 2013 (898.02) million.
In India almost 131 Banks are permitted to provide mobile banking across India. According to the RBI Data the total no of transaction which took place in the
month of April 2015 amounts to Rs. 18862 crore. The total no of wireless subscribers has also increased over wire line subscribers as per the data 31 March 2014.
TABLE 2
Source: TRAI Annual Report 2013-214
RESERVE BANK OF INDIA GUIDELINES Reserve Bank of India issued first guideline on mobile banking in October 2008 looking at the potential of mobile as channel for offering financial services. The
person opting for mobile banking should comply with Know Your Customer (KYC) and anti money laundering. End to end encryption for transaction in excess of
Rs. 5000/- has been mandated. Banks which are licensed and supervised in India and have physical presence in India will be permitted to offer mobile payment
services to residents of India. The per day transaction cap of Rs. 50000/- has been removed by RBI and every bank can change this cap depending upon their risk.
As per the master circular by RBI the facility of registration for mobile banking can be done by the customer through ATMs where in the deadline for the same is
given to bank who are participating in National financial switch to carry out necessary changes in ATM machine latest by 31 March 2016. The application should
clearly indicate the option of mobile banking and also the alert SMS Short Message Service will be send to registered mobile number.
IMPORTANT BENEFITS OF MOBILE BANKING 1. Easy access of day to day banks facilities by using Smartphone from anywhere and anytime.
2. The transaction cost is less when the customer uses the mobile banking provided by the banks.
3. Mobile banking provides speed and accuracy for customers, it helps to avoid queues, and less chance of making mistake as it is done by the customer
themselves.
4. By using mobile banking one can view his Account statement, transaction info, bill payment facility, fund transfer, etc. though mobile banking.
5. Mobile banking is important because the unbank population can be brought under the umbrella banking sector to bring transparency in the country.
6. Mobile banking is the platform customer can use the service efficiently and effectively they do not need go to the bank the bank facility is available on finger
tip to is customers.
CHALLENGES IN ADOPTION OF MOBILE BANKING 1. Building trust about the security among the customer is big challenge for the banks and the regulatory authority.
2. Challenges regarding marketing of mobile banking and making aware about the useful facility.
3. Challenge to provide service of mobile banking on low bandwidth provided by Internet service provider.
4. Challenge to bring the senior citizens and take them into confidence to use mobile banking.
5. Challenge to bring the un-bank rural population of India under banking sector.
6. Challenge faced regarding application of mobile banking where in the testing of application and internet facility
ANALYSIS
As depicted in the table below compatibility as a barrier in Mobile banking 47(46.53%) respondent feel that compatibility a barrier in mobile banking. 29 (28.71%)
respondent is neutral. 33(32.67%) respondent has a fear of theft regarding mobile banking and on the other hand 48(47.52%) respondent is natural in approach
they don’t neither a barrier nor a barrier in mobile banking 10(9%) respondent has a fear of theft among them regarding mobile banking. The major barrier in
mobile banking is the Lack of trust, Fear of Theft, Trial Ability Complexity and Security Concern which constitute to 20(19.80%), 33(32.67%), 21(20.79%) and
31(30.69%).
FIG. 1
Particulars Wireless Subscribers Wire line Subscribers Total Subscribers
Total Wireless Subscribers (Millions) 904.51 Million 28.49 Million 933.00 Million
Urban Subscribers (Millions) 532.73 Million 22.54 Million 555.28 Million
Rural Subscribers (Millions) 371.78 Million 5.96 Million 377.73 Million
Share of Urban Subscribers 58.90% 79.09% 59.51%
Share of Rural Subscribers 41.10% 14.86% 40.49%
Total % Change over the previous Quarter 2.05% 1.37% 1.95%
92
88
82
11
25
9
13
19
90
76
0% 50% 100%
Prefer Mobile
Banking
Mobile phone bill
Utility Bill
Insurance Premium
Bill
Credit Card Bill
Yes
No
Preference and Use of Mobiel Banking

VOLUME NO. 6 (2016), ISSUE NO. 11 (NOVEMBER) ISSN 2231-1009
INTERNATIONAL JOURNAL OF RESEARCH IN COMPUTER APPLICATION & MANAGEMENT A Monthly Double-Blind Peer Reviewed (Refereed/Juried) Open Access International e-Journal - Included in the International Serial Directories
http://ijrcm.org.in/
20
FIG. 2
Source: Researcher Finding
More over when asked to respondents how often do you use mobile banking? All most 42(41.58%) of the respondents use mobile banking on occasionally bases
and 23(22.77%) respondents use mobile banking monthly bases only few 16(15.84%) and 14(13.86%) use it daily and weekly bases as depicted below in table
below.
FIG. 3
Source: Researcher Finding
The respondent who are using mobile banking between 1 year – 3 years constitute to 48(47.52%) and respondents using mobile banking for more than 3 years
constitute to 37(36.63%) as shown in the table below
How long using Mobile Banking Less than One year 1-3 years More than 3 years
16 48 37
Source: Researcher Finding
According to table shown below depicts that 92(91.08%) respondent of co-operative banks prefer mobile banking and pays mobile bill, utility bill, insurance pre-
mium and credit card bill through mobile banking.
CONCLUSION In This research work the researcher comes to the conclusion on the base of facts and finding with proper analysis and interpretation of collected data, that
youngsters contribute more in the use of mobile banking in co-operative banks as compared to senior citizens. Male respondents use more of mobile banking
which constitute to 70% of total respondents. Salaried respondents found using mobile banking more as it help to save their time, and also money. Visiting bank
in office hours is not possible to salaried respondent hence found using mobile banking. It can be concluded that there is more advantage in mobile banking rather
than traditional banking, which save time, distance, no waiting in queue, anytime and anywhere access has made respondents happy. Most of respondents hesitate
to give donations through mobile banking. The barrier in using mobile banking are the fear of theft, menu of the application, poor connectivity, security concerns,
14
3
4
3
8
27
25
44
8
5
47
7
14
4
21
55
45
41
48
38
29
48
62
53
53
17
29
12
41
35
10
33
21
31
17
2
1
3
2
20
1
10
10
2
1
1
2
3
Compatibility
Fear of Theft
Trial Ability
complexity
Security Concern
Poor Network
Coverage
Difficult in Handling
Insufficient Guidance
Cost Per Transaction
is High
Mobile banking
menu not
easy to navigate
Lack of Trust in Mobile banking
Total Number of Respondents 101
Barrier in Mobile Banking
Very low Low Average High Very High
16
14
6
23
42
0 20 40 60
Daily
Weekly
Forth…
Monthly
Occasi…

VOLUME NO. 6 (2016), ISSUE NO. 11 (NOVEMBER) ISSN 2231-1009
INTERNATIONAL JOURNAL OF RESEARCH IN COMPUTER APPLICATION & MANAGEMENT A Monthly Double-Blind Peer Reviewed (Refereed/Juried) Open Access International e-Journal - Included in the International Serial Directories
http://ijrcm.org.in/
21
and trial ability complexity. Education plays important role in use of mobile banking of co-operative banks 33.7% graduate, 61.4% post graduate are the major
share holder in use of mobile banking in co-operative banks. With education, income also plays important role in use of mobile banking, 58% middle income
respondents use mobile banking of co-operative banks than higher income respondents. The respondents use mobile banking occasionally which constitute to
41.6% followed by monthly users which constitute to 22.8%. 63.6% share of respondent’s use mobile banking for more than three years; still they are using mobile
banking occasionally and not daily. 89% share of respondents of co-operative banks feel that mobile banking is better than traditional banking.
RECOMMENDATION In today’s scenario and fast life of the individual, looking at the running time it is advisable to the customer to preferring mobile banking as a handy tool for financial
inclusion to reduce the paper work. Customer should bring transparency by doing more of the transaction through mobile banking where in an accountability can
be possible and records may be easily understood. Customer should personally request co-operative banks to provide handy and updated software application,
and also help the customer as and when they need help in using mobile banking a separate department should be kept for the support. In the era of 4th Generation
telecom service speed is no bar for customers, hence customer should keep the security level at high and try to use genuine software application in their mobile
and specially one antivirus license version to protect unwanted hacks. Customer should read the guideline properly before using mobile banking of co-operative
banks, if found any problem using immediately refer to the branch or the toll free no of the banks. Because of Security reasons banks provide application to specific
IMPI no one it is recorded it is applicable to the same IMPI handset if they remove the SIM the record of the IMPI no also gets deactivated hence avoid switching
the SIM on regular basis to different handsets.
SUGGESTIONS In mobile banking of co-operative banks, co-operative banks should have proved universal application software for all Smartphone’s as they all are android oper-
ating systems. In mobile banking of co-operative banks, the banks should provide General/ life insurance (life insurance/ health / medical insurance) facility options
in the mobile banking services. The application of co-operative banks has to work on low domain network, so that the application software can work smoothly
and easily enough to get connected fast. The co-operative banks must be conscious about the service they promote for mobile banking under the guidelines of
RBI. The co-operative banks must provide their staff the habit of doing more of the work of customer on Smartphone to make them feel comfortable about the
mobile banking. The Co-operative banks must forcefully avoid the paper work in front of the customer and insist customer to opt for mobile banking of the banks.
In mobile banking there should be a facility of interbank switch and also auto payment system which will help to pay the bill on or before due date. Customer has
suggested in mobile banking video banking facility should also be provided in case of any problem faced customer in using mobile banking. The application of the
co-operative banks is more precise and has less menu in it so the banks should update the mobile application and provide with the facility of making fixed deposit,
recurring deposit, term deposit, open friends account, relative account.
REFERENCES 1. Archana Sharma (2013) “Mobile Banking a Technology Adoption and Challenge: A case Study of M-banking in India” International journal Of scientific and
Research, Volume 2 Issue 2
2. Gurmeet Singh Saini (March 2014) “Mobile Banking in india: Issues and Challenges “, Sai Om Journal of Commerce and Management, Volume 1, Issue 3(March
2014)
3. Handbook on Mobile Banking Regulatory and On-Boarding Guidelines for RRB and Central Co-operative Banks
4. http://www.rbi.org.in
5. KPMC Report 2015 (2 July 2015)
6. Manav Aggarwal (May 2014) “A Study On important of Mobile Banking”, Indian Journal for Applied Research, Volume No, 4 Issue 5, (May 2014)
7. Prema Sharma Bamoriya (2012) “Mobile Banking in India Barriers in Adoption and Service Preference” Integral Review- Journal of Management Volume 5,
issue 1
8. Prema Sharma Banoriya (2011)” Issues and Challenges in Mobile Banking in India Customer Perspective Research Journal of Finance and Accounting Volume
2 No 2
9. Report of Technical Committee on Mobile Banking RBI (January 2014)
10. State Bank of India Annual Report 2014-2015
11. Sunil Kumar Mishra & Durga Prasad Sahoo (2013) “Mobile banking and Benefits Toward Customer Service”, Special Issue of International Journal on Advance
Computer Theory and Engineering Volume 2 Issue 1.
12. TRAI, Report 2014-2015, India
13. V. Devadevan (2013) “Mobile Banking in India: Issues and Challenges” International Journal of Emerging Technology and Advance Engineering Volume, 3
Issue 6 (2013)
14. Vishal goyal, Dr, U.S Pandey, Sanjay Batra, and (June 2012) “Mobile Banking in India: Practices, challenges and Security Issues”, International Journal of
Advance Trends in Computer Science and Engineering, Volume 1 No 2 (May –June 2012)
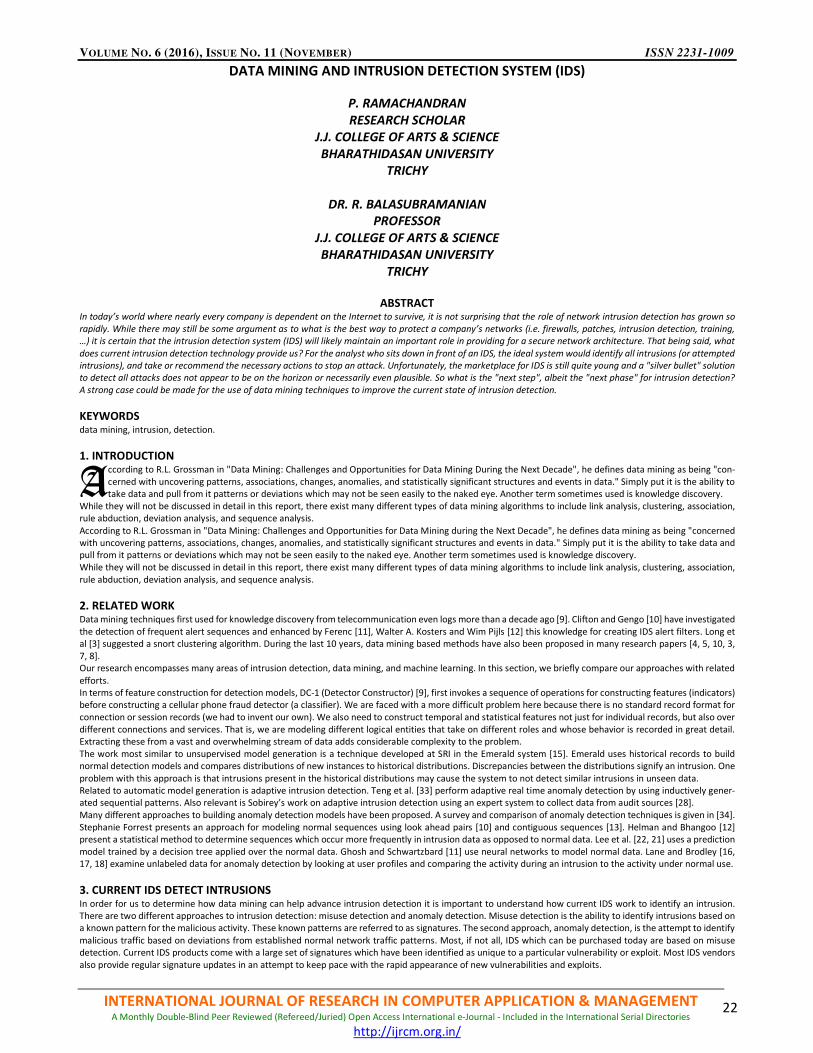
VOLUME NO. 6 (2016), ISSUE NO. 11 (NOVEMBER) ISSN 2231-1009
INTERNATIONAL JOURNAL OF RESEARCH IN COMPUTER APPLICATION & MANAGEMENT A Monthly Double-Blind Peer Reviewed (Refereed/Juried) Open Access International e-Journal - Included in the International Serial Directories
http://ijrcm.org.in/
22
DATA MINING AND INTRUSION DETECTION SYSTEM (IDS)
P. RAMACHANDRAN
RESEARCH SCHOLAR
J.J. COLLEGE OF ARTS & SCIENCE
BHARATHIDASAN UNIVERSITY
TRICHY
DR. R. BALASUBRAMANIAN
PROFESSOR
J.J. COLLEGE OF ARTS & SCIENCE
BHARATHIDASAN UNIVERSITY
TRICHY
ABSTRACT In today’s world where nearly every company is dependent on the Internet to survive, it is not surprising that the role of network intrusion detection has grown so
rapidly. While there may still be some argument as to what is the best way to protect a company’s networks (i.e. firewalls, patches, intrusion detection, training,
…) it is certain that the intrusion detection system (IDS) will likely maintain an important role in providing for a secure network architecture. That being said, what
does current intrusion detection technology provide us? For the analyst who sits down in front of an IDS, the ideal system would identify all intrusions (or attempted
intrusions), and take or recommend the necessary actions to stop an attack. Unfortunately, the marketplace for IDS is still quite young and a "silver bullet" solution
to detect all attacks does not appear to be on the horizon or necessarily even plausible. So what is the "next step", albeit the "next phase" for intrusion detection?
A strong case could be made for the use of data mining techniques to improve the current state of intrusion detection.
KEYWORDS
data mining, intrusion, detection.
1. INTRODUCTION ccording to R.L. Grossman in "Data Mining: Challenges and Opportunities for Data Mining During the Next Decade", he defines data mining as being "con-
cerned with uncovering patterns, associations, changes, anomalies, and statistically significant structures and events in data." Simply put it is the ability to
take data and pull from it patterns or deviations which may not be seen easily to the naked eye. Another term sometimes used is knowledge discovery.
While they will not be discussed in detail in this report, there exist many different types of data mining algorithms to include link analysis, clustering, association,
rule abduction, deviation analysis, and sequence analysis.
According to R.L. Grossman in "Data Mining: Challenges and Opportunities for Data Mining during the Next Decade", he defines data mining as being "concerned
with uncovering patterns, associations, changes, anomalies, and statistically significant structures and events in data." Simply put it is the ability to take data and
pull from it patterns or deviations which may not be seen easily to the naked eye. Another term sometimes used is knowledge discovery.
While they will not be discussed in detail in this report, there exist many different types of data mining algorithms to include link analysis, clustering, association,
rule abduction, deviation analysis, and sequence analysis.
2. RELATED WORK Data mining techniques first used for knowledge discovery from telecommunication even logs more than a decade ago [9]. Clifton and Gengo [10] have investigated
the detection of frequent alert sequences and enhanced by Ferenc [11], Walter A. Kosters and Wim Pijls [12] this knowledge for creating IDS alert filters. Long et
al [3] suggested a snort clustering algorithm. During the last 10 years, data mining based methods have also been proposed in many research papers [4, 5, 10, 3,
7, 8].
Our research encompasses many areas of intrusion detection, data mining, and machine learning. In this section, we briefly compare our approaches with related
efforts.
In terms of feature construction for detection models, DC-1 (Detector Constructor) [9], first invokes a sequence of operations for constructing features (indicators)
before constructing a cellular phone fraud detector (a classifier). We are faced with a more difficult problem here because there is no standard record format for
connection or session records (we had to invent our own). We also need to construct temporal and statistical features not just for individual records, but also over
different connections and services. That is, we are modeling different logical entities that take on different roles and whose behavior is recorded in great detail.
Extracting these from a vast and overwhelming stream of data adds considerable complexity to the problem.
The work most similar to unsupervised model generation is a technique developed at SRI in the Emerald system [15]. Emerald uses historical records to build
normal detection models and compares distributions of new instances to historical distributions. Discrepancies between the distributions signify an intrusion. One
problem with this approach is that intrusions present in the historical distributions may cause the system to not detect similar intrusions in unseen data.
Related to automatic model generation is adaptive intrusion detection. Teng et al. [33] perform adaptive real time anomaly detection by using inductively gener-
ated sequential patterns. Also relevant is Sobirey’s work on adaptive intrusion detection using an expert system to collect data from audit sources [28].
Many different approaches to building anomaly detection models have been proposed. A survey and comparison of anomaly detection techniques is given in [34].
Stephanie Forrest presents an approach for modeling normal sequences using look ahead pairs [10] and contiguous sequences [13]. Helman and Bhangoo [12]
present a statistical method to determine sequences which occur more frequently in intrusion data as opposed to normal data. Lee et al. [22, 21] uses a prediction
model trained by a decision tree applied over the normal data. Ghosh and Schwartzbard [11] use neural networks to model normal data. Lane and Brodley [16,
17, 18] examine unlabeled data for anomaly detection by looking at user profiles and comparing the activity during an intrusion to the activity under normal use.
3. CURRENT IDS DETECT INTRUSIONS In order for us to determine how data mining can help advance intrusion detection it is important to understand how current IDS work to identify an intrusion.
There are two different approaches to intrusion detection: misuse detection and anomaly detection. Misuse detection is the ability to identify intrusions based on
a known pattern for the malicious activity. These known patterns are referred to as signatures. The second approach, anomaly detection, is the attempt to identify
malicious traffic based on deviations from established normal network traffic patterns. Most, if not all, IDS which can be purchased today are based on misuse
detection. Current IDS products come with a large set of signatures which have been identified as unique to a particular vulnerability or exploit. Most IDS vendors
also provide regular signature updates in an attempt to keep pace with the rapid appearance of new vulnerabilities and exploits.
A

VOLUME NO. 6 (2016), ISSUE NO. 11 (NOVEMBER) ISSN 2231-1009
INTERNATIONAL JOURNAL OF RESEARCH IN COMPUTER APPLICATION & MANAGEMENT A Monthly Double-Blind Peer Reviewed (Refereed/Juried) Open Access International e-Journal - Included in the International Serial Directories
http://ijrcm.org.in/
23
SHORTFALLS WITH CURRENT IDS
While the ability to develop and use signatures to detect attacks is a useful and viable approach there are shortfalls to only using this approach which should be
addressed.
• Variants. As stated previously signatures are developed in response to new vulnerabilities or exploits which have been posted or released. Integral to the
success of a signature, it must be unique enough to only alert on malicious traffic and rarely on valid network traffic. The difficulty here is that exploit code
can often be easily changed. It is not uncommon for an exploit tool to be released and then have its defaults changed shortly thereafter by the hacker
community.
• False positives. A common complaint is the amount of false positives an IDS will generate. Developing unique signatures is a difficult task and often times
the vendors will err on the side of alerting too often rather than not enough. This is analogous to the story of the boy who cried wolf. It is much more difficult
to pick out a valid intrusion attempt if a signature also alerts regularly on valid network activity. A difficult problem that arises from this is how much can be
filtered out without potentially missing an attack.
• False negatives …detecting attacks for which there are no known signatures. This leads to the other concept of false negatives where an IDS does not
generate an alert when an intrusion is actually taking place. Simply put if a signature has not been written for a particular exploit there is an extremely good
chance that the IDS will not detect it.
• Data overload. Another aspect which does not relate directly to misuse detection but is extremely important is how much data an analyst can effectively
and efficiently analyze. That being said the amount of data he/she needs to look at seems to be growing rapidly. Depending on the intrusion detection tools
employed by a company and its size there is the possibility for logs to reach millions of records per day.
4. DATA MINING WORKS WITH IDS Data mining can help improve intrusion detection by adding a level of focus to anomaly detection. By identifying bounds for valid network activity, data mining
will aid an analyst in his/her ability to distinguish attack activity from common everyday traffic on the network.
• Variants. Since anomaly detection is not based on pre-defined signatures the concern with variants in the code of an exploit are not as great since we are
looking for abnormal activity versus a unique signature. An example might be a Remote Procedure Call (RPC) buffer overflow exploit whose code has been
modified slightly to evade an IDS using signatures. With anomaly detection, the activity would be flagged since the destination machine has never seen an
RPC connection attempt and the source IP was never seen connecting to the network.
• False positives. In regards to false positives there has been some work to determine if data mining can be used to identify recurring sequences of alarms in
order to help identify valid network activity which can be filtered out.
• False negatives …detecting attacks for which there are no known signatures. By attempting to establish patterns for normal activity and identifying that
activity which lies outside identified bounds, attacks for which signatures have not been developed might be detected. An extremely simple example of how
this would work would be to take a web server and develop a profile of the network activity seen to and from the system. Let us say the web server is locked
down and only connections to ports 80 and 443 are ever seen to the server. Thus, whenever a connection to a port other than 80 or 443 is seen the IDS
should identify that as an anomaly. While this example is quite simple this could be extended to profiling not only individual hosts, but entire networks, users,
traffic based on days of the week or hours in a day, and the list goes on.
• Data overload. The area where data mining is sure to play a vital role is in the area of data reduction. With current data mining algorithms there exists the
capability to identify or extract data which is most relevant and provide analysts with different "views" of the data to aid in their analysis.
5. DIFFICULTIES WHEN IT COMES TO DATA-MINING IN INTRUSION DETECTION The concept of data mining has been around for years. Despite this data mining in intrusion detection is a relatively new concept. Thus there will likely be obstacles
in developing an effective solution. One is the fact that even though the concept of data mining has been around for some time the amount of data to be analyzed
and its complexity is increasing dramatically. As stated previously, it is possible for a company to collect millions of records per day which need to be analyzed for
malicious activity. With this amount of data to analyze one can guess that data mining will become quite computationally expensive. Unfortunately, for some
processing power or memory is not always cheap or available. Of course there may be the argument that you only need samples of the data in order to generate
profiles, but there will also be the argument that analyzing anything, especially network traffic, without all the data could lead to false conclusions. Another
obstacle will be tailoring data mining algorithms and processes to fit intrusion detection. An effort to identify how the data needs to be looked at in order to
provide us with a better picture is surely integral in providing accurate and effective results.
6. SYSTEM ARCHITECTURE The overall system architecture is designed to support a data mining-based IDS with the properties described throughout this paper. As shown in Figure 2, the
architecture consists of sensors, detectors, a data warehouse, and a model generation component. This architecture is capable of supporting not only data gath-
ering, sharing, and analysis, but also data archiving and model generation and distribution
The system is designed to be independent of the sensor data format and model representation. A piece of sensor data can contain an arbitrary number of features.
Each feature can be continuous or discrete, numerical or symbolic. In this framework, a model can be anything from a neural network, to a set of rules, to a
probabilistic model. To deal with this heterogeneity, an XML encoding is used so each component can easily exchange data and/or models.
Our design was influenced by the work in standardizing the message formats and protocols for IDS communication and collaboration: the Common Intrusion
Detection Framework (CIDF, funded by DARPA) [29] and the more recent Intrusion Detection Message Exchange Format (IDMEF, by the Intrusion Detection Work-
ing Group of IETF, the Internet Engineering Task Force). Using CIDF or IDMEF, IDSs can securely exchange attack information, encoded in the standard formats, to
collaboratively detect distributed intrusions. In our architecture, data and model exchanged between the components are encoded in our standard message
format, which can be trivially mapped to either CIDF or IDMEF formats. The key advantage of our architecture is its high performance and scalability. That is, all
components can reside in the same local network, in which case, the work load is distributed among the components; or the components can be in different
networks, in which case, they can also participate in the collaboration with other IDSs in the Internet.
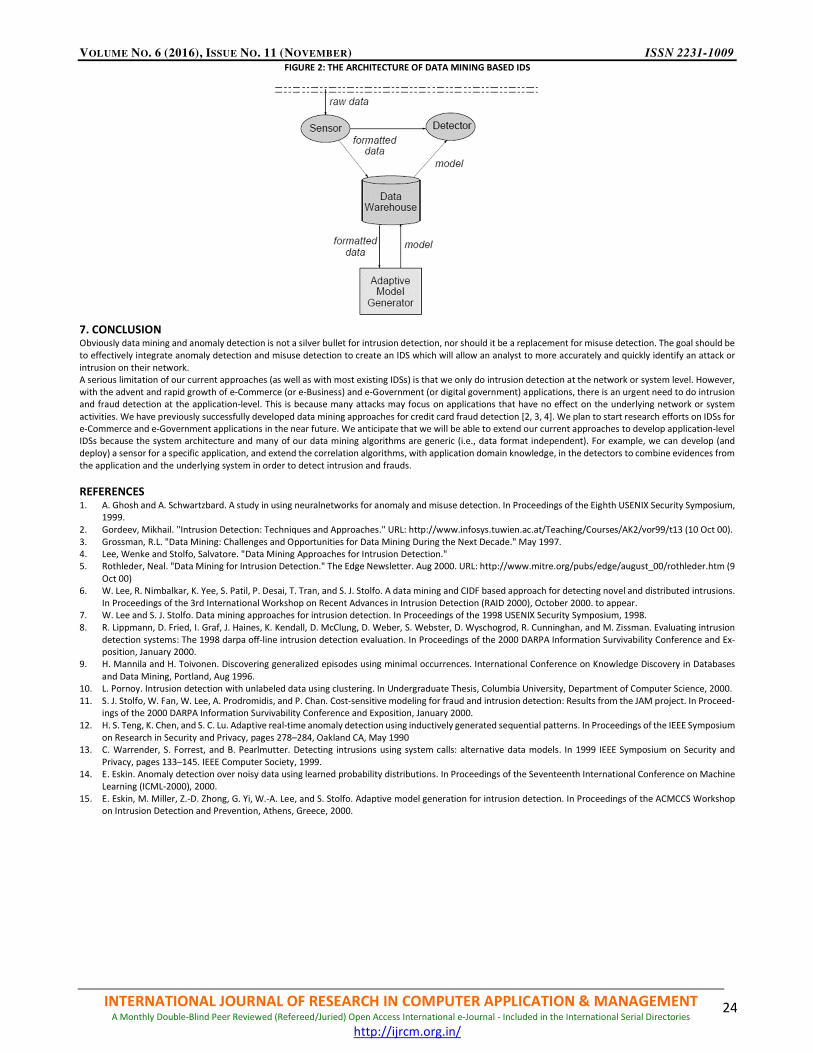
VOLUME NO. 6 (2016), ISSUE NO. 11 (NOVEMBER) ISSN 2231-1009
INTERNATIONAL JOURNAL OF RESEARCH IN COMPUTER APPLICATION & MANAGEMENT A Monthly Double-Blind Peer Reviewed (Refereed/Juried) Open Access International e-Journal - Included in the International Serial Directories
http://ijrcm.org.in/
24
FIGURE 2: THE ARCHITECTURE OF DATA MINING BASED IDS
7. CONCLUSION Obviously data mining and anomaly detection is not a silver bullet for intrusion detection, nor should it be a replacement for misuse detection. The goal should be
to effectively integrate anomaly detection and misuse detection to create an IDS which will allow an analyst to more accurately and quickly identify an attack or
intrusion on their network.
A serious limitation of our current approaches (as well as with most existing IDSs) is that we only do intrusion detection at the network or system level. However,
with the advent and rapid growth of e-Commerce (or e-Business) and e-Government (or digital government) applications, there is an urgent need to do intrusion
and fraud detection at the application-level. This is because many attacks may focus on applications that have no effect on the underlying network or system
activities. We have previously successfully developed data mining approaches for credit card fraud detection [2, 3, 4]. We plan to start research efforts on IDSs for
e-Commerce and e-Government applications in the near future. We anticipate that we will be able to extend our current approaches to develop application-level
IDSs because the system architecture and many of our data mining algorithms are generic (i.e., data format independent). For example, we can develop (and
deploy) a sensor for a specific application, and extend the correlation algorithms, with application domain knowledge, in the detectors to combine evidences from
the application and the underlying system in order to detect intrusion and frauds.
REFERENCES 1. A. Ghosh and A. Schwartzbard. A study in using neuralnetworks for anomaly and misuse detection. In Proceedings of the Eighth USENIX Security Symposium,
1999.
2. Gordeev, Mikhail. "Intrusion Detection: Techniques and Approaches." URL: http://www.infosys.tuwien.ac.at/Teaching/Courses/AK2/vor99/t13 (10 Oct 00).
3. Grossman, R.L. "Data Mining: Challenges and Opportunities for Data Mining During the Next Decade." May 1997.
4. Lee, Wenke and Stolfo, Salvatore. "Data Mining Approaches for Intrusion Detection."
5. Rothleder, Neal. "Data Mining for Intrusion Detection." The Edge Newsletter. Aug 2000. URL: http://www.mitre.org/pubs/edge/august_00/rothleder.htm (9
Oct 00)
6. W. Lee, R. Nimbalkar, K. Yee, S. Patil, P. Desai, T. Tran, and S. J. Stolfo. A data mining and CIDF based approach for detecting novel and distributed intrusions.
In Proceedings of the 3rd International Workshop on Recent Advances in Intrusion Detection (RAID 2000), October 2000. to appear.
7. W. Lee and S. J. Stolfo. Data mining approaches for intrusion detection. In Proceedings of the 1998 USENIX Security Symposium, 1998.
8. R. Lippmann, D. Fried, I. Graf, J. Haines, K. Kendall, D. McClung, D. Weber, S. Webster, D. Wyschogrod, R. Cunninghan, and M. Zissman. Evaluating intrusion
detection systems: The 1998 darpa off-line intrusion detection evaluation. In Proceedings of the 2000 DARPA Information Survivability Conference and Ex-
position, January 2000.
9. H. Mannila and H. Toivonen. Discovering generalized episodes using minimal occurrences. International Conference on Knowledge Discovery in Databases
and Data Mining, Portland, Aug 1996.
10. L. Pornoy. Intrusion detection with unlabeled data using clustering. In Undergraduate Thesis, Columbia University, Department of Computer Science, 2000.
11. S. J. Stolfo, W. Fan, W. Lee, A. Prodromidis, and P. Chan. Cost-sensitive modeling for fraud and intrusion detection: Results from the JAM project. In Proceed-
ings of the 2000 DARPA Information Survivability Conference and Exposition, January 2000.
12. H. S. Teng, K. Chen, and S. C. Lu. Adaptive real-time anomaly detection using inductively generated sequential patterns. In Proceedings of the IEEE Symposium
on Research in Security and Privacy, pages 278–284, Oakland CA, May 1990
13. C. Warrender, S. Forrest, and B. Pearlmutter. Detecting intrusions using system calls: alternative data models. In 1999 IEEE Symposium on Security and
Privacy, pages 133–145. IEEE Computer Society, 1999.
14. E. Eskin. Anomaly detection over noisy data using learned probability distributions. In Proceedings of the Seventeenth International Conference on Machine
Learning (ICML-2000), 2000.
15. E. Eskin, M. Miller, Z.-D. Zhong, G. Yi, W.-A. Lee, and S. Stolfo. Adaptive model generation for intrusion detection. In Proceedings of the ACMCCS Workshop
on Intrusion Detection and Prevention, Athens, Greece, 2000.

VOLUME NO. 6 (2016), ISSUE NO. 11 (NOVEMBER) ISSN 2231-1009
INTERNATIONAL JOURNAL OF RESEARCH IN COMPUTER APPLICATION & MANAGEMENT A Monthly Double-Blind Peer Reviewed (Refereed/Juried) Open Access International e-Journal - Included in the International Serial Directories
http://ijrcm.org.in/
25
IDENTIFICATION OF HIPOS AMONGST HIGH PERFORMING EMPLOYEES AND THEIR DEVELOPMENT
ADITH DEV AKKARA
STUDENT
SIMS
SYMBIOSIS INTERNATIONAL UNIVERSITY
PUNE
VIDHAN SHARMA
STUDENT
SIMS
SYMBIOSIS INTERNATIONAL UNIVERSITY
PUNE
VAISHALI RAJANI
STUDENT
SIMS
SYMBIOSIS INTERNATIONAL UNIVERSITY
PUNE
DR. RAVINDER KAUR
PROFESSOR
SIMS
SYMBIOSIS INTERNATIONAL UNIVERSITY
PUNE
ABSTRACT The ongoing ‘war for talent’ and increasing volatility of contemporary business environment has made it imperative for companies to invest in developing individuals
with higher learning agility and adaptability through consistent and objective ‘high-potential programs’. Also it is critical for organisations to clearly define the
difference between high performers and high potentials to ensure an effective identification process for HIPOs. The purpose of this paper is to elicit and present
information on areas like identification of high-potential employees, development of HiPos, retention of HiPos and whether to openly disclose their status or not.
In addition to this, the paper also plans to focus on the effect of such high-potential programs on the non-identified employees, which have not been given due
importance by most previous publications on this subject. The paper also recommends the organisations on how to identify, develop and retain their high-potential
employees.
KEYWORDS
high-potential employees, identification, development, high-performers.
INTRODUCTION ust as the complexity and dynamism of today’s business environment is constantly increasing so is the need for organizational agility and dynamic leadership
to help organizations be adequately equipped to survive and thrive under fast-changing market conditions. And thus an increasing number of companies
these days are investing as high as 80% of their total developmental budget in managing and developing just 20% (approx.) of their workforce, identified as
‘high-potential employees’ in the organization, who exhibit characteristics like high learning agility, result orientation, strategic thinking etc. and can take up
mission-critical roles in the future. The purpose and importance of such a practice are many including developmental purposes, higher employee retention, bench
strength, motivated workforce and better clarity in terms of succession planning of critical leadership roles.
Also high potential employees are twice as valuable to an organisation compared to those who have not been identified as such, and are 75 percent more likely
to succeed in a senior position. Yet the retention and development of top talent continues to be a struggle for many organizations. And without a conscious effort
to develop and retain future leaders, there is a greater risk for high attrition costs with a lack of qualified talent to fill the leadership pipeline. Hence it is crucial for
organizations to invest in their high-potential employees and successfully retain them.
We are part of an age and era where delivery has to be done on time, no delay accepted. For this to happen, the appropriate resource is necessary. Many companies
would have it to their advantage to devout their attention, time, money and effort to various development programs that identify and cultivate future leaders in
an organisation. Here, a special group of employees come into picture, the high potentials (HIPOs). There is a need for companies to formulate effective programs
for identifying and cultivating high potential individuals, but it lacks research on the actual process of identifying these employees and developing them. Organi-
sations want employees who are not just good performers, but also who have the interest (Middleton, 2011) and the ability to move into leadership roles within
the organisation. HIPOs are the future leaders of an organisation and they are rare.
Successful identification and training of HIPOs in an organisation result in 2 times revenue and profit growth for organisations with a stronger leadership strength.
Also, 1 in 7 high performers are fit to be nominated to be a HIPO. This clearly states that there is a prominent difference between high performers and high
potentials in an organisation. A high performer is not necessarily a high potential and a high potential not necessarily a high performer.
According to CLC Human Resources’ 2009 leadership performance survey, 87% of employees in an organisation lack a ready- now successor and only 13% have a
ready-now successor. This shows the importance of identifying and developing HIPOs in an organisation where the ready- now successor rate will increase consid-
erably, leading to better results in the market. (The corporate executive board company, 2010)
High potential employees, aka HiPos, are that illustrious group of people who are the rising stars in your organization. While your organization might have an
outlined method for distinguishing high-potential employees, what could also be missing is an outlined process for keeping them engaged thus helping in retaining
them.
J

VOLUME NO. 6 (2016), ISSUE NO. 11 (NOVEMBER) ISSN 2231-1009
INTERNATIONAL JOURNAL OF RESEARCH IN COMPUTER APPLICATION & MANAGEMENT A Monthly Double-Blind Peer Reviewed (Refereed/Juried) Open Access International e-Journal - Included in the International Serial Directories
http://ijrcm.org.in/
26
Because if you assume your HiPo staff are engaged, you risk underperformance and turnover. The key is to form a well-managed talent pipeline where HiPos see
a future for themselves in your organization.
And frankly, a well-managed talent pipeline can offer your organization a competitive edge, thus understanding what makes an employee a HiPo and the special
techniques you need to keep them engaged matters.
High-potential talent (HiPo) are workers who have the power and aspiration to achieve success leaders among a corporation. while it would make sense for a high-
performing employee to even have high potential, that’s not perpetually the case. an employee could be nice at their job and take pride in their work and accom-
plishments, however might not have the potential (or desire) to assume a leadership role.
The reason behind this overwhelming rate of incompletion is misidentifying high-performing employees with high potential (too often because of subjective
criteria), and also the undeniable fact that several HiPos don't seem to be engaged. the answer is to focus not solely on developing high-potential employees,
however equally on partaking and retaining them, too.
To stick a finger within the eye of high-potential development, several HiPos see the programs through to completion, solely to take with all of them their training
and new information to a competing company. the explanation for this is that prime potentials are in high demand, as a result of only one in each seven high
performers is truly a HiPo. the sole factor that keeps a HiPo from jumping ship is his or her engagement to the company.
OBJECTIVES 1. To understand the concept of high-potentials and high performers
2. To understand identification process of high potentials from among high performers
3. To suggest strategies for development of high potentials
BENEFITS OF EARLY IDENTIFICATION AND DEVELOPMENT
Not having the ability to differentiate between performance and potential will make it tough for employers to identify, develop and retain talent. All high potentials
are high performers, however not all high performers are high potentials. mistaking a high-performing employee for a high-potential employee can be pricey.
high-potential employees will be tougher to identify – particularly considering that performance and potential don't seem to be mutually exclusive.
People who know how to be an efficient manager apprehend that investing in their high-potential(HiPo) employees is dominant to future leadership bench
strength, men strategy, and succession designing, potentially doubling a company’s revenue and profit growth. But, as effective managers conjointly apprehend,
with any nice investment comes nice risk.
DISCUSSION Things to be kept in mind
1. The risk that the candidate might not succeed in achieving the senior position.
2. The risk that the quality of the employee is not up to the standards to be effective in a senior role for fruitful results.
3. The risk that the HIPO might leave your organisation being a valuable asset to your competitors
There are three major components that highly correlate to identifying the right candidates which are as follows:
1. ASPIRATION – to rise to senior roles
2. ABILITY – to be effective in senior roles
3. ENGAGEMENT – to commit and remain in the organisation
By assessing a candidate on these three attributes, the results of training the identified HIPO will be much more fruitful. (CEB SHL talent measurement, 2014)
The reason why the identification process is so important is because, 50% of the HR professionals lack confidence in their HIPO programme, and 5 out of 6 HR
professionals are dissatisfied with the programme. It is observed that 55% of the employees drop out of the HIPO programme within 5 years and 46% fail to meet
their business objectives in a new role. Only 1 in 7 are found to be fit for the programme. But one has to keep in mind that, all this is cause a selection process with
no rigid guidelines. Very few companies, 1 in 3 have a structured way of selecting the candidates for HIPOs programme. Rest of the companies work with intuition
which is a very high risk approach to the identification process. Hence it can be seen that even though performance is an important factor, it is not the primary
factor on which candidates are or should be selected as high potential employees (Middleton, 2011).
Stay interviews are also used to identify HIPOs in an organisation. Stay interviews are in the same lines of exit interviews just that here the employees are asked
for why are they staying in the organisation. In this manner, we get to what the employee likes and dislikes in the role given.
Assessments are a reliable and effective method of identifying HIPOs in an organisation. In this manner, different selection tools can be used, to determine the
qualification of various competencies being tested in a HIPO such as leadership or emotional intelligence. These tests can be group, individual or self-assessment
test.
Some of the companies also rely on a performance vs potential grid with the potential axis having attributes
1. Does not meet expectations
2. Meets expectations
3. Exceeds expectations
Hence employees are graded and plotted on this grid and selected accordingly. The ideal candidate will be the one with the highest performance rating and the
highest potential rating. (Conger and Fulmer, 2003)
If we believe that people are the most important asset for our organisation, then HIPOs are an even more valuable for the organisation. They are in fact twice as
valuable. This throws light on the importance of proper development of HIPOs in an organisation. At time business heads are unconvinced that the right people
are going through the programme, but have no structured answer to the issue.
The high performers in an organisation have the redeeming quality of sustained performance over the course of time in relatively similar situations or roles. On
the other hand, a HiPo has the ability to learn to deal with first time or changing situations, applying new and prior learning to each new challenge that is given to
them. It is to note that both talents are necessary for the organisation. The HiPos have simply not reached their full potential and due to this untapped potential,
are groomed for senior or C-Level roles.
Greater
bench
strength
For key
roles
Smoother
transitions
And shorter
learning
curves
Reduced
risk
Of derail-
ment
Enhanced
retention
Reduced
exposure
To people
risk
Quantifiable
Return on in-
vestment

VOLUME NO. 6 (2016), ISSUE NO. 11 (NOVEMBER) ISSN 2231-1009
INTERNATIONAL JOURNAL OF RESEARCH IN COMPUTER APPLICATION & MANAGEMENT A Monthly Double-Blind Peer Reviewed (Refereed/Juried) Open Access International e-Journal - Included in the International Serial Directories
http://ijrcm.org.in/
27
Role playing and challenging stimulations help build engagement and confidence in a HIPO to face challenging and new situations. Job rotation acts as an important
tool to develop the HIPOs, which helps them to stretch out from their normal jobs, giving them a wide variety of experience. This exposes them to various parts
of an organisation. Mentoring is another method adopted to provide support and feedback from the trusted peer. Group mentoring allow them to learn from not
only the mentor but from their peers as well. (Middleton, 2011)
Reverse mentoring is also gaining popularity, with the gen Y entering the workplace. This involves the subordinate mentoring the more experienced manager.
They provide the management with opinions and share ideas and knowledge. All this helps induce confidence in the HIPO.
Some companies like the Aditya Birla group, aim at investing in the best, but also to focus on the rest also. In other words, they believe everybody has the capability
to lead, but there is a necessity to differentiate between them and invest on only specific employees accordingly. (Aon Hewitt, 2013) Therefore, top companies
designate a status of ‘high potential’ to less than one quarter of their leadership population.
360-degree feedback, leadership style inventories as well as performance ratings and nominations are some of the tools used to assess high potentials and develop
them in the process. Cognitive ability tests, personality tests, assessment centre and simulations are some of the other very successful practices followed by
companies these days to not only assess but also develop the HIPOs in an organisation (Church and Rotolo, 2013)
A lot of times, the potential employee is not ready or is confused with the readiness of himself or herself to a senior level role or job. The judgement of potential
is based on whether the individual has the developmental orientation, balanced focus on values and results, motivations, mastery of complexity and other attrib-
utes needed for more senior or strategic levels. Readiness on the other hand is determined by knowing how ready the potential is to stretch roles, when judged
against specific leadership requirements. Therefore, judging potential and judging readiness are two different things, and different criteria are demanded by each
of them. (Hanson, 2011)
Despite having formal programs for the identification of high-potential employees a lot many companies fail to ensure consistency and objectivity in this process
and often tend to use ‘I can see it’ approach to identify high potentials without respecting the proven fact that high performers are not same as high potentials.
And so considering individual’s performance in the current job role has been deemed as one of the caveats of organisations in identifying high potentials for the
reason that employees identified on basis of their current performance will sooner or later be expected to take up job roles of much higher magnitudes in terms
of complexity and responsibility and that is when the employee may fail to perform due to lack of characteristics necessary for a high potential employee(Martin
and Schmidt, 2010).Thus it is imperative for organisations to first define the kind of functional knowledge, skills, abilities and behavioural characteristics they
expect their future leaders to possess so as to classify their high potentials for a formal identification program.
As explained by Downs (2015), high performers can be classified as someone who has great in-depth knowledge of their area of expertise, deliver superior results
year after year and are referred to as the ‘go-to’ person in the organisation, but contrary to this, high potentials are promotable even outside their immediate area
of expertise, exhibit higher learning agility and ability to deal with ambiguities or the VUCA environment. Hence it is clear that unlike high performers, high poten-
tials by virtue of their ability to adapt and deal with volatilities are better equipped to perform well in critical leadership roles in the organisation.
To Tell or Not? is one such question that troubles almost all organisations and managers with respect to disclosing the high potential status to their employees
and so, many previous publications have covered this topic extensively, stating the various advantages and disadvantages of disclosing the HiPo status. As per Dr
Sullivan (2011) the most prominent benefit of disclosing the status comes in the form of higher motivation and engagement of the identified employee. Since
being formally recognized is seen as an accomplishment, it sends a message to the individual of a brighter future in the organisation and thus reduce the probability
of him/her looking for other employment opportunities. The disclosure of the status also helps to prioritize and target the developmental resources towards the
identified talent without any ambiguity and also the person’s awareness of the intention behind developmental conversations helps to obtain better results out
of the developmental efforts.
Assuming an effective psychological contract, which is based on the concept of social exchange theory or reciprocity, an employee who gets recognized as high
potential tends to feel more valued and is likely to reciprocate with higher emotional engagement, due to their higher relational orientation wherein an employee
offers loyalty, commitment and sustained association with company values in exchange for professional career development. The identified employees are mostly
expected to have a higher sense of perceived distributive justice which results in increased work commitment and job satisfaction (Gelens, et.al. 2014). Also the
employees belonging to the identified talent pool are found to exhibit a greater organizational citizenship behaviour which involves providing discretionary support
to co-workers, responding to broader organisation’s needs and making voluntary efforts beyond the call of duty (Seopa et.al. 2015). And hence most organisations
tend to disclose their high potential list to the employees with an expectation to enhance their level of motivation and retention within the organisation.
But the disclosure of an employee’s high potential status has its own share of disadvantages and complications thus making it critical for the organisations to have
a well thought out approach so as to deal with the impact that such a disclosure has on the identified as well as non-identified employees.
The downside to this is that not many organisations realize that after getting to know their indispensability to the organisation, high potentials do expect to be
treated specially and thus any failure on part of the organization to provide them with stimulating work, recognition, compelling career paths and growth oppor-
tunities is likely to attract a feeling of disappointment and detachment among them. Thus in the event of any violation of psychological contract, the high potentials
are the first ones to cut back on efforts and actively seek employment outside. Also the organisations may not be able to cut down their salary and performance
based compensation during difficult business environments as this could lead to severe disengagement since pay is one of the primary ways in which HiPos are
made to feel recognized. This makes the decision of disclosing the status a double edged sword for the organisations. (Martin and Schmidt, 2010)
More so, this makes it important for organisations to take great care of their high potential employees by constantly involving them in decision making process
and making them feel special in the organisation. The organisation must also ensure that the tasks being delegated to such employees are challenging and offer
them full autonomy to make decisions. Also the assignments must offer flexibility for them to strike a desired work-life balance. They must be allotted effective
mentors, who they feel can develop their potential further into competencies and give them a greater visibility in terms of career progression and at the end, they
must be put in an environment that supports their growth and helps deal with the implicit pressure felt by most high potentials to perform up to people’s expec-
tations. (Grossman, Robert J. 2011)
Unlike the impact of such exclusive talent management approaches on the identified talent pool, what has been greatly underexplored by previous literature is its
impact on the ‘B’ players of the organisation, who constitute 70%of the workforce after accounting for the top 20% employees comprising of ‘A’ players and the
bottom 10% comprising of ‘C’ players. Since the basic premise of HiPo programs is the notion of ‘workforce differentiation’ which refers to investing dispropor-
tionate resources in only specific employees therefore the program surely has the potential to contribute to the perceived distributive, procedural and interper-
sonal injustice among the ‘B’ players if not implemented carefully. (Malik, et.al. 2014)
Also according to Malik, et.al. (2014) every employee tends to make internal attributions to the HiPo programs i.e. it perceives the cause of such implementation
to be in the control of management and only if these causes are perceived to be fair and in favour of employee well-being do they form commitment focused HiPo
attributions, as in the case of the ‘A’ players. On the contrary if the underlying goals are perceived to be of reducing costs and exploiting employees, they are more
likely to form control focused HiPo attributions, and so a sense of negativity towards the program is definite to be instilled in the minds of the non-identified talent
pool. Though one of the moderating factors in formation of controlled focused attributions could be the individual’s own motivation profile, which means that a
Performance
In the current role Potential
To create an effective
performer in a signifi-
cantly larger role over
the long run
Readiness
To step into and effec-
tively perform in a new
challenging role in the
near term

VOLUME NO. 6 (2016), ISSUE NO. 11 (NOVEMBER) ISSN 2231-1009
INTERNATIONAL JOURNAL OF RESEARCH IN COMPUTER APPLICATION & MANAGEMENT A Monthly Double-Blind Peer Reviewed (Refereed/Juried) Open Access International e-Journal - Included in the International Serial Directories
http://ijrcm.org.in/
28
non-identified person with a higher need for achievement and power might be more motivated to become an ‘A’ player and hence form positive HiPo attributions.
Therefore, organisations need to be extra cautious while implementing HiPo programs and ensure that there is complete visibility/transparency in selection pro-
cess, consistency in the policies and consensus of the senior management, to avoid losing the trust and support of its ‘B’ players.
POTENTIAL DERAILERS
Derailers are counterproductive personality traits and interpersonal strategies, which hinder the individual’s ability to build relationships, to motivate and create
cohesive and goal oriented teams in an organisation. They are usually triggered when the person is under pressure.
The usual profile of HiPos who fall into the derailment are the ones who are smart and are trained to push through obstacles to meet their ambitious goals. This
same hard working and risk taking style of the individual also cause them problems to work with their peers.
Other people who fall prey for this are the ones who have brilliant ideas and solutions, but who are inconsistent in their delivery, and succeed in implementing
their ideas only at times. A rigorous assessment process will reveal the ‘dark side of their personality’.
The Categories of High Potentials
1) Early Stage HIPO
These are recognized more for their talent and drive than their track record. They are emerging leaders at the beginning of their careers. These days the top
performing companies recognize more of early potentials and put them in pipeline and soon the organization will reap the benefits of it
2) Late stage HIPO
These are experienced managers ready to make their way in the executive ranks. These are at the middle or the senior level and given a lot of formal training,
specialized mentoring, executive retreats, personal coaching, real-world action learning, global rotation, and more. These senior managers are among the top 10
percent of an organization, and significant costs are incurred to prepare them for senior executive roles within the organization.
Attributes of HIPO employees
1) HIPOs will have an uncontrolled aggression and a driving force to do something.
2) They have an uncommon ability to analyse and synthesize large amount data.
3) They are comfortable with uncertainty and ambiguity.
4) They are passionate about learning and or growth.
5) Dissatisfied with the status quo
6) They can collaborate effectively with everyone.
7) They communicate with clarity.
They expect more development, support and investment and are more committed and engaged when they have a clear career path. They thrive on challenges
and variety.
RECOMMENDATION This sections attempts to recommend the organisations on how to identify, develop and retain their high-potentials. The organisation must first invest in develop-
ing a consistent and objective program for the identification of high-potential programs, which takes into consideration not just the current performance but also
the future potential of the employee by gauging an employee’s learning agility, career variation, aspiration and degree of engagement. This can be done objectively
by reviewing the performance appraisals which can elicit information on the person’s skills and consistency in achieving targets and hence could be seen as a
reflection of his result oriented approach. Similarly evaluating a person on learning agility and career variation would also tell the employer the extent to which
he/she would be able to adapt changes and respond appropriately to them at higher positions. Also the managers could try probing an individual on his develop-
ment and career growth plans and therefore know if the person is even willing to move up to the leadership roles.
The organisations must also devote a substantial amount of their resources in developing the identified pool of talent by continuously providing them opportunities
to challenge their potential. They must be confronted with stretch assignments that may require the employee to expand his scope of expertise beyond the
comfort zone and help them develop holistically as future leaders. But the organizations must also remember not to go over the top with building expectations
from their HiPos, so much so that it might lead to pressurizing them beyond their threshold and eventually result in break down. The organisation must also be
proactive in assigning effective mentors to these identified individuals who could guide them through the journey of becoming future leaders.
But what remains the most important aspect of the implementation of HIPO programs is the perceived distributive and procedural justice of the program by
ensuring transparency, consistency and consensus of top management as failing to do so may cost the organisation the trust of its non-identified employees and
result in higher attrition rates among the non-identified talent pool. Also the organisation must be careful in maintaining their HIPOs since once identified, they
become aware of their self-worth and hence any instance of the organisation not meeting their expectations in terms of keeping them engaged may trigger the
need to switch their jobs. So the organisations must always compensate them adequately and offer them flexible yet challenging job roles.
CONCLUSION Even though the basic premise of the HIPO programs strictly deviates from the inclusive talent management approach which believes in investing equal resources
in the development of all the employees, but still considering the level of ambiguity and volatility surrounding the global business environment it becomes essential
for all organisations to invest disproportionate resources in developing only a few employees who may have been identified to have the required learning agility,
career variation and aspirations. It is also important to identify such potential for the simple reason that these individuals by virtue of their abilities and attitude
contribute substantially more than their counterparts in terms of productivity and exhibit potential to do even better. Thus having a consistent and objective HIPO
program in place works in favour of the organisations to deal with VUCA environment
REFERENCES 1. Adam, L., Valérie, S., David, H., & Marieke, H. (2011). The Role of ‘High Potentials’ in Integrating and Implementing Corporate Social Responsibility. Journal
of Business Ethics, 99(1), 73-91.
2. Adams, D. (2011). Using assessments for high-potential identification. Employment Relations Today, 38(2), 7-13.
3. Beninger, A. (2013). High-Potential Employees in the Pipeline: Maximizing the Talent Pool in Canadian Organizations. Toronto: Catalyst.
4. Branham, L. (2005). Planning to become an employer of choice. Journal of Organizational Excellence, 24(3), 57-68.
5. Brienza, D., & Cavallo, K. (2002). Emotional competence and leadership excellence at Johnson & Johnson: The emotional intelligence and leadership
study. Consortium for Research on Emotional Intelligence in Organizations.
6. Bringing Leadership, 5(9), 9-12.
7. Campbell, M & Smith, R. (2014). High-potential: Talent A View from Inside the Leadership Pipeline. Center for Creative Leadership, 34(4),
8. Church, A.L.L.A.N.H & Rotolo, T. (2013). How Are the Top Companies Assessing their High-Potentials and Senior Executives? A Talent Management Bench-
mark Study. Consulting Psychology Journal, 65(3), 199-223.
9. Derr, C., Jones, C., & Toomey, E. L. (1988). Managing high-potential employees: Current practices in thirty-three US corporations. Human Resource Manage-
ment, 27(3), 273-290.
10. Downs, L. (2015). Star talent: investing in high-potential employees for organizational success. Industrial and Commercial Training, 47(7), 349-355.
11. Dries, N., & Pepermans, R. (2007). “Real” high-potential careers an empirical study into the perspectives of organisations and high potentials. Personnel
Review, 37(1), 85-108.
VOLUME NO. 6 (2016), ISSUE NO. 11 (NOVEMBER) ISSN 2231-1009
INTERNATIONAL JOURNAL OF RESEARCH IN COMPUTER APPLICATION & MANAGEMENT A Monthly Double-Blind Peer Reviewed (Refereed/Juried) Open Access International e-Journal - Included in the International Serial Directories
http://ijrcm.org.in/
29
12. Forret, M. L. (1996). Issues facing organizations when implementing formal mentoring programmes. Leadership & Organization Development Journal,17(3),
27-30.
13. Fu, W., Deshpande, S. P., & Zhao, X. (2011). The impact of ethical behaviour and facets of job satisfaction on organizational commitment of Chinese employ-
ees. Journal of Business Ethics, 104(4), 537-543.
14. Fulmer, R & Conger, J. (2003). Developing Your Leadership Pipeline. Harvard Business Review.
15. Gelens, J. (2014). Talent management and organisational justice: employee reactions to high potential identification. Human Resource Management Jour-
nal, 24(2),
16. Grossman, R. J. (2011). THE CARE AND FEEDING OF HIGH-POTENTIAL EMPLOYEES. (cover story). HR Magazine, 56(8), 34-39.
17. HARDESTY, D., & JONES, W. (1968). CHARACTERISTICS OF JUDGED HIGH POTENTIAL MANAGEMENT PERSONNEL–THE OPERATIONS OF AN INDUSTRIAL
ASSESSMENT CENTER. Personnel Psychology, 21(1)
18. Hermans, J. (2007). High Potentials: A CEO Perspective. Journal of Studies in International Education, 11(3-4), 510
19. Hewitt, A.O.N. (2013). Building the Right High Potential Pool. AON Hewitt, (1),
20. Hor, F. C., Huang, L. C., Shih, H. S., Lee, Y. H., & Lee, E. S. (2010). Establishing talent management for company’s succession planning through analytic network
process: Application to an MNC semiconductor company in Taiwan. Computers & Mathematics with Applications, 60(3), 528-540.
21. Iles, P. (1997). Sustainable high-potential career development: a resource-based view. Career Development International, 2(7), 347-353.
22. Joseph, C. (2013). Leveraging a women's network to attract, develop and retain high potential female talent. Strategic HR Review, 12(3), 132-137.
23. Kelly, K. (2013). Identifying High-Potential talent in the Workplace. Director of Marketing & Business Development: UNC Executive Development.
24. Korosteleva, J. (2009). Internationalization and high-potential entrepreneurship. Thunderbird International Business Review, 51(3), 311-315.
25. Kotlyar, I. (2013). The Double Edge Sword of "High Potential" Expectations. Europe's Journal of Psychology, 9(3), 518-596. doi:10.5964/ejop.v9i3.620
26. Kuruppu, S., & Milne, M. J. (2010, March). Dolphin deaths, organizational legitimacy and potential employees’ reactions to assured environmental disclosures.
In Accounting Forum (Vol. 34, No. 1, pp. 1-19). Elsevier.
27. Larsen, H. H., London, M., Weinstein, M., & Raghuram, S. (1998). High-flyer management-development programs: organizational rhetoric or self-fulfilling
prophecy? International Studies of Management & Organization, 28(1), 64-90.
28. Lombardo, M., & Eichinger, R. (2000). High potentials as high learners. Human Resource Management, 39(4), 321-329.
29. Malik, A., & Singh, P. (2014). ‘High potential’ programs: Let's hear it for ‘B’ players. Human Resource Management Review, 24(4), 330-346.
30. McNatt, D. B., & Judge, T. A. (2008). Self-efficacy intervention, job attitudes, and turnover: A field experiment with employees in role transition. Human
Relations, 61(6), 783-810.
31. Michlitsch, J. F. (2000). High-performing, loyal employees: The real way to implement strategy. Strategy & Leadership, 28(6), 28-33.
32. Middleton, C. (2011). Analysis of the Identification and development of High Potential Employees. University of Wisconsin-Stout,
33. Northcraft, G. B., Griffith, T. L., & Shalley, C. E. (1992). Building top management muscle in a slow growth environment: How different is better at Greyhound
Financial Corporation. The Executive, 32-41.
34. Nurita Juhdi, Fatimah Pa’wan, Rammilah Hansaram, (2015) "Employers’ experience in managing high potential employees in Malaysia", Journal of Manage-
ment Development, Vol. 34 Iss: 2, pp.187 – 20
35. Opengart, R., & Short, D. C. (2002). Free agent learners: the new career model and its impact on human resource development. International Journal of
Lifelong Education, 21(3), 220-233.
36. Peters, J., & Smith, P. (1996). Developing high- potential staff - an action learning approach. Employee Counselling Today, 8(3), 6-11.
37. Ready, D., Conger, J., Hill, L., & Stecker, E. (2010). THE ANATOMY OF A HIGH POTENTIAL. Business Strategy Review, 21(3),
38. Rothwell, W. J. (2010). Effective succession planning: Ensuring leadership continuity and building talent from within. AMACOM Div American Mgmt Assn.
39. Shaheen, J. (2010). Talent acquisition as a potent tool of succession management. Journal of Corporate Recruitin
40. Slan-Jerusalim, R., & Hausdorf, A.P. (2007). Managers' justice perceptions of high potential identification practices. Journal of Management Development,
26(10), 933-950.
41. Smedlund, A. (2008). Identification and management of high-potential professional services. Management Decision, 46(6), 864-879.
42. Snipes, J. (2015, no-date). Identifying and Cultivating High-Potential Employees. [Weblog]. Retrieved 30 January 2016, from http://www.clomedia.com/arti-
cles/identifying_and_cultivating_high_potential_employees
43. Spreitzer, G. M., McCall, M. W., & Mahoney, J. D. (1997). Early identification of international executive potential. Journal of Applied Psychology, 82(1), 6.
44. Sullivan, D.R. J. (2011, 14 November 2011). Succession Planning: Why Releasing the Names of High Potentials Is a Smart Move. [Weblog]. Retrieved 30 Janu-
ary 2016, from http://www.eremedia.com/ere/succession-planning-why-releasing-the-names-of-high-potentials-is-a-smart-move/
45. Tarrant, D. (2013). Life in the fast lane.
46. Vloeberghs, D. F. (2002). Grooming Leaders in the Netherlands. Cross-cultural Approaches to Leadership Development, 123.
47. Vloeberghs, D., Pepermans, R., & Thielemans, K. (2005). High-potential development policies: an empirical study among Belgian companies. Journal of Man-
agement Development, 24(6), 546-558.
48. Yang, X. (2002). From Revolutionaries to Political Entrepreneurs: Selecting Leaders for China's Modern State-Owned Enterprises. Cross-Cultural Approaches
to Leadership Development, Westpoint: Quorum Books, 168-189.

VOLUME NO. 6 (2016), ISSUE NO. 11 (NOVEMBER) ISSN 2231-1009
INTERNATIONAL JOURNAL OF RESEARCH IN COMPUTER APPLICATION & MANAGEMENT A Monthly Double-Blind Peer Reviewed (Refereed/Juried) Open Access International e-Journal - Included in the International Serial Directories
http://ijrcm.org.in/
30
DIGITAL MARKETING: THE SUCCESS MANTRA
V.SRAVANI CHARI
ASSOCIATE PROFESSOR
ST. PAULS COLLEGE OF MANAGEMENT & IT
TURKAYAMJAL
ABSTRACT The rapidly emerging digital economy is challenging the relevance of existing marketing practices, and a radical redesign of the marketing strategies consistent
with the emerging business needs of the 21st century. To remain relevant, businesses must evolve with both the changing technological environment and the way
marketing is perceived by its consumers. The article focuses on the concept of digital marketing, how it is different from traditional marketing, gaining importance
of Digital Marketing, its framework and the major challenges faced by digital marketers today.
KEYWORDS digital marketing, traditional marketing, search engine optimization, social media marketing, content marketing, pay per click.
INTRODUCTION oday we are living in a super-connected world, as such advertising and marketing are no longer the same birds they once were. This is principally true due
to the ascend of social media, which has changed the way of how of business communicate with their potential and existing clients. Internet has opened
doors of vast variety of options for businesses. Employing social networks, one can not only share a private picture of one’s birthday but can also get
customers for one’s business and attain them conveniently. The tempo and ease, with which the digital media transmits information and help heighten a business
is incredible.
WHAT IS DIGITAL MARKETING
PHOTO 1
Digital Marketing is a collective term which is used where marketing is integrated with internet technology and other forms of new media. It is the term used for
the targeted, measurable, and interactive marketing of products or services using digital technologies to reach the viewers, turn them into customers, and retain
them. In simple terms - Digital Marketing is the promotion of products or brands via one or more forms of electronic media. Digital Marketing is the marketing
that makes use of electronic devices (computers) such as personal computers, smart phones, cell phones, tablets, and game consoles to engage with stakehold-
ers/customers. It is the process of building and maintaining customer relationships through online activities to facilitate exchange of ides, products and services
that satisfy the services of both the parties. It entails marketing of goods and services using digital technologies and digital mediums. It applies technologies or
platforms such as websites, e-mail, apps (classic and mobile) and social networks.
DIGITAL MARKETING VS TRADITIONAL MARKETING Digital marketing differs from traditional marketing.
The following table lists a few points that differentiate digital marketing from traditional marketing:
TABLE 1
Traditional Marketing Digital Marketing
Communication is unidirectional. Means, a business communicates
about its products or services with a group of people.
Communication is bidirectional. The customer also can ask queries or make sugges-
tions about the business products and services.
Medium of communication is generally phone calls, letters, and Emails. Medium of communication is mostly through social media websites, chat, and Email.
Campaigning takes more time for designing, preparing, and launching. There is always a fast way to develop an online campaign and carry out changes along
its development. With digital tools, campaigning is easier.
It is carried out for a specific audience throughout from generating cam-
paign ideas up to selling a product or a service.
The content is available for general public. It is then made to reach the specific audi-
ence by employing search engine techniques.
It is conventional way of marketing; best for reaching local audience. It is best for reaching global audience.
It is difficult to measure the effectiveness of a campaign. It is easier to measure the effectiveness of a campaign through analytics.
T

VOLUME NO. 6 (2016), ISSUE NO. 11 (NOVEMBER) ISSN 2231-1009
INTERNATIONAL JOURNAL OF RESEARCH IN COMPUTER APPLICATION & MANAGEMENT A Monthly Double-Blind Peer Reviewed (Refereed/Juried) Open Access International e-Journal - Included in the International Serial Directories
http://ijrcm.org.in/
31
IMPORTANCE OF DIGITAL MARKETING Digital media is so invasive that consumers have access to information any time and any place they want it. It provides an ever-growing source of entertainment,
news, shopping and social interaction and customers are now exposed to what the company says about its brand but what media, friends, relatives, peers etc. are
saying as well. With the constant growing of web and more people getting connected everyday, digital marketing has become a necessity for many organizations.
People are going online for more and more information about a new product, service or location.
FRAMEWORK OF DIGITAL MARKETING Digital marketing framework can be explained in the following figure.
FIG. 1
SOCIAL MEDIA MARKETING Social Media Marketing (SMM) is the process of generating website traffic or attracting viewers and customers through social networking websites such as Face-
book, Pinterest, LinkedIn, Twitter, and so on. Social media marketing is a subset of digital marketing.
FIG. 2
SMM allows two-way communication between company and consumer in a way that wasn’t previously seen. It has changed the approach of business towards
marketing, now the consumer holds the power rather than the company itself.
All social networking websites support sharing of content, but all are not necessarily employed for digital marketing. While Facebook emphasizes on personal
sharing, Twitter emphasizes on tweeting short messages about ones’ opinions or reactions, and LinkedIn goes for professional networking, Pinterest motivates to
market one’s ideas and online businesses.
SEARCH ENGINE OPTIMIZATION (SEO) SEO or Search engine optimization is a technique that allows a site to get more traffic from search engines like Google, Microsoft, Yahoo etc. It is a means of
optimizing the content of a website in order to gain better placement on the Search Engine Results Page (SERPS). SEO improves competitive edge, expands cus-
tomer base and target audience, is cost effective and measurable and has global reach.
SEO includes:
• Keyword research and usage, on-page and off (within HTML)
• Link building/ outreach blogging
• Content delivery
• Site Structure
• Analytics
CONTENT MARKETING The goal of Content marketing is to retain and attract customers by consistently creating valuable and relevant content with the intention to engage targeted
audience in order to drive profitable customer action. It is a technique where content is produced and distributed with the intention of providing relevant, inter-
esting content to attract and engage a particular audience that a business is targeting. The creation of useful content is a way of developing communication with
the customer in order to drive engagement and customer action.

VOLUME NO. 6 (2016), ISSUE NO. 11 (NOVEMBER) ISSN 2231-1009
INTERNATIONAL JOURNAL OF RESEARCH IN COMPUTER APPLICATION & MANAGEMENT A Monthly Double-Blind Peer Reviewed (Refereed/Juried) Open Access International e-Journal - Included in the International Serial Directories
http://ijrcm.org.in/
32
ADVERTISING Online Advertising has multitude of benefits over traditional advertising and the chief difference is targeting. Most of the online marketing platforms accept
banner/text/rich media ad formats which are billed in three ways:
� Pay per Click (PPC): PPC is a type of sponsored online advertising that is used on a wide range of websites including search engines where the advertiser only
pays if a web user clicks on their ad
� Cost for Thousand (CPM): In CPM, the advertiser pays for each 1000 ad views that the ad gets,
� Cost per lead (CPL): In this the advertiser pays for an explicit sign up from an interested consumer who is interested in the advertiser's offer
THE 7 C”S OF DIGITAL MARKETING The 7C’s of Digital Marketing can be seen in the following figure
CHALLENGES FACING DIGITAL MARKETERS Proliferation of Digital Channels: Consumers use multiple digital channels and a variety of devices that use different protocols, specifications and interfaces – and
they interact with those devices in different ways and for different purposes.
Intensifying Competition: Digital channels are relatively cheap, compared with traditional media, making them within the reach of every business of every size.
As a result, its becoming harder to capture consumer’s attention.
Exploring data volumes: Consumers leave behind a huge trial of data in digital channels. It’s extremely difficult to get hold of all that data, as well as to find the
right data within those exploring data volumes.
CONCLUSION Virtual reality will become more and more popular in future and it will definitely play a significant role in sales and marketing in the future. Thus Digital Marketing
will represent a convergence of ideation, relationship management, data analyses and technology. Digital Marketing will become a major enabler of human buying
behavior.
REFERENCES 1. Damian Ryan, Calvin Jones – Understanding Digital Marketing – Marketing Strategies for Emerging the Digital Generation. (2009)
2. Dave Evans, Jake Mckee Social Media Marketing: The Next Generation of Business Engagement. (2011)
3. Siddhartha Singh – 7 Steps to Digital Marketing Strategy Guide, EBook 2015.
4. Weber, L. 2009. Marketing to the Social Web: How Digital Customer Communities build your Business. Second Edition. N.J, USA: John Wiley & Sons.
WEBSITES
5. www.guru99.com
6. www.linkedin.com
7. www.sas.com
8. www.slideshare.net
9. www.tutorialspoint.com
CONVERSATION
CUSTOMIZATION
DIGITAL
MARKETING
CONVERGENCE CONTEXT
COLLABORATION
CONVENIENCE
CONTENT
VOLUME NO. 6 (2016), ISSUE NO. 11 (NOVEMBER) ISSN 2231-1009
INTERNATIONAL JOURNAL OF RESEARCH IN COMPUTER APPLICATION & MANAGEMENT A Monthly Double-Blind Peer Reviewed (Refereed/Juried) Open Access International e-Journal - Included in the International Serial Directories
http://ijrcm.org.in/
33
TEXTILE EXPORTERS IN INDIA: A CASE STUDY OF TIRUPUR
DR. G. YOGANANDAN
ASSOCIATE PROFESSOR
PERIYAR INSTITUTE OF MANAGEMENT STUDIES
PERIYAR UNIVERSITY
SALEM
ABSTRACT The apparel industry in India includes woven and knitted garment industry. Tirupur is a dominant player in the knitting garment sector. This industry is also called
as hosiery sector, hosiery garment sector, knitted garment apparel sector and knitted garment sector. Tirupur is known for the cluster activity and mostly each
activity of garment making is being carried out in the outside units viz., knitting units, dyeing & bleaching units, fabric printing, garmenting, embroidery, compacting
and calendaring and other ancillary units. To study the socio-economic profile of the exporters, the researcher used a validated questionnaire and survey method
was employed to collect the first hand information from 600 sample respondents (apparel exporters) who are members of Tirupur Exporters Association (TEA).
Tirupur Exporters Association, popularly known as TEA, was established in the year 1990. Today, TEA has a membership of 897 life members. The data thus collected
were tabulated for easier analysis and interpretation. Statistical tools like Percentage, Average, Standard Deviation, Two-way table and Chi-square test were em-
ployed. The research was carried out during 2012 to 2013. The study found that there are 3.3% of apparel exporters with annual turnover of less than Rs.1 crore,
68.8% of apparel exporters with annual turnover of Rs.1-10 crore, 20.2% of apparel exporters with annual turnover of Rs.10-20 crore and 7.7% of apparel exporters
with annual turnover of more than Rs.20 crore. The study also found that the exporters lack professionalism the fact that majority of the exporters are not profes-
sionally qualified. Of late, the entrepreneurs have started to diversify their export business and also have taken efforts to brand their export products. Yet, the
infrastructural bottlenecks create hindrance to the growth of export businesses and the government has to speed up the industry modernization process through
enhanced promotional measures so as to increase the textile exports from India.
KEYWORDS India, entrepreneurs, exporters, textile industry, tirupur.
INTRODUCTION he apparel industry in India includes woven and knitted garment industry. Tirupur is a dominant player in the knitting garment sector. The apparel exporters
in Tirupur mostly produce and export knitted garments and the share of woven garment is insignificant when compared with knitted garment production
and exports. In India, the other major knitted garment production centres are Ludhiana, Delhi, Kolkata and Mumbai (Yoganandan, Growth of Apparel
Export Industry in Tirupur, India, 2015). This industry is also called as hosiery sector, hosiery garment sector, knitted garment apparel sector and knitted garment
sector (Jayabharathi,2010). Tirupur is spread over 27.20 sq. kms and the seventh largest town in Tamil Nadu and 60 kms. from Coimbatore, the Manchester of
Southern India (Yoganandan, An overview of Tirupur: The Textile city in India, 2015). It has grown by encompassing peripheral villages like Avinashi, Nallur, Man-
galam, Kangeyam, Palladam, Koduwai, which are situated around 15-20 km. radius from Tirupur (Devaraja TS, 2011). Tirupur is also called as the Knitwear city,
Banian city, Kutti (Small) Japan, Dollar city and is surrounded by other regions (cities) famous for their contribution to textile industry (Vetrivel T & Manivannan L,
2011). Apparel industry in Tirupur is predominantly a small scale industry where large numbers of players are small exporters (Yoganandan, External factors
influencing textile exports of Tirupur: An application of Factor Analysis, 2015). The exporters in Tirupur focus on low-volume mid-fashion segment particularly the
women and children wear segments.
CAPACITY OF UNITS IN VARIOUS OPERATIONS Tirupur is known for the cluster activity and mostly each activity of garment making is being carried out in the outside units viz., knitting units, dyeing & bleaching
units, fabric printing, garmenting, embroidery, compacting and calendaring and other ancillary units. There were 3000 knitwear exporters, 2000 knitwear domestic
business oriented business houses, 1000 garment making units 100 embroidery units, 764 fabric printing units, 100 compacting units, and 729 dyeing units in 2009
(Office of Special Officer, 2009). Even though it has so many business organizations and it identified as textile cluster, it is facing certain challenges in the form of
non-availability of quality infrastructure in the form of poor road connectivity, power supply problems, sea port and airport connectivity problems etc. (Yoganan-
dan, Jaganathan, Saravanan, & Senthil kumar, 2013).
TIRUPUR EXPORTERS ASSOCIATION (TEA) AND ITS ACHIEVEMENTS Tirupur Exporters Association, popularly known as TEA, was established in the year 1990. This is an Association exclusively for exporters of cotton knitwear who
have production facilities in Tirupur. From the modest beginning TEA has now grown into a strong body of knitwear exporters. Today, TEA has a membership of
897 life members (TEA, 2012).
WHY DO NATIONS EXPORT? Exports mean selling the home country’s goods/services in other countries (Kumar, 2007). Export is a function of international trade whereby goods produced in
one country are shipped to another country for future sale or trade (Investopedia, 2013). No country in the world is self sufficient in everything she consumes. The
role of entrepreneur is critical in making the country self sufficient (Yoganandan & Vetriselvan, Entrepreneurship development in India, 2016).The disproportionate
endowment of resources throughout the world made economies to go for exports and imports. The countries in the gulf region have abundant petroleum, China,
Australia, United states of America and South Africa have abundant gold, Russia has natural gas, Botswana, Russia and South Africa are the leading producers of
diamond, China, India, United States of America, Pakistan and Brazil are the leading cotton producing countries and India, China, Indonesia and Thailand are the
leading producers of rice. But these economies need many other consumables (good and services) to survive. Hence, they have to engage in international trade
by exporting the surplus of goods and services against import of all other goods and services the production of which is inadequate. Thus, the primary reason for
exports is to import, that is to earn foreign exchange to pay for her imports. The export and imports of developing countries like India and Pakistan gained mo-
mentum after the reforms that took place in 1990 (Yoganandan, Globalization of Pakistan, 2010).
METHODOLOGY In this article an attempt was made to study the socio, economic profile of textile exporters in Tirupur. This article draws lots of inputs from the doctoral research
thesis submitted to Anna University, Chennai. A field survey method was employed to collect the first hand information from 600 sample respondents (apparel
exporters). The data thus collected were tabulated for easier analysis and interpretation. Statistical tools like Percentage, Average, Standard Deviation, Two-way
table and Chi-square test were employed. The apparel exporters have been chosen from the Tirupur Exporters‟ Association (TEA), Tirupur. The research was
carried out during 2012 to 2013.
T

VOLUME NO. 6 (2016), ISSUE NO. 11 (NOVEMBER) ISSN 2231-1009
INTERNATIONAL JOURNAL OF RESEARCH IN COMPUTER APPLICATION & MANAGEMENT A Monthly Double-Blind Peer Reviewed (Refereed/Juried) Open Access International e-Journal - Included in the International Serial Directories
http://ijrcm.org.in/
34
ANALYSIS AND DISCUSSIONS Distribution of apparel exporters based on turnover: An attempt was made to classify the apparel exporters based on their annual turnover. The Tirupur Export-
ers‟ Association (TEA), Tirupur has 900 apparel exporters as members out of which 600 apparel exporters are contacted. The researchers used stratified propor-
tionate random sampling method to gather the data from apparel exporters who are members of The Tirupur Exporters‟ Association (TEA), Tirupur. For this
purpose, the four strata have been identified viz., exporters with annual turnover of less than Rs.1 crore, Rs.1-10 crore, Rs.10-20 crore and more than Rs.20 crores.
TABLE 1: DISTRIBUTION OF APPAREL EXPORTERS BASED ON TURNOVER
S. No. Turnover and Classification No. of apparel exporters Percentage
1 Less than Rs.1 crore
(Micro exporters)
20 3.3
2 Rs.1-10 crore
(Small exporters)
413 68.8
3 Rs.10-20 crore
(Medium exporters)
121 20.2
4 More than Rs.20 crore
(Large exporters)
46 7.7
Total 600 100 Source: Primary data
It is clear from the table 1 that in the chosen sample there are 3.3% of apparel exporters with annual turnover of less than Rs.1 crore and they may be called as
micro exporters, 68.8% of apparel exporters with annual turnover of Rs.1-10 crore and they may be called as small exporters, 20.2% of apparel exporters with
annual turnover of Rs.10-20 crore and they may be called as medium exporters and 7.7% of apparel exporters with annual turnover of more than Rs.20 crore and
they may be called as large exporters. It is inferred that majority 68.8 % of apparel exporters are small exporters with annual turnover of Rs.1-10 crore. This reflects
the nature of apparel export industry in Tirupur which is still predominantly a small scale industry. This also explains why the government of India is taking many
promotional activities to rejuvenate the growth of textile export industry in Tirupur (Yoganandan, Textile Export Promotion in India-Salient Features, 2015).
Distribution of apparel exporters based on period of establishment: An attempt was made to find out the period of establishment of apparel exporters‟ business.
This would help one to understand the trend in new apparel export business getting started and also to understand the period in which the new entrants into the
industry was at the maximum. For this purpose, the apparel exporters based on period of establishment are classified into three viz., apparel export firms that
were established before 1995, during 1995-2005 and after 2005. It is found from the study that 38.3% of apparel exporters started their export business before
1995, 43.7% of apparel exporters started their export business during 1995-2005 and 18.0% of apparel exporters started their export business after 2005. Hence,
it is inferred that majority 43.7% of apparel exporters started their export business during 1995-2005. Interestingly, this coincides with the period when the reform
process or economic liberalization has been introduced in India.
Distribution of apparel exporters based on age-group of the promoter: The apparel exporters are categorised into three age-groups namely aged less than 40
years, aged between 40-55 years and aged more than 55 years. The study found that 35.2% of apparel exporters belong to the age-group of less than 40 years,
50.3% of apparel exporters belong to the age-group of 40-55 years and 14.5% of apparel exporters belong to the age-group of more than 55 years. It is inferred
that majority 50.3% of apparel exporters belong to the age-group of 40-55 years. The above finding highlights the fact that apparel export business is slowly moving
into the hands of younger generation of entrepreneurs.
Business experience of promoters: Experience may play a significant role in the conduct of apparel export business. For this purpose, the experience of the apparel
exporters is categorised into groups viz, less than 10 years, 10-20 years and more than 20 years. The study found that 38.7% of apparel exporters have less than
10 years of experience, 28.3% of apparel exporters have 10–20 years of experience and 33.0% of apparel exporters have more than 20 years of experience.
Therefore, it could be inferred that majority 38.7% of apparel exporters (apparel exporters) have less than 10 years of experience in the apparel export business.
This indicates that the apparel export industry still attracts more and more entrepreneurs into export business.
Educational qualification of promoters: An understanding of the educational background would help in relating the current changes in educational background
and of apparel exporters in Tirupur. For this purpose, the exporters are categorised into educational qualifications viz., Illiterate, Completed schooling (Higher
Secondary Course), Undergraduates and Postgraduates. It is found that 6.3% of apparel exporters are illiterates, 43.7% of apparel exporters have completed
schooling (HSC), 35.5% of apparel exporters are undergraduates and 14.5% of apparel exporters are postgraduates. This shows that though there is visible change
in the educational background of apparel exporters as there are more and more exporters started acquiring higher qualification, still majority of the apparel
exporters have only completed their schooling (Yoganandan, The strategies and expectations of apparel exporters in Tirupur, India, 2015).
Distribution of apparel exporters based on markets diversified: To understand the apparel industries ability, willingness to take risk and interest to serve buyers
in many countries the apparel exporters are classified into four categories viz., apparel exporters exporting to less than 3 countries, apparel exporters exporting
to 3-6 countries, apparel exporters exporting to 6-10 countries and apparel exporters exporting to more than 10 countries. It is found from the study that 21.0%
of apparel exporters export to less than 3 countries, 49.2% of apparel exporters export to 3-6 countries, 23.3% of apparel exporters export to 6-10 countries and
6.5% of apparel exporters export to more than 10 countries. Hence, it is inferred that majority 49.2% of apparel exporters export to 3-6 countries. This shows that,
the apparel exporters in Tirupur have not yet diversified in a big way in terms of geographical coverage covering more countries (Yoganandan & Saravanan, Export
performance of Indian Textile industry during post reform period (1991 to 2010), 2011).
Distribution of apparel exporters on the basis of brand ownership: The brand ownership may influence their export performance; hence it is important to find
out the brand ownership status of apparel exporters in Tirupur. For this purpose, the apparel exporters are categorised into exporters who use only buyers‟ brand
and exporters who also have own brand. It is clear from the findings of the research that 81.3% of apparel exporters in Tirupur manufacture and export only in
buyers‟ brand whereas the rest 18.7% of exporters manufacture and export not only in buyers‟ brand but also in their own brand. These findings match with the
findings of Karthikeyan & Ramachandran (2009) who highlighted the need to establish strong brands in the international market. Also, the global recession played
negatively on the efforts taken by the exporter to market the products under their own brand (Yoganandan & Saravanan, Impact of global recession on global
textile exports and imports, 2015).
Distribution of apparel exporters on the basis of manufacturing activity: To study the distribution of apparel exporters in Tirupur on the basis of manufacturing
activity, the apparel exporters are categorised into manufacturing exporters who complete the production of entire export order by themselves, manufacturing
cum merchandising exporters who give part of their export order to sub-contractors and merchandising exporters who completely rely on sub-contractor for entire
production of export order. It is found that that 36.2% of apparel exporters all under the category of manufacturing cum merchandising exporter, 63.8% of apparel
exporters fall under the category of manufacturing exporters, and there is no merchandising exporter in the chosen sample.
Apparel exporters and usage of Indian and foreign machines: An attempt was made to study the usage of foreign and Indian machines in the manufacturing and
processing activities. The apparel exporters may use both Indian and foreign machines in their production process. It is found that all the apparel exporters in
Tirupur have both knitting and garment stitching machines. But only 43.8% of apparel exporters have foreign made knitting machines and only 45.8% of apparel
exporters have foreign made garment stitching machines. This finding is in line with the findings of Shanmugasundaram. According to Shanmugasundaram et al.,
(2010), exporters in order to reduce cost chose inferior quality of yarn and also used indigenous machineries for their knitting and this research also confirms that
only 43.8 % of apparel exporters use foreign made machines for knitting (similarly for other processing activities) although they also use Indian made machines.
Regarding dyeing and bleaching, 83.6% of exporters do not have their own dyeing units and depend on other independent dyeing and bleaching units. In case of
fabric printing, 44 % of apparel exporters have Indian and foreign fabric printing machines whereas 16.6% of apparel exporters do not have any fabric printing

VOLUME NO. 6 (2016), ISSUE NO. 11 (NOVEMBER) ISSN 2231-1009
INTERNATIONAL JOURNAL OF RESEARCH IN COMPUTER APPLICATION & MANAGEMENT A Monthly Double-Blind Peer Reviewed (Refereed/Juried) Open Access International e-Journal - Included in the International Serial Directories
http://ijrcm.org.in/
35
machine and they are dependent on other units. 77% of apparel exporters have Indian embroidery machines and 67% of apparel exporters have foreign embroidery
machines. In the compacting and calendaring, around 20 % of exporters have either Indian made or foreign made machines. 71% of exporters do not have com-
pacting and calendaring machines.
It is revealed from the analysis that around 70% of apparel exporters do not have dyeing and bleaching units and compacting and calendaring units and they are
dependent on other units (service providers) for this part of the manufacturing process and this is in line with the findings of Abhijit Banerjee and Kaivan Munshi
(1999). They pointed out that out of seven principal stages in the production process except the most important knitting and stitching, the rest of the work is given
to job-workers who are specialized producers. National productivity council report (2009) also stressed the need for expansion of spinning and dyeing units and
Samar Verma (2002) highlighted that level of modernization in the textile industry is one of the constraints in the apparel industry is confirmed with the findings
of this research.
Apparel exporters and sourcing of raw materials: An attempt is made to understand the sources of raw material, accessories and other man-made raw materials
(synthetic fabrics and yarns). It is found from the study that all the apparel exporters in Tirupur used to source the raw materials (cotton yarn), man-made fibres
and accessories from Tamil Nadu and other states in India. But there are 10% of apparel exporters who source cotton yarn and fabric from abroad, 27% of apparel
exporters source accessories from other countries and 14% of apparel exporters source most of made-made fibres from abroad.
Apparel exporters and sources of fund: The primary source of fund is promoters own capital. But apart from promoters ‟capital the apparel exporters have also
used other sources of fund. It is found from the research that majority 90.5% of apparel exporters rely on bank loans as the other major source of fund for their
business operation. Only 9.5 % of apparel exporters use loans from private institutions as the major source of fund apart from promoters” own capital. The apparel
exporters do not prefer venture capital investments or public deposits as major source of fund. Small exporters are really unable to raise the funds for business
activities and they continue to operate as small exporters with wafer thin profit margin. (Yoganandan, Saravanan, & SenthilKumar, Problems Faced by Small
Knitwear Exporters in Tirupur, Tamil Nadu, 2013).
FINDINGS FROM CHI-SQUARE ANALYSIS It is found from the research that in the annual turnover of less than Rs.1 crore category, majority 50.0% of exporters established their export business after 2005.
In the annual turnover of Rs.1-10 crore category, majority 50.6% of exporters established their export business during 1995-2005. In the annual turnover of Rs.10-
20 crore category, majority 48.8% of exporters established their export business before 1995. And in the annual turnover of more than Rs.20 crore category,
majority 67.4% of exporters established their export business before 1995. The chi-square analysis indicates that there is a significant relationship between period
of establishment and annual turnover of apparel exporters in Tirupur. It is divulged from the study that in the annual turnover of less than Rs.1 crore category,
majority 45.0% of exporters belong to the age-group of less than 40 years. In the annual turnover of Rs.1-10 crore category, majority 49.9% of exporters belong
to the age-group of 40-55 years. In the annual turnover of Rs.10-20 crore category, majority 52.9% of exporters belong to the age-group of more than 55 years.
And in the annual turnover of more than Rs.20 crore category, majority 58.7% of exporters belong to the age-group of 40-55 years. The chi-square analysis indicates
that there is a significant relationship between age-group and annual turnover of apparel exporters in Tirupur.
It is found from the study that in the annual turnover of less than Rs.1 crore category, majority 35.0% of exporters have less than 10 years of business experience
and more than 20 years experience. In the annual turnover of Rs.1- 10 crore category, majority 41.4% of exporters have less than 10 years of business experience.
In the annual turnover of Rs.10-20 crore category, majority 35.5% of exporters have 10-20 years of business experience. And in the annual turnover of more than
Rs.20 crore category, majority 37.0% of exporters have less than 10 years of business experience. The chi-square analysis shows that there is no significant rela-
tionship between business experience and annual turnover of apparel exporters in Tirupur. It is identified from analysis that in the annual turnover of less than
Rs.1 crore category, majority 35.0% of exporters are undergraduates. In the annual turnover of Rs.1-10 crore category, majority 43.1% of exporters have qualified
as schooling completed. In the annual turnover of Rs.10-20 crore category, majority 43.8% of exporters have qualified as schooling completed. And in the annual
turnover of more than Rs.20 crore category, majority 56.5% of exporters have qualified as schooling completed. The chi-square analysis shows that there is a
significant relationship between educational qualification and annual turnover of apparel exporters in Tirupur.
It is found from the study that in the annual turnover of less than Rs.1 crore category, majority 40.0% of exporters have diversified into less than 3 countries. In
the annual turnover of Rs.1-10 crore category, majority 51.1% of exporters have diversified into 3-6 countries. In the annual turnover of Rs.10-20 crorecategory,
majority 55.4% of exporters have diversified into 3-6 countries. And in the annual turnover of more than Rs.20 crore category, majority 45.7% of exporters have
diversified into 6-10 countries. The chi-square analysis reveals that that there is a significant relationship between markets diversified and annual turnover of
apparel exporters in Tirupur. It is found from the study that in the annual turnover of less than Rs.1 crore category majority 55.0% of apparel export firms do
manufacture and export in buyers‟ brand name. In the annual turnover of Rs.1-10 crore category majority 86.2% of apparel export firms do manufacture and
export in buyers‟ brand name. In the annual turnover of Rs.10-20 crore category majority 88.4% of apparel export firms do manufacture and export in buyers‟
brand name. And in the annual turnover of more than Rs.20 crore category majority 69.6% of apparel export firms do manufacture and export in buyers‟ and also
in their own brand name. The chi- square analysis indicates that there is a significant relationship between brand ownership and annual turnover of apparel
exporters in Tirupur.
It is found from the study that in the annual turnover of less than Rs.1 crore category, majority 70.0% of apparel export firms are manufacturing exporters. In the
annual turnover of Rs.1-10 crore category, majority 63.4% of apparel export firms are manufacturing exporters. In the annual turnover of Rs.10-20 crore category,
majority 60.34% of apparel export firms are manufacturing exporters. And in the annual turnover of more than Rs.20 crore category, majority 73.9% of apparel
export firms are manufacturing exporters. The chi-square analysis shows that there is no significant relationship between manufacturing activity and annual turn-
over of apparel exporters in Tirupur.
CONCLUSION Tirupur is one of the largest textile clusters in India offering foreign exchange revenue for the government at the same time generating millions of direct and
indirect job opportunities. Tirupur exporters are usually small and medium sized business enterprises with relatively 10 to 20 years of experience in the export
industry. The government of India has been taking promotional measures to promote the textile industry in India. Yet, the infrastructural bottlenecks create
hindrance to the growth of export businesses. The lack of professionalism is clear from the fact that majority of the exporters are not professionally qualified. The
entrepreneurs have started to diversify their export business and also have taken efforts to brand their export products. The government has also need to encour-
age in creating congenial climate for business organization to come out with innovative products, in their own brand name in order to make this export industry
to sustain on its own.
REFERENCES 1. Banerjee, A., & Munshi, K. (1999). Market Imperfections, Communities and the Organization of Production: An Empirical Analysis of Tirupur’s Garment-Export
Network. Preliminary research report.
2. Deveraja, T. (2011). Indian textile and garment industry-An overview. New Delhi: Indian Council of Social Science Research.
3. Investopedia. (2013, September 15). Export. Retrieved September 15, 2013, from Investopedia: http://www.investopedia.com/terms/e/export.asp
4. Jayabharathi. (2010, January-March). A study on enhancing the learning capability of knitted garment export industry in Tirupur: Emphasis on influencing
factors and opportunities. Journal of Contemporary Rsearch in Management, 89-102.
5. Karthikeyan, G., & Ramachandran. (2009). Marketing strategies to be adopted by the garment exporters after the quota removal in Tirupur. Indian Journal
of Marketing, 46-54.
6. Kumar, A. (2007). Export and import management. New Delhi: Excel Books.
7. Office-of-Special-Officer. (2009). Tirupur oru kannottam (Tamil version). Tirupur: State government of Tamil Nadu.

VOLUME NO. 6 (2016), ISSUE NO. 11 (NOVEMBER) ISSN 2231-1009
INTERNATIONAL JOURNAL OF RESEARCH IN COMPUTER APPLICATION & MANAGEMENT A Monthly Double-Blind Peer Reviewed (Refereed/Juried) Open Access International e-Journal - Included in the International Serial Directories
http://ijrcm.org.in/
36
8. Shanmugasundaram, S., Loganathan, G., & Panchanatham, N. (2010). Quality Awareness – An Imperative Need for Flourishing Knitwear Industry in India.
International Journal of Trade, Economics and Finance, 1 (3), 309-314.
9. TEA. (2012, September 14). About TEA. Retrieved September 14, 2012, from Tirupur Exporters Association: http://www.tea-india.org/Pages/aboutus.aspx
10. Vasan, M. (2011). Consumer Shopping Behaviour in Retail Stores - A Case of Salem District. International Journal of Marketing & Management Research, 2
(7), 226-237.
11. Vasan, M. (2011). Owners’ Attitude Towards the Performance of Powerloom Sector in Tamilnadu - A Case of Erode District. Asia Pacific Journal of Research
in Business Management, 2 (7), 319-338.
12. Vasan, M. (2016). Problems and Prospects of Women Entrepreneurs in India. Shanlax International Journal of Management, 3 (1), 312-315.
13. Vasan, M. (2015). Prudent Debt Management for Business Development. International Research Journal of Business and Management, 8 (2), 94-97.
14. Vasan, M. (2007). Retail Industry in India - A Review. Economic Challenger, 36 (9), 25-30.
15. Vasan, M. (2014). Talent Management - An Overview. Nafen Digest, 2-4.
16. Verma, S. (2002). Export competitiveness of Indian textile and garment industry. International council for research on international economic relations. New
Delhi: International council for research on international economic relations.
17. Vetrivel, T., & Manivannan, L. (2011). Problems and prospects of garment industry in Tirupur. Indian Journal of Applied Research, 1 (2), 99-102.
18. Yoganandan, G. (2015). An overview of Tirupur: The Textile city in India. Global Journal for Research Analysis, 4 (3), 55-56.
19. Yoganandan, G. (2015). External factors influencing textile exports of Tirupur: An application of Factor Analysis. SCHOLARS WORLD - International Refereed
Multidisciplinary Journal of Contemporary Research, 3 (2), 52-64.
20. Yoganandan, G. (2010). Globalization of Pakistan: Lessons for politically unstable countries. International Journal of Marketing Studies, 2 (1), 133-139.
21. Yoganandan, G. (2015). Growth of Apparel Export Industry in Tirupur, India. International Journal of Research, 2 (3), 183-187.
22. Yoganandan, G. (2015). Textile Export Promotion in India-Salient Features. Bonfring International Journal of Industrial Engineering and Management Science,
5 (1), 01-04.
23. Yoganandan, G. (2015). The strategies and expectations of apparel exporters in Tirupur, India. Zenith International Joournal of Business Economics & Man-
agement Research, 5 (1), 169-177.
24. Yoganandan, G., & Saravanan, R. (2011). Export performance of Indian Textile industry during post reform period (1991 to 2010). International Journal of
Management, Entrepreneurship & Technology, 1 (1), 44.
25. Yoganandan, G., & Saravanan, R. (2015). Impact of global recession on global textile exports and imports. Global Journal for Research Analysis, 4 (1), 103-
105.
26. Yoganandan, G., & Vetriselvan, V. (2016). Entrepreneurship development in India. Shanlax International Journal of Management, 3 (1), 345-346.
27. Yoganandan, G., Jaganathan, A., Saravanan, R., & Senthil kumar, V. (2013). Factors affecting the export performance of textile industry in developing countries
– A review of literature. International Journal of Commerce, Business and Management, 2 (4), 173-176.
28. Yoganandan, G., Saravanan, R., & SenthilKumar, V. (2013). Problems Faced by Small Knitwear Exporters in Tirupur, Tamil Nadu. Life Science Journal, 10 (7),
1145-1152.
VOLUME NO. 6 (2016), ISSUE NO. 11 (NOVEMBER) ISSN 2231-1009
INTERNATIONAL JOURNAL OF RESEARCH IN COMPUTER APPLICATION & MANAGEMENT A Monthly Double-Blind Peer Reviewed (Refereed/Juried) Open Access International e-Journal - Included in the International Serial Directories
http://ijrcm.org.in/
37
A STUDY ON INVESTMENT PATTERN OF GOVERNMENT EMPLOYEES AND PRIVATE EMPLOYEES IN
COIMBATORE CITY
DR. K. KANNIAMMAL
ASSOCIATE PROFESSOR
AVINASHILINGAM INSTITUTE FOR HOME SCIENCE & HIGHER EDUCATION FOR WOMEN
COIMABTORE
JANNET.A
STUDENT
AVINASHILINGAM INSTITUTE FOR HOME SCIENCE & HIGHER EDUCATION FOR WOMEN
COIMBATORE
ABSTRACT Investment is the employment of funds on assets with the aim of earning income or capital appreciation. People are earning more but are not aware about proper
investment. They allocate their savings in various aspects of investment avenues without having a proper knowledge about investment avenues. Most of the
respondents look for safety rather than higher returns. This research aims to study and understands the pattern of investment among the government employees
and private employees and the difference in the perception of an individuals related to various investment alternatives. The study was based on both primary and
secondary data. Primary data are collected using a structured interview schedule method and secondary data are collected from various books, journals and
website. The simple percentages analysis and scaling technique were used for analysis. The study revealed that both the government and private employees prefer
to invest their money in bank deposits and life insurance. Though they have knowledge about the various investment options, they are not ready to invest their
money in securities, bonds and debentures due to risk. Only few private employees are ready to take risk to get high return by investing in securities, debentures
and commodity markets.
KEYWORDS investment pattern, awareness, knowledge, government employees, private employee, satisfaction.
INTRODUCTION n Investment in knowledge pays the best interest.
Benjamin Franklin
The individual investor should act consistently as an investor and not as a speculator.
Ben graham
Investment is the employment of funds on assets with the aim of earning income or capital appreciation. Investment has two attributes namely time and risk.
Present consumption is sacrificed to get a return in the future. The sacrifice that has to be borne is certain but the return may be uncertain. This attributes of
investment indicates the risk factor. The risk is undertaken with a view to reap some return from the investment. The fast growing Indian economy has led to
higher income level and availability of new investment avenues. Government savings departments, banks, financial institutions and mutual fund houses are vying
for a share in the savings of investors. Investors now have many options for making investments like debt instruments, stocks, mutual funds, gold, etc. Kathuria
and Kanika Singhania (2012) The integration of the world financial markets lead to the change in choice of saving and investment avenues available to the Inves-
tors. When compared globally, India has a good investment habit at all level of investors at different investment avenues. (Sanjay Kanti Das (2012) Development
of an economy necessarily depends upon its financial system and the rate of new capital formation which can be achieved by mobilizing savings and adopting an
investment pattern. There are different types of investors and each category differs in their objectives and hence it is essential for the investors to choose an
appropriate investment policy (Manta Shah (2012).
The main investment objectives are increasing the rate of return and reducing the risk. Other objectives like safety, liquidity and hedge against inflation can be
considered as subsidiary objectives. There are a large number of investment avenues available today in India. Some of them are marketable and liquid while others
are non marketable. Some of them are also highly risky while others are almost riskless. The investment avenues are: equity, mutual funds, bonds, real estate,
fixed deposits, insurance, gold/silver, Post office savings and corporate debentures.
REVIEW OF LITERATURE Gavini and Athma (1999) conducted a study on “Small Saving Schemes of Post office Need to be known more” and concluded that most of the public preferred
post office scheme, Indira Vikaspatre (IVP), KVP and post office recurring deposit account in rural and urban areas Krishnamoorty (2008), in his study “A study on
Investment Pattern and Tax planning in the Nilagiris District” concluded that all salaried people were aware of bank deposits, PF schemes, insurance schemes,
post office savings schemes and gold, only few were aware of UTI. Aparna Smudra and Burghate (2012) conducted a study on “Investment Behavior of Middle
Class Households” in Nagpur. The study reveals that the bank deposits remain the most popular instrument of investment followed by insurance with maximum
number of respondents in these fixed income bearing option. Palanivelu and Chandrakumar (2013) “A Study on Preferred Investment Avenues among Salaried
Peoples with Reference to Namakkal Taluk”, conducted, and concluded that respondents are aware about various investment choices to some extent but they
are not aware about stock market, equity, bonds and debentures. Umamaheswari, and Ashok Kumar (2014), conducted a study on “Investment Pattern and
Awareness of Salaried Class Investors in Coimbatore District “and the study concluded that there is lack of awareness of investors about the concept and working
of the investment pattern. The various literature reviews made the authors to conduct a study on Investment Pattern of Government Employees and Private
Employees in Coimbatore City.
SCOPE OF THE STUDY This study attempt to gain knowledge about investment pattern of the government and private employees and it will be helpful to identify the better investment
options in the market. The study also attempted the factors influencing the investors to select the investment options.
STATEMENT OF THE PROBLEM Government and private employees fallaciously believe that they do not need any financial planning as their income and expenses are regular. The investment
pattern in India is not so organized so to know in which segment people are investing more and which factor influence them to take decision of investment. Hence
a study is undertaken to know the investment pattern of government employees and private employees in Coimbatore city.
A

VOLUME NO. 6 (2016), ISSUE NO. 11 (NOVEMBER) ISSN 2231-1009
INTERNATIONAL JOURNAL OF RESEARCH IN COMPUTER APPLICATION & MANAGEMENT A Monthly Double-Blind Peer Reviewed (Refereed/Juried) Open Access International e-Journal - Included in the International Serial Directories
http://ijrcm.org.in/
38
OBJECTIVES OF THE STUDY 1. To know the investment pattern of government and private employees.
2. To know the factors influencing the investors in their investment pattern.
3. To identify the profitable investment option opted by the government and private employees.
METHODOLOGY The study was conducted in Coimbatore City and based on purposive random sampling method, 110 respondents (Government employees 55 and private em-
ployees 55) were selected for the study. The primary data was collected with the structured interview schedule and the study was conducted during a period of
December 2014 to March 2015. The simple percentage and scaling technique were used for analysis. In order to analyse the satisfaction level, five-point scaling
technique was applied. The score was assigned as follows: Highly satisfied (5), Satisfied (4), Neutral (3), Dissatisfied (2), Highly dissatisfied (1). The respondents
were asked to give their level of satisfaction and level of influence based on which the score were assigned.
RESULTS AND DISCUSSION THE ANALYSIS WAS DONE UNDER THE FOLLOWING HEADINGS:
1. Socio economic characteristics it is of the respondents.
2. Awareness of the respondents about the investment options and factors influencing the investors in their investment pattern.
3. Investments made by the Respondents and their satisfaction
SOCIO ECONOMIC CHARACTERISTICS
The socio economic characteristics of the respondents will strongly influence the pattern of investments and the details are given in Table 1.
TABLE 1: SOCIO ECONOMIC CHARACTERISTICS OF THE RESPONDENTS
S. No Particulars Government Employees (55) Private Employees (55)
1.
Age in Years
20-30
No. Percentage No. Percentage
10
18
15
27
2. 30-40 15 27 22 40
3. 40-50 25 45 11 20
4. 50-60 5 9 7 13
1.
Gender
Male
25
46
33
60
2. Female 30 54 22 40
1.
Educational Qualification
Up to 12th
0
0
2. Graduates 26 47 27 49
3. Post graduates 19 35 21 38
4. Diploma/IT 9 16 7 13
5. Others 1 2 0 0
1.
Community
SC
2
4
0
0
2. ST 0 0 0 0
3. BC 38 69 45 82
4. OC 15 27 10 18
1.
Marital Status
Single
7
13
20
36
2. Unmarried 48 87 35 64
1.
Type of Family
Joint
12
22
18
33
2. Nuclear 43 78 37 67
1.
Earning Members
One
7
13
19
34
2. Two 32 58 27 48
3. Three 16 29 8 14
4. More than three 0 0 1 2
1.
Annual Income in (Rs.)
Less than Three lakh
6
11
25
45
2. Three lakhs- Five lakhs 21 38 26 47
3. Five lakhs –Seven lakhs 23 42 4 7
4. More than Seven lakhs 5 9 0
Source: Field Survey 2015
The table reveals that majority of the government employees (45 percent) are in the age group of 40-50 years and in the case of private employees the majority
(40percent) is in the age group of 30-40 years. Further the majorities of the investors are female in case of government employees and male incase of private
employees. Majorities are married, belonging to neutral family, having two earning members in their family and majority are graduates in both the cases.
AWARENESS OF THE RESPONDENTS ABOUT THE INVESTMENT OPTIONS AND FACTORS INFLUENCING THE INVESTORS IN THEIR INVESTMENT PATTERN
Awareness is the ability to perceive, to feel or to be conscious of events, objects, thought, emotions, or sensory patterns. The following table clearly reveals the
awareness about the investment options by the respondents.

VOLUME NO. 6 (2016), ISSUE NO. 11 (NOVEMBER) ISSN 2231-1009
INTERNATIONAL JOURNAL OF RESEARCH IN COMPUTER APPLICATION & MANAGEMENT A Monthly Double-Blind Peer Reviewed (Refereed/Juried) Open Access International e-Journal - Included in the International Serial Directories
http://ijrcm.org.in/
39
TABLE 2: AWARENESS ABOUT INVESTMENT OPTIONS BY THE RESPONDENTS
S. No Particulars Government
Employees (55)
Private
Employees (55)
1.
Awareness about Various
Investment Options
Yes
No. Percentage No. Percentage
52
95
43
78
2. No 3 5 12 22
1.
Source of awareness
Broker
5
9
2
4
2. Bank 11 20 6 11
3. Friend/Relatives 20 37 28 51
4. TV/Newspaper 15 27 18 32
5. Others 4 7 1 2
1.
Consultation of Investment choice
Yes
41
74
48
87
2. No 15 26 7 13
1.
Source of Consultation
Friends
22
40
23
42
2. Relatives 18 33 22 40
3. Bank 11 20 7 13
4. Brokers 4 7 3 5
Source: Field Survey 2015
*Multiple Response
From the above table it is revealed that 95 percent of the government employees and 78 percent of the private employees are aware about various investment
avenues and the rest are not having awareness but invested indicating the saving habit of Indians. Regarding the source of awareness majority of government and
private employees were able to gain the information through friends and relatives followed by television and news paper. Further 74 percentages of government
employees and 87 percentages of the private employees agreed that they consult their family members, friends and relatives before finalizing the investment.
FACTORS INFLUENCING THE INVESTORS IN THEIR INVESTMENT PATTERN
There are many factors which directly or indirectly, influences the investment pattern of investors. The factors influencing investment decision are very important
and are given in Table 3.
TABLE 3: FACTORS INFLUENCING THE INVESTORS IN THEIR INVESTMENT PATTERN
S. No Particulars Government Employees (55) Private Employees (55)
1.
Income level
No.* Percentage No.* Percentage
49 89 48 87
2. Consumption level 45 82 47 85
3. Saving habits 47 85 48 87
4. Safety of investment 51 93 52 95
5. Return from investment 52 95 48 87
6. Liquidity 47 85 48 87
7. Tax concession 44 80 42 76
8. Fear of risk 53 96 50 91
9. Time period 35 64 42 76
10. Future scope 46 84 44 80
Source: Field Survey 2015
*Multiple Response
The table clearly indicates that for private sector employees the most influencing factor for investment is safety of investments followed by fear of risk, income
level, return from investment and liquidity. For government sector employees the most influencing factor are fear of risk followed by return from investments,
safety of investment and income level. The analysis clearly indicates that the employees of both government and private sector are much concerned with fear of
risk and safety and they are not willing to take risk for the sake of return.
INVESTMENTS DETAILS
Effective planning and duration of the investments are very essential for profitable investments before investing and is given in Table 4.
TABLE 4: INVESTMENT DETAILS
Source: Field Survey 2015
*Multiple Response
The analysis reveals that more than 90 percent of the employees of government and private sector are planning well before investment and majority of the
government sector (42 percent) are investing up to three to six years and in the case of private sector the majority (64 percent) are investing one to three years.
S. No Particulars Government
Employees (55)
Private
Employees (55)
1.
Planning before Investment
Yes
No. Percentage No. Percentage
52
95
50
91
2. No 3 5 5 9
1.
Period of Investments
One –three years
17
31
35
63
2. Three-six years 23 42 19 35
3. Above six years 15 27 1 2
1.
Percentage of Income Invested
Up to 10%
7
13
9
16
2. 10%-20% 42 76 23 42
3. 20%-30% 6 11 21 38
4. Above 30% 0 0 2 4

VOLUME NO. 6 (2016), ISSUE NO. 11 (NOVEMBER) ISSN 2231-1009
INTERNATIONAL JOURNAL OF RESEARCH IN COMPUTER APPLICATION & MANAGEMENT A Monthly Double-Blind Peer Reviewed (Refereed/Juried) Open Access International e-Journal - Included in the International Serial Directories
http://ijrcm.org.in/
40
Further 27 percent of employees of government sector invest above six years and in the case of private sector it is only two percent. It is noted that majority of
them are investing 10 percent to 20 percent of their income and only four percent of private sector employees are investing above 30 percent of their income and
none in government sector employees.
RESPONDENTS’ KNOWLEDGE ON INVESTMENTS, TYPE OF INVESTMENTS AND LEVEL OF SATISFACTION
In the globalized scenario innovative investments are available with attractive features at the same time uncertainty in the new investment market. Every individual
investor possesses different mindset when they decide about investing in a particular investment avenue such as bank deposits, post office savings, insurance
policies, stocks, bonds etc. However, the decision varies for every investor depending upon their knowledge on investments, expected return and their risk taking
ability, the purpose for which an investment is chosen and more importantly their level of satisfaction in the particular investment. These details are given in Table
5.
TABLE NO: 5 RESPONDENTS KNOWLEDGE ON INVESTMENTS, TYPE OF INVESTMENTS AND LEVEL OF SATISFACTION
Source: Field Survey 2015
*Multiple Response
The above table reveals that majority of the respondents of government sector invested in bank deposits (87 percent) and life insurance policies (84 percent) and
preferred to invest in gold and silver (38 percent) rather than investing in debentures, bonds and securities. Similarly, the majority of private sector employees
also invested in bank deposits (89 percent) and life insurance policies (76 percent) but they preferred to invest in share market (37 percent), debentures, bonds
and commodity share market (31 percent) and willing to assume risk. This indicates that the majority of private sector employees are having knowledge on these
investments. This is also indicated in their satisfaction level.
The study reveals the awareness and knowledge on different investments of selected government and private sector employees, their investment pattern and
satisfaction on different investments.
SUGGESTIONS � More awareness should be created for investment in debentures, mutual funds, bonds, commodity market, securities which has not influenced government
employees.
� The employees should be motivated to approach the professional such as tax consultants, auditors, etc., to get benefits, and avoid taking self decision when
making investments.
� General awareness about the new investment scheme should be created to the investors through advertisement.
� Investments in form of bank deposit has been found more popular among employees as it alone accounts for more than half the total investment made by
them from the safety point of view. Hence it is suggested that they can channelise their surplus in diversified way so that they may get good return.
CONCLUSION The standard of living the people is increasing day by day and they have started realizing the importance of saving and proper investment of their savings. Most
of the investors is very sensitive about safety and reliability. From the study it is revealed that both the government and private employee’s gives first priority to
the bank fixed deposits which is very safe followed by the investment in life insurance. The government employees are not ready to take any risk by investing in
securities, bonds, debentures, etc., whereas few private employees have made investments in securities, debentures, commodity market and bonds. From the
study is understood that majority of the respondents are aware of the various investment avenues but are not ready to make investments due to fear of loss. Thus
it is concluded that fixed deposit and life insurance is the most preferred investment option by the government employees and private employees.
LIMITATIONS 1. The study is conducted in Coimbatore City and it provides information of investment pattern and preference of government and private employees of this
particulars region only.
2. The sample size is constrained to 110 only.
REFERENCES
JOURNALS
1. Aparna Smudra and Burghate (2012), “Investment Behavior of Middle Class Households” International Journal of Social Sciences and Inter Disciplinary Re-
search. Vol. No. 5, ISSN 2277 3630 PP.43-54.
2. Das Sanjay Kanti (2012) “Investment Behaviour of Middle Class Household’s: An Empirical Analysis”. Asian Journal of Management”, Vol. 3, No.3, PP. 123-
133 ISSN:0976-495X.
3. Gavini Augustine and Prashanth Athma, (1999), “Small Saving Schemes of Post Office-Need to be known more “Southern Economist, Vol. 37 No.20 PP. 13-
14.
4. Kathuria.L.M and Kanika Singhania.K, (2012), “Investment Decision Making: A Gender-Based Study of Private Sector Bank Employees”, “The IUP Journal of
Behavioral Finance’’, Vol. 9, No. 1,PP. 45-56.
5. Mamta Shah (2012) “Marketing Practices of Mutual Funds” Asian Journal of Research in Marketing, Vol. 1, No. 6 ISSN: 2277- 6621, PP. 70-86
6. Palanivelu, V.R. & Chandrakumar, K. (2013),” A Study on Preferred Investment Avenues among Salaried Peoples with Reference to Namakkal Taluk”, Tamil
Nadu, India. IBEA, International Conference on Business, Economics, and Accounting.
7. Umamaheswari, and Ashok Kumar (2014), “Investment Pattern and Awareness Salaried Class Investors in Coimbatore District”, International Journal of
Research Business Management, (IJRBM), ISSN9 (E) 23221 -886 X: Vol. 2, No.8, PP: 49 –57.
THESIS
8. Krishnamoorthy (2008) “A Study on Investment Pattern and Tax Planning in the Nilagiris District”, January -Unpublished Thesis- Bharathiyar University.
S. No INVESTMENT AVENUE GOVERNEMENT EMPLOYEES (55) PRIVATE EMPLOYEES (55)
Types of Investments Knowledge* Investment made* Satisfaction Knowledge* Investment made* Satisfaction
Total score Mean score Total score Mean score
No. % No % No % No %
1 Bank fixed deposits 55 100 48 87 263 4.78 55 100 49 89 268 4.87
2 Post office deposits 44 80 5 9 84 1.52 39 71 4 7 92 1.67
3 Real estate 35 63 9 17 95 1.72 48 87 6 11 105 1.91
4 Mutual funds 35 63 0 0 45 0.82 44 80 6 11 102 1.85
5 Chit funds 30 74 0 0 98 1.78 44 80 15 27 104 1.89
6 Life insurance 55 100 46 84 244 4.44 51 93 42 76 217 4.67
7 Debentures 31 56 0 0 45 0.82 44 80 5 9 76 1.38
8 Bonds 29 53 0 0 68 1.24 39 71 5 9 84 1.52
9 Equity share market 30 55 7 13 72 1.31 34 62 20 37 128 2.33
10 Commodity share market 19 34 0 0 42 0.76 30 55 7 13 102 1.86
11 Gold/ Silver 51 93 21 38 148 2.69 48 87 14 25 108 1.96
VOLUME NO. 6 (2016), ISSUE NO. 11 (NOVEMBER) ISSN 2231-1009
INTERNATIONAL JOURNAL OF RESEARCH IN COMPUTER APPLICATION & MANAGEMENT A Monthly Double-Blind Peer Reviewed (Refereed/Juried) Open Access International e-Journal - Included in the International Serial Directories
http://ijrcm.org.in/
41
IMPACT OF TURNOVER RATIOS ON PROFITABILITY: SPECIAL REFERENCE TO TWO AND THREE WHEELERS
SECTOR IN INDIA
V.SANGEETHA
RESEARCH SCHOLAR
PG & RESEARCH DEPARTMENT OF COMMERCE
LRG GOVERNMENT ARTS COLLEGE FOR WOMEN
TIRUPUR
DR. M. KRISHNAVENI
HEAD
PG & RESEARCH DEPARTMENT OF COMMERCE
LRG GOVERNMENT ARTS COLLEGE FOR WOMEN
TIRUPUR
ABSTRACT This paper examines the financial efficiency can be maximized through effective management, especially financial performance. Finance is just like the heart of
business. If it becomes weak, the business can hardly prosper and survive. In order to improve the financial management practices, it is essential for the finance
manager to adopt a proper approach of working capital decisions making to drive their respective firms towards success in order to generate the value of profita-
bility. The period covered in this study is ten years commencing from 2005-06 to 2014-15. In this paper also focus on impact of turnover ratios on profitability of
two and three wheelers sectors in India.
KEYWORDS India, turnover ratios on profitability, two wheelers sector, three wheelers sector.
INTRODUCTION OF AUTOMOBILES IN INDIA ndian automobiles have come a long way. Earlier the fields of Indian automobiles were dominated by one or two players, but the time is totally changed
now. Today, Indian automobile is a buzzing industry, with lots of things happening there.
The first automobile came to Bombay in 1897. Soon the number of cars on Mumbai's roads increased, to warrant the formation of a motoring body that
would take up causes that plagued car owners even at that time.
Much bitumen has been poured on Indian roads since then but the causes yet strikingly remain similar - concern for better roads and demand for better fuel.
The Western India Automobile Association (WIAA) was founded on October 15th 1919, and since then it has been serving the motoring community in all possible
ways. Today WIAA is the largest and the oldest motoring body with over forty-eight thousand members and a network of 7 branches in 4 states of Western India.
Ashok Leyland Limit is one of India's leading manufacturers of commercial vehicles. They also manufacture special vehicles and engines for industrial, genset and
marine requirements. For over five decades, they have been a major presence in India's commercial vehicle industry. These fifty years have been punctuated by a
number of technological innovations that have gone on to become industry norms. Customers can buy automobile spares and accessories in online also.
Foremost exporters are Scooters, Motorcycles, Mopeds, Step Thrus, Spare Parts and Accessories. Available all popular models made in India, By Honda, Suzuki,
Yamaha, Bajaj, Piaggio, Kinetic.
At Bharat Traders they believe in providing quality products and innovative solutions to their worldwide clients. Over the past years, they established us as leading
merchant exporters with a distinction of successfully combating complex challenges. Through a network of overseas offices, they offer international trade expertise
truly rely upon. They have an excellent track record, sound management experience and capabilities to be responsive to their specific needs. They bring their
experience to where it can best serve.
AUTOMOBILE - OVERVIEW Engineers at a Big-Three automaker in Romulus, Michigan, are using an innovative new way to check for missing connecting rod bearing inserts in engine assem-
blies. Using ultrasonic waves, they measure the piston stroke, known to be significantly shorter in cylinders with missing inserts.
The new technology will probably spell the end for the age-old practice of listening for missing inserts. For decades, skilled inspectors would "look" for the missing
parts by tapping rod caps with a hammer and listening to the sound. Though nostalgic, the method was anything but foolproof. Engines with missing bearing
inserts would frequently make it to the hot-test stage, where they would need costly rework.
Out of the engines produced each day at the Romulus plant, ultrasonic testing now catches all of the missing inserts. This is unprecedented accuracy, and saves
the considerable time and expense of having to tear apart engines after detection at the hot-test or cold-test station. This also provides a better control on engines
getting to the field with a missing bearing.
LITERATURE REVIEW It is mandatory to review the literature available with respect to the area of the research study. Measuring the performance of the corporate sector has always
been an area of controversies from the point of view of the government, shareholders, prospective inventors, creditors, employees and any other stockholders.
Several studies have been undertaken to evaluate the financial performance in the corporate sector. This chapter presents some of the studies conducted by
financial analysis.
Amita S.Kantawala (2001-02)1 in his study on financial performance of non-banking finance companies ( NBFCS ) in India concluded that there exists a significant
difference in the profitability ratios, leverage ratios and liquidity ratios of various categories of NBFCS. The more number of ratios do not statistically differed from
one another in majority of the cases except the trading in share and investment holdings were compared with leasing. The analysis of variance along with the
details the average ratio may become a useful guide to companies to decide the dissatisfaction or continuation in the same line of business considering overall
profitability within the regulatory frame work.
Kar.N.C and sahoo, SK, (2001)2 in their study stated that even though, still the growth rate has been consistent. The average growth rate of current assets is higher
in Bajaj Auto ltd. It is observed that there exists a high degree of positive correlation between sales and current assets.
Padmaja Manoharan (2002)3 through her study on profitability of cement industries in India has revealed that the profitability of firms depend on age, size and
region. She has indentified that quality of earnings depend on cost management, assets management and leverage management.
I

VOLUME NO. 6 (2016), ISSUE NO. 11 (NOVEMBER) ISSN 2231-1009
INTERNATIONAL JOURNAL OF RESEARCH IN COMPUTER APPLICATION & MANAGEMENT A Monthly Double-Blind Peer Reviewed (Refereed/Juried) Open Access International e-Journal - Included in the International Serial Directories
http://ijrcm.org.in/
42
Shanmugasundaram and Ratnam (2002)4 in their study on “Measures for sustaining profitability of spinning mills”, analyzed and the financial performance of 140
spinning mills in Tamilnadu during 1994-2000. The mills were classified as high and low profit mills. The financial performance of the spinning mills during the six
years was found to the poor.
Nand Kishore Sharma (2002)5 in his study on Financial appraisal of cement industry in India found that the current and quick ratio showed a decreasing trend and
also it varied from time to time. On comparing the current and quick ratio of cement industry, six companies were higher than the average and four recorded
lower than the average of industries. The average debt equity ratio was 54:34 percentages. This ratio showed a decreasing trend in the first 4 years of study but
after that it registered an increasing Trent. The ratio of fixed assets to total debt always showed more than 100 percent, which indicated that the claims of outsiders
were covered by the fixed assets of that organization. The return on capital employed recorded average of 15:46 percent. This ratio varied from 2.76 percent to
21.80 percent during the period of study.
Sankaran (2002)6 has made a financial performance evaluation of ten (five Indian and five MNC’S) Pharmaceutical companies in India. The financial performance
was analyzed with the help of liquidity, profitability and solvency perspectives. The companies were ranked for assessing corporate excellence by ET-HBSAT model,
bankruptcy and average return on net worth with the help of Altman model. It identified that the financial performances of MNC Pharma companies are better
than the Indian companies.
Mansur Mulia.A (2002)7 in his study on use of ‘Z‘ score analysis for evaluation of financial health of textile mills found that the textile mill under study was just on
the verge of financial collapse. The financial health of the mill was never in the too healthy zone during the study period. The position of its performance front was
very unviable and apprehensions of the total failure of the mill were inadequate level of working capital. The textile mill, on the volume front, had failed to achieve
the sales target set for different years mainly due to the low achievement of production performance owing to the under utilization of the available capacity which
contributed to the deterioration of the financial health of the mill.
Prasad Sangameshwaran (2002)8 has studied in detail the importance of branding the cement. Industry analysts feel that branding efforts have been initiated due
to the cluster. The large media spends that has influenced the increased visibility for the brand. Cement has always been loyal to the door media, walls and
hoarding. They spelled out measures why branding becomes important for cement for cement players today. Another reason is the nature of the product, which
influence the manner in which it is sold. Being bulky by nature, cement manufactures sell their products close to the area of manufacturing. Finally he pointed out
that to stand out in the cluster, branding would naturally help.
Jack Glen, Kevin Lee and Ajit Singh (2002)9 in their study presents time-series analyses of corporate profitability in seven leading Developing countries (DCs) using
the common methodology as the persistence of profitability (PP) studies and systematically compare the results with those for Advanced Countries (ACs). Surpris-
ingly, both short and long term persistence of profitability for DCs was found to be lower than those for ACs. The paper concentrated on economic explanation for
these findings. It also reports the results on the persistence of the two components as profitability-capital-output ratios and profit margins. These two raise
important general issues of economic interpretation for persistence of profitability (PP) studies, which are outlined.
Tze-wei Fu, Mei-Chiu ke and Yen-Sheng Huang (2002)10 examined the relationship between profitability and financial capital for 1,276 small firms in Taiwan over
the period 1992-1997. The results indicated a statistically positive relationship between profitability and capital growth. When financial capital was further divided
into debt and equity, the results indicate a significantly positive relationship between profitability and equity financing, but a significantly negative relationship
between profitability and debt financing. Moreover, the profitability of small firms was positively related to both the external economic conditions and the firms’
previous profitability.
Kaen and Baumann (2003)11 in their study measured the profitability of US companies with a sample of 64 selected randomly. They had taken sales, EBITDA, EBIT,
EBITDA margin, EBIT margin, total assets and number of employees as independent variables and return on assets as dependent variables for the study. Using
regression and correlation techniques their study resulted that about half of industry, firm’s profitability increases at decreasing rate and eventually declines as
the firms become larger, for the remaining half, no relationship between profitability and size was found.
Bardia (2004)12 Conducted an empirical study on liquidity management of the largest public sector company the steel Authority of India ltd. (SAIL). This study put
emphasis of working capital management of the company. The results of spearman’s rank correlation and students’ revealed the significant positive association
between the liquidity and the profitability of the company. Further metal’s comprehensive rank test and other statistical techniques demonstrated the need for
improvement in debt collections, maintenance optimum quick ratio, need for arrangement of short term finances to manage the short terms liquidity of the
company.
A.V. Dharmadrishnan (2004)13 has studied consolidation in the cement industry. The cement industry has been going through a period of re-alignment or consol-
idation since the early 1990s but still has a long way to go in this regard. The Indian Cement industry is the second largest in the world after China. The cement
industry’s progress since its inception in 1914 has been significant. Today in terms of quality, productivity and efficiency the industry is second to none in the
world. India can produce cement to any international standards. Today, the industry has a combined installed capacity of 153 million tones. The cement industry’s
growth is in line with the Gross Domestic Product growth. Cement exports registered a 35 per cent growth in 2002-03 over the previous year.
Arthur S. Leahy (2004)14 Tested the proposition that profitability was related to the functions performed and risks assumed by a company. The tree measures of
profitability such as gross margins, operating margin and berry ratio are examined and related to proxies for the functions performed and / or risks assumed by
those manufactures. The results showed that SGA / Sales, Inv / COGs and AP / COGs variables are significant determinants of profitability. The results vary according
to the measures of profitability employed i.e., the significance of the independent variable may depend on the profitability measures employed.
Patel (2004)15 in his study made an attempt to examine the profitability of Colour – Chem Limited during the period 1981-1999. The multiple correlation coefficient
technique was used for analyzing the impact of net fixed assets, sales and net worth on the profitability. The result of the study showed that sales and net fixed
assets, sales and net worth, and net fixed assets and net worth had significant effect on net profit of colour – Chem limited. The analysis of profitability ratios
showed that the company was in a round position.
Marcos A. M. Lima and Marcelo Resende (2004)16 in their work entitled profit margins and business cycles in the Brazilian industry: a panel data study investigated
the relationship between profit margins and business cycle in the Brazilian industry during the 1992-1998 period, taking as reference a dynamic panel data model
founded around a conjectural variation framework. The empirical results indicated pro-cyclical behavior or profit margins for the aggregate business cycle but are
less clear in the case of sector-specific business cycle variables. Among the most robust results, one can highlight the roles of lagged profitability and import
intensity and the negligible role of union density.
Sueyoshi, Toshiyuki (2005)17 Financial Ratio Analysis is newly proposed to examine the financial performance of the American Power / energy industry. The new
approach compares the financial performances of 147 non-default firms with those of 24 default firm in the US power / energy market. The proposed approach is
a new type provides a set of weight of a linear descriminant function, consequently yielding an evaluation score for group membership. Such weight estimates,
along with an evaluation score, of the discriminant function provide a total financial evaluation measure, based upon which we can determine the financial per-
formance of the power / energy firms.
This empirical study informs that both leverages (debt) and profitability (returns of equity) are important financial factors in terms of avoiding corporate results
obtained from the American power / energy industry are further extended to the International comparison of other major industrial nations including Japan and
the European nations. The international comparison concludes that Japanese electric power firms have enough managerial and financial capabilities even if the
American financial standard is hypothetically introduced into the evaluation of their financial performances. However, the empirical results also indicate that the
Japanese power industry performs barely above the American standard. Thus, corporate leaders in the Japanese power industry need to pay more serious atten-
tion to their corporate finances and financial strategies. Such financial perspective will be increasingly important along with the current deregulation policy of the
Japanese government.
Alovsat muslumov (2005)18 This paper examines the post-privatization performance of privatized companies in the Turkish cement industry. The findings indicate
that, when performance criteria for both the state and private enterprises are considered privatization in the cement industry results in significant performance
deterioration. Total value added and the return on investment declines significantly after privatization. This decrease mainly stems from deterioration in assets
VOLUME NO. 6 (2016), ISSUE NO. 11 (NOVEMBER) ISSN 2231-1009
INTERNATIONAL JOURNAL OF RESEARCH IN COMPUTER APPLICATION & MANAGEMENT A Monthly Double-Blind Peer Reviewed (Refereed/Juried) Open Access International e-Journal - Included in the International Serial Directories
http://ijrcm.org.in/
43
productivity. The decline in asset productivity, however, is not caused by an increase in capital investment, since post privatization capital investment did not
change significantly.
Significant contraction in total employment and increase in financial leverage after privatization are among the key research findings. Privatization through public
offering, gradual privatization and domestic ownership are found to stimulate the financial and operating performance of firms following privatization.
Hamasalakshmi and Manickam (2005)19 in their study on “Financial performance analysis of selected software companies” examined liquidities, profitability and
leverage position on thirty-four software companies during the period 1998-1999 to 2001-2002 by using ratios, correlation and multiple regression analysis. The
study revealed favourable liquidity and working capital position. They concluded that the companies very on the internal financing and overall profitability position
of the software companies showed a moderately increasing trend.
Dr. Sanjay J. Bhayani (2006)20 in his study an attempt has been made to study the cost component of cement units under the study. For the purpose of analysis
of cost component, all component cost has been calculated as percentage of sales. A study has been made by using data from financial statements of top five
cement companies of India, viz.,
Gujarat Ambuja Cements Ltd. (GALL), Dalmia Cements Ltd. (DCL), Madras Cements Ltd. (MCL), Indian Cements Ltd. (ICL) and Shree Cements Ltd. (SCL) the data of
total cost various cement companies under study have been rearranged and classified under the following heads; Raw materials and stores consumed, salaries
and wages, indirect taxes, power and fuel, depreciation, administrative selling and distribution and other expenses and financial charges. He found out from his
study that the most influencing factor in cost structure of cement industry is power and fuel cost, the portion of this cost of total was 21 percent, where the portion
of raw materials cost and selling and distribution and other cost in total cost structure were 19.27 percent and 16.60 percentage respectively. So it can be calculated
that to improve the profitability of units there is a need to give proper attention towards this cost by corporate. The closest view of analysis showed that the
average cost in almost all elements of GACL was closer to the average industry.
Agiomirgianakis, Voulgaris and Papadogonas (2006)21 examined financial determinants of firm profitability and employment growth are identified by using a
panel of 3094 Greek manufacturing firms for 1995 and 1999, just before the country’s accession to the European Monetary Union. The analysis includes stepwise
regression models.
The independent variables used are size, age, location and exports, as well as a number of financial ratios describing the asset structure, capital structure, reliance
on debt, employee profitability and managerial efficiency.
The results show that size, age, exports, debt structure, investment in fixed assets and profitability assets and sales contribute significantly to firm growth. Econo-
metric results also reveal that firm size, age, exports, sales growth, reliance on debt on fixed assets and investment growth, as well as efficient management of
assets, influence profitability.
Sam Luther (2007)22 analyzed the liquidity, Risk and profitability. To measure the liquidity two important ratios are used; they are current ratio and quick ratio.
There are two major categories of profitability ratios 1. profit in relation to sales, and 2. profits in relation to investments. One of the major drawbacks of the
profits in relation to sales is that it ignores the Japanese electric power firms have enough managerial and financial capabilities even if the American financial
standard is hypothetically introduced into the evaluation of their financial performances. However, the empirical results also indicate that the empirical results
also indicate that the Japanese power industry performs barely above the American standard. Thus, corporate leaders in the Japanese power industry need to pay
more serious attention to their corporate finances and financial strategies.
Such financial perspective will be increasingly important along with the current deregulation policy of the Japanese government deregulation policy of the Japanese
government.
Dr. B. Ramachandra Reddy and Dr. B. Yuvaraja Reddy (2007)23 in their study, an attempt has been made to examine the effect of selected variables on MVA of
selected cement companies in India from 01.04.2003 to 31.03.2004. For the purpose of the study 3 major cement units and 7 mini plants were selected. The MVA
has been taken as a dependent variable and return on net worth, capital productivity, labour productivity, earnings per shares, economic value added, return on
sales (or) turnover, return on total assets and cash profits have been selected as independent variables. It can be inferred them regression analysis that none of
the factors was found to have significant impact on MVA. But EPS was found to have a negative and significant effect on MVA. This implies that the MVA of cement
companies is not only affected by selected independent variables but also influenced by other factors.
Kasturi Rangan, S. (2008)24 in his study made an attempt to identify the factors determining the profitability of the banks through partial correlation co efficient
for the period from March 2000 to 2007. These banks were categorized into 5 different groups for the purposes of analysis.
Victoria Bellou, Andronikidis, (2009)25 depicts in their study that organizational climate, which includes the setting of values, rules and priorities to be followed by
all individuals involved in the organization, has been receiving increased attention over recent years. The purpose of this paper is to look into the prevalent
organizational climate within hotels and to identify variations employees’ perception, based on whether they hold managerial or non-managerial positions. The
results show that efficiency, reflexivity, innovation and flexibility, supervision support and quality were among the most prominent characteristics affected by
organizational climate, whereas outward focus and pressure to produce were least affected. Moreover, the only differences revealed between managerial and
non-managerial employees were in the areas involvement and efficiency.
Ray Sarbapriya and Mihir Kumar Pal (2010)26 in their study reflect dismal declining trend after the path -breaking economic reforms in 1991. There is an urgent
need for developing a comprehensive plan for cement industry so that it can survive in the post -liberalized Indian environment and make its presence global.
Chandrakumarmangalam, P Govindasamy (2010)27 in their study have discussed the impact of leverage on the profitability of the firm. The relationship between
the debt and equity ratio and earnings per share and how effectively the firm be financing. The leverage and profitability and growth are related and the leveraging
impact on the profitability of the firm.
Glocker, Daniela (2011)28 in this paper I evaluate the effect of student aid on the success of academic studies. I focus on two dimensions, the duration of study
and the probability of actually graduating with a degree. To determine the impact of financial student aid, I estimate a discrete-time duration model allowing for
competing risks to account for different exit states (graduation and dropout) using individual level panel data from the German Socio-Economic Panel (SOEP) for
the years 1984-2007. My findings suggest that the duration of study is responsive to the type of financial support a student receives. There are three main results.
First, student aid recipients finish faster than comparable students who are supported by the same amount of parental/private transfers only. Second, although
higher financial aid does on average not affect the duration of study, this effect is (third) dominated by the increased probability of actually finishing university
successfully.
Rai Sandeep Kumar and Dwivdei Shailesh K, (2011)29 in their study, stated that the Cement Industry in India is moment. Driven by a booming real estate sector,
global demand and increased activity in his fracture development such as state and national highways, the cement industry has witnessed tremendous growth.
The realty sector boomed but could not sustain for long and it collapsed because of the loan defaults. This situation spread like wild fiber and put the Indian
economy in danger like the US economy. The US financial crises have affected many countries of the world and India is no exception to it. Because of these financial
crises, Indian economy has lost more than 2% of GDP growth. Almost all sectors of the Indian economy have been affected by this crisis.
N. Venkata Ramana (2012)30 Bankruptcy is a situation where the liabilities exceed the assets in the company, generally it happens due to under capitalization, not
maintain sufficient cash, sources are not utilize properly, in efficient management in all activities, sales decline and market situation etc. Predicting bankruptcy is
a dire vital for taking curative and corrective measures for better financial planning, profitability, liquidity and solvency efficiency of the firm. In this study an
attempt has been made know the financial performance and also to predict the risk of bankruptcy for selected cement companies from 2001-to-2010.
Liquidity Ratios; Working Capital Ratios, Solvency Ratios and Altman Z-Score Analysis was made to diagnose the problem of bankruptcy. The result reveals that
liquidity, working capital turnover efficiency and solvency position of the selected cement companies are not satisfactory. In this study the Z-Score analysis results
show that KCP Ltd and Kesoram Industries Ltd have poor financial performance and Dalmia Bharat Ltd is at the edge of bankruptcy.
Sachin Mittal, (2012)31 Indian cement industry is the second largest cement industry in the world. The paper attempts to examine the working capital trends on
the basis of size of working capital, ratio of working capital to total assets, fitting trend line analysis, and correlation amongst the profit, sales and current assets.
The present study opined that in India, cement industry has low level of profitability due to mismanagement of current assets and current liabilities. The main

VOLUME NO. 6 (2016), ISSUE NO. 11 (NOVEMBER) ISSN 2231-1009
INTERNATIONAL JOURNAL OF RESEARCH IN COMPUTER APPLICATION & MANAGEMENT A Monthly Double-Blind Peer Reviewed (Refereed/Juried) Open Access International e-Journal - Included in the International Serial Directories
http://ijrcm.org.in/
44
objective of working capital management is to arrange the needed funds at right time from the right sources and for the right period so that tradeoff between
liquidity and profitability may be realized. The study unearthed that the cement industry in India are failing to maintain the required level of working capital.
Sarangarajan (2013)32 Indian cement industry is the second largest cement industry in the world. The paper attempts to examine the performance and manage-
ment of assets of the select cement companies in Tamilnadu with the support of Trend analysis. Data employed in this study are all secondary in nature which is
frequently inspected by Institute of Charted Accountants of India and Security Exchange Board of India. The pooled data collection is to assess the impact of
regulation on performance of asset of cement companies in Tamil Nadu over the time horizon viz., 1996-97 to 2005-06 The variables used in this study are Land,
plant, stock, cash and debtors. The authors have chosen four cement companies in Tamilnadu and using a statistical technique as Trend analysis with the aid of
Minitab software version 15. On an analysis it is found that cement plants taken first study have procured land not only for plant construction but also mining
lands keeping the future expansion/new plant on a long term basis. It is natural for Tamil Nadu cement factories to hold higher inventory of limestone because of
various factors involved in mining operation and location of the mining land from the factory. As found in the Trend Analysis the cement plants had changed their
marketing policy from “Cash and Carry” to credit sales. This change in policy of offering credit to large consumers is a major cause for higher debtor’s balance in
the recent years.
The cement plants in Tamil Nadu in their efforts to increase their market share started offering credit to the consumers especially for real estate builders which
has resulted in low cash balance. It is expected that change in cement customer mix will result in a comfortable cash balance in future. It is found that so many
small cement industries have been closed because of improper cash management. This has resulted in cash crunch in Cash Trend Analysis. The consumption of
cement by government increases, this trend may be expected to decline.
Dr. P. Krishna Kumar (2013)33 The study was designed to investigate the progress of Indian cements industry since 1991, in terms of its growth in installed capacity,
production, exports, and value additions; In detail the research methodology used for the study that has focused on the past, present and the future performance
of Indian Cement Industry (ICI) at the macro level and the Chettinadu Cement Corporation Limited (CCCL) at the micro level as a case firm. The study purely relies
on secondary data. The secondary data were collected for a period of fifteen years (1991-92 to 2005-06) from the database maintained and made available by
several organizations viz., Cement Manufacturers Association, Export Import Bank of India, Center for Monitoring Indian Economy etc. for the purpose of effective
periodical analysis. In order to know the progress of ICI, annual time series data for the six variables were.
Studied for trend, cyclical variation and random variation, as seasonal variation was not observable in the annual data. The estimated trend equations were
evaluated for their goodness of fit and predictive power and found valid to draw inferences. The values of the six variables were projected to the next five years.
Estimated values were adjusted for the likely effects of cyclical variations (c) the reliability of predicted values was evaluated with the help of forecasting error. In
the end of the study implications and conclusion were provided.
Acharekar Sachin Vilas Vijaya (2013)34 Working capital is considered to be life -giving force to an economic entity and managing working capital one of the most
important functions of corporate management. Working capital management (WCM) is the management of short – term financing requirements of a firm which
includes maintaining optimum balance of working capital components –receivables, inventory and payables – and using the cash efficiently for day – to -day
operations. The main objectives of this study are to examine and evaluate the working capital management in Cement Industries Limited, examine the manage-
ment pattern of inventory, liquidity position and receivables management. This also finds the relationship between Working Capital Efficiency and Profitability,
Profitability.
OBJECTIVES OF THE STUDY The present study in general aims at making a comparative study of financial performance in two and three wheelers sectors of Indian automobile industry. The
specific objectives of the study are:
1. To assess the impact of turnover ratios on profitability of Indian Two and Three Wheelers Sector.
2. To examine the combine effect of the ratios relating to Turnover ratios and profitability with the assistance of correlation co-efficient.
RESEARCH METHODOLOGY SELECTION OF SAMPLE
Keeping in view the scope of the study, it is decided to include all the companies under two and three wheelers sector in Indian automobile industry working
before or from the year 2005-06 to 2014-15. But, owing to several constraints such as non-availability of financial statements or non-working of a company in a
particular year etc., the researcher is compelled to restrict the number of sample companies to nine. Therefore, this study is expost facto based on survey method
making a survey of nine companies under two and three wheelers sector in Indian automobile industry. There are seventeen companies operating in the two and
three wheelers sector in India. The details of the sector with the available companies of Indian automobile industry.
PERIOD OF STUDY
The period 2005-06 to 2014-15 is selected for this study of two and three wheelers sectors in Indian automobile industry. This 10 years period is chosen in order
to have a fairly long, cyclically well balanced period, for which reasonably homogenous, reliable and upto-date financial data would be available. Further, the span
chosen for the study is the period of the beginning of liberalization measures introduced by the Government of India. Hence, the period 2005-06 to 2014-15 is an
era of growth of Indian Two and Three wheelers sector financial performance in the manufacturing sector, particularly automobile industry and has got genuine
economic significance of its own.
SOURCE OF DATA
The study is mainly based on secondary data. The major source of data analyzed and interpreted in this study related to all those companies selected is collected
from “PROWESS” database, which is the most reliable on the empowered corporate database of Centre for Monitoring Indian Economy (CMIE). It contains a highly
normalized database built on a sound understanding of disclosure in India on around 12,000 companies, which include public, private, co-operative and joint sector
companies. The database provides financial statements, ratio analysis, funds flow, cash flow, product profiles, returns and risk on the stock market etc.
Besides prowess databases, relevant secondary data have also been collected from BSE Stock Exchange Official Directory, CMIE Publications, Annual Survey of
Industry, Business newspapers, Reports on Currency and Finance, Libraries of various Research Institutions, through Internet etc. The study required variety of
data therefore; websites like http://indiainfoline.com, www.indiastat.com and www.google.com have been comprehensively searched.
FINANCIAL AND STATISTICAL TOOLS
The ratios relating to working capital management which have been selected and computed for the study are Current Ratio (CR), Liquid Ratio (LR), Inventory
Turnover Ratio (ITR), Receivable Turnover Ratio (RTR), Total Asset Turnover Ratio (TATR), Fixed Asset Turnover Ratio and determined Profit Before Tax to Total
Assets Ratio (PBT to Total Assets Ratio) is used. For analysing data simple statically tools like‘t’ test and Karl Pearsons’s Co-efficient of Correlation have been used
to examine the interrelationship the variables and level of significance.
LIMITATIONS OF THE STUDY
The data used in this study have been taken only secondary sources and as such it findings depends entirely on the accuracy of such data.
RESULTS AND DISCUSSIONS TWO AND THREE WHEELERS SECTOR IN INDIA
ATUL AUTO LIMITED
Firstly, it is evident from the table 1 shows that the co-efficient of correlation between profitability ratio and current ratio is 0.74. It reveals a positive correlation
which is significant at 10 per cent level. Secondly, the co-efficient of correlation between profitability and liquid ratio stands at 0.72. It shows a positive correlation
between the two variables, which is insignificant. Thirdly, the co-efficient of correlation between profitability ratio and inventory turnover ratio is 0.84. It reveals
a positive correlation which is significant at 5 per cent level. Fourthly, the co-efficient of correlation between profitability ratio and receivables turnover ratio is

VOLUME NO. 6 (2016), ISSUE NO. 11 (NOVEMBER) ISSN 2231-1009
INTERNATIONAL JOURNAL OF RESEARCH IN COMPUTER APPLICATION & MANAGEMENT A Monthly Double-Blind Peer Reviewed (Refereed/Juried) Open Access International e-Journal - Included in the International Serial Directories
http://ijrcm.org.in/
45
found to be 0.65. It shows a low positive correlation between the two variables, which is insignificant. Fifthly, the co-efficient of correlation between profitability
ratio and total assets turnover ratio indicates higher positive association of 0.93, which is significant at 5 per cent level. Lastly, the co-efficient of correlation
between profitability ratio and fixed assets turnover ratio is found to be 0.79, It shows a positive correlation between the two variables, which is insignificant.
Total assets turnover ratio and Inventory turnover ratio confirm with the assumption that higher the turnover increases the profitability of the Atul Auto Limited
industry.
Thus, the analysis of the impact of turnover ratios on profitability in the Atul Auto Limited industry showed that CR, LR, ITR, RTR, TATR and FATR have shown
positive correlation with profitability ratio. All the independent ratios except LR, RTR, FATR are found to have significant association with profitability ratio.
BAJAJ AUTO LIMITED
The table 2 replicates that the co-efficient of correlation between profitability ratio and current ratio is -0.71. It shows negative correlation between the variables.
This is significant at 10 per cent level. The co-efficient of correlation between profitability ratio and inventory turnover ratio 0.83 and receivables turnover ratio
0.89 are found to have a high positive association with profitability ratio. It reveals that high degree of correlation between the variables, which is significant at 1
per cent level. Similarly, the co-efficient of correlation between profitability ratio and liquid ratio is 0.18 and total asset turnover ratio is 0.27 are found to have a
low degree of positive association with profitability ratio which is insignificant. Lastly, the co-efficient of correlation between profitability and fixed asset turnover
ratio is 0.55. It shows a positive correlation found to be significant at 10 per cent level.
Thus, the analysis of the impact of turnover ratios on profitability in the Bajaj Auto Limited showed that CR have shown a negative correlation with profitability
ratio and LR, ITR, RTR, TATR and FATR have shown positive correlation with profitability ratio. It is also inferred from the table that all the independent ratios are
significantly associated with profitability ratio.
HERO MOTO CORP LIMITED
It is evident from the table 3 that the co-efficient of correlation between profitability ratio and current ratio is 0.01. It shows a low degree of positive correlation
between the variables. This is insignificant. Similarly, the co-efficient of correlation between profitability ratio and liquid ratio stands at -0.58. It is also indicates
that there is negative correlation between these two variables. The value of co-efficient of correlation is found to be significant at 10 per cent level.
The co-efficient of correlation between profitability ratio and inventory turnover ratio is 0.70; it shows high degree of positive correlation between the variables.
This is significant at 10 per cent level. The co-efficient of correlation between profitability ratio and receivable turnover ratio 0.25.which is insignificant. It is also
indicating that there is moderate positive correlation between these two variables, total assets turnover ratio 0.57 are found to have a positive association with
profitability ratio. It reveals that the correlation between the variables, which is significant at 10 per cent level. Lastly, the co-efficient of correlation between
profitability and fixed assets turnover ratio is 0.49. This is also positive correlation found to be insignificant.
Thus, the analysis of the impact of turnover ratios on profitability in the Hero Moto Corp Limited showed that LR have a negative correlation with profitability ratio
and CR, ITR, RTR, TATR and FATR have shown positive correlation with profitability ratio. It is also inferred from the table that all the independent ratios are
significantly associated with profitability ratio except CR, RTR, and FATR.
KINETIC ENGINEERING LIMITED
It is evident from the table 4 that the co-efficient of correlation between profitability ratio and current ratio is -0.21. It shows a low degree of negative correlation
between the variables. This is significant at 1 per cent level. Secondly, the co-efficient of correlation between profitability ratio and liquid ratio stands at -0.36. It
is also indicates that the moderate degree of negative correlation between these two variables. This is insignificant.
Thirdly, the co-efficient of correlation between profitability ratio and inventory turnover ratio is -0.69 It reveals that the negative correlation between the variables,
which is significant at 5 per cent level. Fourthly, the co-efficient of correlation between profitability ratio and receivables turnover ratio is -0.40. It indicates that
the negative correlation between the variables which is insignificant. Fifthly, the co-efficient of correlation between profitability ratio and total asset turnover ratio
is -0.71. It shows that high degree of negative correlation between the two variables, which is significant at 10 per cent level. Finally, the co-efficient of correlation
between profitability ratio and fixed asset turnover ratio is 0.56. It indicates that the positive correlation between the variables, which is insignificant.
Thus, the analysis of the impact of turnover ratios on profitability in the Kinetic Engineering Limited showed that CR, LR, ITR, RTR, and TATR have shown negative
correlation with profitability ratio and FATR have a positive correlation with profitability ratio. It is also inferred from the table that all the independent ratios are
significantly associated with profitability ratio except LR, RTR, and FATR.
LML LIMITED
The co-efficient of correlation between inventory ratios and profitability ratios for the LML Limited are presented in table 5.
It is evident from the table 5 that the co-efficient of correlation between profitability ratio and current ratio is 0.47. It shows a positive correlation between the
variables. This is significant at 10 per cent level. Similarly, the co-efficient of correlation between profitability ratio and liquid ratio stands at -0.11. It is also indicating
that there is low degree of negative correlation between these two variables which is insignificant.
The co-efficient of correlation between profitability ratio and inventory turnover ratio 0.75 and total asset turnover ratio 0.88 are found to have a high positive
association with profitability ratio. It reveals that high degree of correlation between the variables. ITR and TATR are statistically insignificant. The co-efficient of
correlation between profitability and receivables turnover ratio is -0.58 this is negative correlation found to be significant at 1 per cent level. Moreover, the co-
efficient of correlation between profitability ratio and fixed assets turnover ratio is -0.61. This is also negative correlation found to be significant at 1 per cent level.
Thus, the analysis of the impact of turnover ratios on profitability in the LML Limited showed that CR, ITR, and TATR have shown positive correlation with profita-
bility ratio and LR, RTR and FATR have shown a negative correlation with profitability ratio It is also inferred from the table that all the independent ratios are
significantly associated with profitability ratio except LR, ITR, and TATR.
CONCLUSION The analysis of the impact of turnover ratios on profitability in the Atul Auto Limited industry showed that CR, LR, ITR, RTR, TATR and FATR have shown positive
correlation with profitability ratio. All the independent ratios except LR, RTR, FATR are found to have significant association with profitability ratio. The Bajaj Auto
Limited showed that CR have shown a negative correlation with profitability ratio and LR, ITR, RTR, TATR and FATR have shown positive correlation with profitability
ratio. It is also inferred from the table that all the independent ratios are significantly associated with profitability ratio. The Hero Moto Corp Limited showed that
LR have a negative correlation with profitability ratio and CR, ITR, RTR, TATR and FATR have shown positive correlation with profitability ratio. It is also inferred
from the table that all the independent ratios are significantly associated with profitability ratio except CR, RTR, and FATR. The Kinetic Engineering Limited showed
that CR, LR, ITR, RTR, and TATR have shown negative correlation with profitability ratio and FATR have a positive correlation with profitability ratio. It is also
inferred from the table that all the independent ratios are significantly associated with profitability ratio except LR, RTR, and FATR. Lastly, the LML Limited showed
that CR, ITR, and TATR have shown positive correlation with profitability ratio and LR, RTR and FATR have shown a negative correlation with profitability ratio It is
also inferred from the table that all the independent ratios are significantly associated with profitability ratio except LR, ITR, and TATR. The overall results of the
model showing impact of turnover ratios on profitability of two and three-wheelers sector in India the Atul Auto Limited is encouraging.
REFERENCES 1. Amita S. Kantawala (2001-02) “Financial performance of Non Banking Finance companies in India”, The Indian Economic Journal 49(1), July – Sep 2001-02.,
pp.88-92.
2. Kar.N.C and Sahoo, SK, (2001) "Working capital management. A comparison of Bajaj Auto ltd and Telco" JIMS 8m, Jan-March2001, pp.20-24.
3. Padmaja Manoharan (2002) “An Analystical study in Profitability of cement industry in India 2002”.
4. Shanmugasundaram and Ratnam (2002) “Measures for sustaining profitability of spinning mills”, The South India Textile Research Association, Coimbatore,
Vol.47, No.5, Sep 2002, pp.1-36.
5. Nand Kishore Sharma (2002) Financial appraisal of cement Industry in India, The management Accountant, August 2002, pp. 622-625.

VOLUME NO. 6 (2016), ISSUE NO. 11 (NOVEMBER) ISSN 2231-1009
INTERNATIONAL JOURNAL OF RESEARCH IN COMPUTER APPLICATION & MANAGEMENT A Monthly Double-Blind Peer Reviewed (Refereed/Juried) Open Access International e-Journal - Included in the International Serial Directories
http://ijrcm.org.in/
46
6. Sankaran (2002) “Financial performance evaluation of pharmaceutical companies in India”, Finance India, vol.XVI, No.3, Sep 2002, pp.1059-1061.
7. Mansur Mulia.A(2002) Use of ‘Z’ Score Analysis for Evaluation of Financial Health of Textile Mills – A case study”, Abhigyam. 19(4), January – March 2002,
pp.37-41.
8. Prasad Sangameshwaran (2002) ‘Cementing Brand Equity’, Indian Cement Review’, October.2002. p. 5-6.
9. Jack Glen, Kevin Lee and Ajit Singh (2002) Corporate profitability and the dynamics of competition in emerging markets – A time series analysis, ESRC Center
for Business Research, University of Cambridge, Working Paper No.248.
10. Tze-wei Fu, Mei-Chiu ke and Yen-Sheng Huang (2002) Capital Growth, Financing source and profitability of small Business: Evidence from Taiwan Small
Enterprises, Small Business Economics, Vol.18, No.4, pp.257-267.
11. Kaen and Baumann (2003) “Firm Size, Employees and profitability in US Manufacturing Industries”, http://ssrn.com/sol.papers.cf, abstracted=899615, Ac-
cessed on July 10, 2006.
12. Bardia (2004) Liquidity management- A case study of steel Authority of India, Finance India vol. XVI, No 3,2004, pp.463-467.
13. A. V. Dharmadrishnan (2004) ‘Need thrust after a pause’, The Hindu Survey of Indian Industry. 2004. pp.209.
14. Arthur S. Leahy (2004) The determinants of profitability in the Liquor Industry, Briefing Notes in Economics, No.61, pp.1-6.
15. Patel (2004) “Profit and Profitability (A Case study of Colour-Chem Limited)”, ACCST Research Journal, Vol.ii, No.2, pp.89-95.
16. Marcos A. M. Lima and Marcelo Resend (2004) Profit margins and business cycles in the Brazilian industry: a panel data study, Taylor and Francis Journal in
Applied Economics, pp.923-930.
17. Sueyoshi, Toshiyuki (2005) Financial Ratio Analysis of the Electric Power Industry, Asia –pacific Journal of operational Research, vol. 22, Issue 3, September
2005, pp. 349-376.
18. Alovsat muslumov (2005) The Financial and operating performance of privatized companies in Turkish Cement Industry, METU studies in Development,
Vol.32, No.1,2005, pp.59-100.
19. Hamasalakshmi and Manickam (2005) “Financial performance analysis of selected software companies”, Finance India, Vol.XIX, No.3, Sep 2005, pp.935.
20. Dr. Sanjay J. Bhayani (2006) “Financial Performance in paper Industry – A case study”, The Management Accountant,30(5)-May 2006, pp.327-336.
21. Agiomirgianakis, Voulgaris and Papadogonas (2006) Financial factors affecting profitability and employment growth: the case of Greek manufacturing, Inter-
national Journal of Financial Service Management, Vol.1 Nos.2/3, pp.232-242.
22. Sam Luther (2007) Liquidity, Risk and Profitability analysis a case study of madras cements ltd, The management Accountant, Vol.42, No.10. October-2007.
Pp.784-789.
23. Dr. B. Ramachandra Reddy and Dr. B. Yuvaraja Reddy (2007) A case study, The management Accountant Vol.35, No.5, May 1971. Pp. 377-378.
24. Kasturi Rangan, S. (2008) “Determinants of Profits and Banks - Studying their correlation”. The Indian Banker, Vol.III, August 2008, pp.52-54.
25. Victoria Bellou, Andronikidis, (2009) Examining Organizational climate in Greek Hotels journal of contemporary Hospitality management, 2009, vol.21, issue:
3, pp.294-30.
26. Ray Sarbapriya and Mihir Kumar Pal (2010) “Trade Liberalization and Industrial Performance of Cement Industry in India, International Journal of Productivity
and Quality Management, Vol6, No.3. 210, pp.332-353.
27. Chandrakumarmangalam, P Govindasamy (2010) An Analysis and its impact on Profitability with Reference to Selected Cement Companies in India, European
Journal of Economics, Finance and Administrative Sciences, No.27, pp.53-57.
28. Glocker, Daniela (2011) The Effect of Student Aid on the Duration of Study Economics of Education Review, Journal Articles; Reports - Research v30 n1 p177-
190 Feb 2011
29. Rai Sandeep Kumar and Dwivdei Shailesh K, (2011) Impact of Global recession on the Indian Cement Industry with special reference to ACC Limited, Journal
of Managerial Economies, Year 2011.
30. N. VenkataRamana (2012) financial performance and predicting the risk of bankruptcy: a case of selected cement companies in India international journal of
public administration and management research (IJPAMR), vol. 1, no. 1, October 2012, 40-56.
31. Sachin Mittal, (2012) Indian cement industry is the second largest cement industry in the world. International Conference on Humanities, Economics and
Geography (ICHEG'2012) March 17-18, 2012.
32. Sarangarajan (2013) Financial Ratio Analysis of the Electric Power Industry, Asia –pacific Journal of operational Research, vol. 22, Issue 3, September 2013,
pp. 349-376.
33. Dr. P. Krishna Kumar, (2013) The study was designed to investigate the progress of Indian Cements Published by European Centre for Research, Training and
Development, UK British Journal of Marketing Studies Vol.1, No. 1, March 2013, pp.1-15.
34. Acharekar Sachin Vilas Vijaya (2013) International Refereed Journal of Engineering and Science (IRJES) ISSN (Online) 2319 - 183X, (Print) 2319-1821 Volume
2, Issue 8 (August 2013), PP.12 -17.
APPENDIX TABLE 1: IMPACT OF TURNOVER RATIOS ON PROFITABILITY –SIMPLE CORRELATION ANALYSIS (Atul Auto Limited)
Year CR LR ITR RTR TATR FATR PBT to Total Assets Ratio
2005-06 1.32 0.67 17.38 19.97 3.28 5.92 0.17
2006-07 1.19 0.78 9.14 16.64 2.26 4.05 0.09
2007-08 1.09 0.53 4.56 15.07 1.33 2.31 0.03
2008-09 1.07 0.48 6.78 33.58 1.89 3.04 0.01
2009-10 1.10 0.41 7.17 32.36 2.11 2.58 0.13
2010-11 1.05 0.40 11.79 44.85 4.15 3.67 0.29
2011-12 1.16 0.58 13.45 57.36 4.81 5.30 0.37
2012-13 1.37 1.03 15.55 62.02 4.88 6.32 0.50
2013-14 1.58 1.34 20.74 47.52 4.53 6.32 0.45
2014-15 1.65 1.18 21.79 23.73 4.05 5.37 0.49
r 0.74 0.72 0.84 0.65 0.93 0.79
t 4.35*** -1.84 -3.19** 5.84 6.77** -1.87
Source: Computed from the annual reports of the respective units
**Significant at 0.05 level
***Significant at 0.10 level
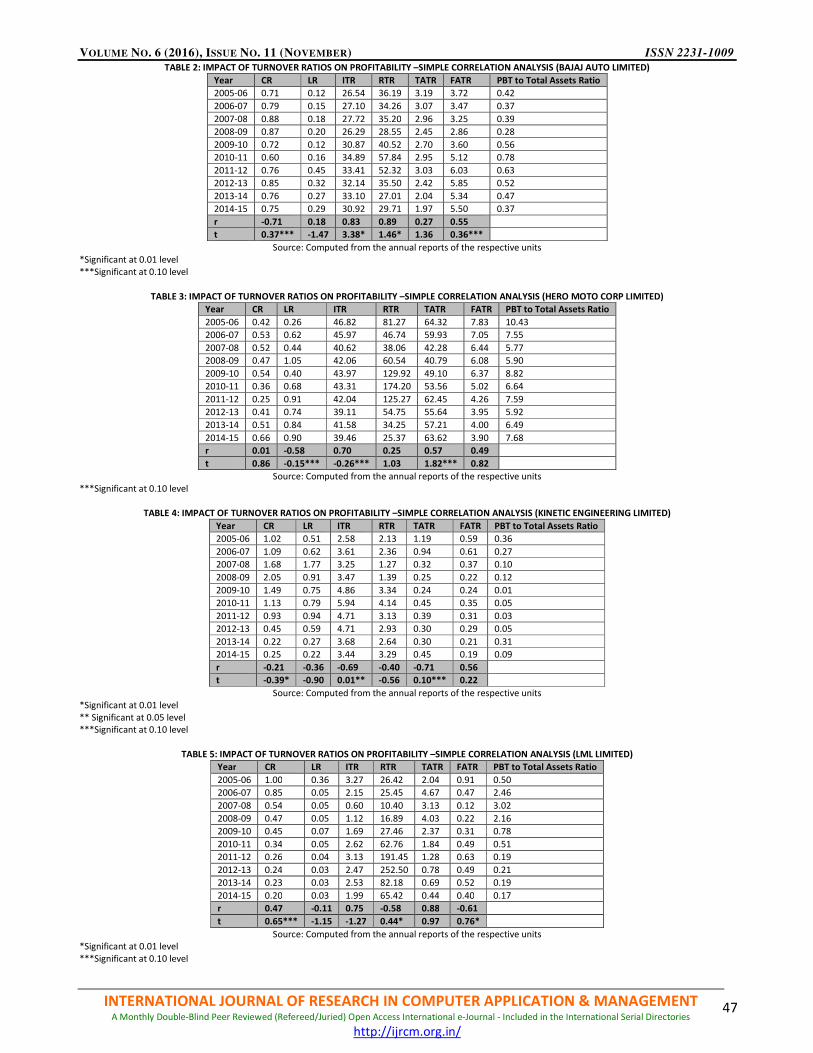
VOLUME NO. 6 (2016), ISSUE NO. 11 (NOVEMBER) ISSN 2231-1009
INTERNATIONAL JOURNAL OF RESEARCH IN COMPUTER APPLICATION & MANAGEMENT A Monthly Double-Blind Peer Reviewed (Refereed/Juried) Open Access International e-Journal - Included in the International Serial Directories
http://ijrcm.org.in/
47
TABLE 2: IMPACT OF TURNOVER RATIOS ON PROFITABILITY –SIMPLE CORRELATION ANALYSIS (BAJAJ AUTO LIMITED)
Year CR LR ITR RTR TATR FATR PBT to Total Assets Ratio
2005-06 0.71 0.12 26.54 36.19 3.19 3.72 0.42
2006-07 0.79 0.15 27.10 34.26 3.07 3.47 0.37
2007-08 0.88 0.18 27.72 35.20 2.96 3.25 0.39
2008-09 0.87 0.20 26.29 28.55 2.45 2.86 0.28
2009-10 0.72 0.12 30.87 40.52 2.70 3.60 0.56
2010-11 0.60 0.16 34.89 57.84 2.95 5.12 0.78
2011-12 0.76 0.45 33.41 52.32 3.03 6.03 0.63
2012-13 0.85 0.32 32.14 35.50 2.42 5.85 0.52
2013-14 0.76 0.27 33.10 27.01 2.04 5.34 0.47
2014-15 0.75 0.29 30.92 29.71 1.97 5.50 0.37
r -0.71 0.18 0.83 0.89 0.27 0.55
t 0.37*** -1.47 3.38* 1.46* 1.36 0.36***
Source: Computed from the annual reports of the respective units
*Significant at 0.01 level
***Significant at 0.10 level
TABLE 3: IMPACT OF TURNOVER RATIOS ON PROFITABILITY –SIMPLE CORRELATION ANALYSIS (HERO MOTO CORP LIMITED)
Year CR LR ITR RTR TATR FATR PBT to Total Assets Ratio
2005-06 0.42 0.26 46.82 81.27 64.32 7.83 10.43
2006-07 0.53 0.62 45.97 46.74 59.93 7.05 7.55
2007-08 0.52 0.44 40.62 38.06 42.28 6.44 5.77
2008-09 0.47 1.05 42.06 60.54 40.79 6.08 5.90
2009-10 0.54 0.40 43.97 129.92 49.10 6.37 8.82
2010-11 0.36 0.68 43.31 174.20 53.56 5.02 6.64
2011-12 0.25 0.91 42.04 125.27 62.45 4.26 7.59
2012-13 0.41 0.74 39.11 54.75 55.64 3.95 5.92
2013-14 0.51 0.84 41.58 34.25 57.21 4.00 6.49
2014-15 0.66 0.90 39.46 25.37 63.62 3.90 7.68
r 0.01 -0.58 0.70 0.25 0.57 0.49
t 0.86 -0.15*** -0.26*** 1.03 1.82*** 0.82
Source: Computed from the annual reports of the respective units
***Significant at 0.10 level
TABLE 4: IMPACT OF TURNOVER RATIOS ON PROFITABILITY –SIMPLE CORRELATION ANALYSIS (KINETIC ENGINEERING LIMITED)
Year CR LR ITR RTR TATR FATR PBT to Total Assets Ratio
2005-06 1.02 0.51 2.58 2.13 1.19 0.59 0.36
2006-07 1.09 0.62 3.61 2.36 0.94 0.61 0.27
2007-08 1.68 1.77 3.25 1.27 0.32 0.37 0.10
2008-09 2.05 0.91 3.47 1.39 0.25 0.22 0.12
2009-10 1.49 0.75 4.86 3.34 0.24 0.24 0.01
2010-11 1.13 0.79 5.94 4.14 0.45 0.35 0.05
2011-12 0.93 0.94 4.71 3.13 0.39 0.31 0.03
2012-13 0.45 0.59 4.71 2.93 0.30 0.29 0.05
2013-14 0.22 0.27 3.68 2.64 0.30 0.21 0.31
2014-15 0.25 0.22 3.44 3.29 0.45 0.19 0.09
r -0.21 -0.36 -0.69 -0.40 -0.71 0.56
t -0.39* -0.90 0.01** -0.56 0.10*** 0.22
Source: Computed from the annual reports of the respective units
*Significant at 0.01 level
** Significant at 0.05 level
***Significant at 0.10 level
TABLE 5: IMPACT OF TURNOVER RATIOS ON PROFITABILITY –SIMPLE CORRELATION ANALYSIS (LML LIMITED)
Year CR LR ITR RTR TATR FATR PBT to Total Assets Ratio
2005-06 1.00 0.36 3.27 26.42 2.04 0.91 0.50
2006-07 0.85 0.05 2.15 25.45 4.67 0.47 2.46
2007-08 0.54 0.05 0.60 10.40 3.13 0.12 3.02
2008-09 0.47 0.05 1.12 16.89 4.03 0.22 2.16
2009-10 0.45 0.07 1.69 27.46 2.37 0.31 0.78
2010-11 0.34 0.05 2.62 62.76 1.84 0.49 0.51
2011-12 0.26 0.04 3.13 191.45 1.28 0.63 0.19
2012-13 0.24 0.03 2.47 252.50 0.78 0.49 0.21
2013-14 0.23 0.03 2.53 82.18 0.69 0.52 0.19
2014-15 0.20 0.03 1.99 65.42 0.44 0.40 0.17
r 0.47 -0.11 0.75 -0.58 0.88 -0.61
t 0.65*** -1.15 -1.27 0.44* 0.97 0.76*
Source: Computed from the annual reports of the respective units
*Significant at 0.01 level
***Significant at 0.10 level

VOLUME NO. 6 (2016), ISSUE NO. 11 (NOVEMBER) ISSN 2231-1009
INTERNATIONAL JOURNAL OF RESEARCH IN COMPUTER APPLICATION & MANAGEMENT A Monthly Double-Blind Peer Reviewed (Refereed/Juried) Open Access International e-Journal - Included in the International Serial Directories
http://ijrcm.org.in/
48
THE CAUSATIVE EFFECT OF ADVERTISEMENT ON SALES
JAKKIREDDY SURESH REDDY
ASST. PROFESSOR
DEPARTMENT OF MANAGEMENT STUDIES
RAJEEV GANDHI MEMORIAL COLLEGE OF ENGINEERING AND TECHNOLOGY
NANDYAL
MULINTI CHINNA PULLAIAH
ASST. PROFESSOR
DEPARTMENT OF MANAGEMENT STUDIES
RAJEEV GANDHI MEMORIAL COLLEGE OF ENGINEERING AND TECHNOLOGY
NANDYAL
ABSTRACT The Advertising industry represents an important business sector with respect to national and international economics. An advertising campaign may satisfy a
multitude of objectives for a firm. The commercials may be used to inform consumers about the usage features and benefits specific to a brand or a given product,
or generate favorable attitudes and preferences amongst customers. Due to less product differentiation and intense industry competition, many marketers heavily
involve in advertising and branding tasks. The Nike Inc business which is engaged in the design, development, manufacturing and global wide marketing and sales
of footwear, apparel, equipment, accessories and services is one of the fastest growing companies in the global market. The current study examined the linear
relationship between the advertising expenses and the sales revenues for the Nike Inc business on the secondary data for the six years. The two main objectives of
this study are to i. To analyze the relationship between the advertisement expenditures and the sales revenues on the collected secondary data of Nike’s Inc. ii.
Providing the analysis of the relationship between advertising and sales in the advertising industry during the observed period. This study controlled for factors
expected to affect sales revenues such as population size, price and inflationary effects. Results from the analysis show a positive and significant relationship
between advertising expenditures and sales revenues.
KEYWORDS advertisement expenses, sales revenue, secondary data, cause, impact, advertising and sales relationship.
INTRODUCTION ne of the important IMC tools that help the marketer to create the awareness in the public and to increase the sales of a product is the advertising.
Advertising is one of the tools to an organization to defend the competitors. Advertising is a prominent feature of modern business operations. One can
encounter advertising messages, while watching TV, reading magazines, listening to the radio, surfing the internet, or even simply while walking down the
street, as advertisement has a stimulating influence on purchasing behavior of the customer. That is why every organization with the expectation of earning return
is investing millions of rupees or dollars on this mode of marketing communication.
But to what extent the sales are influenced by the advertisement is a debatable question. While one of the groups are in favour of the advertisement and the
other group consider the advertisement as the wasteful expenditure.
But certainly there should be an impact of advertisement on sales and that could be the reason why the companies spend huge amounts of money on advertise-
ment. And what is expected to be seen is which companies spend more heavily on advertisements and which do not spend more on advertisement.
Even till today there is no clear marketing literature on the integration of the advertisement expenditure on the sales figures and revenues but most of the
marketing research studies have focused on the advanced countries like USA etc. The current study drafts the literature on the already available data and by
studying the linkages between the advertisement expenditure and the sales revenues of the NIKE Inc.
Hence, in pursuit of their ultimate objective of increasing sales, every endeavor of each marketer is to make this mode of sales generation more effective. But
advertisement effectiveness conveys different meanings to different groups.
The research study is planned and organized as follows. The present part introduces the concept of the research study and briefs the need of the study. The second
presents state the objectives of the study. The third part reviews the literature available till now. The fourth part describes the methodology used for the study.
And the fifth part presents the results and conclusions.
OBJECTIVES OF THE STUDY 1. To find out whether an increase in advertisement expenditure leads to an increase in the sales revenues.
2. To find out the type relation between the advertisement expenditure and sales revenue.
3. To suggest to the marketers with respect to the need to the increase in the advertisement expenditure in order to increase the sales revenues.
REVIEW OF LITERATURE Till date many researchers had studied the impact of the advertisement on sales.
Brooker, Eastwood, Gray (1994) examine the influence of advertising on consumer demand.
Leach and Reekie (1996) analysed the effect of advertising on the market share of a brand.
Gabszewicz, Laussel and Sonnac (2001) studied the impact of advertising on the level of differentiation.
Kamber (2002) studied the factors affecting the advertisement such as company size or past sales.
Guo (2003), examined the relationship between advertising and consumption at macro level.
Weston (2004) studied the impact of advertising on breadth of
Ownership and stock liquidity in the secondary market.
Sundarsan (2007) examine the effectiveness of advertising on sales of small and large firms.
Chemmanur and Yan (2008) studied the effect of advertising in the market of new securities issues.
Different researchers had found various results.
Brooker, Eastwood, Gray (1994) reveal that newspaper advertising elasticity’s were positive and significant.
Leach and Reekie (1996) unearth that the brand on the market share effect by distributed lag model.
Gabszewicz, Laussel and Sonnac (2001) reveal that advertising reduces differentiation between broadcasters.
Kamber (2002) uncover a measurable relationship between advertising expenditure and sales.
O

VOLUME NO. 6 (2016), ISSUE NO. 11 (NOVEMBER) ISSN 2231-1009
INTERNATIONAL JOURNAL OF RESEARCH IN COMPUTER APPLICATION & MANAGEMENT A Monthly Double-Blind Peer Reviewed (Refereed/Juried) Open Access International e-Journal - Included in the International Serial Directories
http://ijrcm.org.in/
49
Guo (2003) find that advertising and consumption using the US data on advertising expenditure, personal consumption and disposable income.
Weston (2004) reveal that advertising affects the contemporary stock returns in the advertising year.
Sundarsan (2007) unearth that advertising has influenced sales, though its relative effectiveness was not the same for all the categories of firms.
Chemmanur and Yan (2008) reveal that decision of product market advertising and the decision on the amount of the money left on table during the going public
process.
This study mainly focuses on the causative effect of advertisement expenditure on the sales revenues.
RESEARCH METHODOLOGY Simple Linear Regression Analysis for the Sales & Advertising Expenditure Data of Nike, where the Nike’s data will be the experimental data. The predictor variable,
sales (Y) depends on the response variable, advertising expenditure (X). The collected experimental data set is as follows:
TABLE 1
Year Sales (Million US $)-Y Advertising Expenditure (Billion US $)-X
2005 1,212 1.6
2006 1,392 1.74
2007 1,492 1.91
2008 1,883 2.31
2009 1,487 2.35
2014 2,693 3.03
Economic relationship may be there and may not be there between Advertising and Sales. There might be a positive or negative relationship between the two
attributes.
HYPOTHESIS
If there is a significant linear relationship between the independent variable X and the dependent variable Y, the slope will not equal zero.
H0: Β1 = 0
Ha: Β1 ≠ 0
The null hypothesis states that the slope is equal to zero, and the alternative hypothesis states that the slope is not equal to zero.
Generate a regression plot and the regression line for the two variables to know the degree of the relationship between them.
FIG. 1
The fitted regression equation is
y = 158.1x – 31592
The coefficient of determination r2 and the correlation coefficient r quantify the strength of a linear relationship.
Regression line
Y=158.1x – 31592
Coefficient of determination
R2 = 0.882
The regression line as shown in the chart and the R2 value (0.882) known as the Coefficient of determination represent the moderate relationship between the
Sales and advertising expenditure. That is 88.2% of the sample variation in y can be explained by the variation in x. And remaining 11.8 % variation in y cannot be
explained.
"Predictor" (the intercept b0 is always referred to as the Constant.)
R-squared is the “percent of variance explained” by the model.
Correlation Coefficient
r = ±√ R2
= ± √ 0.882
= 0.94
The sign of r depends on the sign of the estimated slope coefficient b1:
• If b1 is negative, then r takes a negative sign.
• If b1 is positive, then r takes a positive sign.
That is, the estimated slope and the correlation coefficient r always share the same sign. Furthermore, because r2 is always a number between 0 and 1, the
correlation coefficient r is always a number between -1 and 1.
The correlation coefficient explains the type of relation between the sales and advertising. Since the value of r = 0.94 which is closer to +1 indicates that the two
variables are positively related. (Positive linear relationship).
Residual errors will be there between the actual/observed values and the predicted values (Values on the trend line/fitted regression line.)
y = 158.16x - 315920
R² = 0.8825
y = 0.161x - 321.13
R² = 0.963
S
a
l
e
s
Advertising expenditure in different Years
Sales (Million US $)-Y
Advertising Expenditure (Billion US $)-
X
Linear (Sales (Million US $)-Y)
Linear (Advertising Expenditure
(Billion US $)-X)
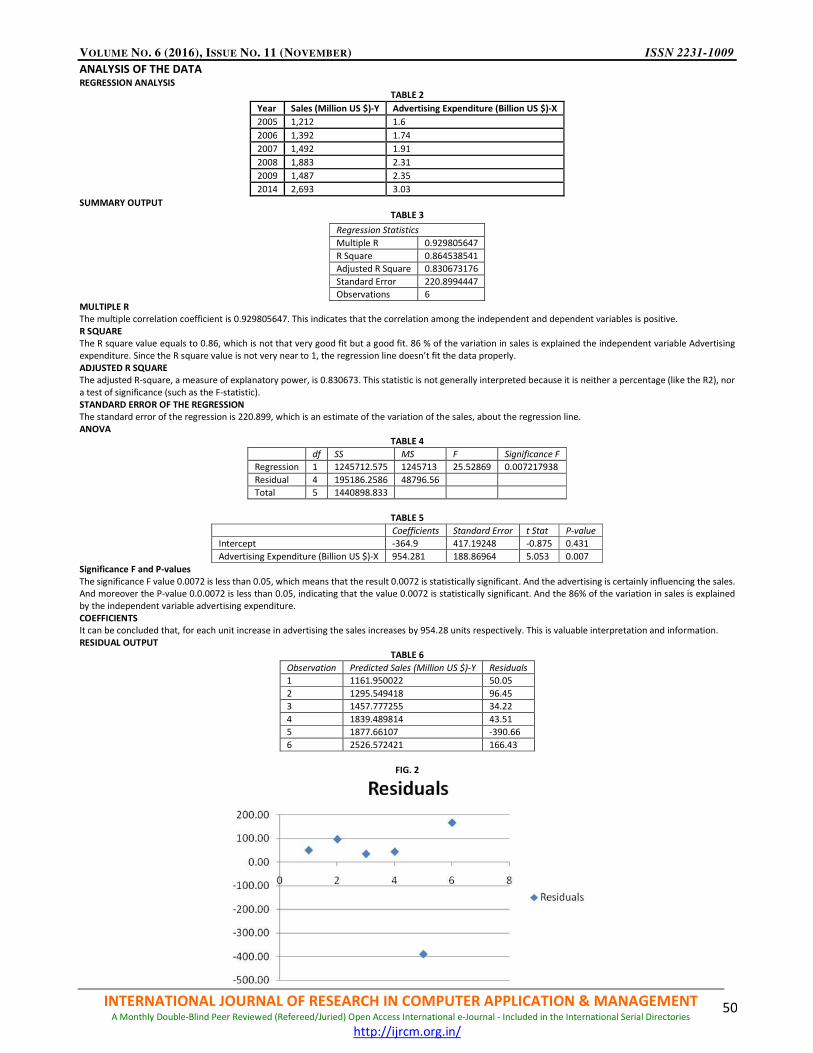
VOLUME NO. 6 (2016), ISSUE NO. 11 (NOVEMBER) ISSN 2231-1009
INTERNATIONAL JOURNAL OF RESEARCH IN COMPUTER APPLICATION & MANAGEMENT A Monthly Double-Blind Peer Reviewed (Refereed/Juried) Open Access International e-Journal - Included in the International Serial Directories
http://ijrcm.org.in/
50
ANALYSIS OF THE DATA REGRESSION ANALYSIS
TABLE 2
Year Sales (Million US $)-Y Advertising Expenditure (Billion US $)-X
2005 1,212 1.6
2006 1,392 1.74
2007 1,492 1.91
2008 1,883 2.31
2009 1,487 2.35
2014 2,693 3.03
SUMMARY OUTPUT
TABLE 3
MULTIPLE R
The multiple correlation coefficient is 0.929805647. This indicates that the correlation among the independent and dependent variables is positive.
R SQUARE
The R square value equals to 0.86, which is not that very good fit but a good fit. 86 % of the variation in sales is explained the independent variable Advertising
expenditure. Since the R square value is not very near to 1, the regression line doesn’t fit the data properly.
ADJUSTED R SQUARE
The adjusted R-square, a measure of explanatory power, is 0.830673. This statistic is not generally interpreted because it is neither a percentage (like the R2), nor
a test of significance (such as the F-statistic).
STANDARD ERROR OF THE REGRESSION
The standard error of the regression is 220.899, which is an estimate of the variation of the sales, about the regression line.
ANOVA
TABLE 4
df SS MS F Significance F
Regression 1 1245712.575 1245713 25.52869 0.007217938
Residual 4 195186.2586 48796.56
Total 5 1440898.833
TABLE 5
Coefficients Standard Error t Stat P-value
Intercept -364.9 417.19248 -0.875 0.431
Advertising Expenditure (Billion US $)-X 954.281 188.86964 5.053 0.007
Significance F and P-values
The significance F value 0.0072 is less than 0.05, which means that the result 0.0072 is statistically significant. And the advertising is certainly influencing the sales.
And moreover the P-value 0.0.0072 is less than 0.05, indicating that the value 0.0072 is statistically significant. And the 86% of the variation in sales is explained
by the independent variable advertising expenditure.
COEFFICIENTS
It can be concluded that, for each unit increase in advertising the sales increases by 954.28 units respectively. This is valuable interpretation and information.
RESIDUAL OUTPUT
TABLE 6
Observation Predicted Sales (Million US $)-Y Residuals
1 1161.950022 50.05
2 1295.549418 96.45
3 1457.777255 34.22
4 1839.489814 43.51
5 1877.66107 -390.66
6 2526.572421 166.43
FIG. 2
Regression Statistics
Multiple R 0.929805647
R Square 0.864538541
Adjusted R Square 0.830673176
Standard Error 220.8994447
Observations 6

VOLUME NO. 6 (2016), ISSUE NO. 11 (NOVEMBER) ISSN 2231-1009
INTERNATIONAL JOURNAL OF RESEARCH IN COMPUTER APPLICATION & MANAGEMENT A Monthly Double-Blind Peer Reviewed (Refereed/Juried) Open Access International e-Journal - Included in the International Serial Directories
http://ijrcm.org.in/
51
RESIDUALS
The residuals show you how far away the actual data points are from the predicted data points (using the equation). For example, the first data point equals
1161.Using the equation, the predicted data point equals 1161, giving a residual of 50.
The scatter plot of residuals is as above.
LIMITATIONS
A large r2 value should not be interpreted as meaning that the estimated regression line fits the data well. Another function might better describe the trend in the
data.
The coefficient of determination r2 and the correlation coefficient r can both be greatly affected by just one data point (or a few data points).
Correlation (or association) does not imply causation.
CONCLUSION The study conclused that advertising industry represents an important business sector with respect to national and international economics. An advertising cam-
paign may satisfy a multitude of objectives for a firm. The commercials may be used to inform consumers about the usage features and benefits specific to a brand
or a given product, or generate favorable attitudes and preferences amongst customers. Due to less product differentiation and intense industry competition,
many marketers heavily involve in advertising and branding tasks. The Nike Inc business which is engaged in the design, development, manufacturing and global
wide marketing and sales of footwear, apparel, equipment, accessories and services is one of the fastest growing companies in the global market. The current
study examined the linear relationship between the advertising expenses and the sales revenues for the Nike Inc business on the secondary data for the six years.
The two main objectives of this study are to i. To analyze the relationship between the advertisement expenditures and the sales revenues on the collected
secondary data of Nike’s Inc. ii. Providing the analysis of the relationship between advertising and sales in the advertising industry during the observed period.
This study controlled for factors expected to affect sales revenues such as population size, price and inflationary effects. Results from the analysis show a positive
and significant relationship between advertising expenditures and sales revenues.
REFERENCES 1. Aromowole, K.A., Ebeloku, A.I. 2000Theory and Practice of Modern Marketing, Sodipe Nigeria Limited, Mushin, Lagos, Nigeria
2. Borden, (2007), “Advertising Management Text and Cases”, Woodend Bookshop, Vic Australia Frank Jefkis: Advertising. Pearson Education Limited, UK.
3. Comanor, W. S. and Wilson, T. S. (1967), “Advertising, Market Structure, and Performance”, Review of Economics and Statistics, Vol. 49, pp. 423-440
4. Gervais, S., R. Kaniel& D.H. Mingelgrin (2001). The high-volumereturn premium. Journal of Finance LVI, 877–919
5. Giles, 1997, Successful Marketing Technique Approach, Mac-donald and Evans Ltd.
6. Nickels W. G. Mchugh, J. M. & McHugh, S. M. (2000). Understanding Business, International Edition, 5th Edition, McGraw Hill Companies, Inc. U.S.A. of
Marketing, (American Marketing Association,
7. Pagan, J.D., and Geor, R.J., (2001) Advances in Equine Nutrition II, Nottingham, Nothingham University Press. Pages 169
8. Vakratsas.i Ambler G. (1999); sales performance management (3rd edition) Prentice hall international Inc
9. Williams F. (1996): Journal of Marketing (American Arens, Contemporary Advertising.USA.
10. Young C. E. (2005). The Advertising Handbook, Ideas in flight, Scattle, W.A., ISBN 0- 9765574-0-1g7
VOLUME NO. 6 (2016), ISSUE NO. 11 (NOVEMBER) ISSN 2231-1009
INTERNATIONAL JOURNAL OF RESEARCH IN COMPUTER APPLICATION & MANAGEMENT A Monthly Double-Blind Peer Reviewed (Refereed/Juried) Open Access International e-Journal - Included in the International Serial Directories
http://ijrcm.org.in/
52
DIGITAL DIVIDE: CONSEQUENCES AND REMEDIAL MEASURES
M MAQBOOL PALA
ASST. PROFESSOR IN COMPUTER APPLICATION
GOVERNMENT DEGREE COLLEGE
ANANTNAG
ABSTRACT “Digital Divide” is a term that has been around for too long now. It is actually a segregation that discriminates between those who have access to the latest
technological tools and those who do not. This divide exists between the developed and underdeveloped countries. But it also exists within different section of
Indian society. This divide in India is even more severe. Various strategies for reducing this divide are explored. Libraries are now operating digitally, and their digital
services open up a new channel to the universe of knowledge and information connecting cultures across geographical and social boundaries. This paper discusses
all about digital divide and possible measures to minimize this discrimination.
KEYWORDS ICT, ISP, digital divide.
INTRODUCTION he digital divide is the gulf that separates individuals, communities and even nations by placing them into two different categories: Those who have access
to ICT (information communication technology) and those who do not. Norris (2001) categories this divide into its three constituent elements: the global
divide between advanced industrialized countries and developing countries, the social divide between information rich and information poor within ad-
vanced industrialized countries, and the democratic divide between those within the online community who do and do not use digital resources to engage, mobilize
and participate in public life. The divide is primarily discussed in terms of access to ICTs, rather than in terms of the information and knowledge which is of value
in the context of the information society and in terms of the social capabilities for such learning.
‘Digital divide’ is one of the greatest impediments to development………..and it is growing exponentially. Several influential and comprehensive studies of the global
digital divide point to a significant positive relationship between levels of economic development and the global digital divide. Economic analyses potray ICT as a
significant factor of growth in the context of modern competitive economies consequently the lack of ICT is an inhibiting factor for economic development.
Relatively less attention has been given to non-economic indicators of digital divide, although they can potentially reveal important facets of the link between ICT
and development.
India, renowned for its pre-eminence in software programming and for producing and providing the world with skilled IT professionals is still rated and ranked
very low in the list of countries with highly networked communities, though poverty can be a reason.
DIGITAL DIVIDE AS A PROBLEM OF ACCESS Among policy makers, the debate surrounding ICTs and the digital divide is typically founded upon a fundamentally technocratic optimism. The technology is
simply taken as a mantra for development. Digital divide seen as an intra-alia for international development and focused on expansion of the technology from the
‘haves’ and ‘have nots’.
So individuals having access to the most powerful computers, the best telephone service and fastest internet services with skill to use these services and the
individuals lacking some or even all these facilities reflect the ‘digital divide’.
DIGITAL DIVIDE AS A DISPARITY OF SKILLS Material access to computers and networks infrastructure has long been dominant framework for international and national policy makers addressing the digital
divide. Yet as the results on the ground proved unsatisfactory, the focus on access has come under increasing scrutiny, particularly in the interaction between
policy makers and other actors, including representatives of the technology industries civil society and most notably the academic research community.
Most of the scholarly debate that emerged around this research focused on identifying the digital divide’s component dimensions. Much of the recent work on
the digital divide has been an increasingly pointed critique of the “access” view of the digital divide and the simple “haves” and “have nots” dichotomy it implies.
An attempt has been made to link the digital divide to the larger forces that perpetuate resource disparities: some see the digital divide as an element of broader
waves of political and economic development (Norris 2001). Many –a-times skill and the social resources that provide it is been overlooked. Access to technology
can be solved by installing necessary equipments but providing a household with an Internet facility does not mean they are adequately prepared to use it, or to
use it in a meaningful enough way to reap its benefits. So, ICT literacy is more important that actually going for it without ability to use it, In 2002 the UN conference
on Trade and Development introduced measures of information literacy as part of their index of ICT development.
Muir and Oppenheim (2002) state that the opportunity for people to participate in economic, political and cultural life depends on their ability to access and use
communication and information services. Individuals need skills and tools to locate the communication pathways, information and audience in timely fashion and
in an appropriate form.
POLICY FOR ADDRESSING THE CHALLENGES IN BRIDGING THE DIGITAL DIVIDE Despite India taking significant steps towards acquiring competence in information and technology, the country is increasingly getting divided between people
who have access to technology and those who do not. India has around half a million software developers and is second to the US, but 300, 000 Indian villages do
not have a phone connection, 70% of Indian population lies below poverty line and 35% illiterate. There are only 5 PCs per 1100 people, 9 mobile lines per 1000
and 37 fixed lines of Internet.
MEASURES FOR ADDRESSING THE DIVIDE There is, however, light at the end of the tunnel. It is possible to close the gap and cross the divide. Some of these initiatives will be successful, some might fail and
yet some may prove counter-productive. One example of successful initiatives is the current infusion of small businesses that are trying to both educate and enable
those on the wrongside of the divide. Internet connectivity and broadband and speeds are an invaluable asset. It is this speed that has changed the markets and
help ICT literate make purchases online (Flipkart, Snapdealetc). technological advancement in manufacturing industry has made the smartphones affordable. Help
on the usage of these devices is also provided.
Grameen phone demonstrates that private businesses can provide necessary services, enable the poor to reduce costs, improve their lives and financial status.
Community computer centre connected to govt. offices through Internet need to be set up.
Another initiative that is a tremendous example of how innovative uses of both new technologies and broadband communications technology are helping the
poor is being promoted by the partnership between Aravind Eye Clinics in India and UC Berkeley. By utilizing new software, building wi-fi network available for
T
VOLUME NO. 6 (2016), ISSUE NO. 11 (NOVEMBER) ISSN 2231-1009
INTERNATIONAL JOURNAL OF RESEARCH IN COMPUTER APPLICATION & MANAGEMENT A Monthly Double-Blind Peer Reviewed (Refereed/Juried) Open Access International e-Journal - Included in the International Serial Directories
http://ijrcm.org.in/
53
free to poor rural communities and installing communication stations that include digital cameras and video conferencing, the Aravind Eye Clinics are able to reach
thousands of customers located in poor rural communities.
However, defining the digital divide in terms of each person’s capacity to use information technology effectively may suggest that responsibility lies in the hands
of individuals and educational institutions, those who could help pursue the necessary “digital literacy”. There is an important reminder that responsibility may
not be a singular assignment among static players: discursive framing may itself change the degree to which different actors are opposed or pair in their efforts.
People of both lower and higher socioeconomic status tended to attribute the responsibility for bridging the digital divide to individuals rather than to government
or other institutions whether it was described in terms of skills or physical access.
The government has done half to bridge the divide by way of introducing schemes like “Kissan Call Centres”, “Life Line India”, “Mygovernance”, “Grievance Cells”
etc, but half remains undone where ICT literacy of the citizen is important as ICT literate alone can reap the benefits of such schemes. The result of educational
institutions here, becomes very important.
ROLE OF LIBRARIES IN BRIDGING THE DIVIDE Most of the libraries are very rich in ICT infrastructure and human resource that can help public, who lack this facility at their homes or at their work place, to
reach public officials for registering their demands.
Library professionals can help working people get more comfortable and skilled with using computers and surfing the net.
Govt. should take up necessary steps for providing proper infrastructure and human resource wherever it is required.
CONCLUSION The understanding and presentation of digital divide deserves scholarly debates as its consequences appear to have not been taken so seriously by our society.
Developed countries, though have migrated from digital divide to ‘digital opportunity’ or ‘digital inclusion’, they are reluctant to share the benefits of ICT diffusion
or dissemination with the developing or underdeveloped countries.
Responsibility of bridging the divide lies not only on the govt. for providing the society with basic and necessary infrastructure but also lies on the individuals for
attaining the required skills.
REFERENCES 1. Brazilai- Nahon, K. 2006. gaps and bits.
2. Chomskey, N.2004. Hegemony or survival.
3. ITU.2005 world summit on information society.
4. Muir, A and C. Oppenheim 2002, journal of information sciences.
5. Norris, P. 2001. Digital divide.
6. Van Dijk, J.A.G.M. 2006.Digital divide research, achievements and short comings.

VOLUME NO. 6 (2016), ISSUE NO. 11 (NOVEMBER) ISSN 2231-1009
INTERNATIONAL JOURNAL OF RESEARCH IN COMPUTER APPLICATION & MANAGEMENT A Monthly Double-Blind Peer Reviewed (Refereed/Juried) Open Access International e-Journal - Included in the International Serial Directories
http://ijrcm.org.in/
54
SCHEDULING BASED NOTIFIED TRACKING BY RAILWAY NETWORK USING MOBILE USER APPLICATION
S. ARUNKUMAR
ASST. PROFESSOR
DEPARTMENT OF COMPUTER APPLICATIONS
ADHIPARASAKTHI ENGINEERING COLLEGE
MELMARUVATHUR
ABSTRACT The scheduling based notified tracking by railway network is software projecting that supports the railway network track system services as per train schedule. The
project is designed with a good GUI that allows monitoring and controlling various trains on the network. It has happened more times that people have been
waiting on railway station for some train to arrive. But don’t have any exact notification about train arrival timing and other stuff. The tracking by railway network
system operates on train schedules and plans appropriate tracks for trains to pass as per their decided route and scheduled time. It has been designed to support
and maintain data for multiple trains on the railway network. The train scheduling time and scheduled routes are maintained in a database by admin every time.
The train passes on a scheduled track the further track cross or joins are managed properly as per the train scheduled route and time. Once the train passes the
track is then configured for the next scheduled train to pass. This system can be used in local stations and junction. This system helps traveler to know about train
delays and timing. Existing system not provide accurate details, but this system will provide accurate details about the train scheduling delay and timing in mobile
application.
KEYWORDS android mobile, android application, scheduling based notified tracking by railway network.
1.0 INTRODUCTION t has happened so many times that you have been waiting on railway station for someone to arrive and you don’t have any exact information about train
timing and other stuff. So here we present to you a project on Railway Tracking and Arrival Time Prediction. Using this system user’s can get the information
about train timing, and is it on time or not, and other information. In this, system will track the train timing at what time train departed from a particular
station and pass these timing details to other station’s system where it will display the timing according to train departed from previous station. If system will find
any delay in train due to signal it will automatically update the train timing in next station and will be displayed to viewers.
In this system there is an admin module, who enters the detail about trains and its timing and these details will be passed through internet server and is fetched
by the system on other stations, and there is other system that shows train information to the viewers on platform. Second system will get all the information of
all trains but will automatically select the data that refers to particular station and shows that information on screen. For example, if an admin at Mumbai station
enter information about Delhi station Chennai station system will not be effected, but Delhi Station system will show the information about train. This system
works like – when train is departed late from a station, admin will enter details about departure and its time, and this information goes in real time on internet
server and retrieved on other system through internet server and shows the details on screen. Station masters on every station have a login where in them may
update train arrival time at their station when it arrives. This second System is installed on various locations on station for viewers to view the information. Admin
will add information like train departed from station, expected arrival at destination, delay in the train schedule, etc. This project publishes real-time train schedule
events to subscribing multiple client applications.
ADVANTAGES 1. This system help commuter to know about train delays and timing.
2. System will provide accurate details about the train.
2.0 RELATED WORK 2.1 EXISTING SYSTEM
The existing railway reservation system has many shortcomings associated with it. In the existing system railway used to set train reservation levels higher than
capacity to Compensate passenger cancellation and no-shows accounting tooverbooking in the agent frequently to do so thus wasting time and money for all.
Inthe existing system integration of different railways on single platforms was not met. With the advent of the online reservation system these flaws can be
overcome.
2.2 DISADVANTAGES OF EXISTING SYSTEM
o High expensive
o Time taken procedures and methods
o No portability
o No user friendly
2.3 PROPOSED SYSTEM
The new onlinereservation system maintains the database centrally giving the clients the information required from anywhere in the world whenever required.
This system requires the use of API through which it interact the data from a central databasemonitors all the data exchanges that are made at the client side to
it and updates itautomatically. Through online reservation system customer is able to book &purchase a ticket thus saving time money for the customer and
railway/agent. As the information is stored centrally the customer never loses his ticket as in the existing system.
2.4 ADVANTAGES OF THE PROPOSED SYSTEM
� Significantly lower expenses.
� Time savings by not having to ship paper or to reenter data into a computer.
� Richer, more complete and more accurate data.
� Remote deployment to travelers; and in many cases.
� The ability to use devices that you already own.
3.0 MODULES • Administrator Module
• Passenger Login Module
• Passenger Registration Module
• Train Search Module
• Ticket Reservation Module
• Train Tracking Module
I

VOLUME NO. 6 (2016), ISSUE NO. 11 (NOVEMBER) ISSN 2231-1009
INTERNATIONAL JOURNAL OF RESEARCH IN COMPUTER APPLICATION & MANAGEMENT A Monthly Double-Blind Peer Reviewed (Refereed/Juried) Open Access International e-Journal - Included in the International Serial Directories
http://ijrcm.org.in/
55
3.1 MODULE DESCRIPTION
3.1.1 Administrator Login
The whole system is controlled by an administrator, administrator login into system by giving his authentication details such as username and password. After
login into the system, he can see the trains currently available to the passengers. The train details are train name, departure, destination, availability, and running
days. And administrator can also add a new train into the databases.
3.1.2 Passenger Login
In this module, the user can login into the system by providing their credential, if auser is new to this application, and don’t have their credential details such as
username and password; he can register as a new member in this system by registering.
3.1.3 Passenger Registration
If any user doesn’t have username and password to login into the system, then he canchoose to register as a new member by choosing register option. He prompt
to givehis personal and contact information such as name, address, phone number, email id, and he can choose his own username and password. If registration is
success then theuser can login into the system, by username and password chosen by him/her.
3.1.4 Train Search
After successfully login into system, passenger can search the available train by their requirements. The requirements may departure, destination, journey date.
Thelist of available trains is shown to the user. Then user may select any train and maketicket reservation. If no train is available, then user may change the journey
date, departure, or destination.
3.1.5 Ticket Reservation Module
If the journey date, destination and departure is match for a train then the passengercan select the particular train, after selecting the particular train, user will
get thetrains details and seat availability in each class, the classes will be AC, Sleeper andseater class. User can select any class, and input the number of seats to
reserve, if the user selected seats not available then he prompts to give only select seat less than orequal to available seats. After selecting no. of seats, user can
make payment, when heready to pay, the details of reservation will be shown to the user such as class, number of seats, total amount. Then the user may confirm
or cancel the payment. Ifhe confirms the payment then only the ticket will be reserved for that passenger, otherwise it will be open to all.
3.1.6 Train Tracking
The passenger has the options to track the Trains in real time. Trains physicallocation will show in the map with the place currently train is travelling. Passengercan
select particular train, and then train details such as previous station, next static, train started date and expected time to reach the next station are shown to the
user. The route covered by the train is shown as a yellow line, and route to be covered willshow as the dotted yellow line. The trains currently running on time will
be shown inblue color, and trains currently running late will be shown in red color.
4.0 SYSTEM DESIGN 4.1 SYSTEM ARCHITECTURE
We strongly believe that the correct combination of latest information and communication technologies can provide an effective and feasible solution for the
requirement of a reliable and accurate train tracking system to improve the efficiency and productivity of India Railways. The solution we propose encompasses a
powerful combination of mobile computing, Global System for Mobile Communication (WIRELESS),
Global Positioning System (GPS), Geographical Information System (GIS) technologies and software to provide an intelligent train tracking and management system
to improve the existing railway transport service. All these technologies are seamlessly integrated to build a robust, scalable architecture.
5.0 PROJECT DESCRIPTION Passengers can track for the train in which trains are available. For this, passenger has to provide the desired train number and the date for which ticket is to be
booked. Before booking a ticket for a passenger, the validity of train number and date is checked.
Once the train number date is validated, it is checked whether the train is available. If yes, the ticket is booked with confirm status and Corresponding ticket ID is
generated which is stored along with other details of the passenger. If waiting lot is also finished, and a message of non-availability of time is displayed. The train
can be cancelled at any time. For this, the passenger has to provide the train ID (the unique key). The train is searched and the corresponding record is deleted.
6.0 CONCLUSION After seeing many advancements and changes in the location tracking technology, Indian Railways now has the ability to pin point the location and other attributes
of an operational train in an economical accurate manner. Thus it is visible that to keep up with the today’s demand for information and to comply with the citizen
centric governance, technological advancements is essential for a 3rd world country, as after all the deciding factors of a country’s success would be on the how
collaborative and duplex the governance framework in terms of seamless information flow of accurate and timely information between governance ecosystem.
REFERENCES 1. Hartman, G.A., “Infrared Damage Detection System (IDDS) for realtime, small-scale damage monitoring, Charlotte, North Carolina (2003).
2. K. Vijayakumar, S.R. Wylie, J. D. Cullen, C.C. Wright, and A.I. AIShamma’a, “Non invasive rail track detection system usingMicrowave sensor”, Journal of App.
Phy., 2009.
3. M. Cacciola, G. Megali, D. Pellicanμo, S. Calcagno, M. Versaci, and F.C. Morabito, “Rotating Electromagnetic Field for Crack Detection in Railway Tracks",
PIERS ONLINE, Vol. 6, NO. 3, 2010.
4. Qiao Jian-hua, Li Lin-sheng and Zhang Jinggang, “Design of RailSurface Crack-detecting System Based on Linear CCD Sensor”, IEEEInt. Conf. on Networking,
Sensing and Control, 2008.
5. Richard J. Greene, John R. Yates and Eann A. Patterson, "Crackdetection in rail using infrared methods", Opt. Eng. 46, 051013, May2007.
6. Rohan Samarajiva, May 2009, Ideas to win the war: Sri Lanka's main line railway, http://www.lankabusinessonline.com/print.php?nid=1238565096
7. Sri Lanka Railway Department 2007, n.d., FuturePlans,http://www.railway.gov.lk/future_plan.
8. Wojnarowski, RobertJohn Welles, Kenneth Brakeley Kornrumpf, and William Paul, "Electromagnetic system for railroad track detection and traction enhance-
ment".

VOLUME NO. 6 (2016), ISSUE NO. 11 (NOVEMBER) ISSN 2231-1009
INTERNATIONAL JOURNAL OF RESEARCH IN COMPUTER APPLICATION & MANAGEMENT A Monthly Double-Blind Peer Reviewed (Refereed/Juried) Open Access International e-Journal - Included in the International Serial Directories
http://ijrcm.org.in/
56
THE IMPACT OF EMPLOYEE EMPOWERMENT ON JOB SATISFACTION: A COMPARATIVE STUDY BETWEEN
PUBLIC AND PRIVATE SECTOR FIRMS IN KERALA
BINDU R
ASST. PROFESSOR
MARTHOMA COLLEGE FOR WOMEN
PERUMBAVOOR
ABSTRACT The principal aim of this paper is to explore the impact of Employee Empowerment on Job Satisfaction in ISO Certified Large-Scale manufacturing firms both public
and private sectors in Kerala and its sector-wise comparison. Data for this study was collected using a Pre-tested questionnaire that was distributed to 60 ISO
certified Large-Scale manufacturing firms (24 from public sector and 36 from private sector) in Kerala selected by purposive sampling method under non-random
sampling technique from the database of Kerala State Industrial Development Council, Trivandrum. Two Top level managers (GM/MD/CEO’s, DGM etc.) from each
firm were the respondent of the survey. 120 top level managers are selected for the study from both sectors (48 from public sector and 72 from private sector).
Correlation analysis was used to analyze the collected data with the help of SPSS Software. The study reveals that there is a positive impact of Employee Empow-
erment on Job satisfaction in manufacturing firms in Kerala and impact of Employee Empowerment on Job satisfaction in private sector higher than public sector.
In addition, study also reveals that there is no positive impact of Employee Empowerment on Job Satisfaction in public sector manufacturing firms in Kerala. Data
collected for assessing Employee Empowerment and Job satisfaction was from the top level managers of the firm, not from employees directly. The study reflects,
only the perceptions of top level managers regarding the Employee Empowerment and Job satisfaction in manufacturing firms in Kerala. So this secondary nature
data may lead to the biased results. This paper presents new data and empirical insights into the relationship between Employee Empowerment and Job satisfaction
in ISO certified Large-Scale manufacturing firm in Kerala and its differences in Public and Private sectors.
KEYWORDS employee empowerment, job satisfaction, ISO certification.
INTRODUCTION mployee empowerment i s a management practice of sharing information, rewards, and power with employees so that they can take initiative and make
decisions to solve problems and improve service and performance. Empowerment is based on the idea that giving employees skills, resources, authority,
opportunity, motivation, as well holding them responsible and accountable for outcomes of their actions, will contribute to their competence and satisfac-
tion.
This empirical research paper discusses the impact of empowerment among the employees on their job satisfaction in manufacturing sector industries in Kerala
both public and private sector and its sector wise differences
THEORETICAL FRAMEWORK AND LITERATURE REVIEW EMPLOYEE EMPOWERMENT
Empowerment means encouraging the people to make decisions with least intervention from higher management (Handy, 1993). Employee empowerment is
defined as giving the power to employees to make decisions. It is a form of freedom in which employee takes decisions to ensure maximum satisfaction to cus-
tomers. Empowerment is the initial, fundamental and an extraordinary aspect for achievement of success and growth for any business and enhances the produc-
tivity. Employees and customer satisfaction is, therefore, effected by empowerment using it as a tool through which businesses goals could be obtained. Employees
are the assets of an organization and can make or break the organization. Highly motivated employees give the unexpected output while employees with low
motivation level can drag the company growth downwards (Deal, 2005). Lawler & Mohram (1989) defined the employee involvement as it a proper procedure to
compete the capability of worker for enhancing their commitment and achievement of growth and success of organization.
Employee empowerment is a strategy and philosophy that enables employees to make decisions about their jobs. Employee empowerment helps employees own
their work and take responsibility for their results. Employee empowerment helps employees serve customers at the level of the organization where the customer
interface exists. These are the ten most important principles for managing people in a way that reinforces employee empowerment, accomplishment, and contri-
bution.
1. Demonstrate That Value People
2. Share Leadership Vision
3. Share Goals and Direction
4. Trust People
5. Provide Information for Decision Making
6. Delegate Authority and Impact Opportunities, Not Just More Work
7. Provide Frequent Feedback
8. Solve Problems: Don't Pinpoint Problem People
9. Listen to Learn and Ask Questions to Provide Guidance
10. Help Employees Feel Rewarded and Recognized for Empowered Behavior
GENERAL ADVANTAGES OF EMPOWERMENT AND INVOLVEMENT � Increased job satisfaction
� Effective Team work
� Increased employee participation
� Reduces Turnover rates.
� Increases trust in the organization
� Lower absenteeism degree
� Better productivity and profitability
� Less conflict as employees will more likely agree with changes if they can get involved in the decision making process
JOB SATISFACTION Job satisfaction is an area that has been well researched in the industrial and organizational psychology literature. However, it is a concept that is still surrounded
by controversy because much of the literature is inconclusive in nature Morgan et.al, (1995).
E

VOLUME NO. 6 (2016), ISSUE NO. 11 (NOVEMBER) ISSN 2231-1009
INTERNATIONAL JOURNAL OF RESEARCH IN COMPUTER APPLICATION & MANAGEMENT A Monthly Double-Blind Peer Reviewed (Refereed/Juried) Open Access International e-Journal - Included in the International Serial Directories
http://ijrcm.org.in/
57
Defining job satisfaction is problematic since it has been considered in a variety of ways, and defined differently in various studies (Lam, Zhang and Baum, 2000).
They further argue that if there is consensus about job satisfaction, it is the verbal expression of an incumbent’s evaluation of his/her job. The popular definition
that has been made reference to in the literature is that advanced by Locke, (1976). He defined the concept of job satisfaction as a pleasurable or positive emotional
state resulting from the appraisal of one’s job or job experiences. Locke further argues that the satisfaction is achieved when one realizes one’s important job
values provided these are congruent with or help to fulfill one’s basic needs. The values or conditions conducive to job satisfaction are:
� Mentally challenging work which the individual can cope successfully
� Personal interest in the work itself
� Work that is not too physically tiring
� Rewards for performance that are just, informative and in line with the individual’s personal aspirations
� Working conditions that are compatible with the individual’s physical needs and that facilitate the accomplishment of his work
� High self esteem on the part of the employee
� Agents in the work place who help the employee to attain job values such as interesting work, pay and promotions, whose basic values are similar to his
own, and who minimize role conflict and ambiguity.
Employee job satisfaction is the terminology used to describe whether employees are happy and contented and fulfilling their desires and needs at work. Many
measures purport that employee satisfaction is a factor in employee motivation, employee goal achievement, and positive employee morale in the workplace.
“employee satisfaction is defined as "the extent to which people like (satisfaction) or dislike (dissatisfaction) their jobs"
Wexley and Yukl (1997) say that job satisfaction is “the way an employee feels about his or her job". Gupta (1991) say that employee loyalty has a strong tendency
towards job satisfaction, suggesting that when an employee is more loyal to the organization, he will feel satisfied with the organization.
FORMULATION OF THE PROBLEM AND RESEARCH QUESTIONS Some researchers found that a positive relationship between empowerment and job satisfaction. For example, Rinehart and Short (1994) found a strong and
positive relationship between empowerment and job satisfaction. Dennis (1999) also found a strong relationship between the variables of employee involvement
and job satisfaction in his search for factors influencing job satisfaction in the prison environment.
Some interesting positive links between employee involvement and job satisfaction have been found in the nursing field. For example, Kanter (1993) in her studies
argued that in nursing, empowerment has been shown to predict important organizational outcomes, such as trust in management, perceived control over nursing,
organizational commitment and job satisfaction. Nykodym, et al.1994) assert that participation causes greater job satisfaction because the employee feels more
valued and trusted by management and because the worker gains a better understanding of management difficulties by dealing with some of the same problems.
So, the researcher wants to explore the impact of Employee Empowerment on job satisfaction in ISO certified Large-Scale manufacturing firms both public and
private sectors in Kerala and its sector-wise comparison
This study seeks to provide answers to the following two research questions
1. What is the impact of Employee Empowerment on Job Satisfaction in manufacturing firms both public and private sectors in Kerala?
2. Is there any difference in the impact of Employee Empowerment on Job Satisfaction in public and private sector manufacturing firms in Kerala?
OBJECTIVES OF THE STUDY 1. To explore the impact of Employee Empowerment on Job Satisfaction in manufacturing firms both public and private sectors in Kerala
2. To compare the impact of Employee Empowerment on Job Satisfaction in public and private sector manufacturing firms in Kerala
SIGNIFICANCE OF THE STUDY The existing literature has clearly shown that no large-scale empirical research has been systematically conducted to explore the impact of Employee Empower-
ment on Job Satisfaction in manufacturing firms both private and public sector undertakings in Kerala. In order to bridge this research gap, a study related with
Employee Empowerment and Job Satisfaction in manufacturing firms both private and a public sector undertaking in Kerala is truly needed. This study compares
the impact of Employee Empowerment on Job Satisfaction in the public and private sector manufacturing firms in Kerala.
On the basis of these analyses, Top level managers of the manufacturing firm in Kerala can understand that how Employee Empowerment efforts helps to achieve
employee job satisfaction in their firm.
SCOPE OF THE STUDY The study was conducted among the ISO Certified large-scale manufacturing firms both public and private sectors in Kerala, irrespective of nature of product
produced.
METHODOLOGY SECONDARY DATA
The secondary data is collected from review of existing literatures and published sources such as information of enterprises, journals, articles, PhD thesis, websites
etc.
PRIMARY DATA
Primary data collected for this study from the Top level managers of ISO certified, Large Scale manufacturing organizations in Kerala with the help of a pre-tested
questionnaire.
RESEARCH STRATEGIES
The study carried out with descriptive type of research. The survey conducted among the ISO certified Large-Scale manufacturing firms both public and private
sectors in Kerala. Likert scale was adopted to measure the questions of Employee empowerment and eamemployee satisfaction. The questionnaire has been
designed on 5-point scale (Strongly Agree to Strongly Disagree). Purposive sampling method under non-random sampling techniques was adopted to select the
organizations for the study both public and private sector undertaking. 60 organizations are selected as sample firms which contain 24 from public sector and 36
from private sector. 2 Top level managers (GM/MD/CEO’s, DGM etc.) from each firm were the respondent of the survey. 120 top level managers are selected for
the study from both sectors (48 from public sector and 72 from private sector).
TOOL USED FOR DATA ANALYSIS
To exploring the impact of Employee Empowerment and Job Satisfaction in both public and private sector manufacturing firms in Kerala and it’s sector-wise
comparison, the statistical tool, correlation co-efficient was used.
LIMITATION OF THE STUDY
Data collected for assessing Employee Empowerment and Job Satisfaction was from the top level managers of the firm, not from employees directly. The study
reflects, only the perceptions of top level managers regarding the Employee Empowerment and Job Satisfaction in manufacturing firms in Kerala. So this secondary
nature data may lead to the biased results.

VOLUME NO. 6 (2016), ISSUE NO. 11 (NOVEMBER) ISSN 2231-1009
INTERNATIONAL JOURNAL OF RESEARCH IN COMPUTER APPLICATION & MANAGEMENT A Monthly Double-Blind Peer Reviewed (Refereed/Juried) Open Access International e-Journal - Included in the International Serial Directories
http://ijrcm.org.in/
58
ANALYSIS OF THE DATA IMPACT OF EMPLOYEE EMPOWERMENT ON EMPLOYEE SATISFACTION
The following hypothesis was made to assessing the impact of Employee Empowerment on Job satisfaction.
H0.1: There is no positive impact of Employee Empowerment on Job Satisfaction in manufacturing firms both public and private sectors in Kerala
H1.1: There is a positive impact of Employee Empowerment on Job Satisfaction in manufacturing firms both public and private sectors in Kerala
TABLE 1
Independent factor Dependent factor Correlation P Value
Employee Empowerment Job Satisfaction 0.520 <0.001
From the above table, the correlation between Employee Empowerment and Job satisfaction is 0.520 and is significant at 1% level. So it can be concluded that
there is a positive impact of Employee Empowerment on Job satisfaction in manufacturing firms both public and private sectors in Kerala
SECTOR-WISE COMPARISON
H0.2: Impacts of Employee Empowerment on Job satisfaction in public sector manufacturing firms are not higher than private sector
H1.2: Impacts of Employee Empowerment on Job satisfaction in public sector manufacturing firms are higher than private sector
TABLE 2
Attribute Sector Correlation P. Value
Impact of Employee Empowerment on Job satisfaction Public 0.337 0.001
Private 0.538 0.001
The above table indicates that the impact of Employee Empowerment in the Public sector manufacturing firm is 0.337 at 1% significant level is less than the private
sector which is 0.538 at 1% significant level. So it can be concluded that impact of Employee Empowerment on Job satisfaction in public sector manufacturing
firms in Kerala not higher than private sector.
From this analysis, it is clear that there is no positive impact of Employee Empowerment on employee satisfaction in public sector manufacturing firms in Kerala
FINDINGS, SUGGESTIONS AND CONCLUSION FINDINGS
1. Employee Empowerment has a positive impact on Job Satisfaction in manufacturing firms both public and private sectors in Kerala
2. Impact of Employee Empowerment on Job Satisfaction in private sector higher than public sector manufacturing firms in Kerala
3. There is no positive impact of Employee Empowerment on Job satisfaction in public sector manufacturing firms in Kerala
SUGGESTIONS
The study reveals that there is no positive impact of Employee Empowerment on employee Job satisfaction in public sector manufacturing firms in Kerala. Whereas,
there is a positive impact of Employee Empowerment on employee Job satisfaction in private sector manufacturing firms in Kerala. So the public sectors firms
must empower their employees to achieve the synergic organizational functioning and higher employee satisfaction
CONCLUSION
This paper discussed the role of Employee Empowerment on Job satisfaction in manufacturing industries in Kerala both public and private sector and its sector
wise differences. The study reveals that there is a positive impact of Employee Empowerment on Job satisfaction in manufacturing firms in Kerala and impact of
Employee Empowerment on Job satisfaction in private sector higher than public sector. In addition, study also reveals that there is no positive impact of Employee
Empowerment on Job Satisfaction in public sector manufacturing firms in Kerala
REFERENCES 1. Deal, J. (2005). Employees: Greatest asset or greatest expense. Retrieved on March 15, 2005
2. Elnaga, et al., (2014), American Journal of Research Communication, Vol 2(1), pp 17
3. Gupta Nina, Jenkins Douglas, Jr, (1991), Rethinking Dysfunctional Employee Behaviors: Journal of Human Resource Hayes, N. (2005), Psychologie, Prague,
Portál,
4. Handy, M. (1993). Freeing the victims Total Quality Management, 11 Davidson, I. (2004). Employees: Business asset or legal liability? Internet Works, Autumn
2004, Vol 86.
5. Lam, T, Zhang, H and Baum, T (2001) “An investigation of employees’ job satisfaction: the case of hotels in Hong Kong” Tourism Management, Vol. 22, pp
157- 165
6. Lawler, E. and Mohrman, S.A. (1989). With help, all managers can practice high involvement management. Personnel, 66, 26-31.
7. Locke, E.A. (1976), The nature and causes of job satisfaction, in Dunnette, M.D. (ed), Handbook of industrial and organisational psychology, pp. 1297-1349.
Randy McNally, Chicago.
8. Morgan, R., McDonagh, P and Morgan, T.R. (1995) “Employee job Satisfaction: an empirical assessment of marketing managers as an occupationally homo-
geneous group” Journal of Managerial Psychology, Vol. 10, N0. 2, pp 10-17
9. Syed Waqar Akbar (2011), Impact of Employee Empowerment on Job Satisfaction: An Empirical Analysis of Pakistani Service Industry, interdisciplinary journal
of contemporary research in business, Vol -II, No. 11, pp.27-28
10. Wexley, Kenneth N, and Gary A Yukl (1997), Perilaku Organisasi dan Psikologi Personalia. Terjemahan. Jakarta: Bina Aksara.
11. Zuvarashe Judith Mushipe (2011), Employee Empowerment and Job Satisfaction: A Study of the Employees in the Food Manufacturing Sector in Zimbabwe,
interdisciplinary journal of contemporary research in business, Vol -III, No. 8, pp.24-25
WEBSITES
12. http://humanresources.about.com/od/employeeempowerment/
13. http://www.businessdictionary.com/definition/empowerment.html#ixzz37MWmsA2L
14. http://www.dealconsulting.com/personnel/employee.html
VOLUME NO. 6 (2016), ISSUE NO. 11 (NOVEMBER) ISSN 2231-1009
INTERNATIONAL JOURNAL OF RESEARCH IN COMPUTER APPLICATION & MANAGEMENT A Monthly Double-Blind Peer Reviewed (Refereed/Juried) Open Access International e-Journal - Included in the International Serial Directories
http://ijrcm.org.in/
59
ANALYSIS AND GROWTH OF SIKKIM HANDLOOM AND HANDICRAFTS INDUSTRY
TENZING DORJEE BHUTIA
LECTURER
ICFAI UNIVERSITY
GANGTOK
RISHI THAPA
LECTURER
ICFAI UNIVERSITY
GANGTOK
ABSTRACT This study analyses the growth of Sikkim Directorate Handicrafts and handloom industry during the past years. Sikkim handicrafts and handloom as on date is a
hub of activity, development and progress showcasing the traditional arts and crafts of Sikkim. The growth and expansions of handicrafts and handloom industry
in terms of physical assets, infrastructure and manpower has been impressive, having on date as many as 32 branch training centers throughout the state with a
total number of 650 trainees, 13 production units with approximately 70-250 paid workers and 260 personnel including officer and support staff. There are different
kinds of handicrafts and handloom products made in Sikkim and the growth of this handicraft and handloom industry is moving in a positive direction. For the
overall growth of handloom and handicrafts, Directorate of Handicrafts and handloom (D.H.H) has been continuously working for the development of majority of
the weavers belonging to the smallholders group living in isolated rural areas. It provides appropriate access to markets for their products and also imparts infor-
mation about the recent preferences and demands of the customers. Lastly, the study explores the program implemented by the D.H.H. for the Development of
handicrafts and handloom industry both in Sikkim and India.
KEYWORDS Sikkim, handloom industry, handicrafts industry.
INTRODUCTION ikkim Handicrafts represents beauty, dignity, form and style. The directorate of handicrafts and handloom (D.H.H) began its history in the year 1975 when
it was established as the Palden Thendup Cottage Industries Institute for Training and Production of traditional arts and crafts with 58 numbers of trainees
all over the Sikkim. From the early period itself when Sikkim itself was a Country handloom and handicrafts industry has been playing a significant role in
its economy in providing employment and income belonging to the weaker section of the society of the rural and semi urban areas. In the year 1975 when Sikkim
became a part of India, handloom and handicraft still continues to contribute in generating income and employment to the rural and semi urban areas population
till date. The Directorate of Handicrafts and Handloom (D.H.H.) primary objective is not only to preserve and showcase the traditional arts and crafts of Sikkim but
to promote and disseminate information regarding the policy orientation of the government in setting the highest standard comparable to the best in the world
for arts and crafts, skill development and environment friendly working culture. As a policy initiative there has been tremendous investment in Skill Development
Porgramme by the state government in assistance with central government whereby local trainees and artisans are trained in different crafts with the objective
of developing and acquiring skills which will enable them not only to generate employment but in the long run to acquire self sufficiency and self reliance.
To analyze the growth D.H.H of Sikkim, it had started with only 58 trainees in the year 1957 but the figures has risen to 680 trainees registered in Directorate of
Handicrafts and Handloom in the four districts of Sikkim. In the last decades the growth of Directorate of Handicrafts and Handloom is Sikkim has evolved into
major centre of learning and training of traditional arts and crafts and as on date there are 32 branch training centers throughout the state imparting training to
rural youth in different eleven specific crafts. The government in order to encourage the local trainees to take training seriously it had stipend the trainees from
Rs 700/-and Rs 900/- respectively to Rs 1500/-for the 1st year trainees and Rs 2000/- for the 2nd year trainees according to the government vides Notifications No:
580/C&I/2012 dated 06/08/2012. According to our survey conducted we found out that for the growth of Sikkim handloom and handicrafts industry the D.H.H.
works in cooperation with the NGO’s Self Help Groups, Cooperative and Panchayati Raj Institutions at the Village and Block Level integrating and creating an
environment of collaboration and participation through facilitation, incentives and other policy related interventions. The development and management strate-
gies are being worked to optimize the strength of this sector and to add value for creating new skills, ending unemployment, eliminating poverty, enhancing the
status of women, preserving and encouraging tribal and local crafts and setting the pace for developing a judicious and transparent socio-economic system. To
provide the marketing platform for the sale of the products made by the trainees and artisans the Sikkim Handloom and Handicrafts ltd. was established in the
year 2003 vide Registration No. 29(C) LD/2001/200 dated 18/10/2001 incorporated under registration of Companies Act Sikkim 1961 dated:16.10.2001. Promotion,
Publicity and marketing of Sikkim as a Handicrafts and Handloom destination is being taken up aggressively and in a well phased manner at the local National &
International level. Thus the present study will focus on the growth and impact of Directorate of Handicrafts and Handloom (D.H.H.)
OBJECTIVES OF THE STUDY 1. To study the growth of Sikkim Handicrafts and handloom industry.
2. To study the various types of program implemented by the Directorate of Handicrafts and Handloom (D.H.H.), Sikkim.
SOURCE OF DATA The data for this article has been collected form primary sources and secondary sources. Primary sources include meeting the official of the Sikkim handicraft and
handloom industry at the concern offices and secondary sources includes Sikkim handicraft and handloom reports, research reports, reference article and elec-
tronic sources.
DISCUSSION PROGRAM IMPLEMENTED BY THE DIRECTORATE OF SIKKIM FOR THE GROWTH OF HANDLOOM AND HANDICRAFTS INDUSTRY
1. INTEGRATED HANDLOOMS DEVELOPMENT SCHEME (IHDS)
During the year 2007-2008 the central government of India introduces centrally sponsored scheme called Integrated Handloom Development Scheme (IHDS) for
the development of handloom and handicraft industry for North Eastern region. Sikkim being one of the North Eastern regions which has been continuously
developing in the field of handloom and handicraft industry has also successfully implemented this program. The Core objective of this program was to uplift the
development of lower community leaving in the rural area. The program was successful in reaching the lower community specially the women community who
were the major beneficiary of this program who are now capable of multitasking and are contributing to the family source of income. IHDS has four components
under its scheme – (i) The Cluster Development Program main objectives was to provide financial assistance for meeting expenditure on formation of Self Help
S

VOLUME NO. 6 (2016), ISSUE NO. 11 (NOVEMBER) ISSN 2231-1009
INTERNATIONAL JOURNAL OF RESEARCH IN COMPUTER APPLICATION & MANAGEMENT A Monthly Double-Blind Peer Reviewed (Refereed/Juried) Open Access International e-Journal - Included in the International Serial Directories
http://ijrcm.org.in/
60
groups, setting up yarn depots, design development, setting up common facility center dye houses, margin money for working capital, new looms and accessories
and construction of works sheds, skill up gradation and marketing opportunities. (ii) The Group Approach was formulated and implemented to supports those
handloom wavers who were not covered by the cluster development program in groups of 10 or more and up to 100 weavers, by providing financial assistance
for basic inputs; training in weaving, dyeing, designing and managerial disciplines; and construction of work sheds. Per beneficiary cost is in the range of ` 10,000
to ` 30,000. (iii) Marketing Incentive was provided to handloom corporation, Apex organizations and primary weaver cooperative societies, at the rate of 10%
(shared 50:50 between the central and the state governments) for promoting marketing of handloom products, largely through promotion of investments in
infrastructure. The program of marketing incentive motivated the different organizations to work collectively and effectively in marketing the handloom and
handicraft productively. (iv) lastly up to 10% of funds under the scheme was for innovative ideas, and up to 2% allocated for publicity, monitoring, supervision,
and training of officials of the development commissioner for handlooms and state directors of handlooms and state directors of handlooms as well as for evalu-
ation of the scheme
2. MARKETING AND EXPORT PROMOTION SCHEME
The Marketing and Export Promotion Scheme, aimed at developing and promoting marketing channel in domestic as well as export markets. The department has
been providing assistance to the local entrepreneur who is engage in selling and marketing of handloom and handicraft goods. The assistance the department
provides under this scheme are Marketing Promotion Program assisting the sale of handloom products by organizing exhibitions at national, regional, state and
district levels, providing facilities to consumers to purchase genuine handloom products under one umbrella scheme, promoting awareness about latest designs
and varieties of handloom and handicraft products, providing marketing infrastructural support, encouraging innovation in designs, fostering brand identity and
technological developments among weavers. The department has also been helping in organizing special expos, craft Melas, Urban Haats, giving national awards
and national Merit Certificates, registration of special designs and techniques under the Geographical Indication Act, and establishing brand image for handloom
products through the handloom Mark.
3. BORDER AREA DEVELOPMENT PROGRAM 2012-13
According to survey conducted and discussion with the official of the Sikkim Directorate of Handicrafts & Handloom it was found that in the rural and semi –rural
areas there exist quite a large number of school dropouts among the youth. The department objective is to take all the school dropouts and provides necessary
training modules and courses in consultation with the various Central & State agencies involved in the promotion of handloom and handicrafts of the state. The
objectives are to train the local semi skilled weavers and artisan and also to educated energetic youth force and channelize them into a productive socio-economic
identity which already exist in the state which on the long run will provide a base for further development of the remote border region of the state. The Project
aims to reduce the migration of the youth from the far flung border areas by providing capacity building and skill development training in various crafts so that
they are able to generate their own source of income.
4. MARKETING SUPPORT AND SERVICES SCHEME (MSS)
The objective of the MSS scheme is to enhance the access of artisans to various markets and marketing channels, and also create awareness about handicrafts
amongst consumers and public at large, both in domestic and international markets, along with creation of marketing infrastructure. The Scheme has three broad
components. (i) Domestic marketing through Crafts bazaars, exhibitions, sourcing shows, setting up Urban Haats, Emporia, and warehousing facilities; and organ-
izing Workshops, (ii) International marketing including workshops and training program, craft exchange program, participation in fairs and exhibitions, road shows,
reverse buyer-seller meets and market studies abroad, and (iii) Publicity and marketing
5. SETTING UP MORE NUMBER OF OUTLETS INSIDE SIKKIM AND OUTSIDE SIKKIM
For the growth of handicrafts and handloom industries a new program Under the National Bamboo Mission has been setup. Two Sales emporiums have been set
up at Namchi, South Sikkim and at New Sikkim House, New Delhi. The concept of a value added MICE Agenda– meetings, incentives, convention and exhibition
are also included in the programmed under the National Bamboo Mission, D.L.E’s, National Handloom Expo’s and Gandhi Shilpa Bazars.
6. COMMUNITY MOBILIZATION
For the growth of handloom and handicraft industry in Sikkim there was a need for bringing togetherness among the community in the society. Directorate of
handloom and handicrafts realized the working together in cooperation with NGO’s, Self Help Groups, Cooperative and Panchayati Raj Institutions at the village
and block level integrating and creating an environment of collaboration and participation through facilitation, incentives and other policy related interventions.
The government has set up one computer aided design centre in the Directorate of Handloom and Handicraft with assistance from the Information Technology
Department, Government of Sikkim and C-DAC, Kolkata and similar I.T based economy activity training centre at Namchi South Sikkim. The idea behind setting up
these two centers was to upgrade the skill of local weavers/artisans to professional weavers/artisans and empower them to create and develop innovative Infor-
mation technology based designs which would contribute value to the traditional products making it globally competitive and acceptable.
7. MARKETING SUPPORT AND SERVICES SCHEME (MSS)
In order to access better market for the selling of handicrafts and handloom products, Marketing Support and Service scheme (MSS) has been providing access to
various markets and marketing channels, and also creating awareness about handicrafts amongst consumer and public at large, both in domestic and international
marketing, along with creation of marketing infrastructure for the local entrepreneur. The Scheme has three broad components. (i) Domestic marketing through
Crafts bazaars, exhibitions, sourcing shows, setting up Urban Haats, Emporia, and warehousing facilities; and organizing Workshops, (ii) International marketing
including workshops and training program, craft exchange program, participation in fairs and exhibitions, road shows, reverse buyer-seller meets and market
studies abroad, and (iii) Publicity and marketing
8. SETTING UP MORE NUMBER OF OUTLETS INSIDE SIKKIM AND OUTSIDE SIKKIM
With the continuous growth in Handloom and Handicrafts industry, the government of Sikkim has been setting up more number of outlets within Sikkim and
outside Sikkim to cater the needs of the customer in the market. A new program under the National Bamboo Mission has been setup. Two sales emporiums have
been setup at Namchi, South Sikkim and at New Sikkim House, New Delhi. The concept of a value added MICE Agenda-meetings, incentives, convention and
exhibition are also included in the programmed under the National Bamboo Mission. D.LE’s, National Handloom Expo’s and Gandhi Shilpa Bazaars are some of the
other program formulated and implemented for the sale of handloom and handicrafts products.
The table below represents the annual sales growth of the Sikkim Handloom and Handicraft industry for the past ten year. It can be seen that during some years
there was growth in the sales figure but in some years there has been declined in the sales figure too. The analysis for the growth and fall in the sales figure has
been discussed below.
ANNUAL SALES REPORT WITHIN THE STATE AND OUTSIDE STATE IN THE YEAR 2007-2016
TABLE 1
YEAR Total sales (in lakh) Growth (%)
2007-2008 Rs.96,11,126 (-)
2008-2009 Rs.93,69,775 (-2.51)
2009-2010 Rs.1,23,17,967 (31.46)
2010-2011 Rs.98,02,725 (-25.65)
2011-2012 Rs.87,91,213 (-10.31)
2012-2013 Rs.1,06,74,962 (21.42)
2013-2014 Rs.1,44,42,286 (35.29)
2014-2015 Rs.1,32,00,000 (-8.6)
2015-2016 Rs.1,30,78,117 (-0.92)
Source- Government of Sikkim DHH

VOLUME NO. 6 (2016), ISSUE NO. 11 (NOVEMBER) ISSN 2231-1009
INTERNATIONAL JOURNAL OF RESEARCH IN COMPUTER APPLICATION & MANAGEMENT A Monthly Double-Blind Peer Reviewed (Refereed/Juried) Open Access International e-Journal - Included in the International Serial Directories
http://ijrcm.org.in/
61
FIG. 1: GRAPHICAL REPRESENTATION OF THE PERCENTAGE (%) CHANGE IN SALES (lakh)
RESULT AND DISCUSSION Table l indicates proportionate increase and decrease in the sale of the handloom and handicraft products between the years 2007-2016. As observed in Table 1
the individual yearly sales, it is found that during the year 2008-2009 the sale figure has slightly declined compared to the previous year sales figure of 2007-
2008.The reason for the decline in the sales figure may be due to the lack of proper programs and scheme not being implemented by the state due to which the
artisan was not able to produce quality products in the market according to the needs and demand of the customer. The other reason being less number of inflow
of the tourists to Sikkim during that year. The year 2009-2010 witnessed a drastic growth in the sale from (-2.51%) to (31.46%) and the reason for such huge sales
was the result of implementation of the 2007-2008 centrally sponsored program in coordination with the concerned state department. In addition, there had been
a remarkable increase in the inflow of tourist to Sikkim as mentioned in table 2. In continuation to the analysis of the growth in the sales figure of table 1, we can
see that from the year 2010-2012 there has been a decline in the sales figure and the reason being due to a major earthquake of 6.6 magnitude Richter scale that
hit the Sikkim Himalayan region during 2011 which had caused major drawback to Sikkim tourism industry and its impact can be seen for the year to come as
observed in table 2 as given below. Further analysis shows that after 2012 again the growth in the sales of handloom and handicraft started increasing slowly and
it continues to increase. One of the major increases in the sales of the handloom and handicraft industry during the course of the year is formulation and imple-
mentation of number of programs and schemes implemented by the government of Sikkim for the development of handloom and handicraft industry. As Sikkim,
being one of the major preferred tourist destinations both nationally and internationally it has witnessed a large number of tourists (table 2) every year. According
to the survey conducted these tourists who visit Sikkim are the major purchaser of the handloom and handicraft products. Therefore, overall if we look at the sales
figure in the table 1 Sikkim handloom and handicraft industry has been doing well in the recent years although the last two years (2014-2016) there has been slight
decrease in the sales figure the reason may be lack of proper marketing channel and artificial goods replacing the authentic handicraft and handloom products in
the market since the customer are not able to easily differentiate between the two.
STATISTICS OF TOURIST ARRIVAL IN THE STATE OF SIKKIM DATA OF DOMESTIC TOURIST FROM YEAR 2007-2105
TABLE 2
MONTH 2007 2008 2009 2010 2011 2012 2013 2014 2015
JAN 22286 24035 30395 40160 42314 28560 30292 28824 54229
FEB 23465 26098 35883 48420 50652 29642 31278 19830 44366
MAR 47465 51018 55965 60560 62438 45231 48102 24597 32515
APR 70684 76539 85669 87172 89238 65341 69054 63730 89648
MAY 86448 99625 108778 116641 124323 120212 131804 92199 138695
JUN 34025 35172 63905 68236 69784 65673 68205 85763 86218
JULY 19462 22010 26992 27021 29540 18628 17161 19472 19521
AUG 21428 22628 35826 37180 38964 35294 7713 11875 19535
SEP 25295 26910 41285 53624 13943 12678 20115 25478 25535
OCT 43218 49456 44865 59582 9682 42390 50461 75025 75908
NOV 38215 43018 43720 48764 8326 39602 42836 53275 55827
DEC 33213 35864 42345 52651 13249 55287 59728 62350 63026
TOTAL 465204 512373 615628 700011 552453 558538 576749 562418 705023
DATA OF FOREIGN TOURIST FROM YEAR 2007-2015
TABLE 3
MONTH 2007 2008 2009 2010 2011 2012 2013 2014 2015
JAN 866 910 696 984 1436 1904 873 4145 3458
FEB 1286 1106 1053 1320 1065 2406 1247 3803 3119
MAR 2225 2406 2184 2605 2423 3199 2524 5211 4971
APR 2386 2411 2544 3036 2615 3939 4895 2855 6909
MAY 1058 1857 1335 1593 2875 2058 1312 4927 2326
JUN 631 393 429 830 643 1152 804 3939 1727
JULY 549 453 646 680 553 1282 563 2496 1382
AUG 811 864 846 979 873 1048 2579 1429 1563
SEP 1230 1330 1275 1678 1415 1432 3942 2410 1406
OCT 3106 3386 2925 2780 4286 4486 5292 8906 4431
NOV 2471 2867 2406 2410 3323 2300 3210 5537 3877
DEC 1218 1171 1391 1862 2438 1283 4457 3517 3310
TOTAL 17837 19154 17730 20757 23945 26489 31698 49175 38479
Source –government of Sikkim tourism department, sikkimtourism.gov.in
-2000000
0
2000000
4000000
6000000
8000000
10000000
12000000
14000000
16000000
Amount(in Lakhs)
% change (progress)

VOLUME NO. 6 (2016), ISSUE NO. 11 (NOVEMBER) ISSN 2231-1009
INTERNATIONAL JOURNAL OF RESEARCH IN COMPUTER APPLICATION & MANAGEMENT A Monthly Double-Blind Peer Reviewed (Refereed/Juried) Open Access International e-Journal - Included in the International Serial Directories
http://ijrcm.org.in/
62
FIG. 3: GRAPHICAL REPRESENTATION OF INFLOW OF TOURIST IN SIKKIM FORM 2007-2015
CONCLUSION The present study shows that there is a significant growth in the Directorate handloom and handicrafts industry in Sikkim. The study is also significant since it is
conducted in Sikkim which has shown a paradigm shift in the different varieties of handloom and handicrafts products produce by local artisan and which has
shown an increasing demand for the products both in Sikkim and in other parts of India. During the course of the study it was found that only a few shopping
outlets are present for the sale of handloom and handicraft product in entire Sikkim, which is not able to cater the needs of the large number of tourists visiting
Sikkim. In order to meet the large number of demands from tourists visiting Sikkim and to further increase the sales growth of handloom and handicraft products
produce the government needs to increase more number of shopping outlets both in Sikkim and in other parts of India, especially in major metropolitan cities
where the demand for the Sikkim handloom and handicraft product produce continues. Further the government needs to established Research and design devel-
opment units in each district of state for generating sustainable livelihood both in urban and rural areas. The government also needs to build on infrastructure
where the local artisan and upcoming entrepreneurs in the field of handloom and handicrafts industry can be provided with proper training facilities so that
unskilled artisan and entrepreneurs can be developed into skillful artisan and successful entrepreneurs who can contribute towards the growth of the Sikkim
handloom and handicrafts industry. The findings of the study will help in realizing the growth, viability and potential creditability of the handicrafts and handloom
produce which can play an important role in contributing towards the economy of the state of Sikkim.
REFERENCES 1. epratrust.com/articles/upload/19.Bikash%20Sharma%20&%20T.%20Sezhiyan.pdf- “marketing of handicrafts in Sikkim” -Bikash Sharma - Ph. D. Research
Scholar, Department of Economics, Annamalai University, Annamalai Nagar, and T. Sezhiyan- Tamil Nadu, Asst. Professor, Economics wing, DDE, Annamalai
University, Annamalai Nagar, Tamil Nadu.
2. handicrafts.nic.in/CmsUpload/22342016043422str_handloom0305.pdf- Report of the Steering Committee On Handlooms and Handicrafts Constituted for
the Twelfth Five Year Plan (2012 – 2017)
3. http://epch.in/index.php?option=com_content&view=article&id=53&Itemid=233-EXPORT PROMOTION SCHEME FOR HANDICRAFTS FROM EPCH
4. Reference from Golden jubilee celebrations (souvenir) 1957-2007, Est.9th march, Magazine of directorate of handicrafts and handloom government of Sikkim.
5. www.ermt.net/docs/papers/Volume_4/4_April2015/V4N4-139.pdf- Traditional Handlooms of India: The Role of Designer into Market Opportunity Recogni-
tion in the Globalization Era K. V. Rakhin. Asst. Prof. Amity University Haryana, Amity Education Valley, Manesar, Gurgaon, India.
0
100000
200000
300000
400000
500000
600000
700000
800000
2007 2008 2009 2010 2011 2012 2013 2014 2015
Foreign Tourists
Domestic Tourists
VOLUME NO. 6 (2016), ISSUE NO. 11 (NOVEMBER) ISSN 2231-1009
INTERNATIONAL JOURNAL OF RESEARCH IN COMPUTER APPLICATION & MANAGEMENT A Monthly Double-Blind Peer Reviewed (Refereed/Juried) Open Access International e-Journal - Included in the International Serial Directories
http://ijrcm.org.in/
63
ASSESSMENT OF THE IMPACT OF COMPUTERIZED ACCOUNTING INFORMATION SYSTEMS ON AUDIT
RISK: THE CASE OF AUTHORIZED ACCOUNTANTS ENGAGED IN NEKEMTE TOWN
KENO TELILA MIJENA
LECTURER
COLLEGE OF BUSINESS & ECONOMICS
DEPARTMENT OF ACCOUNTING AND FINANCE
WOLLEGA UNIVERSITY
NEKMETE
ABSTRACT The study has been carried out in Nekemte Town, Oromia, Ethiopia. The need for CAIS is becoming more necessary day after day, but it conveys the potential risk.
Audit review for computerized accounting information system will be critical tools for auditors. The system initiates new dimensions for financial transaction. These
dimensions need an infrastructure for auditing practices. The review of related literature revealed the existence of various knowledge gaps in site of the impact of
implementing computerized accounting information system on audit risk. The degree of adopting computerized accounting information system differs between
organizations in all countries. The Influence of Computerized Accounting Information system on audit functions and the potential risk that are associated with
auditing in such environment have been approved by the literature relating to Ethiopia, Addis Ababa city, Negeria, Saud Arabia. However, the impact of IT-based
accounting system on audit risk has not been assessed in Wollega, particularly, in Nekemte town. So, this research fills the existing gap by assessing empirically the
pressure of the utilization of Computerized Accounting Information System on audit risk in the study place. The overall objective of the study was to assess the
impact of Computerized Accounting Information Systems on audit risk the case of authorized accountants engaged in Nekemte town. It seeks to identify whether
audit risk considerably changed as results of implementing this system by the authorized accountant’s clients in this area. The study used both quantitative and
qualitative (mixed) approach. Self-administered questionnaire has been carried out to meet the desired objective and to address the study problem. The major
findings of this study were that several variables tainted audit risk related to implementing the system. These are: lack of segregation of duties; lack of awareness
of the issue, problems and risk associated to the system; disappearance of audit trial; unsuitable audit approach; lack of IT training for both client staffs and auditors
in such environment; weakness of client internal control system and audit firm financial cost concern.
KEYWORDS computerized, accounting, information, systems, audit, risk.
I. INTRODUCTION nformation Technology (IT) has caused the accounting environment to change at a fast rate during the last for decades. Certainly, technology is so persistent
in the accounting business that it would be difficult for many companies to meet their accounting and financial reporting objectives without using technology.
As a result, IT audit and control concepts play a very important role in the current business environment. Accordingly, the need for accounting professionals
to understand IT auditing concepts has evolved to a point that warrants required coverage of IT audit concepts in the accounting environment. The explosive
growth of IT capabilities and the desire of businesses of all sizes to obtain a competitive advantage have led to a dramatic increase in the use of IT systems to
originate process, store and communicate information. Today, employees at all levels use IT systems in their daily activities. Electronic records have replaced
traditional paper documents. In fact, there are few companies that don't rely on IT to at least some extent to achieve their financial reporting, operating and
compliance objectives. As a result, it is rare to find an entity whose IT use does not also affect its independent audit (Coe, 2006).
Introduction Technology (IT) has had a radical impact on business processes in both developed and developing countries. It facilitates the streamlining of the
administrative process and enables the decentralization of the scope and scale of the business. An Accounting Information System (AIS) is the system of records a
business keeps maintaining its accounting system. This includes the purchase, sales, and other financial processes of the business. The purpose of AIS is to accu-
mulate data and provide decision makers (investors, creditors, and managers) with information to make decisions. While this was previously a paper-based pro-
cess, most modern businesses now use computerized accounting software such as Sage, Peachtree, Pegasus, Oracle Financial, Iris etc. These are referred to as
Computerized Accounting Information System (CAIS). It should be noted that Computerized Accounting Information Systems (CAIS) and IT- based Accounting
Systems mean one and the same thing. Both of these will be used interchangeably in this paper (Ariwa and Eseimokumoh, 2008).
The increased use of IT-based accounting systems by audit clients has given rise to the question of the capability and competence of audit firms in this new
environment. This question focuses on the issues of the competence of the auditors and also the sufficiency of their audit techniques and methods that are used
to deal with the features of this new environment. The importance of these issues increases in this environment since many traditional audit aids, such as the
notion of the separation of duties, cannot always exist (Cosserat, 2000).
According to Coe (2006) the foundations of auditing are competence, independence, and due professional care. All three affect the quality and the value of an
audit. In today's environment, where audit evidence is increasingly digital in nature, the exercise of competence and due professional care has taken on a new and
different character. Competence relates to an auditor's technical ability to discover a material misstatement in the financial statements and is a function of edu-
cation, training, and experience. It enables an auditor to collect evidence to support the audit opinion and weigh it in order to determine if the evidence is sufficient
and reliable. Dramatic changes in information technology have changed the very nature of the evidence of transactions and have created a challenge for the audit
profession to maintain its competence. The changes in the use of information technology by business have had a profound effect on accounting and auditing
because these records are almost universally recorded, processed, and reported digitally. Information technology Audit is the process of collecting and evaluating
evidence to determine whether a computer system has been designed to maintain data integrity, safeguard assets, allows organizational goals to be achieved
effectively, and uses resources efficiently (Abu-Musa, 2001). Therefore, the purpose of this study was to assess the impact of computerized accounting information
systems on audit risk: the case of Authorized Accountants Engaged in Nekemte Town.
II. STATEMENT OF THE PROBLEM Accounting activities that were previously performed manually can now be performed with the use of computers, but with the increase in the usage of IT-based
accounting systems in developed and developing countries there are several risk posed by the systems such as accidental and intentional entry of bad data;
organized fraud; lack of awareness of the issues, problems and risks associated with CAIS; the application of an unsuitable audit approach (i.e. auditing around the
computer); the incompetence of client staffs’ in dealing with issues relating to CAIS etc (Al-Fehaid, 2003).
Abu-Musa(2005) states in designing audit procedures that, the auditor should consider the potential of the risk; the materiality of misstatement; the characteristics
of the class of transactions, account balance or disclosure involved; the nature of the specific controls used by the organization including the organization’s use of
IT; and whether the auditor expects to obtain audit evidence to determine if the organization’s controls are effective in preventing, or detecting and correcting,
material misstatements. Furthermore Abu-Musa(2005) identify that Information technology introduces specific risks to an organization’s internal control, includ-
ing: programs that are inaccurately processing data, processing inaccurate data, or both; unauthorized access to data that may result in destruction of data or
improper changes to data, including the recording of unauthorized or nonexistent transactions or inaccurate recording of transactions; unauthorized changes to
I

VOLUME NO. 6 (2016), ISSUE NO. 11 (NOVEMBER) ISSN 2231-1009
INTERNATIONAL JOURNAL OF RESEARCH IN COMPUTER APPLICATION & MANAGEMENT A Monthly Double-Blind Peer Reviewed (Refereed/Juried) Open Access International e-Journal - Included in the International Serial Directories
http://ijrcm.org.in/
64
data in master files; failure to make necessary changes to systems or programs; inappropriate manual intervention; and potential loss of data or inability to access
data as required (IFAC, 2002). However, the impact of utilizing IT-accounting systems on accounting and audit services and major risks that are associated with
auditing in such an environment have been recognized by the literatures relating to private audit firms in Addis Ababa. However, the impact of these risks on the
level of audit risk in an IT-based accounting environment has not been assessed in Wollega, particularly, Nekemete Town. Accordingly, this study was raised to fill
this gap by identifying the impact of implementing IT-based accounting systems on audit risk in Nekemte town by emphasized on authorized accountants.
III. GENERAL OBJECTIVE The main objective of this research was to evaluate the impact of utilizing computerized accounting information system on audit risk in Nekemte town. Specifically,
the study intended to:
1. Assess the extent to which the accounting information system in business enterprise is computerized in Nekemte town.
2. Study potential problems linked with auditing company that use computerized accounting information system in Nekemte town.
3. Assess the impact of IT-based accounting information system on the level of audit risk.
4. Evaluate whether the audit risk has increase or decrease due to implementing the computerized accounting information system by client in Nekemte
town.
IV. SIGNIFICANCE OF STUDY The value of this paper was intended to see the factual practice of authorized accountants in this new environments and how they respond to both its require-
ments and its difficulty in order to eradicate, or reduce, the audit risk and get better quality of audit services in Wollega, particularly, Nekemte Town. There is the
need to assess audit risk following the implementing computerized accounting information systems by businesses in study area. Besides, this study will be tapered
the existing hole regarding the problem linked in implementing computerized accounting information system in Nekemte Town.
V. RESEARCH METHODOLOGY Research Design
The researches designs are both descriptive and explanatory nature. Descriptive research is used to generate information on the phenomena of interest that
already exists (Fink, 1995), whereas explanatory research is concerned with the explanation of a condition or problem, usually in terms of cause-and-effect rela-
tionships (Churchill, 1995). The researcher expected that, the mixture of these two approaches were useful for bringing together the quantitative and qualitative
(mixed) approaches. It is advisable as it gives more complex picture by drawing on the individual strength and weakness of each methods; as well as enabling
discovery and verification; understanding and prediction; validity and reliability within the research design (Jarratt,1996).
Types of Data
The study used both primary and secondary data. Primary data included information obtained through self- administered questionnaires from six (6) practicing
authorized accountant firms in Nekemte Town. Whereas secondary data includes journals articles, and audit reports.
Data Collection Instrument
This paper utilized the questionnaire as the main data collection instrument. The data has been collected through self-administered questionnaire. Some of these
questionnaires are adopted from Al-Fehaid (2003), (Ariwa, and Eseimokumoh, 2008) and Abu-Musa (2008). A questionnaire is a method for drawing out, recording,
collecting information and is useful when the researcher wishes to gather large amount of factual and simplistic data that can be quantified and made into statistical
evidence (Creswell, 2003).
Within this approach, a combination of both close, and open ended and Likert scales questionnaire which self administer is found to be suitable methods of data
collection for this research. In open-ended question participants are free to answer the question in any manner they choose. By contrast, a closed-ended question
provides the participant with several answers from which to choose.
Likert scales used to look in to certain response patterns to see whether there is a problematic response set that emerges, as indicated by restricted variability in
responses (Marczyk et al, 2005). For this study the researcher classified the interval scale in to four (4) such as very often, often, rarely, very rarely, and not at
all. The use of self administered questionnaires has many advantages like time saving; cost wise; and it does not require as much skill to administer questionnaires
as to conduct the interviews (Sekaran, 2000).
Sampling Techniques and Selection
The target populations are authorized accountants in Nekemte town which are six (6) in number. Census survey was used in choosing 100% participants from the
population of interest. Accordingly, this study used census survey because the number of authorized accountants in Nekemte town is few.
Data Analysis and Presentation
Appropriate tools such as Excel and, descriptive statistics such as frequency, percentage, tables and graphs has been used to analysis the data concerning the
nature and type of data collected. Statistical analysis and interpretation has been applied to address the research problem.
Research Variables
Based on, empirical review in related literature and previous researches the researcher indentified thirteen (10) independent variables those have major impact
on audit risk due to implementing computerized accounting information system and one dependant variable –audit risk that includes inherent risk, control risk
and detection risk. Those independent variables included: - lack awareness of the problems associated with CAIS; security breaches and virus; information tech-
nology (IT) related fraud; weaknesses in internal control systems in relation to CAIS; unsuitable audit approach; the incompetence of client staffs’ and audi-
tors in dealing with issues; accidental entry of bad data by employees; the disappearance of the audit trail; lack of client staff and auditors training in it environ-
ment; audit financial cost concern.
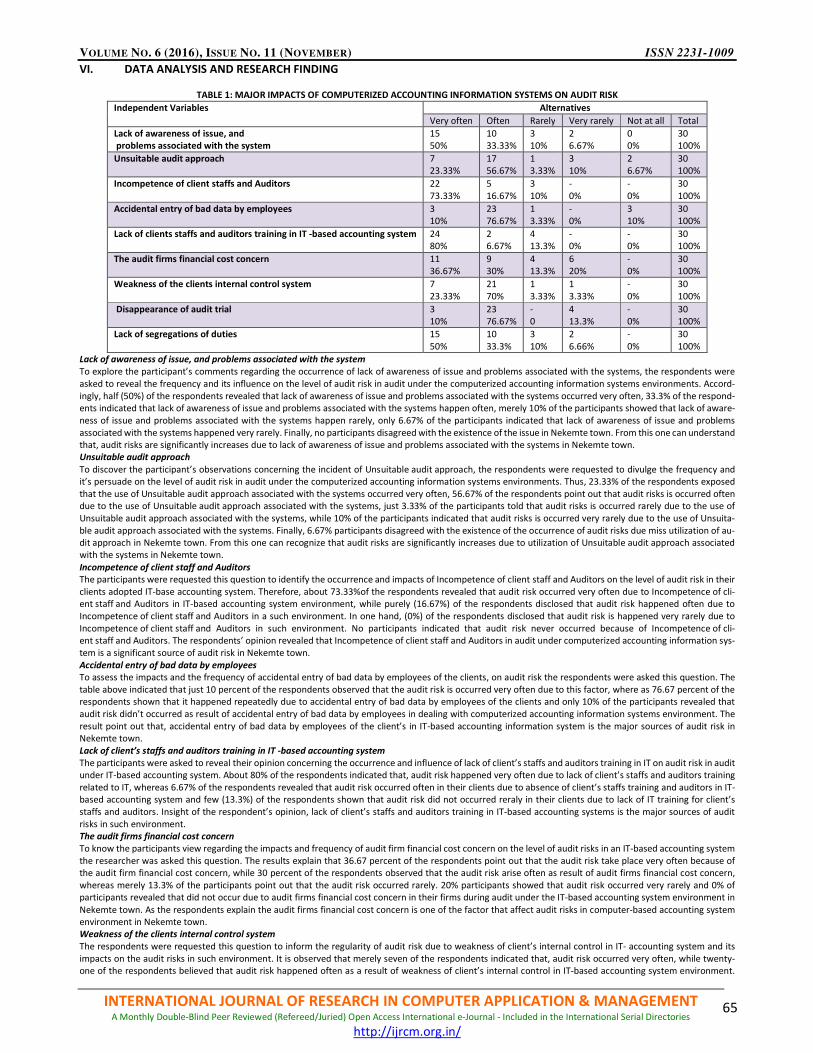
VOLUME NO. 6 (2016), ISSUE NO. 11 (NOVEMBER) ISSN 2231-1009
INTERNATIONAL JOURNAL OF RESEARCH IN COMPUTER APPLICATION & MANAGEMENT A Monthly Double-Blind Peer Reviewed (Refereed/Juried) Open Access International e-Journal - Included in the International Serial Directories
http://ijrcm.org.in/
65
VI. DATA ANALYSIS AND RESEARCH FINDING
TABLE 1: MAJOR IMPACTS OF COMPUTERIZED ACCOUNTING INFORMATION SYSTEMS ON AUDIT RISK
Independent Variables Alternatives
Very often Often Rarely Very rarely Not at all Total
Lack of awareness of issue, and
problems associated with the system
15
50%
10
33.33%
3
10%
2
6.67%
0
0%
30
100%
Unsuitable audit approach
7
23.33%
17
56.67%
1
3.33%
3
10%
2
6.67%
30
100%
Incompetence of client staffs and Auditors 22
73.33%
5
16.67%
3
10%
-
0%
-
0%
30
100%
Accidental entry of bad data by employees 3
10%
23
76.67%
1
3.33%
-
0%
3
10%
30
100%
Lack of clients staffs and auditors training in IT -based accounting system 24
80%
2
6.67%
4
13.3%
-
0%
-
0%
30
100%
The audit firms financial cost concern 11
36.67%
9
30%
4
13.3%
6
20%
-
0%
30
100%
Weakness of the clients internal control system 7
23.33%
21
70%
1
3.33%
1
3.33%
-
0%
30
100%
Disappearance of audit trial 3
10%
23
76.67%
-
0
4
13.3%
-
0%
30
100%
Lack of segregations of duties 15
50%
10
33.3%
3
10%
2
6.66%
-
0%
30
100%
Lack of awareness of issue, and problems associated with the system
To explore the participant’s comments regarding the occurrence of lack of awareness of issue and problems associated with the systems, the respondents were
asked to reveal the frequency and its influence on the level of audit risk in audit under the computerized accounting information systems environments. Accord-
ingly, half (50%) of the respondents revealed that lack of awareness of issue and problems associated with the systems occurred very often, 33.3% of the respond-
ents indicated that lack of awareness of issue and problems associated with the systems happen often, merely 10% of the participants showed that lack of aware-
ness of issue and problems associated with the systems happen rarely, only 6.67% of the participants indicated that lack of awareness of issue and problems
associated with the systems happened very rarely. Finally, no participants disagreed with the existence of the issue in Nekemte town. From this one can understand
that, audit risks are significantly increases due to lack of awareness of issue and problems associated with the systems in Nekemte town.
Unsuitable audit approach
To discover the participant’s observations concerning the incident of Unsuitable audit approach, the respondents were requested to divulge the frequency and
it’s persuade on the level of audit risk in audit under the computerized accounting information systems environments. Thus, 23.33% of the respondents exposed
that the use of Unsuitable audit approach associated with the systems occurred very often, 56.67% of the respondents point out that audit risks is occurred often
due to the use of Unsuitable audit approach associated with the systems, just 3.33% of the participants told that audit risks is occurred rarely due to the use of
Unsuitable audit approach associated with the systems, while 10% of the participants indicated that audit risks is occurred very rarely due to the use of Unsuita-
ble audit approach associated with the systems. Finally, 6.67% participants disagreed with the existence of the occurrence of audit risks due miss utilization of au-
dit approach in Nekemte town. From this one can recognize that audit risks are significantly increases due to utilization of Unsuitable audit approach associated
with the systems in Nekemte town.
Incompetence of client staff and Auditors
The participants were requested this question to identify the occurrence and impacts of Incompetence of client staff and Auditors on the level of audit risk in their
clients adopted IT-base accounting system. Therefore, about 73.33%of the respondents revealed that audit risk occurred very often due to Incompetence of cli-
ent staff and Auditors in IT-based accounting system environment, while purely (16.67%) of the respondents disclosed that audit risk happened often due to
Incompetence of client staff and Auditors in a such environment. In one hand, (0%) of the respondents disclosed that audit risk is happened very rarely due to
Incompetence of client staff and Auditors in such environment. No participants indicated that audit risk never occurred because of Incompetence of cli-
ent staff and Auditors. The respondents’ opinion revealed that Incompetence of client staff and Auditors in audit under computerized accounting information sys-
tem is a significant source of audit risk in Nekemte town.
Accidental entry of bad data by employees
To assess the impacts and the frequency of accidental entry of bad data by employees of the clients, on audit risk the respondents were asked this question. The
table above indicated that just 10 percent of the respondents observed that the audit risk is occurred very often due to this factor, where as 76.67 percent of the
respondents shown that it happened repeatedly due to accidental entry of bad data by employees of the clients and only 10% of the participants revealed that
audit risk didn’t occurred as result of accidental entry of bad data by employees in dealing with computerized accounting information systems environment. The
result point out that, accidental entry of bad data by employees of the client’s in IT-based accounting information system is the major sources of audit risk in
Nekemte town.
Lack of client’s staffs and auditors training in IT -based accounting system
The participants were asked to reveal their opinion concerning the occurrence and influence of lack of client’s staffs and auditors training in IT on audit risk in audit
under IT-based accounting system. About 80% of the respondents indicated that, audit risk happened very often due to lack of client’s staffs and auditors training
related to IT, whereas 6.67% of the respondents revealed that audit risk occurred often in their clients due to absence of client’s staffs training and auditors in IT-
based accounting system and few (13.3%) of the respondents shown that audit risk did not occurred reraly in their clients due to lack of IT training for client’s
staffs and auditors. Insight of the respondent’s opinion, lack of client’s staffs and auditors training in IT-based accounting systems is the major sources of audit
risks in such environment.
The audit firms financial cost concern
To know the participants view regarding the impacts and frequency of audit firm financial cost concern on the level of audit risks in an IT-based accounting system
the researcher was asked this question. The results explain that 36.67 percent of the respondents point out that the audit risk take place very often because of
the audit firm financial cost concern, while 30 percent of the respondents observed that the audit risk arise often as result of audit firms financial cost concern,
whereas merely 13.3% of the participants point out that the audit risk occurred rarely. 20% participants showed that audit risk occurred very rarely and 0% of
participants revealed that did not occur due to audit firms financial cost concern in their firms during audit under the IT-based accounting system environment in
Nekemte town. As the respondents explain the audit firms financial cost concern is one of the factor that affect audit risks in computer-based accounting system
environment in Nekemte town.
Weakness of the clients internal control system
The respondents were requested this question to inform the regularity of audit risk due to weakness of client’s internal control in IT- accounting system and its
impacts on the audit risks in such environment. It is observed that merely seven of the respondents indicated that, audit risk occurred very often, while twenty-
one of the respondents believed that audit risk happened often as a result of weakness of client’s internal control in IT-based accounting system environment.
VOLUME NO. 6 (2016), ISSUE NO. 11 (NOVEMBER) ISSN 2231-1009
INTERNATIONAL JOURNAL OF RESEARCH IN COMPUTER APPLICATION & MANAGEMENT A Monthly Double-Blind Peer Reviewed (Refereed/Juried) Open Access International e-Journal - Included in the International Serial Directories
http://ijrcm.org.in/
66
Furthermore, two of the respondents believed that, weakness of client’s internal control occurred rarely and very rarely due fault related to clients internal control
system. No participants discharged the occurrence of e audit risk because weakness of client’s internal controls system in such environment. As the participants
indicated weakness of client’s internal control in IT-based accounting system is the major sources of audit risks in their client’s.
Disappearance of audit trial
The participants were requested this question to identify the incidence and collision of disappearance of audit trial on the extent of audit risk in their clients
adopted IT-base accounting system. Accordingly, about (10%) of the respondents revealed that audit risk occurred very often due to disappearance of audit trial
in audit under IT-based accounting system environment, while majority (76.67%) of the respondents disclosed that audit risk happened often due to disappearance
of audit risk in a such environment. In one hand, (0%) of the respondents indicated that audit risk occurred rarely because of absence of audit trial. Despite, 13.3%
of the respondents indicated that audit risk occurred very rarely due to lost the respondents’ opinion revealed that disappearance of audit trial in audit under
computerized accounting information system is a significant source of audit risk in Addis Ababa.
Lack of segregations of duties
The participants were requested to reveal the occurrence and the influence of lack of segregations of duties on the level of audit risk in computerized accounting
information systems environment in Nekemte. The results revealed that half (50%) of the respondents believed that audit risk take place very often because of
lack of segregation of duties, merely (33.3%) of the respondents observed that audit risk occurred often due to lack of segregations of duties, while few (10%) of
the participants believed that lack of segregations of duties happened rarely causes audit risk in IT-based accounting system environment in Nekemte. It’s observed
that majority of the respondents indicated that lack of segregations of duties in IT-based accounting system is the potential sources of audit risk in Nekemte.
VII. CONCLUSION One the basic results of this study were that large number client’s in Nekemte town was implemented computerized accounting information systems. The results
of this study witness/boost the researcher ideas concerning the rational to assess the influence of computerized accounting information systems on audit risks
(Inherent, control and detection) in Nekemte town.
The study revealed audit risks in business organization adopted computerized accounting information systems are facing similar problems investigated by previous
studies (Ariwa and Eseimokumho,2008; Keno,2011;Al-Fehaid,2003; and Abumusa,2006) such as lack of awareness concerning the issue and problems associated
with the systems; use of unsuitable audit approach; incompetency of client’s staffs and auditors; accidental entry of bad data by employees ;lack of staffs and
auditors training in IT- based accounting systems; audit firms financial cost concerns; weakens of client’s internal control systems; disappearance of audit trials;
and lack of segregation of duties are the major problems influence audit risks in Nekemte town. However, the magnitude and materiality of each factor are
different in this study as well as previous studies under review of related literature part.
ACKNOWLEDGEMENT There are numerous people who deserve to be acknowledged in this study and it is difficult to tell all of them by their name. However, I would like to thank
particularly, those who have made significant contributions toward the completion of this paper after almighty God.
Secondly, I wish to express my gratitude and appreciation to all of my friends who have always supported and encouraged me for the completion of this paper.
Lastly, I would like to acknowledge the assistance that I have obtained from Authorized Accountants and their staffs. However, special thanks go to all those
persons who have supported me throughout the period of this research but who I may have unfortunately not disclosed.
REFERENCES
1. A.Seetharaman,M.Senthilvenmuruganand Rajan Periyanayagam (2002), “Anatomy of Computer Accounting Frauds”:Multimedia University, Malaysia. pp18.
http//www.er meraldisight.com/research register.
2. Abu Musa.A.A (2006), “Exploring Perceived Threats of Computerized Accounting Information System in Developing Countries: The Case of Sauid Arabia”.
Management Auditing Journals vol.2, pp.1-35. www.emeralandinsight.com/0268-6902.htm.
3. Abu-Musa.A.A (2001), “Evaluating the Security of Computerized Accounting Information Systems”: An Empirical Study on Egyptian Banking Industry”. Aber-
deen University UK.Pp.329.
4. Abu-Musa.A.A (2005), “Information Technology and its Implications for Internal Auditing: An Empirical Study on Saudi Organizations”.pp3-45.
5. Ahmad A. Abu-Musa (2006), “Evaluating the Security Controls of Computerized Accounting Information System in Developing Countries: The Case of Sauid
Arabia”. King Fahd University of Petroleum and Mineral. International Journal of Digital Accounting Research vol. 25, pp.2-24.
6. Ahmad A. Abu-Musa.A.A (2008), “Information Technology and its implications for Internal Auditing: An empirical study on Saudi Organizations”. Management
Auditing Journals vol.23, no.5 pp1-4.httm//www.emeralandinsight.com/0268-6902.htm.
7. Al-Fehaid, A.M. (2003), “An Investigation of the Influence of Information Technology on Audit Risk: An Empirical Study in Sauid Arabia”.Lough Borough
University, UK. PP.20- 384.
8. American Institute of Certified public Accountants (2001), “The effect of information technology on the auditor’s consideration of internal control in a finan-
cial statement audit”: Statement of audit standards no.94. New York NY.
9. An Introduction to Process and Method. Landon Sage Publication, PP.55-66.
10. Ana-Maria Sudc, Mihai Bzol, and Florin Gheorghe Fillip (2010), “Audit for Information Systems Security”. Informatics Economic vol.14, no.1, pp.43-49.
11. Appendix 9A, “Understanding Information Systems and Technology for Risk and Control Assessment”. no.1, pp.2-28.
12. Arens, A. A., R.J. Elder, and M.S.Beasely (2006), “Auditing and Assurance Services, an Integrated Approach”: Ninth edition Upper Saddle River, NJ Prentice
Hall.pp.56-154.
13. Ariwa and Eseimokumoh (2008), “Financial Informatics Enterprise and Audit Risk Developing Economy: The case of Nigeria”. Journal of Yasar University, pp.1-
25 http/joy.yasar.ed.ir.
14. Association of Chartered Certified Accountants (2011), “Specific Aspects of Auditing in a Computer-based environment”.pp2-6.
15. Auditing and Assurance Standard 29 (2003), “Auditing in a Computer Information Systems Environment”. Issued by the Council of the Institute of Chartered
Accountants of India. Pp.1-34.
16. Barclay Simpson (2007), “Introduction to Computer Auditing”.pp.5-21.
17. Bell,T.B.,kenchel, W.R.,Payne,J.L. and Willingham,J.J.(1998), “An Empirical Investigations of the Relationship between the Computerization of Accounting
Systems and the Incidents and Sizes of Audit Differences Auditing”. Journal of Practice and Theory, vol.17, no.1, pp.13-38.
18. Benefit of Computerized Accounting Information Systems on the JIT production Systems. Review of Social, Economic and Business Studies, vol.2, pp.45-64.
19. Berdard, J.C. and Biggs, S. (1991), “Pattern Recognition, Hypotheses Generation, and Auditor Performances in an Analytical Task”. The Accounting Review,
pp.622-42.
20. Bierstaker, J.L. and Thibodeau (2001), “The Impact of Information Technology on the Audit Process: An assessment of the state of the art and Implications
for the Future”. Audit Journal, pp.159-164. http://www.emerald-library.com/ft.
21. Caster, P., D.W.Massey and A.M. Wright (2000), “Research on the Nature, Characteristics, and Causes of Accounting Errors: The need for a Mulit-Method
Approach”. Journal of Accounting Literature.
22. Chan, S.I (2000), “Information Technology in Business Processes”. Management Journal, vol.6, no.3.pp.34-40.
23. Chen Ling Li Xiaohong (2007), “Computerized Accounting and Auditing Problems and Solutions, Business Economics”.pp.35.
24. Chen Xiao (2006), “Development of Modern Audit Functions: The Era of China Economic Press”.pp.3-25.
25. Chinese Version Related News (2009), “Computerized Accounting System of the Information Age the Risks and Prevention”.pp.10-20.

VOLUME NO. 6 (2016), ISSUE NO. 11 (NOVEMBER) ISSN 2231-1009
INTERNATIONAL JOURNAL OF RESEARCH IN COMPUTER APPLICATION & MANAGEMENT A Monthly Double-Blind Peer Reviewed (Refereed/Juried) Open Access International e-Journal - Included in the International Serial Directories
http://ijrcm.org.in/
67
26. Collbert, J.and P.Bowen (1996), “A Comparison of Internal Controls: Cobit, SAC, COSO, and SAS55/75”. IT Audit and Control Journal, pp.20-35.
27. Cosserat, G. (2000), “Modern Auditing”. West Sussex, England: John Wiley & Sons. pp.346.
28. Creswell (2003), “Research Design Qualitatitive, Quantitative, and Mixed Methods Approaches”. Second ed., pp.1-335.
29. Dalci and Tanis (2003), “Benefit of Computerized Accounting Information Systems on JIT Production systems”. Review of Social, Economic and Business
Studies, vol.2, pp.12-28.
30. Dallas, D.A. (1999), “The Role of IT Auditing in Today’s Business Environment: Information Strategy”.pp.40-48.
31. Davis, C.k and C.A.D Ykman (1993), “Information System Auditors”. Journal of System Management, pp.22.
32. Dodd, F. (1992), “Practical Computerized Accounting Systems, NCC Black well and Oxford”.
33. Drew Nelson (2010), “How to Audit a Computerized Accounting Sytem”.pp.1.
34. Elizabeth A. Austen William F. and Messier J.R.T (2006), “The Relationship of Risk Assessments and Information Technology to Detected Misstatements”.
Approved by Auditor Generals, vol.65 of 27.
35. Elliot R.K. (1992), “The Third Wave breaks on the Shores of Accounting Information systems Horizons”.pp.61-85.
36. Fricke (2010), “The Impact of Information Technology on Today’s Accountant”. pp.1-34
37. General Accounting Office (1999), “Evaluating and Testing General Control: Security Planning”.PP.26.
38. Gillham, B. (2000), The research Interview, London: Continuum.pp.56.
39. Granlund (2009), “On the Inter face between Accounting and Modern Information Technology”. Turku School of Economics, pp.5-45.
40. Gray. L and Mason.S. (2005), “The Audit Process”. Third ed. Thompson Learning, London.pp.102.
41. Hall, J. A. (2001), “Accounting Information Systems”, South Western Publishing Company.pp.1
42. Hannaford (2010), “Can Computer Security Really Make a difference”? Managerial Audit Journal, pp.1.
43. Helms and Mancino (1998), “The Electronic Auditor”. Journal of Accountancy, pp.5-20.
44. Houghton, C.W. and Fogarty J.A. (1991), “Inherent risk”. Journal of Practice and Theory, vol.10, no.1, pp.1-3.
45. “Influences and Countermeasures of Computerized Accounting on Modern Auditing”. Journal of Modern Accounting and Auditing, USA (2007).
46. Information Technology Audit (ISA) 401 (2002), “Audit in Computer Information System Environment”. IT Audit Monograph Series no.1. Indian General
principle. pp. 1-3.
47. Jadish Pathak, Mary R. Lind, Merrick Hall (2001), “Integrated Information Systems”, SAS 94 and Auditors”.pp.2-9.
48. James A. Hall (2004), “Information System Audit and Assurance Accounting Information Systems”, 4th.Ed. pp. 120.
49. Jarrat, D. (1996), “Comparison of Two Alternatives Interviewing Techniques used with an Integrated Research Design: A Case Study in Out Shopping using
Semi-Structured and Non Directed Interviewing Techniques”. pp.5-17.
50. Johnson N.R (1987), “Auditors Detected Errors and Related Client Traits: Study of Inherent and Control risks in a Sample of UK audit”. Journal of Business
Finance and Accountingpp.6-240.
51. Joseph (2004), “The Effects of Computer Assurance Specialists Competence and Auditor; Accounting Information System Expertise on Auditor Planning Judg-
ments”. pp.25.
52. Joseph B.O. Donell (2007), “Innovations in Audit Technology: A Model of Continuous Audit Adoption”. Journal of Applied Business and Economics.pp.1-7.
53. JosephF. Brazel (2007), “An Examination of Auditors Planning Judgments in a Complex Accounting Information System Environment”. Christopher P. Goglia,
Drexel University.pp.1-25.
54. Kallinikos J. (2006), “The Consequences of Information: Institutional Implication of Information Technological Change”. pp.16.
55. Keechi (2007), “The Impact of ERP system on the Audit Process”. Swedish School of Economics and Business Administration.pp.1-11.
56. Kinney, J., W.R. (2000), “The productive Power of the Limited Information in Preliminary Analytical Review: An Empirical Study”. Journal of Accounting Re-
search.pp.148-60.
57. Lanier S. (1992), “Computerized Accounting, Prentice Hall International Limited”. London. pp.89.
58. Lucas H.C. (1975), “Performance and The use of an Information System”. Management Science, vol. 21, pp.908-909
59. Lu-Ming Wang (2005), “On the Audit of the Information age Technology Innovation: Management of Information Technology in China”.pp.45.
60. Marian Carroll (2006), “An Information System Auditors Profile”. University of South Africa.pp.10-89.
61. Martin J Coe (2006), “Integrating IT Audit in to AIS course”.The Review of Business Information Sytems.pp.5-11.
62. Messier F.,A. Eillifsen, and L.A. Austen (2000), “The Relationship of Risk Assessments and Information Technology to Detected Misstatements”. Institute of
Accounting, Auditing and Law. Norwegian School of Economics Adiminstration.pp.1-35.
63. Methodological Recommendations for Information Systems. Approved by the Auditor General Vol. 65, 2006.
64. Pathak and Hall (2002), “Integrated Information Systems, SAS 94 and Auditors”. School of Business and Economics North Carolina A and T State Univer-
sity.pp.1-30.
65. Pathak and Hall (2002), “Integrated Information Systems, SAS 94 and Auditors”. School of Bus. & Eco. North Carolina A and T State University, pp.1-30.
66. Price water house Coopers (2010), “The Impact of Information Technology on to day’s Accountants”.pp.5-30.
67. Raval v. (2000), “Today’s Information Systems Auditing, opportunities and challenges”. http://www.isaca.org/art2a.htm
68. Remenyi, D.Williams, B., Money, A. and Swartz, E.(1998), “Doing Research In Business and Management: An Introduction to Process and Metod”, Lon-
don.Sage Publications,pp. 123.
69. Rezee Z. and Reinstein A (1998), “The Impact of Information Technology on Auditing.” Manag erial Auditing Journal, vol.13, no.8, pp.464-47.
70. Romney, Marshall B., Steinbart, Paul John,Cushing, and Barry (1997), “Accounting Information Systems” 7thEd., Addison-Wesley, pp.154.
71. Santos and Tribolet (2004), “The Impact of E-commerce on Internal Control and on Auditing Practice”. IADIS International Conference E-comm., pp.269-276.
72. Sekaran U (2000), “Research Method for Business”, second Edition, John Wiley and Sons, New York NY.
73. Sir Lanka Auditing Standard (SLAUS), “Auditing in a Computer Information Systems Enviroment”. No.11, pp.1-6.
74. Standard on Internal Audit (SIA) 14 Internal Audits in an Information Technology Environment.pp.12
75. Statement of Auditing Standards 310 (2004), “Auditing in Computer information system Enviroment”. No.310, pp.1-5.
76. Timothy B.Bell, Peat Marwick, Montvale, N.J.W. Robert Knechel (2006), “Audit Risk Attributes in Computerized Environments”. University of Mississippi.
77. Waller, W.S. (1993), “Auditors Assessments’ of Inherent and Control Risk in Field Settings”. The Accounting Review, pp.783-803.
78. William B. (2009), “The Impact of Developments in Information Technology on Auditing and the Audit Process”. Report to the Auditing Research Foundation
of the Institute of Chartered Accountants of England and Wales, pp.45.
79. Wright S. and A. Wright (2002), “Information Systems Assurance for Enterprise Resources Planning System: Unique Risk Considerations.” Journal of Infor-
mation Systems, pp.99.
80. WrightS. And A. Wright (1996), “The Relationship between Assessments of Internal Control Strength and Error occurrence, Impact and Cause. Accounting
and Business Research. Pp.58-71.
81. Yang D.C, and L.Guan (2004), “The Evaluation of IT Auditing and Internal Control Standards in Financial Statement Audits; the Case of the United States.”Man-
agerial Auditing Journal, pp534-559
82. Zeng Ling-Fang (2007), “Influences and Countermeasures of Computerized Accounting on Modern Auditing”. Journal of Modern Accounting and Audit-
ing.pp.1-5.
83. Zulkarin Muhammad Sori (2009), “Accounting Information Systems and Knowledge Management: A Case Study Management”. University of Putra Malaysia.
Journal of Scientific Research.pp.14-32.http://www.eurojournals.com/ajsr.htm.

VOLUME NO. 6 (2016), ISSUE NO. 11 (NOVEMBER) ISSN 2231-1009
INTERNATIONAL JOURNAL OF RESEARCH IN COMPUTER APPLICATION & MANAGEMENT A Monthly Double-Blind Peer Reviewed (Refereed/Juried) Open Access International e-Journal - Included in the International Serial Directories
http://ijrcm.org.in/
68
BANK SELECTION CRITERIA EMPLOYED BY CORPORATE CUSTOMERS: A CASE STUDY ON TEN SELECTED
COMMERCIAL BANKS IN ADDIS ABABA CITY ETHIOPIA
MUSE BEYENE
LECTURER
BUSINESS AND ECONOMICS COLLEGE
JIMMA UINIVERSTY
JIMAA
ABSTRACT To plan an appropriate marketing strategy for attracting new customers and retain the existing ones, commercial Banks need to identify the criteria on which
potential customers determine their Bank selection decision. The study focuses on examining the criteria being employed by current account holder customers in
Addis Ababa city that customer consider important when selecting a bank and how these criteria are prioritized according to their importance in order to better
serve the customer needs and enable Banks to plan effective marketing strategies and survive in an intense competition exist in the Bank industry. The study was
also designed to examine the impact of demographic disparities on the Bank selection criteria applied by diversified customers. A total of 220 customers were
served as a sample for the study using systematic probability sampling technique. 21 Bank selection factors extracted from relevant literature, pretest with man-
agers of Ten Bank Managers and from the researcher’s point of view were examined in the study. SPSS version-19 was used to analysis and rate Bank selection
criteria’s based on the average response (mean) of the respondents. Findings show that the most important and top rated factors determining customers' selection
are: Confidence on Bank, Provision of fast and efficient services, Bank reputation, Friendliness of Bank personnel and Private Banks. However, the Bank selection
factors vary across customer’s demographic differences. Finally, the study recommends that Bank Executives and Officials should focus on these Bank selection
criteria’s while they are designing their effective marketing strategies to better serve and meet the needs of the customers and be strong survival competitor in the
market
KEYWORDS
bank marketing, customer preferences, corporate customers, customer satisfaction.
1. INTRODUCTION 1.1 BACKGROUND OF THE STUDY
or firms to survive in contemporary highly competitive business environment, they should be able to attract new customers and retain the existing ones.
(Maiyaki, 2011). In today’s economy, the financial services industry is exposed to increasing performance pressures and competitive forces (Goergen, 2001).
Service organizations must be able to effectively attract and retain customers by satisfying their needs and/or wants. To meet customers’ needs, there is
need to understand what is valuable to them and how they make decisions. To be profitable in a competitive industry, companies need to offer customers more
value or be able to produce products and/or services more cheaply (Leibert, 2004). Sometimes marketing of organizations do fail due to improperly identifying
the factors or determinants that consumer consider in their selection (Khazeh & Decker, 1992). Hence, there is need for service organization to effectively differ-
entiate their offerings from those of competitors in order to attract customers’ attention and choice.
With rapid change and more sophisticated customers, it has become very important that financial institutions determine the factors which are pertinent to the
customers’ selection process. With the advent of interstate and international banking, the trend towards larger bank holding companies, and innovations in the
market place, the customers have greater and greater difficulty in determining one institution from another. Therefore, the current problem for the financial
services industry is to determine the basis on which customers, both depositors and borrowers, make their selection process for financial services (Boyde et.al
1994) R PREFE.
Understanding customers’ banks selection criteria has been argued to be helpful to banks in identifying the appropriate marketing strategies needed to attract
new customers and retain existing ones. (Kaynak and Kucukemiroglu, 1992). Indeed, the growing competitiveness in the Banking industry. (Grady and Spencer,
1990), and similarity of services offered by Banks. (Holstius and Kaynak, 1995), have made it increasingly important that Banks identify the factors that determine
the basis upon which customers choose between providers of financial services. Consequently, the issue of “how customers select Banks” has been given consid-
erable attention by researchers (for example: Anderson et al. 1976; Evans 1979; (Kaynack and Yavas,1985); (Ross, 1989); (Kazeh and Decker, 1993); (Denton and
Chan, 1991); Hegazi 1995; (Metawa and Almossawi 1998); (Omar, 2007); (Kamakodi and Khan2008); (Rao, 2010). However, literature also indicates that studies
related to Bank selection criteria have been mainly conducted in the USA and some European countries. While, such studies have contributed substantially to the
literature on bank selection, their findings may not be applicable to other countries, due to differences in cultural, economic and legal environments. A set of
determinant factors that have a significant role in bank selection in one nation may prove to be insignificant in another (Rao, et.al 2010).
The various Banking systems have undergone very important changes globally. More specifically, increased competition, technological developments and the
growth of the various institutions have significantly altered the environment in which Banks operate. At the same time, many Banking activities are now performed
by non-Banking institutions. In reality, banking institutions in developed countries have started to lose their market shares, while technology has minimized trans-
action costs and the number of competitors is continuously increasing. (John, 2007). Banks are in the process of moving into a more competitive financial atmos-
phere, with a wide variety of financial products/services. No Bank can offer all products and be the best/ leading Bank for all customers. They are forced to develop
a differentiated strategy in order to find a new basis for competition. (Zineldin, 1996)
The intense competition that exists in the market for financial services presents a big challenge to the profitability of retail banking institutions of all sizes. A
common suggestion is that retail Banks ought to respond to this challenge by making better use of market segmentation techniques. (Peter and Olson, 2005) argue
that the application of more and better segmentation technique is the best strategy to meet the demands of the competitive market environment. Segmentation
offers commercial banks a powerful discriminating method of grouping bank customers categorically, so that their needs may be effectively addressed for the
purpose of preparing effective marketing strategies. The concept attempts to bridge the gap between diverse customer needs and limited company resources, by
encouraging distinct product and marketing offerings to be developed to suit the requirements of different customer segments (Assael & Roscoe, 1976); (Wind,
1978). The choice of segmentation bases is significant because an inappropriate segmentation strategy may lead to missed profit opportunities. The key is to
identify bases or variables which will produce substantial, measurable, and accessible segments which are crucial for carrying out right marketing mixes (Sun,
2009). There are several bases on which consumer markets can be segmented, including (but not limited to) geographic; demographic; psychographic to include
lifestyles, personality and social class; and behavioral-benefits sought, usage patterns, etc. In particular, demographic variables are the most commonly used base
to identify consumer groups mainly because of the ease of access to and the measurement of demographic data (Pol, 1991).
As a result, to meet the changing preferences of customers and to stay ahead of competitors, commercial banks should bound to providing quality and efficient
services so as to enhance customer service by leveraging on technology, maintenance of good qualities services and efficient service delivery standards that will
best meet customer expectations. Currently Ethiopian government is embarking on measures such as economic reforms, financial liberalization and restructuring
of financial institution. All these measures are being made having the aim of promoting a competitive environment and efficient Banking services to users espe-
cially, public. Similarly, with the coming into effect of the licensing and super using Banking business proclamation No 88/994 a couples of private commercial
F
VOLUME NO. 6 (2016), ISSUE NO. 11 (NOVEMBER) ISSN 2231-1009
INTERNATIONAL JOURNAL OF RESEARCH IN COMPUTER APPLICATION & MANAGEMENT A Monthly Double-Blind Peer Reviewed (Refereed/Juried) Open Access International e-Journal - Included in the International Serial Directories
http://ijrcm.org.in/
69
Banks have emerged and joined the market since 1994. As Ethiopian economy continues to grow and develop markets and completive structure customer’s needs
and expectations evolve and grow over time, resulting in strategies to meet customer expectation and satisfaction. Absolutely the survival of Banks relies or
depends on identifying customer’s needs and developing new ways of doing business. In line with this, the objective of this paper is to study the Bank selection
criteria employed by Corporate customers and selection for the services provided by commercial Banks in Addis Ababa City, how customers know about the
availability of Banks and their services, to ascertain and to rate the choice criteria for Bank selection. The study was conducted expecting that it do have a value to
those who are practicing (Commercial Banks), and to enhance understanding of customer preferences (selections) of commercial Banks services and customers
expectations of commercial Banks in Ethiopia.
1.2 LITERATURE REVIEW The review of the literature is divided into two parts. The first part discusses the theoretical foundation for the study, while the second part presents a survey of
previous studies.
1.2.1 THEORITICAL LITERATURE
The relevant theoretical expositions underpinning the study are the rational choice theory and competition theory. The rational choice theory provides useful
insights on the choice or selection behavior of individual customer, while the competition theory explains how firms try to win customers patronage and loyalty
through service excellence, meeting customers’ needs and providing innovative products. The choice theory otherwise referred to as rational choice theory or
rational action theory is a framework for understanding and often formally modeling social and economic behavior. Rationality, which basically expresses the idea
of wanting more rather than less of a good, is widely used as an assumption of the behavior of individuals in microeconomic models. The theory, therefore, shows
that patterns of behavior in societies reflect the choices made by individuals as they try to maximize their benefits and minimize their costs. In other words, people
make decisions about how they should act by comparing the costs and benefits of different courses of action. Consequently, patterns of behavior develop within
the societies that result from those choices.
Rational decision making entails choosing an action given one's preferences, the actions one could take, and expectations about the outcomes of those actions.
The validity of rational decision making is rooted in two complementary assumptions namely completeness and transitivity. Completeness requires that all actions
of the individual can be ranked in an order of preference (indifference between two or more is possible), while transitivity is a condition that if choice A is preferred
to B, and action B is preferred to C, then A is preferred to C. Together these assumptions form the result that given a set of exhaustive and exclusive actions to
choose from, an individual can rank them in terms of his/her preferences, and that his/her preferences are consistent. Competition in economics is best described
as the existence within a market for some good or service of a sufficient number of buyers and sellers such that no single market participant has enough influence
to determine the going price of the good or service. Competition occurs when two or more organizations act independently to supply their products to the same
group of consumers. Direct competition exists where organizations produce similar products that appeal to the same group of consumers. Indirect competition
exists when different firms make or sell items which although not in head to head competition still compete for the same money in the customers pocket. Both
direct and indirect competitions cause commercial firms to develop new products, services and technologies, which would give consumers greater selection and
better products. The greater selection typically causes lower prices for the products, compared to what the price would be if there was no competition (monopoly)
or little competition. Thus, the competitive strategy of firms is dependent upon consumers’ choice characteristics which tend to influence firms productive decision
towards the satisfaction of consumers preferences. The relevance of rational choice, where people compare the costs and benefits of certain actions, is easy to
see in respect of bank selection behavior of customers. Since people want to get the most useful products/services at the lowest price/convenience, they will
judge the benefits/significance of a certain banks services/offers (for example, how useful is it or how attractive is it) compared to similar ones from others banks.
Then they will compare prices or costs and benefits. In general, people will choose the bank that they perceive provides the greatest reward or benefits at the
lowest cost, given their preferences. According to Kaynak and Kucukemiroglu (1992) and Hull (2002), the banking industry is highly competitive, with banks not
only competing among each other, but also with non-banks and other financial institutions. The reason is why because most bank products development is easy
to duplicate and when banks provide identical services, they can only distinguish themselves on the basis of price and quality. Consequently, customers’ retention
is potentially an effective tool that banks can use to gain a strategic advantage and survive in today’s ever-increasing banking competitive environment
1.2.2 EMPIRICAL LITERATURE
To analysis and investigate the factors that affect customers Bank selection criteria various empirical studies have been made so far. (Almossawi, 2001) conducted
a survey on Bank section criteria employed by college students in Bahrain. The sample for this study was selected from among a population of 10,000 students of
the University of Bahrain; representing young people aged 19-24. The required data were collected through a specially designed questionnaire. The questionnaires
were passed to and received from the students through their teachers. Therefore, the required number of respondents (1,000 students) was easily achieved. The
questionnaire consisted of two sections. The first part elicited demographic information from the respondents that was deemed necessary to achieve the objec-
tives of the study. The second part of the questionnaire asked respondents to rate the relative importance of 30 potential influencing factors, on their selection
decision of commercial banks, using a five point Likert type importance scale ranging from “very important'' to “not important at all''. The factors were adapted
from the relevant literature, personal experience, interviews with five local bank officials, and 30 students in the University of Bahrain. This attempt resulted in
having a list of 37 selection criteria. A questionnaire pretest indicated that students were not familiar with seven of the chosen factors; therefore, the list was
reduced to 30 factors, which served as potential bank selection criteria for this study. In answering the questions, respondents were assured of the confidentiality
of their responses and their names were not solicited. The questionnaire was originally written in English and then translated into Arabic by an official translator
and back-translated by a second official translator to ensure clarity and interpretation of meaning. A certified company in Bahrain called Panorama Media did
translation and back-translation.
By conducting the study, the researcher found that convenient of ATM locations, availability of ATM in several locations, Bank’s reputation, 24 hours’ availability
of ATM services and availability of parking space nearby as the five most influential factors for bank selection. (Eshgi and Hedayatnia,2011) found that quality of
services, innovation in Banking services, staff behavior and attitude and price are factors that customers most importantly look for before they select or prefer
Bank by the study made in Iranian Retail Banking Industry. The study was conducted in the city of Tehran (the largest city of Iran and its capital) since all Iranian
banks have many branch offices in the city. The data for the research was gathered from 798 customers of banks through a structured questionnaire covering the
different attributes that customers perceive as important when selecting which banks to support. Given the nature of the study, a non-probability (convenience)
sampling was chosen. The questionnaire was consisted of two sections. In first part of questionnaire, respondents were asked to rate the relative importance of
38 influencing factors on their selection decision of commercial retail banks, using a five-point Likert type importance scale ranging from ''very important'' to ''not
important at all''. The factors were extracted based on relevant literature and interviews with five bank officials and adopted to the Iranian banking system.
(Phuong and Har, 2000) under Bank selection decisions in Singapore using the analytical hierarchy process made a survey. The study was made to determine the
product/service characteristics that undergraduate students consider important when selecting a bank and how these characteristics are prioritized according to
their importance, to determine undergraduates students relative preferences of post office bank (POSB) and the others big four banks in Singapore; development
Bank of Singapore (DBS),Overseas Union Bank (OUB),overseas Chinese Banking Corporation (OCBC)with respect to each characteristics considered in decision
process and finally to determine the undergraduate students over all preferences of the banks and the managerial implication of the finding results bank decision
making. Accordingly, the finding of the study depicts that that high interest rate on accounts of customers, commitment, and location of Bank branch, quality of
services, self Banking facilities, low charges, low loan rates, long operating hours, and recommendation as the most crucial factors for selection of banks. Similarly,
(Boyd.et.al, 1994) made an analysis on customer preferences for financial service using a telephone survey, ten selection criteria provided relative to various
demographic characteristics of 188 randomly selected households in south eastern city of USA taking ten (10) selection criteria. With the need to differentiate in
mind, the research was undertaken to: determine the relative strengths of factors used in the selection process, and identify the orientation of potential customers
relative to those factors and corresponding behavioral and demographic characteristics. Accordingly, they found that reputation, Interests on savings accounts,
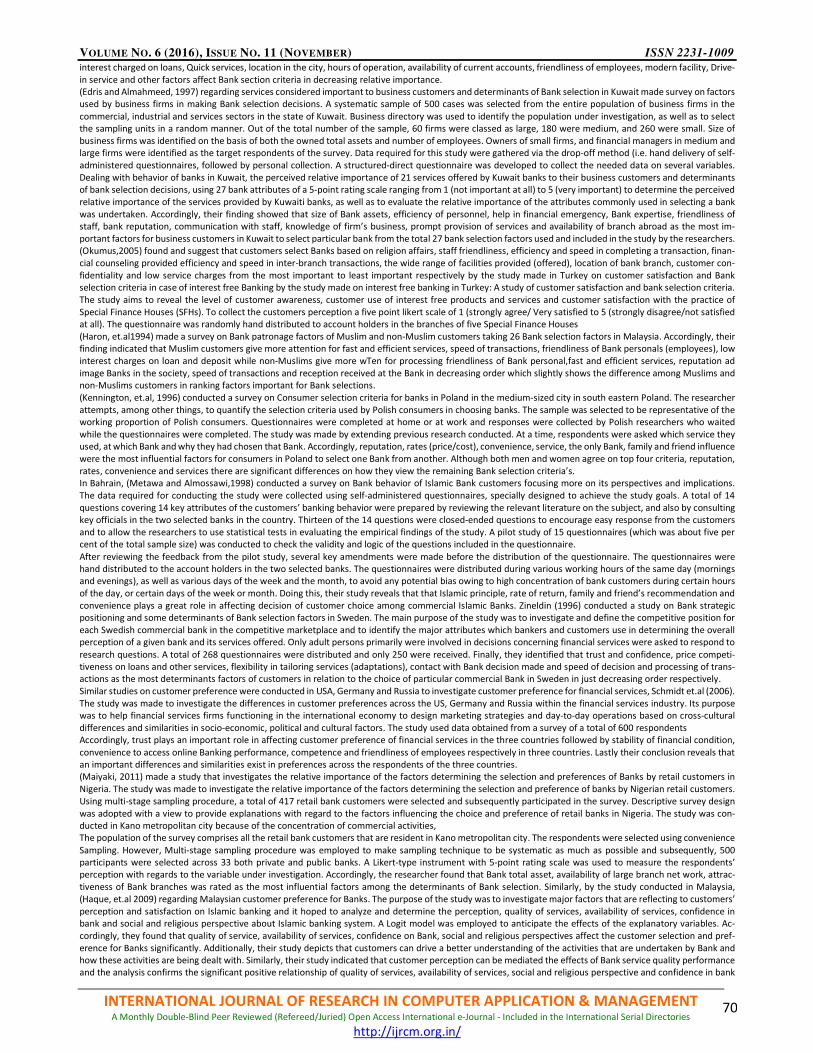
VOLUME NO. 6 (2016), ISSUE NO. 11 (NOVEMBER) ISSN 2231-1009
INTERNATIONAL JOURNAL OF RESEARCH IN COMPUTER APPLICATION & MANAGEMENT A Monthly Double-Blind Peer Reviewed (Refereed/Juried) Open Access International e-Journal - Included in the International Serial Directories
http://ijrcm.org.in/
70
interest charged on loans, Quick services, location in the city, hours of operation, availability of current accounts, friendliness of employees, modern facility, Drive-
in service and other factors affect Bank section criteria in decreasing relative importance.
(Edris and Almahmeed, 1997) regarding services considered important to business customers and determinants of Bank selection in Kuwait made survey on factors
used by business firms in making Bank selection decisions. A systematic sample of 500 cases was selected from the entire population of business firms in the
commercial, industrial and services sectors in the state of Kuwait. Business directory was used to identify the population under investigation, as well as to select
the sampling units in a random manner. Out of the total number of the sample, 60 firms were classed as large, 180 were medium, and 260 were small. Size of
business firms was identified on the basis of both the owned total assets and number of employees. Owners of small firms, and financial managers in medium and
large firms were identified as the target respondents of the survey. Data required for this study were gathered via the drop-off method (i.e. hand delivery of self-
administered questionnaires, followed by personal collection. A structured-direct questionnaire was developed to collect the needed data on several variables.
Dealing with behavior of banks in Kuwait, the perceived relative importance of 21 services offered by Kuwait banks to their business customers and determinants
of bank selection decisions, using 27 bank attributes of a 5-point rating scale ranging from 1 (not important at all) to 5 (very important) to determine the perceived
relative importance of the services provided by Kuwaiti banks, as well as to evaluate the relative importance of the attributes commonly used in selecting a bank
was undertaken. Accordingly, their finding showed that size of Bank assets, efficiency of personnel, help in financial emergency, Bank expertise, friendliness of
staff, bank reputation, communication with staff, knowledge of firm’s business, prompt provision of services and availability of branch abroad as the most im-
portant factors for business customers in Kuwait to select particular bank from the total 27 bank selection factors used and included in the study by the researchers.
(Okumus,2005) found and suggest that customers select Banks based on religion affairs, staff friendliness, efficiency and speed in completing a transaction, finan-
cial counseling provided efficiency and speed in inter-branch transactions, the wide range of facilities provided (offered), location of bank branch, customer con-
fidentiality and low service charges from the most important to least important respectively by the study made in Turkey on customer satisfaction and Bank
selection criteria in case of interest free Banking by the study made on interest free banking in Turkey: A study of customer satisfaction and bank selection criteria.
The study aims to reveal the level of customer awareness, customer use of interest free products and services and customer satisfaction with the practice of
Special Finance Houses (SFHs). To collect the customers perception a five point likert scale of 1 (strongly agree/ Very satisfied to 5 (strongly disagree/not satisfied
at all). The questionnaire was randomly hand distributed to account holders in the branches of five Special Finance Houses
(Haron, et.al1994) made a survey on Bank patronage factors of Muslim and non-Muslim customers taking 26 Bank selection factors in Malaysia. Accordingly, their
finding indicated that Muslim customers give more attention for fast and efficient services, speed of transactions, friendliness of Bank personals (employees), low
interest charges on loan and deposit while non-Muslims give more wTen for processing friendliness of Bank personal,fast and efficient services, reputation ad
image Banks in the society, speed of transactions and reception received at the Bank in decreasing order which slightly shows the difference among Muslims and
non-Muslims customers in ranking factors important for Bank selections.
(Kennington, et.al, 1996) conducted a survey on Consumer selection criteria for banks in Poland in the medium-sized city in south eastern Poland. The researcher
attempts, among other things, to quantify the selection criteria used by Polish consumers in choosing banks. The sample was selected to be representative of the
working proportion of Polish consumers. Questionnaires were completed at home or at work and responses were collected by Polish researchers who waited
while the questionnaires were completed. The study was made by extending previous research conducted. At a time, respondents were asked which service they
used, at which Bank and why they had chosen that Bank. Accordingly, reputation, rates (price/cost), convenience, service, the only Bank, family and friend influence
were the most influential factors for consumers in Poland to select one Bank from another. Although both men and women agree on top four criteria, reputation,
rates, convenience and services there are significant differences on how they view the remaining Bank selection criteria’s.
In Bahrain, (Metawa and Almossawi,1998) conducted a survey on Bank behavior of Islamic Bank customers focusing more on its perspectives and implications.
The data required for conducting the study were collected using self-administered questionnaires, specially designed to achieve the study goals. A total of 14
questions covering 14 key attributes of the customers’ banking behavior were prepared by reviewing the relevant literature on the subject, and also by consulting
key officials in the two selected banks in the country. Thirteen of the 14 questions were closed-ended questions to encourage easy response from the customers
and to allow the researchers to use statistical tests in evaluating the empirical findings of the study. A pilot study of 15 questionnaires (which was about five per
cent of the total sample size) was conducted to check the validity and logic of the questions included in the questionnaire.
After reviewing the feedback from the pilot study, several key amendments were made before the distribution of the questionnaire. The questionnaires were
hand distributed to the account holders in the two selected banks. The questionnaires were distributed during various working hours of the same day (mornings
and evenings), as well as various days of the week and the month, to avoid any potential bias owing to high concentration of bank customers during certain hours
of the day, or certain days of the week or month. Doing this, their study reveals that that Islamic principle, rate of return, family and friend’s recommendation and
convenience plays a great role in affecting decision of customer choice among commercial Islamic Banks. Zineldin (1996) conducted a study on Bank strategic
positioning and some determinants of Bank selection factors in Sweden. The main purpose of the study was to investigate and define the competitive position for
each Swedish commercial bank in the competitive marketplace and to identify the major attributes which bankers and customers use in determining the overall
perception of a given bank and its services offered. Only adult persons primarily were involved in decisions concerning financial services were asked to respond to
research questions. A total of 268 questionnaires were distributed and only 250 were received. Finally, they identified that trust and confidence, price competi-
tiveness on loans and other services, flexibility in tailoring services (adaptations), contact with Bank decision made and speed of decision and processing of trans-
actions as the most determinants factors of customers in relation to the choice of particular commercial Bank in Sweden in just decreasing order respectively.
Similar studies on customer preference were conducted in USA, Germany and Russia to investigate customer preference for financial services, Schmidt et.al (2006).
The study was made to investigate the differences in customer preferences across the US, Germany and Russia within the financial services industry. Its purpose
was to help financial services firms functioning in the international economy to design marketing strategies and day-to-day operations based on cross-cultural
differences and similarities in socio-economic, political and cultural factors. The study used data obtained from a survey of a total of 600 respondents
Accordingly, trust plays an important role in affecting customer preference of financial services in the three countries followed by stability of financial condition,
convenience to access online Banking performance, competence and friendliness of employees respectively in three countries. Lastly their conclusion reveals that
an important differences and similarities exist in preferences across the respondents of the three countries.
(Maiyaki, 2011) made a study that investigates the relative importance of the factors determining the selection and preferences of Banks by retail customers in
Nigeria. The study was made to investigate the relative importance of the factors determining the selection and preference of banks by Nigerian retail customers.
Using multi-stage sampling procedure, a total of 417 retail bank customers were selected and subsequently participated in the survey. Descriptive survey design
was adopted with a view to provide explanations with regard to the factors influencing the choice and preference of retail banks in Nigeria. The study was con-
ducted in Kano metropolitan city because of the concentration of commercial activities,
The population of the survey comprises all the retail bank customers that are resident in Kano metropolitan city. The respondents were selected using convenience
Sampling. However, Multi-stage sampling procedure was employed to make sampling technique to be systematic as much as possible and subsequently, 500
participants were selected across 33 both private and public banks. A Likert-type instrument with 5-point rating scale was used to measure the respondents’
perception with regards to the variable under investigation. Accordingly, the researcher found that Bank total asset, availability of large branch net work, attrac-
tiveness of Bank branches was rated as the most influential factors among the determinants of Bank selection. Similarly, by the study conducted in Malaysia,
(Haque, et.al 2009) regarding Malaysian customer preference for Banks. The purpose of the study was to investigate major factors that are reflecting to customers’
perception and satisfaction on Islamic banking and it hoped to analyze and determine the perception, quality of services, availability of services, confidence in
bank and social and religious perspective about Islamic banking system. A Logit model was employed to anticipate the effects of the explanatory variables. Ac-
cordingly, they found that quality of service, availability of services, confidence on Bank, social and religious perspectives affect the customer selection and pref-
erence for Banks significantly. Additionally, their study depicts that customers can drive a better understanding of the activities that are undertaken by Bank and
how these activities are being dealt with. Similarly, their study indicated that customer perception can be mediated the effects of Bank service quality performance
and the analysis confirms the significant positive relationship of quality of services, availability of services, social and religious perspective and confidence in bank

VOLUME NO. 6 (2016), ISSUE NO. 11 (NOVEMBER) ISSN 2231-1009
INTERNATIONAL JOURNAL OF RESEARCH IN COMPUTER APPLICATION & MANAGEMENT A Monthly Double-Blind Peer Reviewed (Refereed/Juried) Open Access International e-Journal - Included in the International Serial Directories
http://ijrcm.org.in/
71
with customers’ perception about Islamic bank. Hence, customer perception and satisfaction can be considered as the key contrast to Bank for overall perfor-
mance. (Mokhlis,2009) conducted a study in Malaysia. The study was conducted to analysis Gender based choice decisions regarding determinants of choice
criteria in Malaysia’s retail Banking. The sample for the study was selected from among undergraduate students of University Malaysia Terengganu, who were
registered on a range of degree courses. Given the nature of the study, a non- probability (convenience) sampling was chosen and a total of 400 sets of question-
naires were distributed during regular class session. Students were assured of the confidentiality of their responses and they had been told not to write their
names. Students were given approximately 20 minutes to complete the questionnaire and also prevented from communicating with each other while the survey
was in progress to avoid any bias of information. From a total of 400 questionnaires distributed, 390 were returned Accordingly, the researcher found that male
respondents decision of choosing Bank was highly affected by security feeling, ATM services, financial benefits, service promotion, branch location, proximity,
marketing promotion, Attractiveness of branch buildings and people influences while female respondents rated ATM service as first criteria followed by security
feeling, services promotion, proximity, financial benefits, branch location, attractiveness of bank branch building,marketing promotion and lastly by people influ-
ences.
Another study made in Malaysia was by (Safiek et.al, 2008) has conducted survey on the case of under graduate students regarding commercial Bank selection
and found that security is the most determinate factor effecting student Bank selection decision followed by ATM services, financial services, service provision,
and proximity and branch location. However, their finding’s response did not constitute homogenous group since gender stream of study, ethnicity and number
of saving accounts held produced different prioritized factors in Bank selection. Similarly, (Jantan, et.al, 1998) conducted a survey on relationship between Bank
attributes and demographic factors that determine customer choice of retail banking in Malaysia. Taking both local as well as foreign Banks they found that
credibility is of highest importance followed by range of services terms of payments, physical facilities and media and social influence in influencing the bank choice
decision among any of the demographic characteristics of respondents.
In India, (Komal,2009) made a survey on 3 selected commercial Banks of India to analysis the impact of ATM on customer satisfaction and found that bank with
less branches are more satisfying their ATM card users than old banks with highest branch networks even if they do have less material coverage of ATM network
sites.
In Bangladesh (Rashid and Hassan, 2009) conducted survey on customer demographics affecting banks selection criteria and market segmentation by taking
domestic Islamic Banks of Bangladesh and found that female respondents gave highest wTen for core Banking services like availability of basic Banking facility
along with marketing programmers and uniformity of services while male respondents gave more attention to corporal efficiency like faster transaction and
document processing, efficient managers, and knowledge of customer business. Regarding their marital status married respondents give highest importance for
core Banking, corporal efficiency and compliances while unmarried respondents gave due consideration for corporal efficiency core Banking and compliances. As
far as educational level is considered they found that undergraduate education level respondents are highly affected by corporal efficiency while respondents with
educational level of post graduate level is more affected by corporal efficiency showing no significant differences from undergraduates. A comparative analysis
among three Generation Banks in Bangladesh was made regarding promotional activity involvement of commercial Banks, (Samina and Alam 2011). The study was
made to analyze the promotion activities of some selected private commercial Banks in Bangladesh. Accordingly, promotional tools applied by private commercial
Banks were analyzed. Similarly, the difference in promotion mix of three generation Banks as well as the relationship between promotional activities of Banks and
their deposit collection was analyzed. By analyzing the promotional activities of three Generation Banks, the researchers found that the application of promotion
tools varies and there is significant difference in the involvement of promotion tools among the three generation Banks in Bangladesh. Finally, they concluded that
promotional activities have immense significances for the Banking industry in Bangladesh and Banks for all generations are driving to adopt new dimensions of
promotion to utilize the tool effectively and efficiently.
(Frimpong, 1999) made survey on patronage behavior for Ghanaian the characteristics looked for when Ghanaian Bank customers open a Bank account. The results
of the study were based on 225 multiple choice questionnaires filled in during customer’s interviews inside 50 bank branches. As a result, they found that Ghanaian
Bank customers choose a bank based on understanding and rates of interests. However, Ghanaian Bank customers are resistant to long term investment, and the
most effective media that best inform customers of bank services were word of mouth radio and Television.
In Singapore (Tan and Chua, 1986) made a survey under the study on oriental culture taking “Intention, Attitude and social influence in bank selection into consid-
eration. A mail questionnaire survey of 87 subjects reveal that social factors are a stronger influence than other variables, probably due to the fact that social and
other family ties are closer in oriental culture and that consumers are more vulnerable to advice from friends, neighbors and family members. According to the
researches’ finding traditional bank selection criteria considered important by many bankers may be less important factors in the oriental cultures. Similarly, the
researchers’ finding dictates that friendly service is important when social factors are not taken into account. But location is found to be not dominant factor since
Singapore (the city on which the survey has made) is small city and most banks are conveniently located.
Another study made on bank selection criteria in the banking industry is one made by (katircioglul et.al, 2011). The study was made empirically to investigate
customers of Romania. From Romania two cities were selected (i.e. Bucharest and Constanta). Taking 248 students as respondents from the two cities, the follow-
ing factors have found significantly affecting Bank selection preferences of the customer. These are the number of ATM booth, availability of telephone and
internet banking, giving personal attention to customer, reputation and image of banks, confidentiality of bank for customer records, appearance of staff to be
presentable and the number of branch offices around the country. The study also investigated that bank selection factors do not largely differ from one another
with some exceptions covering the least important ones for the customer living in Romania.
A quantitative methodology that used 7033 customers was employed to analysis trends of the relative importance of choice criteria in respect of selecting retail
Banks by (Devlin and Garrard 2004). Their study isolates those criteria which have become significantly more important in motivating choice overtime and those
which have significantly less important. Accordingly, their finding showed that the influence of recommendation has increased significantly and is now most
important choice criteria. Other factors which have also increased in importance are offering of incentives, having a wide product range and economic factors such
as interest rate to be paid and fees and charges levied. Location factors such as choosing a bank close to home or work place have decreased significantly in
importance in motivating choice. Certain criteria have decreased significantly in importance in motivating choice. Certain criteria have remained broadly constant
through time, amongst them, and perhaps surprisingly, are choosing on the basic of bank image and reputation as well as expectation about the level of services.
(Martenson, 1985) in Sweden made an investigation regarding consumer choice criteria in retail bank selection. The study focused more on whether consumers
select their banks in conscious fashion or not. Accordingly, survey results made on 558 Swedish bank customers by the researcher including 53 bank branch
managers indicated that the choices of respondents are random. However, bank locations, availability of loans, payment of salary through certain banks are
reasons for choice as it is the influence of parents’ choices. Hence, choice is most probably a result of match between bank image and consumer interests.
Viewing customers on the basis of age grouping is valuable in terms of product development, promotion and evaluation delivery system. Research into the users
of 31 retail banks in mid-western United States of America indicates that there is greater chance of success in promoting certain products to particular age group,
and that product usage tends to support the assumption that user age is a primary factor in bank product selection. Accordingly, the close association between
customer age and product usage suggests a life cycle rather than a strict segmentation approach to marketing, (Stanley, 1985).
In Hong Kong (Denton and Chan, 1991) made a survey under bank selection criteria of multiple bank users in Hong Kong in retail sectors. The research used survey
questionnaire and their survey includes analyses of the number of banks used by each person, the types of service used at each bank and the factors that influence
this type of consumer behavior. Accordingly, their study reveals that risk reduction, convenience in terms of number of branches and Automatic Teller Machine,
relative advantage of selected banks prestige, need for credit and credit cards and other special circumstance heavily influenced the customers’ bank selection
decision. Similarly, statistically significant differences were found in the evaluation of the relative importance of these factors on the multiple banking behaviors
based on sex, age, marital status, and income and education discriminators.
(Devlin and Gerard, 2005) made a qualitative methodology incorporating 495 respondents is employed so as to study customer choice criteria to multiple bank
users. The study presents an analysis of the relative importance of various choice criteria for main and secondary banks. Accordingly, their study finding showed
that there are significant differences’ between selecting a first and secondary bank. Hence, recondition from others and offering an incentive are influential and
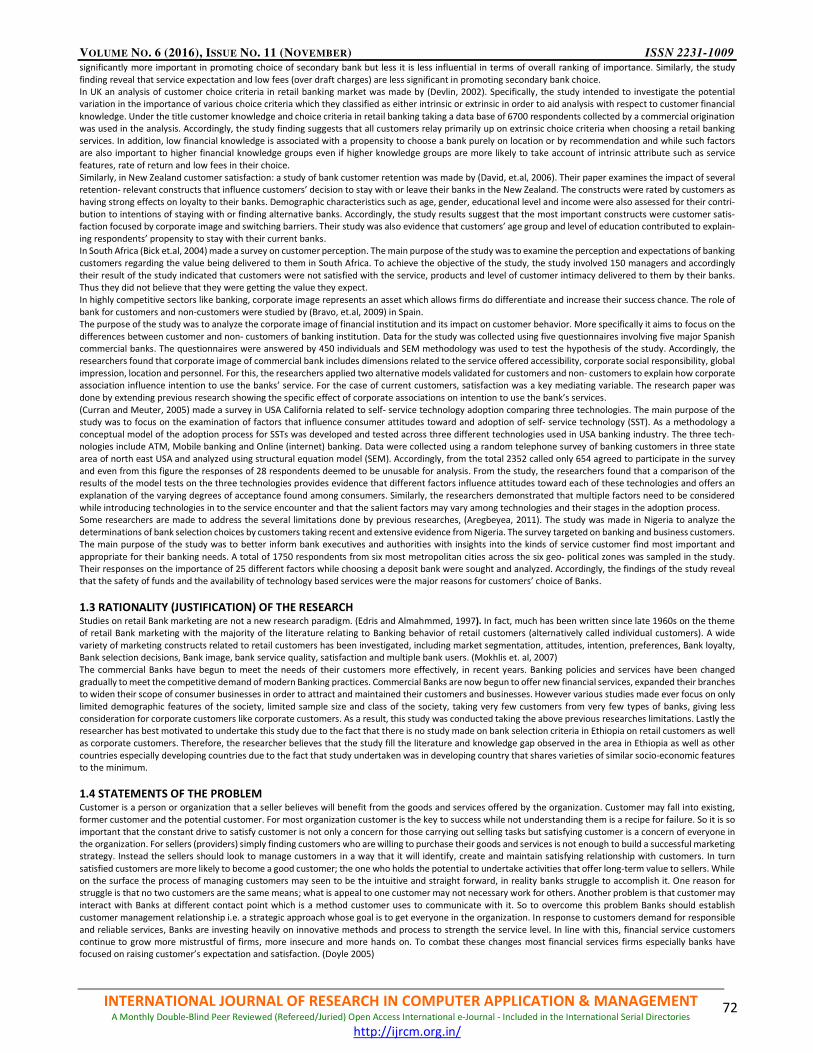
VOLUME NO. 6 (2016), ISSUE NO. 11 (NOVEMBER) ISSN 2231-1009
INTERNATIONAL JOURNAL OF RESEARCH IN COMPUTER APPLICATION & MANAGEMENT A Monthly Double-Blind Peer Reviewed (Refereed/Juried) Open Access International e-Journal - Included in the International Serial Directories
http://ijrcm.org.in/
72
significantly more important in promoting choice of secondary bank but less it is less influential in terms of overall ranking of importance. Similarly, the study
finding reveal that service expectation and low fees (over draft charges) are less significant in promoting secondary bank choice.
In UK an analysis of customer choice criteria in retail banking market was made by (Devlin, 2002). Specifically, the study intended to investigate the potential
variation in the importance of various choice criteria which they classified as either intrinsic or extrinsic in order to aid analysis with respect to customer financial
knowledge. Under the title customer knowledge and choice criteria in retail banking taking a data base of 6700 respondents collected by a commercial origination
was used in the analysis. Accordingly, the study finding suggests that all customers relay primarily up on extrinsic choice criteria when choosing a retail banking
services. In addition, low financial knowledge is associated with a propensity to choose a bank purely on location or by recommendation and while such factors
are also important to higher financial knowledge groups even if higher knowledge groups are more likely to take account of intrinsic attribute such as service
features, rate of return and low fees in their choice.
Similarly, in New Zealand customer satisfaction: a study of bank customer retention was made by (David, et.al, 2006). Their paper examines the impact of several
retention- relevant constructs that influence customers’ decision to stay with or leave their banks in the New Zealand. The constructs were rated by customers as
having strong effects on loyalty to their banks. Demographic characteristics such as age, gender, educational level and income were also assessed for their contri-
bution to intentions of staying with or finding alternative banks. Accordingly, the study results suggest that the most important constructs were customer satis-
faction focused by corporate image and switching barriers. Their study was also evidence that customers’ age group and level of education contributed to explain-
ing respondents’ propensity to stay with their current banks.
In South Africa (Bick et.al, 2004) made a survey on customer perception. The main purpose of the study was to examine the perception and expectations of banking
customers regarding the value being delivered to them in South Africa. To achieve the objective of the study, the study involved 150 managers and accordingly
their result of the study indicated that customers were not satisfied with the service, products and level of customer intimacy delivered to them by their banks.
Thus they did not believe that they were getting the value they expect.
In highly competitive sectors like banking, corporate image represents an asset which allows firms do differentiate and increase their success chance. The role of
bank for customers and non-customers were studied by (Bravo, et.al, 2009) in Spain.
The purpose of the study was to analyze the corporate image of financial institution and its impact on customer behavior. More specifically it aims to focus on the
differences between customer and non- customers of banking institution. Data for the study was collected using five questionnaires involving five major Spanish
commercial banks. The questionnaires were answered by 450 individuals and SEM methodology was used to test the hypothesis of the study. Accordingly, the
researchers found that corporate image of commercial bank includes dimensions related to the service offered accessibility, corporate social responsibility, global
impression, location and personnel. For this, the researchers applied two alternative models validated for customers and non- customers to explain how corporate
association influence intention to use the banks’ service. For the case of current customers, satisfaction was a key mediating variable. The research paper was
done by extending previous research showing the specific effect of corporate associations on intention to use the bank’s services.
(Curran and Meuter, 2005) made a survey in USA California related to self- service technology adoption comparing three technologies. The main purpose of the
study was to focus on the examination of factors that influence consumer attitudes toward and adoption of self- service technology (SST). As a methodology a
conceptual model of the adoption process for SSTs was developed and tested across three different technologies used in USA banking industry. The three tech-
nologies include ATM, Mobile banking and Online (internet) banking. Data were collected using a random telephone survey of banking customers in three state
area of north east USA and analyzed using structural equation model (SEM). Accordingly, from the total 2352 called only 654 agreed to participate in the survey
and even from this figure the responses of 28 respondents deemed to be unusable for analysis. From the study, the researchers found that a comparison of the
results of the model tests on the three technologies provides evidence that different factors influence attitudes toward each of these technologies and offers an
explanation of the varying degrees of acceptance found among consumers. Similarly, the researchers demonstrated that multiple factors need to be considered
while introducing technologies in to the service encounter and that the salient factors may vary among technologies and their stages in the adoption process.
Some researchers are made to address the several limitations done by previous researches, (Aregbeyea, 2011). The study was made in Nigeria to analyze the
determinations of bank selection choices by customers taking recent and extensive evidence from Nigeria. The survey targeted on banking and business customers.
The main purpose of the study was to better inform bank executives and authorities with insights into the kinds of service customer find most important and
appropriate for their banking needs. A total of 1750 respondents from six most metropolitan cities across the six geo- political zones was sampled in the study.
Their responses on the importance of 25 different factors while choosing a deposit bank were sought and analyzed. Accordingly, the findings of the study reveal
that the safety of funds and the availability of technology based services were the major reasons for customers’ choice of Banks.
1.3 RATIONALITY (JUSTIFICATION) OF THE RESEARCH Studies on retail Bank marketing are not a new research paradigm. (Edris and Almahmmed, 1997). In fact, much has been written since late 1960s on the theme
of retail Bank marketing with the majority of the literature relating to Banking behavior of retail customers (alternatively called individual customers). A wide
variety of marketing constructs related to retail customers has been investigated, including market segmentation, attitudes, intention, preferences, Bank loyalty,
Bank selection decisions, Bank image, bank service quality, satisfaction and multiple bank users. (Mokhlis et. al, 2007)
The commercial Banks have begun to meet the needs of their customers more effectively, in recent years. Banking policies and services have been changed
gradually to meet the competitive demand of modern Banking practices. Commercial Banks are now begun to offer new financial services, expanded their branches
to widen their scope of consumer businesses in order to attract and maintained their customers and businesses. However various studies made ever focus on only
limited demographic features of the society, limited sample size and class of the society, taking very few customers from very few types of banks, giving less
consideration for corporate customers like corporate customers. As a result, this study was conducted taking the above previous researches limitations. Lastly the
researcher has best motivated to undertake this study due to the fact that there is no study made on bank selection criteria in Ethiopia on retail customers as well
as corporate customers. Therefore, the researcher believes that the study fill the literature and knowledge gap observed in the area in Ethiopia as well as other
countries especially developing countries due to the fact that study undertaken was in developing country that shares varieties of similar socio-economic features
to the minimum.
1.4 STATEMENTS OF THE PROBLEM Customer is a person or organization that a seller believes will benefit from the goods and services offered by the organization. Customer may fall into existing,
former customer and the potential customer. For most organization customer is the key to success while not understanding them is a recipe for failure. So it is so
important that the constant drive to satisfy customer is not only a concern for those carrying out selling tasks but satisfying customer is a concern of everyone in
the organization. For sellers (providers) simply finding customers who are willing to purchase their goods and services is not enough to build a successful marketing
strategy. Instead the sellers should look to manage customers in a way that it will identify, create and maintain satisfying relationship with customers. In turn
satisfied customers are more likely to become a good customer; the one who holds the potential to undertake activities that offer long-term value to sellers. While
on the surface the process of managing customers may seen to be the intuitive and straight forward, in reality banks struggle to accomplish it. One reason for
struggle is that no two customers are the same means; what is appeal to one customer may not necessary work for others. Another problem is that customer may
interact with Banks at different contact point which is a method customer uses to communicate with it. So to overcome this problem Banks should establish
customer management relationship i.e. a strategic approach whose goal is to get everyone in the organization. In response to customers demand for responsible
and reliable services, Banks are investing heavily on innovative methods and process to strength the service level. In line with this, financial service customers
continue to grow more mistrustful of firms, more insecure and more hands on. To combat these changes most financial services firms especially banks have
focused on raising customer’s expectation and satisfaction. (Doyle 2005)
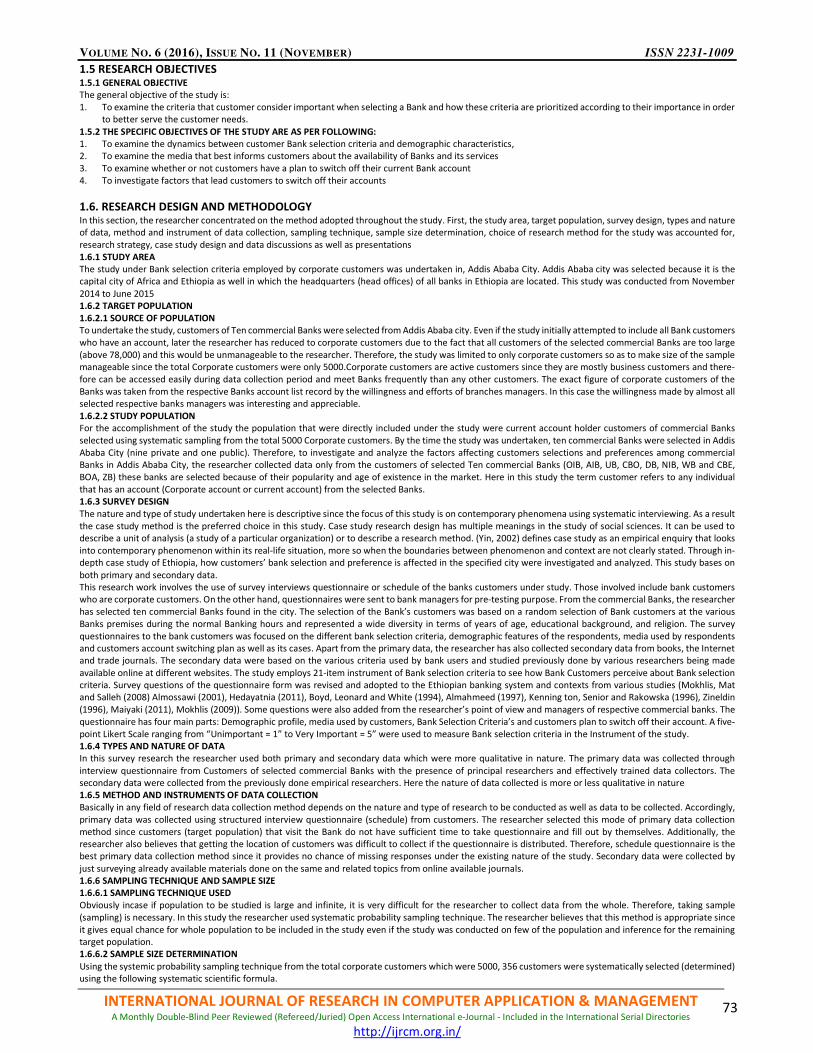
VOLUME NO. 6 (2016), ISSUE NO. 11 (NOVEMBER) ISSN 2231-1009
INTERNATIONAL JOURNAL OF RESEARCH IN COMPUTER APPLICATION & MANAGEMENT A Monthly Double-Blind Peer Reviewed (Refereed/Juried) Open Access International e-Journal - Included in the International Serial Directories
http://ijrcm.org.in/
73
1.5 RESEARCH OBJECTIVES 1.5.1 GENERAL OBJECTIVE
The general objective of the study is:
1. To examine the criteria that customer consider important when selecting a Bank and how these criteria are prioritized according to their importance in order
to better serve the customer needs.
1.5.2 THE SPECIFIC OBJECTIVES OF THE STUDY ARE AS PER FOLLOWING:
1. To examine the dynamics between customer Bank selection criteria and demographic characteristics,
2. To examine the media that best informs customers about the availability of Banks and its services
3. To examine whether or not customers have a plan to switch off their current Bank account
4. To investigate factors that lead customers to switch off their accounts
1.6. RESEARCH DESIGN AND METHODOLOGY In this section, the researcher concentrated on the method adopted throughout the study. First, the study area, target population, survey design, types and nature
of data, method and instrument of data collection, sampling technique, sample size determination, choice of research method for the study was accounted for,
research strategy, case study design and data discussions as well as presentations
1.6.1 STUDY AREA
The study under Bank selection criteria employed by corporate customers was undertaken in, Addis Ababa City. Addis Ababa city was selected because it is the
capital city of Africa and Ethiopia as well in which the headquarters (head offices) of all banks in Ethiopia are located. This study was conducted from November
2014 to June 2015
1.6.2 TARGET POPULATION
1.6.2.1 SOURCE OF POPULATION
To undertake the study, customers of Ten commercial Banks were selected from Addis Ababa city. Even if the study initially attempted to include all Bank customers
who have an account, later the researcher has reduced to corporate customers due to the fact that all customers of the selected commercial Banks are too large
(above 78,000) and this would be unmanageable to the researcher. Therefore, the study was limited to only corporate customers so as to make size of the sample
manageable since the total Corporate customers were only 5000.Corporate customers are active customers since they are mostly business customers and there-
fore can be accessed easily during data collection period and meet Banks frequently than any other customers. The exact figure of corporate customers of the
Banks was taken from the respective Banks account list record by the willingness and efforts of branches managers. In this case the willingness made by almost all
selected respective banks managers was interesting and appreciable.
1.6.2.2 STUDY POPULATION
For the accomplishment of the study the population that were directly included under the study were current account holder customers of commercial Banks
selected using systematic sampling from the total 5000 Corporate customers. By the time the study was undertaken, ten commercial Banks were selected in Addis
Ababa City (nine private and one public). Therefore, to investigate and analyze the factors affecting customers selections and preferences among commercial
Banks in Addis Ababa City, the researcher collected data only from the customers of selected Ten commercial Banks (OIB, AIB, UB, CBO, DB, NIB, WB and CBE,
BOA, ZB) these banks are selected because of their popularity and age of existence in the market. Here in this study the term customer refers to any individual
that has an account (Corporate account or current account) from the selected Banks.
1.6.3 SURVEY DESIGN
The nature and type of study undertaken here is descriptive since the focus of this study is on contemporary phenomena using systematic interviewing. As a result
the case study method is the preferred choice in this study. Case study research design has multiple meanings in the study of social sciences. It can be used to
describe a unit of analysis (a study of a particular organization) or to describe a research method. (Yin, 2002) defines case study as an empirical enquiry that looks
into contemporary phenomenon within its real-life situation, more so when the boundaries between phenomenon and context are not clearly stated. Through in-
depth case study of Ethiopia, how customers’ bank selection and preference is affected in the specified city were investigated and analyzed. This study bases on
both primary and secondary data.
This research work involves the use of survey interviews questionnaire or schedule of the banks customers under study. Those involved include bank customers
who are corporate customers. On the other hand, questionnaires were sent to bank managers for pre-testing purpose. From the commercial Banks, the researcher
has selected ten commercial Banks found in the city. The selection of the Bank’s customers was based on a random selection of Bank customers at the various
Banks premises during the normal Banking hours and represented a wide diversity in terms of years of age, educational background, and religion. The survey
questionnaires to the bank customers was focused on the different bank selection criteria, demographic features of the respondents, media used by respondents
and customers account switching plan as well as its cases. Apart from the primary data, the researcher has also collected secondary data from books, the Internet
and trade journals. The secondary data were based on the various criteria used by bank users and studied previously done by various researchers being made
available online at different websites. The study employs 21-item instrument of Bank selection criteria to see how Bank Customers perceive about Bank selection
criteria. Survey questions of the questionnaire form was revised and adopted to the Ethiopian banking system and contexts from various studies (Mokhlis, Mat
and Salleh (2008) Almossawi (2001), Hedayatnia (2011), Boyd, Leonard and White (1994), Almahmeed (1997), Kenning ton, Senior and Rakowska (1996), Zineldin
(1996), Maiyaki (2011), Mokhlis (2009)). Some questions were also added from the researcher’s point of view and managers of respective commercial banks. The
questionnaire has four main parts: Demographic profile, media used by customers, Bank Selection Criteria’s and customers plan to switch off their account. A five-
point Likert Scale ranging from “Unimportant = 1” to Very Important = 5” were used to measure Bank selection criteria in the Instrument of the study.
1.6.4 TYPES AND NATURE OF DATA
In this survey research the researcher used both primary and secondary data which were more qualitative in nature. The primary data was collected through
interview questionnaire from Customers of selected commercial Banks with the presence of principal researchers and effectively trained data collectors. The
secondary data were collected from the previously done empirical researchers. Here the nature of data collected is more or less qualitative in nature
1.6.5 METHOD AND INSTRUMENTS OF DATA COLLECTION
Basically in any field of research data collection method depends on the nature and type of research to be conducted as well as data to be collected. Accordingly,
primary data was collected using structured interview questionnaire (schedule) from customers. The researcher selected this mode of primary data collection
method since customers (target population) that visit the Bank do not have sufficient time to take questionnaire and fill out by themselves. Additionally, the
researcher also believes that getting the location of customers was difficult to collect if the questionnaire is distributed. Therefore, schedule questionnaire is the
best primary data collection method since it provides no chance of missing responses under the existing nature of the study. Secondary data were collected by
just surveying already available materials done on the same and related topics from online available journals.
1.6.6 SAMPLING TECHNIQUE AND SAMPLE SIZE
1.6.6.1 SAMPLING TECHNIQUE USED
Obviously incase if population to be studied is large and infinite, it is very difficult for the researcher to collect data from the whole. Therefore, taking sample
(sampling) is necessary. In this study the researcher used systematic probability sampling technique. The researcher believes that this method is appropriate since
it gives equal chance for whole population to be included in the study even if the study was conducted on few of the population and inference for the remaining
target population.
1.6.6.2 SAMPLE SIZE DETERMINATION
Using the systemic probability sampling technique from the total corporate customers which were 5000, 356 customers were systematically selected (determined)
using the following systematic scientific formula.

VOLUME NO. 6 (2016), ISSUE NO. 11 (NOVEMBER) ISSN 2231-1009
INTERNATIONAL JOURNAL OF RESEARCH IN COMPUTER APPLICATION & MANAGEMENT A Monthly Double-Blind Peer Reviewed (Refereed/Juried) Open Access International e-Journal - Included in the International Serial Directories
http://ijrcm.org.in/
74
2
2
)(
))((*)(
d
qpzNo =
)05(.
)5)(.5)(.96.1(=
N = 384
Where z = value for selected alpha level of 0.025 in each tail (for 95% degree of confidence) =1.96
(p)(q) = estimate of variance = 0.25
D = acceptable margin of error for proportion being estimated 5% = 0.05
Therefore, since the initial sample size is greater than 5% of the total population (5% *5000=250), Cochran’s (1977) correction formula was used to calculate the
final sample size.
These calculations is as follows
N1 = populationNo
No
/1
_
+
384/1+384/5000
N1 = 356
Where; population size = 5000
No= required return sample size according to Cochran’s formula (1977)
Ni= required return sample size because sample > 5% of population.
K =
= 5000/356
= 14
Accordingly, in each branch; a person that completes 14th transaction was approached and interviewed. This was done to include variety of respondents in the
study systematically and proportionally.
1.7 DATA PROCESSING, ANALYSIS, PRESENTATION AND INTERPRETATION The study was conducted on Bank selection criteria employed by corporate customers in Addis Ababa City by taking customers of selected nine private and One
Public commercial Banks. The collected data from each selected ten commercial banks found in Addis Ababa city was filtered, categorized and proceeded using
descriptive statistics like frequency, mean, standard deviation, by employing SPSS (Statistical Package for the Social Science) Version 19.0 Software. From the total
356 questionnaires intended to be collected, only 220 questionnaires were effectively collected and analyzed. Therefore, the overall analysis and conclusion of
the study depends on finding from 220 respondents’ that represent 62% of the total sample size. 1.7.1 Clients Demographic Characteristics
TABLE 1.7.1.2: PRESENTATION OF AGE OF RESPONDENTS
Particulars Age interval (In years) Frequency Percentage Valid Percentage Cumulative Percentage
21-35 75 34.09 34.09 34.09
36-50 95 43.18 43.18 77.27
51-64 42 19.09 19.09 96.36
>65 8 3.64 3.64 100
Total 220 100 100
Source: Field survey, 2015
Table 1.7.1.2 above depicts the distribution of respondents’ age. Accordingly, 95(43.18%) of the respondents found in age interval of 36-50 while 75(34.09%) of
them were between age interval of 21-35. Similarly, the above table reveals that 42(19.09%) of respondents age lies between 51 and 64 while only 8(3.64%) of
the respondents were above age of 65years.
Therefore, one can infer from the above table that the majority of the respondents were in the age interval of 36-50 years, which represents 43.18% of the
respondents followed by those within age interval of 21-35, which accounts 34.09%. The least proportion of respondent’s age interval was those who were above
age of 65 years, which represented 3.64% of the respondents.
TABLE 1.7.1.3: PRESENTATION OF RESPONDENTS BY LEVEL OF EDUCATION
Particulars Level of education Frequency Percentage Valid Percentage Cumulative Percentage
Primary school 92 41.82 41.82 41.82
Secondary school 108 49.09 49.09 90.91
Diploma 16 7.27 7.27 98.18
Graduate 4 1.82 1.82 100
Post graduate 0 0 0 100
Other 0 0 0 100
Total 220 100 100
Source: Field survey, 2015
Based on the survey study, the above table 1.7.1.3reveals the demographic characteristics of respondents related to educational level. Accordingly, 108(49.09%)
respondents were at secondary school level of education while 92(41.82%) of respondents completed primary school. Similarly, 16(7.27%) respondents have
diploma, while only 4 (1.82%) respondents were at graduate educational level. Surprisingly, no 0(0%) respondents found to be post graduate level and other
educational level. Thus, from the information displayed in the table 4.2 above, one can conclude that the majority of the respondents are secondary school
complete, 49.09% followed by primary school educational level, 41.82% while the least portion of the respondents (1.82%) were at graduate educational level.
TABLE 1.7.1.4: PRESENTATION OF RESPONDENTS BY RELIGION (N= 220)
Particulars Religion type Frequency Percentage Valid Percentage Cumulative Percentage
Christians 181 82.27 82.27 82.27
Muslims 39 17.73 17.73 100
Other 0 0 0 100
Total 220 100 100
Source: Field survey, 2015.
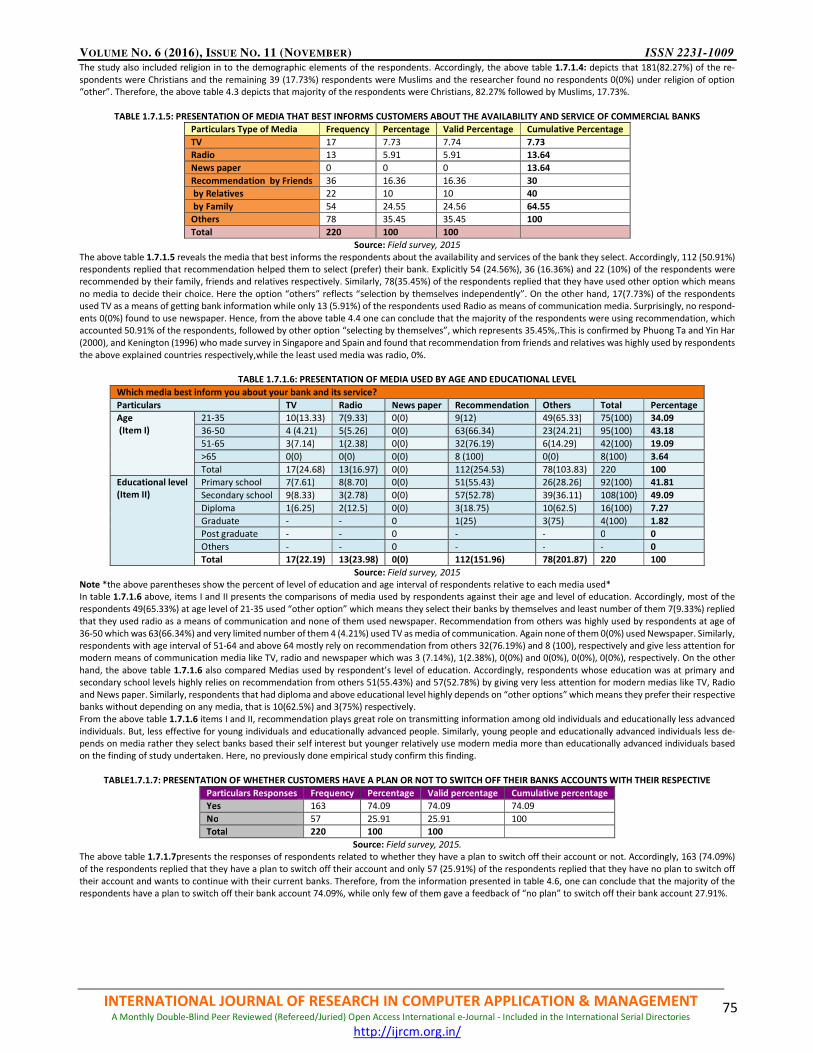
VOLUME NO. 6 (2016), ISSUE NO. 11 (NOVEMBER) ISSN 2231-1009
INTERNATIONAL JOURNAL OF RESEARCH IN COMPUTER APPLICATION & MANAGEMENT A Monthly Double-Blind Peer Reviewed (Refereed/Juried) Open Access International e-Journal - Included in the International Serial Directories
http://ijrcm.org.in/
75
The study also included religion in to the demographic elements of the respondents. Accordingly, the above table 1.7.1.4: depicts that 181(82.27%) of the re-
spondents were Christians and the remaining 39 (17.73%) respondents were Muslims and the researcher found no respondents 0(0%) under religion of option
“other”. Therefore, the above table 4.3 depicts that majority of the respondents were Christians, 82.27% followed by Muslims, 17.73%.
TABLE 1.7.1.5: PRESENTATION OF MEDIA THAT BEST INFORMS CUSTOMERS ABOUT THE AVAILABILITY AND SERVICE OF COMMERCIAL BANKS
Particulars Type of Media Frequency Percentage Valid Percentage Cumulative Percentage
TV 17 7.73 7.74 7.73
Radio 13 5.91 5.91 13.64
News paper 0 0 0 13.64
Recommendation by Friends 36 16.36 16.36 30
by Relatives 22 10 10 40
by Family 54 24.55 24.56 64.55
Others 78 35.45 35.45 100
Total 220 100 100
Source: Field survey, 2015
The above table 1.7.1.5 reveals the media that best informs the respondents about the availability and services of the bank they select. Accordingly, 112 (50.91%)
respondents replied that recommendation helped them to select (prefer) their bank. Explicitly 54 (24.56%), 36 (16.36%) and 22 (10%) of the respondents were
recommended by their family, friends and relatives respectively. Similarly, 78(35.45%) of the respondents replied that they have used other option which means
no media to decide their choice. Here the option “others” reflects “selection by themselves independently”. On the other hand, 17(7.73%) of the respondents
used TV as a means of getting bank information while only 13 (5.91%) of the respondents used Radio as means of communication media. Surprisingly, no respond-
ents 0(0%) found to use newspaper. Hence, from the above table 4.4 one can conclude that the majority of the respondents were using recommendation, which
accounted 50.91% of the respondents, followed by other option “selecting by themselves”, which represents 35.45%,.This is confirmed by Phuong Ta and Yin Har
(2000), and Kenington (1996) who made survey in Singapore and Spain and found that recommendation from friends and relatives was highly used by respondents
the above explained countries respectively,while the least used media was radio, 0%.
TABLE 1.7.1.6: PRESENTATION OF MEDIA USED BY AGE AND EDUCATIONAL LEVEL
Which media best inform you about your bank and its service?
Particulars TV Radio News paper Recommendation Others Total Percentage
Age
(Item I)
21-35 10(13.33) 7(9.33) 0(0) 9(12) 49(65.33) 75(100) 34.09
36-50 4 (4.21) 5(5.26) 0(0) 63(66.34) 23(24.21) 95(100) 43.18
51-65 3(7.14) 1(2.38) 0(0) 32(76.19) 6(14.29) 42(100) 19.09
>65 0(0) 0(0) 0(0) 8 (100) 0(0) 8(100) 3.64
Total 17(24.68) 13(16.97) 0(0) 112(254.53) 78(103.83) 220 100
Educational level
(Item II)
Primary school 7(7.61) 8(8.70) 0(0) 51(55.43) 26(28.26) 92(100) 41.81
Secondary school 9(8.33) 3(2.78) 0(0) 57(52.78) 39(36.11) 108(100) 49.09
Diploma 1(6.25) 2(12.5) 0(0) 3(18.75) 10(62.5) 16(100) 7.27
Graduate - - 0 1(25) 3(75) 4(100) 1.82
Post graduate - - 0 - - 0 0
Others - - 0 - - - 0
Total 17(22.19) 13(23.98) 0(0) 112(151.96) 78(201.87) 220 100
Source: Field survey, 2015
Note *the above parentheses show the percent of level of education and age interval of respondents relative to each media used*
In table 1.7.1.6 above, items I and II presents the comparisons of media used by respondents against their age and level of education. Accordingly, most of the
respondents 49(65.33%) at age level of 21-35 used “other option” which means they select their banks by themselves and least number of them 7(9.33%) replied
that they used radio as a means of communication and none of them used newspaper. Recommendation from others was highly used by respondents at age of
36-50 which was 63(66.34%) and very limited number of them 4 (4.21%) used TV as media of communication. Again none of them 0(0%) used Newspaper. Similarly,
respondents with age interval of 51-64 and above 64 mostly rely on recommendation from others 32(76.19%) and 8 (100), respectively and give less attention for
modern means of communication media like TV, radio and newspaper which was 3 (7.14%), 1(2.38%), 0(0%) and 0(0%), 0(0%), 0(0%), respectively. On the other
hand, the above table 1.7.1.6 also compared Medias used by respondent’s level of education. Accordingly, respondents whose education was at primary and
secondary school levels highly relies on recommendation from others 51(55.43%) and 57(52.78%) by giving very less attention for modern medias like TV, Radio
and News paper. Similarly, respondents that had diploma and above educational level highly depends on “other options” which means they prefer their respective
banks without depending on any media, that is 10(62.5%) and 3(75%) respectively.
From the above table 1.7.1.6 items I and II, recommendation plays great role on transmitting information among old individuals and educationally less advanced
individuals. But, less effective for young individuals and educationally advanced people. Similarly, young people and educationally advanced individuals less de-
pends on media rather they select banks based their self interest but younger relatively use modern media more than educationally advanced individuals based
on the finding of study undertaken. Here, no previously done empirical study confirm this finding.
TABLE1.7.1.7: PRESENTATION OF WHETHER CUSTOMERS HAVE A PLAN OR NOT TO SWITCH OFF THEIR BANKS ACCOUNTS WITH THEIR RESPECTIVE
Particulars Responses Frequency Percentage Valid percentage Cumulative percentage
Yes 163 74.09 74.09 74.09
No 57 25.91 25.91 100
Total 220 100 100
Source: Field survey, 2015.
The above table 1.7.1.7presents the responses of respondents related to whether they have a plan to switch off their account or not. Accordingly, 163 (74.09%)
of the respondents replied that they have a plan to switch off their account and only 57 (25.91%) of the respondents replied that they have no plan to switch off
their account and wants to continue with their current banks. Therefore, from the information presented in table 4.6, one can conclude that the majority of the
respondents have a plan to switch off their bank account 74.09%, while only few of them gave a feedback of “no plan” to switch off their bank account 27.91%.

VOLUME NO. 6 (2016), ISSUE NO. 11 (NOVEMBER) ISSN 2231-1009
INTERNATIONAL JOURNAL OF RESEARCH IN COMPUTER APPLICATION & MANAGEMENT A Monthly Double-Blind Peer Reviewed (Refereed/Juried) Open Access International e-Journal - Included in the International Serial Directories
http://ijrcm.org.in/
76
TABLE1.7.8: PRESENTATIONS OF REASONS WHY CUSTOMERS HAD A PLAN FOR SWITCHING THEIR BANK ACCOUNT (N=163)
Source: Field survey, 2015
The respondents were asked to list the reasons that led them to plan for switching off their bank account and this was presented in the above Table1.7.8. Accord-
ingly, 81(47.70%) of the respondents replied decrease in service quality while 40 respondents (24.54%) replied due to difficulty in getting loan. 29(17.79%) of the
respondents had planned to switch off their account simply to see other banks and 9(5.52%) of the respondents was due to area transfer (leaving) and only 4
(2.45%) of the respondents were because of the high interest rate on loan. From the above Table1.7.8 it is concluded that the majority of the respondents were
forced to plan for switching off their current bank account due to the decrease (deterioration) in quality of service, 47.70%, followed by difficulty in getting loan
which is, 24.54%. The least powerful factor for respondents to switch off their bank account was high interest rate charged on money borrowed, which represented
2.45% of the respondents.
TABLE 1.7.1.9: BANK SELECTION CRITERIA BY RESPONDENTS IRRESPECTIVE OF DEMOGRAPHIC DIFFERENCES (N=220)
Source: Field survey 2015
Table 1.7.1.9 above presents the rating of bank selection criteria by respondents irrespective of their demographic differences. The bank selection criteria were
rated and ranked based on the average responses (mean) calculated using SPSS Version 19.0 Software from response given by respondents using likert scale. The
likert scale varies from unimportant, of little important, moderately important, important and very important having numeric value of 1, 2, 3, 4 and 5, respectively.
The researcher has also included the standard deviation to see how responses deviate among individual respondents from the central value calculated for each
response. Accordingly, the above table 1.7.1.9 reveals that confidence on bank is the most important factor (4.54) for customers to choose a given bank followed
by provision of fast and efficient services (4.47), Bank reputation (goodwill and image of the bank in the society) (4.44), Friendliness of bank personnel (such as
good reception) (4.41), Private Banks (4.37) and Knowledgeable and competent staff (4.30). This finding is supported by (Almossawi 2001), (Boyd 1994), (Edris and
Almahmed 1997) (Zineldin 1996), (Kenington 1996) and (David 2006). But Newness of the bank is rated as the least and unimportant bank selection criteria (1.50)
followed by low commission rate of transferring and receiving cash (1.60), Class of people that patronize the Bank (ethnic and social class) (1.63), Government
Banks (1.74) and Promotional activity (1.97).
Particulars Frequency Percentages Valid percentage Cumulative ercentage
Area transfers 9 5.52 5.52 5.52
Just simply to try other bank 29 17.79 17.79 23.31
Decrease in service quality 81 47.70 49.70 73.01
Difficulty in getting loan 40 24.54 24.54 97.55
High interest rate on loan 4 2.45 2.45 100
Total 163 100 100
Bank selection criteria N Mean Std. Deviation Ranks
Confidence on bank 220 4.54 .615 1
Provision of fast and efficient services 220 4.47 .730 2
Bank reputation(good will and image of the bank in the society) 220 4.44 .794 3
Friendliness of bank personnel (such as good reception) 220 4.41 .792 4
Private banks 220 4.37 .858 5
Knowledgeable and competent staff 220 4.30 .946 6
Proximity to work place 220 4.28 .860 7
Availability of core banking services like computerized services 220 4.15 .817 8
Several branches 220 4.14 .979 9
Hours of operation 220 4.03 1.062 10
Availability of Technology like ATM card 220 3.98 1.116 11
Lending policy like easiness of obtaining loan 220 3.94 1.060 12
Attractiveness of the branch building (physical appearance) 220 3.05 1.519 13
Proximity to home 220 2.23 1.184 14
Ease of opening current account 220 2.03 1.060 15
Low interest on loan 220 1.98 1.102 16
Promotional activity 220 1.97 1.344 17
Government banks 220 1.74 1.115 18
Class of people that patronize the Bank (ethnic and social class) 220 1.63 .920 19
low commission rate of transferring and receiving cash 220 1.60 .862 20
Newness of the bank 220 1.50 .718 21
Valid N (list wise) 220
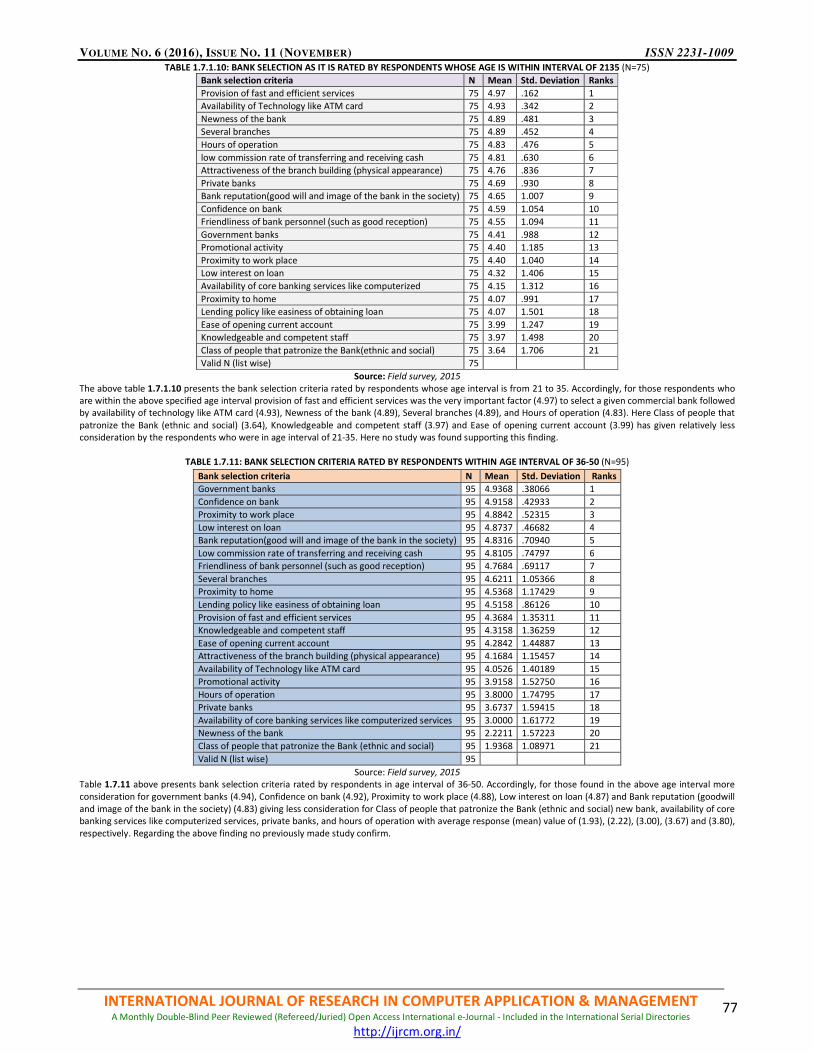
VOLUME NO. 6 (2016), ISSUE NO. 11 (NOVEMBER) ISSN 2231-1009
INTERNATIONAL JOURNAL OF RESEARCH IN COMPUTER APPLICATION & MANAGEMENT A Monthly Double-Blind Peer Reviewed (Refereed/Juried) Open Access International e-Journal - Included in the International Serial Directories
http://ijrcm.org.in/
77
TABLE 1.7.1.10: BANK SELECTION AS IT IS RATED BY RESPONDENTS WHOSE AGE IS WITHIN INTERVAL OF 2135 (N=75)
Source: Field survey, 2015
The above table 1.7.1.10 presents the bank selection criteria rated by respondents whose age interval is from 21 to 35. Accordingly, for those respondents who
are within the above specified age interval provision of fast and efficient services was the very important factor (4.97) to select a given commercial bank followed
by availability of technology like ATM card (4.93), Newness of the bank (4.89), Several branches (4.89), and Hours of operation (4.83). Here Class of people that
patronize the Bank (ethnic and social) (3.64), Knowledgeable and competent staff (3.97) and Ease of opening current account (3.99) has given relatively less
consideration by the respondents who were in age interval of 21-35. Here no study was found supporting this finding.
TABLE 1.7.11: BANK SELECTION CRITERIA RATED BY RESPONDENTS WITHIN AGE INTERVAL OF 36-50 (N=95)
Source: Field survey, 2015
Table 1.7.11 above presents bank selection criteria rated by respondents in age interval of 36-50. Accordingly, for those found in the above age interval more
consideration for government banks (4.94), Confidence on bank (4.92), Proximity to work place (4.88), Low interest on loan (4.87) and Bank reputation (goodwill
and image of the bank in the society) (4.83) giving less consideration for Class of people that patronize the Bank (ethnic and social) new bank, availability of core
banking services like computerized services, private banks, and hours of operation with average response (mean) value of (1.93), (2.22), (3.00), (3.67) and (3.80),
respectively. Regarding the above finding no previously made study confirm.
Bank selection criteria N Mean Std. Deviation Ranks
Provision of fast and efficient services 75 4.97 .162 1
Availability of Technology like ATM card 75 4.93 .342 2
Newness of the bank 75 4.89 .481 3
Several branches 75 4.89 .452 4
Hours of operation 75 4.83 .476 5
low commission rate of transferring and receiving cash 75 4.81 .630 6
Attractiveness of the branch building (physical appearance) 75 4.76 .836 7
Private banks 75 4.69 .930 8
Bank reputation(good will and image of the bank in the society) 75 4.65 1.007 9
Confidence on bank 75 4.59 1.054 10
Friendliness of bank personnel (such as good reception) 75 4.55 1.094 11
Government banks 75 4.41 .988 12
Promotional activity 75 4.40 1.185 13
Proximity to work place 75 4.40 1.040 14
Low interest on loan 75 4.32 1.406 15
Availability of core banking services like computerized 75 4.15 1.312 16
Proximity to home 75 4.07 .991 17
Lending policy like easiness of obtaining loan 75 4.07 1.501 18
Ease of opening current account 75 3.99 1.247 19
Knowledgeable and competent staff 75 3.97 1.498 20
Class of people that patronize the Bank(ethnic and social) 75 3.64 1.706 21
Valid N (list wise) 75
Bank selection criteria N Mean Std. Deviation Ranks
Government banks 95 4.9368 .38066 1
Confidence on bank 95 4.9158 .42933 2
Proximity to work place 95 4.8842 .52315 3
Low interest on loan 95 4.8737 .46682 4
Bank reputation(good will and image of the bank in the society) 95 4.8316 .70940 5
Low commission rate of transferring and receiving cash 95 4.8105 .74797 6
Friendliness of bank personnel (such as good reception) 95 4.7684 .69117 7
Several branches 95 4.6211 1.05366 8
Proximity to home 95 4.5368 1.17429 9
Lending policy like easiness of obtaining loan 95 4.5158 .86126 10
Provision of fast and efficient services 95 4.3684 1.35311 11
Knowledgeable and competent staff 95 4.3158 1.36259 12
Ease of opening current account 95 4.2842 1.44887 13
Attractiveness of the branch building (physical appearance) 95 4.1684 1.15457 14
Availability of Technology like ATM card 95 4.0526 1.40189 15
Promotional activity 95 3.9158 1.52750 16
Hours of operation 95 3.8000 1.74795 17
Private banks 95 3.6737 1.59415 18
Availability of core banking services like computerized services 95 3.0000 1.61772 19
Newness of the bank 95 2.2211 1.57223 20
Class of people that patronize the Bank (ethnic and social) 95 1.9368 1.08971 21
Valid N (list wise) 95
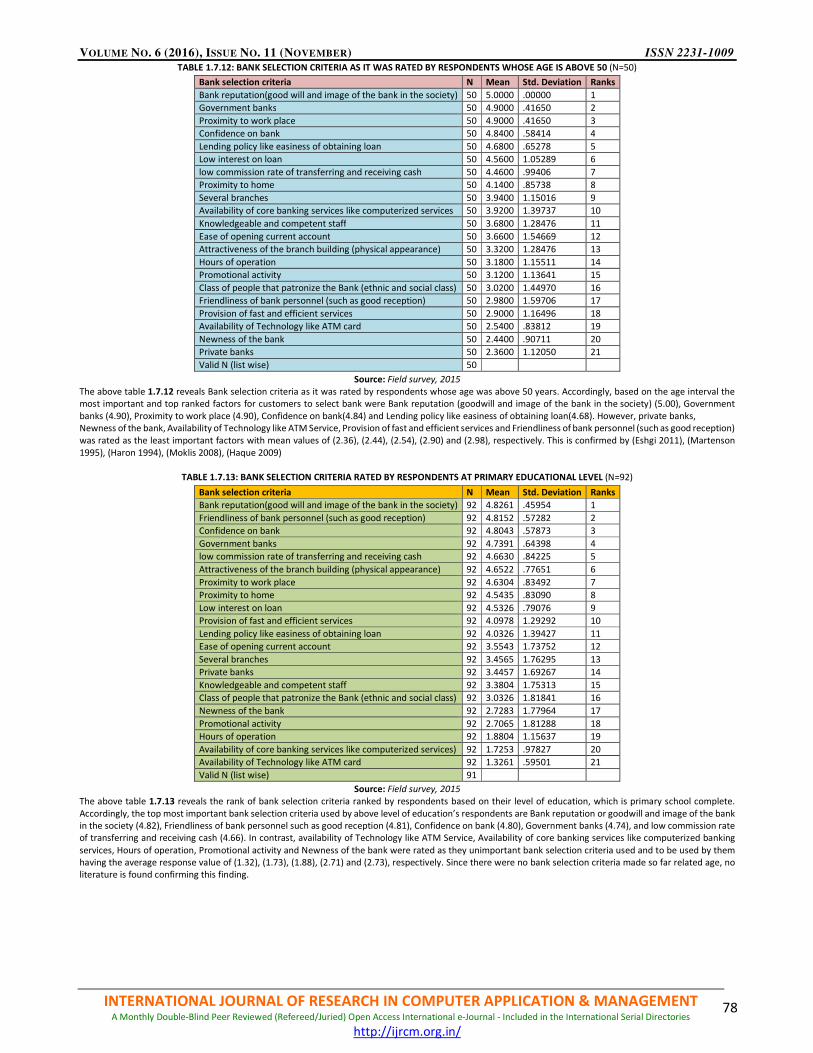
VOLUME NO. 6 (2016), ISSUE NO. 11 (NOVEMBER) ISSN 2231-1009
INTERNATIONAL JOURNAL OF RESEARCH IN COMPUTER APPLICATION & MANAGEMENT A Monthly Double-Blind Peer Reviewed (Refereed/Juried) Open Access International e-Journal - Included in the International Serial Directories
http://ijrcm.org.in/
78
TABLE 1.7.12: BANK SELECTION CRITERIA AS IT WAS RATED BY RESPONDENTS WHOSE AGE IS ABOVE 50 (N=50)
Source: Field survey, 2015
The above table 1.7.12 reveals Bank selection criteria as it was rated by respondents whose age was above 50 years. Accordingly, based on the age interval the
most important and top ranked factors for customers to select bank were Bank reputation (goodwill and image of the bank in the society) (5.00), Government
banks (4.90), Proximity to work place (4.90), Confidence on bank(4.84) and Lending policy like easiness of obtaining loan(4.68). However, private banks,
Newness of the bank, Availability of Technology like ATM Service, Provision of fast and efficient services and Friendliness of bank personnel (such as good reception)
was rated as the least important factors with mean values of (2.36), (2.44), (2.54), (2.90) and (2.98), respectively. This is confirmed by (Eshgi 2011), (Martenson
1995), (Haron 1994), (Moklis 2008), (Haque 2009)
TABLE 1.7.13: BANK SELECTION CRITERIA RATED BY RESPONDENTS AT PRIMARY EDUCATIONAL LEVEL (N=92)
Source: Field survey, 2015
The above table 1.7.13 reveals the rank of bank selection criteria ranked by respondents based on their level of education, which is primary school complete.
Accordingly, the top most important bank selection criteria used by above level of education’s respondents are Bank reputation or goodwill and image of the bank
in the society (4.82), Friendliness of bank personnel such as good reception (4.81), Confidence on bank (4.80), Government banks (4.74), and low commission rate
of transferring and receiving cash (4.66). In contrast, availability of Technology like ATM Service, Availability of core banking services like computerized banking
services, Hours of operation, Promotional activity and Newness of the bank were rated as they unimportant bank selection criteria used and to be used by them
having the average response value of (1.32), (1.73), (1.88), (2.71) and (2.73), respectively. Since there were no bank selection criteria made so far related age, no
literature is found confirming this finding.
Bank selection criteria N Mean Std. Deviation Ranks
Bank reputation(good will and image of the bank in the society) 50 5.0000 .00000 1
Government banks 50 4.9000 .41650 2
Proximity to work place 50 4.9000 .41650 3
Confidence on bank 50 4.8400 .58414 4
Lending policy like easiness of obtaining loan 50 4.6800 .65278 5
Low interest on loan 50 4.5600 1.05289 6
low commission rate of transferring and receiving cash 50 4.4600 .99406 7
Proximity to home 50 4.1400 .85738 8
Several branches 50 3.9400 1.15016 9
Availability of core banking services like computerized services 50 3.9200 1.39737 10
Knowledgeable and competent staff 50 3.6800 1.28476 11
Ease of opening current account 50 3.6600 1.54669 12
Attractiveness of the branch building (physical appearance) 50 3.3200 1.28476 13
Hours of operation 50 3.1800 1.15511 14
Promotional activity 50 3.1200 1.13641 15
Class of people that patronize the Bank (ethnic and social class) 50 3.0200 1.44970 16
Friendliness of bank personnel (such as good reception) 50 2.9800 1.59706 17
Provision of fast and efficient services 50 2.9000 1.16496 18
Availability of Technology like ATM card 50 2.5400 .83812 19
Newness of the bank 50 2.4400 .90711 20
Private banks 50 2.3600 1.12050 21
Valid N (list wise) 50
Bank selection criteria N Mean Std. Deviation Ranks
Bank reputation(good will and image of the bank in the society) 92 4.8261 .45954 1
Friendliness of bank personnel (such as good reception) 92 4.8152 .57282 2
Confidence on bank 92 4.8043 .57873 3
Government banks 92 4.7391 .64398 4
low commission rate of transferring and receiving cash 92 4.6630 .84225 5
Attractiveness of the branch building (physical appearance) 92 4.6522 .77651 6
Proximity to work place 92 4.6304 .83492 7
Proximity to home 92 4.5435 .83090 8
Low interest on loan 92 4.5326 .79076 9
Provision of fast and efficient services 92 4.0978 1.29292 10
Lending policy like easiness of obtaining loan 92 4.0326 1.39427 11
Ease of opening current account 92 3.5543 1.73752 12
Several branches 92 3.4565 1.76295 13
Private banks 92 3.4457 1.69267 14
Knowledgeable and competent staff 92 3.3804 1.75313 15
Class of people that patronize the Bank (ethnic and social class) 92 3.0326 1.81841 16
Newness of the bank 92 2.7283 1.77964 17
Promotional activity 92 2.7065 1.81288 18
Hours of operation 92 1.8804 1.15637 19
Availability of core banking services like computerized services) 92 1.7253 .97827 20
Availability of Technology like ATM card 92 1.3261 .59501 21
Valid N (list wise) 91
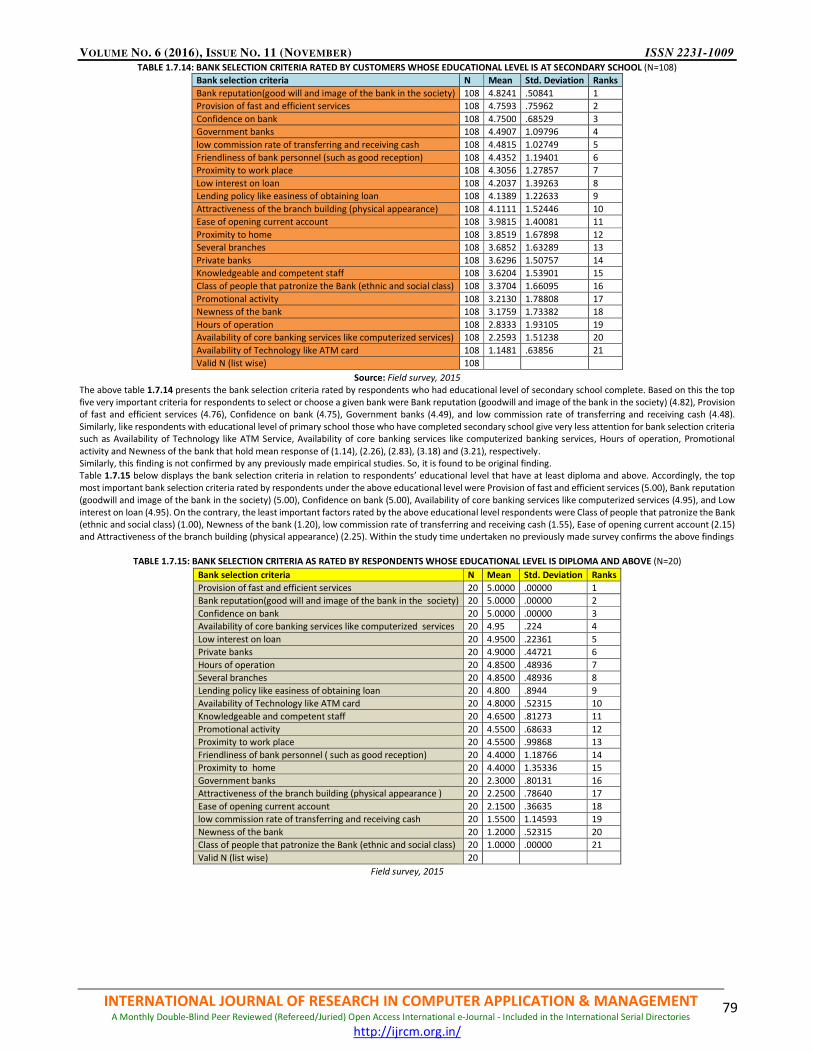
VOLUME NO. 6 (2016), ISSUE NO. 11 (NOVEMBER) ISSN 2231-1009
INTERNATIONAL JOURNAL OF RESEARCH IN COMPUTER APPLICATION & MANAGEMENT A Monthly Double-Blind Peer Reviewed (Refereed/Juried) Open Access International e-Journal - Included in the International Serial Directories
http://ijrcm.org.in/
79
TABLE 1.7.14: BANK SELECTION CRITERIA RATED BY CUSTOMERS WHOSE EDUCATIONAL LEVEL IS AT SECONDARY SCHOOL (N=108)
Source: Field survey, 2015
The above table 1.7.14 presents the bank selection criteria rated by respondents who had educational level of secondary school complete. Based on this the top
five very important criteria for respondents to select or choose a given bank were Bank reputation (goodwill and image of the bank in the society) (4.82), Provision
of fast and efficient services (4.76), Confidence on bank (4.75), Government banks (4.49), and low commission rate of transferring and receiving cash (4.48).
Similarly, like respondents with educational level of primary school those who have completed secondary school give very less attention for bank selection criteria
such as Availability of Technology like ATM Service, Availability of core banking services like computerized banking services, Hours of operation, Promotional
activity and Newness of the bank that hold mean response of (1.14), (2.26), (2.83), (3.18) and (3.21), respectively.
Similarly, this finding is not confirmed by any previously made empirical studies. So, it is found to be original finding.
Table 1.7.15 below displays the bank selection criteria in relation to respondents’ educational level that have at least diploma and above. Accordingly, the top
most important bank selection criteria rated by respondents under the above educational level were Provision of fast and efficient services (5.00), Bank reputation
(goodwill and image of the bank in the society) (5.00), Confidence on bank (5.00), Availability of core banking services like computerized services (4.95), and Low
interest on loan (4.95). On the contrary, the least important factors rated by the above educational level respondents were Class of people that patronize the Bank
(ethnic and social class) (1.00), Newness of the bank (1.20), low commission rate of transferring and receiving cash (1.55), Ease of opening current account (2.15)
and Attractiveness of the branch building (physical appearance) (2.25). Within the study time undertaken no previously made survey confirms the above findings
TABLE 1.7.15: BANK SELECTION CRITERIA AS RATED BY RESPONDENTS WHOSE EDUCATIONAL LEVEL IS DIPLOMA AND ABOVE (N=20)
Field survey, 2015
Bank selection criteria N Mean Std. Deviation Ranks
Bank reputation(good will and image of the bank in the society) 108 4.8241 .50841 1
Provision of fast and efficient services 108 4.7593 .75962 2
Confidence on bank 108 4.7500 .68529 3
Government banks 108 4.4907 1.09796 4
low commission rate of transferring and receiving cash 108 4.4815 1.02749 5
Friendliness of bank personnel (such as good reception) 108 4.4352 1.19401 6
Proximity to work place 108 4.3056 1.27857 7
Low interest on loan 108 4.2037 1.39263 8
Lending policy like easiness of obtaining loan 108 4.1389 1.22633 9
Attractiveness of the branch building (physical appearance) 108 4.1111 1.52446 10
Ease of opening current account 108 3.9815 1.40081 11
Proximity to home 108 3.8519 1.67898 12
Several branches 108 3.6852 1.63289 13
Private banks 108 3.6296 1.50757 14
Knowledgeable and competent staff 108 3.6204 1.53901 15
Class of people that patronize the Bank (ethnic and social class) 108 3.3704 1.66095 16
Promotional activity 108 3.2130 1.78808 17
Newness of the bank 108 3.1759 1.73382 18
Hours of operation 108 2.8333 1.93105 19
Availability of core banking services like computerized services) 108 2.2593 1.51238 20
Availability of Technology like ATM card 108 1.1481 .63856 21
Valid N (list wise) 108
Bank selection criteria N Mean Std. Deviation Ranks
Provision of fast and efficient services 20 5.0000 .00000 1
Bank reputation(good will and image of the bank in the society) 20 5.0000 .00000 2
Confidence on bank 20 5.0000 .00000 3
Availability of core banking services like computerized services 20 4.95 .224 4
Low interest on loan 20 4.9500 .22361 5
Private banks 20 4.9000 .44721 6
Hours of operation 20 4.8500 .48936 7
Several branches 20 4.8500 .48936 8
Lending policy like easiness of obtaining loan 20 4.800 .8944 9
Availability of Technology like ATM card 20 4.8000 .52315 10
Knowledgeable and competent staff 20 4.6500 .81273 11
Promotional activity 20 4.5500 .68633 12
Proximity to work place 20 4.5500 .99868 13
Friendliness of bank personnel ( such as good reception) 20 4.4000 1.18766 14
Proximity to home 20 4.4000 1.35336 15
Government banks 20 2.3000 .80131 16
Attractiveness of the branch building (physical appearance ) 20 2.2500 .78640 17
Ease of opening current account 20 2.1500 .36635 18
low commission rate of transferring and receiving cash 20 1.5500 1.14593 19
Newness of the bank 20 1.2000 .52315 20
Class of people that patronize the Bank (ethnic and social class) 20 1.0000 .00000 21
Valid N (list wise) 20

VOLUME NO. 6 (2016), ISSUE NO. 11 (NOVEMBER) ISSN 2231-1009
INTERNATIONAL JOURNAL OF RESEARCH IN COMPUTER APPLICATION & MANAGEMENT A Monthly Double-Blind Peer Reviewed (Refereed/Juried) Open Access International e-Journal - Included in the International Serial Directories
http://ijrcm.org.in/
80
TABLE 1.7.16: BANK SELECTION CRITERIA AS RATED BY RESPONDENTS WHOSE RELIGION IS CHRISTIANS (N=181)
Source: Field survey, 2015
The above table 1.7.16 presents the rank of bank selection criteria as rated by respondents that follows Christianity. Accordingly, Christians give more consideration
for bank selection criteria’s such as Bank reputation (goodwill and image of the bank in the society) (4.93), Confidence on bank (4.90), Several branches (4.84),
Availability of Technology like ATM Service (4.83), Availability of core banking services like computerized banking services (4.82), and Friendliness of bank personnel
(such as good reception) (4.82). Similarly, Attractiveness of the branch building (physical appearance), Class of people that patronize the Bank (ethnic and social
class), Proximity to home and Newness of the bank having average response of (1.98), (2.36), (3.190 and (3.74) were rated as the least important criteria for a
given bank selection by Christian customers. This is confirmed by Safiek and Jantan (1998)
TABLE 1.7.17: BANK SELECTION CRITERIA AS IT WAS RATED BY RESPONDENTS WHOSE RELIGION WAS MUSLIMS (N=39)
Source: Field survey, 2015
The above table 1.7.17 presents the rank of bank selection criteria as they were rated by respondents in relation to their religion. Accordingly, Confidence on Bank,
Bank reputation (goodwill and image of the bank in the society, Provision of fast and efficient services, Availability of core Banking services like computerized
services, and Friendliness of Bank personnel (such as good reception were rated as the most important criteria of Bank selection by Muslim respondents having
average response of (4.74), (4.67), (4.54), (4.46) and (4.44), respectively. Here, the least important Bank selection criteria rated are Proximity to home (1.87),
Attractiveness of the branch building (physical appearance) (2.28), Newness of the Bank (2.49), Promotional activity (2.76) and Private banks (2.77). This is con-
firmed and supported by (Haron S. 1994) who compared Muslims and non-Muslim customers and found that Fast and efficient services, Speed of transactions,
Friendliness of bank personnel and Confidentiality of bank were rated as the top rated Bank selection factor by Muslim customers.
1.8 SUMMARY OF MAJOR FINDINGS, CONCLUSIONS AND RECOMMENDATIONS 1.8.1 SUMMARY OF MAJOR FINDINGS
The study made on Bank selection criteria employed by corporate customers’ of Bank customers on ten selected commercial Banks in Addis Ababa city. The main
purpose of the study was to examine the criteria that customer consider important when selecting a Bank and how these criteria are prioritized according to their
importance in order to better serve the customer needs. By collecting both primary data and adopting descriptive survey design, the overall analysis was made
using SPSS-19 software and the overall data analysis and finding from the study is summarized as follows.
Bank selection criteria N Mean Std. Deviation Ranks
Bank reputation(good will and image of the bank in the society) 181 4.9282 .31681 1
Confidence on bank 181 4.8950 .42821 2
Several branches 181 4.8398 .60715 3
Availability of Technology like ATM card 181 4.8398 .49640 4
Availability of core banking services like computerized services 181 4.8287 .66538 5
Friendliness of bank personnel ( such as good reception) 181 4.8177 .69516 6
Provision of fast and efficient services 181 4.8066 .76096 7
Knowledgeable and competent staff 181 4.7790 .82043 8
Hours of operation 181 4.7680 .77551 9
Proximity to work place 181 4.6685 1.00031 10
Lending policy like easiness of obtaining loan 181 4.6133 .95140 11
Low interest on loan 181 4.5635 .97900 12
Government banks 181 4.5580 .90873 13
Ease of opening current account 181 4.5249 1.10840 14
Private banks 181 4.3923 .88553 15
Promotional activity 181 4.3646 1.30795 16
low commission rate of transferring and receiving cash 181 4.1602 1.38715 17
Newness of the bank 181 3.7403 1.76509 18
Proximity to home 181 3.1989 .85258 19
Class of people that patronize the Bank (ethnic and social class) 181 2.3646 1.44517 20
Attractiveness of the branch building (physical appearance) 181 1.9834 1.16655 21
Valid N (list wise) 181
Bank selection criteria N Mean Std. Deviation Ranks
Confidence on bank 39 4.7436 .49831 1
Bank reputation(good will and image of the bank in the society) 39 4.6667 .70088 2
Provision of fast and efficient services 39 4.5385 .85367 3
Availability of core banking services like computerized services 39 4.4615 1.02202 4
Friendliness of bank personnel ( such as good reception 39 4.4359 1.02070 5
Proximity to work place 39 4.4103 .78532 6
Knowledgeable and competent staff 39 4.3590 1.03840 7
Several branches 39 4.3077 1.00404 8
Hours of operation 39 4.1538 1.40560 9
Availability of Technology like ATM card 39 4.1538 1.22557 10
Lending policy like easiness of obtaining loan 39 4.0000 1.14708 11
Government banks 39 3.9231 1.15587 12
Ease of opening current account 39 3.6923 1.65679 13
low commission rate of transferring and receiving cash 39 3.5641 1.18754 14
Low interest on loan 39 3.5128 1.66815 15
Class of people that patronize the Bank (ethnic and social class) 39 3.1026 1.58604 16
Private banks 39 2.7692 1.87029 17
Promotional activity 39 2.7692 1.88431 18
Newness of the bank 39 2.4872 1.35475 19
Attractiveness of the branch building (physical appearance 39 2.2821 1.46806 20
Proximity to home 39 1.8718 1.05580 21
Valid N (list wise) 39
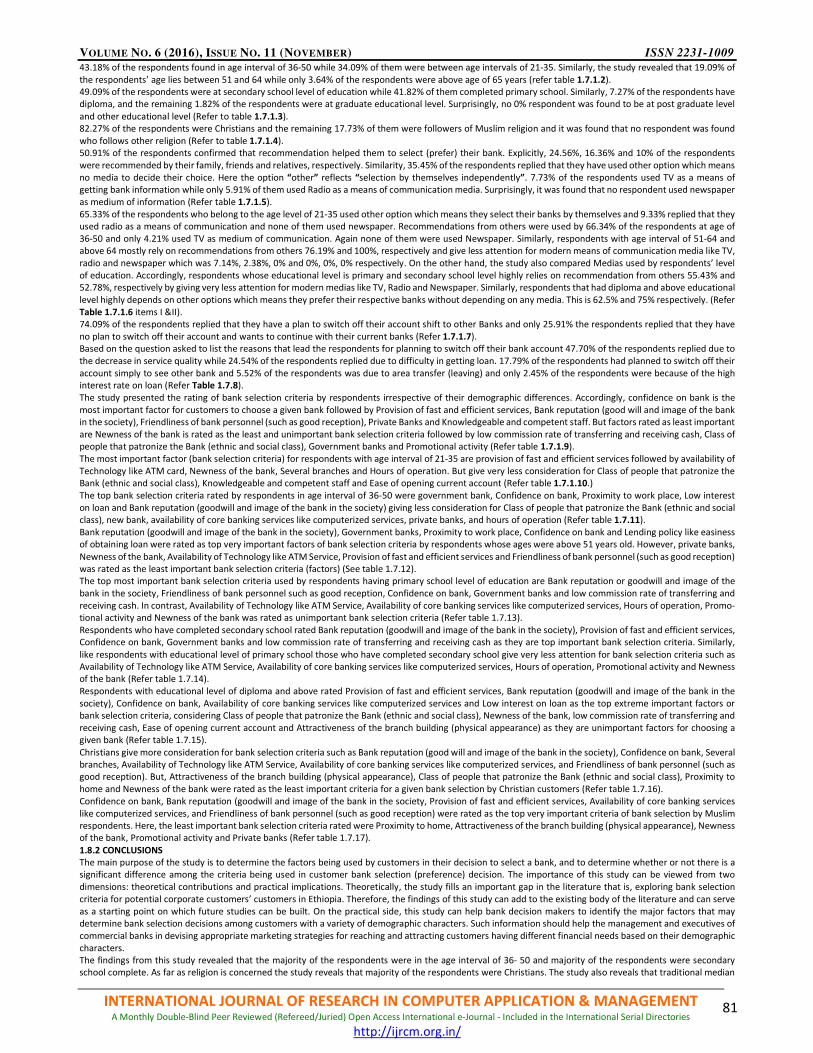
VOLUME NO. 6 (2016), ISSUE NO. 11 (NOVEMBER) ISSN 2231-1009
INTERNATIONAL JOURNAL OF RESEARCH IN COMPUTER APPLICATION & MANAGEMENT A Monthly Double-Blind Peer Reviewed (Refereed/Juried) Open Access International e-Journal - Included in the International Serial Directories
http://ijrcm.org.in/
81
43.18% of the respondents found in age interval of 36-50 while 34.09% of them were between age intervals of 21-35. Similarly, the study revealed that 19.09% of
the respondents’ age lies between 51 and 64 while only 3.64% of the respondents were above age of 65 years (refer table 1.7.1.2).
49.09% of the respondents were at secondary school level of education while 41.82% of them completed primary school. Similarly, 7.27% of the respondents have
diploma, and the remaining 1.82% of the respondents were at graduate educational level. Surprisingly, no 0% respondent was found to be at post graduate level
and other educational level (Refer to table 1.7.1.3).
82.27% of the respondents were Christians and the remaining 17.73% of them were followers of Muslim religion and it was found that no respondent was found
who follows other religion (Refer to table 1.7.1.4).
50.91% of the respondents confirmed that recommendation helped them to select (prefer) their bank. Explicitly, 24.56%, 16.36% and 10% of the respondents
were recommended by their family, friends and relatives, respectively. Similarity, 35.45% of the respondents replied that they have used other option which means
no media to decide their choice. Here the option “other” reflects “selection by themselves independently”. 7.73% of the respondents used TV as a means of
getting bank information while only 5.91% of them used Radio as a means of communication media. Surprisingly, it was found that no respondent used newspaper
as medium of information (Refer table 1.7.1.5).
65.33% of the respondents who belong to the age level of 21-35 used other option which means they select their banks by themselves and 9.33% replied that they
used radio as a means of communication and none of them used newspaper. Recommendations from others were used by 66.34% of the respondents at age of
36-50 and only 4.21% used TV as medium of communication. Again none of them were used Newspaper. Similarly, respondents with age interval of 51-64 and
above 64 mostly rely on recommendations from others 76.19% and 100%, respectively and give less attention for modern means of communication media like TV,
radio and newspaper which was 7.14%, 2.38%, 0% and 0%, 0%, 0% respectively. On the other hand, the study also compared Medias used by respondents’ level
of education. Accordingly, respondents whose educational level is primary and secondary school level highly relies on recommendation from others 55.43% and
52.78%, respectively by giving very less attention for modern medias like TV, Radio and Newspaper. Similarly, respondents that had diploma and above educational
level highly depends on other options which means they prefer their respective banks without depending on any media. This is 62.5% and 75% respectively. (Refer
Table 1.7.1.6 items I &II).
74.09% of the respondents replied that they have a plan to switch off their account shift to other Banks and only 25.91% the respondents replied that they have
no plan to switch off their account and wants to continue with their current banks (Refer 1.7.1.7).
Based on the question asked to list the reasons that lead the respondents for planning to switch off their bank account 47.70% of the respondents replied due to
the decrease in service quality while 24.54% of the respondents replied due to difficulty in getting loan. 17.79% of the respondents had planned to switch off their
account simply to see other bank and 5.52% of the respondents was due to area transfer (leaving) and only 2.45% of the respondents were because of the high
interest rate on loan (Refer Table 1.7.8).
The study presented the rating of bank selection criteria by respondents irrespective of their demographic differences. Accordingly, confidence on bank is the
most important factor for customers to choose a given bank followed by Provision of fast and efficient services, Bank reputation (good will and image of the bank
in the society), Friendliness of bank personnel (such as good reception), Private Banks and Knowledgeable and competent staff. But factors rated as least important
are Newness of the bank is rated as the least and unimportant bank selection criteria followed by low commission rate of transferring and receiving cash, Class of
people that patronize the Bank (ethnic and social class), Government banks and Promotional activity (Refer table 1.7.1.9).
The most important factor (bank selection criteria) for respondents with age interval of 21-35 are provision of fast and efficient services followed by availability of
Technology like ATM card, Newness of the bank, Several branches and Hours of operation. But give very less consideration for Class of people that patronize the
Bank (ethnic and social class), Knowledgeable and competent staff and Ease of opening current account (Refer table 1.7.1.10.)
The top bank selection criteria rated by respondents in age interval of 36-50 were government bank, Confidence on bank, Proximity to work place, Low interest
on loan and Bank reputation (goodwill and image of the bank in the society) giving less consideration for Class of people that patronize the Bank (ethnic and social
class), new bank, availability of core banking services like computerized services, private banks, and hours of operation (Refer table 1.7.11).
Bank reputation (goodwill and image of the bank in the society), Government banks, Proximity to work place, Confidence on bank and Lending policy like easiness
of obtaining loan were rated as top very important factors of bank selection criteria by respondents whose ages were above 51 years old. However, private banks,
Newness of the bank, Availability of Technology like ATM Service, Provision of fast and efficient services and Friendliness of bank personnel (such as good reception)
was rated as the least important bank selection criteria (factors) (See table 1.7.12).
The top most important bank selection criteria used by respondents having primary school level of education are Bank reputation or goodwill and image of the
bank in the society, Friendliness of bank personnel such as good reception, Confidence on bank, Government banks and low commission rate of transferring and
receiving cash. In contrast, Availability of Technology like ATM Service, Availability of core banking services like computerized services, Hours of operation, Promo-
tional activity and Newness of the bank was rated as unimportant bank selection criteria (Refer table 1.7.13).
Respondents who have completed secondary school rated Bank reputation (goodwill and image of the bank in the society), Provision of fast and efficient services,
Confidence on bank, Government banks and low commission rate of transferring and receiving cash as they are top important bank selection criteria. Similarly,
like respondents with educational level of primary school those who have completed secondary school give very less attention for bank selection criteria such as
Availability of Technology like ATM Service, Availability of core banking services like computerized services, Hours of operation, Promotional activity and Newness
of the bank (Refer table 1.7.14).
Respondents with educational level of diploma and above rated Provision of fast and efficient services, Bank reputation (goodwill and image of the bank in the
society), Confidence on bank, Availability of core banking services like computerized services and Low interest on loan as the top extreme important factors or
bank selection criteria, considering Class of people that patronize the Bank (ethnic and social class), Newness of the bank, low commission rate of transferring and
receiving cash, Ease of opening current account and Attractiveness of the branch building (physical appearance) as they are unimportant factors for choosing a
given bank (Refer table 1.7.15).
Christians give more consideration for bank selection criteria such as Bank reputation (good will and image of the bank in the society), Confidence on bank, Several
branches, Availability of Technology like ATM Service, Availability of core banking services like computerized services, and Friendliness of bank personnel (such as
good reception). But, Attractiveness of the branch building (physical appearance), Class of people that patronize the Bank (ethnic and social class), Proximity to
home and Newness of the bank were rated as the least important criteria for a given bank selection by Christian customers (Refer table 1.7.16).
Confidence on bank, Bank reputation (goodwill and image of the bank in the society, Provision of fast and efficient services, Availability of core banking services
like computerized services, and Friendliness of bank personnel (such as good reception) were rated as the top very important criteria of bank selection by Muslim
respondents. Here, the least important bank selection criteria rated were Proximity to home, Attractiveness of the branch building (physical appearance), Newness
of the bank, Promotional activity and Private banks (Refer table 1.7.17).
1.8.2 CONCLUSIONS
The main purpose of the study is to determine the factors being used by customers in their decision to select a bank, and to determine whether or not there is a
significant difference among the criteria being used in customer bank selection (preference) decision. The importance of this study can be viewed from two
dimensions: theoretical contributions and practical implications. Theoretically, the study fills an important gap in the literature that is, exploring bank selection
criteria for potential corporate customers’ customers in Ethiopia. Therefore, the findings of this study can add to the existing body of the literature and can serve
as a starting point on which future studies can be built. On the practical side, this study can help bank decision makers to identify the major factors that may
determine bank selection decisions among customers with a variety of demographic characters. Such information should help the management and executives of
commercial banks in devising appropriate marketing strategies for reaching and attracting customers having different financial needs based on their demographic
characters.
The findings from this study revealed that the majority of the respondents were in the age interval of 36- 50 and majority of the respondents were secondary
school complete. As far as religion is concerned the study reveals that majority of the respondents were Christians. The study also reveals that traditional median

VOLUME NO. 6 (2016), ISSUE NO. 11 (NOVEMBER) ISSN 2231-1009
INTERNATIONAL JOURNAL OF RESEARCH IN COMPUTER APPLICATION & MANAGEMENT A Monthly Double-Blind Peer Reviewed (Refereed/Juried) Open Access International e-Journal - Included in the International Serial Directories
http://ijrcm.org.in/
82
like recommendation from others was used highly by majority of the respondents. However, the media used by respondents differ across age and educational
levels. Accordingly, recommendation plays a great role in transmitting information among old individuals and educationally less advanced individuals while young
customers and educationally advanced customers less depends on media rather they select banks based by their self interest but younger relatively use modern
media such as TV and radio more than educationally advanced individuals based on the findings of study undertaken.
The findings of the study also indicated that majority of the respondents have a plan to switch off their bank account primarily because of deterioration in service
quality and difficulty in getting loan.
Finally, this study examined the relative importance of bank selection criteria used by customers to select a given commercial bank. Confidence on bank was found
being the most important factor for customers to choose a given bank followed by Provision of fast and efficient services, Bank reputation (goodwill and image of
the bank in the society), Friendliness of bank personnel (such as good reception), Private Banks and Knowledgeable and competent staff. However, rating of bank
selection criteria differ across customers’ demographic differences. Accordingly, young customers (21-35years) give more consideration for factors such as provi-
sion of fast and efficient services, availability of Technology like ATM Service, Newness of the bank, several branches and Hours of operation while customers at
medium and relatively old age give great focus for factors like government bank, Confidence on bank, Proximity to work place, and Bank reputation (goodwill and
image of the bank in the society). Similarly, educationally less advanced people give more focus for bank selection criteria such as Bank reputation or goodwill and
image of the bank in the society, Friendliness of bank personnel such as good reception, Confidence on bank, Government banks and low commission rate of
transferring and receiving cash. But relatively educationally advanced customers give more consideration for factors like Provision of fast and efficient services,
Bank reputation (goodwill and image of the bank in the society), Confidence on bank, Availability of core banking services like computerized services. Lastly, the
finding from the study reveals that Christians give more value for bank selection factors such as Bank reputation (goodwill and image of the bank in the society),
Confidence on bank, several branches, Availability of Technology like ATM Service, Availability of core banking services like computerized services, and Friendliness
of bank personnel (such as good reception which has no difference among Muslim customers.
1.8.3 RECOMMENDATIONS
The study made on the Bank selection criteria has intended to rate Bank selection criteria by current account holder customers in Ten selected commercial banks
in Addis Ababa city in relation to their demographic differences, Media best used by customers in relation to customers age differences and education, and finally
analyzed why customers plan to switch off their Bank accounts. Based on conclusion drawn from the finding of the study, the following recommendations were
forwarded expecting it significantly helps commercial Banks executives. The forwarded recommendation were not only for commercial Banks found in Addis Ababa
city, but also recommended to be useful for commercial Banks operating in other cities of Ethiopia even if there is slight difference among respondents’ de-
mographics and other aspects in other Ethiopian cities since there are variety of aspects that respondents share in common
� For commercial Banks, it is recommended that customers’ Bank selection criteria should be highly considered whenever the marketing strategy is designed
by understanding the needs of customers with different demographic needs since there is need difference among customers of different demographic ele-
ments.
� It is advisable for commercial Banks to keep service quality up always to avoid and reduce customers shifting from one Bank to other by switching off their
account.
� Commercial Banks should highly focus on building confidence and good reputation in the society
� Since recommendation plays a great role among customers of commercial banks under the study conducted and promotion is less important for customers,
Commercial banks should not invest highly on media promotion, rather give high attention for service quality because they do have recommendation which
is cost free promotion. But the researcher believes that promotion may be necessary occasionally for commercial Banks such as when they come up with
new and innovative technology and products
� Lastly, the researcher recommend that commercial Banks should focus on service quality and cost reducing innovative technologies than costly tasks like
branch expansion and costly technologies since services, products and technologies in Banks can be easily duplicated.
1.9 LIMITATIONS OF THE STUDY Even if the researcher believes that study conducted on Bank selection criteria employed by Corporate customers among Ten selected commercial Banks benefit
various stakeholders, this benefit may not be as maximum as the researcher believed due to the following hindrances:
� Limited number of sample size taken and included in the study.
� Limited types of customers included in the study
� Limited area covered by the researcher in the study
� Limited applicability of finding from the study for other commercial Banks in other cities.
� No well developed theory on customer Bank selection criteria
� Bank selection criteria variation across respondent’s demographic feature was not statistically tested
1.10 FUTURE RESEARCH DIRECTIONS This study was conducted under Bank selection criteria used and to be employed by corporate customers was conducted only by assessing the preference of
corporate customers, only in Addis Ababa city, with no scientific model by taking very limited number of customers in size and types. So it is recommended that
further research on the area shall be conducted at least by considering the limitations observed and indicated in this study.
ACKNOWLEDGMENT With the help of My Almighty God, this has become a reality. Therefore, my innumerable praise first goes to My Almighty God for his guiding me in all directions
of my life. Next, I respectfully acknowledge my university (Jimma University which is one of the reputed and respected Universities in Ethiopia and recognized in
Africa) for all financial and material support made for me to undertake and complete this important public research. Without whose support and guidance, this
project wouldn't have become a reality. In addition, the completion of this project involved kindly contribution, support and encouragement of many people. So I
am indebted to all who encouraged and supported me in all my passed life progress when I was really in need.
REFERENCES 1. Almossawi M, (2001). Bank selection criteria employed by college students in Bahrain: An empirical analysis. International Journal of Bank Marketing, Volume.
19, No.3, Pp.115-125
2. Anderson, Cox W.J. E. P and Fulcher D. (1976), Bank selection decisions and marketing segmentation. Journal of Marketing, Volume 40, No. 1, pp. 40-45.
3. Aregbeyen. O (2011): The Determinants of Bank Selection Choices by Customers: Recent and Extensive Evidence from Nigeria: International Journal of Business
and Social Science. Volume. 2 No. 22; Pp 276-288.
4. Assael, H. & Roscoe, A. M. (1976). Approaches to market segmentation analysis. Journal of Marketing, volume l No 40, Pp 67-76.
5. Bick G, Brown. A, Abratt R, (2004),"Customer perceptions of the value delivered by retail Banks in South Africa", International Journal of Bank Marketing,
Volume. 22 Issues: 5 Pp. 300-318.
6. Boyd W, Leonard M, White C, (1994). Customer Preferences for Financial Services: An Analysis. International Journal of Bank Marketing, Volume. 12, No.1,
Pp.9-15.
7. Bravo R, Montaner T and Pina J (2009). The role of Bank image for customers versus non-customers: International Journal of Bank Marketing Volume. 27 No.
4, Pp. 315-334.
VOLUME NO. 6 (2016), ISSUE NO. 11 (NOVEMBER) ISSN 2231-1009
INTERNATIONAL JOURNAL OF RESEARCH IN COMPUTER APPLICATION & MANAGEMENT A Monthly Double-Blind Peer Reviewed (Refereed/Juried) Open Access International e-Journal - Included in the International Serial Directories
http://ijrcm.org.in/
83
8. Carneiro, H. & Merzoug, Y. (2001). Leadership in Process Management – A case study based on SAS Cargo, Master’s Thesis, Stockholm School of Economics,
P.7
9. Curran J, Meuter M (2005). Self-service Technology adoption: Comparing three Technologies. Journal of Services Marketing, Volume 19 No.2 Pp 103–113
10. David. C, Christopher.G, Yong A, Hwa H, Esther C(2006) Customer satisfaction : a study of Bank customer retention in New Zealand Commerce Division
discussion paper ; No. 109
11. Denton, L. and A. K. K. Chan (1991), “Bank selection criteria of multiple Bank users in Hong Kong”. International Journal of Bank Marketing, Volume 9, No. 4,
Pp. 23-34.
12. Devlin J & Garrard P (2004) Choice criteria in retail banking: Journal of Strategic Marketing: An analysis of trends Volume 12, Issue 1, Pp 13-27
13. Devlin.J (2002). Customer knowledge and choice criteria in retail Banking. Journal of Strategic Marketing. Volume 10, Issue 4, Pp 273-290.
14. Devlin.J and Garrard. P (2005). A study of customer choice criteria for multiple Bank users’ Services. Journal of Bank marketing. Volume 2, No. 4 Pp 297–306.
15. Dubois, A. & Gadde, L. E. (2002). Systematic Combining: An abductive approach to case study research. Journal of Business Research, Volume 55, Pp. 553-
560.
16. Edris T, Almahmeed M, (1997). Services considered important to business customers and determinants of Bank selection in Kuwait: A segmentation analysis:
International Journal of Bank Marketing, Volume 15, No.4, Pp. 126–133
17. Eshghi K, Hedayatnia A, (2011). Bank Selection Criteria in the Iranian Retail Banking Industry. International Journal of Business and Management, Volume 6,
No.12, Pp.222-231
18. Evans, R.H. (1979), “Bank selection: It all depends on the situation', Journal of Bank Research, Vol. 12, pp. 243-249.
19. Frimpong N (1999). Patronage behavior of Ghanaian Bank customers. International Journal of Bank Marketing. Volume 17 No.7 Pp 335-341
20. Grady, B. & Spencer, H. (1990). Managing Commercial Banks. Englewood Cliffs, NJ: Prentice-Hall.
21. Haque.A Osman J, Ismail J (2009). Factor Influences Selection of Islamic Banking: A Study on Malaysian Customer Preferences. American Journal of Applied
Sciences. Volume 6, No 5 Pp.922-928
22. Haron S, Ahmad N, Planisek S, (1994). Bank Patronage Factors of Muslim and Non-Muslim Customers. International Journal of Bank Marketing, Volume.12,
No. 1, Pp.32-40
23. Hegazi, I.A, 1995. “An Empirical Comparative Study between Islamic and Conventional Banks’ Selection Criteria in Egypt”, International Journal of Contempo-
rary Management, vol. 5, No.3, Pp.46-61.
24. Herzog, T. (1996). Research methods in the social sciences, Harper Collins, New York
25. Holstius, K. & Kaynak, E. (1995). Retail banking in Nordic countries: The case of Finland. International Journal of Bank Marketing, Volume 13, No.8, Pp.10-20
26. Hull, L. (2002), Foreign-Owned Banks: Implications for New Zealand’s Financial Stability. Discussion Papers Series, DP 2002/05
27. Jantan M, Kamaruddin A, Hoe.O, (1998). Bank attributes and demographic factors in determining customer choice in retail Banking: An analytical hierarchy
approach; Journal of Bank marketing, Volume 3 No.2, 19-32
28. John M (2007). A research study of customer preferences in the home loans market. The mortgage experiences of Greek Banks customers, international
research journal of finance and economics issue10, Pp 154-166
29. Kamakodi, N. and Khan, B.A. (2008), “An insight into factors influencing Bank selection decisions of Indian Customers”, Asia-Pacific Business Review, 2008.
30. Katircioglu1 S, Tumer M, and Kilinc C (2011). Bank selection criteria in the banking industry: An empirical investigation from customers in Romanian cities:
African Journal of Business Management. Vol. 5(14), Pp 551-558
31. Kaynak, E. and Kucukemiroglu, O. (1992), “Bank and Product Selection: Hong Kong”, International Journal of Bank Marketing, Volume 10, No.1. Pp.3-17
32. Kaynak, E. and Yavas, U, (1985). Segmenting the Banking Market by Account Usage: An Empirical Investigation. Journal of Professional Service Marketing,
Volume 1, Pp.177-188.
33. Kennington.C, Hill T, Rakowska A, (1996). Consumer selection criteria for Banks in Poland International Journal of Bank Marketing, Volume14, No.4, Pp.12–
21
34. Khazeh K, Decker W. (1993), How customers choose banks? Journal of Retail Banking, Vol.14, No.4, Pp. 41-44.
35. Khazeh, K., & Decker, W. (1992). How customers choose banks? Journal of Retail Banking, Volume. 14, No. 4, Pp. 41-44.
36. Komal, Ms. (2009). Impact of ATM on Customer Satisfaction: A Comparative Study of SBI, ICICI & HDFC Bank. Journal of Business Intelligence, Volume 2, No.
2, Pp.276-286
37. Liebart J (2004): A smart Business capstone (online) Available at http://tools.ashridge.org.uk/ashridge/vircosl.nst/ve/brsmartbusiness.htm
38. Maiyaki. A, (2011). Factors Determining Bank’s Selection and Preference in Nigerian Retail Banking. International Journal of Business and Management.
Volume 6, No.1, Pp.253-257.
39. Martenson, R (1985) "Consumer Choice Criteria in Retail Bank Selection", International Journal of Bank Marketing, Volume 3 Issue: 2, Pp.64 – 74
40. Metawa S, Almossawi M, (1998). Banking behavior of Islamic Bank customers: perspectives and implication. International Journal of Bank Marketing, Volume
16, No.7, Pp.299–313
41. Mokhlis S, (2009). Determinants of Choice Criteria in Malaysia’s Retail Banking: An Analysis of Gender-Based Choice Decisions. European Journal of Economics,
and Finance Administrative Sciences, Volume 16, Pp.18-29
42. Mokhlis S, Mat N, Salleh H, (2008). Commercial Bank Selection: The Case of Undergraduate Students in Malaysia. International Review of Business Research
Papers. Volume 4, No.5, Pp.258-270
43. Okumus S, (2005). Interest free Banking in Turkey: A study of customer satisfaction and Bank selection criteria; Journal of Economic Cooperation, Volume 6,
No. 4, Pp.51-86
44. Omar, O.E. (2007), “Gender-Based Retail Bank Choice Decisions in Nigeria” Journal of Retail Marketing Management Research, Vol. 1 No.1, Pp. 20- 31
45. Peter, J. L. & Olson, J.C. (2005). Consumer behavior & marketing strategy (7th Ed.). New York, NY: McGraw-Hill/Irwin.
46. Phuong H, Har, K (2000). A study of Banks selection decisions in Singapore: using analytical hierarchy process, Volume 18, No.4, Pp.170-180
47. Pol, L. G. (1991). Demographic contributions to marketing: An assessment. Journal of the Academy of Marketing Science. Volume 19, No.1, Pp.53-59.
48. Rao, A.S. and Sharma, R.K (2010), “Bank Selection Criteria Employed by MBA Students in Delhi: An Empirical Analysis”, Journal of Business Studies Quarterly,
Vol.1, no. 2, Pp.56-69
49. Rashid M. Hassan M, (2009). Customer Demographics Affecting Bank Selection Criteria, Preference and Market Segmentation: Study on Domestic Islamic
Banks in Bangladesh. International Journal of Business and Management, Volume 4, No.6, Pp.131-139
50. Ross, D. (1989). “Your banks and how to choose them'', Accountancy, Vol. Journal of Bank Marketing 104, Pp.130-141
51. Samina Q and Alam M (2011). Promotional Activity Involvement of Commercial Banks: A Comparative Analysis among Three Generation Banks in Bangladesh:
International Review of Business Research Papers Volume 7, No. 5 Pp. 35-52.
52. Schmidt, Bergsiek M, Kolesnikova M, (2006). Customer Preferences of Financial Services across the US, Germany and Russia. Journal of International Business
and Cultural Studies, 1, No.1, Pp.1-20
53. Stanley O, Ford K, Richards S, (1985) "Segmentation of Bank Customers by Age", International Journal of Bank Marketing. Volume. 3 Issue: 3, Pp.56 – 63
54. Sun, S. (2009). An analysis of conditions and methods of market segmentation. International Journal of Business and Management, volume 4, No.2, Pp.63-
72.
55. Tan C, Chua C, (1986) "Intention, Attitude and Social Influence in Bank Selection: A Study in an Oriental Culture", International Journal of Bank Marketing,
Volume.4 Issue: 3, Pp.43 – 53
56. Wind, Y. (1978). Issues and advances in segmentation research. Journal of Marketing Research, volume 15 No.3, Pp.317-337

VOLUME NO. 6 (2016), ISSUE NO. 11 (NOVEMBER) ISSN 2231-1009
INTERNATIONAL JOURNAL OF RESEARCH IN COMPUTER APPLICATION & MANAGEMENT A Monthly Double-Blind Peer Reviewed (Refereed/Juried) Open Access International e-Journal - Included in the International Serial Directories
http://ijrcm.org.in/
84
57. Yin, R. (1994). Case study research: Design and methods (2nd ed). Beverly Hills, CA: Sage Publishing. New York
58. Yin, R. (2002). Case Study Research, Design and Methods (3rd ed), Newbury Park, Sage Publications.
59. Zineldin M, (1996). Bank strategic positioning and some determinants of Bank selection. International Journal of Bank Marketing, volume 14, No.6, Pp.12–22
WEBSITES
60. http://en.wikipedia.org/wiki/Addis Ababa) (Accessed, January 20th 2015)
61. http://www.knowthis.com/principles-of-marketingtutorials/managing customers/customers-and-the-organization/ (Accessed December 10th 2015)
62. http://www.practicalentrepreneurship.com/resources/marketing. (Accessed December 10th 2015)
63. http://www.rb.com/careers/ABCD (Accessed, December 15th 2015)
64. http://www.scribd.com/doc/46189592/DTH-Service (Accessed, December 12th 2015)
65. http://www.selectknowledge.com/images/public/preview_quality2.pdf (Accessed, December 15th 2015)
VOLUME NO. 6 (2016), ISSUE NO. 11 (NOVEMBER) ISSN 2231-1009
INTERNATIONAL JOURNAL OF RESEARCH IN COMPUTER APPLICATION & MANAGEMENT A Monthly Double-Blind Peer Reviewed (Refereed/Juried) Open Access International e-Journal - Included in the International Serial Directories
http://ijrcm.org.in/
85
PANCHAYATI RAJ IN HIMACHAL PRADESH: AN INTRODUCTION
KHEM RAJ
RESEARCH SCHOLAR
DEPARTMENT OF POLITICAL SCIENCE
HIMACHAL PRADESH UNIVERSITY
SHIMLA
ABSTRACT The Himachal region before 1947 consisted of thirty small princely states, all independent of each other but under the suzeminly of the British Crown. Hence, there
was no single panchayat act in operation in all these states. But the Punjab Village Panchayat Act 1939, had been adopted where the rulers were enlightened. The
state of Himachal Pradesh came into existence on 15 April 1948 with the merger of these thirty princely states of Shimla and other Himalayan regions in and around
the Shivalik Hills. It underwent a series of metamorphic changes, both political and administrative, till 25 January 1971, when it became the eighteenth state of the
Indian union.
KEYWORDS panchayati raj institutions, 73rd amendment, local Government.
INTRODUCTION he origin of panchayats in the territories now constituting Himachal Pradesh dates back to 1908 when Raja Bijai Chand of Kehloor (Bilaspur) established
quomi (caste) panchayats in his state. There were three major castes- Brahmins, Thakur Rajputs and Rajputs-recognised by the Raja of Bilaspur for this
purpose. These Guomi Panchayats, although established for only three major castes, were not just castes panchayats.
The Bilaspur ruler also constituted a central health and education committee to manage the problems of health and education in his state. This committee, along
with the quomi/panchayats, could be considered the forerunner of panchayat institutions in the state. It was partly elected and partly nominated with ten mem-
bers and one chairperson. Five members were elected from five one-member constituencies and the remaining five members were nominated by the ruler. The
state also had halqa and pargana councils with their pradhans, up-pradhans and secretaries. The pargana councils had more or less the same functions as the
panchayat samitis in other states. They ceased to function in 1950 following the extension of the Punjab act of 1939 to Bilaspur state.
Most of the other princely states in the region also had their traditional panchayats. For example, in Sirmour, Lahaul Spiti, Kullu and Kangra regularly established
panchayats had been in operation. Sirmour, in fact, had implemented the Punjab act of 1939 and formed three panchayats: Dadahu, Sarahan and Majra. Lahaul
Spiti had its regularly constituted panchayats from November 1944 when thirteen panchayats came into existence. The new state of Himachal Pradesh adopted
the Punjab Village Panchayat Act, 1939, as the first step towards introduction of a panchayat system in 1949 and in that year itself established a total of 186
panchayats in its four constituent states. The breakup was: Mahasu, 45; Mandi, 33; Chamba, 54; Sirmour, fifty-four. In 1950, the Punjab Village Panchayat Act was
extended to Bilaspur state also.
INDEPENDENCE AND AFTER The state legislature passed the Himachal Pradesh Panchayat Raj Act in 1952, in order to bring the working of panchayats in tune with the local conditions and
with the growing aspirations of the people for democratisation. Thus, Act authorised the state government to establish a gram sabha for a village or a group of
villages and a tehsil panchayat for every tehsil or sub-division. The president of the gram sabha was the pradhan, who, along with the up-pradhan, was to be
elected for three years from amongst the members. An executive committee of the gram sabha, also elected, was called the gram panchayat. There was reservation
of seats for SCs as well as for women in the gram panchayat. The act provided for seventeen functions for the gram panchayat besides sixteen discretionary
functions. A gram panchayat was given power under the act to maintain and seek improvement in schools and hospitals and also help in the establishment of
primary schools. A gram sabha could also report the misconduct of certain officials to the higher authorities.
The Act of 1952 required a district to be divided into circles for which a Nyaya Panchayat was established. Every gram sabha in a circle selected fifteen members
of prescribed qualifications for the Nyaya Panchayat. By 1954, a total of 426 panchayats (one in each patwari circle) covering 13,606 villages had been established
in the four districts constituting, the state in addition, there were twenty-six tehsil panchayats and three zila panchayats. The tehsil as well as zila panchayats were
established through indirect elections.
In Himachal Pradesh, the tehsil panchayats were already functioning as the second tier when the Balwant Mehta Committee Report was being implemented in
other states of India. The tehsil was an administrative revenue unit and was not coterminous with a block. There were ten to forty members in each tehsil pan-
chayat. Some of these members were nominated by the state government and each panchayat used to return one member. The tehsildar used to be its president.
The Himachal Pradesh Act of 1952, was repealed in 1968 when the state legislature passed a new panchayati raj act. This act provided for a uniform System for
the Entire State, Including Bilaspur and other areas transferred to it. The panchayats in these areas had been working in accordance with the provisions- of the
Punjab legislations of 1952, and 1961 when the Himachal Pradesh Panchayat Raj Act, 1968, came into force on 15 November 1970, that is, two years later. By then
the newly merged areas had already constituted a total of 1,965 gram panchayats, 29 panchayat samitis and 3 zila parishads under the Punjab statutes adopted
by them.
THE 1968 ACT The Himachal Pradesh Panchayat Raj Act, 1968, was enacted to incorporate the major recommendations of the Balwant Rai Mehta Committee. Accordingly, a
panchayat samiti was constituted for every block. It consisted of primary members (who were all the pradhans of the gram panchayats in the block), and co-opted
members. The provision applying to the primary members was, however, amended in 1991. The amended Act laid down that, the primary members would be
elected by secret ballot by the members of the gram sabhas with one member from every two contiguous gram sabhas, subject to a minimum of ten members.
The pradhans and up-pradhans of the gram sabhas, who were also the pradhans and up-pradhans of the gram panchayats, were elected from amongst the
members of the gram Sabha, by secret ballot and direct vote. The Act of 1968 also provided for representation of women in case there were no primary women
members in the panchayat samiti. Only two women were to be co-opted from among the panches from the block. Similarly, a maximum of four panches belonging
to the SCs were to be co-opted if there was no SC primary member.
A special feature of the panchayat samiti in Himachal Pradesh was that, it had directly elected primary members and its chairperson wrote the annual confidential
report of the Block Development Officer. The Act of 1968, conferred twenty-Seven duties on gram panchayats but the funds made available to them were ex-
tremely limited. It was just not possible for a gram panchayat with hardly any source of income to perform even duties like sanitation and maintenance of public
utilities.
The 1968 Act had in fact vested real powers in the District Collector, Sub-Divisional Magistrate and the District Panchayati Raj Department. The slogan of democratic
decentralization was misleading. There was no real power either with the pradhans of the gram panchayats or with the chairpersons of the panchayat samitis.
T
VOLUME NO. 6 (2016), ISSUE NO. 11 (NOVEMBER) ISSN 2231-1009
INTERNATIONAL JOURNAL OF RESEARCH IN COMPUTER APPLICATION & MANAGEMENT A Monthly Double-Blind Peer Reviewed (Refereed/Juried) Open Access International e-Journal - Included in the International Serial Directories
http://ijrcm.org.in/
86
Implementation of the act of 1968, whether it related to powers, duties, functions or taxation, required prior approval or sanction of the state government, in
other words, of the director of panchayats or the District Collector.
The most important official dealing with Panchayati Raj Institutions at the grassroots level (Gram Sabha/Panchayat) was the secretary of a gram panchayat or of a
group of panchayats, who was appointed by the director of panchayats. This was the start of an attempt to control gram panchayats, although the secretary was
supposed to act under the overall supervision of the pradhans.
Functional jurisdiction of the gram panchayat was the requirement for prior approval by a deputy commissioner of plans for under taking any work involving more
than 500 rupees. The previous sanction of the Deputy Commissioner had to be obtained when a panchayat needed to borrow money and the conditions imposed
by him had to be accepted. The prior permission of the Deputy Commissioner was necessary even for the imposition of a special tax on the adult male members
of the panchayat for the construction of any public utility.
A draconian clause of the 1968 Act empowered a Deputy Commissioner or a Sub-Divisional Officer to suspend the execution of a resolution or order of a gram
panchayat or prohibit the implementation of an act. Another clause was the one authorizing the state government, or the Deputy Commissioner, to suspend a
panch during the course of an enquiry or for any other recorded reason. Such unlimited powers had made the district and state bureaucracy the unquestioned
masters of panchayati raj institutions in the state. Although the Himachal Pradesh Panchayati Raj Act of 1968, had reaffirmed the belief in the three-tier system,
the three zila parishads which were dissolved in 1957 were not brought to life again.
The impact of the Ashoka Mehta Committee's report of 1978 was insignificant on the panchayati raj system of the state. The only recommendation of this report
accepted by the state government pertained to the direct election of members of the panchayat samiti. But even this was made mandatory only under the
Himachal Pradesh Panchayati Raj (Amendment) Act in 1991.1
STATUS OF PANCHAYATI RAJ INSTITUTIONS Despite such deliberate attempts to suppress the Panchayati Raj Institutions in Himachal Pradesh, these had survived as formally constituted institutions and
organizations. Gram panchayats and panchayat samitis enjoyed a certain level of status and power. Government officers on their visits to the villages or blocks,
always asked for the pradhans or the chairpersons of the panchayat samitis, and this official recognition was of significance in the villages. Although the financial
position of these institutions was weak, they had status and prestige in the eyes of the common man. It is true that, persons with some economic status became
chairpersons of the panchayats, but caste leaders and popular social workers were also favoured in panchayat elections.
POST-73RD AMENDMENT DEVELOPMENTS Himachal Pradesh enacted new panchayati raj legislation, the Himachal Pradesh Panchayati Raj Act, 1994 in conformity with the provisions of the Constitutional
(Seventy-third Amendment) Act, 1992. The act of 1994 repealing the earlier state Panchayati Raj Act of 1968, became effective from 22nd April 1994. This act
provided for a gram sabha and gram panchayats, panchayat samitis and zila panchayats at village, block and district levels respectively.
GRAM SABHA In Section 3 of the Act, a gram sabha is to be constituted for a village or group of villages with not less than 1,000 and not more than 5,000 populations. In Schedule
V areas, the population can be less than 1,000. The state can also decide to have a gram sabha for a village or group of villages with less than 1,000 or more than
5,000 populations keeping in view the geographical situation, lack of transport and communication, and for administrative convenience. An interesting feature is
that a Gram Sabha area can be changed only on completion of tenure of the current elected members. The functions of the gram Sabha include: encouraging
contribution of voluntary labour and contribution in cash or in kind, implementation of development Schemes for the village, promotion of unity and harmony
among all sections of the society in the area, seeking clarification from the gram Panchayat Pradhan, up-pradhan and members on any activity, schemes, income
and expenditure. The Gram Sabha considers and gives suggestions and recommendations to the gram panchayat on the annual budget, administration report,
audit report, gram panchayat's report for the previous year's development programmes, current year's proposals, unity and harmony among all sections of the
society and adult education programme in the village. The gram panchayat has to give due consideration to the Gram Sabha's suggestions and recommendations.
The Gram Sabha will have two meetings in a year and the prescribed quorum for its meetings is one-fifth of its total membership.
GRAM PANCHAYAT The Gram Panchayat is defined in the Act as the executive of the gram Sabha. Its membership ranges from 5 to 13 according to the population. There will be 5
members for a population 'of 1,500, 7 for a population between 1,500 and 2,500, 9 for 2,500 to 3,500, 11 for 3,500 to 4,500, and 13 members for a population
exceeding fats thousand five hundred. Reservation for SCs and STs is provided in proportion to their population with a minimum of one in number. The government
can also reserve seats for Backward Classes. The gram panchayat meeting has been declared a public meeting and is to be held at least once every month. This
Act gives twenty nine duties of the gram panchayat which are specifically in the nature of civic functions like sanitation, maintenance and repair of public wells,
village roads, culverts, public street lighting and public land management. The government can also entrust to the panchayats the preparation and implementation
of schemes for promoting economic development and social justice, including on subjects listed in Schedule Eleven of the Constitution.
The Gram Panchayat has the power to remove encroachments and nuisance. It can also regulate building construction after preparation of model schemes for the
village. Under Section 16 of the act, it can inquire into complaints against the peon, bailiff, police constable, hawaldar, chowkidar, police guard, person incharge
of irrigation, vaccinator, animal supervisor and gram sevak, about misconduct in their official capacity. The concerned senior officer, Deputy Commissioner or Sub-
Divisional Officer (SDO) will take action on its report and inform it to the director of panchayats. Similarly, on a report of any person that a patwari, chowkidar,
gram sevak or forest guard has failed to perform the duties assigned to him by any law or rule, gram panchayats can ask him to carry out the duty in a reasonable
period, and if he fails, it can report to the concerned senior officer, or Deputy Commissioner, who will take action after appropriate inquiries and then inform the
gram panchayat and the director of panchayats.
By a resolution passed by a two-thirds majority of the gram panchayat can also impose prohibition on liquor vending in the area. The gram panchayat is also to
assist a government servant in carrying out his duties if so prescribed and to the extent practicable. A Gram Panchayat will have three standing committees: (1)
Agricultural Production, Animal Husbandry and Rural Industry Committee; (2) Social Justice Committee for Sc ST, OBC welfare and welfare of women and children;
and (3) Amenities Committee for Education, Public Health, Public Works and other Works. The Act also provides for certain judicial functions and powers for gram
panchayats.
The Gram Panchayat has taxation powers which include (1) house tax, (2) profession tax, (3) cess on stamp duty, (4) other taxes, fees or cess authorized by
government. If a particular panchayat fails to impose a tax the government can itself impose it and it will be deemed to be a tax imposed by the panchayat. The
fees which the panchayat can impose are service fees on sanitation, street lighting, registration of animal sold and rate on water supply. The panchayat can also
impose special tax on each adult male for any public work construction with Deputy Commissioner’s permission.2
PANCHAYAT SAMITI A Panchayat Samiti is to be constituted for a block with one member for a population of three thousand. The total number of directly elected members from
territorial constituencies will be not less than 15 for 45,000 population and not more than 40 for more than 1.20 lakh population. Members of the Lok Sabha, and
Vidhan Sabha with a constituency wholly or partly in the block, and Rajya Sabha members who are registered voters in the area are also members. One-fifth of
the gram panchayat pradhans are members of the panchayat samiti by rotation. In the panchayat samiti as well as in the gram panchayat the government can
reserve seats for the backward classes.

VOLUME NO. 6 (2016), ISSUE NO. 11 (NOVEMBER) ISSN 2231-1009
INTERNATIONAL JOURNAL OF RESEARCH IN COMPUTER APPLICATION & MANAGEMENT A Monthly Double-Blind Peer Reviewed (Refereed/Juried) Open Access International e-Journal - Included in the International Serial Directories
http://ijrcm.org.in/
87
The function of the panchayat samiti include the following: (1) 1RDP, agriculture, social forestry, fishery, health and sanitation, adult education, communication,
public works, cottage industries, cooperatives, women, youth and child welfare, welfare of disabled, destitutes and backward classes, family welfare and sports;
(2) Natural Calamities like fire, flood, drought arrangement of local pilgrimages and festivals (4) Management of public ferries and public markets, fairs and exhi-
bitions. The government can also entrust other functions to it. The panchayat samiti will have three standing committees: General, Finance, Audit and Planning,
and Social justice.
ZILA PARISHAD The Zila parishad consists of directly elected members from territorial constituencies, one for 20,000 populations or part thereof and at least 10 members for a
district with a population of 2 lakh. The Government has retained the power to notify that in the Schedule Area there will be no consideration of population.
Members of the Lok Sabha with their constituencies in the District and members of the Rajya Sabha registered as voters, and all presidents of panchayat samitis
are members of the Zila Parishad but if the MPs and presidents of panchayat samitis together exceed directly elected members, only one-fifth of the panchayat
samiti presidents will be members by rotation.
The duties of the Zila Parishad are: (1) Control, Coordination and Guidance of panchayat samitis and gram panchayats. (2) Coordination and integration of pan-
chayat samiti plans, coordination of special purpose grants, and requests of panchayat samitis, advising government on development activities, social forestry,
family welfare, welfare of disabled, destitute women, youth and children and sports. The government can also entrust to Zila Parishads other functions within
their competence, like preparation of plans for economic development and social justice and implementation of schemes, including those in the Eleventh Schedule
of the Constitution. The Zila parishad has five standing committees: General, Finance, Audit and planning, Social Justice, Education and Health, and Agriculture
and Industry in the panchayat samiti, the Block Development and Panchayat Officer (BDPO), and in the Zila Parishad, the District Development and Panchayat
Officer (DDPO) have been designated as the secretaries in the act.3
GOVERNMENT CONTROL The Government or an authorized officer can suspend a panchayat resolution. It can dissolve a panchayat if it does not comply with its orders or does not carry
out its duties or misuses its powers. It can also inquire into the functioning of a panchayat and can remove any of its office bearers.
ELECTIONS Elections to the Gram Panchayats were held in December 1991, and to the sixty-nine panchayats samitis. Elections to the Zila Parishads were not held. Although
the state had 2,757 gram panchayats at that time, only 2,731 of them went to the polls. Elections to twenty-four gram panchayats in the whole of the Rohru block
had been stayed by the court and the constitution of two gram panchayats in the Kunihar block of Solan district had been disputed. In Pragpur Panchayat Samiti
(Kangra district) elections for the post of chairperson and vice-chairperson were not held.
Although the elections to the gram panchayat and panchayat samitis were held on a non-party basis, the two major political parties in the state, namely, the
Congress and the Bharatiya Janata Party (BJP) took an active interest in them. Caste too played a significant role. People of a caste or community tended to vote
for the candidate of the same caste or community. The next elections to panchayats in Himachal Pradesh were held in December 1995. These were conducted by
the State Election Commission, set up under the 1994 Act. There was very high voter turnout for the polls. The polling crossed 90 per cent in certain areas of
Mandi, Solan, Kangra and Shimla districts. On an average 80 to 85 per cent polling was recorded throughout the state. There was greater enthusiasm among
women voters. Barring setbacks in some prestigious constituencies, the Congress-supported candidates were elected in a majority of the areas. In the elections
7,652 women were elected to different offices. Out of these 1,961 belonged to the scheduled castes and 439 to the scheduled tribes.
STATE FINANCE COMMISSION RECOMMENDATIONS The State Finance Commission was constituted in April, 1994. The Commission submitted its report on 30 November 1996. It made the following observations and
recommendations:
The existing provisions in the Act do not really allow a fair degree of freedom to the PRIs and the local bodies to raise resources through taxes and levies. The
government could suggest maxima and minima rates for the imposts. The Government could also consider amending the statutes to provide for this flexible
arrangement. In case, local bodies do not collect their statutory levies, the resource transfers recommended for them should not be made. The deficit of PRIs of `
1,387.45 lakh from 1996-97 has to be filled by grants. For the delegated functions, a total sum of `. 3,750 lath was estimated to be necessary.
For the maintenance of already created assets, a rural infrastructure Maintenance Corpus needs to be established, for which a sum of ` 1,280 lakh for a period of
five years needs to be provided. For maintenance and creation of new assets, gram panchayats have to raise resources locally. For maintenance of water supply
and irrigation schemes, additional amount would be required. For the payment of an honorarium to the chairpersons and to meet other expenses of gram pan-
chayats and panchayat samitis for the five year period 1996-97 to 2000-2001, they should be provided with ` 095.471 and 63.39 lakh respectively. Each Zila
Parishad should be given ` 300 lakh for constructing office buildings. Due to constraints on the state exchequer the revenue transfers of `19.13 lakh made to the
PRIs in 1995-96 is assumed to be the fixed quantum of revenue transfer annually during the period 1996-97 to 2000-2001. The deficit between their revenue and
expenditure has to be filled by gap-filling grants as stated above. All the recommendations of the SFC have been accepted by the state government.
PANCHAYATS IN SCHEDULED AREAS The Himachal Pradesh Panchayati Raj Act, 1994, was amended in 1997, to extend the Panchayati Raj System to the Fifth Schedule areas in the state in conformity
with the central law of 1996, on the subject. The amended legislation, the Himachal Pradesh Panchayati Raj (Second Amendment) Act, 1997, broadly follows the
pattern of the central act, giving the Gram Sabha the pivotal position in the Panchayati Raj Structure in the tribal areas except in respect of grant of prospecting
license or mining lease for or minerals. In these spheres, the Gram Sabha's recommendations shall merely be taken into consideration in taking the final decision
instead of being mandatory as the central Act provides. Also, the panchayat had been empowered to exercise control over institutions and functionaries in all
sectors, and over local plans and resources for such plans, including tribal sub-plans.
DISTRICT PLANNING COMMITTEE Lok Sabha members, the Zila Parishad Adhyaksha, the Mayor of the Municipality at the District Headquarters and Members from Rural and Urban areas in propor-
tion to their population will be members of the DPC. MLAs of the District and Rajya Sabha members registered in the district as voters are also its member. The
Act has left on the mode of choosing the chairperson of the committee. The Zila Parishad Secretary will be the secretary of the DPC. The DPCs are still to start
functioning in the state. The DRDAs in the state also continue to have the district collectors as the chairpersons. Panchayati Raj in Himachal Pradesh has come a
long way from the stage of quomi (caste) panchayats to that of a statutory local self-government institution. It has become the embodiment of the hopes and
aspirations of the under-privileged sections of society, particularly women.4
The state Government of Himachal Pradesh has further amended 73rd constitutional Amendment Act, and the special provision of 50 per cent reservation for
women has recorded a remarkable fact in the history of Panchayati Raj System of Himachal Pradesh. The Himachal Pradesh Panchayat (Amendment) Bill was
presented on 8th April 2008, and passed in the house, and then Himachal became the third state after Rajasthan and Madhya Pradesh to give 50 per cent reservation
to women in Panchayats and local bodies. After that, 27th August 2008, the Central Government also passed a bill of 50 per cent reservation for women in Panchayti
Raj Institutions. This bill absolutely helps in empowering women and helps in creating compassion to women related development issues. District/Block wise
number of Gram Panchayats in Himachal Pradesh have been shown in table 1.1.
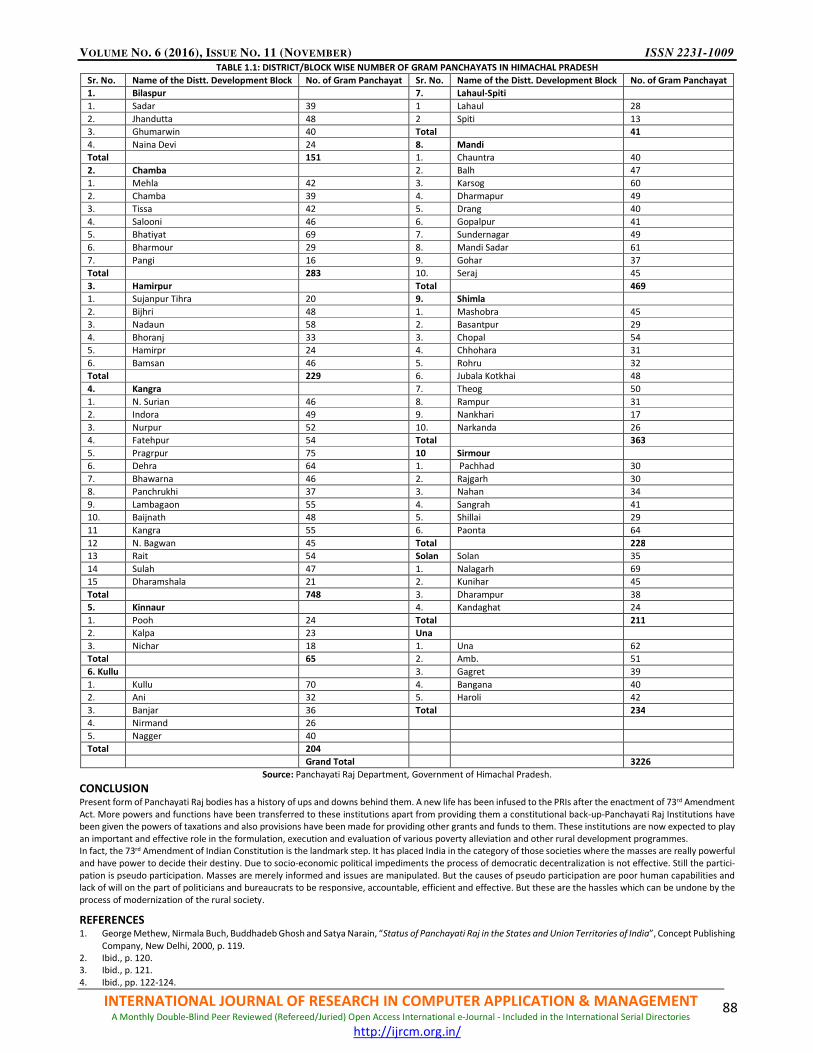
VOLUME NO. 6 (2016), ISSUE NO. 11 (NOVEMBER) ISSN 2231-1009
INTERNATIONAL JOURNAL OF RESEARCH IN COMPUTER APPLICATION & MANAGEMENT A Monthly Double-Blind Peer Reviewed (Refereed/Juried) Open Access International e-Journal - Included in the International Serial Directories
http://ijrcm.org.in/
88
TABLE 1.1: DISTRICT/BLOCK WISE NUMBER OF GRAM PANCHAYATS IN HIMACHAL PRADESH
Sr. No. Name of the Distt. Development Block No. of Gram Panchayat Sr. No. Name of the Distt. Development Block No. of Gram Panchayat
1. Bilaspur 7. Lahaul-Spiti
1. Sadar 39 1 Lahaul 28
2. Jhandutta 48 2 Spiti 13
3. Ghumarwin 40 Total 41
4. Naina Devi 24 8. Mandi
Total 151 1. Chauntra 40
2. Chamba 2. Balh 47
1. Mehla 42 3. Karsog 60
2. Chamba 39 4. Dharmapur 49
3. Tissa 42 5. Drang 40
4. Salooni 46 6. Gopalpur 41
5. Bhatiyat 69 7. Sundernagar 49
6. Bharmour 29 8. Mandi Sadar 61
7. Pangi 16 9. Gohar 37
Total 283 10. Seraj 45
3. Hamirpur Total 469
1. Sujanpur Tihra 20 9. Shimla
2. Bijhri 48 1. Mashobra 45
3. Nadaun 58 2. Basantpur 29
4. Bhoranj 33 3. Chopal 54
5. Hamirpr 24 4. Chhohara 31
6. Bamsan 46 5. Rohru 32
Total 229 6. Jubala Kotkhai 48
4. Kangra 7. Theog 50
1. N. Surian 46 8. Rampur 31
2. Indora 49 9. Nankhari 17
3. Nurpur 52 10. Narkanda 26
4. Fatehpur 54 Total 363
5. Pragrpur 75 10 Sirmour
6. Dehra 64 1. Pachhad 30
7. Bhawarna 46 2. Rajgarh 30
8. Panchrukhi 37 3. Nahan 34
9. Lambagaon 55 4. Sangrah 41
10. Baijnath 48 5. Shillai 29
11 Kangra 55 6. Paonta 64
12 N. Bagwan 45 Total 228
13 Rait 54 Solan Solan 35
14 Sulah 47 1. Nalagarh 69
15 Dharamshala 21 2. Kunihar 45
Total 748 3. Dharampur 38
5. Kinnaur 4. Kandaghat 24
1. Pooh 24 Total 211
2. Kalpa 23 Una
3. Nichar 18 1. Una 62
Total 65 2. Amb. 51
6. Kullu 3. Gagret 39
1. Kullu 70 4. Bangana 40
2. Ani 32 5. Haroli 42
3. Banjar 36 Total 234
4. Nirmand 26
5. Nagger 40
Total 204
Grand Total 3226
Source: Panchayati Raj Department, Government of Himachal Pradesh.
CONCLUSION Present form of Panchayati Raj bodies has a history of ups and downs behind them. A new life has been infused to the PRIs after the enactment of 73rd Amendment
Act. More powers and functions have been transferred to these institutions apart from providing them a constitutional back-up-Panchayati Raj Institutions have
been given the powers of taxations and also provisions have been made for providing other grants and funds to them. These institutions are now expected to play
an important and effective role in the formulation, execution and evaluation of various poverty alleviation and other rural development programmes.
In fact, the 73rd Amendment of Indian Constitution is the landmark step. It has placed India in the category of those societies where the masses are really powerful
and have power to decide their destiny. Due to socio-economic political impediments the process of democratic decentralization is not effective. Still the partici-
pation is pseudo participation. Masses are merely informed and issues are manipulated. But the causes of pseudo participation are poor human capabilities and
lack of will on the part of politicians and bureaucrats to be responsive, accountable, efficient and effective. But these are the hassles which can be undone by the
process of modernization of the rural society.
REFERENCES 1. George Methew, Nirmala Buch, Buddhadeb Ghosh and Satya Narain, “Status of Panchayati Raj in the States and Union Territories of India”, Concept Publishing
Company, New Delhi, 2000, p. 119.
2. Ibid., p. 120.
3. Ibid., p. 121.
4. Ibid., pp. 122-124.

VOLUME NO. 6 (2016), ISSUE NO. 11 (NOVEMBER) ISSN 2231-1009
INTERNATIONAL JOURNAL OF RESEARCH IN COMPUTER APPLICATION & MANAGEMENT A Monthly Double-Blind Peer Reviewed (Refereed/Juried) Open Access International e-Journal - Included in the International Serial Directories
http://ijrcm.org.in/
89
A STUDY ON CONSUMERS’ BEHAVIOUR IN BUYING GOODS ONLINE WITH REFERENCE TO THOOTHUKUDI
DISTRICT
R. ANANTHA LAXMI
RESEARCH SCHOLAR
PG & RESEARCH DEPARTMENT OF COMMERCE
V.O. CHIDAMBARAM COLLEGE
THOOTHUKUDI
ABSTRACT Internet shopping has been widely accepted as a way of purchasing products and services. It has become a more popular means in the internet world. It also
provides consumer more information and choices to compare product and price, more choice, convenience and easier to find anything online. There are billions of
people online and each of them is a potential online consumer for a company which provides online services and goods. Competition increases day by day due to
increase attention of consumers towards online shopping. Therefore, it is necessary to understand the online purchasing behaviour of consumers so that the online
sellers could improve and enhance their customer retention theories. In this paper, the researcher has carefully analyzed the consumers’ buying behaviour through
online shopping. This paper gives a comprehensive picture of the factors influencing the purchase of goods online by the consumers. A sample size of one hundred
and five respondents is selected for the research from Thoothukudi district. The study quantitatively analyses the consumers’ buying behaviour, factors influencing
the attitudes and behaviours of the consumers in buying various products from internet, satisfaction on the overall quality of goods purchased and the like using
primary data. Appropriate findings and suggestions are given in the paper.
KEYWORDS buying behavior, online shopping, overall quality.
INTRODUCTION onsumer behaviour has changed greatly over the last 25 years, but it has been evolutionary and the seeds of change have been apparent for generations
(Lelia Voinea and Alina Filip, 2010)1. Customer purchasing decisions are influenced by perception, motivation, learning, attitudes and beliefs. The perception
is reflected to on how the customers select, organize, and interpret information to form knowledge. The motivation is reflected to the customer’s desire to
meet their own needs. Learning is reflected to the customers’ behavior experience arising. Attitudes are reflected to customers’ steadily favorable or unfavorable
assessments, feelings, and inclinations towards object or idea. Finally, Beliefs is reflected to customers’ thoughts about a product or service (Kotler and Armstrong,
1997)2.
Online shopping is a form of E-commerce whereby consumers directly buy goods or services from a seller over the internet. Online shopping is done through an
online shop, e-shop, e-store, Internet shop or online store. All the products in online stores are described through text, with photos and with multimedia files.
Many online stores will provide links for extra information about their products. They often make available, safety procedures, instructions, manufacture specifi-
cation and demonstrations (Saad Akbar and Paul TJ James)3. The four key dimensions of online shopping are namely web sites, information content, design security
and privacy. Though all these dimensions have an impact on the purchase intension, security and privacy will have greater impact on the purchase intent on online
buyers (Ranganathan and Ganapathy, 2002)4. The main concern is to purchase products in an efficient and timely manner to achieve their goals with a minimum
of irritation. Consumers seek online shopping for the potential entertainment resulting from the fun and play arising from the internet shopping experience
(Holbrook, 1994)5.
STATEMENT OF PROBLEM Online shopping is third most popular activity on the internet after email using and web browsing. Globally more than 627 million people have done online
shopping so far, World’s biggest online shoppers include Germans and British. Books, airline tickets/reservations, clothing/shoes/videos/games and other elec-
tronic products are the most popular items purchased on the internet (A.C. Nielsen, 2005)6. It has been a growing phenomenon in all four corners of the world, in
particular amongst countries possessing highly developed infrastructure available for marketing activities through the internet. Today, internet is not only a net-
working media, but also a global means of transaction for consumers. Internet usage has grown rapidly over the past years and it has become a common means
for information transfer, services and trade (Narges Delafrooz et al., 2010)7. In this study, the researcher has made an attempt to find out the online purchasing
behaviour of the consumers in Thoothukudi district.
OBJECTIVES OF THE STUDY The following are the objectives of the study:
1. To understand behaviour of the consumers in buying goods online.
2. To identify the factors influencing the consumers purchase of goods by adopting online shopping.
3. To study the influence of the demographic profile of the consumers on the overall quality of the goods purchased by them through online shopping.
HYPOTHESES The following are the null hypotheses to be tested in the study
1. The quality information available on the internet does not depend on the detail information, Comparison of info with other product and searching the right
products by the consumers.
2. The demographic profile of the consumers does not influence the overall quality of goods purchased by them through online shopping.
RESEARCH METHODOLOGY RESEARCH DESIGN
Since the present study has its own predetermined objectives and methodology, it is both descriptive and analytical in nature. The study has made an attempt to
explain the consumers’ behaviour in buying goods online.
SAMPLING DESIGN
By adopting random sampling method respondents were selected from various parts of Thoothukudi district. The sample size of this study is 105. Structured
interview schedule was used to collect the relevant data among the consumers in Thoothukudi District.
SCOPE OF THE STUDY
The present study covers the Thoothukudi district of Tamil Nadu. It deals with the consumers’ behaviour in buying goods online. The period of this study is about
one year (i.e.) from June 2014 to May 2015.
C

VOLUME NO. 6 (2016), ISSUE NO. 11 (NOVEMBER) ISSN 2231-1009
INTERNATIONAL JOURNAL OF RESEARCH IN COMPUTER APPLICATION & MANAGEMENT A Monthly Double-Blind Peer Reviewed (Refereed/Juried) Open Access International e-Journal - Included in the International Serial Directories
http://ijrcm.org.in/
90
SOURCE OF DATA
The present study is based on both primary data and secondary data. Primary data were collected through interview schedules. Secondary data were collected
through websites, articles, books and journals.
COLLECTION OF DATA
A well-structured schedule was used to collect primary data from the respondents. The interview schedule consists of four important parts. The first part covers
the demographic profile of the respondents. The second part of the schedule includes the awareness and attitudes of consumers in operating internet for online
purchase. The third part of the schedule includes the behaviour of the consumers in buying goods online. A pilot study was conducted among 20 respondents
based on the feedback of the pilot study, modifications, additions and deletions were carried out. The final draft was prepared to collect the data.
FRAMEWORK OF ANALYSIS
For analyzing the data from the consumers, relevant statistical tools were used to fulfill the objectives of the study. Statistical package for the Social Science (SPSS)
software package version 20 was used to analyze the data. The tools include Factor analysis, Multiple Regression, Oneway ANOVA and Independent samples t
test.
RESULTS AND DISCUSSION In the study, factor analysis is used to classify the opinion about internet shopping. Oneway ANOVA has been used to analyze the relationship between the profile
of the respondents and their satisfaction on the overall quality in purchasing goods online. Independent samples t test has been used to find out the relationship
between gender and the overall quality of goods purchased online. Multiple regression analysis has been used to find out the validity of quality information
available for the product.
FACTOR ANALYSIS ON OPINION ABOUT INTERNET SHOPPING
Factor analysis shows how the variables are grouped into the various underlying factors. The factor analysis by principal component method is applied to reduce
the variables into predominant factors. In particular, this analysis is applied over a block of five point scale statement or any other defined scale to emerge with
meaningful factors. In the present research work, the researcher after reviewing national and international literature regarding online shopping identified eight
variables pertaining to the usage of internet. The statements were responded by the respondents in Likert’s five point scale technique. The application of factor
analysis over the ten variables fetched these results.
TABLE 1: KMO AND BARTLETT'S TEST
Kaiser-Meyer-Olkin Measure of Sampling Adequacy. 0.698
Bartlett's Test of Sphericity
Approx. Chi-Square 200.920
Df 28
Sig. 0.000
To verify whether the data set is suitable for factor analysis, it has to be checked whether the KMO measure of sampling is 0.6 or above and whether the Bartlett’s
test of sphericity value is significant (i.e., the significant value should be 0.05 or smaller). From the above table, it is found that KMO measure of sampling adequacy
is 0.698 and Bartlett’s test of sphericity with approximate Chi-square value 200.920 are statistically significant at 5% level. Therefore, it can be concluded that the
eight variables possess appropriate variance over the required and adequate sample size. These variables also form a normal distribution and can be grouped to
frame a meaningful factor.
TABLE 2: TOTAL VARIANCE EXPLAINED
Component Initial Eigenvalues Rotation Sums of Squared Loadings
Total % of Variance Cumulative % Total % of Variance Cumulative %
1 2.860 35.744 35.744 2.003 25.034 25.034
2 1.480 18.502 54.245 1.821 22.766 47.800
3 1.029 12.865 67.110 1.545 19.310 67.110
4 .766 9.576 76.686
5 .667 8.336 85.022
6 .497 6.211 91.233
7 .373 4.656 95.890
8 .329 4.110 100.000
The component Eigen value from the above table should be 1 or more in the total variance. In this study, only the first three components recorded Eigen values
above 1 (25.034, 22.766 and 19.310). Overall, the model for 3 factors account to 67.110 percent which is relatively a good model.
TABLE 3: ROTATED COMPONENT MATRIX
Reasons Component
1 2 3
Save money .816 .216 -.086
Secure .796 .164 .177
Better quality of product .787 -.146 .385
Convenient .060 .841 .173
Easy to do .126 .834 .024
Privacy policies .101 .544 .480
Variety of products .018 .143 .805
Easy promotion .232 .091 .671
This table shows the rotated component matrix which represents the variables under different factors. The predominant factors include
Factor 1 can be named as Safety benefits including the variables
1. Save money (0.816)
2. Secure (0.796)
3. Better quality of product (0.787)
Factor 2 can be named as Convenience & Privacy including the variables
1. Convenient (0.841)
2. Easy to do (0.834)
3. Privacy policies (0.544)
Factor 3 can be named as Product Range including the variables
1. Variety of products (0.805)
2. Easy promotion (0.671)
The first factor identified through factor analysis is named “Safety benefits”. This factor enumerates the online purchasing behaviour of consumers based on
saving money through online purchase, security of the transaction and better quality of the products purchased online. The second factor identified through factor
analysis is named “Convenience & Privacy”. This factor enumerates factors that induce easiness to the consumers compared to regular shopping like convenience,
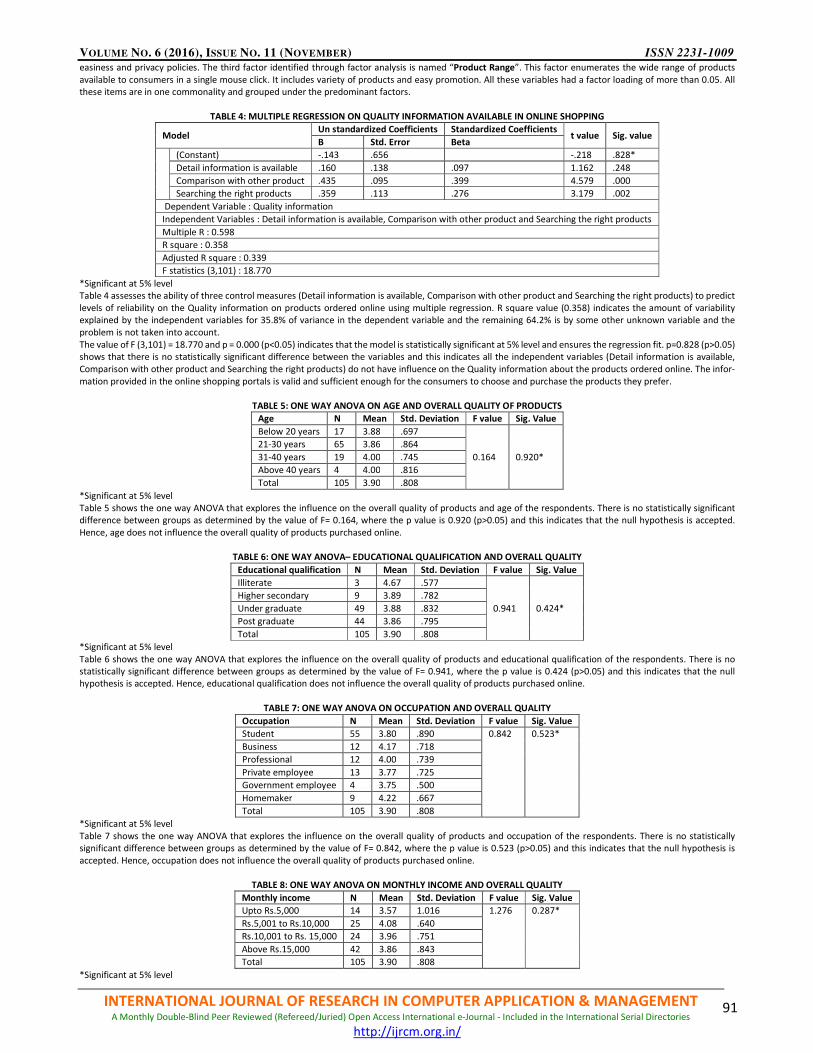
VOLUME NO. 6 (2016), ISSUE NO. 11 (NOVEMBER) ISSN 2231-1009
INTERNATIONAL JOURNAL OF RESEARCH IN COMPUTER APPLICATION & MANAGEMENT A Monthly Double-Blind Peer Reviewed (Refereed/Juried) Open Access International e-Journal - Included in the International Serial Directories
http://ijrcm.org.in/
91
easiness and privacy policies. The third factor identified through factor analysis is named “Product Range”. This factor enumerates the wide range of products
available to consumers in a single mouse click. It includes variety of products and easy promotion. All these variables had a factor loading of more than 0.05. All
these items are in one commonality and grouped under the predominant factors.
TABLE 4: MULTIPLE REGRESSION ON QUALITY INFORMATION AVAILABLE IN ONLINE SHOPPING
Model Un standardized Coefficients Standardized Coefficients
t value Sig. value B Std. Error Beta
(Constant) -.143 .656 -.218 .828*
Detail information is available .160 .138 .097 1.162 .248
Comparison with other product .435 .095 .399 4.579 .000
Searching the right products .359 .113 .276 3.179 .002
Dependent Variable : Quality information
Independent Variables : Detail information is available, Comparison with other product and Searching the right products
Multiple R : 0.598
R square : 0.358
Adjusted R square : 0.339
F statistics (3,101) : 18.770
*Significant at 5% level
Table 4 assesses the ability of three control measures (Detail information is available, Comparison with other product and Searching the right products) to predict
levels of reliability on the Quality information on products ordered online using multiple regression. R square value (0.358) indicates the amount of variability
explained by the independent variables for 35.8% of variance in the dependent variable and the remaining 64.2% is by some other unknown variable and the
problem is not taken into account.
The value of F (3,101) = 18.770 and p = 0.000 (p<0.05) indicates that the model is statistically significant at 5% level and ensures the regression fit. p=0.828 (p>0.05)
shows that there is no statistically significant difference between the variables and this indicates all the independent variables (Detail information is available,
Comparison with other product and Searching the right products) do not have influence on the Quality information about the products ordered online. The infor-
mation provided in the online shopping portals is valid and sufficient enough for the consumers to choose and purchase the products they prefer.
TABLE 5: ONE WAY ANOVA ON AGE AND OVERALL QUALITY OF PRODUCTS
Age N Mean Std. Deviation F value Sig. Value
Below 20 years 17 3.88 .697
0.164 0.920*
21-30 years 65 3.86 .864
31-40 years 19 4.00 .745
Above 40 years 4 4.00 .816
Total 105 3.90 .808
*Significant at 5% level
Table 5 shows the one way ANOVA that explores the influence on the overall quality of products and age of the respondents. There is no statistically significant
difference between groups as determined by the value of F= 0.164, where the p value is 0.920 (p>0.05) and this indicates that the null hypothesis is accepted.
Hence, age does not influence the overall quality of products purchased online.
TABLE 6: ONE WAY ANOVA– EDUCATIONAL QUALIFICATION AND OVERALL QUALITY
Educational qualification N Mean Std. Deviation F value Sig. Value
Illiterate 3 4.67 .577
0.941 0.424*
Higher secondary 9 3.89 .782
Under graduate 49 3.88 .832
Post graduate 44 3.86 .795
Total 105 3.90 .808
*Significant at 5% level
Table 6 shows the one way ANOVA that explores the influence on the overall quality of products and educational qualification of the respondents. There is no
statistically significant difference between groups as determined by the value of F= 0.941, where the p value is 0.424 (p>0.05) and this indicates that the null
hypothesis is accepted. Hence, educational qualification does not influence the overall quality of products purchased online.
TABLE 7: ONE WAY ANOVA ON OCCUPATION AND OVERALL QUALITY
Occupation N Mean Std. Deviation F value Sig. Value
Student 55 3.80 .890 0.842 0.523*
Business 12 4.17 .718
Professional 12 4.00 .739
Private employee 13 3.77 .725
Government employee 4 3.75 .500
Homemaker 9 4.22 .667
Total 105 3.90 .808
*Significant at 5% level
Table 7 shows the one way ANOVA that explores the influence on the overall quality of products and occupation of the respondents. There is no statistically
significant difference between groups as determined by the value of F= 0.842, where the p value is 0.523 (p>0.05) and this indicates that the null hypothesis is
accepted. Hence, occupation does not influence the overall quality of products purchased online.
TABLE 8: ONE WAY ANOVA ON MONTHLY INCOME AND OVERALL QUALITY
Monthly income N Mean Std. Deviation F value Sig. Value
Upto Rs.5,000 14 3.57 1.016 1.276 0.287*
Rs.5,001 to Rs.10,000 25 4.08 .640
Rs.10,001 to Rs. 15,000 24 3.96 .751
Above Rs.15,000 42 3.86 .843
Total 105 3.90 .808
*Significant at 5% level
VOLUME NO. 6 (2016), ISSUE NO. 11 (NOVEMBER) ISSN 2231-1009
INTERNATIONAL JOURNAL OF RESEARCH IN COMPUTER APPLICATION & MANAGEMENT A Monthly Double-Blind Peer Reviewed (Refereed/Juried) Open Access International e-Journal - Included in the International Serial Directories
http://ijrcm.org.in/
92
Table 8 shows the one way ANOVA that explores the influence on the overall quality of products and monthly income of the respondents. There is no statistically
significant difference between groups as determined by the value of F= 1.276, where the p value is 0.287 (p>0.05) and this indicates that the null hypothesis is
accepted. Hence, monthly income does not influence the overall quality of products purchased online.
TABLE 9: INDEPENDENT SAMPLES T-TEST ON GENDER AND OVERALL QUALITY
Reasons Gender N Mean t value Sig. value
Overall rate the quality of the products Male 45 3.96
0.661 0.510* Female 60 3.85
*Significant at 5% level
Table 9 shows the independent samples t- test that compares the overall quality of products and gender of the respondents. There is no statistically significant
difference determined by the value of t= 0.661, where the p value is 0.510 (p>0.05) and this indicates that the null hypothesis is accepted. Hence, gender does not
influence the overall quality of products purchased online.
FINDINGS OF THE STUDY • The results of the factor analysis depict that there are many dimensions associated with consumers’ online buying behaviour and their usage is explored and
understood here. Every day, consumers and households make decisions about the goods and the services they purchase. Online shopping and regular shop-
ping has its own differences. The factors that influence the online buying decision of the consumers are quality, convenience and variety of products. This
research work finds that the consumers’ perception on buying goods is mostly affected by the factors such as Safety, Convenience & Privacy and Product
range.
• The variables detail information is available, comparison with other product and searching the right products do not have influence on the quality information
about the products ordered online. The information provided in the online shopping portals is valid and sufficient enough for the consumers to choose and
purchase the products they prefer.
• The demographic factors of the consumers including age, education, occupation, monthly income and gender do not influence the overall quality of goods
purchased by them through online shopping. It is evident that the consumers purchase goods online irrespective of their age, education, occupation, monthly
income and gender. The analyses also discover that in consumer decision-making process, product promotion, convenience and product information play an
important role while purchasing consumer durables.
SUGGESTIONS AND CONCLUSION The customers should critically analyze the reviews given by other consumers and product specifications given by the online seller before buying a product. Further,
the online buying behaviour is also influenced by the brand awareness among consumers and alternatives of brands available in the market. The factor analysis
conducted in the study has important implications for further research which will be useful for online sellers to customize their products and services for the
general people not only in Thoothukudi district, but also in the other parts of India.
REFERENCES 1. Lelia Voinea and Alina Filip (2010). “Analyzing the Main Changes in New Consumer Buying Behavior during Economic Crisis”. pp:14.
2. Kotler. P and Armstrong. G (1997). “Principles of marketing (9th ED.)”. Cliffs, NJ: Prentice Hall.
3. Saad Akbar and Paul TJ James. “Thailand Consumers’ attitude towards online shopping Factors influencing employees of crazy domains to shop online,”
Journal of Management and Marketing Research, pp:01.
4. Ranganathan and Ganapathy (2002). “Young consumer online shopping: an empirical study,” Journal of internet business, Issue 5-2008.
5. Holbrook, M.B. (1994). “The nature of customer value: an axiology of services in the consumption experience”, Service quality: New directions in Theory and
practice, sage, Newbury park, CA, pp. 21-71.
6. A.C. Nielsen (2007). “Seek and You Shall Buy,” Entertainment and Travel, January 2007, pp:137.
7. Narges Delafrooz, LailyHj Paim and Ali Khatibi (2012). “Students’ Online Shopping,” Journal of American Science, 2010, 6(1), pp:137.

VOLUME NO. 6 (2016), ISSUE NO. 11 (NOVEMBER) ISSN 2231-1009
INTERNATIONAL JOURNAL OF RESEARCH IN COMPUTER APPLICATION & MANAGEMENT A Monthly Double-Blind Peer Reviewed (Refereed/Juried) Open Access International e-Journal - Included in the International Serial Directories
http://ijrcm.org.in/
93
URBAN DEVELOPMENT WITH DIVERSIFICATION OF FUND: A CASE STUDY
RUPAK KARMAKAR
RESEARCH SCHOLAR, WEST BENGAL STATE UNIVERSITY
GUEST LECTURER
DEPARTMENT OF COMMERCE & MANAGEMENT
BARASAT COLLEGE
BARASAT
ABSTRACT In this study we have seen that day by day increment of population will affect the services which local government provide because of lack of revenue collection,
mostly the fund collection by the local bodies in its own source will not enough to fulfill the proper demand, so some central or state grants were converts to the
other are where which is need.
KEYWORDS SUDA, WTP, IHSDP, local bodies, property tax.
ABBREVIATION EGS Employment Generation Scheme
MED Municipal Engineering Directorate
MDM Mid-day Meal
UIDSSMT Urban Infrastructure Development Schemes for Small and Medium Town
IDSMT Integrated Development of Small and Medium Town
PMT Pratidin Media Trust
UIG Urban Infrastructure Governance
BSUP Basic Services for urban Poor
JNNURM Jawaharlal Neheru National Urban Renewal Mission
UDD Urban Development Department
WTP water Treatment Plan
BSHDL Bengal Shelter Housing Development Ltd.
IHSDP Integrated Housing and Slum Development Program
SUDA State Urban Development Agency
SWM Solid Waste Management
INTRODUCTION n India there are two distinct areas which are covered urban as well as rural area, but in the first stage of independence Indian government are divided into
two tier system one is state government & another is central government, but people of remote area suffered have some problem, then central government
create a new government which is called local level government and it is the third tier of government. In recent year population has been increase tremen-
dously as well work load has been increased. So local government will face various kind of problems mostly related their daily life such as health, education &
culture, agriculture, communications, industry & trade, drainage & sanitation. This kind of problem only solved financial inclusion to the local bodies and local
bodies are dependent two kinds of grants, one of them central and state government fund and another of its own source of revenue. Central and state fund are
used various kind of projects but mostly small developmental work and management expenses still dependent of own source of revenue. Some study will observe
in this kind of activity.
LITERATURE REVIEW � Nikolai Mikhailov in his study (1998) “Types of property tax & assessment limitation & tax relief programs” observed that property tax is the main source of
income of local government & urban local government are mostly dependent on that kind of source.
� Roberto de Vera & Yun Hawn Kin (2003) in their study “Local government finance, private resources, and local credit markets in Asia” observed that local
government finance in the region exhibits several problems due to fiscal imbalance, revenue generation, central government fund allotment private saving
for long term infrastructure project etc.
� Richard Henry Carlson (2004) in his study “A brief history of property tax” told in his paper civilization property taxes have been a major source of revenue
of government property tax has been included in our everyday works.
� Gediminas Davulis, Kestutis Peleckis & Neringa Slavinskaite in their study (2013) “Development of local municipality taxes & principles of fiscal policy in
Lithunia” showed that developing fiscal decentralization & collection of various kinds of taxes will help the development of local level.
� M. Prasad Rao & D.V. Rao in their study (2015) “property tax reforms in Andhara Pradesh & Telengana” property tax constitutes the single largest source of
revenue to the urban local bodies in India & reforms of property tax will help the better financial position of local government.
� Charan Singh & Chiranjiv Singh (2015) in their paper “Financing of urban local bodies in India” revealed that imbalance between level of urbanization and
infrastructure development a serious matter due to financial requirement.
� Somik V. Lall & Uwe Deichmann in their study “Fiscal and distributional implications of property tax reforms in Indian cities” observed that proper implication
of property tax will provide significant benefits in terms of increasing revenues.
� Mr. Ilias Dirie in your study “Municipal Finance: Innovative resourcing for municipal infrastructure and service provision” observed that challenging increasing
on local government on key basis service like water, sanitation, primary health care, housing economic & community development with insufficient financial
resources.
OBJECTIVES Except central or state government fund local government development mostly dependent their own source of revenue and most of the collection of own source
of revenue come from tax revenue which include property tax, so proper collection of own fund will reduce the imbalance between expenditure of development
and revenue collection, some objectives of this study will discussed below:
1. To analyze the source of funds.
2. To analyze the modification of funds.
3. To analyze the effect of diversification of funds.
4. To analyze the modes of operation in various schemes.
I
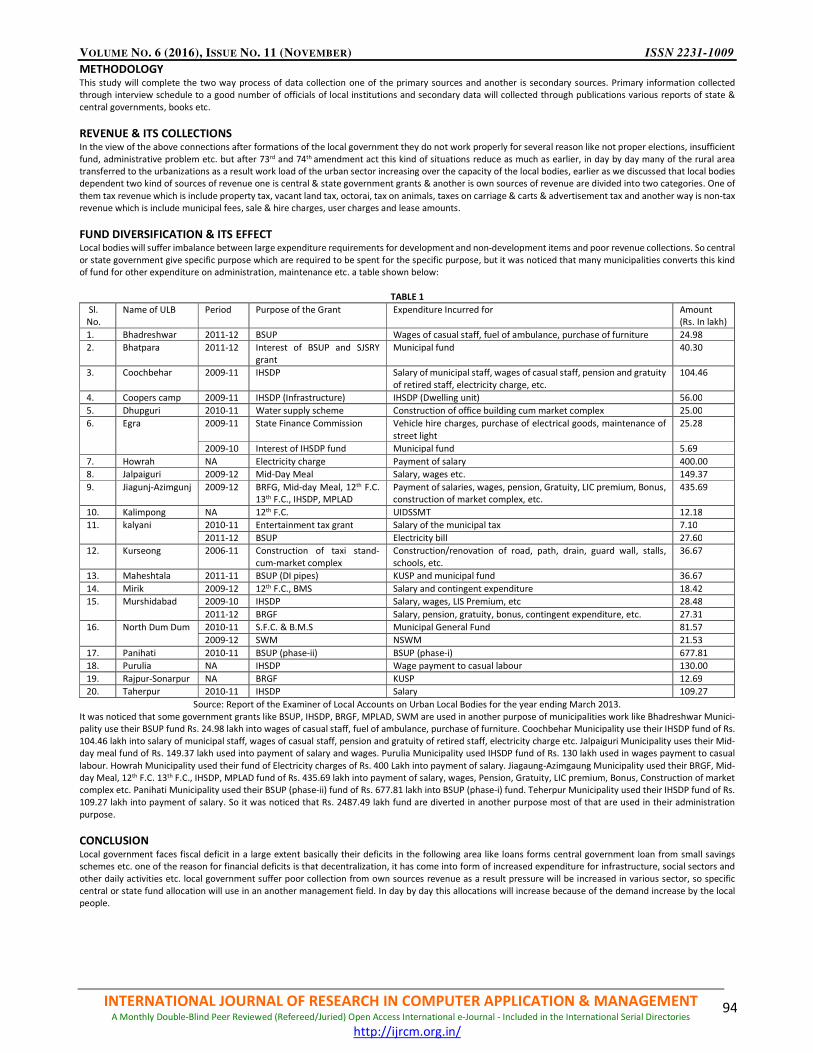
VOLUME NO. 6 (2016), ISSUE NO. 11 (NOVEMBER) ISSN 2231-1009
INTERNATIONAL JOURNAL OF RESEARCH IN COMPUTER APPLICATION & MANAGEMENT A Monthly Double-Blind Peer Reviewed (Refereed/Juried) Open Access International e-Journal - Included in the International Serial Directories
http://ijrcm.org.in/
94
METHODOLOGY This study will complete the two way process of data collection one of the primary sources and another is secondary sources. Primary information collected
through interview schedule to a good number of officials of local institutions and secondary data will collected through publications various reports of state &
central governments, books etc.
REVENUE & ITS COLLECTIONS In the view of the above connections after formations of the local government they do not work properly for several reason like not proper elections, insufficient
fund, administrative problem etc. but after 73rd and 74th amendment act this kind of situations reduce as much as earlier, in day by day many of the rural area
transferred to the urbanizations as a result work load of the urban sector increasing over the capacity of the local bodies, earlier as we discussed that local bodies
dependent two kind of sources of revenue one is central & state government grants & another is own sources of revenue are divided into two categories. One of
them tax revenue which is include property tax, vacant land tax, octorai, tax on animals, taxes on carriage & carts & advertisement tax and another way is non-tax
revenue which is include municipal fees, sale & hire charges, user charges and lease amounts.
FUND DIVERSIFICATION & ITS EFFECT Local bodies will suffer imbalance between large expenditure requirements for development and non-development items and poor revenue collections. So central
or state government give specific purpose which are required to be spent for the specific purpose, but it was noticed that many municipalities converts this kind
of fund for other expenditure on administration, maintenance etc. a table shown below:
TABLE 1
Sl.
No.
Name of ULB Period Purpose of the Grant Expenditure Incurred for Amount
(Rs. In lakh)
1. Bhadreshwar 2011-12 BSUP Wages of casual staff, fuel of ambulance, purchase of furniture 24.98
2. Bhatpara 2011-12 Interest of BSUP and SJSRY
grant
Municipal fund 40.30
3. Coochbehar 2009-11 IHSDP Salary of municipal staff, wages of casual staff, pension and gratuity
of retired staff, electricity charge, etc.
104.46
4. Coopers camp 2009-11 IHSDP (Infrastructure) IHSDP (Dwelling unit) 56.00
5. Dhupguri 2010-11 Water supply scheme Construction of office building cum market complex 25.00
6. Egra 2009-11 State Finance Commission Vehicle hire charges, purchase of electrical goods, maintenance of
street light
25.28
2009-10 Interest of IHSDP fund Municipal fund 5.69
7. Howrah NA Electricity charge Payment of salary 400.00
8. Jalpaiguri 2009-12 Mid-Day Meal Salary, wages etc. 149.37
9. Jiagunj-Azimgunj 2009-12 BRFG, Mid-day Meal, 12th F.C.
13th F.C., IHSDP, MPLAD
Payment of salaries, wages, pension, Gratuity, LIC premium, Bonus,
construction of market complex, etc.
435.69
10. Kalimpong NA 12th F.C. UIDSSMT 12.18
11. kalyani 2010-11 Entertainment tax grant Salary of the municipal tax 7.10
2011-12 BSUP Electricity bill 27.60
12. Kurseong 2006-11 Construction of taxi stand-
cum-market complex
Construction/renovation of road, path, drain, guard wall, stalls,
schools, etc.
36.67
13. Maheshtala 2011-11 BSUP (DI pipes) KUSP and municipal fund 36.67
14. Mirik 2009-12 12th F.C., BMS Salary and contingent expenditure 18.42
15. Murshidabad 2009-10 IHSDP Salary, wages, LIS Premium, etc 28.48
2011-12 BRGF Salary, pension, gratuity, bonus, contingent expenditure, etc. 27.31
16. North Dum Dum 2010-11 S.F.C. & B.M.S Municipal General Fund 81.57
2009-12 SWM NSWM 21.53
17. Panihati 2010-11 BSUP (phase-ii) BSUP (phase-i) 677.81
18. Purulia NA IHSDP Wage payment to casual labour 130.00
19. Rajpur-Sonarpur NA BRGF KUSP 12.69
20. Taherpur 2010-11 IHSDP Salary 109.27
Source: Report of the Examiner of Local Accounts on Urban Local Bodies for the year ending March 2013.
It was noticed that some government grants like BSUP, IHSDP, BRGF, MPLAD, SWM are used in another purpose of municipalities work like Bhadreshwar Munici-
pality use their BSUP fund Rs. 24.98 lakh into wages of casual staff, fuel of ambulance, purchase of furniture. Coochbehar Municipality use their IHSDP fund of Rs.
104.46 lakh into salary of municipal staff, wages of casual staff, pension and gratuity of retired staff, electricity charge etc. Jalpaiguri Municipality uses their Mid-
day meal fund of Rs. 149.37 lakh used into payment of salary and wages. Purulia Municipality used IHSDP fund of Rs. 130 lakh used in wages payment to casual
labour. Howrah Municipality used their fund of Electricity charges of Rs. 400 Lakh into payment of salary. Jiagaung-Azimgaung Municipality used their BRGF, Mid-
day Meal, 12th F.C. 13th F.C., IHSDP, MPLAD fund of Rs. 435.69 lakh into payment of salary, wages, Pension, Gratuity, LIC premium, Bonus, Construction of market
complex etc. Panihati Municipality used their BSUP (phase-ii) fund of Rs. 677.81 lakh into BSUP (phase-i) fund. Teherpur Municipality used their IHSDP fund of Rs.
109.27 lakh into payment of salary. So it was noticed that Rs. 2487.49 lakh fund are diverted in another purpose most of that are used in their administration
purpose.
CONCLUSION Local government faces fiscal deficit in a large extent basically their deficits in the following area like loans forms central government loan from small savings
schemes etc. one of the reason for financial deficits is that decentralization, it has come into form of increased expenditure for infrastructure, social sectors and
other daily activities etc. local government suffer poor collection from own sources revenue as a result pressure will be increased in various sector, so specific
central or state fund allocation will use in an another management field. In day by day this allocations will increase because of the demand increase by the local
people.
VOLUME NO. 6 (2016), ISSUE NO. 11 (NOVEMBER) ISSN 2231-1009
INTERNATIONAL JOURNAL OF RESEARCH IN COMPUTER APPLICATION & MANAGEMENT A Monthly Double-Blind Peer Reviewed (Refereed/Juried) Open Access International e-Journal - Included in the International Serial Directories
http://ijrcm.org.in/
95
SUGGESTIONS In the above context we have seen that financial imbalance between expenditure requirement for developments and poor revenue collection will effect the local
bodies, so proper collection of own revenue will help the better control to the local bodies, maximum collection of own source of revenue will get from tax
collection and property tax is the main source of revenue. Although some suggestion in my mind which I discussed below:
1) Time to time revision of tax policy will help the better control.
2) Proper implication on taxation will also help the services in better control.
3) Valuation of property will be computed systematically.
4) Rent collection of leasehold property systematically.
5) Tax structure will upgrade time to time etc.
REFERENCES 1. Andrejs Skaburskis & Ray Tomalty, “The effect of property taxes & developments cost charges on urban developments: perspectives of planners, developers
& finance officers in Toronto sottawa”.
2. Charan Singh & Chiranjiv Singh (2015), Financing of urban local bodies in India.
3. Evaluation of tax system in India, Chapter- II.
4. Gediminas Davulis, Kestutis Peleckis & Neringa Slavinskaite (2013), Development of local municipality taxes & principles of fiscal policy in Lithunia. American
journal of contemporary research vol.3 No.8, August 2013.
5. M. Govinda Rao (2013), property tax system in India: Problems & Prospects of reform, working paper no. 2013-2014.
6. M. Prasad Rao & D. V. Rao (2015), property tax reforms in Andhara Pradesh & Telengana.
7. Mr. Ilias Dirie, Municipal Finance: Innovative resourcing for municipal infrastructure and service provision.
8. Nikolai Mikhailov (1998), Types of property tax & assessment limitation & tax relief programs.
9. Prasanta Prakash (2013), property taxes across G20 countries: can India act it right? OXFAM working paper series, OIWPS-XV.
10. Property tax ULB level reform.
11. Richard Henry Carlson (2004), A brief history of property tax.
12. Roberto de Vera & Yun Hawn Kin (2003), Local government finance, private resources, and local credit markets in Asia. www.adb.org/Economics
13. Simanti Bandyopadhyay (2013), property taxation in Indian cities: A comparison of Delhi & Bangalore.
14. Somik V. Lall & Uwe Deichmann, Fiscal and distributional implications of property tax reforms in Indian cities.

VOLUME NO. 6 (2016), ISSUE NO. 11 (NOVEMBER) ISSN 2231-1009
INTERNATIONAL JOURNAL OF RESEARCH IN COMPUTER APPLICATION & MANAGEMENT A Monthly Double-Blind Peer Reviewed (Refereed/Juried) Open Access International e-Journal - Included in the International Serial Directories
http://ijrcm.org.in/
96
REQUEST FOR FEEDBACK
Dear Readers
At the very outset, International Journal of Research in Computer Application & Management (IJRCM)
acknowledges & appreciates your efforts in showing interest in our present issue under your kind perusal.
I would like to request you to supply your critical comments and suggestions about the material published
in this issue, as well as on the journal as a whole, on our e-mail [email protected] for further improve-
ments in the interest of research.
If you have any queries, please feel free to contact us on our e-mail [email protected].
I am sure that your feedback and deliberations would make future issues better – a result of our joint effort.
Looking forward to an appropriate consideration.
With sincere regards
Thanking you profoundly
Academically yours
Sd/-
Co-ordinator
DISCLAIMER The information and opinions presented in the Journal reflect the views of the authors and not of the Journal
or its Editorial Board or the Publishers/Editors. Publication does not constitute endorsement by the journal.
Neither the Journal nor its publishers/Editors/Editorial Board nor anyone else involved in creating, producing
or delivering the journal or the materials contained therein, assumes any liability or responsibility for the
accuracy, completeness, or usefulness of any information provided in the journal, nor shall they be liable for
any direct, indirect, incidental, special, consequential or punitive damages arising out of the use of infor-
mation/material contained in the journal. The journal, neither its publishers/Editors/ Editorial Board, nor any
other party involved in the preparation of material contained in the journal represents or warrants that the
information contained herein is in every respect accurate or complete, and they are not responsible for any
errors or omissions or for the results obtained from the use of such material. Readers are encouraged to
confirm the information contained herein with other sources. The responsibility of the contents and the
opinions expressed in this journal are exclusively of the author (s) concerned.
VOLUME NO. 6 (2016), ISSUE NO. 11 (NOVEMBER) ISSN 2231-1009
INTERNATIONAL JOURNAL OF RESEARCH IN COMPUTER APPLICATION & MANAGEMENT A Monthly Double-Blind Peer Reviewed (Refereed/Juried) Open Access International e-Journal - Included in the International Serial Directories
http://ijrcm.org.in/
II