Volume kinetics of acetated Ringer's solution during ...441425/FULLTEXT01.pdf · Hahn et al: Fluid...
24
Volume kinetics of acetated Ringer's solution during experimental spinal anaesthesia Robert Hahn, C C Lindahl, and Drobin Linköping University Post Print N.B.: When citing this work, cite the original article. This is the pre-reviewed version of the following article: Robert Hahn, C C Lindahl, and Drobin, Volume kinetics of acetated Ringer's solution during experimental spinal anaesthesia, 2011, Acta Anaesthesiologica Scandinavica, (55), 8, 987- 994. which has been published in final form at: http://dx.doi.org/10.1111/j.1399-6576.2011.02493.x Copyright: Wiley-Blackwell http://eu.wiley.com/WileyCDA/Brand/id-35.html Postprint available at: Linköping University Electronic Press http://urn.kb.se/resolve?urn=urn:nbn:se:liu:diva-70736
Transcript of Volume kinetics of acetated Ringer's solution during ...441425/FULLTEXT01.pdf · Hahn et al: Fluid...

Volume kinetics of acetated Ringer's solution
during experimental spinal anaesthesia
Robert Hahn, C C Lindahl, and Drobin
Linköping University Post Print
N.B.: When citing this work, cite the original article.
This is the pre-reviewed version of the following article:
Robert Hahn, C C Lindahl, and Drobin, Volume kinetics of acetated Ringer's solution during
experimental spinal anaesthesia, 2011, Acta Anaesthesiologica Scandinavica, (55), 8, 987-
994.
which has been published in final form at:
http://dx.doi.org/10.1111/j.1399-6576.2011.02493.x
Copyright: Wiley-Blackwell
http://eu.wiley.com/WileyCDA/Brand/id-35.html
Postprint available at: Linköping University Electronic Press
http://urn.kb.se/resolve?urn=urn:nbn:se:liu:diva-70736

Hahn et al: Fluid Dynamics During Spinal Anesthesia
1
Volume kinetics of acetated Ringer’s solution during
experimental spinal anesthesia
Robert G. Hahn,1,2 Christina C. Lindahl
3, and Dan Drobin
1
1 Department of Anesthesia at the Faculty of Health Sciences, Linköping University,
Linköping, 2Research Unit, Södertälje Hospital, Södertälje, Sweden.
3 Department of
Anesthesia, Karolinska University Hospital, Stockholm,
The study was conducted at Södersjukhuset, Stockholm, Sweden, where all authors
worked when the data was collected.
Address for correspondence:
Robert G. Hahn, MD, PhD
Section of Anesthesia
Faculty of Health Sciences
Linköping University
581 85 Linköping, Sweden
Telephone: +467395660972
E-m ail: r .h a h n @t e lia .co m
Short title: Fluid dynamics during spinal anesthesia

Hahn et al: Fluid Dynamics During Spinal Anesthesia
2
Abstract
Background: General anesthesia lowers the clearance of crystalloid fluid, but
the volume kinetics of such fluid throughout the duration of spinal anesthesia has not
been studied.
Methods: Ten female volunteers (mean age 29 years) received an intravenous
infusion of 25 ml/kg of acetated Ringer’s solution with and without spinal anesthesia.
A volume kinetic model was fitted to serial measurements of the hemoglobin
concentration over 240 min based on arterial, cubital vein, and femoral vein blood.
The measured urine flow was compared to the model-predicted elimination.
Results: The arterial pressure remained stable although the block reached to
Th3-Th5 in half of the volunteers. There were no differences in fluid kinetics between
the spinal anesthesia and the control experiments. The administered volume was well
confined to the kinetic system, which consisted of two communicating fluid spaces
that were 2.8 L and approximately 7 L in size at baseline. The arteriovenous (AV)
difference in plasma dilution remained positive for 30 min post-infusion in those
having analgesia reaching to Th3-Th5, which differed significantly from low-level
analgesia (Th12-L2, P< 0.03) when venous plasma was sampled from the leg. The
urinary excretion averaged 1.13 L and 1.01 L for the spinal and control experiments,
respectively. Volume kinetics predicted the urinary excretion at 5-10 min intervals
with an overall bias of 52 ml.
Conclusion: Acetated Ringer’s solution showed the same kinetics during
experimental spinal anesthesia as when the fluid was infused alone. Hence, spinal
anesthesia is not associated with the reduced fluid clearance reported for general
anesthesia.
Key words. Anesthetic techniques, subarachnoid;
Fluids, IVi.v.; Model, pharmacokinetic;

Hahn et al: Fluid Dynamics During Spinal Anesthesia
3
Introduction
Intravenous (IV) fluid therapy remains the first choice for cardiovascular support
during anesthesia and surgery. Volume kinetic studies show that the renal clearance
(Clr) for crystalloid fluid is greatly reduced during general anesthesia. During thyroid1
as well as laparoscopic2 and open abdominal
3 surgery, Clr is only 5-20 ml/min, while
it is usually 60-100 ml/min in conscious volunteers.4,5
Isoflurane alone lowers Clr for
crystalloid fluid by 50%.6
The distribution of fluid may also become aberrant.1,7
In contrast to general anesthesia, the capacity of spinal anesthesia to modify the
kinetics of crystalloid fluid is poorly known. Just as with general anesthesia,8 the onset
of spinal anesthesia lowers the distribution clearance (Cld) in proportion to the
reduction of the arterial pressure.8-10
However, the distribution and elimination of
crystalloid fluid throughout the course of spinal anesthesia has not been studied.
The aim of the present study was to compare the kinetics of acetated Ringer’s
solution with and without experimental spinal anesthesia in volunteers. The
distribution of fluid in the presence of spinal block was further explored by collecting
blood from three sampling sites and by continuous collection of excreted urine. Our
hypothesis was that spinal anesthesia increases the plasma volume expansion in
response to crystalloid fluid either by reducing Cld or Clr. We also wished to examine
whether the anesthesia promotes aberrant distribution of the administered fluid.

Hahn et al: Fluid Dynamics During Spinal Anesthesia
4
Materials and Methods
Ten healthy female volunteers, aged 21-39 (mean 29) years with a body weight of 58-
67 kg (mean 62.5 kg) participated as paid volunteers in two experiments separated by
at least one week. The protocol was approved by the Regional Ethics Committee of
Karolinska institutet. Each volunteer gave her written informed consent after a
medical examination confirmed that she was in good health. None of them used daily
medication.
The volunteers arrived at the hospital at 8 AM. No oral fluid or food was
allowed between midnight and completion of the experiment. Both experiments
consisted of the subject receiving an IV infusion of 25 ml/kg acetated Ringer’s
solution (Na 130, Cl 110, Ca 2, K 4, acetate- 30 mmol/L; osmolality 273 mosm/L)
provided by an infusion pump (Flo-Guard 6201, Baxter, IL). Blood and urine were
sampled over 240 min for later kinetic calculations of the distribution and elimination
of the volume load.
On one occasion, the volunteers received fluid and an experimental spinal
anesthesia while on the other occasion they received only the fluid volume (control).
Experimental procedure
Instrumentation during the spinal anesthesia experiment consisted of cannule
for sampling blood from the radial artery, cubital vein, and femoral vein, and
placement of an indwelling catheter into the bladder. A cannula was also placed in the
cubital vein of the opposite arm for the administration of fluid. A period of 20 min in
the supine position was allowed for equilibration before the infusion was started, and
the volunteers remained in bed during the observation time.
Preloading was performed as a safeguard against undetected hypovolemia.
Hence, acetated Ringer’s solution was infused over 60 min and spinal anesthesia
induced after 30 min. For this purpose, the volunteer was placed in a lateral position
until the anesthesia was given, after which the supine position reassumed. We used a
Whitacre pencil-point 26 gauge needle (Becton Dickinson, Franklin Lake, NJ) and 3.0
Hahn et al: Fluid Dynamics During Spinal Anesthesia
5
ml bupivacaine hydrochloride 5 mg/ml (AstraZeneca AB, Södertalje, Sweden) was
administered medially in the lumbar 3-4 interspace. The spread of the analgesia was
tested with loss of cold sensation every 5-10 min until the block began to subside.
Intravenous ephedrine 5-10 mg was planned to be withheld until arterial hypotension
coincided with nausea and/or bradycardia.
The control experiment differed from the first protocol in that blood was only
sampled from a cubital vein and that the acetated Ringer’s solution was administered
as a standard 30-min infusion.4, 5, 11
Measurements
Blood samples (4 ml) were taken, and the urinary excretion was measured every 5 min
during the first 120 min and every 10 min thereafter up to 240 min. A discard volume
of 3 ml was drawn before each blood collection. This blood was then returned and the
cannula flushed with 3 ml of saline to prevent clotting and to replace the amount of
withdrawn plasma.
The hemoglobin (Hb) concentration in whole blood, the red blood cell count,
and the mean corpuscular volume were measured by a Technicon H2 (Bayer,
Tarrytown, NY) using colorimetry at 546 nm for Hb, and light dispersion using a
helium neon laser for the other two parameters. Duplicate samples drawn at baseline
assured a CV of 0.8% for Hb (n=40); the mean values were used in the calculations.
Heart rate and non-invasive arterial pressure were displayed on an AS 3-
monitor (Datex, Finland). Peripheral oxygen saturation and EKG were also monitored.
Each experiment was performed by two anesthesiologists and one anesthesia nurse,
which allowed withdrawal of exactly timed blood samples and assured the best
possible control of the safety of the volunteers.
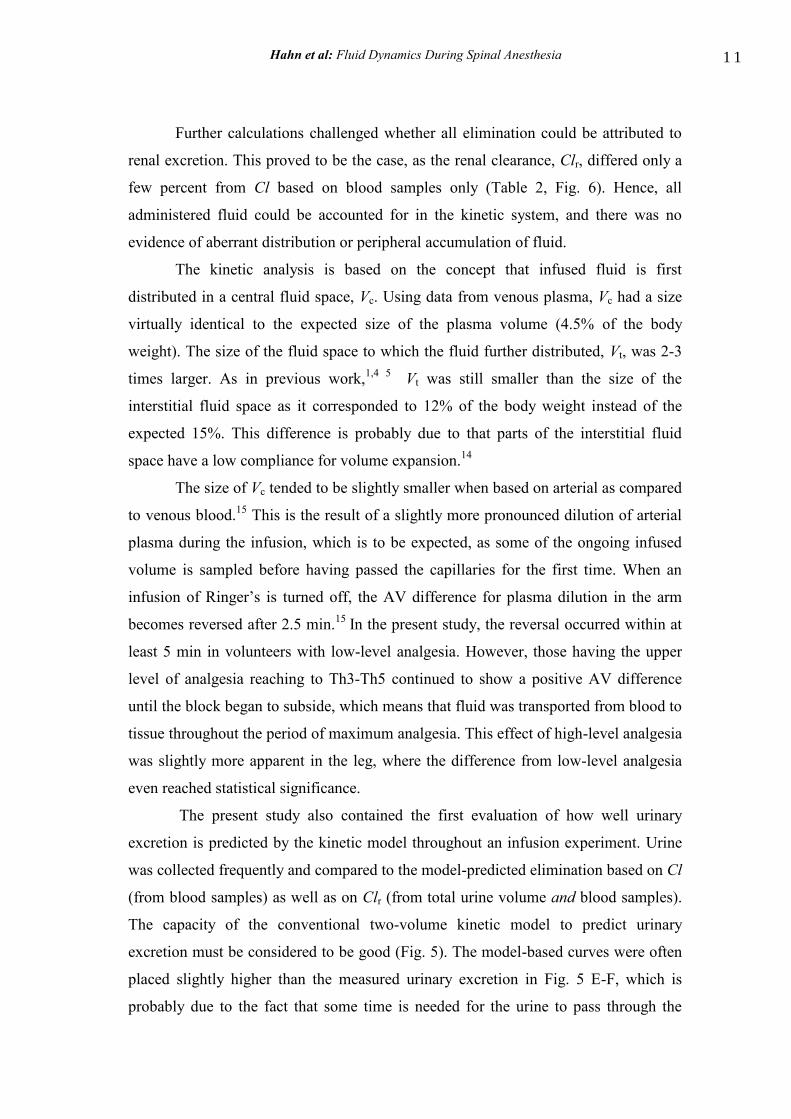
Kinetic analysis
Th e d is t r ib u t io n a n d e lim in a t io n o f t h e flu id given b y IV in fu sio n
wa s a n a ly zed b y fit t in g a t wo -vo lu m e flu id -sp a ce m o d e l t o t h e Hb -
d e r ived p la sm a d ilu t io n .1 -8 ,1 1
A clearance constant Cl describes elimination,
Cld describes distribution and Clo denotes baseline fluid losses (pre-set to 0.4
ml/min1 3
). The infusion is given at rate Ro and expands two functional volumes, a
Hahn et al: Fluid Dynamics During Spinal Anesthesia
6
central volume Vc to the larger size vc and a peripheral volume Vt to vt (Fig. 1 ) . The
differential equations are:
dvc
dt RoCloCl
(vc(t)Vc)
Vc Cld
(vc(t)Vc)
Vc
(vt(t)Vt)
Vt
dvt
dtCld
(vc(t)Vc)
Vc
(vt(t)Vt)
Vt
a t a n y t im e t . Th e Hb -d e r ived fr a ct io n a l p la sm a d ilu t io n wa s u sed
t o in d ica t e t h e vo lu m e exp a n sio n o f Vc r e su lt in g fr o m t h e
in fu sio n :
vc(t )Vc
Vc
Hb/Hb(t ) 1)
(1Hct)
A co r r ect io n fo r t h e e ffect o f b lo o d sa m p lin g wa s m a d e o n t h e
p la sm a d ilu t io n .1
The renal clearance of the infused fluid (Clr) was calculated based on the total
urinary excretion divided by the area under the curve (AUC) of the plasma dilution-
time profile:4
Clr urine volume
AUC for (vc(t )Vc) /Vc
The matrix solutions to the differential equations describing the two-volume
kinetic model4 were fitted to the data from each volunteer and sampling site separately
by using a nonlinear least-squares regression routine, based on a Gauss-Newton
method and programmed in Matlab 4.2 (MathWorks Inc., Natick, MA). This was
repeated until no parameter changed by more than 0.1% in each iteration.
The volumes of vc and v
t over time were calculated by multiplying their
dilutions with Vc and V
t, which transformed (v
c–V
c) / V
c into (v
c–V
c) .

Hahn et al: Fluid Dynamics During Spinal Anesthesia
7
The urinary excretion over time was assessed in three ways: (1) from the urine
collections at 5-10 min intervals, (2) as the cumulative product of the plasma dilution
at any time and the Cl obtained by the curve-fitting, and (3) as the cumulative product
of the plasma dilution and Clr, the latter of which was based on the total urinary
excretion between 0 and 240 min.

Hahn et al: Fluid Dynamics During Spinal Anesthesia
8
Statistics
Data are presented as the mean and standard deviation (SD) or, if the distribution was
skewed, as the median and interquartile range. Statistics was performed by using one-
way and repeated-measures ANOVA, the Wilcoxon matched-pair test, and linear
regression analysis. A systematic difference between predicted and measured data (i.e.
the bias) was expressed as the median residual error. The absolute value for the
difference between predicted and measured data was used to quantify the precision of
the prediction. P< 0.05 was considered statistically significant.
Results
Spinal block and hemodynamics
After induction at 30 min, the onset of the block was rapid and the cephalic spread
peaked at 60 (51-65) min. The upper level of the analgesia reached Th5 (Th3-L2) and
the block began to subside at 108 (101-122) min (Fig. 2 A). It was not possible to
safely determine the return of sensation due to patchy recovery, but half of the
volunteers had residual analgesia at the end of the experiment (at 240 min).
The arterial pressure tended to be slightly higher at baseline when spinal
anesthesia was to be induced, but the difference from the controls was not statistically
significant (Table 1). Minor hemodynamic changes occurred in the presence of spinal
anesthesia (Fig. 2 B-D). Here, the arterial pressure declined slightly, the lowest being
recorded at 60 min (30 min after the induction).
One volunteer was given 10 mg ephedrine intravenously when her systolic
arterial pressure fell from 113 to 79 mmHg in 10 min, after which the pressure
recovered instantly to 104 mmHg. This was the only complication. The event occurred
in the volunteer who had the fastest onset of the anesthesia but was not associated with
nausea or bradycardia.

Hahn et al: Fluid Dynamics During Spinal Anesthesia
9
Plasma dilution
The induction of anesthesia created a temporary notch in the plasma dilution-time
profile, but there was no marked difference in its overall shape as compared to the
control infusions (Fig. 3).
As the dilution-time curves from the three sampling sites had quite similar
appearance (Fig. 3 A-C), the distribution of fluid was further explored by plotting the
AV differences in plasma dilution (Fig. 3 D, E). The arm showed a slightly greater AV
difference than the leg, but statistical significance was not reached. However, the six
volunteers with the highest level of analgesia (Th3-Th5) had a positive AV difference
for some time even after the infusion ended, which was not the case for the four
having low-level analgesia (Th12-L2). This difference between low-level and high-
level analgesia was most apparent in the leg at between 65-90 min of the study, where
it also reached statistical significance (P< 0.03).
Arterial blood tended to yield lower Vc than venous blood, but otherwise
kinetic parameter estimates from the three sampling sites were quite similar (Table 2).
The renal clearance (Clr) was close that the total clearance (Cl).
There was no significant difference between the two series of experiments with
regard to the fluid kinetics calculated from cubital vein blood (Table 2).
Simulations
The median values of the parameter estimates based on cubital vein blood were used
for further computer simulations to highlight the disposition of the infused fluid.
The fluid volume residing in vt already exceeded that of vc at the end of the
infusions. At that time, 24% and 40%, respectively, of the fluid administered during
the spinal and control experiments, respectively, remained in vc (Fig. 4 A, B). This
difference was due to the infusion time, as the fraction of the fluid that was retained in
vc decreased in a similar way throughout the infusion period (Fig. 4 C).
The relationship between the excess volumes residing in Vt and Vc [i.e. the
ratio (vt–Vt)/(vc–Vc)] stabilized 25 min after each infusion at a ratio of approximately 3
(Fig. 4 D). This ratio was slightly higher than the relationship between the baseline
volumes Vt /Vc due to the fact that elimination occurs from vc (Table 2).

Hahn et al: Fluid Dynamics During Spinal Anesthesia
1 0
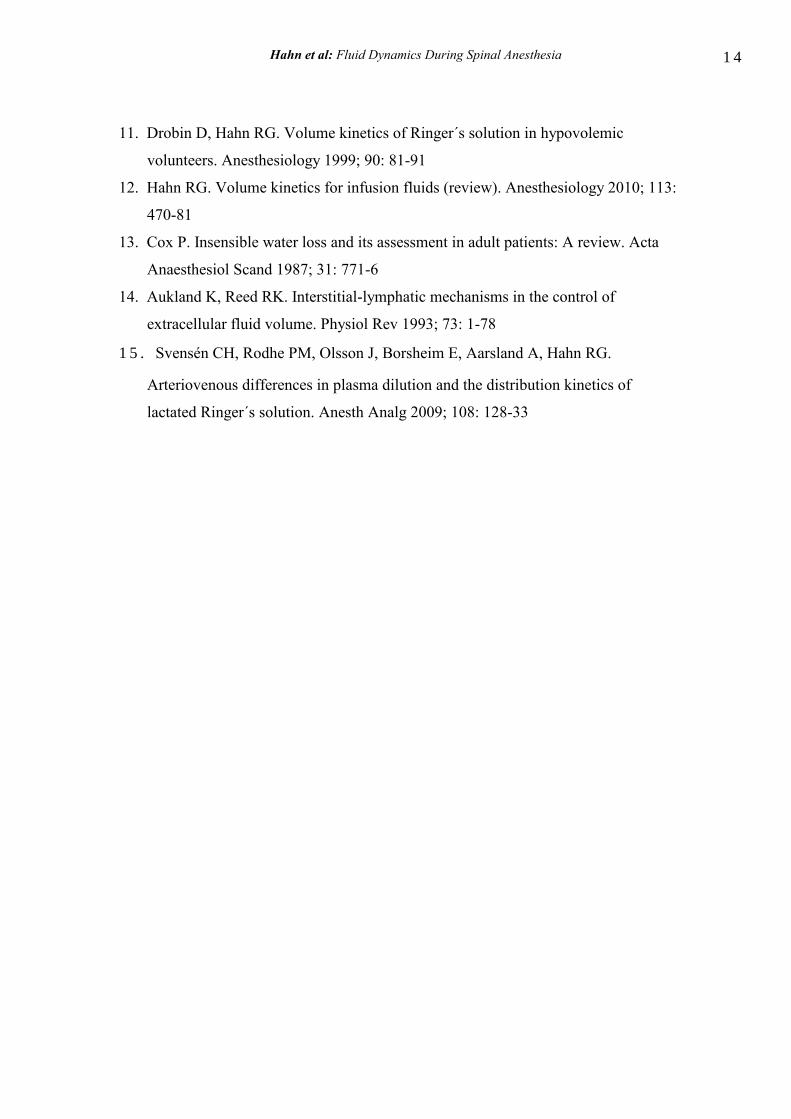
Urinary excretion
The total urinary excretion was similar for the two experiments (Table 1, bottom). The
urine flow was assessed by frequent direct measurement but also by two kinetic
approaches (Fig. 5 A-D). A comparison shows that the two kinetic approaches slightly
overestimated the urinary excretion, the overall median residual error (the bias) being -
52 ml. The median absolute residual error (the inaccuracy) for the difference between
the predicted and measured urine volumes based on all data points for both kinetic
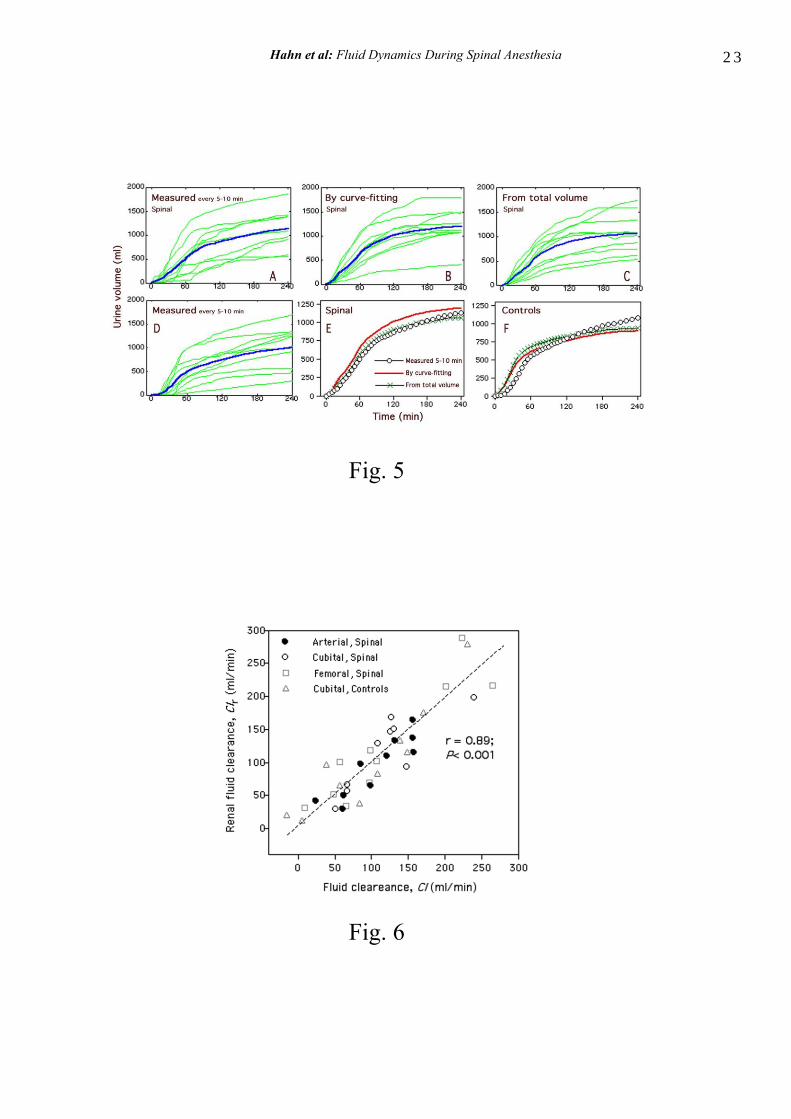
methods was 69 ml (Fig. 5 E, F). There was a strong overall linear correlation between
the clearance values obtained by the two kinetic approaches (Fig. 6).
Discussion
The distribution and elimination of acetated Ringer’s solution during experimental
spinal anesthesia was quite similar to that of a control infusion. Hence, the results
refute our hypothesis that pronounced plasma volume expansion would result from
crystalloid fluid during spinal anesthesia alone. We believed that the mechanism for
such a change could be a reduction of either Cld or Clr, but no such change occurred.
Previous work shows that the onset on both general an regional anesthesia
markedly reduces Cld which degree correlates with the accompanying decrease in
arterial pressure.8-10,12
The fact that the Cld reported here was close to values
previously found in volunteers not receiving anesthesia4,11
can be understood from the
stable arterial pressure recorded in nearly all of the present subjects (Fig. 2). Hence,
spinal block without hypotension does not change the fluid distribution.
The fluid clearance, Cl, was slightly above 100 ml/min, which is normal for
volunteers,14
although lower values have occasionally been reported.5 In any event, the
very marked reduction of Cl to only 5-20 ml/min during thyroid1 and abdominal
surgery2,3
and general anesthesia alone6 was not at hand. The Cl rather tended to be
slightly higher with than without the block (Table 2).
Hahn et al: Fluid Dynamics During Spinal Anesthesia
1 1
Further calculations challenged whether all elimination could be attributed to
renal excretion. This proved to be the case, as the renal clearance, Clr, differed only a
few percent from Cl based on blood samples only (Table 2, Fig. 6). Hence, all
administered fluid could be accounted for in the kinetic system, and there was no
evidence of aberrant distribution or peripheral accumulation of fluid.
The kinetic analysis is based on the concept that infused fluid is first
distributed in a central fluid space, Vc. Using data from venous plasma, Vc had a size
virtually identical to the expected size of the plasma volume (4.5% of the body
weight). The size of the fluid space to which the fluid further distributed, Vt, was 2-3
times larger. As in previous work,1,4 5
Vt was still smaller than the size of the
interstitial fluid space as it corresponded to 12% of the body weight instead of the
expected 15%. This difference is probably due to that parts of the interstitial fluid
space have a low compliance for volume expansion.14
The size of Vc tended to be slightly smaller when based on arterial as compared
to venous blood.15
This is the result of a slightly more pronounced dilution of arterial
plasma during the infusion, which is to be expected, as some of the ongoing infused
volume is sampled before having passed the capillaries for the first time. When an
infusion of Ringer’s is turned off, the AV difference for plasma dilution in the arm
becomes reversed after 2.5 min.15
In the present study, the reversal occurred within at
least 5 min in volunteers with low-level analgesia. However, those having the upper
level of analgesia reaching to Th3-Th5 continued to show a positive AV difference
until the block began to subside, which means that fluid was transported from blood to
tissue throughout the period of maximum analgesia. This effect of high-level analgesia
was slightly more apparent in the leg, where the difference from low-level analgesia
even reached statistical significance.
The present study also contained the first evaluation of how well urinary
excretion is predicted by the kinetic model throughout an infusion experiment. Urine
was collected frequently and compared to the model-predicted elimination based on Cl
(from blood samples) as well as on Clr (from total urine volume and blood samples).
The capacity of the conventional two-volume kinetic model to predict urinary
excretion must be considered to be good (Fig. 5). The model-based curves were often
placed slightly higher than the measured urinary excretion in Fig. 5 E-F, which is
probably due to the fact that some time is needed for the urine to pass through the

Hahn et al: Fluid Dynamics During Spinal Anesthesia
1 2
kidneys and ureters in order to enter an external urine bag. This delay affected the
urine collections at all times.
Limitations of the study include that safety reasons prompted a 30-min pre-
loading period before spinal anesthesia was induced, which is included in the kinetic
analysis. The block resolved at various speeds, whereby some late periods of limited
anesthesia could be included in the kinetic analysis. Besides that the volume loading
before the block is induced is still widely practiced clinically, partial derivatives show
that the data obtained during the period when the anesthesia was fully developed
contributed the most information to the parameter estimates.
Consideration should be given to the fact that the frequent blood sampling
from three sites in the spinal anesthesia experiment created a more or less continuous
small bleeding which finally amounted to 400 ml. The plasma was replaced by
crystalloid fluid, but the loss of Hb was corrected for in our computer program, as it
creates iatrogenic dilution.1 Without such a correction, the return of the hemodilution
would not be as prompt as shown in Fig. 3. In contrast, the collected blood during the
control experiments amounted to only slightly below 150 ml.
In conclusion, the volume kinetics of acetated Ringer’s solution during
experimental spinal anesthesia with stable hemodynamics did not differ from that
obtained for a control infusion. In both experiments the urinary excretion was well
predicted by the kinetic analysis.
Acknowledgement: Eva Thuresson assisted during the experiments.
Financial support was given by Södersjukhuset AB Research Fund.

Hahn et al: Fluid Dynamics During Spinal Anesthesia
1 3
References
1. Ewaldsson C-A, Hahn RG. Kinetics and extravascular retention of acetated
Ringer´s solution during isoflurane and propofol anesthesia for thyroid surgery.
Anesthesiology 2005; 103: 460-9
2. Olsson J, Svensén CH, Hahn RG. The volume kinetics of acetated Ringer´s
solution during laparoscopic cholecystectomy. Anesth Analg 2004; 99: 1854-60
3. Svensén CH, Olsson J, Hahn RG. Intravascular fluid administration and
hemodynamic performance during open abdominal surgery. Anesth Analg 2006:
103: 671-6
4. Hahn RG, Drobin D. Urinary excretion as an input variable in volume kinetic
analysis of Ringer´s solution. Br J Anaesth 1998; 80: 183-8
5. Drobin D, Hahn RG. Kinetics of isotonic and hypertonic plasma volume
expanders. Anesthesiology 2002; 96: 1371-80
6. Norberg Å, Hahn RG, Husong Li, Olsson J, Prough DS, Börsheim E, Wolf S,
Minton R, Svensén CH. Population volume kinetics predicts retention of 0.9%
saline infused in awake and isoflurane-anesthetized volunteers. Anesthesiology
2007; 107: 24-32
7. Connolly CM, Kramer GC, Hahn RG, Chaisson NF, Svensén C, Kirschner RA,
Hastings DA, Chinkes D, Prough DS. Isoflurane but not mechanical ventilation
promotes extravascular fluid accumulation during crystalloid volume loading.
Anesthesiology 2003; 98: 670-81
8. Li Y, Zhu S, Hahn RG. The kinetics of Ringer´s solution in young and elderly
patients during induction of general and epidural anesthesia. Acta Anaesth Scand
2007; 51: 880-7
9. Drobin D, Hahn RG. Time course of increased haemocdilution in hypotension
induced by extradural anaesthesia. Br J Anaesth 1996: 77: 223-6
10. Ewaldsson C-A, Hahn RG. Volume kinetics during induction of spinal and general
anaesthesia. Br J Anaesth 2001; 87: 406-14
Hahn et al: Fluid Dynamics During Spinal Anesthesia
1 4
11. Drobin D, Hahn RG. Volume kinetics of Ringer´s solution in hypovolemic
volunteers. Anesthesiology 1999; 90: 81-91
12. Hahn RG. Volume kinetics for infusion fluids (review). Anesthesiology 2010; 113:
470-81
13. Cox P. Insensible water loss and its assessment in adult patients: A review. Acta
Anaesthesiol Scand 1987; 31: 771-6
14. Aukland K, Reed RK. Interstitial-lymphatic mechanisms in the control of
extracellular fluid volume. Physiol Rev 1993; 73: 1-78
1 5 . Svensén CH, Rodhe PM, Olsson J, Borsheim E, Aarsland A, Hahn RG.
Arteriovenous differences in plasma dilution and the distribution kinetics of
lactated Ringer´s solution. Anesth Analg 2009; 108: 128-33

Hahn et al: Fluid Dynamics During Spinal Anesthesia
1 5
Table 1
Baseline values for blood pressure and heart rate, and key data on fluid balance
Variable
Spinal anesthesia
Control experiment
Systolic arterial pressure (mm Hg) 115 (11) 109 (10)
Diastolic arterial pressure (mm Hg) 70 (8) 67 (7)
Heart rate (bpm) 70 (13) 68 (14)
Infused volume (ml) 1463 (233) 1466 (143)
Urinary excretion (ml) 1133 (400) 1013 (466)
Excreted/Infused (ratio) 0.77 (0.22) 0.70 (0.32)
Data are the mean (SD) for the group of 10 volunteers.

Hahn et al: Fluid Dynamics During Spinal Anesthesia
1 6
Table 2
Top: Optimal parameter estimates for kinetic analysis according to the two-volume
model, where baseline fluid losses are considered by setting Clo to 0.4 ml/min.
Spinal anaesthesia
Ar t e r ia l Fem o r a l ve in
Cu b it a l ve in
Control
Cubital vein
Vc (L)
2.00 (1.79-2.41)
2.52 (1.91-3.30)
2.75 (2.39-4.13)
2.79 (2.30-4.12)
Vt (L)
6.23 (4.52-9.40)
5.53 (4.27-7.47)
7.49 (5.01-12.4)
6.28 (5.01-12.4)
Cld (ml/min)
208 (106-240)
213 (129-294)
211 (138-279)
212 (88-356)
Cl (ml/min)
110 (61-156)
98 (57-202)
125 (67-134)
83 (30-141)
Clr (ml/min) 105 (50-133)
102 (52-215)
112 (57-151)
90 (39-133)
Data are the median (interquartile range) for the group of 10 volunteers.
Th e u n ce r t a in t y o f a n in d iv id u a l p a r a m e t e r e st im a t e , exp r essed a s t h e SD,
a ve r a ged 1 3 % fo r Cl.

Hahn et al: Fluid Dynamics During Spinal Anesthesia
1 7
Legends for figures
Fig. 1
The two-volume kinetic model used to analyze the data.
Symbols denote: Ro= fluid infusion; Vc and Vt = central and peripheral body fluid
spaces, respectively; vc and vt = expanded fluid spaces; Cl = elimination clearance;
Cld = distribution clearance; Clo = baseline fluid losses.
Fig. 2
A. Up p e r leve l o f sen so r y lo ss , B. sy st o lic a r t e r ia l p r e ssu r e , C.
d ia st o lic a r t e r ia l p r e ssu r e , a n d D. h ea r t r a t e wh en sp in a l
a n e st h e sia wa s in d u ced a ft e r 3 0 m in . Ea ch lin e r ep r e s en t s o n e
vo lu n t ee r . In p a n e ls B-D t h e m ea n in m a r k ed b y a t h ick lin e .
Fig. 3
Th e p la sm a d ilu t io n d u r in g exp e r im en t a l sp in a l a n e st h e sia
in d ica t ed in b lo o d fr o m
A. t h e r a d ia l a r t e r y , B. t h e cu b it a l ve in , C. t h e fem o r a l ve in , D.
t h e AV d iffe r en ce a s o b t a in ed fr o m t h e a r m , a n d E. t h e leg.
F. Th e p la sm a d ilu t io n in t h e cu b it a l ve in m ea su r ed d u r in g a
co n t r o l in fu sio n .

Hahn et al: Fluid Dynamics During Spinal Anesthesia
1 8
Ea ch t h in lin e r ep r e sen t s o n e vo lu n t ee r . Th e t h ick lin e s in A-C
a n d F a r e k in e t ic cu r ve s b a sed o n t h e m ed ia n o p t im a l e s t im a t e s o f
t h e p a r a m e t e r s fo r t h e gr o u p . Th e t h ick lin e s in D a n d E a r e t h e
m ea n va lu e s .
Fig. 4
Th e vo lu m e ch a n ges o f vc a n d v
t d u r in g a n d a ft e r a n in fu sio n o f
2 5 m l/ k g o f a ce t a t ed Rin ge r ’s so lu t io n is in fu sed :
A. d u r in g 6 0 m in in t h e p r e sen ce o f sp in a l a n e st h e sia
B. d u r in g 3 0 m in wit h o u t sp in a l a n e st h e sia ( co n t r o l)
C. t h e fr a ct io n o f t h e in fu sed flu id vo lu m e r em a in in g in vc, a n d
D. t h e r a t io b e t ween t h e vo lu m e ch a n ges o f vt a n d v
c
Fig. 5
Th e u r in a r y excr e t io n :
A. m ea su r ed a t 5 -1 0 m in in t e r va ls d u r in g sp in a l a n e st h e sia
B. p r ed ict ed b y k in e t ic a n a ly sis o f ven o u s p la sm a .
C. p r ed ict ed fr o m t h e r en a l cle a r a n ce , wh ich is b a sed o n t h e t o t a l
u r in e excr e t io n
D. m ea su r ed a t 5 -1 0 m in in t e r va ls d u r in g a co n t r o l in fu sio n . Ea ch
t h in lin e r ep r e sen t s o n e vo lu n t ee r a n d t h e t h ick lin e t h e m ea n
va lu e

Hahn et al: Fluid Dynamics During Spinal Anesthesia
1 9
E a n d F. given a s t h e m ea n va lu e s fo r t h e t h r ee wa y s t o a sse ss
u r in a r y excr e t io n fo r t h e sp in a l a n d co n t r o l exp e r im en t s ,
r e sp ect ive ly
Fig. 6
Th e flu id cle a r a n ce , Cl, e s t im a t ed b y cu r ve -fit t in g o f t h e p la sm a
d ilu t io n o ve r t im e v e rsu s t h e r en a l cle a r a n ce , Clr, wh ich wa s
ca lcu la t ed a s t h e m ea su r ed t o t a l u r in a r y excr e t io n d iv id ed b y t h e
a r ea u n d e r t h e cu r ve o f t h e p la sm a d ilu t io n -t im e p r o file .

Hahn et al: Fluid Dynamics During Spinal Anesthesia
2 0
Fig. 1

Hahn et al: Fluid Dynamics During Spinal Anesthesia
2 1
Fig. 2

Hahn et al: Fluid Dynamics During Spinal Anesthesia
2 2
Fig. 3
Fig. 4
Hahn et al: Fluid Dynamics During Spinal Anesthesia
2 3
Fig. 5
Fig. 6