Volume I: Executive Summary Volume II: Main Report...
160
Transcript of Volume I: Executive Summary Volume II: Main Report...

Volume I: Executive Summary
Volume II: Main Report
Volume III: Supporting Report
Exchange Rates
USD1.00 = PhP 40.4 = JPY105.3
As of 29 February, 2008
Source: Bangko Sentral ng Pilipinas

Final Report
The Master Plan on Solid Waste Management
for Boracay Island and Malay Municipality i
VOLUME III: SUPPORTING REPORT
Table of Contents
Pages
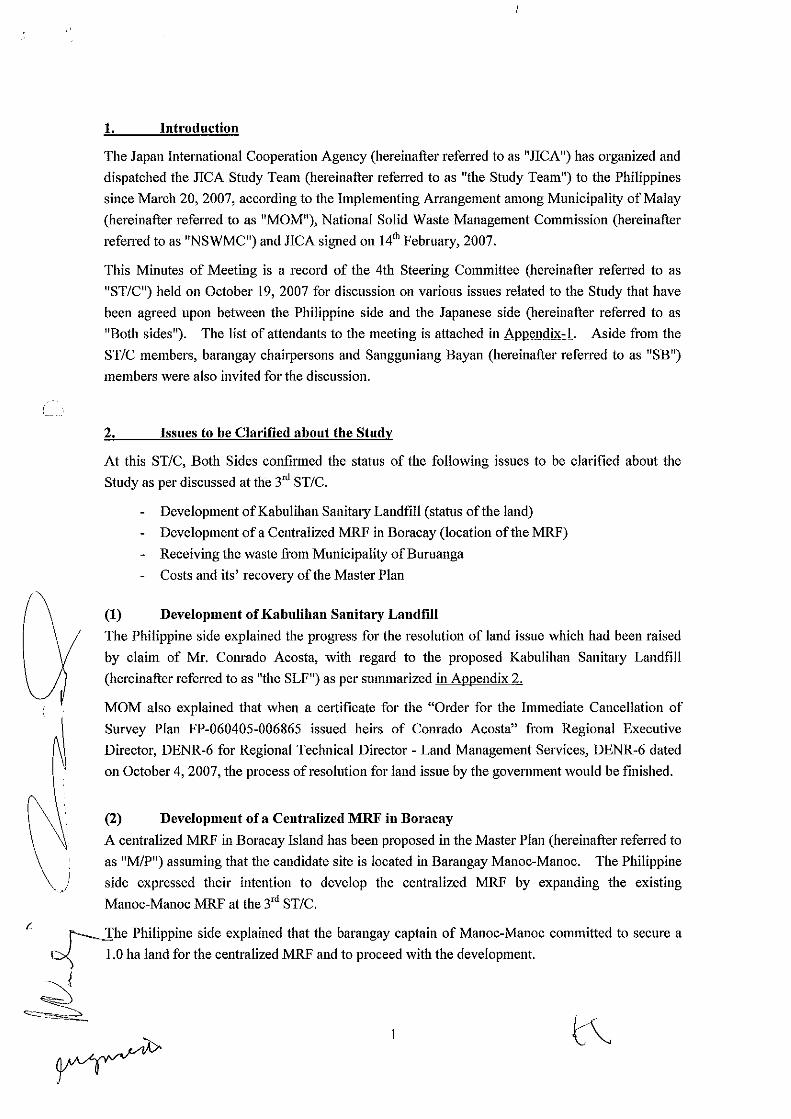
PART I: MINUTES OF MEETING OF STEERING COMMITTEE
PART II: 10-YEAR SOLID WASTE MANAGEMENT PLAN
A: PUBLIC AWARENESS SURVEY
1 Introduction.............................................................................................................II-A-1
2 Objectives ...............................................................................................................II-A-1
3 Scope of Work.........................................................................................................II-A-1
4 Methodology of the Study.......................................................................................II-A-1
4.1 Sampling Procedure ............................................................................................II-A-2
4.2 Interview Procedures and Time Schedule ...........................................................II-A-3
5 Results and Discussion ...........................................................................................II-A-3
5.1 Household Survey ...............................................................................................II-A-3
5.2 Business Establishment Survey...........................................................................II-A-31
5.3 Tourist Survey .....................................................................................................II-A-59
Appendix
B: WASTE CHARACTERISTIC SURVEY
1 Introduction.............................................................................................................II-B-1
2 Objective of the Survey...........................................................................................II-B-1
3 Scope of Works .......................................................................................................II-B-1
4 Methodologies.........................................................................................................II-B-1
4.1 Sampling Methods ..............................................................................................II-B-1
4.2 Measurement Method .........................................................................................II-B-2
5 Results of the Waste Quality and Quantity Survey .................................................II-B-3
5.1 Waste Quantity Survey........................................................................................II-B-3
5.2 Waste Quality Survey..........................................................................................II-B-6
5.3 Waste Quantity Survey........................................................................................II-B-13
Appendix
PART III: FEASIBILITY STUDY
C: NEW LANDFILL SITE SURVEY
1 Introduction...................................................................................................................III-C-1
2 Objectives .....................................................................................................................III-C-1
3. Scope of Works .............................................................................................................III-C-1
3.1 Topographic Survey .................................................................................................III-C-1
3.2 Geological and Geotechnical Survey ..................................................................III-C-2
3.3 Environmental Survey.........................................................................................III-C-2
3.4 Desk Study................................................................................................................III-C-2

Final Report
The Master Plan on Solid Waste Management
for Boracay Island and Malay Municipality ii
4. Methodologies...............................................................................................................III-C-2
4.1 Topographic Survey ..................................................................................................III-C-2
4.2 Geological and Geotechnical Survey........................................................................III-C-3
4.3 Environmental Survey ..............................................................................................III-C-6
4.4 Desk Study................................................................................................................III-C-10
5 Results...........................................................................................................................III-C-11
5.1 Topographic Survey .................................................................................................III-C-11
5.2 Geological Survey....................................................................................................III-C-12
5.3 Environmental Survey .............................................................................................III-C-23
5.4 Human Environment ................................................................................................III-C-28
5.5 Desk Study (Conceptual Design of the SLF)............................................................III-C-31
Appendix
D: OLD DUMPING SITE SURVEY
1. Introduction............................................................................................................. III-D-1
2. Objectives ............................................................................................................... III-D-1
3. Scope of Works ....................................................................................................... III-D-1
3.1 Topographic Survey ..................................................................................................III-D-2
3.2 Geological, Geotechnical and Hydro-geological Survey..........................................III-D-2
3.3 Environmental Survey ..............................................................................................III-D-2
3.4 Desk Survey ............................................................................................................III-D-2
4. Methodologies............................................................................................................... III-D-2
4.1 Topographic Survey ..................................................................................................III-D-2
4.2 Geological and Geotechnical Survey........................................................................III-D-3
4.3 Environmental Survey ..............................................................................................III-D-6
4.4 Desk Study................................................................................................................III-D-10
5. Results of the Survey .............................................................................................. III-D-10
5.1 Topographic Survey ..................................................................................................III-D-10
5.2 Geological, Geotechnical and Hydro-geological Survey..........................................III-D-10
5.3 Environmental Survey ..............................................................................................III-D-18
5.4 Desk Study................................................................................................................III-D-29
Appendix
E: CENTRALIZED MRF SITE SURVEY
1. Introduction............................................................................................................. III -E-1
2. Objectives ............................................................................................................... III -E-1
3. Scope of Works ....................................................................................................... III -E-1
3.1 Topographic Survey ............................................................................................ III -E-1
3.2 Conceptual Design ............................................................................................... III -E-2
4. Methodology ........................................................................................................... III -E-2
4.1 Topographic Survey ............................................................................................. III -E-2
4.2 Conceptual Design ............................................................................................... III -E-2
5. Result ...................................................................................................................... III -E-3
5.1 Topographic Survey ............................................................................................. III -E-3
5.2 Conceptual Design ............................................................................................... III -E-3
Appendix
PART I: MINUTES OF MEETING OF
STEERING COMMITTEE


PART II: 10-YEAR SOLID WASTE
MANAGEMENT PLAN
A: PUBLIC AWARENESS SURVEY
Supporting Report
Chapter II-A
The Master Plan on Solid Waste Management
for Boracay Island and Municipality of Malay
II-A-1
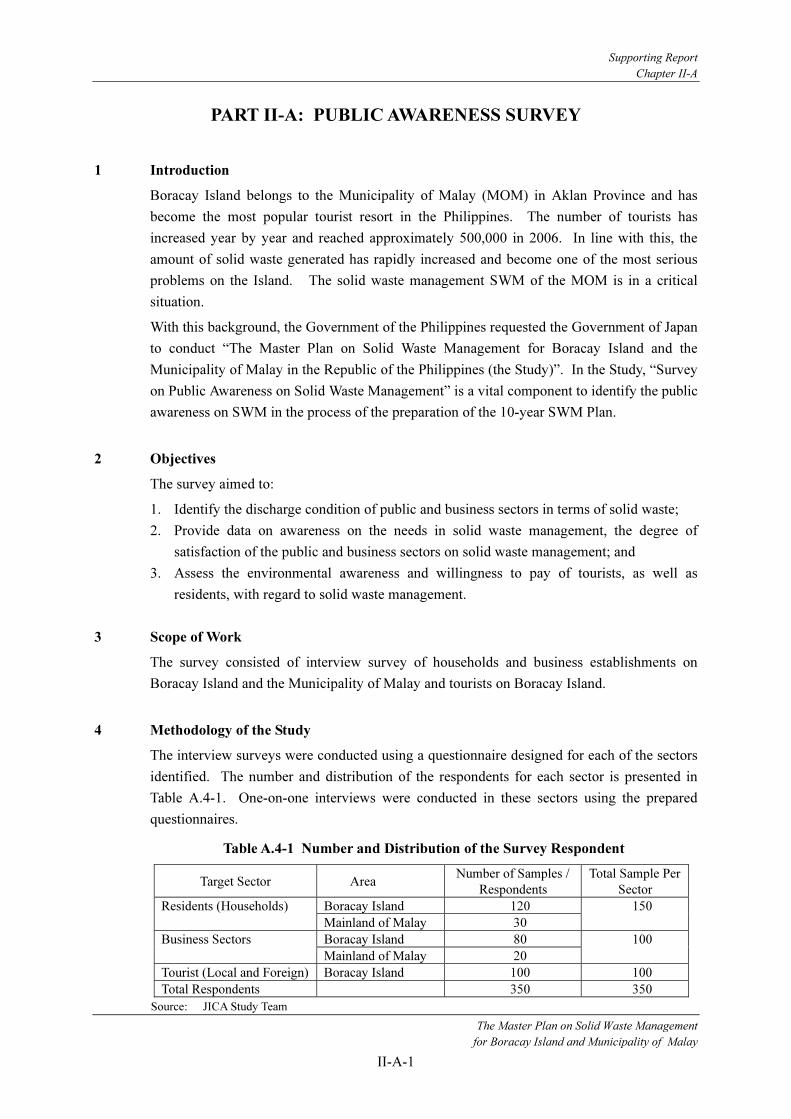
PART II-A: PUBLIC AWARENESS SURVEY
1 Introduction
Boracay Island belongs to the Municipality of Malay (MOM) in Aklan Province and has
become the most popular tourist resort in the Philippines. The number of tourists has
increased year by year and reached approximately 500,000 in 2006. In line with this, the
amount of solid waste generated has rapidly increased and become one of the most serious
problems on the Island. The solid waste management SWM of the MOM is in a critical
situation.
With this background, the Government of the Philippines requested the Government of Japan
to conduct “The Master Plan on Solid Waste Management for Boracay Island and the
Municipality of Malay in the Republic of the Philippines (the Study)”. In the Study, “Survey
on Public Awareness on Solid Waste Management” is a vital component to identify the public
awareness on SWM in the process of the preparation of the 10-year SWM Plan.
2 Objectives
The survey aimed to:
1. Identify the discharge condition of public and business sectors in terms of solid waste;
2. Provide data on awareness on the needs in solid waste management, the degree of
satisfaction of the public and business sectors on solid waste management; and
3. Assess the environmental awareness and willingness to pay of tourists, as well as
residents, with regard to solid waste management.
3 Scope of Work
The survey consisted of interview survey of households and business establishments on
Boracay Island and the Municipality of Malay and tourists on Boracay Island.
4 Methodology of the Study
The interview surveys were conducted using a questionnaire designed for each of the sectors
identified. The number and distribution of the respondents for each sector is presented in
Table A.4-1. One-on-one interviews were conducted in these sectors using the prepared
questionnaires.
Table A.4-1 Number and Distribution of the Survey Respondent
Target Sector Area Number of Samples /
Respondents
Total Sample Per
Sector
Boracay Island 120 Residents (Households)
Mainland of Malay 30
150
Boracay Island 80 Business Sectors
Mainland of Malay 20
100
Tourist (Local and Foreign) Boracay Island 100 100
Total Respondents 350 350
Source: JICA Study Team

Supporting Report
Chapter II-A
The Master Plan on Solid Waste Management
for Boracay Island and Municipality of Malay
II-A-2
4.1 Sampling Procedure
The procedure for selecting the respondents for the interview depended on the target sectors
that were interviewed, i.e., residents/households, business establishments and tourists.
Household/Residents Survey adopted a random sampling procedure to select the target
respondents. After selection, the 120 target respondents were distributed equally to the three
barangays on Boracay Island (Brangay Yapak, Brangay Balabag and Brangay Manoc-
Manoc).
Using available household listings at the barangay level, 120 households were randomly
selected and identified as respondents. A total of 30 household respondents were identified
from each of the barangay on the Island. Replacement samples (about 10% of total
households) were also selected in case the drawn sample households were not available at
the time of actual visit for interview.
The same procedure was undertaken for the 30 respondents required on the Mainland of
Malay but was limited only to two (2) barangays of Malay due to the small number of
respondents. As identified during the mobilization meeting, the target barangays on the
Mainland of Malay, Aklan were in Poblacion and Balusbos with 15 household respondents
for each.
Business Establishments Survey also adopted a random sampling procedure considering the
proportion of the type of business. The list of business establishments on Boracay and the
Mainland of Malay were collected on the Municipal Planning and Development Office
(MPDO) and were distributed according to the type of business. The required 80
respondents were distributed according to the proportion of the type of business and were
randomly selected within the same business type categories. The same procedure was used
in selecting business establishment respondents for the areas.
Table A.4.1-1 Number of Registered Businesses and their Proportion
Business Type No. of Businesses Registered* Proportion (%) Dist’n of Resp. (n = 80)
Hotels 175 17.4 14
Restaurants 210 20.9 17
Market Vendors 350 34.8 28
Souvenir Shops 180 17.9 14
Grocery Stores 90 9.0 7
Total 1,005 100 80
Source: MPDO
Tourist Survey used purposive sampling. Respondents were selected and identified on
Boracay Island. The 100 samples were distributed to 50 local tourists and 50 foreign tourists.
Each of the field interviewers was provided a base map on Boracay Island and the Mainland
of Malay where the locations and areas of the respondents that were interviewed were plotted.

Supporting Report
Chapter II-A
The Master Plan on Solid Waste Management
for Boracay Island and Municipality of Malay
II-A-3
The actual number of respondents interviewed is shown in Table A.4.1-2 below.
Table A.4.1-2 Actual Number of Respondents Interviewed
Target Number of
Respondents
Actual Number of
Respondents Covered
Target Sector Area Total
Sample
Per Sector
Number of
Samples
Required
Total
Respondents
Per Sector
Number of
Respondents
Boracay Island 80 80 Business
Establishments Mainland of
Malay
100
20
101
21
Boracay Island 120 132 Household/
Residents Mainland of
Malay
150
30
162
30
Local & Foreign
Tourist
Boracay Island 100 100 133 133
Total Respondents 350 350 396 396
Source: JICA Study Team
4.2 Interview Procedures and Time Schedule
The survey commenced with the training of the survey interviewers using questionnaires.
Each questionnaire was discussed in detail with regard to each question and proper
interviewing techniques were discussed. After the discussions on the individual
questionnaires, mock interviews were conducted to practice. Afterwards, a pre-test of the
questionnaires was conducted. Appropriate revisions were then made to the questionnaires
based on the results of the pre-test. After the approval of the final version of the
questionnaires, actual interviews were conducted on Boracay Island and the Mainland of
Malay for the household and business establishments and on Boracay Island for the tourists.
A field interview manual was also prepared to aid the interviewers during the conduct of the
interview.
5 Results and Discussion
5.1 Household Survey
5.1.1 General Information
(1) Household Information
A total of 162 household respondents were interviewed. Three barangays on Boracay Island
were covered as well as two barangays on the Mainland of Malay.
Table A.5.1-1 and Table A.5.1-2 present the profile of the respondents on the Boracay Island
and the Mainland of Malay. The majority of the respondents from the survey were
household heads of the family where 69% were in Barangay Balabag, 72% in Barangay
Manoc-Manoc and 68% in Barangay Yapak.

Supporting Report
Chapter II-A
The Master Plan on Solid Waste Management
for Boracay Island and Municipality of Malay
II-A-4
As a whole, 68% of the respondents on the Boracay Island were household head, 29% were
spouses and the remaining 3% were other members of the family, i.e. children and
grandparents of the family. On the other hand, the respondents on the Mainland of Malay
were also household head of the family where 67% in Barangay Balusbos and 80% in
Barangay Poblacion.
In terms of number of dependents within the household, majority of the household
respondents belong to the lower range (Between 0-3), 45% in the barangays on Boracay
Island and 73% in the Mainland of Malay. The average number of dependents per household
is 4.1 on Boracay Island and 3.7 on the Mainland of Malay.
Table A.5.1-1 General Household Profile of 132 Respondents on Boracay Island
Balabag Manoc-Manoc Yapak Boracay IslandItem
No. RatePercent No. Percent No. Percent No. Percent
Household Position
Household Head 29 69 34 72 27 63 90 68
Spouse 10 24 13 28 15 35 38 29
Others 3 7 0 0 1 2 4 3
Total 42 100 47 100 43 100 132 100
Number of Family Dependents
Between 0 to 3 23 55 25 53 12 28 60 45
Between 4 to 6 17 40 16 34 21 49 54 41
More than 6 2 5 6 13 10 23 18 14
Total 42 100 47 100.00 43 100 132 100
Average Number of
Dependents
3.4 4.0 4.9 4.1
Lowest Number of
Dependents
1 0 0 0
Highest Number of
Dependents
8 10 10 10
Source: JICA Study Team

Supporting Report
Chapter II-A
The Master Plan on Solid Waste Management
for Boracay Island and Municipality of Malay
II-A-5
Table A.5.1-2 General Household Profile of 30 Respondents on the Mainland of Malay
Balusbos Poblacion Mainland
Malay Item
No. Percent No. Percent No. Percent
Household Head 10 66.67 12 80.00 22 73.33
Spouse 4 26.67 2 13.33 6 20.00
Others 1 6.67 1 6.67 2 6.67
Total 15 100.00 15 100.00 30 100.00
Between 0 to 3 10 66.67 7 46.67 17 56.67
Between 4 to 6 5 33.33 5 33.33 10 33.33
More than 6 0 0.00 3 20.00 3 10.00
Total 15 100.00 15 100.00 30 100.00
Average 2.8 4.53 3.67
Lowest Number of Dependents 0 2 0
Highest Number of Dependents 5 11 11
Note: All respondents were sampled in sitio proper of the barangays
Source: JICA Study Team
Majority of the sampled respondents in Barangay Balabag were from Sitio Proper (50%),
Barangay Manoc-Manoc in Sitio Cagban (23%) and in Barangay Yapak in Zone (33%) due
to the number of families from these sitios and zones. On the other hand, all of the sampled
residents on the Mainland of Malay were taken from the Sitio Proper of Barangay Poblacion
and Balusbos based from the geographical considerations between these barangays.
(2) Respondent Profile
Majority of the respondents from the household survey were male (61%) on Boracay Island
and 60% on the Mainland of Malay (Table A.5.1-3). Majority of the respondents’ age
belongs to the productive years of age between 31 to 45 years old, 44% on Boracay Island
and 40% on the Mainland of Malay. The average age of the respondents interviewed were
39.11 years old and 51.80 years on both Boracay Island and the Mainland of Malay,
respectively.
With regard to educational attainment, majority of the respondents were high school
graduates. Some 15% on Boracay Island have college degrees. On the other hand, 37% on
the Mainland of Malay finished college.

Supporting Report
Chapter II-A
The Master Plan on Solid Waste Management
for Boracay Island and Municipality of Malay
II-A-6
Table A.5.1-3 General Profile of Respondents Interviewed
Balabag Manoc-
Manoc Yapak
Boracay
Island Balusbos Poblacion
Mainland of
Malay Item
No. % No. % No. % No. % No. % No. % No. %
Distribution of Gender
Male 23 54.76 30 63.83 28 65.12 81 61.36 7 46.67 11 78.57 18 60.00
Female 19 45.24 17 36.17 15 34.88 51 38.64 8 53.33 4 28.57 12 40.00
Total 42 100.00 47 100.00 43 100.00 132 100.00 15 100.00 15 100.00 30 100.00
Distribution of Age (Years)
18–30 14 33.33 12 25.53 8 18.60 34 25.76 1 6.67 0 0.00 1 3.33
31-45 12 28.57 22 46.81 24 55.81 58 43.94 5 33.33 7 46.67 12 40.00
46-60 9 21.43 11 23.40 10 23.26 30 22.73 3 20.00 6 40.00 9 30.00
More than 60 7 16.67 2 4.26 1 2.33 10 7.58 6 40.00 2 13.33 8 26.67
Total 42 100.00 47 100.00 43 100.00 132 100.00 15 100.00 15 100.00 30 100.00
Average Age 41.79 36.68 39.14 39.11 54.80 48.80 51.80
Youngest 21.00 21.00 18.00 18.00 21.00 37.00 21.00
Oldest 77.00 66.00 69.00 77.00 80.00 72.00 80.00
Educational Attainment
Elementary
Undergrad 7 16.67 7 14.89 8 18.60 22 16.67 2 13.33 0 0.00 2 6.67
Elementary Grad 7 16.67 7 14.89 2 4.65 16 12.12 3 20.00 0 0.00 3 10.00
High School
Undergrad 4 9.52 7 14.89 10 23.26 21 15.91 1 6.67 1 6.67 2 6.67
High School Grad 15 35.71 19 40.43 19 44.19 53 40.15 5 33.33 7 46.67 12 40.00
College
Undergrad 6 14.29 2 4.26 0 0.00 8 6.06 0 0.00 1 6.67 1 3.33
College Grad 3 7.14 5 10.64 4 9.30 12 9.09 4 26.67 6 40.00 10 33.33
Total 42 100.00 47 100.00 43 100.00 132 100.00 15 100.00 15 100.00 30 100.00
Distribution of Occupation
Farmer/Fisherfolk 1 2.38 0 0.00 0 0.00 1 0.76 3 20.00 1 6.67 4 13.33
Public Official 0 0.00 2 4.26 1 2.33 3 2.27 0 0.00 3 20.00 3 10.00
Salary Worker 10 23.81 4 8.51 7 16.28 21 15.91 3 20.00 2 13.33 5 16.67
Daily Wage
Worker 7 16.67 14 29.79 14 32.56 35 26.52 0 0.00 7 46.67 7 23.33
Private
Businessman 11 26.19 15 31.91 10 23.26 36 27.27 6 40.00 1 6.67 7 23.33
Student 0 0.00 0 0.00 1 2.33 1 0.76 0 0.00 0 0.00 0 0.00
Pension Receiver 0 0.00 0 0.00 0 0.00 0 0.00 1 6.67 0 0.00 1 3.33
No Job (NJ) 13 30.95 12 25.53 10 23.26 35 26.52 2 13.33 1 6.67 3 10.00
Total 42 100.00 47 100.00 43 100.00 132 100.00 15 100.00 15 100.00 30 100.00
Source: JICA Study Team
In terms of occupation, majority of the respondents on Boracay Island and the Mainland of
Malay were daily wageworkers, 26% and 23% respectively. On Boracay Island, the majority
of the respondents were working as employees of different business establishments on
Boracay Island. On the Mainland of Malay, the majority were working as skilled laborers.
(3) Annual Income of Households
Table A.5.1-4 presents the annual income profile of the household respondents. Fifty-one
percent (51%) of the respondents on the Boracay Island have an annual income range
Supporting Report
Chapter II-A
The Master Plan on Solid Waste Management
for Boracay Island and Municipality of Malay
II-A-7
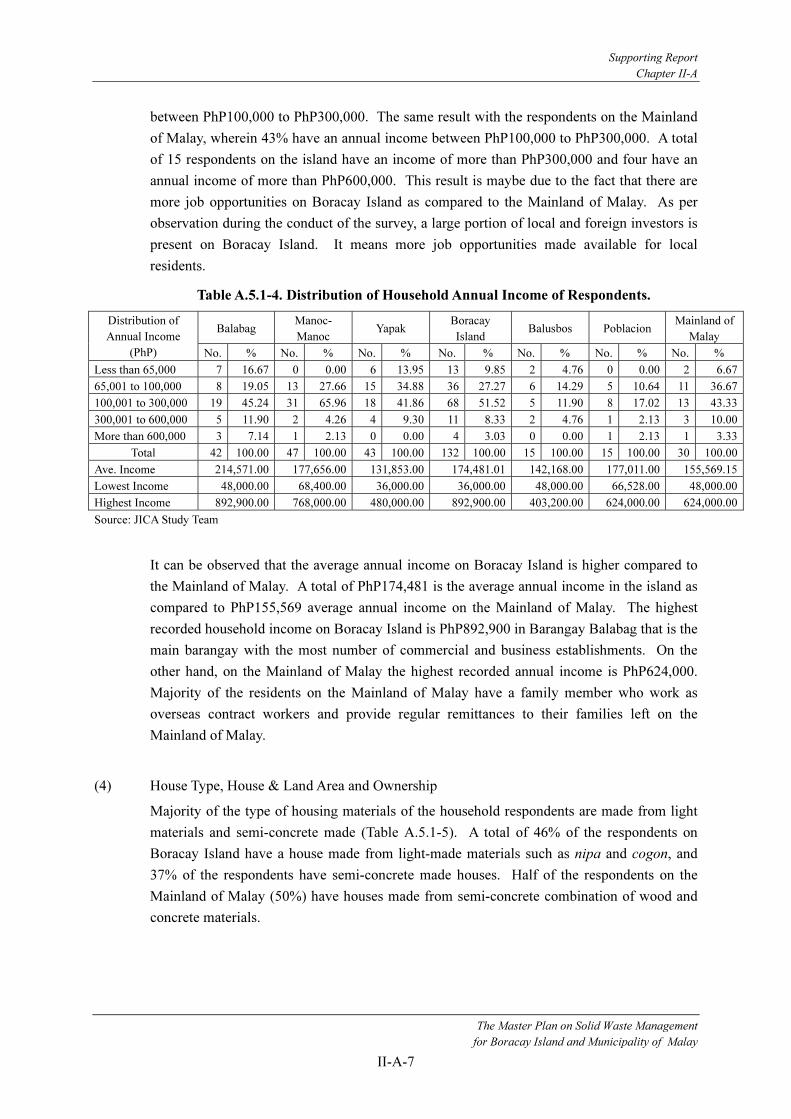
between PhP100,000 to PhP300,000. The same result with the respondents on the Mainland
of Malay, wherein 43% have an annual income between PhP100,000 to PhP300,000. A total
of 15 respondents on the island have an income of more than PhP300,000 and four have an
annual income of more than PhP600,000. This result is maybe due to the fact that there are
more job opportunities on Boracay Island as compared to the Mainland of Malay. As per
observation during the conduct of the survey, a large portion of local and foreign investors is
present on Boracay Island. It means more job opportunities made available for local
residents.
Table A.5.1-4. Distribution of Household Annual Income of Respondents.
Balabag Manoc-
Manoc Yapak
Boracay
Island Balusbos Poblacion
Mainland of
Malay
Distribution of
Annual Income
(PhP) No. % No. % No. % No. % No. % No. % No. %
Less than 65,000 7 16.67 0 0.00 6 13.95 13 9.85 2 4.76 0 0.00 2 6.67
65,001 to 100,000 8 19.05 13 27.66 15 34.88 36 27.27 6 14.29 5 10.64 11 36.67
100,001 to 300,000 19 45.24 31 65.96 18 41.86 68 51.52 5 11.90 8 17.02 13 43.33
300,001 to 600,000 5 11.90 2 4.26 4 9.30 11 8.33 2 4.76 1 2.13 3 10.00
More than 600,000 3 7.14 1 2.13 0 0.00 4 3.03 0 0.00 1 2.13 1 3.33
Total 42 100.00 47 100.00 43 100.00 132 100.00 15 100.00 15 100.00 30 100.00
Ave. Income 214,571.00 177,656.00 131,853.00 174,481.01 142,168.00 177,011.00 155,569.15
Lowest Income 48,000.00 68,400.00 36,000.00 36,000.00 48,000.00 66,528.00 48,000.00
Highest Income 892,900.00 768,000.00 480,000.00 892,900.00 403,200.00 624,000.00 624,000.00
Source: JICA Study Team
It can be observed that the average annual income on Boracay Island is higher compared to
the Mainland of Malay. A total of PhP174,481 is the average annual income in the island as
compared to PhP155,569 average annual income on the Mainland of Malay. The highest
recorded household income on Boracay Island is PhP892,900 in Barangay Balabag that is the
main barangay with the most number of commercial and business establishments. On the
other hand, on the Mainland of Malay the highest recorded annual income is PhP624,000.
Majority of the residents on the Mainland of Malay have a family member who work as
overseas contract workers and provide regular remittances to their families left on the
Mainland of Malay.
(4) House Type, House & Land Area and Ownership
Majority of the type of housing materials of the household respondents are made from light
materials and semi-concrete made (Table A.5.1-5). A total of 46% of the respondents on
Boracay Island have a house made from light-made materials such as nipa and cogon, and
37% of the respondents have semi-concrete made houses. Half of the respondents on the
Mainland of Malay (50%) have houses made from semi-concrete combination of wood and
concrete materials.

Supporting Report
Chapter II-A
The Master Plan on Solid Waste Management
for Boracay Island and Municipality of Malay
II-A-8
Table A.5.1-5 Type of Housing Materials and Ownership of the House and Lot
Balabag Manoc-
Manoc Yapak
Boracay
Island Balusbos Poblacion
Mainland of
Malay Item
No. % No. % No. % No. % No. % No. % No. %
Type of Housing Materials
Light-made
Materials 11 26.19 28 59.57 22 51.16 61 46.21 3 20.00 2 13.33 5 16.67
Hardwood-
made 1 2.38 1 2.13 4 9.30 6 4.55 0 0.00 0 0.00 0 0.00
Semi-
concrete
Made 23 54.76 13 27.66 13 30.23 49 37.12 8 53.33 7 46.67 15 50.00
Concrete-
made 7 16.67 5 10.64 4 9.30 16 12.12 4 26.67 6 40.00 10 33.33
Total 42 100.00 47 100.00 43 100.00 132 100.00 15 100.00 15 100.00 30 100.00
Land Ownership of the House
Owned 29 69.05 22 46.81 24 55.81 75 56.82 14 93.33 14 93.33 28 93.33
Rented 9 21.43 12 25.53 4 9.30 25 18.94 0 0.00 0 0.00 0 0.00
Rent-free
Occupant 4 9.52 13 27.66 15 34.88 32 24.24 1 6.67 1 6.67 2 6.67
Total 42 100.00 47 100.00 43 100.00 132 100.00 15 100.00 15 100.00 30 100.00
Ownership of the House
Owned 33 78.57 42 89.36 31 72.09 106 80.30 13 86.67 12 80.00 25 83.33
Rented 8 19.05 2 4.26 0 0.00 10 7.58 2 13.33 1 6.67 3 10.00
Rent-free
Occupant 1 2.38 3 6.38 12 27.91 16 12.12 0 0.00 2 13.33 2 6.67
Total 42 100.00 47 100.00 43 100.00 132 100.00 15 100.00 15 100.00 30 100.00
Source: JICA Study Team
Majority of the household respondents own the land, 57% on Boracay Island and 93% on the
Mainland of Malay respectively. The same result can be observed with ownership of the
houses, where 56% of the respondents on Boracay Island own the house as well as the 93%
of the respondents on the Mainland of Malay.
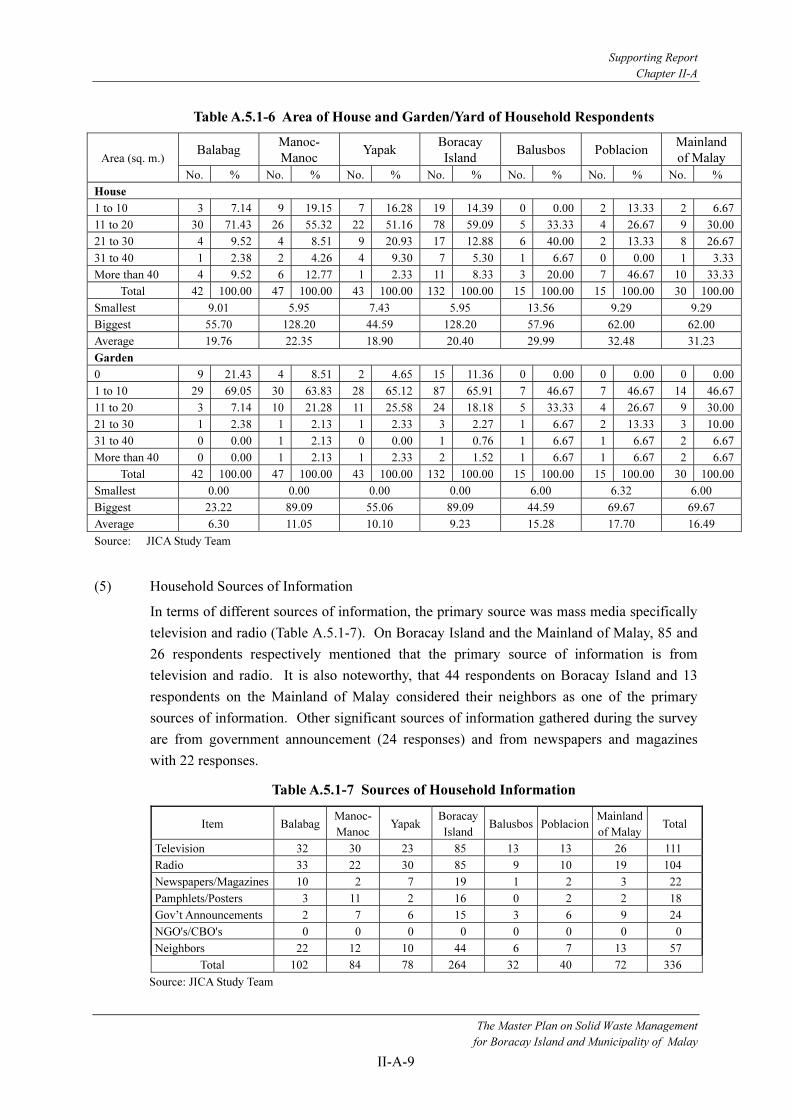
The average area of the respondent houses was 20.40 square meters on Boracay Island and
31.23 square meters on the Mainland of Malay (Table A.5.1-6). In terms of surrounding yard
or garden area the average size on Boracay Island is about 9.23 square meters as compared to
the respondents on the Mainland of Malay having an average size of 16.49 square meters.
Supporting Report
Chapter II-A
The Master Plan on Solid Waste Management
for Boracay Island and Municipality of Malay
II-A-9
Table A.5.1-6 Area of House and Garden/Yard of Household Respondents
Balabag Manoc-
Manoc Yapak
Boracay
Island Balusbos Poblacion
Mainland
of Malay Area (sq. m.)
No. % No. % No. % No. % No. % No. % No. %
House
1 to 10 3 7.14 9 19.15 7 16.28 19 14.39 0 0.00 2 13.33 2 6.67
11 to 20 30 71.43 26 55.32 22 51.16 78 59.09 5 33.33 4 26.67 9 30.00
21 to 30 4 9.52 4 8.51 9 20.93 17 12.88 6 40.00 2 13.33 8 26.67
31 to 40 1 2.38 2 4.26 4 9.30 7 5.30 1 6.67 0 0.00 1 3.33
More than 40 4 9.52 6 12.77 1 2.33 11 8.33 3 20.00 7 46.67 10 33.33
Total 42 100.00 47 100.00 43 100.00 132 100.00 15 100.00 15 100.00 30 100.00
Smallest 9.01 5.95 7.43 5.95 13.56 9.29 9.29
Biggest 55.70 128.20 44.59 128.20 57.96 62.00 62.00
Average 19.76 22.35 18.90 20.40 29.99 32.48 31.23
Garden
0 9 21.43 4 8.51 2 4.65 15 11.36 0 0.00 0 0.00 0 0.00
1 to 10 29 69.05 30 63.83 28 65.12 87 65.91 7 46.67 7 46.67 14 46.67
11 to 20 3 7.14 10 21.28 11 25.58 24 18.18 5 33.33 4 26.67 9 30.00
21 to 30 1 2.38 1 2.13 1 2.33 3 2.27 1 6.67 2 13.33 3 10.00
31 to 40 0 0.00 1 2.13 0 0.00 1 0.76 1 6.67 1 6.67 2 6.67
More than 40 0 0.00 1 2.13 1 2.33 2 1.52 1 6.67 1 6.67 2 6.67
Total 42 100.00 47 100.00 43 100.00 132 100.00 15 100.00 15 100.00 30 100.00
Smallest 0.00 0.00 0.00 0.00 6.00 6.32 6.00
Biggest 23.22 89.09 55.06 89.09 44.59 69.67 69.67
Average 6.30 11.05 10.10 9.23 15.28 17.70 16.49
Source: JICA Study Team
(5) Household Sources of Information
In terms of different sources of information, the primary source was mass media specifically
television and radio (Table A.5.1-7). On Boracay Island and the Mainland of Malay, 85 and
26 respondents respectively mentioned that the primary source of information is from
television and radio. It is also noteworthy, that 44 respondents on Boracay Island and 13
respondents on the Mainland of Malay considered their neighbors as one of the primary
sources of information. Other significant sources of information gathered during the survey
are from government announcement (24 responses) and from newspapers and magazines
with 22 responses.
Table A.5.1-7 Sources of Household Information
Item Balabag Manoc-
ManocYapak
Boracay
IslandBalusbos Poblacion
Mainland
of Malay Total
Television 32 30 23 85 13 13 26 111
Radio 33 22 30 85 9 10 19 104
Newspapers/Magazines 10 2 7 19 1 2 3 22
Pamphlets/Posters 3 11 2 16 0 2 2 18
Gov’t Announcements 2 7 6 15 3 6 9 24
NGO's/CBO's 0 0 0 0 0 0 0 0
Neighbors 22 12 10 44 6 7 13 57
Total 102 84 78 264 32 40 72 336
Source: JICA Study Team
Supporting Report
Chapter II-A
The Master Plan on Solid Waste Management
for Boracay Island and Municipality of Malay
II-A-10
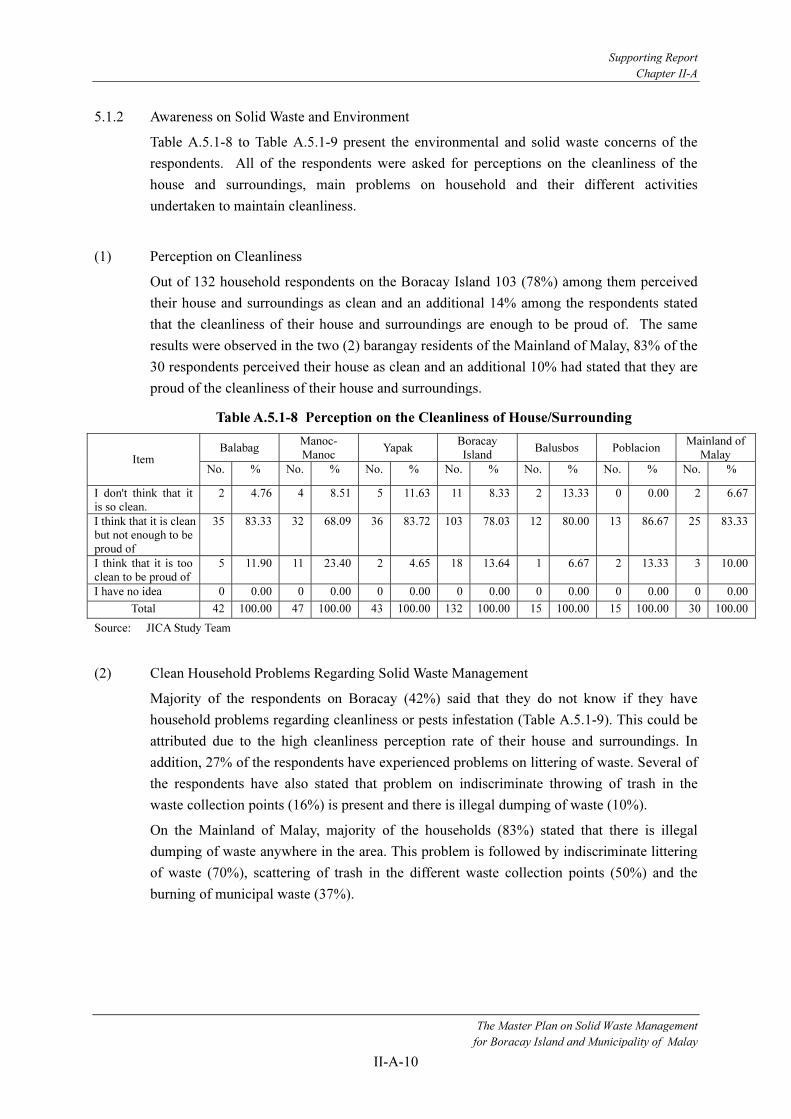
5.1.2 Awareness on Solid Waste and Environment
Table A.5.1-8 to Table A.5.1-9 present the environmental and solid waste concerns of the
respondents. All of the respondents were asked for perceptions on the cleanliness of the
house and surroundings, main problems on household and their different activities
undertaken to maintain cleanliness.
(1) Perception on Cleanliness
Out of 132 household respondents on the Boracay Island 103 (78%) among them perceived
their house and surroundings as clean and an additional 14% among the respondents stated
that the cleanliness of their house and surroundings are enough to be proud of. The same
results were observed in the two (2) barangay residents of the Mainland of Malay, 83% of the
30 respondents perceived their house as clean and an additional 10% had stated that they are
proud of the cleanliness of their house and surroundings.
Table A.5.1-8 Perception on the Cleanliness of House/Surrounding
Balabag Manoc-
Manoc Yapak
Boracay
Island Balusbos Poblacion
Mainland of
Malay Item No. % No. % No. % No. % No. % No. % No. %
I don't think that it
is so clean.
2 4.76 4 8.51 5 11.63 11 8.33 2 13.33 0 0.00 2 6.67
I think that it is clean
but not enough to be
proud of
35 83.33 32 68.09 36 83.72 103 78.03 12 80.00 13 86.67 25 83.33
I think that it is too
clean to be proud of
5 11.90 11 23.40 2 4.65 18 13.64 1 6.67 2 13.33 3 10.00
I have no idea 0 0.00 0 0.00 0 0.00 0 0.00 0 0.00 0 0.00 0 0.00
Total 42 100.00 47 100.00 43 100.00 132 100.00 15 100.00 15 100.00 30 100.00
Source: JICA Study Team
(2) Clean Household Problems Regarding Solid Waste Management
Majority of the respondents on Boracay (42%) said that they do not know if they have
household problems regarding cleanliness or pests infestation (Table A.5.1-9). This could be
attributed due to the high cleanliness perception rate of their house and surroundings. In
addition, 27% of the respondents have experienced problems on littering of waste. Several of
the respondents have also stated that problem on indiscriminate throwing of trash in the
waste collection points (16%) is present and there is illegal dumping of waste (10%).
On the Mainland of Malay, majority of the households (83%) stated that there is illegal
dumping of waste anywhere in the area. This problem is followed by indiscriminate littering
of waste (70%), scattering of trash in the different waste collection points (50%) and the
burning of municipal waste (37%).

Supporting Report
Chapter II-A
The Master Plan on Solid Waste Management
for Boracay Island and Municipality of Malay
II-A-11
Table A.5.1-9 Household Problems Experienced by Respondents Regarding
Cleanliness of Their Environment.
Item Balabag Manoc-
ManocYapak
Boracay
Island Balusbos Poblacion
Mainland
Malay Total
Littering of wastes anywhere 7 5 24 36 11 10 21 57
Dumping of wastes anywhere 2 3 8 13 13 12 25 38
Scattering trash in waste collection
points 13 3 5 21 8 7 15 36
Offensive odor from surrounding
waste treatment 0 2 1 3 0 0 0 3
Insects, pests, worms or animals
proliferate due to scattering solid
waste 1 0 0 1 0 0 0 1
Burning of municipal waste 2 4 0 6 6 5 11 17
Others 5 3 1 9 2 1 3 12
I don't know 18 24 14 56 0 0 0 56
Total 48 44 53 145 40 35 75 220
Source: JICA Study Team
(3) Cleaning Activities
Majority of the households on Boracay Island and the Mainland of Malay practice regular
cleaning activities in the house (90% each). In addition, 87% on Boracay Island and 57% of
the respondents on the Mainland of Malay practice waste segregation. Also, 64% of the
respondents on Boracay Island are discharging waste at the designated time and place of
discharge making them highly aware of the policy and practice on solid waste management
(Table A.5.1-10).
Table A.5.1-10 Cleaning Activities Undertaken by Households
Item Balabag Manoc-
ManocYapak
Boracay
Island Balusbos Poblacion
Mainland
Malay Total
Clean around my house only 38 42 39 119 14 13 27 146
Practice waste segregation 35 42 38 115 8 9 17 132
Discharge waste at designated
time/place 27 30 27 84 1 0 1 85
Participate in voluntary cleaning
activities 3 2 2 7 1 0 1 8
Educate family to keep house and
surrounding clean 5 0 3 8 0 0 0 8
Others 0 0 0 0 2 3 5 5
Total 108 116 109 333 26 25 51 384
Source: JICA Study Team
5.1.3 Knowledge on Solid Waste Management and 3R Activities (Reduce, Reuse, Recycle)
The survey for household respondents also validated the level of knowledge on SWM and
the corresponding 3R activities being done by the respondents. The different activities being
done by the respondents to adhere to SWM segregation were also identified during the
survey.

Supporting Report
Chapter II-A
The Master Plan on Solid Waste Management
for Boracay Island and Municipality of Malay
II-A-12
(1) Awareness on Solid Waste Management Program
All of the households on Boracay Island are aware of the SWM ordinance in the municipality
(Table A.5.1-11). Almost all of the respondents on the island are aware of the different
policies guiding the SWM program. Activities such as solid waste collection schedule and
waste discharging time and place are known, as well as the categories of segregation.
On the other hand, less than half (47%) of the respondents on the Mainland of Malay are
aware of the SWM ordinance and policies. This is due to the fact that majority of the
respondents on the Mainland of Malay (60%) have stated that there is no collection of solid
wastes in their respective areas and barangays. This is the main reason why there is a low
level of awareness on the Mainland of Malay in terms of SWM program implementation.
Table A.5.1-11 Level of Awareness on Solid Waste Management Ordinance/Polices.
Balabag Manoc-
Manoc Yapak
Boracay
Island Balusbos Poblacion
Mainland
Malay Total Level of
Awareness No. % No. % No. % No. % No. % No. % No. % No. %
SWM Ordinance
Yes 42 100.00 46 97.87 43 100.00 131 99.24 6 40.00 8 53.33 14 46.67 145 89.51
No 0 0.00 0 0.00 0 0.00 0 0.00 6 40.00 3 20.00 9 30.00 9 5.56
No Idea 0 0.00 1 2.13 0 0.00 1 0.76 3 20.00 4 26.67 7 23.33 8 4.94
Total 42 100.00 47 100.00 43 100.00 132 100.00 15 100.00 15 100.00 30 100.00 162 100.00
Awareness on SWM Policies
Day/Time of SW
Collection 41 97.62 46 97.87 43 100.00 130 98.48 0 0.00 2 13.33 2 6.67 132 81.48
Time of
Discharging SW 41 97.62 46 97.87 43 100.00 130 98.48 0 0.00 5 33.33 5 16.67 135 83.33
Place of
Discharging SW 40 95.24 46 97.87 43 100.00 129 97.73 0 0.00 5 33.33 5 16.67 134 82.72
Category of
Segregation 39 92.86 43 91.49 41 95.35 123 93.18 2 13.33 6 40.00 8 26.67 131 80.86
Others (No
collection in the
barangay) 1 2.38 2 4.26 0 0.00 3 2.27 13 86.67 5 33.33 18 60.00 21 12.96
Source: JICA Study Team
(2) Degree of Segregation
A total of 107 or 81% of the households on Boracay Island agreed that the food wastes and
recyclables are important to segregate from other kind of waste. The main reason for this is
because food wastes can be feed to livestock and household pets and the recyclables are
being sold to junk shops for additional household income. There is an additional 19
respondents (14%) on the island had stated that recyclables should not be collected by the
garbage truck in their area.
Eight (8) respondents on the Mainland of Malay agreed that recyclables should not be
collected for these can be sold to junk shops. There were three (3) respondents on the
Mainland of Malay who do not know the segregation categories of the municipality (Table
A.5.1-12).

Supporting Report
Chapter II-A
The Master Plan on Solid Waste Management
for Boracay Island and Municipality of Malay
II-A-13
Table A.5.1-12 Degree of Segregation
Balabag Manoc-
Manoc Yapak
Boracay
Island Balusbos Poblacion
Mainland
Malay Total
Item
No. % No. % No. % No. % No. % No. % No. % No. %
All wastes are mixed
without segregation 1 2.38 0 0.00 0 0.00 1 0.76 0 0.00 0 0.00 0 0.00 1 0.62
Only recyclables are
separated from other wastes 4 9.52 0 0.00 1 2.33 5 3.79 0 0.00 2 13.33 2 6.67 7 4.32
Only food waste and
recyclables are separated
from other wastes 34 80.95 35 74.47 38 88.37 107 81.06 0 0.00 0 0.00 0 0.00 107 66.05
Recyclables should not be
collected but other wastes
must be collected 3 7.14 12 25.53 4 9.30 19 14.39 1 6.67 7 46.67 8 26.67 27 16.67
I don't know how to
segregate 0 0.00 0 0.00 0 0.00 0 0.00 3 20.00 0 0.00 3 10.00 3 1.85
Total 42 100 47 100 43 100 132 100 4 26.67 9 60 13 43.33 145 89.51
Source: JICA Study Team
(3) Source of Information on SWM
In terms of getting the information on practicing segregation and solid waste discharge,
majority of the households on Boracay Island follow the instructions provided by the
barangay monitoring team (98 responses) who regularly observe their waste discharging
activities (Table A.5.1-13). The dissemination meeting of the different barangays on Boracay
Island (72 responses) is also a significant source of information among the respondents. In
addition, announcements and advertisements from the radio (48 responses) were cited as an
information source (33 responses).
The household respondents on the Mainland of Malay also sourced their information on
discharging methods through dissemination meeting by the barangay (9 responses), from
television (9 responses) and from radio announcements (9 responses). It was also observed
that a large portion of the respondents on the Mainland of Malay (7 responses) have no idea
or not knowledgeable in the discharge methods of the SWM program.

Supporting Report
Chapter II-A
The Master Plan on Solid Waste Management
for Boracay Island and Municipality of Malay
II-A-14
Table A.5.1-13 Different Means in Getting Knowledge on Discharging Methods
Different Means Balabag Manoc-
manoc Yapak
Boracay
Is. Balusbos Poblacion
Mainland
Malay Total
Poster in tricycles 0 5 0 5 0 0 0 5
Poster in multi-cab 0 0 0 0 0 0 0 0
Poster in pumpboat 0 0 0 0 0 0 0 0
Heard in the neighborhood 17 9 7 33 0 2 2 35
Dissemination meeting of
municipality 1 1 0 2 0 1 1 3
Dissemination meeting of
barangay 28 24 20 72 1 8 9 81
Dissemination meeting of
NGO/CBO 0 0 0 0 0 0 0 0
Instruction from brgy monitoring
team 19 41 38 98 0 0 0 98
Newspapers/Newsletters 4 1 5 10 0 0 0 10
Radio 29 7 12 48 1 6 7 55
TV 9 8 7 24 3 6 9 33
Internet 1 0 0 1 0 0 0 1
Others 2 1 1 4 0 0 0 4
I don't know the discharge method 0 0 0 0 6 1 7 7
Total 110 97 90 297 11 24 35 332
Source: JICA Study Team
5.1.4 Waste Discharge Activities
The public awareness survey also assessed the waste discharging activities of the different
households. The study reviewed the different discharging activities of the household per
type of waste in corresponding waste segregation categories of the municipality. The volume
of discharge per respondent was estimated to provide a general solid waste discharge
situation of the households on Boracay Island and the Mainland of Malay. The household
capacity to discharge solid waste was also estimated.
(1) Handling Manner
1) Food Wastes and Recyclables
Based on the survey, majority of the households on Boracay Island and the Mainland of
Malay are feeding their food wastes to their pets, 121 and 27 responses respectively (Table
A.5.1-14). Newspapers, magazines and cartons were discharged with segregation (77
responses) and burned (76 responses) on Boracay Island. On the Mainland of Malay,
majority of the newspaper and magazines were burned (21 responses) and six (6) among the
respondents discharged these items without segregation. Glass bottles, cans and PET bottles
are either being discharged with segregation of being sold to junkshops for additional
household income of respondents on Boracay. On the Mainland of Malay, almost all of the
glass bottles, cans and PET bottles were sold to junkshops.

Supporting Report
Chapter II-A
The Master Plan on Solid Waste Management
for Boracay Island and Municipality of Malay
II-A-15
Table A.5.1-14 Solid Waste Discharging Activities (Primary Waste Categories)
Item Balabag Manoc-
ManocYapak
Boracay
Island Balusbos Poblacion
Mainland
Malay Total
Food Waste
Bury 6 2 2 10 3 1 4 14
Burn 0 0 0 0 0 1 1 1
Feed to Pets 37 44 40 121 15 12 27 148
Make Compost 0 0 3 3 0 0 0 3
Sell to Buyers 1 0 0 1 0 0 0 1
Discharge w/Segregation 3 2 4 9 0 0 0 9
Discharge w/out Segregation 1 0 0 1 0 0 0 1
Total 48 48 49 145 18 14 32 177
Newspaper/Magazines/Cartons
Bury 0 2 1 3 2 0 2 5
Burn 25 34 17 76 12 9 21 97
Sell to Buyers 3 6 2 11 0 2 2 13
Discharge w/Segregation 24 22 31 77 2 0 2 79
Discharge w/out Segregation 1 0 0 1 2 4 6 7
Total 53 64 51 168 18 15 33 201
Glass Bottles
Bury 1 0 0 1 0 1 1 2
Burn 0 0 1 1 0 0 0 1
Sell to Buyers 32 44 37 113 15 14 29 142
Discharge w/Segregation 21 22 25 68 3 0 3 71
Discharge w/out Segregation 1 0 0 1 2 4 6 7
Total 55 66 63 184 20 19 39 223
Cans
Bury 1 0 0 1 0 0 0 1
Sell to Buyers 31 43 37 111 15 15 30 141
Discharge w/Segregation 22 20 25 67 2 0 2 69
Discharge w/out Segregation 0 0 0 0 2 4 6 6
Total 54 63 62 179 19 19 38 217
PET Bottles
Sell to Buyers 31 44 34 109 15 15 30 139
Discharge w/Segregation 20 20 25 65 2 0 2 67
Discharge w/out Segregation 0 0 0 0 2 4 6 6
Total 51 64 59 174 19 19 38 212
Source: JICA Study Team
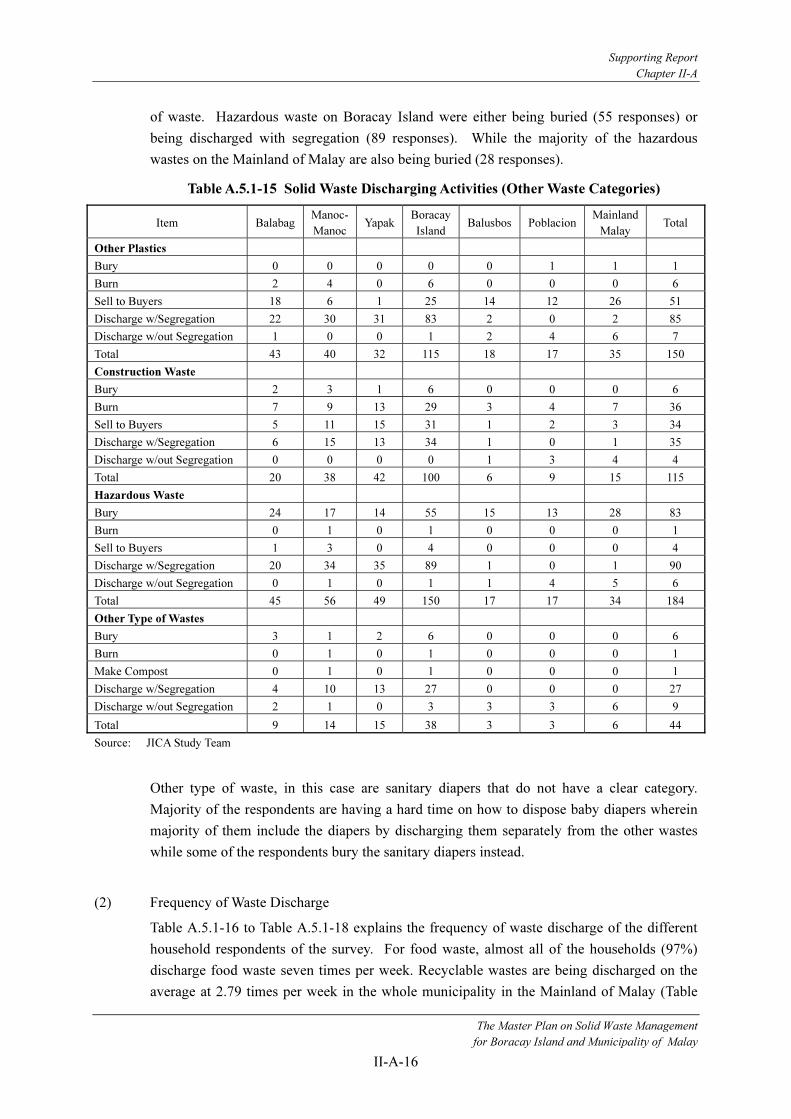
2) Other Types of Waste
Table A.5.1-15 presents the discharging activities of the different households on other waste
types, i.e. other plastics, hazardous wastes, construction waste and others. On Boracay
Island, other types of plastic wastes were either discharged with segregation (83 responses)
or sold to plastic buyers (25 responses) while on the Mainland of Malay, the majority of the
plastic wastes are being sold to buyers (26 responses).
Construction waste was either sold to buyers or being discharged with segregation on
Boracay Island while on the Mainland of Malay majority of the respondents burned this type
Supporting Report
Chapter II-A
The Master Plan on Solid Waste Management
for Boracay Island and Municipality of Malay
II-A-16
of waste. Hazardous waste on Boracay Island were either being buried (55 responses) or
being discharged with segregation (89 responses). While the majority of the hazardous
wastes on the Mainland of Malay are also being buried (28 responses).
Table A.5.1-15 Solid Waste Discharging Activities (Other Waste Categories)
Item Balabag Manoc-
ManocYapak
Boracay
Island Balusbos Poblacion
Mainland
Malay Total
Other Plastics
Bury 0 0 0 0 0 1 1 1
Burn 2 4 0 6 0 0 0 6
Sell to Buyers 18 6 1 25 14 12 26 51
Discharge w/Segregation 22 30 31 83 2 0 2 85
Discharge w/out Segregation 1 0 0 1 2 4 6 7
Total 43 40 32 115 18 17 35 150
Construction Waste
Bury 2 3 1 6 0 0 0 6
Burn 7 9 13 29 3 4 7 36
Sell to Buyers 5 11 15 31 1 2 3 34
Discharge w/Segregation 6 15 13 34 1 0 1 35
Discharge w/out Segregation 0 0 0 0 1 3 4 4
Total 20 38 42 100 6 9 15 115
Hazardous Waste
Bury 24 17 14 55 15 13 28 83
Burn 0 1 0 1 0 0 0 1
Sell to Buyers 1 3 0 4 0 0 0 4
Discharge w/Segregation 20 34 35 89 1 0 1 90
Discharge w/out Segregation 0 1 0 1 1 4 5 6
Total 45 56 49 150 17 17 34 184
Other Type of Wastes
Bury 3 1 2 6 0 0 0 6
Burn 0 1 0 1 0 0 0 1
Make Compost 0 1 0 1 0 0 0 1
Discharge w/Segregation 4 10 13 27 0 0 0 27
Discharge w/out Segregation 2 1 0 3 3 3 6 9
Total 9 14 15 38 3 3 6 44
Source: JICA Study Team
Other type of waste, in this case are sanitary diapers that do not have a clear category.
Majority of the respondents are having a hard time on how to dispose baby diapers wherein
majority of them include the diapers by discharging them separately from the other wastes
while some of the respondents bury the sanitary diapers instead.
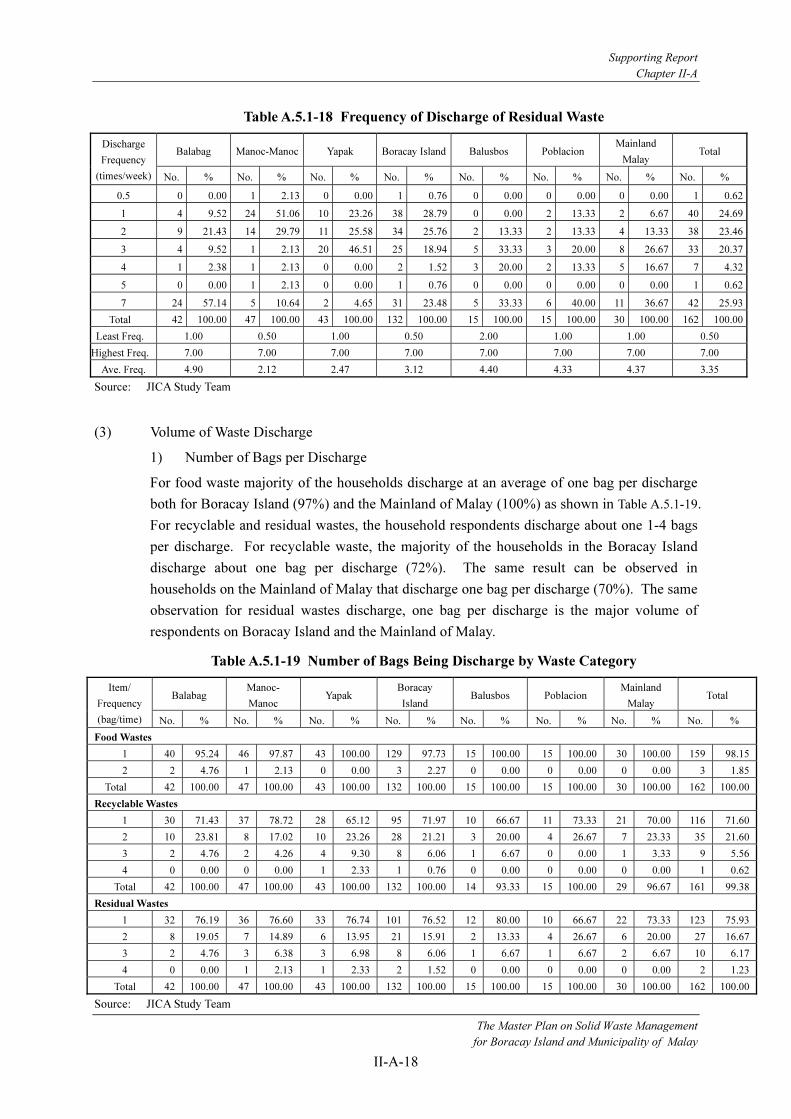
(2) Frequency of Waste Discharge
Table A.5.1-16 to Table A.5.1-18 explains the frequency of waste discharge of the different
household respondents of the survey. For food waste, almost all of the households (97%)
discharge food waste seven times per week. Recyclable wastes are being discharged on the
average at 2.79 times per week in the whole municipality in the Mainland of Malay (Table

Supporting Report
Chapter II-A
The Master Plan on Solid Waste Management
for Boracay Island and Municipality of Malay
II-A-17
A.5.1-17). On Boracay Island, households discharge recyclable wastes on the average 3.10
times per week and on the Mainland of Malay, it is 1.41 times per week (Table A.5.1-17).
In terms of residual wastes, the average discharge of households on Boracay Island is 3.12
times per week and higher on the Mainland of Malay at 4.37 times per week (Table A.5.1-18).
The discharge frequency of 0.25 times per week and 0.5 times per week means that the
household discharge either recyclable or residual wastes 1-2 times per month.
Table A.5.1-16 Frequency of Discharge of Food Waste
Balabag Manoc-Manoc Yapak Boracay Island Balusbos Poblacion Mainland
Malay Total
Discharge
Frequency
(times/week) No. % No. % No. % No. % No. % No. % No. % No. %
1 0 0.00 2 4.26 1 2.33 3 2.27 0 0.00 1 6.67 1 3.33 4 2.47
7 42 100.00 45 95.74 42 97.67 129 97.73 15 100.00 14 93.33 29 96.67 158 97.53
Total 42 100.00 47 100.00 43 100.00 132 100.00 15 100.00 15 100.00 30 100.00 162 100.00
Least Freq. 7.00 1.00 1.00 1.00 7.00 1.00 1.00 1.00
Highest Freq. 7.00 7.00 7.00 7.00 7.00 7.00 7.00 7.00
Ave. Freq. 7.00 6.74 6.86 6.86 7.00 6.60 6.80 6.85
Source: JICA Study Team
Table A.5.1-17 Frequency of Discharge of Recyclable Waste
Balabag Manoc-
Manoc Yapak
Boracay
Island Balusbos Poblacion
Mainland
Malay Total
Discharge
Frequency
(times/week) No. % No. % No. % No. % No. % No. % No. % No. %
0.25 5 11.90 6 12.77 3 6.98 14 10.61 2 13.33 3 20.00 5 16.67 19 11.73
0.50 1 2.38 0 0.00 2 4.65 3 2.27 1 6.67 0 0.00 1 3.33 4 2.47
1 6 14.29 19 40.43 8 18.60 33 25.00 7 46.67 7 46.67 14 46.67 47 29.01
2 13 30.95 12 25.53 9 20.93 34 25.76 2 13.33 2 13.33 4 13.33 38 23.46
3 5 11.90 0 0.00 16 37.21 21 15.91 1 6.67 3 20.00 4 13.33 25 15.43
4 2 4.76 1 2.13 0 0.00 3 2.27 0 0.00 0 0.00 0 0.00 3 1.85
5 0 0.00 1 2.13 0 0.00 1 0.76 1 6.67 0 0.00 1 3.33 2 1.23
7 8 19.05 6 12.77 2 4.65 16 12.12 0 0.00 0 0.00 0 0.00 16 9.88
14 0 0.00 1 2.13 0 0.00 1 0.76 0 0.00 0 0.00 0 0.00 1 0.62
15 1 2.38 1 2.13 3 6.98 5 3.79 0 0.00 0 0.00 0 0.00 5 3.09
22 1 2.38 0 0.00 0 0.00 1 0.76 0 0.00 0 0.00 0 0.00 1 0.62
Total 42 100.00 47 100.00 43 100.00 132 100.00 14 93.33 15 100.00 29 96.67 161 99.38
Least Freq. 0.25 0.25 0.25 0.25 0.25 0.25 0.25 0.25
Highest Freq. 22.00 15.00 15.00 22.00 5.00 3.00 5.00 22.00
Ave. Freq. 3.57 2.65 3.13 3.10 1.43 1.38 1.41 2.79
Source: JICA Study Team
Supporting Report
Chapter II-A
The Master Plan on Solid Waste Management
for Boracay Island and Municipality of Malay
II-A-18
Table A.5.1-18 Frequency of Discharge of Residual Waste
Balabag Manoc-Manoc Yapak Boracay Island Balusbos Poblacion Mainland
Malay Total
Discharge
Frequency
(times/week) No. % No. % No. % No. % No. % No. % No. % No. %
0.5 0 0.00 1 2.13 0 0.00 1 0.76 0 0.00 0 0.00 0 0.00 1 0.62
1 4 9.52 24 51.06 10 23.26 38 28.79 0 0.00 2 13.33 2 6.67 40 24.69
2 9 21.43 14 29.79 11 25.58 34 25.76 2 13.33 2 13.33 4 13.33 38 23.46
3 4 9.52 1 2.13 20 46.51 25 18.94 5 33.33 3 20.00 8 26.67 33 20.37
4 1 2.38 1 2.13 0 0.00 2 1.52 3 20.00 2 13.33 5 16.67 7 4.32
5 0 0.00 1 2.13 0 0.00 1 0.76 0 0.00 0 0.00 0 0.00 1 0.62
7 24 57.14 5 10.64 2 4.65 31 23.48 5 33.33 6 40.00 11 36.67 42 25.93
Total 42 100.00 47 100.00 43 100.00 132 100.00 15 100.00 15 100.00 30 100.00 162 100.00
Least Freq. 1.00 0.50 1.00 0.50 2.00 1.00 1.00 0.50
Highest Freq. 7.00 7.00 7.00 7.00 7.00 7.00 7.00 7.00
Ave. Freq. 4.90 2.12 2.47 3.12 4.40 4.33 4.37 3.35
Source: JICA Study Team
(3) Volume of Waste Discharge
1) Number of Bags per Discharge
For food waste majority of the households discharge at an average of one bag per discharge
both for Boracay Island (97%) and the Mainland of Malay (100%) as shown in Table A.5.1-19.
For recyclable and residual wastes, the household respondents discharge about one 1-4 bags
per discharge. For recyclable waste, the majority of the households in the Boracay Island
discharge about one bag per discharge (72%). The same result can be observed in
households on the Mainland of Malay that discharge one bag per discharge (70%). The same
observation for residual wastes discharge, one bag per discharge is the major volume of
respondents on Boracay Island and the Mainland of Malay.
Table A.5.1-19 Number of Bags Being Discharge by Waste Category
Balabag Manoc-
Manoc Yapak
Boracay
Island Balusbos Poblacion
Mainland
Malay Total
Item/
Frequency
(bag/time) No. % No. % No. % No. % No. % No. % No. % No. %
Food Wastes
1 40 95.24 46 97.87 43 100.00 129 97.73 15 100.00 15 100.00 30 100.00 159 98.15
2 2 4.76 1 2.13 0 0.00 3 2.27 0 0.00 0 0.00 0 0.00 3 1.85
Total 42 100.00 47 100.00 43 100.00 132 100.00 15 100.00 15 100.00 30 100.00 162 100.00
Recyclable Wastes
1 30 71.43 37 78.72 28 65.12 95 71.97 10 66.67 11 73.33 21 70.00 116 71.60
2 10 23.81 8 17.02 10 23.26 28 21.21 3 20.00 4 26.67 7 23.33 35 21.60
3 2 4.76 2 4.26 4 9.30 8 6.06 1 6.67 0 0.00 1 3.33 9 5.56
4 0 0.00 0 0.00 1 2.33 1 0.76 0 0.00 0 0.00 0 0.00 1 0.62
Total 42 100.00 47 100.00 43 100.00 132 100.00 14 93.33 15 100.00 29 96.67 161 99.38
Residual Wastes
1 32 76.19 36 76.60 33 76.74 101 76.52 12 80.00 10 66.67 22 73.33 123 75.93
2 8 19.05 7 14.89 6 13.95 21 15.91 2 13.33 4 26.67 6 20.00 27 16.67
3 2 4.76 3 6.38 3 6.98 8 6.06 1 6.67 1 6.67 2 6.67 10 6.17
4 0 0.00 1 2.13 1 2.33 2 1.52 0 0.00 0 0.00 0 0.00 2 1.23
Total 42 100.00 47 100.00 43 100.00 132 100.00 15 100.00 15 100.00 30 100.00 162 100.00
Source: JICA Study Team

Supporting Report
Chapter II-A
The Master Plan on Solid Waste Management
for Boracay Island and Municipality of Malay
II-A-19
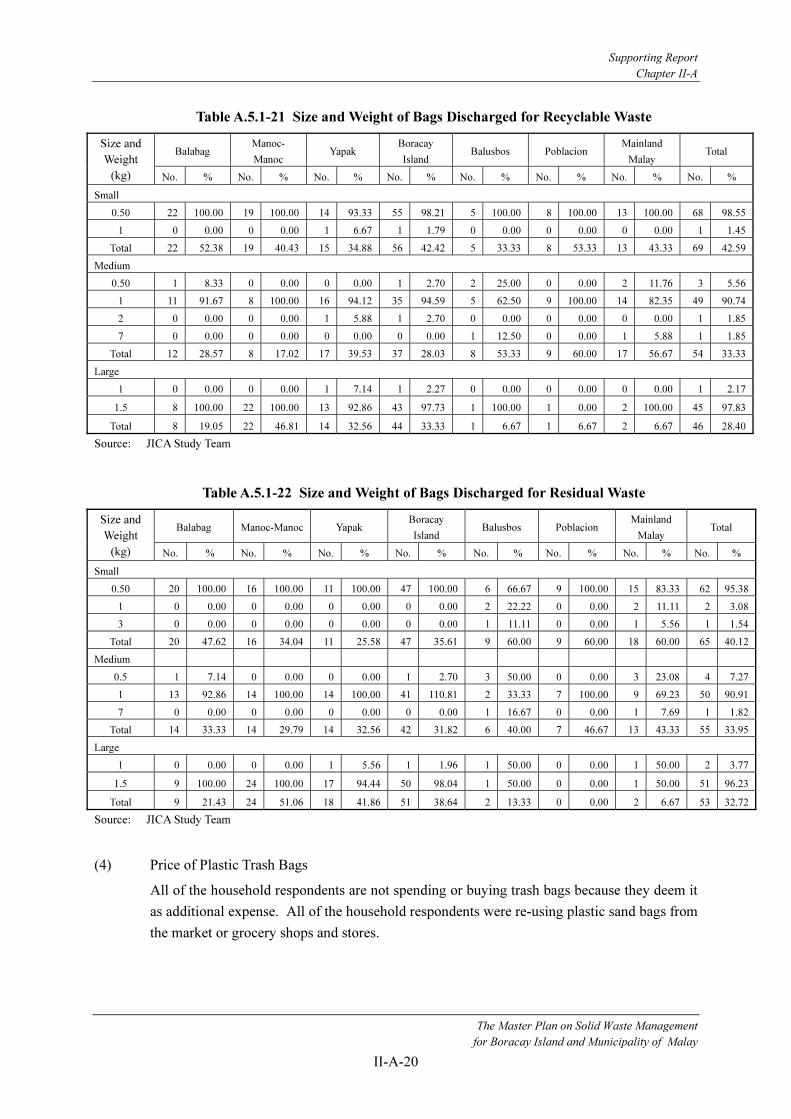
2) Bag Size and Weight
Presented in Table A.5.1-20 to Table A.5.1-22 are the volume of discharge in terms of bag
size and weight per bag. The size of waste or trash bag is classified into small, medium and
large and the weight of bags depends on the type of waste. As observed during the survey,
food wastes have the heaviest weight in any size of bags. The weight of a small size food
waste bag is heavier than the weight of the recyclable wastes in small size bag.
Based on the Table A.5.1-20, majority of the food waste discharged is contained in small size
trash bags (83%) with a range weight of 0.5 to 3.0 kg. During discharge majority of the
households discharge an average of 1 kg of food waste in small trash bags. 14% of the
households discharge medium size trash bags for food waste and 2% discharge large size
trash bags.
For recyclable waste, 43% of the households use small size trash bags during discharge, 33%
use medium size and 28% use large size trash bags. Among the respondents discharging
small size trash bags, the majority of them discharge 0.5 kg of recyclable wastes. Among the
medium size trash bags majority of the discharge is 1 kg of recyclables and among large size
of trash bags 1.5 kg is the common weight discharged.
The same result can be observed for residual waste; 40% use small size trash bags, 34% use
medium size and 33% use large size trash bags. Among the respondents discharging residual
wastes, the major weight of discharge for small trash bag is 0.5 kg, for medium size trash bag
is 1 kg and 1.5 kg for large trash bags.
Table A.5.1-20 Size and Weight of Bags Discharged for Food Waste
Balabag Manoc-
Manoc Yapak
Boracay
Island Balusbos Poblacion
Mainland
Malay Total
Size and
Weight
(kg) No. % No. % No. % No. % No. % No. % No. % No. %
Small
0.50 0 0.00 5 11.63 1 3.23 6 5.50 2 14.29 0 0.00 2 7.69 8 5.93
1 35 100.00 38 88.37 30 96.77 103 94.50 11 78.57 12 100.00 23 88.46 126 93.33
3 0 0.00 0 0.00 0 0.00 0 0.00 1 7.14 0 0.00 1 3.85 1 0.74
Total 35 83.33 43 91.49 31 72.09 109 82.58 14 93.33 12 80.00 26 86.67 135 83.33
Medium
1 0 0.00 1 33.33 0 0.00 1 5.26 0 0.00 2 66.67 2 50.00 3 13.04
1.5 0 0.00 0 0.00 3 30.00 3 15.79 1 100.00 0 0.00 1 25.00 4 17.39
2 6 100.00 2 66.67 7 70.00 15 78.95 0 0.00 1 33.33 1 25.00 16 69.57
Total 6 14.29 3 6.38 10 23.26 19 14.39 1 6.67 3 20.00 4 13.33 23 14.20
Large
1 0 0.00 1 100.00 0 0.00 1 25.00 0 0.00 0 0.00 0 0.00 1 25.00
2 0 0.00 0 0.00 2 100.00 2 50.00 0 0.00 0 0.00 0 0.00 2 50.00
3 1 100.00 0 0.00 0 0.00 1 25.00 0 0.00 0 0.00 0 0.00 1 25.00
Total 1 2.38 1 2.13 2 4.65 4 3.03 0 0.00 0 0.00 0 0.00 4 2.47
Source: JICA Study Team
Supporting Report
Chapter II-A
The Master Plan on Solid Waste Management
for Boracay Island and Municipality of Malay
II-A-20
Table A.5.1-21 Size and Weight of Bags Discharged for Recyclable Waste
Balabag Manoc-
Manoc Yapak
Boracay
Island Balusbos Poblacion
Mainland
Malay Total
Size and
Weight
(kg) No. % No. % No. % No. % No. % No. % No. % No. %
Small
0.50 22 100.00 19 100.00 14 93.33 55 98.21 5 100.00 8 100.00 13 100.00 68 98.55
1 0 0.00 0 0.00 1 6.67 1 1.79 0 0.00 0 0.00 0 0.00 1 1.45
Total 22 52.38 19 40.43 15 34.88 56 42.42 5 33.33 8 53.33 13 43.33 69 42.59
Medium
0.50 1 8.33 0 0.00 0 0.00 1 2.70 2 25.00 0 0.00 2 11.76 3 5.56
1 11 91.67 8 100.00 16 94.12 35 94.59 5 62.50 9 100.00 14 82.35 49 90.74
2 0 0.00 0 0.00 1 5.88 1 2.70 0 0.00 0 0.00 0 0.00 1 1.85
7 0 0.00 0 0.00 0 0.00 0 0.00 1 12.50 0 0.00 1 5.88 1 1.85
Total 12 28.57 8 17.02 17 39.53 37 28.03 8 53.33 9 60.00 17 56.67 54 33.33
Large
1 0 0.00 0 0.00 1 7.14 1 2.27 0 0.00 0 0.00 0 0.00 1 2.17
1.5 8 100.00 22 100.00 13 92.86 43 97.73 1 100.00 1 0.00 2 100.00 45 97.83
Total 8 19.05 22 46.81 14 32.56 44 33.33 1 6.67 1 6.67 2 6.67 46 28.40
Source: JICA Study Team
Table A.5.1-22 Size and Weight of Bags Discharged for Residual Waste
Balabag Manoc-Manoc Yapak Boracay
Island Balusbos Poblacion
Mainland
Malay Total
Size and
Weight
(kg) No. % No. % No. % No. % No. % No. % No. % No. %
Small
0.50 20 100.00 16 100.00 11 100.00 47 100.00 6 66.67 9 100.00 15 83.33 62 95.38
1 0 0.00 0 0.00 0 0.00 0 0.00 2 22.22 0 0.00 2 11.11 2 3.08
3 0 0.00 0 0.00 0 0.00 0 0.00 1 11.11 0 0.00 1 5.56 1 1.54
Total 20 47.62 16 34.04 11 25.58 47 35.61 9 60.00 9 60.00 18 60.00 65 40.12
Medium
0.5 1 7.14 0 0.00 0 0.00 1 2.70 3 50.00 0 0.00 3 23.08 4 7.27
1 13 92.86 14 100.00 14 100.00 41 110.81 2 33.33 7 100.00 9 69.23 50 90.91
7 0 0.00 0 0.00 0 0.00 0 0.00 1 16.67 0 0.00 1 7.69 1 1.82
Total 14 33.33 14 29.79 14 32.56 42 31.82 6 40.00 7 46.67 13 43.33 55 33.95
Large
1 0 0.00 0 0.00 1 5.56 1 1.96 1 50.00 0 0.00 1 50.00 2 3.77
1.5 9 100.00 24 100.00 17 94.44 50 98.04 1 50.00 0 0.00 1 50.00 51 96.23
Total 9 21.43 24 51.06 18 41.86 51 38.64 2 13.33 0 0.00 2 6.67 53 32.72
Source: JICA Study Team
(4) Price of Plastic Trash Bags
All of the household respondents are not spending or buying trash bags because they deem it
as additional expense. All of the household respondents were re-using plastic sand bags from
the market or grocery shops and stores.
Supporting Report
Chapter II-A
The Master Plan on Solid Waste Management
for Boracay Island and Municipality of Malay
II-A-21
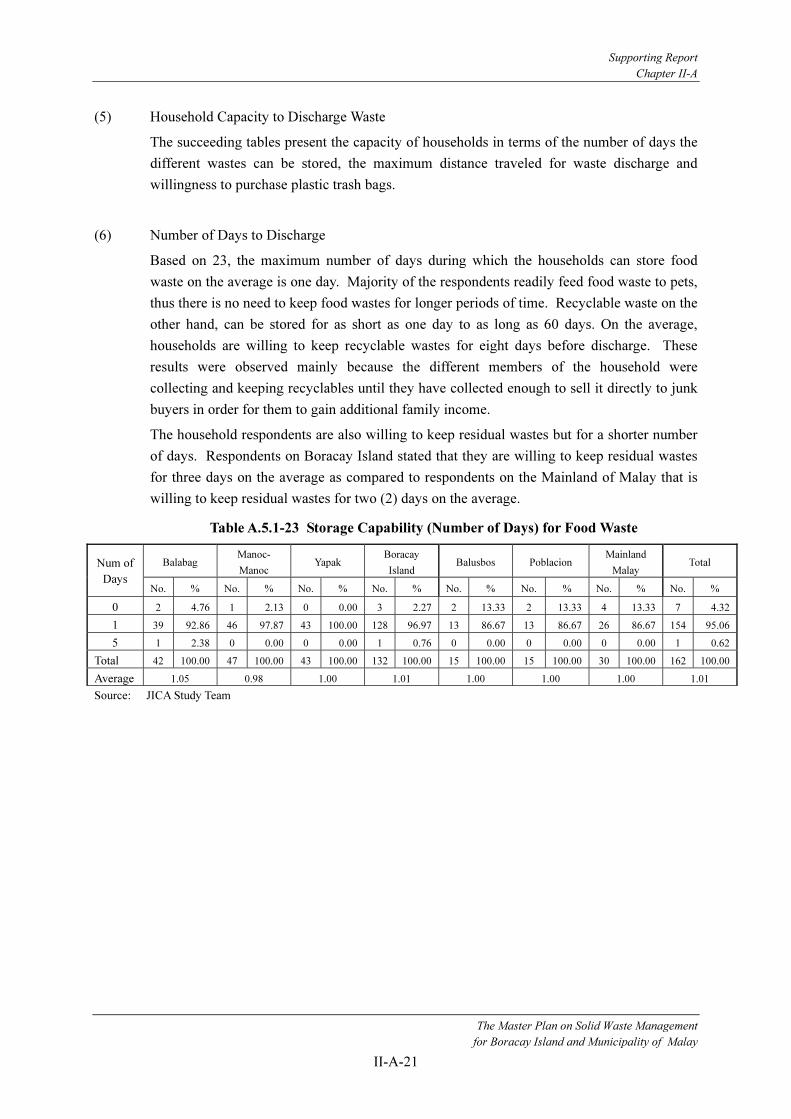
(5) Household Capacity to Discharge Waste
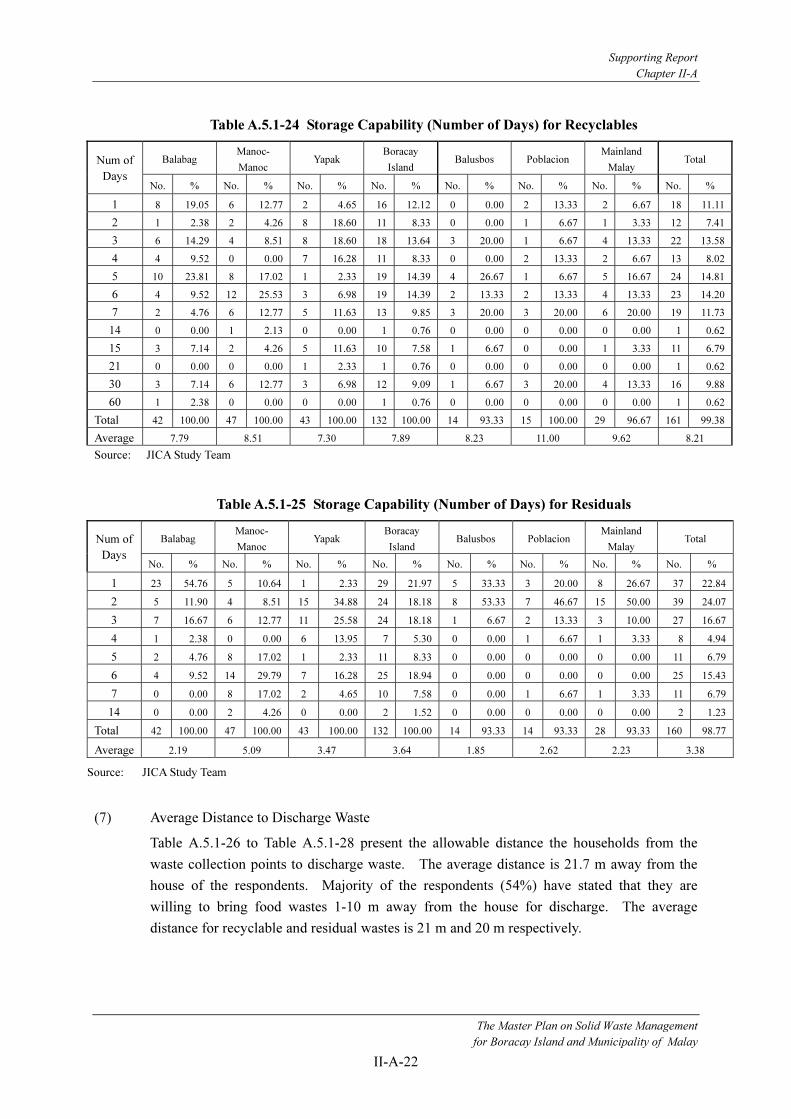
The succeeding tables present the capacity of households in terms of the number of days the
different wastes can be stored, the maximum distance traveled for waste discharge and
willingness to purchase plastic trash bags.
(6) Number of Days to Discharge
Based on 23, the maximum number of days during which the households can store food
waste on the average is one day. Majority of the respondents readily feed food waste to pets,
thus there is no need to keep food wastes for longer periods of time. Recyclable waste on the
other hand, can be stored for as short as one day to as long as 60 days. On the average,
households are willing to keep recyclable wastes for eight days before discharge. These
results were observed mainly because the different members of the household were
collecting and keeping recyclables until they have collected enough to sell it directly to junk
buyers in order for them to gain additional family income.
The household respondents are also willing to keep residual wastes but for a shorter number
of days. Respondents on Boracay Island stated that they are willing to keep residual wastes
for three days on the average as compared to respondents on the Mainland of Malay that is
willing to keep residual wastes for two (2) days on the average.
Table A.5.1-23 Storage Capability (Number of Days) for Food Waste
Balabag Manoc-
Manoc Yapak
Boracay
Island Balusbos Poblacion
Mainland
Malay Total Num of
Days No. % No. % No. % No. % No. % No. % No. % No. %
0 2 4.76 1 2.13 0 0.00 3 2.27 2 13.33 2 13.33 4 13.33 7 4.32
1 39 92.86 46 97.87 43 100.00 128 96.97 13 86.67 13 86.67 26 86.67 154 95.06
5 1 2.38 0 0.00 0 0.00 1 0.76 0 0.00 0 0.00 0 0.00 1 0.62
Total 42 100.00 47 100.00 43 100.00 132 100.00 15 100.00 15 100.00 30 100.00 162 100.00
Average 1.05 0.98 1.00 1.01 1.00 1.00 1.00 1.01
Source: JICA Study Team
Supporting Report
Chapter II-A
The Master Plan on Solid Waste Management
for Boracay Island and Municipality of Malay
II-A-22
Table A.5.1-24 Storage Capability (Number of Days) for Recyclables
Balabag Manoc-
Manoc Yapak
Boracay
Island Balusbos Poblacion
Mainland
Malay Total Num of
Days No. % No. % No. % No. % No. % No. % No. % No. %
1 8 19.05 6 12.77 2 4.65 16 12.12 0 0.00 2 13.33 2 6.67 18 11.11
2 1 2.38 2 4.26 8 18.60 11 8.33 0 0.00 1 6.67 1 3.33 12 7.41
3 6 14.29 4 8.51 8 18.60 18 13.64 3 20.00 1 6.67 4 13.33 22 13.58
4 4 9.52 0 0.00 7 16.28 11 8.33 0 0.00 2 13.33 2 6.67 13 8.02
5 10 23.81 8 17.02 1 2.33 19 14.39 4 26.67 1 6.67 5 16.67 24 14.81
6 4 9.52 12 25.53 3 6.98 19 14.39 2 13.33 2 13.33 4 13.33 23 14.20
7 2 4.76 6 12.77 5 11.63 13 9.85 3 20.00 3 20.00 6 20.00 19 11.73
14 0 0.00 1 2.13 0 0.00 1 0.76 0 0.00 0 0.00 0 0.00 1 0.62
15 3 7.14 2 4.26 5 11.63 10 7.58 1 6.67 0 0.00 1 3.33 11 6.79
21 0 0.00 0 0.00 1 2.33 1 0.76 0 0.00 0 0.00 0 0.00 1 0.62
30 3 7.14 6 12.77 3 6.98 12 9.09 1 6.67 3 20.00 4 13.33 16 9.88
60 1 2.38 0 0.00 0 0.00 1 0.76 0 0.00 0 0.00 0 0.00 1 0.62
Total 42 100.00 47 100.00 43 100.00 132 100.00 14 93.33 15 100.00 29 96.67 161 99.38
Average 7.79 8.51 7.30 7.89 8.23 11.00 9.62 8.21
Source: JICA Study Team
Table A.5.1-25 Storage Capability (Number of Days) for Residuals
Balabag Manoc-
Manoc Yapak
Boracay
Island Balusbos Poblacion
Mainland
Malay Total Num of
Days No. % No. % No. % No. % No. % No. % No. % No. %
1 23 54.76 5 10.64 1 2.33 29 21.97 5 33.33 3 20.00 8 26.67 37 22.84
2 5 11.90 4 8.51 15 34.88 24 18.18 8 53.33 7 46.67 15 50.00 39 24.07
3 7 16.67 6 12.77 11 25.58 24 18.18 1 6.67 2 13.33 3 10.00 27 16.67
4 1 2.38 0 0.00 6 13.95 7 5.30 0 0.00 1 6.67 1 3.33 8 4.94
5 2 4.76 8 17.02 1 2.33 11 8.33 0 0.00 0 0.00 0 0.00 11 6.79
6 4 9.52 14 29.79 7 16.28 25 18.94 0 0.00 0 0.00 0 0.00 25 15.43
7 0 0.00 8 17.02 2 4.65 10 7.58 0 0.00 1 6.67 1 3.33 11 6.79
14 0 0.00 2 4.26 0 0.00 2 1.52 0 0.00 0 0.00 0 0.00 2 1.23
Total 42 100.00 47 100.00 43 100.00 132 100.00 14 93.33 14 93.33 28 93.33 160 98.77
Average 2.19 5.09 3.47 3.64 1.85 2.62 2.23 3.38
Source: JICA Study Team
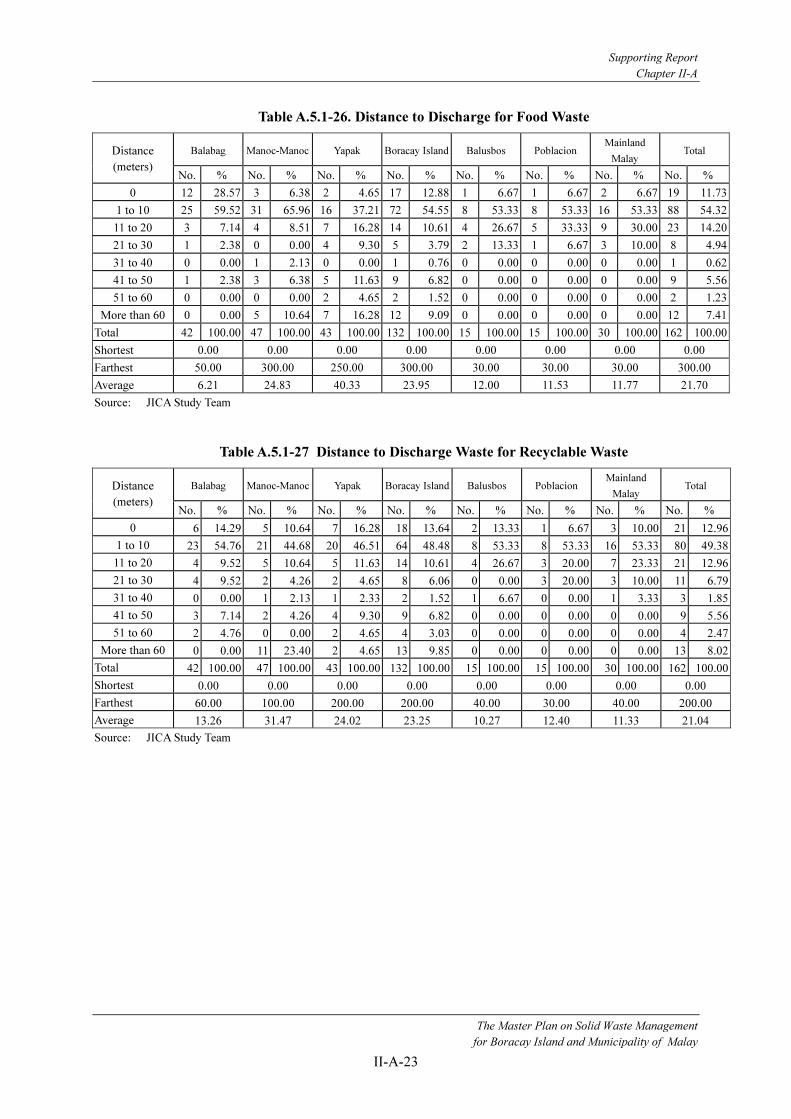
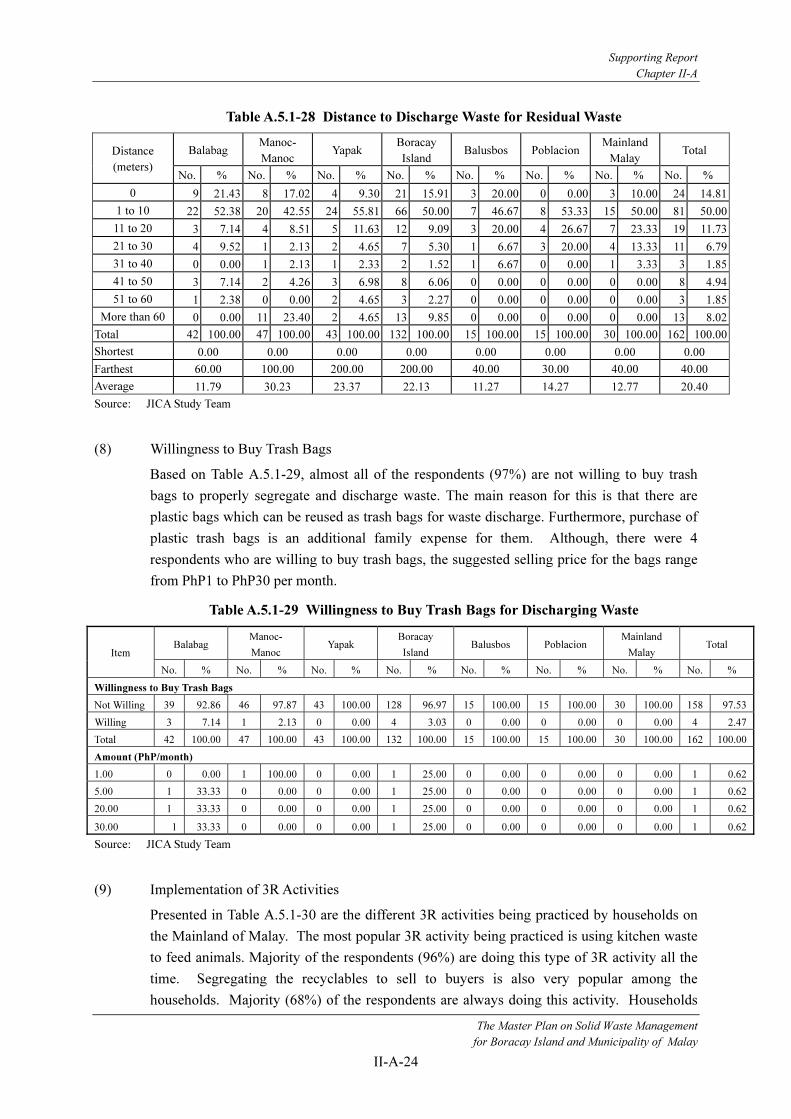
(7) Average Distance to Discharge Waste
Table A.5.1-26 to Table A.5.1-28 present the allowable distance the households from the
waste collection points to discharge waste. The average distance is 21.7 m away from the
house of the respondents. Majority of the respondents (54%) have stated that they are
willing to bring food wastes 1-10 m away from the house for discharge. The average
distance for recyclable and residual wastes is 21 m and 20 m respectively.
Supporting Report
Chapter II-A
The Master Plan on Solid Waste Management
for Boracay Island and Municipality of Malay
II-A-23
Table A.5.1-26. Distance to Discharge for Food Waste
Balabag Manoc-Manoc Yapak Boracay Island Balusbos Poblacion Mainland
Malay Total Distance
(meters) No. % No. % No. % No. % No. % No. % No. % No. %
0 12 28.57 3 6.38 2 4.65 17 12.88 1 6.67 1 6.67 2 6.67 19 11.73
1 to 10 25 59.52 31 65.96 16 37.21 72 54.55 8 53.33 8 53.33 16 53.33 88 54.32
11 to 20 3 7.14 4 8.51 7 16.28 14 10.61 4 26.67 5 33.33 9 30.00 23 14.20
21 to 30 1 2.38 0 0.00 4 9.30 5 3.79 2 13.33 1 6.67 3 10.00 8 4.94
31 to 40 0 0.00 1 2.13 0 0.00 1 0.76 0 0.00 0 0.00 0 0.00 1 0.62
41 to 50 1 2.38 3 6.38 5 11.63 9 6.82 0 0.00 0 0.00 0 0.00 9 5.56
51 to 60 0 0.00 0 0.00 2 4.65 2 1.52 0 0.00 0 0.00 0 0.00 2 1.23
More than 60 0 0.00 5 10.64 7 16.28 12 9.09 0 0.00 0 0.00 0 0.00 12 7.41
Total 42 100.00 47 100.00 43 100.00 132 100.00 15 100.00 15 100.00 30 100.00 162 100.00
Shortest 0.00 0.00 0.00 0.00 0.00 0.00 0.00 0.00
Farthest 50.00 300.00 250.00 300.00 30.00 30.00 30.00 300.00
Average 6.21 24.83 40.33 23.95 12.00 11.53 11.77 21.70
Source: JICA Study Team
Table A.5.1-27 Distance to Discharge Waste for Recyclable Waste
Balabag Manoc-Manoc Yapak Boracay Island Balusbos Poblacion Mainland
Malay Total Distance
(meters) No. % No. % No. % No. % No. % No. % No. % No. %
0 6 14.29 5 10.64 7 16.28 18 13.64 2 13.33 1 6.67 3 10.00 21 12.96
1 to 10 23 54.76 21 44.68 20 46.51 64 48.48 8 53.33 8 53.33 16 53.33 80 49.38
11 to 20 4 9.52 5 10.64 5 11.63 14 10.61 4 26.67 3 20.00 7 23.33 21 12.96
21 to 30 4 9.52 2 4.26 2 4.65 8 6.06 0 0.00 3 20.00 3 10.00 11 6.79
31 to 40 0 0.00 1 2.13 1 2.33 2 1.52 1 6.67 0 0.00 1 3.33 3 1.85
41 to 50 3 7.14 2 4.26 4 9.30 9 6.82 0 0.00 0 0.00 0 0.00 9 5.56
51 to 60 2 4.76 0 0.00 2 4.65 4 3.03 0 0.00 0 0.00 0 0.00 4 2.47
More than 60 0 0.00 11 23.40 2 4.65 13 9.85 0 0.00 0 0.00 0 0.00 13 8.02
Total 42 100.00 47 100.00 43 100.00 132 100.00 15 100.00 15 100.00 30 100.00 162 100.00
Shortest 0.00 0.00 0.00 0.00 0.00 0.00 0.00 0.00
Farthest 60.00 100.00 200.00 200.00 40.00 30.00 40.00 200.00
Average 13.26 31.47 24.02 23.25 10.27 12.40 11.33 21.04
Source: JICA Study Team
Supporting Report
Chapter II-A
The Master Plan on Solid Waste Management
for Boracay Island and Municipality of Malay
II-A-24
Table A.5.1-28 Distance to Discharge Waste for Residual Waste
Balabag Manoc-
Manoc Yapak
Boracay
Island Balusbos Poblacion
Mainland
Malay Total Distance
(meters) No. % No. % No. % No. % No. % No. % No. % No. %
0 9 21.43 8 17.02 4 9.30 21 15.91 3 20.00 0 0.00 3 10.00 24 14.81
1 to 10 22 52.38 20 42.55 24 55.81 66 50.00 7 46.67 8 53.33 15 50.00 81 50.00
11 to 20 3 7.14 4 8.51 5 11.63 12 9.09 3 20.00 4 26.67 7 23.33 19 11.73
21 to 30 4 9.52 1 2.13 2 4.65 7 5.30 1 6.67 3 20.00 4 13.33 11 6.79
31 to 40 0 0.00 1 2.13 1 2.33 2 1.52 1 6.67 0 0.00 1 3.33 3 1.85
41 to 50 3 7.14 2 4.26 3 6.98 8 6.06 0 0.00 0 0.00 0 0.00 8 4.94
51 to 60 1 2.38 0 0.00 2 4.65 3 2.27 0 0.00 0 0.00 0 0.00 3 1.85
More than 60 0 0.00 11 23.40 2 4.65 13 9.85 0 0.00 0 0.00 0 0.00 13 8.02
Total 42 100.00 47 100.00 43 100.00 132 100.00 15 100.00 15 100.00 30 100.00 162 100.00
Shortest 0.00 0.00 0.00 0.00 0.00 0.00 0.00 0.00
Farthest 60.00 100.00 200.00 200.00 40.00 30.00 40.00 40.00
Average 11.79 30.23 23.37 22.13 11.27 14.27 12.77 20.40
Source: JICA Study Team
(8) Willingness to Buy Trash Bags
Based on Table A.5.1-29, almost all of the respondents (97%) are not willing to buy trash
bags to properly segregate and discharge waste. The main reason for this is that there are
plastic bags which can be reused as trash bags for waste discharge. Furthermore, purchase of
plastic trash bags is an additional family expense for them. Although, there were 4
respondents who are willing to buy trash bags, the suggested selling price for the bags range
from PhP1 to PhP30 per month.
Table A.5.1-29 Willingness to Buy Trash Bags for Discharging Waste
Balabag Manoc-
Manoc Yapak
Boracay
Island Balusbos Poblacion
Mainland
Malay Total
Item
No. % No. % No. % No. % No. % No. % No. % No. %
Willingness to Buy Trash Bags
Not Willing 39 92.86 46 97.87 43 100.00 128 96.97 15 100.00 15 100.00 30 100.00 158 97.53
Willing 3 7.14 1 2.13 0 0.00 4 3.03 0 0.00 0 0.00 0 0.00 4 2.47
Total 42 100.00 47 100.00 43 100.00 132 100.00 15 100.00 15 100.00 30 100.00 162 100.00
Amount (PhP/month)
1.00 0 0.00 1 100.00 0 0.00 1 25.00 0 0.00 0 0.00 0 0.00 1 0.62
5.00 1 33.33 0 0.00 0 0.00 1 25.00 0 0.00 0 0.00 0 0.00 1 0.62
20.00 1 33.33 0 0.00 0 0.00 1 25.00 0 0.00 0 0.00 0 0.00 1 0.62
30.00 1 33.33 0 0.00 0 0.00 1 25.00 0 0.00 0 0.00 0 0.00 1 0.62
Source: JICA Study Team
(9) Implementation of 3R Activities
Presented in Table A.5.1-30 are the different 3R activities being practiced by households on
the Mainland of Malay. The most popular 3R activity being practiced is using kitchen waste
to feed animals. Majority of the respondents (96%) are doing this type of 3R activity all the
time. Segregating the recyclables to sell to buyers is also very popular among the
households. Majority (68%) of the respondents are always doing this activity. Households

Supporting Report
Chapter II-A
The Master Plan on Solid Waste Management
for Boracay Island and Municipality of Malay
II-A-25
are also significantly undertaking reduction of kitchen waste during the cooking process and
also fixing and repairing broken things. The other 3R activities that are not popular with the
household respondents are to bring own shopping bag and making compost from kitchen
waste. In general, all of the household covered in the survey are significantly undertaking
3R activities especially on Boracay Island.
Table A.5.1-30 3R Activities of the Households
Balabag Manoc-
Manoc Yapak
Boracay
Island Balusbos Poblacion
Mainland
Malay Total
3R Activity
No. % No. % No. % No. % No. % No. % No. % No. %
Reduce Kitchen Wastes in Cooking Process
Do It At All 19 45.24 15 31.91 12 27.91 46 34.85 5 33.33 5 33.33 10 33.33 56 34.57
Sometimes Do It 17 40.48 28 59.57 27 62.79 72 54.55 5 33.33 4 26.67 9 30.00 81 50.00
Often Do It 1 2.38 3 6.38 3 6.98 7 5.30 4 26.67 4 26.67 8 26.67 15 9.26
Do It Every time 5 11.90 1 2.13 1 2.33 7 5.30 1 6.67 2 13.33 3 10.00 10 6.17
Total 42 100.00 47 100.00 43 100.00 132 100.00 15 100.00 15 100.00 30 100.00 162 100.00
Repair and Reuse of Broken Things
Don't Do It At All 20 47.62 16 34.04 14 32.56 50 37.88 4 26.67 0 0.00 4 13.33 54 33.33
Sometimes Do It 14 33.33 20 42.55 17 39.53 51 38.64 4 26.67 7 46.67 11 36.67 62 38.27
Often Do It 4 9.52 3 6.38 12 27.91 19 14.39 7 46.67 8 53.33 15 50.00 34 20.99
Do It Every time 4 9.52 8 17.02 0 0.00 12 9.09 0 0.00 0 0.00 0 0.00 12 7.41
Total 42 100.00 47 100.00 43 100.00 132 100.00 15 100.00 15 100.00 30 100.00 162 100.00
Bringing Own Shopping Bag
Don't Do It At All 0 0.00 2 4.26 0 0.00 2 1.52 4 26.67 3 20.00 7 23.33 9 5.56
Sometimes Do It 4 9.52 1 2.13 0 0.00 5 3.79 0 0.00 2 13.33 2 6.67 7 4.32
Often Do It 11 26.19 14 29.79 14 32.56 39 29.55 2 13.33 0 0.00 2 6.67 41 25.31
Do It Every time 27 64.29 30 63.83 29 67.44 86 65.15 9 60.00 10 66.67 19 63.33 105 64.81
Total 42 100.00 47 100.00 43 100.00 132 100.00 15 100.00 15 100.00 30 100.00 162 100.00
Using Kitchen Waste to Feed Animals
Don't Do It At All 32 76.19 38 80.85 34 79.07 104 78.79 10 66.67 9 60.00 19 63.33 123 75.93
Sometimes Do It 4 9.52 4 8.51 5 11.63 13 9.85 1 6.67 5 33.33 6 20.00 19 11.73
Often Do It 4 9.52 2 4.26 4 9.30 10 7.58 4 26.67 1 6.67 5 16.67 15 9.26
Do It Every time 2 4.76 3 6.38 0 0.00 5 3.79 0 0.00 0 0.00 0 0.00 5 3.09
Total 42 100.00 47 100.00 43 100.00 132 100.00 15 100.00 15 100.00 30 100.00 162 100.00
Using Kitchen Waste to Make Compost
Don't Do It At All 2 4.76 2 4.26 1 2.33 5 3.79 0 0.00 1 6.67 1 3.33 6 3.70
Sometimes Do It 10 23.81 13 27.66 9 20.93 32 24.24 3 20.00 7 46.67 10 33.33 42 25.93
Often Do It 0 0.00 19 40.43 15 34.88 34 25.76 3 20.00 2 13.33 5 16.67 39 24.07
Do It Every time 30 71.43 13 27.66 18 41.86 61 46.21 9 60.00 5 33.33 14 46.67 75 46.30
Total 42 100.00 47 100.00 43 100.00 132 100.00 15 100.00 15 100.00 30 100.00 162 100.00
Segregate Recyclables & Sell to Buyers
Don't Do It At All 26 61.90 40 85.11 31 72.09 97 73.48 5 33.33 9 60.00 14 46.67 111 68.52
Sometimes Do It 8 19.05 4 8.51 6 13.95 18 13.64 3 20.00 1 6.67 4 13.33 22 13.58
Often Do It 6 14.29 1 2.13 4 9.30 11 8.33 7 46.67 4 26.67 11 36.67 22 13.58
Do It Every time 2 4.76 2 4.26 2 4.65 6 4.55 0 0.00 1 6.67 1 3.33 7 4.32
Total 42 100.00 47 100.00 43 100.00 132 100.00 15 100.00 15 100.00 30 100.00 162 100.00
Source: JICA Study Team
Supporting Report
Chapter II-A
The Master Plan on Solid Waste Management
for Boracay Island and Municipality of Malay
II-A-26
5.1.5 Opinion of Current Public Collection Service
The survey also evaluated the opinion of the different household respondents on the service
of the current public collection activities. The level of satisfaction from the public collection
service was asked to the respondents in order to have a gauge on the effective
implementation of the current SWM program. This section only considered the household
respondents on Boracay Island for the program have focused its activities on the island. This
is true enough because all of the household respondents in the two barangays on the
Mainland of Malay (Brangay Poblacion and Balusbos) were unsatisfied with the current
public collection service for there is no public collection of wastes on the Mainland of Malay.
(1) Level of Satisfaction.
Based on Table A.5.1-31, majority of the respondents on Boracay Island were satisfied with
the current public collection service. Majority of the households (48%) were very satisfied
with the collection service. A small proportion (5%) was not satisfied of the service and two
respondents who cannot provide opinions on the public collection service. The reason for
satisfaction was also asked from the respondents. Majority of the satisfied respondents said
that the collection time of waste is always on schedule (90 responses). Thirty-four (34) of the
respondents are actively doing segregation in their household and the collection frequency is
fairly often (27 responses). However, among those respondents who were not quite satisfied
with the public collection service there are other major reasons on why they are unsatisfied
(5 responses). Among their reasons are the very seldom collection or no collection of wastes
at all in their respective area. In addition, there are also other kinds of wastes that are not
being collected by the waste collection vehicle, such as sanitary napkins and infant diapers.
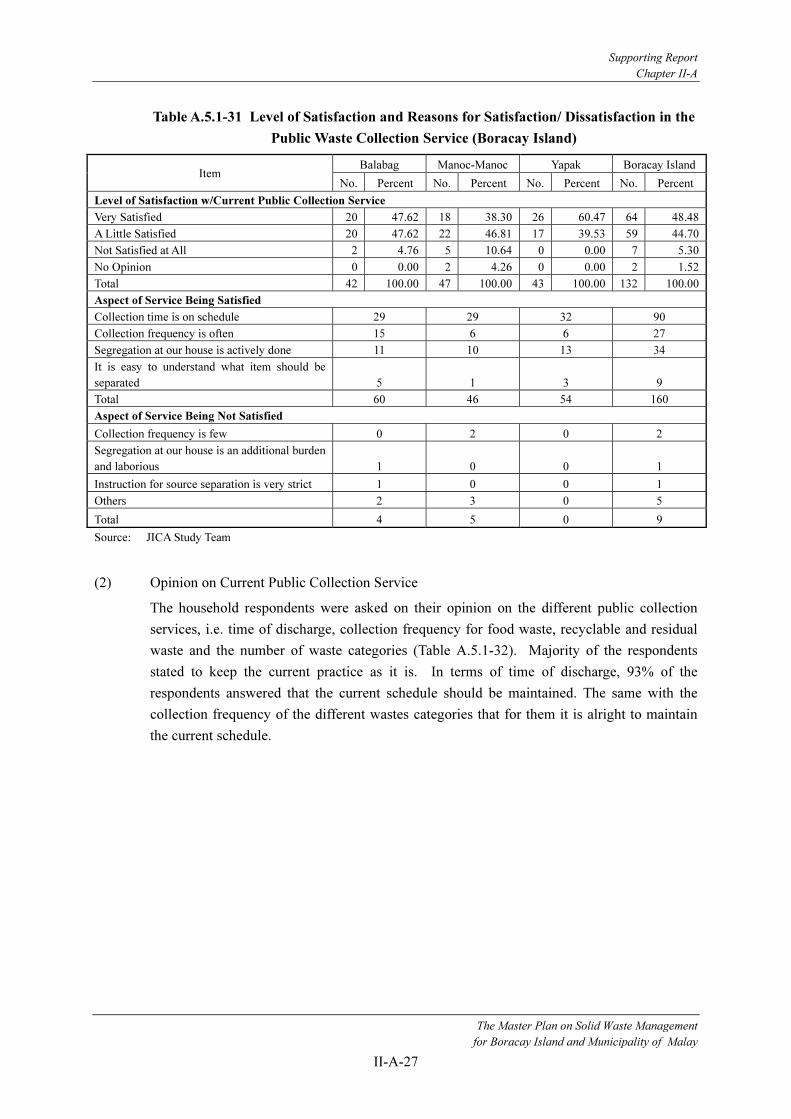
Supporting Report
Chapter II-A
The Master Plan on Solid Waste Management
for Boracay Island and Municipality of Malay
II-A-27
Table A.5.1-31 Level of Satisfaction and Reasons for Satisfaction/ Dissatisfaction in the
Public Waste Collection Service (Boracay Island)
Balabag Manoc-Manoc Yapak Boracay IslandItem
No. Percent No. Percent No. Percent No. Percent
Level of Satisfaction w/Current Public Collection Service
Very Satisfied 20 47.62 18 38.30 26 60.47 64 48.48
A Little Satisfied 20 47.62 22 46.81 17 39.53 59 44.70
Not Satisfied at All 2 4.76 5 10.64 0 0.00 7 5.30
No Opinion 0 0.00 2 4.26 0 0.00 2 1.52
Total 42 100.00 47 100.00 43 100.00 132 100.00
Aspect of Service Being Satisfied
Collection time is on schedule 29 29 32 90
Collection frequency is often 15 6 6 27
Segregation at our house is actively done 11 10 13 34
It is easy to understand what item should be
separated 5 1 3 9
Total 60 46 54 160
Aspect of Service Being Not Satisfied
Collection frequency is few 0 2 0 2
Segregation at our house is an additional burden
and laborious 1 0 0 1
Instruction for source separation is very strict 1 0 0 1
Others 2 3 0 5
Total 4 5 0 9
Source: JICA Study Team
(2) Opinion on Current Public Collection Service
The household respondents were asked on their opinion on the different public collection
services, i.e. time of discharge, collection frequency for food waste, recyclable and residual
waste and the number of waste categories (Table A.5.1-32). Majority of the respondents
stated to keep the current practice as it is. In terms of time of discharge, 93% of the
respondents answered that the current schedule should be maintained. The same with the
collection frequency of the different wastes categories that for them it is alright to maintain
the current schedule.

Supporting Report
Chapter II-A
The Master Plan on Solid Waste Management
for Boracay Island and Municipality of Malay
II-A-28
Table A.5.1-32 Opinion on the Current Public Collection Service
Balabag Manoc-Manoc Yapak Boracay IslandItem
No. Percent No. Percent No. Percent No. Percent
Time of Discharge Waste
Keep it as is 40 95.24 41 87.23 42 97.67 123 93.18
Change schedule to: 1 2.38 3 6.38 1 2.33 5 3.79
5:00 AM 0 1 0 1
6:00 AM 0 1 0 1
7:00 AM 1 0 1 2
9:00 AM 0 1 0 1
Total 41 97.62 44 93.62 43 91.49 128 96.97
Food Waste Collection Frequency
Keep it as is 41 97.62 44 93.62 43 100.00 128 96.97
Increase Collection 0 0.00 0 0.00 0 0.00 0 0.00
Reduce Collection 0 0.00 0 0.00 0 0.00 0 0.00
Total 41 97.62 44 93.62 43 91.49 128 96.97
Recyclables Collection Frequency
Keep it as is 41 97.62 44 93.62 42 97.67 127 96.21
Increase Collection 0 0.00 0 0.00 0 0.00 0 0.00
Reduce Collection to 1X 0 0.00 0 0.00 1 2.33 1 0.76
Total 41 97.62 44 93.62 43 91.49 128 96.97
Residual Waste Collection Frequency
Keep it as is 40 95.24 39 82.98 38 88.37 117 88.64
Increase Collection 1 2.38 5 10.64 4 9.30 10 7.58
Reduce Collection 0 0.00 0.00 1 2.33 1 0.76
Total 41 97.62 44 93.62 43 91.49 128 96.97
Number of Source Separation Categories
Keep it as is 40 95.24 44 93.62 43 100.00 127 96.21
Reduce to 2 Categories 1 2.38 0 0.00 0 0.00 1 0.76
Increase Categories 0 0.00 0 0.00 0 0.00 0 0.00
Total 41 97.62 44 93.62 43 91.49 128 96.97
Source: JICA Study Team
5.1.6 Willingness to Pay for Waste Collection
One of the purposes of this public awareness survey is to determine the willingness to pay
for waste collection. All of the household respondents were asked on whether they will be
willing to pay a monthly collection fee for the segregated waste to facilitate the proper
implementation of the SWM program in their respective barangays.
(1) Willingness to Pay.
Only 34% (55 respondents) are willing to have a monthly garbage collection fee in the MOM
(Table A.5.1-332). From the 132 respondents on Boracay Island, households in Barangay
Yapak are the most willing to participate in the collection fee (39%). Only a total of 43
respondents (33%) on Boracay and 12 respondents on the Mainland of Malay are willing to
adopt a garbage collection fee. Among those who were willing to pay a garbage collection
fee, 42% of the respondents suggested a fee of PhP50.00 per month. This coincides with the
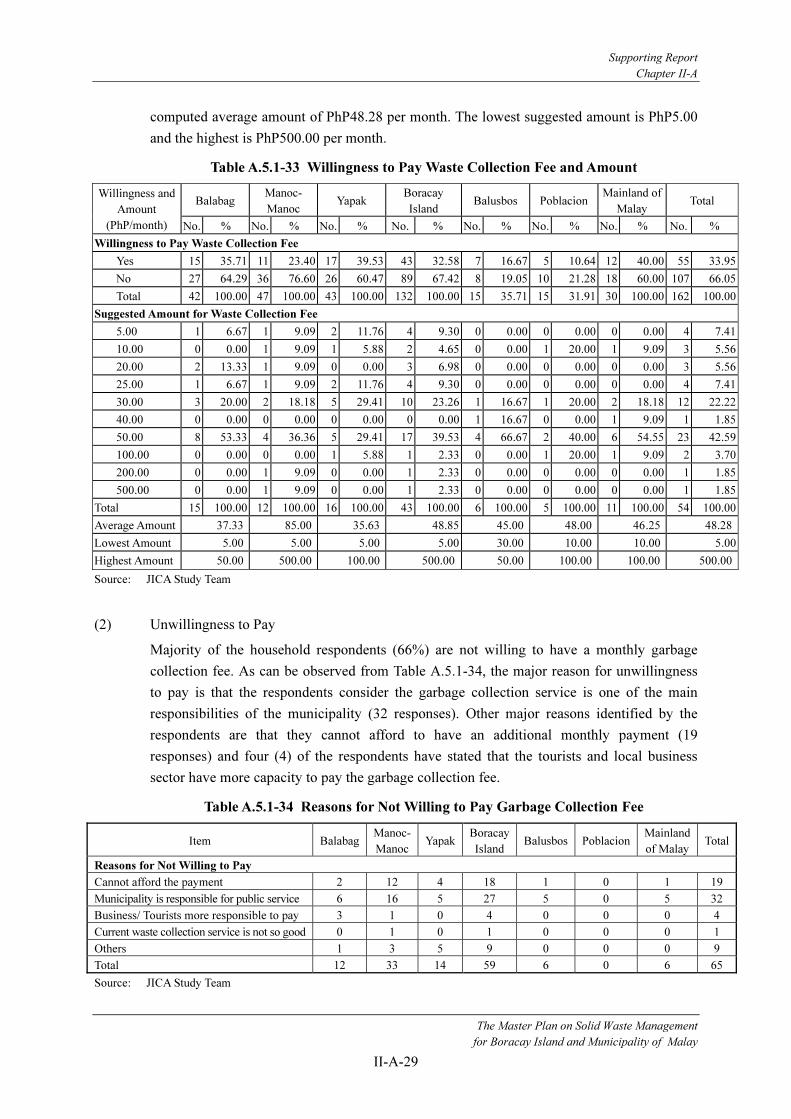
Supporting Report
Chapter II-A
The Master Plan on Solid Waste Management
for Boracay Island and Municipality of Malay
II-A-29
computed average amount of PhP48.28 per month. The lowest suggested amount is PhP5.00
and the highest is PhP500.00 per month.
Table A.5.1-33 Willingness to Pay Waste Collection Fee and Amount
Balabag Manoc-
Manoc Yapak
Boracay
Island Balusbos Poblacion
Mainland of
Malay Total
Willingness and
Amount
(PhP/month) No. % No. % No. % No. % No. % No. % No. % No. %
Willingness to Pay Waste Collection Fee
Yes 15 35.71 11 23.40 17 39.53 43 32.58 7 16.67 5 10.64 12 40.00 55 33.95
No 27 64.29 36 76.60 26 60.47 89 67.42 8 19.05 10 21.28 18 60.00 107 66.05
Total 42 100.00 47 100.00 43 100.00 132 100.00 15 35.71 15 31.91 30 100.00 162 100.00
Suggested Amount for Waste Collection Fee
5.00 1 6.67 1 9.09 2 11.76 4 9.30 0 0.00 0 0.00 0 0.00 4 7.41
10.00 0 0.00 1 9.09 1 5.88 2 4.65 0 0.00 1 20.00 1 9.09 3 5.56
20.00 2 13.33 1 9.09 0 0.00 3 6.98 0 0.00 0 0.00 0 0.00 3 5.56
25.00 1 6.67 1 9.09 2 11.76 4 9.30 0 0.00 0 0.00 0 0.00 4 7.41
30.00 3 20.00 2 18.18 5 29.41 10 23.26 1 16.67 1 20.00 2 18.18 12 22.22
40.00 0 0.00 0 0.00 0 0.00 0 0.00 1 16.67 0 0.00 1 9.09 1 1.85
50.00 8 53.33 4 36.36 5 29.41 17 39.53 4 66.67 2 40.00 6 54.55 23 42.59
100.00 0 0.00 0 0.00 1 5.88 1 2.33 0 0.00 1 20.00 1 9.09 2 3.70
200.00 0 0.00 1 9.09 0 0.00 1 2.33 0 0.00 0 0.00 0 0.00 1 1.85
500.00 0 0.00 1 9.09 0 0.00 1 2.33 0 0.00 0 0.00 0 0.00 1 1.85
Total 15 100.00 12 100.00 16 100.00 43 100.00 6 100.00 5 100.00 11 100.00 54 100.00
Average Amount 37.33 85.00 35.63 48.85 45.00 48.00 46.25 48.28
Lowest Amount 5.00 5.00 5.00 5.00 30.00 10.00 10.00 5.00
Highest Amount 50.00 500.00 100.00 500.00 50.00 100.00 100.00 500.00
Source: JICA Study Team
(2) Unwillingness to Pay
Majority of the household respondents (66%) are not willing to have a monthly garbage
collection fee. As can be observed from Table A.5.1-34, the major reason for unwillingness
to pay is that the respondents consider the garbage collection service is one of the main
responsibilities of the municipality (32 responses). Other major reasons identified by the
respondents are that they cannot afford to have an additional monthly payment (19
responses) and four (4) of the respondents have stated that the tourists and local business
sector have more capacity to pay the garbage collection fee.
Table A.5.1-34 Reasons for Not Willing to Pay Garbage Collection Fee
Item BalabagManoc-
ManocYapak
Boracay
Island Balusbos Poblacion
Mainland
of MalayTotal
Reasons for Not Willing to Pay
Cannot afford the payment 2 12 4 18 1 0 1 19
Municipality is responsible for public service 6 16 5 27 5 0 5 32
Business/ Tourists more responsible to pay 3 1 0 4 0 0 0 4
Current waste collection service is not so good 0 1 0 1 0 0 0 1
Others 1 3 5 9 0 0 0 9
Total 12 33 14 59 6 0 6 65
Source: JICA Study Team
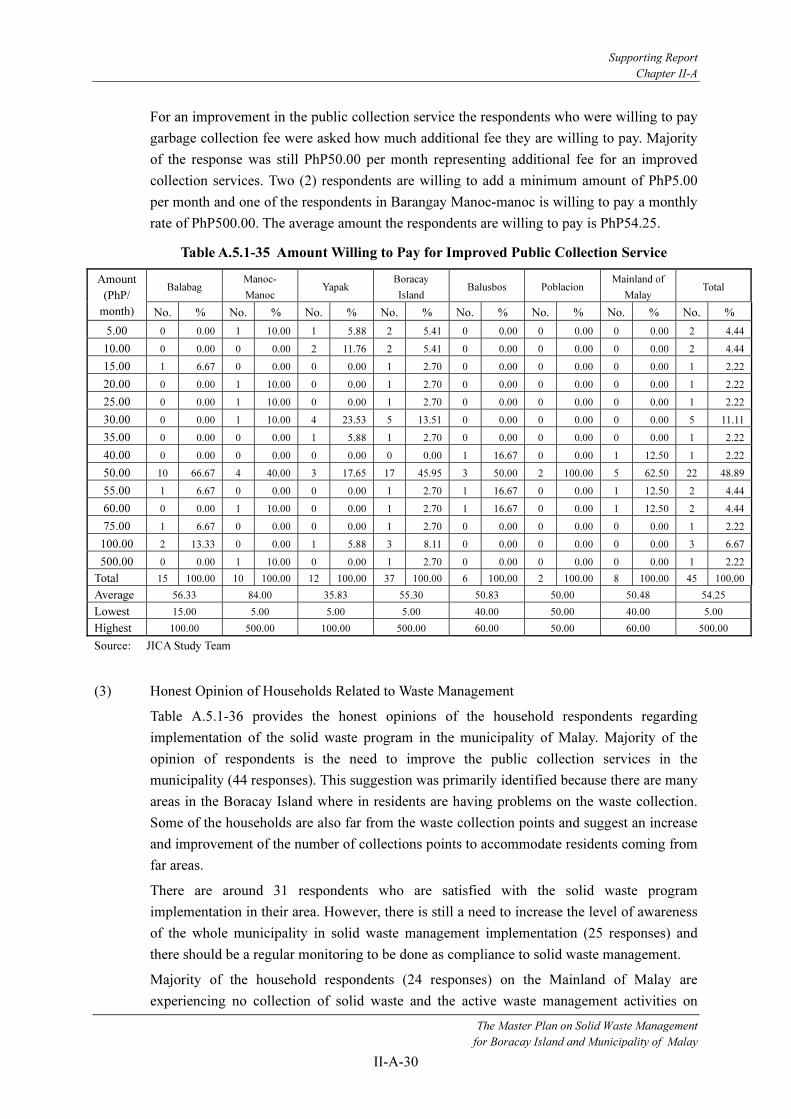
Supporting Report
Chapter II-A
The Master Plan on Solid Waste Management
for Boracay Island and Municipality of Malay
II-A-30
For an improvement in the public collection service the respondents who were willing to pay
garbage collection fee were asked how much additional fee they are willing to pay. Majority
of the response was still PhP50.00 per month representing additional fee for an improved
collection services. Two (2) respondents are willing to add a minimum amount of PhP5.00
per month and one of the respondents in Barangay Manoc-manoc is willing to pay a monthly
rate of PhP500.00. The average amount the respondents are willing to pay is PhP54.25.
Table A.5.1-35 Amount Willing to Pay for Improved Public Collection Service
Balabag Manoc-
Manoc Yapak
Boracay
Island Balusbos Poblacion
Mainland of
Malay Total
Amount
(PhP/
month) No. % No. % No. % No. % No. % No. % No. % No. %
5.00 0 0.00 1 10.00 1 5.88 2 5.41 0 0.00 0 0.00 0 0.00 2 4.44
10.00 0 0.00 0 0.00 2 11.76 2 5.41 0 0.00 0 0.00 0 0.00 2 4.44
15.00 1 6.67 0 0.00 0 0.00 1 2.70 0 0.00 0 0.00 0 0.00 1 2.22
20.00 0 0.00 1 10.00 0 0.00 1 2.70 0 0.00 0 0.00 0 0.00 1 2.22
25.00 0 0.00 1 10.00 0 0.00 1 2.70 0 0.00 0 0.00 0 0.00 1 2.22
30.00 0 0.00 1 10.00 4 23.53 5 13.51 0 0.00 0 0.00 0 0.00 5 11.11
35.00 0 0.00 0 0.00 1 5.88 1 2.70 0 0.00 0 0.00 0 0.00 1 2.22
40.00 0 0.00 0 0.00 0 0.00 0 0.00 1 16.67 0 0.00 1 12.50 1 2.22
50.00 10 66.67 4 40.00 3 17.65 17 45.95 3 50.00 2 100.00 5 62.50 22 48.89
55.00 1 6.67 0 0.00 0 0.00 1 2.70 1 16.67 0 0.00 1 12.50 2 4.44
60.00 0 0.00 1 10.00 0 0.00 1 2.70 1 16.67 0 0.00 1 12.50 2 4.44
75.00 1 6.67 0 0.00 0 0.00 1 2.70 0 0.00 0 0.00 0 0.00 1 2.22
100.00 2 13.33 0 0.00 1 5.88 3 8.11 0 0.00 0 0.00 0 0.00 3 6.67
500.00 0 0.00 1 10.00 0 0.00 1 2.70 0 0.00 0 0.00 0 0.00 1 2.22
Total 15 100.00 10 100.00 12 100.00 37 100.00 6 100.00 2 100.00 8 100.00 45 100.00
Average 56.33 84.00 35.83 55.30 50.83 50.00 50.48 54.25
Lowest 15.00 5.00 5.00 5.00 40.00 50.00 40.00 5.00
Highest 100.00 500.00 100.00 500.00 60.00 50.00 60.00 500.00
Source: JICA Study Team
(3) Honest Opinion of Households Related to Waste Management
Table A.5.1-36 provides the honest opinions of the household respondents regarding
implementation of the solid waste program in the municipality of Malay. Majority of the
opinion of respondents is the need to improve the public collection services in the
municipality (44 responses). This suggestion was primarily identified because there are many
areas in the Boracay Island where in residents are having problems on the waste collection.
Some of the households are also far from the waste collection points and suggest an increase
and improvement of the number of collections points to accommodate residents coming from
far areas.
There are around 31 respondents who are satisfied with the solid waste program
implementation in their area. However, there is still a need to increase the level of awareness
of the whole municipality in solid waste management implementation (25 responses) and
there should be a regular monitoring to be done as compliance to solid waste management.
Majority of the household respondents (24 responses) on the Mainland of Malay are
experiencing no collection of solid waste and the active waste management activities on

Supporting Report
Chapter II-A
The Master Plan on Solid Waste Management
for Boracay Island and Municipality of Malay
II-A-31
Boracay Island are hardly felt on the Mainland of Malay. The local government should look
and consider this problem in the improvement of the solid waste management program on
the Mainland of Malay.
Table A.5.1-36 Honest Opinion Regarding Solid Waste Management Implementation
on the Mainland of Malay
Honest Opinion on Solid Waste Managment Freq.
Increase/Improve trash bins around the island 2
Increase awareness on SWM 25
Regular clean-up at the beach 3
Regular monitoring for compliance on SWM 18
I see no problems/SWM is properly implemented 31
Observe proper disposal of solid wastes 5
Hire people to maintain cleanliness at the island 1
All should participate in clean-up activities 2
Environment should be protected as a whole 6
Business establishment should also be responsible in maintaining cleanliness 2
There is no waste collection here in the area/barangay 24
Increase in the number and frequency of collection 13
Improve collection services 44
Improve and developed the MRF in the barangay 4
It is the responsibility of the municipal office to collect waste 5
No idea 20
Total 205
Source: JICA Study Team
5.2 Business Establishment Survey
5.2.1 General Information
(1) Selection of Targeted Establishments
Based on the list of registered business establishments, as provided by the Malay Municipal
office, the survey was able to identify the different business types as main respondents during
the survey. Table A.5.2-1 presents the different business types covered during the business
establishment survey and the number of establishments covered per type and proportion to
the overall surveyed sample. Majority of the respondents were Boracay Muslim Vendors
(13%) and hotels/resorts and cottages with 12 establishments covered (12%). A number of
other type of business were also surveyed, i.e. gasoline station, wholesalers, plastic ware
vendors, appliance store, etc. The total of 101 business establishments was covered during
the survey where 80 businesses are on Boracay Island and 21 on Mainland of Malay.
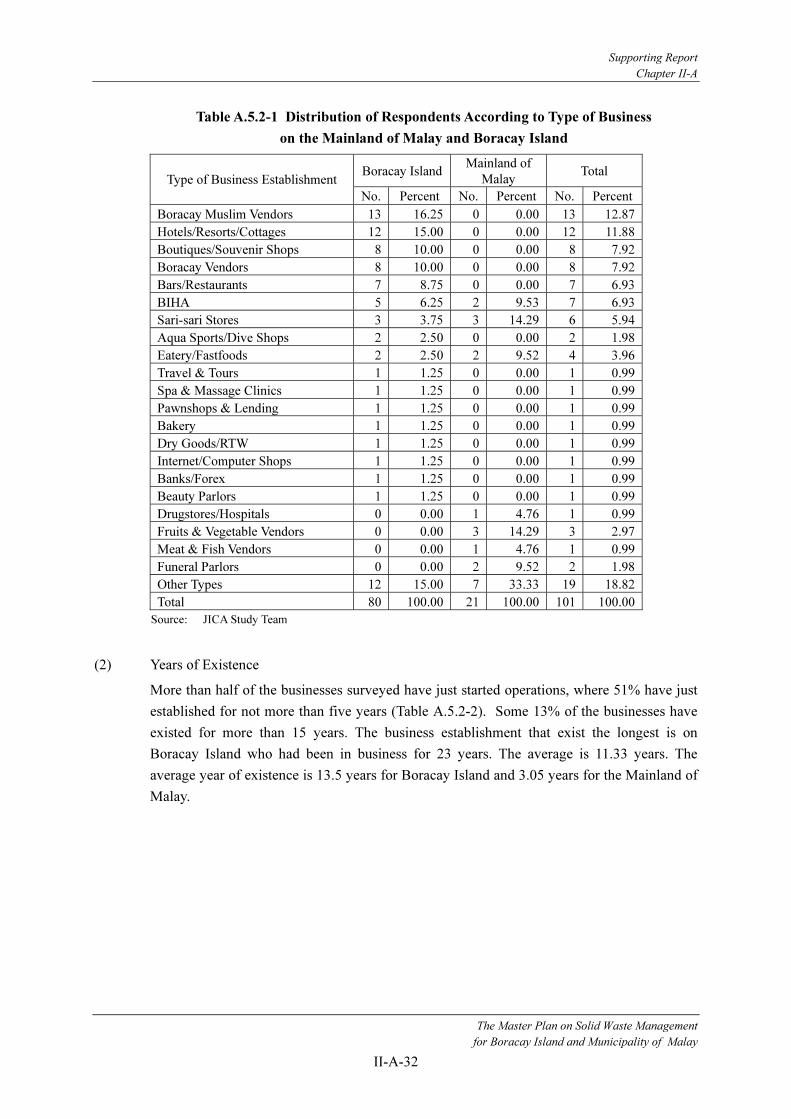
Supporting Report
Chapter II-A
The Master Plan on Solid Waste Management
for Boracay Island and Municipality of Malay
II-A-32
Table A.5.2-1 Distribution of Respondents According to Type of Business
on the Mainland of Malay and Boracay Island
Boracay IslandMainland of
Malay Total
Type of Business Establishment
No. Percent No. Percent No. Percent
Boracay Muslim Vendors 13 16.25 0 0.00 13 12.87
Hotels/Resorts/Cottages 12 15.00 0 0.00 12 11.88
Boutiques/Souvenir Shops 8 10.00 0 0.00 8 7.92
Boracay Vendors 8 10.00 0 0.00 8 7.92
Bars/Restaurants 7 8.75 0 0.00 7 6.93
BIHA 5 6.25 2 9.53 7 6.93
Sari-sari Stores 3 3.75 3 14.29 6 5.94
Aqua Sports/Dive Shops 2 2.50 0 0.00 2 1.98
Eatery/Fastfoods 2 2.50 2 9.52 4 3.96
Travel & Tours 1 1.25 0 0.00 1 0.99
Spa & Massage Clinics 1 1.25 0 0.00 1 0.99
Pawnshops & Lending 1 1.25 0 0.00 1 0.99
Bakery 1 1.25 0 0.00 1 0.99
Dry Goods/RTW 1 1.25 0 0.00 1 0.99
Internet/Computer Shops 1 1.25 0 0.00 1 0.99
Banks/Forex 1 1.25 0 0.00 1 0.99
Beauty Parlors 1 1.25 0 0.00 1 0.99
Drugstores/Hospitals 0 0.00 1 4.76 1 0.99
Fruits & Vegetable Vendors 0 0.00 3 14.29 3 2.97
Meat & Fish Vendors 0 0.00 1 4.76 1 0.99
Funeral Parlors 0 0.00 2 9.52 2 1.98
Other Types 12 15.00 7 33.33 19 18.82
Total 80 100.00 21 100.00 101 100.00
Source: JICA Study Team
(2) Years of Existence
More than half of the businesses surveyed have just started operations, where 51% have just
established for not more than five years (Table A.5.2-2). Some 13% of the businesses have
existed for more than 15 years. The business establishment that exist the longest is on
Boracay Island who had been in business for 23 years. The average is 11.33 years. The
average year of existence is 13.5 years for Boracay Island and 3.05 years for the Mainland of
Malay.

Supporting Report
Chapter II-A
The Master Plan on Solid Waste Management
for Boracay Island and Municipality of Malay
II-A-33
Table A.5.2-2 Years of Existence of Business Establishments
Boracay Island Mainland of Malay Total Years in Existence
No. Percent No. Percent No. Percent
0 to 5 years 46 57.5 6 28.57 52 51.49
5 to 10 years 13 16.25 6 28.57 19 18.81
11 to 15 years 11 13.75 4 19.05 15 14.85
More than 15 years 9 11.25 4 19.05 13 12.87
Cannot recall 1 1.25 1 4.76 2 1.98
Total 80 100.00 21 100.00 101 100.00
Most Recent 2007 2007 2007
Oldest Buss. Establishment 1984 1997 1984
Ave. Years of Existence 13.5 3.05 11.33
Source: JICA Study Team
Presented in Table A.5.2-3 is the number of employees of the business establishments
covered during the survey. Since majority of the business respondents are cottage- to small-
scale businesses the number of people that work for them are few (49%) having less than
five employees. The average number of employees for business establishment on Boracay
Island is 6.93 and on the Mainland of Malay are 3.14.
Table A.5.2-3 Number of Employees
Boracay Island Mainland Malay Total Number
No. Percent No. Percent No. Percent
1 to 5 31 38.75 19 90.48 50 49.50
5 to 10 12 15.00 2 9.52 14 13.86
11 to 15 25 31.25 0 0.00 25 24.75
16 to 20 6 7.50 0 0.00 6 5.94
21 to 50 1 1.25 0 0.00 1 0.99
More than 50 5 6.25 0 0.00 5 4.95
Total 80 100.00 21 100.00 101 100.00
Least Number of Employees 1 1 1
Most Number of Employees 77 9 77
Average Number of Employees 6.93 3.14 6.14
Source: JICA Study Team
(2) Floor Area of Business Establishment
Around 63 businesses (62%) had a floor area of more than 25m2. The biggest floor area is
on Boracay Island with 2,000m2. The average floor area of businesses on Boracay Island is
312 m2 and it is 207 m
2 on the Mainland of Malay (Table A.5.2-4).
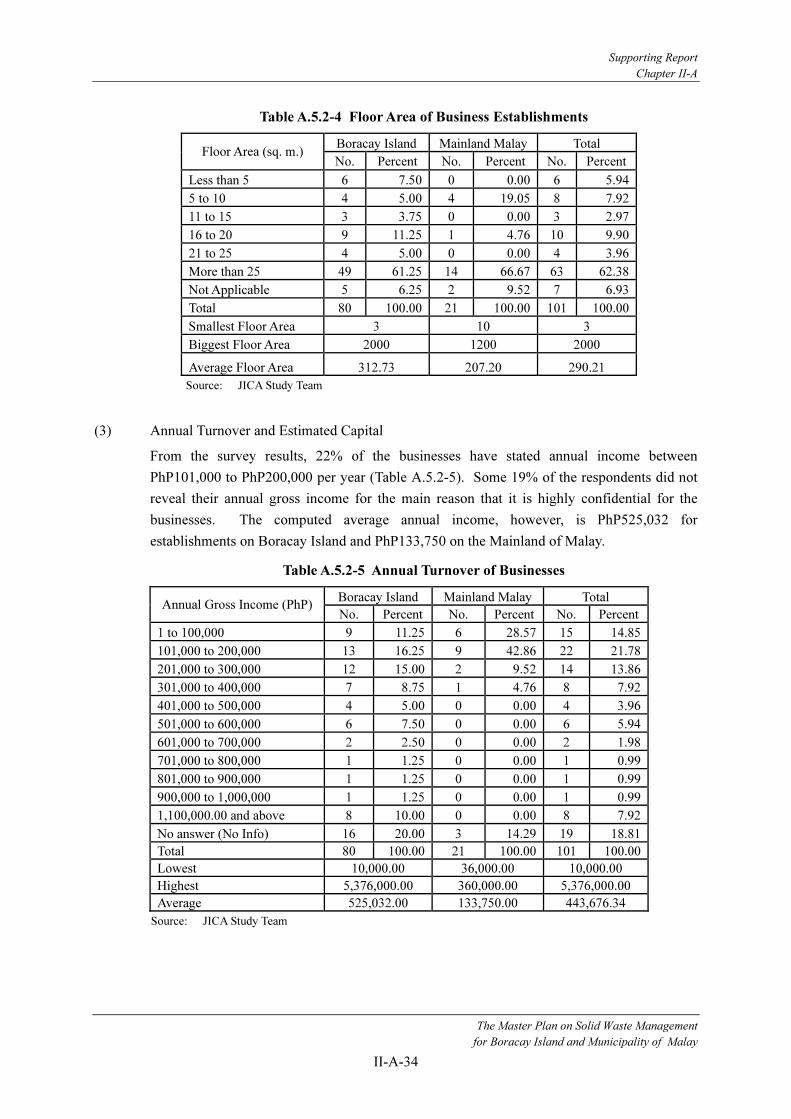
Supporting Report
Chapter II-A
The Master Plan on Solid Waste Management
for Boracay Island and Municipality of Malay
II-A-34
Table A.5.2-4 Floor Area of Business Establishments
Boracay Island Mainland Malay Total Floor Area (sq. m.)
No. Percent No. Percent No. Percent
Less than 5 6 7.50 0 0.00 6 5.94
5 to 10 4 5.00 4 19.05 8 7.92
11 to 15 3 3.75 0 0.00 3 2.97
16 to 20 9 11.25 1 4.76 10 9.90
21 to 25 4 5.00 0 0.00 4 3.96
More than 25 49 61.25 14 66.67 63 62.38
Not Applicable 5 6.25 2 9.52 7 6.93
Total 80 100.00 21 100.00 101 100.00
Smallest Floor Area 3 10 3
Biggest Floor Area 2000 1200 2000
Average Floor Area 312.73 207.20 290.21
Source: JICA Study Team
(3) Annual Turnover and Estimated Capital
From the survey results, 22% of the businesses have stated annual income between
PhP101,000 to PhP200,000 per year (Table A.5.2-5). Some 19% of the respondents did not
reveal their annual gross income for the main reason that it is highly confidential for the
businesses. The computed average annual income, however, is PhP525,032 for
establishments on Boracay Island and PhP133,750 on the Mainland of Malay.
Table A.5.2-5 Annual Turnover of Businesses
Boracay Island Mainland Malay Total Annual Gross Income (PhP)
No. Percent No. Percent No. Percent
1 to 100,000 9 11.25 6 28.57 15 14.85
101,000 to 200,000 13 16.25 9 42.86 22 21.78
201,000 to 300,000 12 15.00 2 9.52 14 13.86
301,000 to 400,000 7 8.75 1 4.76 8 7.92
401,000 to 500,000 4 5.00 0 0.00 4 3.96
501,000 to 600,000 6 7.50 0 0.00 6 5.94
601,000 to 700,000 2 2.50 0 0.00 2 1.98
701,000 to 800,000 1 1.25 0 0.00 1 0.99
801,000 to 900,000 1 1.25 0 0.00 1 0.99
900,000 to 1,000,000 1 1.25 0 0.00 1 0.99
1,100,000.00 and above 8 10.00 0 0.00 8 7.92
No answer (No Info) 16 20.00 3 14.29 19 18.81
Total 80 100.00 21 100.00 101 100.00
Lowest 10,000.00 36,000.00 10,000.00
Highest 5,376,000.00 360,000.00 5,376,000.00
Average 525,032.00 133,750.00 443,676.34
Source: JICA Study Team
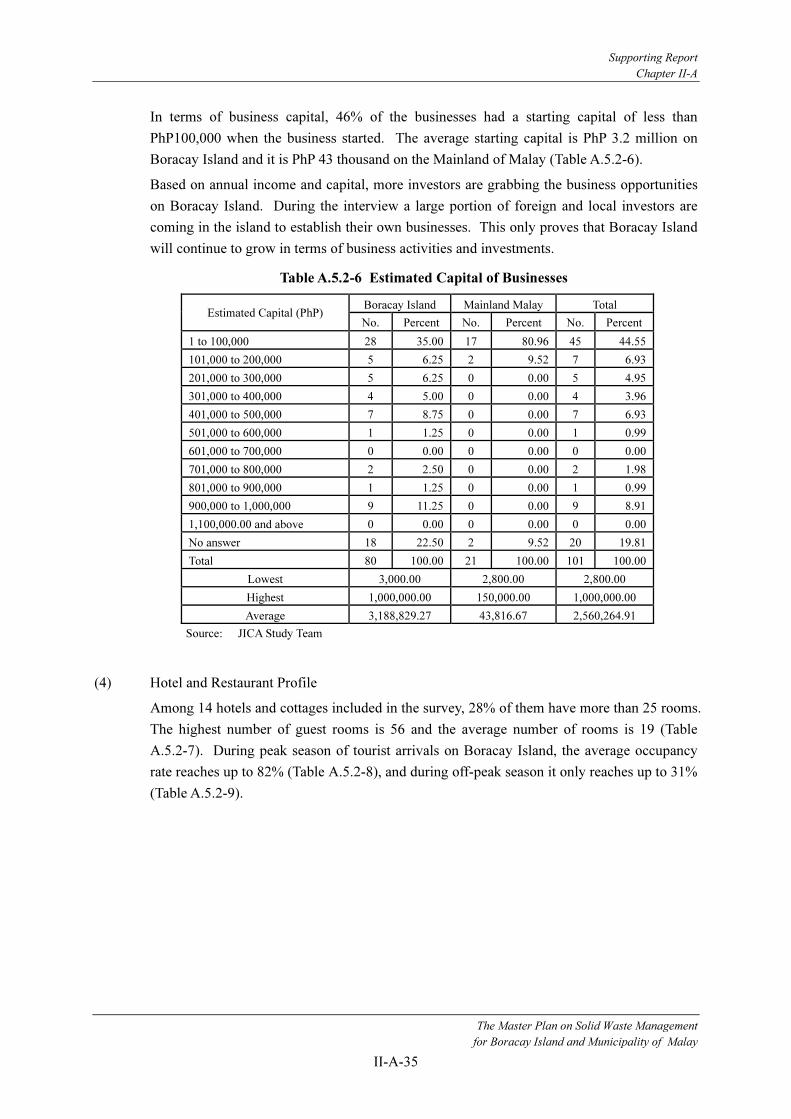
Supporting Report
Chapter II-A
The Master Plan on Solid Waste Management
for Boracay Island and Municipality of Malay
II-A-35
In terms of business capital, 46% of the businesses had a starting capital of less than
PhP100,000 when the business started. The average starting capital is PhP 3.2 million on
Boracay Island and it is PhP 43 thousand on the Mainland of Malay (Table A.5.2-6).
Based on annual income and capital, more investors are grabbing the business opportunities
on Boracay Island. During the interview a large portion of foreign and local investors are
coming in the island to establish their own businesses. This only proves that Boracay Island
will continue to grow in terms of business activities and investments.
Table A.5.2-6 Estimated Capital of Businesses
Boracay Island Mainland Malay Total Estimated Capital (PhP)
No. Percent No. Percent No. Percent
1 to 100,000 28 35.00 17 80.96 45 44.55
101,000 to 200,000 5 6.25 2 9.52 7 6.93
201,000 to 300,000 5 6.25 0 0.00 5 4.95
301,000 to 400,000 4 5.00 0 0.00 4 3.96
401,000 to 500,000 7 8.75 0 0.00 7 6.93
501,000 to 600,000 1 1.25 0 0.00 1 0.99
601,000 to 700,000 0 0.00 0 0.00 0 0.00
701,000 to 800,000 2 2.50 0 0.00 2 1.98
801,000 to 900,000 1 1.25 0 0.00 1 0.99
900,000 to 1,000,000 9 11.25 0 0.00 9 8.91
1,100,000.00 and above 0 0.00 0 0.00 0 0.00
No answer 18 22.50 2 9.52 20 19.81
Total 80 100.00 21 100.00 101 100.00
Lowest 3,000.00 2,800.00 2,800.00
Highest 1,000,000.00 150,000.00 1,000,000.00
Average 3,188,829.27 43,816.67 2,560,264.91
Source: JICA Study Team
(4) Hotel and Restaurant Profile
Among 14 hotels and cottages included in the survey, 28% of them have more than 25 rooms.
The highest number of guest rooms is 56 and the average number of rooms is 19 (Table
A.5.2-7). During peak season of tourist arrivals on Boracay Island, the average occupancy
rate reaches up to 82% (Table A.5.2-8), and during off-peak season it only reaches up to 31%
(Table A.5.2-9).
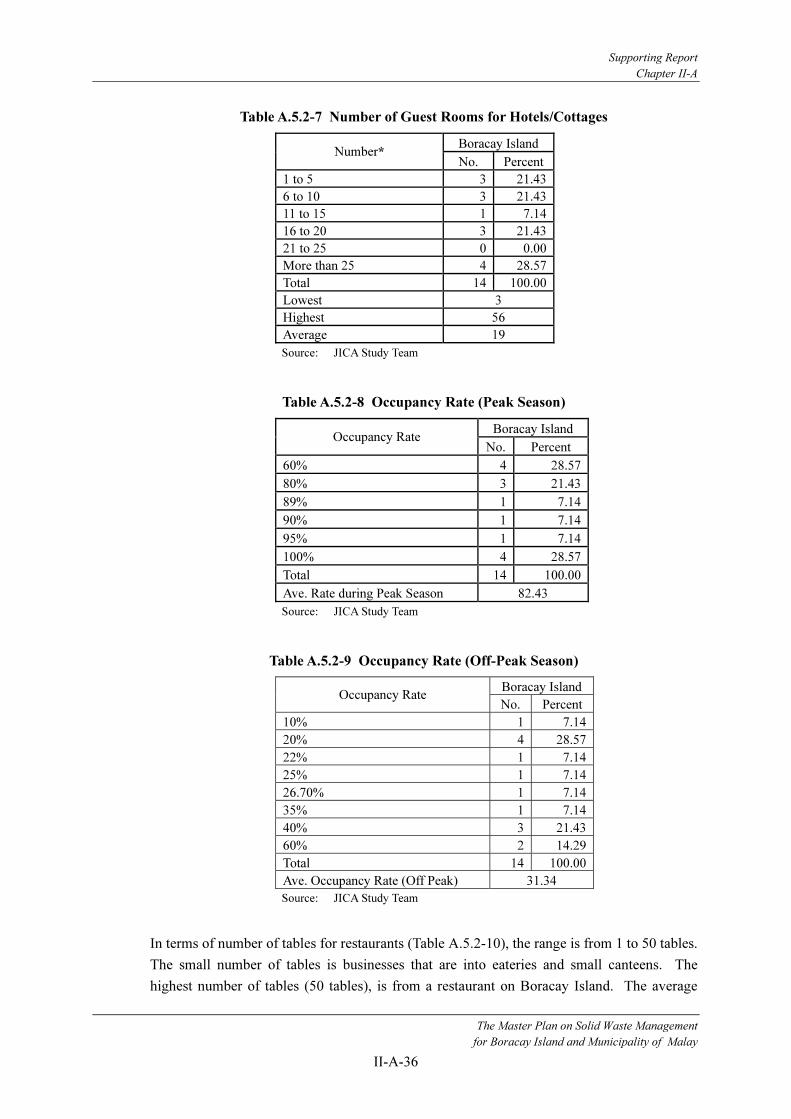
Supporting Report
Chapter II-A
The Master Plan on Solid Waste Management
for Boracay Island and Municipality of Malay
II-A-36
Table A.5.2-7 Number of Guest Rooms for Hotels/Cottages
Boracay Island Number*
No. Percent
1 to 5 3 21.43
6 to 10 3 21.43
11 to 15 1 7.14
16 to 20 3 21.43
21 to 25 0 0.00
More than 25 4 28.57
Total 14 100.00
Lowest 3
Highest 56
Average 19
Source: JICA Study Team
Table A.5.2-8 Occupancy Rate (Peak Season)
Boracay Island Occupancy Rate
No. Percent
60% 4 28.57
80% 3 21.43
89% 1 7.14
90% 1 7.14
95% 1 7.14
100% 4 28.57
Total 14 100.00
Ave. Rate during Peak Season 82.43
Source: JICA Study Team
Table A.5.2-9 Occupancy Rate (Off-Peak Season)
Boracay Island Occupancy Rate
No. Percent
10% 1 7.14
20% 4 28.57
22% 1 7.14
25% 1 7.14
26.70% 1 7.14
35% 1 7.14
40% 3 21.43
60% 2 14.29
Total 14 100.00
Ave. Occupancy Rate (Off Peak) 31.34
Source: JICA Study Team
In terms of number of tables for restaurants (Table A.5.2-10), the range is from 1 to 50 tables.
The small number of tables is businesses that are into eateries and small canteens. The
highest number of tables (50 tables), is from a restaurant on Boracay Island. The average

Supporting Report
Chapter II-A
The Master Plan on Solid Waste Management
for Boracay Island and Municipality of Malay
II-A-37
number of tables in a restaurant on Boracay Island is 14 and on the Mainland of Malay is
only four.
Table A.5.2-10 Number of Tables of Hotels and Restaurants
Boracay Island Mainland Malay Total Number of
Tables No. Percent No. Percent No. Percent
1 0 0.00 1 33.33 1 5.88
4 2 14.29 0 0.00 2 11.76
5 1 7.14 1 33.33 2 11.76
6 1 7.14 0 0.00 1 5.88
7 0 0.00 1 33.33 1 5.88
8 2 14.29 0 0.00 2 11.76
10 2 14.29 0 0.00 2 11.76
15 1 7.14 0 0.00 1 5.88
16 1 7.14 0 0.00 1 5.88
20 2 14.29 0 0.00 2 11.76
22 1 7.14 0 0.00 1 5.88
50 1 7.14 0 0.00 1 5.88
Total 14 100.00 3 100.00 17 100.00
Lowest 1 1 1
Highest 50 7 50
Average 14.14 4.33 12.41
Source: JICA Study Team
(5) Respondent Information
The position of the respondents that were interviewed is shown in Table A.5.2-11. Majority
of the respondents (60%) were the owners of the business establishments both on Boracay
Island and on the Mainland of Malay. In addition, there were also several business managers
(20%) that were interviewed and the rest of the respondents were office and section
managers and other permanent staff of the business. A total of 60 respondents were female
(59%) and the remaining 41 respondents were male (Table A.5.2-12). In addition, Table
A.5.2-13 shows the distribution of the respondents’ age, where majority of are within the
range of 20-39 years old (49%) and 40-59 years old (43%) which falls under the productive
working years of an employee.
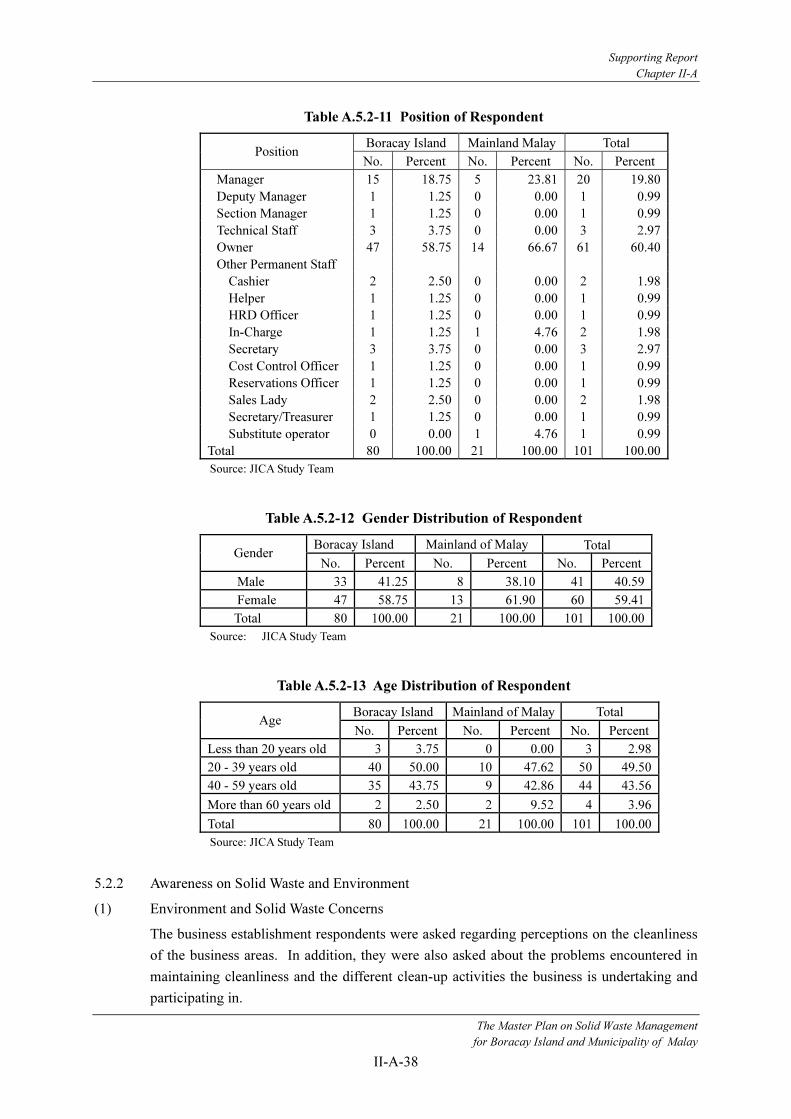
Supporting Report
Chapter II-A
The Master Plan on Solid Waste Management
for Boracay Island and Municipality of Malay
II-A-38
Table A.5.2-11 Position of Respondent
Boracay Island Mainland Malay Total Position
No. Percent No. Percent No. Percent
Manager 15 18.75 5 23.81 20 19.80
Deputy Manager 1 1.25 0 0.00 1 0.99
Section Manager 1 1.25 0 0.00 1 0.99
Technical Staff 3 3.75 0 0.00 3 2.97
Owner 47 58.75 14 66.67 61 60.40
Other Permanent Staff
Cashier 2 2.50 0 0.00 2 1.98
Helper 1 1.25 0 0.00 1 0.99
HRD Officer 1 1.25 0 0.00 1 0.99
In-Charge 1 1.25 1 4.76 2 1.98
Secretary 3 3.75 0 0.00 3 2.97
Cost Control Officer 1 1.25 0 0.00 1 0.99
Reservations Officer 1 1.25 0 0.00 1 0.99
Sales Lady 2 2.50 0 0.00 2 1.98
Secretary/Treasurer 1 1.25 0 0.00 1 0.99
Substitute operator 0 0.00 1 4.76 1 0.99
Total 80 100.00 21 100.00 101 100.00
Source: JICA Study Team
Table A.5.2-12 Gender Distribution of Respondent
Boracay Island Mainland of Malay Total Gender
No. Percent No. Percent No. Percent
Male 33 41.25 8 38.10 41 40.59
Female 47 58.75 13 61.90 60 59.41
Total 80 100.00 21 100.00 101 100.00
Source: JICA Study Team
Table A.5.2-13 Age Distribution of Respondent
Boracay Island Mainland of Malay Total Age
No. Percent No. Percent No. Percent
Less than 20 years old 3 3.75 0 0.00 3 2.98
20 - 39 years old 40 50.00 10 47.62 50 49.50
40 - 59 years old 35 43.75 9 42.86 44 43.56
More than 60 years old 2 2.50 2 9.52 4 3.96
Total 80 100.00 21 100.00 101 100.00
Source: JICA Study Team
5.2.2 Awareness on Solid Waste and Environment
(1) Environment and Solid Waste Concerns
The business establishment respondents were asked regarding perceptions on the cleanliness
of the business areas. In addition, they were also asked about the problems encountered in
maintaining cleanliness and the different clean-up activities the business is undertaking and
participating in.

Supporting Report
Chapter II-A
The Master Plan on Solid Waste Management
for Boracay Island and Municipality of Malay
II-A-39
(2) Perception on Cleanliness
The perception on the cleanliness of the business establishment and surroundings are shown
in Table A.5.2-14. Majority (47%) were proud of the cleanliness of the business
establishment especially businesses on Boracay Island. On the other hand, 13 business
establishments on the Mainland of Malay perceived the establishments/surroundings are
clean enough. A total of 17 business establishments perceived that the business
establishment/ surroundings are not so clean (18%).
Table A.5.2-14 Level of Awareness on Cleanliness
Boracay
Island
Mainland
Malay Total
Perception of Cleanliness
No. Percent No. Percent No. Percent
I don't think that it is so clean. 12 15.00 6 28.57 18 17.82
I think that it is clean but not enough to be proud of 22 27.50 13 61.90 35 34.65
I think that it is too clean to be proud of 46 57.50 2 9.53 48 47.53
I have no idea 0 0.00 0 0.00 0 0.00
Total 80 100.00 21 100.00 101 100.00
Source: JICA Study Team
1) Cleaning Activities Participated
In Table A.5.2-15, majority of the business establishments participate and adhere in the
segregation of waste set by the municipality (79 establishments). In addition, there are 46
businesses that clean only around the vicinity of their business. A total of 21 establishments
participate in the clean-up activities on Boracay Island and the Mainland of Malay and 19
businesses train and teach the staff on the proper maintenance of cleanliness on the business
premises.
Table A.5.2-15 Cleaning Activities
Boracay
Island
Mainland
Malay Total
Activities
No. No. No.
Clean around our business establishment only 32 14 46
Segregate solid waste 65 14 79
Participate in voluntary clean-up activities 17 4 21
Train / Teach our staff to maintain cleanliness 17 2 19
Total 131 34 165
Source: JICA Study Team
2) Business Establishments Problems on Cleanliness
As can be observed in Table A.5.2-16, 14 of the establishments were problems on the
indiscriminate throwing of solid waste in their area. In addition, other observed problems
were the scattering of waste in the collection points (11 responses), proliferation of insects
and worms due to waste and foul odor from the surrounding waste treatment facility. It is
however worthy to note that at most only 37 out of 101 establishments were encountering

Supporting Report
Chapter II-A
The Master Plan on Solid Waste Management
for Boracay Island and Municipality of Malay
II-A-40
problems on cleanliness, the rest of the establishments does not experience any problems and
maintain the cleanliness of their business areas.
Table A.5.2-16 Problems Caused by Solid Waste
Boracay
Island
Mainland
Malay Total
Problems
No. No. No.
Indiscriminate throwing of solid waste anywhere 12 2 14
Scattering waste in waste collection points 11 0 11
Foul odor from surrounding waste treatment and disposal facility 4 2 6
Insect, pest, and worms proliferation due to scattering solid waste 3 2 5
Contamination or pollution of water source by leachate from dumping
site or other solid waste treatment facilities 1 0 1
Degradation of landscape due to solid waste treatment and disposal
facility 0 0 0
Total 31 6 37
Source: JICA Study Team
5.2.3 Knowledge Regarding Solid Waste Management and 3R Activities (Reduce, Reuse, Recycle)
Table A.5.2-17 presents the problems mentioned in the current public collection service.
Majority of the business establishments on the Mainland of Malay do not experience any
problem in the public waste collection service (74%), since majority adhere to the municipal
ordinance on solid waste management. Some of business establishments, especially on the
Mainland of Malay are experiencing problems in the public collection service. The problem
informed by the respondents is unstable collection schedule and frequency of collection.
Some of the business establishments have problems on collection because the waste
collection vehicle will not collect wastes that are not segregated which are the usual case that
can be found in public garbage cans. Business establishments do not have time segregating
the garbage cans in the public area located at the front of their businesses.
Table A.5.2-17 Problems regarding the Public Waste Collection Service
Boracay Island Mainland Malay Total Presence of
Problems No. Percent No. Percent No. Percent
Yes 15 18.75 8 38.10 23 22.77
No 62 77.50 13 61.90 75 74.26
No Idea 3 3.75 0 0.00 3 2.97
Total 80 100.00 21 100.00 101 100.00
Source: JICA Study Team
(1) Awareness of the Solid Waste Management Program
Majority of the respondents were highly aware of the policies guiding the implementation of
the solid waste management in the whole municipality. In Table A.5.2-18, it is clear that
business establishments on Boracay are more aware of the different policies on solid waste
management as compared to businesses on the Mainland of Malay. There are three (3)
establishments on the Mainland of Malay who claim that there is no collection in their area.

Supporting Report
Chapter II-A
The Master Plan on Solid Waste Management
for Boracay Island and Municipality of Malay
II-A-41
Table A.5.2-18 Level of Awareness on SWM Policies
Boracay Island Mainland Malay Total Level of Awareness
No. Percent No. Percent No. Percent
Date / Day of SW Collection 77 96.25 12 57.14 89 88.12
Time of Discharging SW 77 96.25 12 57.14 89 88.12
Place of Discharging SW 79 98.75 12 57.14 91 90.10
Classification of Segregation 78 97.50 14 66.67 92 91.09
Others (No collection) 0 0.00 3 14.29 3 2.97
Source: JICA Study Team
(2) Sources of Information on Solid Waste Management
Based on Table A.5.2-19, 71 business establishments mainly rely on government
announcements regarding solid waste management. In addition, 38 respondents receive
information and additional knowledge from radio and 26 establishments from other NGOs
and CBOs. The other sources of information are from neighbors, television and from
newspapers and newsletters.
Table A.5.2-19 Sources of Information on Solid Waste Management
Boracay
Island
Mainland
Malay Total
Sources
No. No. No.
Television 9 0 9
Radio 33 5 38
Newspaper / Magazines 4 0 4
Pamphlets / Posters 11 0 11
Government Announcements 57 14 71
NGOs / CBOs 25 1 26
Neighbors 9 1 10
Total 148 21 169
Source: JICA Study Team
(3) Adherence to SWM Segregation
Table A.5.2-20 presents adherence to SWM policy on waste segregation. Majority of the
business (73%) believes that it is important the segregate food waste and recyclables from
other type of wastes. Food waste must be segregated because it is important that it should be
dispose right away for it is highly biodegradable. In addition recyclables are separated
because it is a source of additional income if they sell all the recyclables to junk shop buyers.
It should be noted that two establishments on the Mainland of Malay are not willing to do
waste segregation mainly because they do not know the waste categories for segregation.
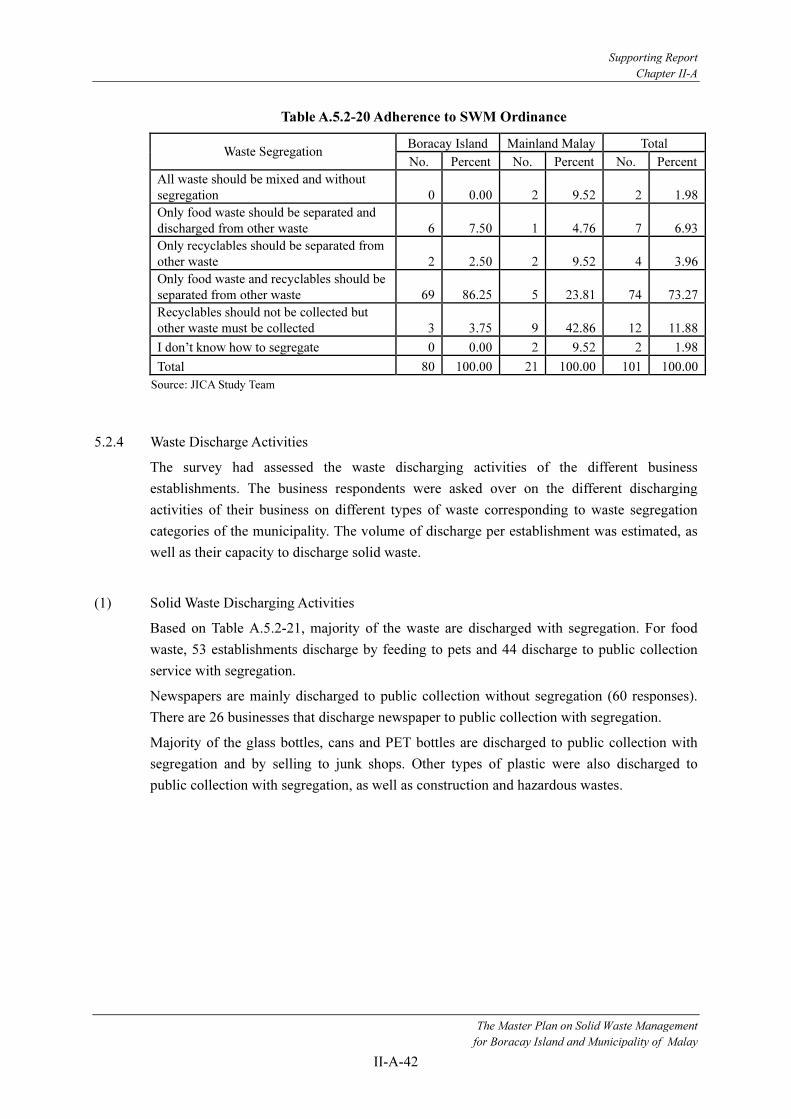
Supporting Report
Chapter II-A
The Master Plan on Solid Waste Management
for Boracay Island and Municipality of Malay
II-A-42
Table A.5.2-20 Adherence to SWM Ordinance
Boracay Island Mainland Malay Total Waste Segregation
No. Percent No. Percent No. Percent
All waste should be mixed and without
segregation 0 0.00 2 9.52 2 1.98
Only food waste should be separated and
discharged from other waste 6 7.50 1 4.76 7 6.93
Only recyclables should be separated from
other waste 2 2.50 2 9.52 4 3.96
Only food waste and recyclables should be
separated from other waste 69 86.25 5 23.81 74 73.27
Recyclables should not be collected but
other waste must be collected 3 3.75 9 42.86 12 11.88
I don’t know how to segregate 0 0.00 2 9.52 2 1.98
Total 80 100.00 21 100.00 101 100.00
Source: JICA Study Team
5.2.4 Waste Discharge Activities
The survey had assessed the waste discharging activities of the different business
establishments. The business respondents were asked over on the different discharging
activities of their business on different types of waste corresponding to waste segregation
categories of the municipality. The volume of discharge per establishment was estimated, as
well as their capacity to discharge solid waste.
(1) Solid Waste Discharging Activities
Based on Table A.5.2-21, majority of the waste are discharged with segregation. For food
waste, 53 establishments discharge by feeding to pets and 44 discharge to public collection
service with segregation.
Newspapers are mainly discharged to public collection without segregation (60 responses).
There are 26 businesses that discharge newspaper to public collection with segregation.
Majority of the glass bottles, cans and PET bottles are discharged to public collection with
segregation and by selling to junk shops. Other types of plastic were also discharged to
public collection with segregation, as well as construction and hazardous wastes.
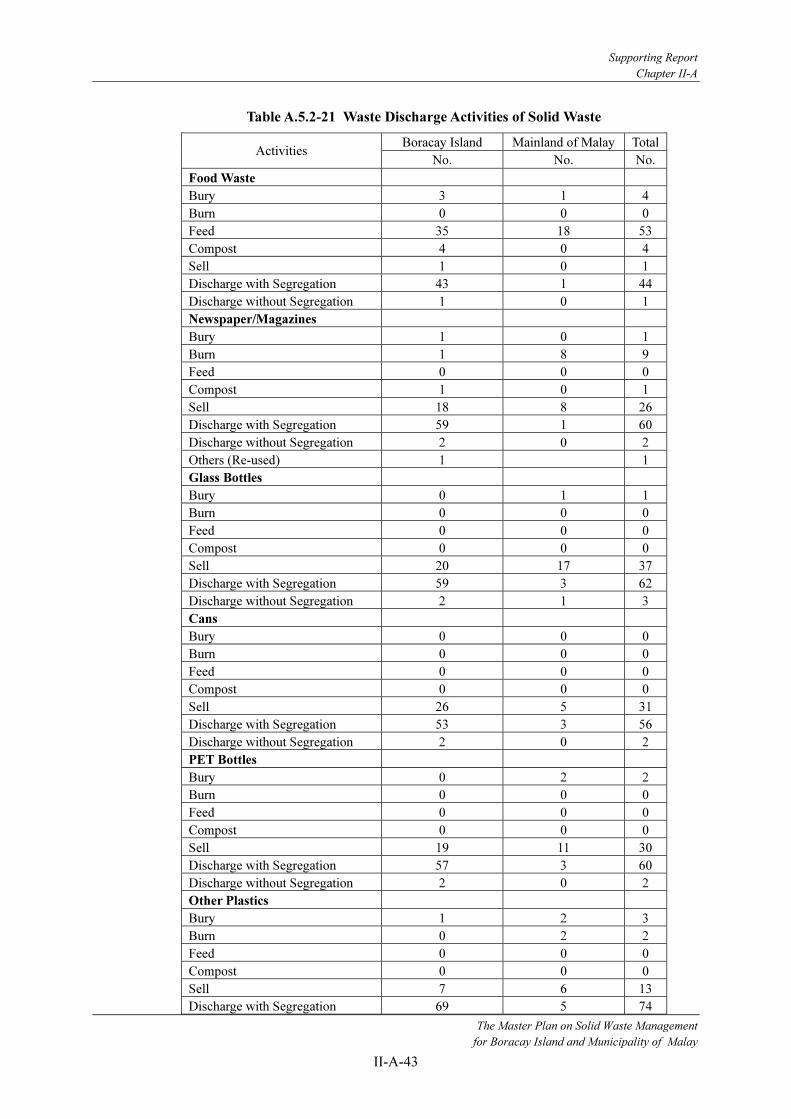
Supporting Report
Chapter II-A
The Master Plan on Solid Waste Management
for Boracay Island and Municipality of Malay
II-A-43
Table A.5.2-21 Waste Discharge Activities of Solid Waste
Boracay Island Mainland of Malay TotalActivities
No. No. No.
Food Waste
Bury 3 1 4
Burn 0 0 0
Feed 35 18 53
Compost 4 0 4
Sell 1 0 1
Discharge with Segregation 43 1 44
Discharge without Segregation 1 0 1
Newspaper/Magazines
Bury 1 0 1
Burn 1 8 9
Feed 0 0 0
Compost 1 0 1
Sell 18 8 26
Discharge with Segregation 59 1 60
Discharge without Segregation 2 0 2
Others (Re-used) 1 1
Glass Bottles
Bury 0 1 1
Burn 0 0 0
Feed 0 0 0
Compost 0 0 0
Sell 20 17 37
Discharge with Segregation 59 3 62
Discharge without Segregation 2 1 3
Cans
Bury 0 0 0
Burn 0 0 0
Feed 0 0 0
Compost 0 0 0
Sell 26 5 31
Discharge with Segregation 53 3 56
Discharge without Segregation 2 0 2
PET Bottles
Bury 0 2 2
Burn 0 0 0
Feed 0 0 0
Compost 0 0 0
Sell 19 11 30
Discharge with Segregation 57 3 60
Discharge without Segregation 2 0 2
Other Plastics
Bury 1 2 3
Burn 0 2 2
Feed 0 0 0
Compost 0 0 0
Sell 7 6 13
Discharge with Segregation 69 5 74

Supporting Report
Chapter II-A
The Master Plan on Solid Waste Management
for Boracay Island and Municipality of Malay
II-A-44
Boracay Island Mainland of Malay TotalActivities
No. No. No.
Discharge without Segregation 2 0 2
Construction Waste
Bury 1 0 1
Burn 0 3 3
Feed 0 0 0
Compost 0 0 0
Sell 2 1 3
Discharge with Segregation 34 4 38
Discharge without Segregation 1 0 1
Hazardous Waste
Bury 2 5 7
Burn 0 0 0
Feed 0 0 0
Compost 1 0 1
Sell 0 1 1
Discharge with Segregation 62 5 67
Discharge without Segregation 1 1 2
Other Types of Waste
Bury 0 1 1
Burn 0 0 0
Feed 0 0 0
Compost 0 0 0
Sell 0 0 0
Discharge with Segregation 0 0 0
Discharge without Segregation 0 0 0
Source: JICA Study Team
(2) Frequency of Waste Discharge
Table A.5.2-22 presents the frequency of waste discharge of the different business
establishments. For food waste, majority of the businesses discharge on a daily basis or
seven times per week (69%). There are 27 establishments that do not discharge food waste
because it is fed to pets. Recyclables on the average are discharged four (4) times a week
and residual wastes are discharged five times a week. Still, majority of the business
establishments discharge recyclable and residual waste on the daily basis, 31% and 39%
respectively.

Supporting Report
Chapter II-A
The Master Plan on Solid Waste Management
for Boracay Island and Municipality of Malay
II-A-45
Table A.5.2-22 Frequency of Waste Discharge
Boracay Island Mainland
Malay Total Frequency of Discharge
(times/week) No. Percent No. Percent No. Percent
Food Wastes
0 17 21.25 10 47.62 27 26.73
1 0 0.00 1 4.76 1 0.99
2 2 2.50 0 0.00 2 1.98
3 0 0.00 0 0.00 0 0.00
4 1 1.25 0 0.00 1 0.99
5 0 0.00 0 0.00 0 0.00
6 0 0.00 0 0.00 0 0.00
7 60 75.00 10 47.62 70 69.31
Total 80 100.00 21 100.00 101 100.00
Least 0 0 0
Most 7 7 7
Average 11.42 2.62 9.59
Recyclable Wastes
0 13 16.25 5 23.81 18 17.82
1 7 8.75 5 23.81 12 11.88
2 11 13.75 3 14.29 14 13.86
3 11 13.75 8 38.10 19 18.81
4 4 5.00 0 0.00 4 3.96
5 2 2.50 0 0.00 2 1.98
6 1 1.25 0 0.00 1 0.99
7 31 38.75 0 0.00 31 30.69
Total 80 100 21 100.00 101 100.00
Least 0 0 0
Most 7 3 7
Average 4.44 2.10 3.95
Residual Wastes
0 14 17.50 6 28.57 20 19.80
1 4 5.00 1 4.76 5 4.95
2 10 12.50 6 28.57 16 15.84
3 7 8.75 3 14.29 10 9.90
4 8 10.00 0 0.00 8 7.92
5 2 2.50 1 4.76 3 2.97
6 0 0.00 0 0.00 0 0.00
7 35 43.75 4 19.05 39 38.61
Total 80 100.00 21 100.00 101 100.00
Least 0 0 0
Most 7 7 7
Average 5.71 1.90 4.92
Source: JICA Study Team
(3) Volume of Waste Discharge
1) Number of Bags to Discharge per Time
For food waste, majority (69.31%) of the business establishments discharged 7 bags of food
wastes per time (Table A.5.2-23). Majority of the businesses are not using bags during
discharge but instead use gallon containers for easy handling of food waste. In addition,

Supporting Report
Chapter II-A
The Master Plan on Solid Waste Management
for Boracay Island and Municipality of Malay
II-A-46
majority of the business establishments discharge one bag per time of recyclable wastes
(65%) and residual wastes (59%). There are also 13 business establishments who discharged
two bags of recyclable wastes per time and 15 businesses discharging two bags of residuals
per time.
Table A.5.2-23 Number of Bags Discharge Per Time by Waste Catgory
Boracay Island Mainland Malay Total Number
Discharged
(bags per time) No. Percent No. Percent No. Percent
Food Wastes
0 17 21.25 10 47.62 27 26.73
1 0 - 1 4.76 1 0.99
2 2 2.50 0 - 2 1.98
3 0 - 0 - 0 0.00
4 1 1.25 0 - 1 0.99
5 0 - 0 - 0 0.00
6 or more 0 - 0 - 0 0.99
7 60 75 10 47.62 70 69.31
Total 80 100.00 21 100.00 101 100.00
Recyclable Wastes
0 12 15.00 5 23.81 17 16.83
1 52 65.00 14 66.67 66 65.35
2 11 13.75 2 9.52 13 12.87
3 2 2.50 0 0.00 2 1.98
4 2 2.50 0 0.00 2 1.98
5 1 1.25 0 0.00 1 0.99
6 or more 0 0.00 0 0.00 0 0.00
Total 80 100.00 21 100.00 101 100.00
Residual Wastes
0 13 16.25 6 28.57 19 18.81
1 51 63.75 9 42.86 60 59.41
2 11 13.75 4 19.05 15 14.85
3 2 2.50 2 9.52 4 3.96
4 2 2.50 0 0.00 2 1.98
5 1 1.25 0 0.00 1 0.99
6 0 0.00 0 0.00 0 0.00
Total 80 100.00 21 100.00 101 100.00
Source: JICA Study Team
(4) Bag Size and Weight
For food waste, majority of bags being discharged are in small sizes (49 responses) with a
weight range of 0.5 to 2 kg. Majority of the establishments discharge 1 kg of food waste per
time in small size trash bags (Table A.5.2-24). There are also 19 businesses that discharge
medium sized plastic bags and five establishments that discharged large size of plastic bags.
A large proportion of the business establishments also discharged recyclable wastes using the
small size plastic bags (37 businesses). Some 22 business establishments use medium size
plastic bags and 24 businesses use large size plastic bags (Table A.5.2-25).
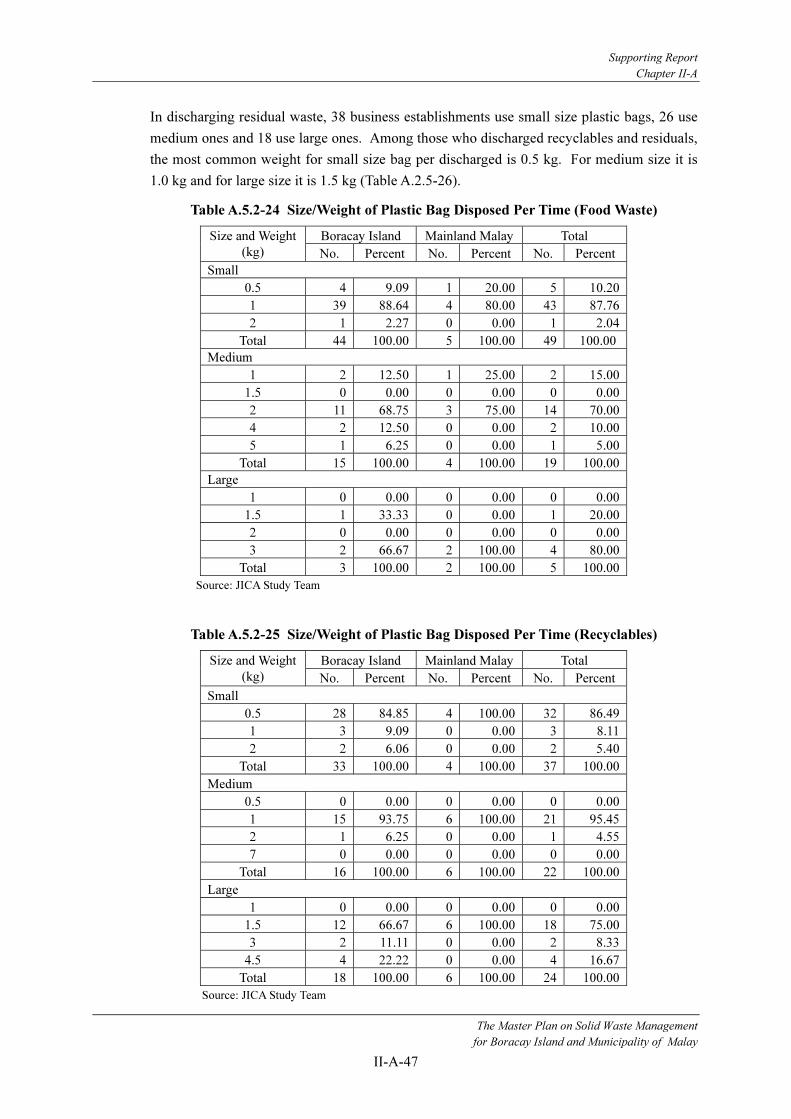
Supporting Report
Chapter II-A
The Master Plan on Solid Waste Management
for Boracay Island and Municipality of Malay
II-A-47
In discharging residual waste, 38 business establishments use small size plastic bags, 26 use
medium ones and 18 use large ones. Among those who discharged recyclables and residuals,
the most common weight for small size bag per discharged is 0.5 kg. For medium size it is
1.0 kg and for large size it is 1.5 kg (Table A.2.5-26).
Table A.5.2-24 Size/Weight of Plastic Bag Disposed Per Time (Food Waste)
Boracay Island Mainland Malay Total Size and Weight
(kg) No. Percent No. Percent No. Percent
Small
0.5 4 9.09 1 20.00 5 10.20
1 39 88.64 4 80.00 43 87.76
2 1 2.27 0 0.00 1 2.04
Total 44 100.00 5 100.00 49 100.00
Medium
1 2 12.50 1 25.00 2 15.00
1.5 0 0.00 0 0.00 0 0.00
2 11 68.75 3 75.00 14 70.00
4 2 12.50 0 0.00 2 10.00
5 1 6.25 0 0.00 1 5.00
Total 15 100.00 4 100.00 19 100.00
Large
1 0 0.00 0 0.00 0 0.00
1.5 1 33.33 0 0.00 1 20.00
2 0 0.00 0 0.00 0 0.00
3 2 66.67 2 100.00 4 80.00
Total 3 100.00 2 100.00 5 100.00
Source: JICA Study Team
Table A.5.2-25 Size/Weight of Plastic Bag Disposed Per Time (Recyclables)
Boracay Island Mainland Malay Total Size and Weight
(kg) No. Percent No. Percent No. Percent
Small
0.5 28 84.85 4 100.00 32 86.49
1 3 9.09 0 0.00 3 8.11
2 2 6.06 0 0.00 2 5.40
Total 33 100.00 4 100.00 37 100.00
Medium
0.5 0 0.00 0 0.00 0 0.00
1 15 93.75 6 100.00 21 95.45
2 1 6.25 0 0.00 1 4.55
7 0 0.00 0 0.00 0 0.00
Total 16 100.00 6 100.00 22 100.00
Large
1 0 0.00 0 0.00 0 0.00
1.5 12 66.67 6 100.00 18 75.00
3 2 11.11 0 0.00 2 8.33
4.5 4 22.22 0 0.00 4 16.67
Total 18 100.00 6 100.00 24 100.00
Source: JICA Study Team

Supporting Report
Chapter II-A
The Master Plan on Solid Waste Management
for Boracay Island and Municipality of Malay
II-A-48
Table A.5.2-26 Size/Weight of Plastic Bag Disposed Per Time (Residuals)
Boracay Island Mainland Malay Total Size and Weight
(kg) No. Percent No. Percent No. Percent
Small
0.5 27 87.10 6 85.71 33 86.84
1 3 9.68 1 14.29 4 10.53
2 1 3.22 0 0.00 1 2.63
Total 31 100.00 7 100.00 38 100.00
Medium
0.5 0 0.00 0 0.00 0 0.00
1 19 95.00 4 66.67 23 88.46
2 1 5.00 2 33.33 3 11.54
Total 20 100.00 6 100.00 26 100.00
Large
1 1 6.25 0 0.00 1 5.56
1.5 11 68.75 2 100.00 13 72.22
3 2 12.50 0 0.00 2 11.11
4.5 2 12.50 0 0.00 2 11.11
Total 16 100.00 2 100.00 18 100.00
Source: JICA Study Team
(5) Price of Plastic Trash Bags
There are very business establishments who purchased trash bags for waste discharge. On a
regular monthly basis, there are two businesses that purchase small trash bags for PhP1 to
PhP10. For recyclable and residual wastes, there is a business establishment that purchases
large size trash bags for PhP6 to PhP10 per month (Table A.5.2-27 to Table A.5.2-29).
Table A.5.2-27 Price of Plastic Bag Per Month by (Food Waste)
Boracay Island Mainland Malay Total Price (PhP)
No. Percent No. Percent No. Percent
Small Size
0 78 97.5 20 100.00 78 97.50
1.00 - 5.00 1 1.25 0 0.00 1 1.25
6.00 - 10.00 1 1.25 0 0.00 1 1.25
Total 80 100.00 0 100.00 101 100.00
Medium Size
0.00 80 100.00 21 100.00 101 100.00
1.00 to 5.00 0 0.00 0 0.00 0 0.00
6.00 to 10.00 0 0.00 0 0.00 0 0.00
Total 80 100.00 21 100.00 101 100.00
Large Size
0.00 80 100.00 21 100.00 101 100.00
1.00 to 5.00 0 0.00 0 0.00 0 0.00
6.00 to 10.00 0 0.00 0 0.00 0 0.00
Total 80 100.00 21 100.00 101 100.00
Source: JICA Study Team
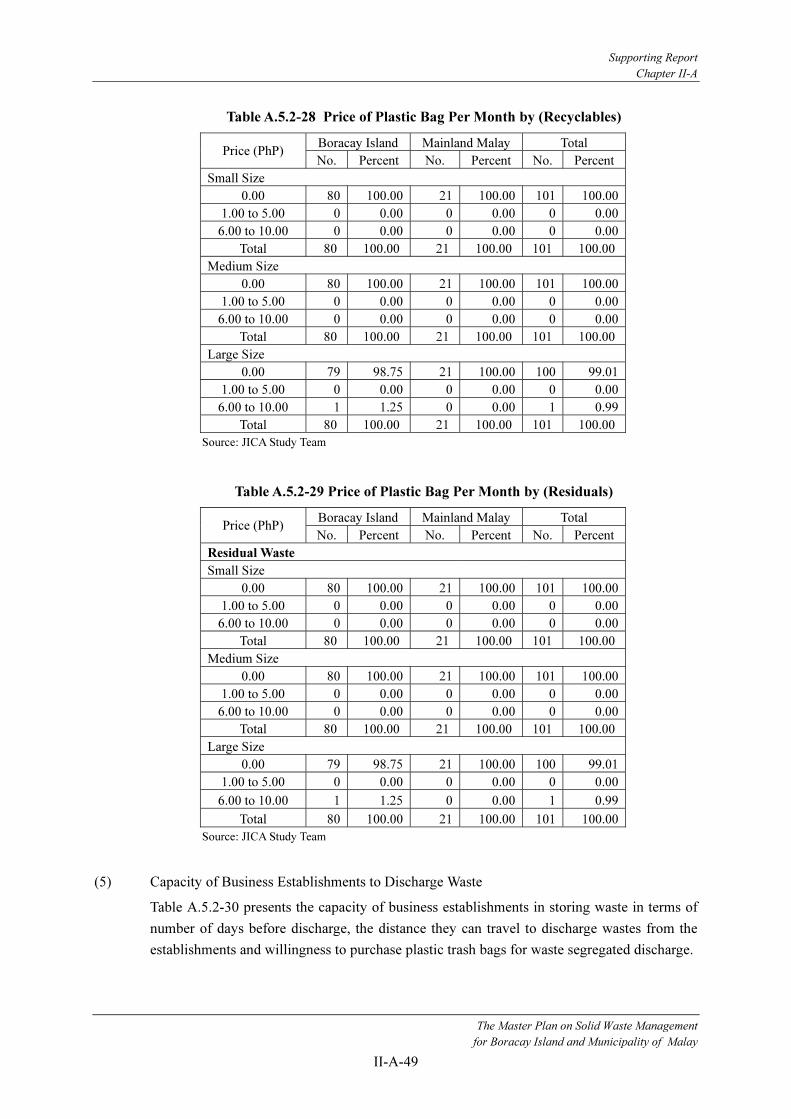
Supporting Report
Chapter II-A
The Master Plan on Solid Waste Management
for Boracay Island and Municipality of Malay
II-A-49
Table A.5.2-28 Price of Plastic Bag Per Month by (Recyclables)
Boracay Island Mainland Malay Total Price (PhP)
No. Percent No. Percent No. Percent
Small Size
0.00 80 100.00 21 100.00 101 100.00
1.00 to 5.00 0 0.00 0 0.00 0 0.00
6.00 to 10.00 0 0.00 0 0.00 0 0.00
Total 80 100.00 21 100.00 101 100.00
Medium Size
0.00 80 100.00 21 100.00 101 100.00
1.00 to 5.00 0 0.00 0 0.00 0 0.00
6.00 to 10.00 0 0.00 0 0.00 0 0.00
Total 80 100.00 21 100.00 101 100.00
Large Size
0.00 79 98.75 21 100.00 100 99.01
1.00 to 5.00 0 0.00 0 0.00 0 0.00
6.00 to 10.00 1 1.25 0 0.00 1 0.99
Total 80 100.00 21 100.00 101 100.00
Source: JICA Study Team
Table A.5.2-29 Price of Plastic Bag Per Month by (Residuals)
Boracay Island Mainland Malay Total Price (PhP)
No. Percent No. Percent No. Percent
Residual Waste
Small Size
0.00 80 100.00 21 100.00 101 100.00
1.00 to 5.00 0 0.00 0 0.00 0 0.00
6.00 to 10.00 0 0.00 0 0.00 0 0.00
Total 80 100.00 21 100.00 101 100.00
Medium Size
0.00 80 100.00 21 100.00 101 100.00
1.00 to 5.00 0 0.00 0 0.00 0 0.00
6.00 to 10.00 0 0.00 0 0.00 0 0.00
Total 80 100.00 21 100.00 101 100.00
Large Size
0.00 79 98.75 21 100.00 100 99.01
1.00 to 5.00 0 0.00 0 0.00 0 0.00
6.00 to 10.00 1 1.25 0 0.00 1 0.99
Total 80 100.00 21 100.00 101 100.00
Source: JICA Study Team
(5) Capacity of Business Establishments to Discharge Waste
Table A.5.2-30 presents the capacity of business establishments in storing waste in terms of
number of days before discharge, the distance they can travel to discharge wastes from the
establishments and willingness to purchase plastic trash bags for waste segregated discharge.

Supporting Report
Chapter II-A
The Master Plan on Solid Waste Management
for Boracay Island and Municipality of Malay
II-A-50
1) Waste Storage Capacity
Majority of the business establishments can keep food waste (61%), recyclables (36%), and
residuals (39%) for only one day. The duration range of zero to seven days was acquired
during the survey with an average of 1.76 days for food wastes. Businesses can store
recyclables for an average of 3.96 days and their residual wastes for 3.39 days.
Table A.5.2-30 Storage Capability by Waste Category
Boracay Island Mainland Malay Total Number of Days
No. Percent No. Percent No. Percent
Food Wastes
0 22 27.50 12 57.15 34 33.66
1 55 68.75 7 33.33 62 61.39
2 3 3.75 1 4.76 4 3.96
7 0 0.00 1 4.76 1 0.99
Total 80 100.00 21 100.00 101 100.00
Average 1.5 2.75 1.76
Recyclable Wastes
0 12 15.00 3 14.29 15 14.85
1 35 43.75 2 9.52 37 36.63
2 9 11.25 4 19.05 13 12.87
3 8 10.00 5 23.81 13 12.87
4 5 6.25 1 4.76 6 5.94
5 2 2.50 1 4.76 3 2.97
6 2 2.50 0 0.00 2 1.98
7 7 8.75 5 23.81 12 11.88
Total 80 100.00 21 100.00 101 100.00
Average 3.86 4.36 3.96
Residual Wastes
0 13 16.25 7 33.33 20 19.80
1 36 45 3 14.29 39 38.61
2 10 12.5 6 28.57 16 15.84
3 10 12.5 2 9.52 12 11.88
4 6 7.5 1 4.76 7 6.93
5 2 2.5 1 4.76 3 2.97
6 1 1.25 0 0.00 1 0.99
7 2 2.5 1 4.76 3 2.97
Total 80 100.00 21 100.00 101 100.00
Average 3.57 2.72 3.39
Source: JICA Study Team
2) Average Distance to Discharge Waste
The business respondents preferred a shorter distance in discharging wastes; if possible they
can readily discharge their waste in front of the establishments (Table A.5.2-31). The most
common distance to discharge waste is 0 to 10 m for food, recyclable and residual wastes.
The shortest distance for all categories is zero and the farthest is 500 m. The average distance
for food waste is 63.97 m, for recyclable it is 41.12 m and for residuals it is 45.10 m.
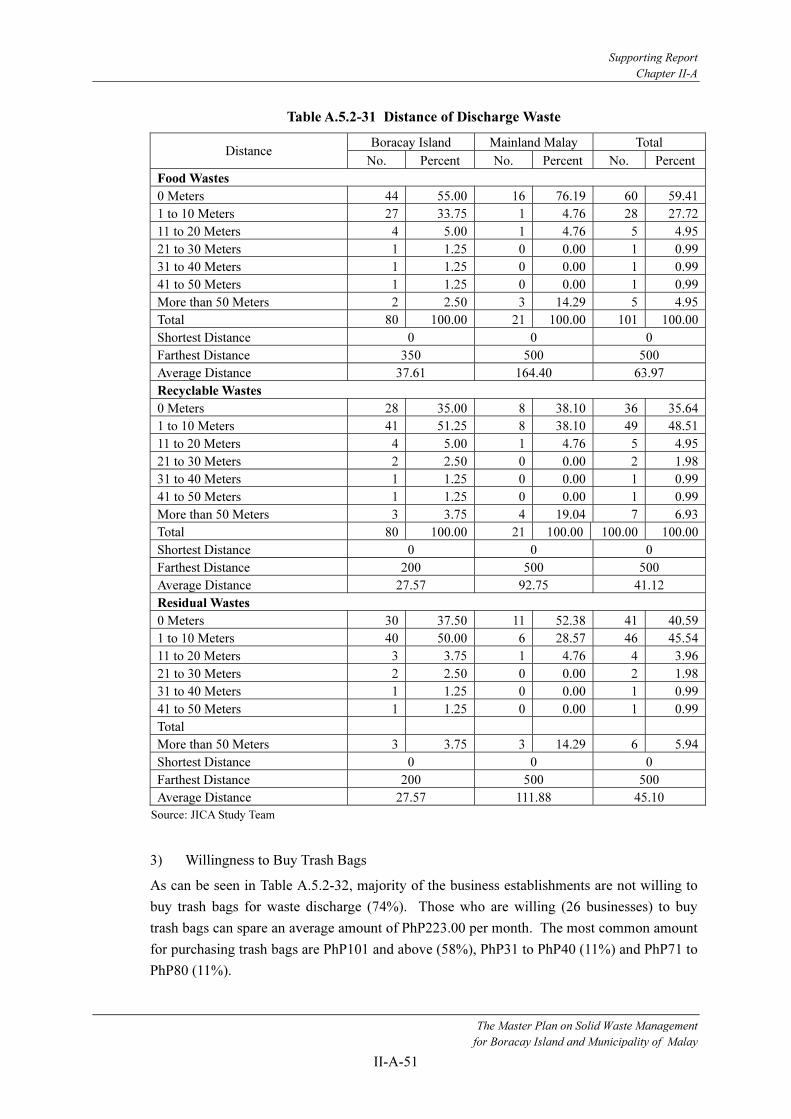
Supporting Report
Chapter II-A
The Master Plan on Solid Waste Management
for Boracay Island and Municipality of Malay
II-A-51
Table A.5.2-31 Distance of Discharge Waste
Boracay Island Mainland Malay Total Distance
No. Percent No. Percent No. Percent
Food Wastes
0 Meters 44 55.00 16 76.19 60 59.41
1 to 10 Meters 27 33.75 1 4.76 28 27.72
11 to 20 Meters 4 5.00 1 4.76 5 4.95
21 to 30 Meters 1 1.25 0 0.00 1 0.99
31 to 40 Meters 1 1.25 0 0.00 1 0.99
41 to 50 Meters 1 1.25 0 0.00 1 0.99
More than 50 Meters 2 2.50 3 14.29 5 4.95
Total 80 100.00 21 100.00 101 100.00
Shortest Distance 0 0 0
Farthest Distance 350 500 500
Average Distance 37.61 164.40 63.97
Recyclable Wastes
0 Meters 28 35.00 8 38.10 36 35.64
1 to 10 Meters 41 51.25 8 38.10 49 48.51
11 to 20 Meters 4 5.00 1 4.76 5 4.95
21 to 30 Meters 2 2.50 0 0.00 2 1.98
31 to 40 Meters 1 1.25 0 0.00 1 0.99
41 to 50 Meters 1 1.25 0 0.00 1 0.99
More than 50 Meters 3 3.75 4 19.04 7 6.93
Total 80 100.00 21 100.00 100.00 100.00
Shortest Distance 0 0 0
Farthest Distance 200 500 500
Average Distance 27.57 92.75 41.12
Residual Wastes
0 Meters 30 37.50 11 52.38 41 40.59
1 to 10 Meters 40 50.00 6 28.57 46 45.54
11 to 20 Meters 3 3.75 1 4.76 4 3.96
21 to 30 Meters 2 2.50 0 0.00 2 1.98
31 to 40 Meters 1 1.25 0 0.00 1 0.99
41 to 50 Meters 1 1.25 0 0.00 1 0.99
Total
More than 50 Meters 3 3.75 3 14.29 6 5.94
Shortest Distance 0 0 0
Farthest Distance 200 500 500
Average Distance 27.57 111.88 45.10
Source: JICA Study Team
3) Willingness to Buy Trash Bags
As can be seen in Table A.5.2-32, majority of the business establishments are not willing to
buy trash bags for waste discharge (74%). Those who are willing (26 businesses) to buy
trash bags can spare an average amount of PhP223.00 per month. The most common amount
for purchasing trash bags are PhP101 and above (58%), PhP31 to PhP40 (11%) and PhP71 to
PhP80 (11%).
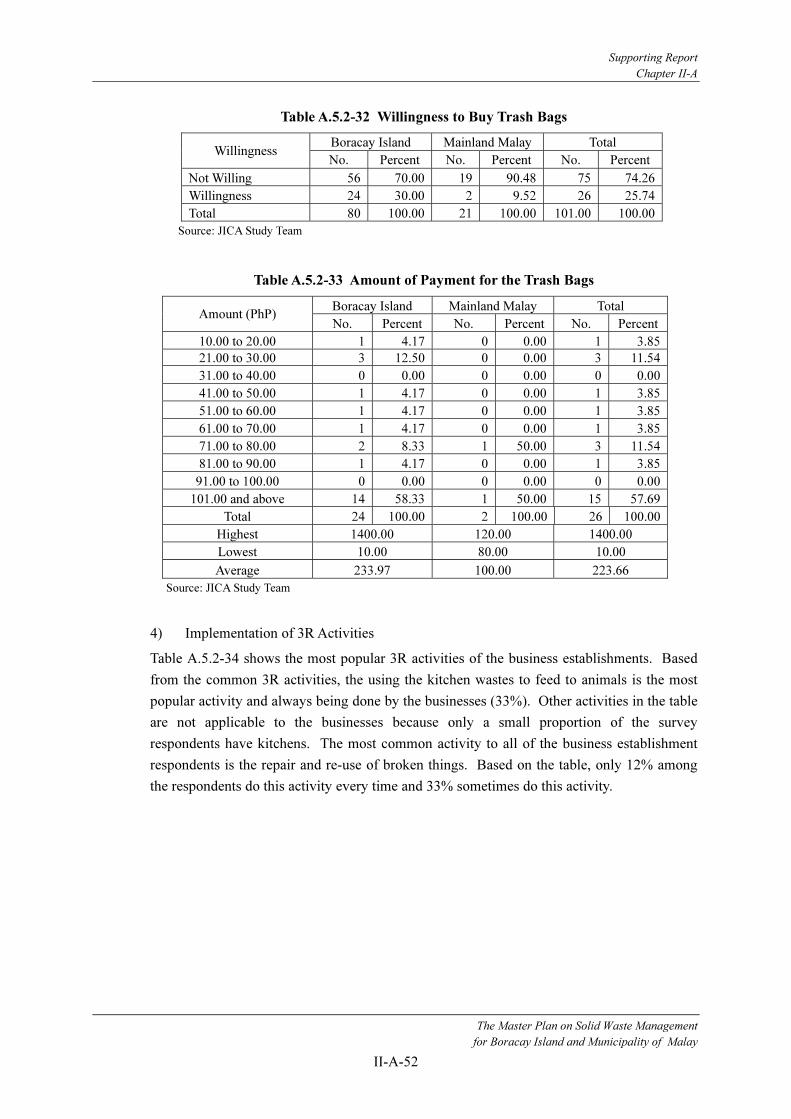
Supporting Report
Chapter II-A
The Master Plan on Solid Waste Management
for Boracay Island and Municipality of Malay
II-A-52
Table A.5.2-32 Willingness to Buy Trash Bags
Boracay Island Mainland Malay Total Willingness
No. Percent No. Percent No. Percent
Not Willing 56 70.00 19 90.48 75 74.26
Willingness 24 30.00 2 9.52 26 25.74
Total 80 100.00 21 100.00 101.00 100.00
Source: JICA Study Team
Table A.5.2-33 Amount of Payment for the Trash Bags
Boracay Island Mainland Malay Total Amount (PhP)
No. Percent No. Percent No. Percent
10.00 to 20.00 1 4.17 0 0.00 1 3.85
21.00 to 30.00 3 12.50 0 0.00 3 11.54
31.00 to 40.00 0 0.00 0 0.00 0 0.00
41.00 to 50.00 1 4.17 0 0.00 1 3.85
51.00 to 60.00 1 4.17 0 0.00 1 3.85
61.00 to 70.00 1 4.17 0 0.00 1 3.85
71.00 to 80.00 2 8.33 1 50.00 3 11.54
81.00 to 90.00 1 4.17 0 0.00 1 3.85
91.00 to 100.00 0 0.00 0 0.00 0 0.00
101.00 and above 14 58.33 1 50.00 15 57.69
Total 24 100.00 2 100.00 26 100.00
Highest 1400.00 120.00 1400.00
Lowest 10.00 80.00 10.00
Average 233.97 100.00 223.66
Source: JICA Study Team
4) Implementation of 3R Activities
Table A.5.2-34 shows the most popular 3R activities of the business establishments. Based
from the common 3R activities, the using the kitchen wastes to feed to animals is the most
popular activity and always being done by the businesses (33%). Other activities in the table
are not applicable to the businesses because only a small proportion of the survey
respondents have kitchens. The most common activity to all of the business establishment
respondents is the repair and re-use of broken things. Based on the table, only 12% among
the respondents do this activity every time and 33% sometimes do this activity.

Supporting Report
Chapter II-A
The Master Plan on Solid Waste Management
for Boracay Island and Municipality of Malay
II-A-53
Table A.5.2-34 Implementing 3R Activities
Boracay Island Mainland Malay Total 3R Activities
No. Percent No. Percent No. Percent
Reduce Kitchen Wastes in Cooking Process
Don't Do It At All 21 26.25 10 47.62 31 30.69
Sometimes Do It 12 15 4 19.05 16 15.84
Often Do It 3 3.75 1 4.76 4 3.96
Do It Every time 13 16.25 1 4.76 14 13.86
Not Applicable 31 38.75 5 23.81 36 35.64
Total 80 100.00 21 100.00 101 100.00
Using Kitchen Waste to Feed Animals
Don't Do It At All 17 21.25 0 0.00 17 16.83
Sometimes Do It 10 12.5 0 0.00 10 9.90
Often Do It 5 6.25 0 0.00 5 4.95
Do It Every time 17 21.25 16 76.19 33 32.67
Not Applicable 31 38.75 5 23.81 36 35.64
Total 80 100.00 21 100.00 101 100.00
Using Kitchen Waste to Make Compost
Don't Do It At All 29 36.25 8 38.10 37 36.63
Sometimes Do It 10 12.5 2 9.52 12 11.88
Often Do It 6 7.5 2 9.52 8 7.92
Do It Every time 4 5 4 19.05 8 7.92
Not Applicable 31 38.75 5 23.81 36 35.64
Total 80 100.00 21 100.00 101 100.00
Repair and Reuse of Broken Things
Don't Do It At All 41 51.25 8 38.10 49 48.51
Sometimes Do It 25 31.25 8 38.10 33 32.67
Often Do It 3 3.75 4 19.05 7 6.94
Do It Every time 11 13.75 1 4.75 12 11.88
Total 80 100.00 21 100.00 101 100.00
Source: JICA Study Team
5.2.5 Opinion of Current Public Collection Service
The different opinions of the business establishments were asked in order to determine their
level of satisfaction on the current public collection activities. The tables presented under
this section can form part of the solid waste management program evaluation, especially in
measuring the level of satisfaction of the program beneficiaries particularly the different
business establishments in the municipality.
(1) Business Establishments Level of Satisfaction to Public Collection Service
Table A.5.2-35 presents the satisfaction level of business establishments on the public
collection service. Majority of the businesses on Boracay Island (65%) are highly satisfied
with the service, 27% are a little satisfied and there are about 5 establishments who are not
satisfied at all. On the Mainland of Malay, 10 of the establishments are satisfied and eight
(8) are unsatisfied with the public collection service. This result reflects the fact that there
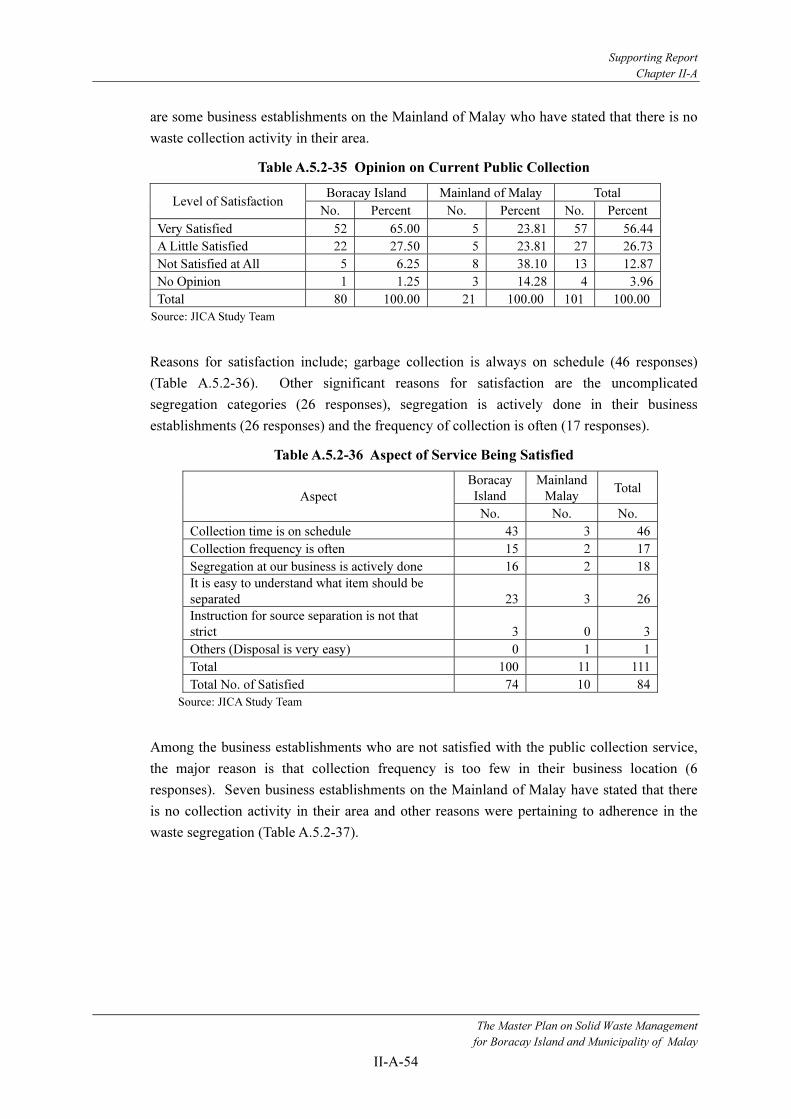
Supporting Report
Chapter II-A
The Master Plan on Solid Waste Management
for Boracay Island and Municipality of Malay
II-A-54
are some business establishments on the Mainland of Malay who have stated that there is no
waste collection activity in their area.
Table A.5.2-35 Opinion on Current Public Collection
Boracay Island Mainland of Malay Total Level of Satisfaction
No. Percent No. Percent No. Percent
Very Satisfied 52 65.00 5 23.81 57 56.44
A Little Satisfied 22 27.50 5 23.81 27 26.73
Not Satisfied at All 5 6.25 8 38.10 13 12.87
No Opinion 1 1.25 3 14.28 4 3.96
Total 80 100.00 21 100.00 101 100.00
Source: JICA Study Team
Reasons for satisfaction include; garbage collection is always on schedule (46 responses)
(Table A.5.2-36). Other significant reasons for satisfaction are the uncomplicated
segregation categories (26 responses), segregation is actively done in their business
establishments (26 responses) and the frequency of collection is often (17 responses).
Table A.5.2-36 Aspect of Service Being Satisfied
Boracay
Island
Mainland
Malay Total
Aspect
No. No. No.
Collection time is on schedule 43 3 46
Collection frequency is often 15 2 17
Segregation at our business is actively done 16 2 18
It is easy to understand what item should be
separated 23 3 26
Instruction for source separation is not that
strict 3 0 3
Others (Disposal is very easy) 0 1 1
Total 100 11 111
Total No. of Satisfied 74 10 84
Source: JICA Study Team
Among the business establishments who are not satisfied with the public collection service,
the major reason is that collection frequency is too few in their business location (6
responses). Seven business establishments on the Mainland of Malay have stated that there
is no collection activity in their area and other reasons were pertaining to adherence in the
waste segregation (Table A.5.2-37).

Supporting Report
Chapter II-A
The Master Plan on Solid Waste Management
for Boracay Island and Municipality of Malay
II-A-55
Table A.5.2-37 Aspect of Service Being Not Satisfied
Boracay
Island
Mainland
Malay TotalAspect
No. No. No.
Collection time is too early to discharge waste 2 0 2
Collection frequency is few 3 3 6
Segregation at our house is an additional burden and laborious 0 1 1
It is not easy to understand what item should be separated 1 1 2
Instruction for source separation is very strict 1 1 2
Monitoring is not active 1 0 1
Compliance monitoring is not done properly 0 1 1
Others (No collection here) 0 7 7
Total 8 14 22
Total No. Not Satisfied 8 14 22
Source: JICA Study Team
Opinion on Current Public Collection Service, Table A.5.2-38 presents the overall opinions
of the business establishment respondents on the current public collection service.
Regarding time of waste discharge, 83% among the businesses stated to maintain the current
time of discharge. Several of the businesses (10 respondents) have suggested changing the
time of discharge to 6:00 AM up to 9:00 AM.
In terms of collecting food wastes, majority of the businesses (79%) stated to maintain the
current schedule of discharge and 14 establishments want to increase the number of
collection. Thirteen (13) establishments suggested that the collection frequency increase to
seven times per week and one business establishment suggested that it increase to 14 times
per week.
In terms of collecting recyclables and residuals, still majority of the business establishments
(78%) suggested to maintain the current frequency of collection. Under the collection of
recyclable waste, 15 businesses want to increase the collection frequency to three to eight
times per week and 10 establishments suggested that the collection frequency of residual
wastes increase to three to seven times per week.

Supporting Report
Chapter II-A
The Master Plan on Solid Waste Management
for Boracay Island and Municipality of Malay
II-A-56
Table A.5.2-38 Opinion on Current Public Collection Service
Boracay Island Mainland Malay Total Opinion
No. Percent No. Percent No. Percent
Time of Discharge
Keep it as is 72 90.00 12 15.00 84 83.17
Change schedule to:
6:00 AM 2 2.50 0 0.00 2 1.98
7:00 AM 2 2.50 2 2.50 4 3.96
7:30 AM 1 1.25 0 0.00 1 0.99
8:00 AM 2 2.50 0 0.00 2 1.98
9:00 AM 1 1.25 0 0.00 1 0.99
No Answer 0 0.00 7 8.75 7 6.93
Total 80 100.00 21 100.00 101 100.00
Food Waste Collection Frequency
Keep it as is 71 88.75 9 11.25 80 79.21
Increase Collection
7 times a week 8 10.00 5 6.25 13 12.87
14 times a week 1 1.25 0 0.00 1 0.99
Reduce Collection 0 0.00 0 0.00 0 0.00
No Answer 0 0.00 7 8.75 7 6.93
Total 80 100.00 21 100.00 101 100.00
Recyclables Collection Frequency
Keep it as is 69 86.25 10 47.62 79 78.22
Increase Collection
3 times a week 2 2.50 3 14.29 5 4.95
5 times a week 2 2.50 0 0.00 2 1.98
7 times a week 6 7.50 1 4.76 7 6.93
8 times a week 1 1.25 0 0.00 1 0.99
Reduce Collection 0 0.00 0 0.00 0 0.00
No Answer 0 0.00 7 33.33 7 6.93
Total 80 100.00 21 100.00 101 100.00
Residual Waste Collection Frequency
Keep it as is 69 86.25 10 47.62 79 78.22
Increase Collection
3 times a week 2 2.50 3 14.29 5 4.95
4 times a week 2 2.50 0 0.00 2 1.98
7 times a week 7 8.75 1 4.76 8 7.92
Reduce Collection 0 0.00 0 0.00 0 0.00
No Answer 0 0.00 7 33.33 7 6.93
Total 80 100.00 21 100.00 101 100.00
Number of Source Separation Categories
Keep it as is 80 100.00 14 66.67 94 93.07
Reduce Categories 0 0.00 0 0.00 0 0.00
Increase Categories 0 0.00 0 0.00 0 0.00
No Answer 0 0.00 7 33.33 7 6.93
Total 80 100.00 21 100.00 101 100.00
Source: JICA Study Team
5.2.6 Willingness to Pay for Waste Collection
The willingness to pay for waste collection services is needed to determine in order to
provide the solid waste management program of Malay regarding a workable policy towards
sustaining the implementation of the program on the local level. The different business

Supporting Report
Chapter II-A
The Master Plan on Solid Waste Management
for Boracay Island and Municipality of Malay
II-A-57
establishments on the Mainland of Malay are commonly paying a waste and garbage
collection fee amounting to PhP1,800 per year in the municipal office during annual
processing of mayor’s permit. However, in good consideration for the small-scale businesses
in the municipality, some of the cottage-scale and livelihood businesses in both Boracay
Island and the Mainland of Malay are not liable to pay an annual waste collection fee.
(1) Payment of Current Waste Collection Fee
Based on Table A.5.2-39, 79% of the businesses are aware and paying regularly the annual
waste collection fee, there are nine establishments who do not pay such fees and 12
establishments who are not well oriented on this matter.
Table A.5.2-39 Payment of Waste Collection Fee of Business Establishments
Boracay Island Mainland Malay Total Payment of Waste Collection Fee
No. Percent No. Percent No. Percent
Yes, we pay it regularly 65 81.25 15 71.43 80 79.21
Yes, we sometimes pay it 0 0.00 0 0.00 0 0.00
No, we don't 4 5.00 5 23.81 9 8.91
I don't know the system 11 13.75 1 4.76 12 11.88
Total 80 100.00 21 100.00 101 100.00
Source: JICA Study Team
In Table A.5.2-40, 52% among businesses who pay an annual garbage fee is spending an
average of PhP150 per month on waste collection services. Some of the businesses are
paying an average of PhP300 per month (16%) and some are paying as low as PhP100 per
month (6%) to as high as PhP1,000 per month (1%). The average waste collection fee being
paid by business establishments is PhP373 per month.
Table A.5.2-40 Amount of Payment for the Current Collection Service per Month
Boracay Island Mainland Malay Total Amount
(PhP/month) No. Percent No. Percent No. Percent
100 4 6.15 1 6.67 5 6.25
120 0 0.00 1 6.67 1 1.25
150 39 60.00 3 20.00 42 52.50
200 3 4.62 1 6.67 4 5.00
280 1 1.54 0 0.00 1 1.25
300 9 13.85 4 26.67 13 16.25
400 2 3.08 1 6.67 3 3.75
500 3 4.60 2 13.33 5 6.25
600 1 1.54 1 6.67 2 2.50
800 1 1.54 1 6.67 2 2.50
850 1 1.54 0 0.00 1 1.25
1,000 1 1.54 0 0.00 1 1.25
Total 65 100.00 15 100.00 80 100.00
Average Amount 387.05 314.45 373.09
Lowest Amount 100.00 100.00 100.00
Highest Amount 1000.00 800.00 1000.00
Source: JICA Study Team

Supporting Report
Chapter II-A
The Master Plan on Solid Waste Management
for Boracay Island and Municipality of Malay
II-A-58
(2) Willingness to Pay
Table A.5.2-41 presents the number of business establishments willing to pay more than the
current garbage fee. Some 21% among the business establishments are willing to pay more
than the current garbage collection fee.
Table A.5.2-41 Willingness to Pay More than the Present Garbage Fee
Boracay Island Mainland Malay Total Willingness
No. Percent No. Percent No. Percent
Yes 16 20.00 5 23.81 21 20.79
No 64 80.00 16 76.19 80 79.21
Total 80 100.00 21 100.00 101 100.00
Source: JICA Study Team
From the 21 establishments who were willing to pay an additional waste collection fee, seven
of the businesses are willing to pay an additional PhP500 per month (Table A.5.2-42). Four
among them can pay PhP200 and three businesses are willing to pay PhP150 per month. The
average amount of additional waste collection fee willing to be paid is PhP285.
Table A.5.2-42 Additional Amount Willing to Pay for Waste Collection
Boracay Island Mainland Malay Total Amount
(PhP/month) No. Percent No. Percent No. Percent
100 1 6.25 0 0.00 1 4.76
150 1 6.25 2 40.00 3 14.29
170 1 6.25 0 0.00 1 4.76
175 1 6.25 0 0.00 1 4.76
200 3 18.75 1 20.00 4 19.05
250 1 6.25 0 0.00 1 4.76
400 2 12.5 0 0.00 2 9.52
500 5 31.25 2 40.00 7 33.33
600 1 6.25 0 0.00 1 4.76
Total 16 100.00 5 100.00 21 100.00
Average 285.90 283.33 285.29
Lowest 100.00 150.00 100.00
Highest 600.00 500.00 600.00
Source: JICA Study Team
(3) Opinions and Idea Related to Solid Waste Management
Table A.5.2-43 presents the opinion of the respondents on solid waste management. The
most common comment after those that have no ideas is that regular collection should be
done followed by regular monitoring for compliance to the solid waste management
ordinance of the municipality. Other comments are shown below.

Supporting Report
Chapter II-A
The Master Plan on Solid Waste Management
for Boracay Island and Municipality of Malay
II-A-59
Table A.5.2-43 Honest Opinion on Solid Waste Management
Opinion/Comments Num.
No idea/No comment 45
I see no problems/SWM is ok 15
Regular collection should be done/More garbage trucks 8
Regular monitoring for compliance on SWM 7
No waste collection here 7
Increase/Improve trash bins around the island 6
Observe proper disposal of solid wastes 4
Regular clean-up at the beach 2
Needs more improvement 2
Increase awareness on SWM 1
Transparency in where the fees go 1
Collection frequency is too few 1
Unsatisfied with present waste collection 1
SWM is the responsibility of the government/They should segregate 1
Garbage fee is too much 1
Regular checking of facilities (manhole) 1
Improve SWM (Increase MRF) 1
Pro-rate garbage fee 1
Total Responses 105
Source: JICA Study Team
5.3 Tourist Survey
5.3.1 General Information
(1) Country of Targeted Respondents
Majority, 84% or 63% of the respondents are Asians with the Philippines having the highest
(33.83%) seconded by Korea with 25.56%. This is followed by European tourists
comprising of 24.81% of the total respondents. Among the Europeans, English tourists are
the highest with 4.51%. South and North American tourists comprise 12.03% of the
respondents with USA having the largest number at 9.02%. Table A.5.3-1 below presents the
number of tourist respondents by country.
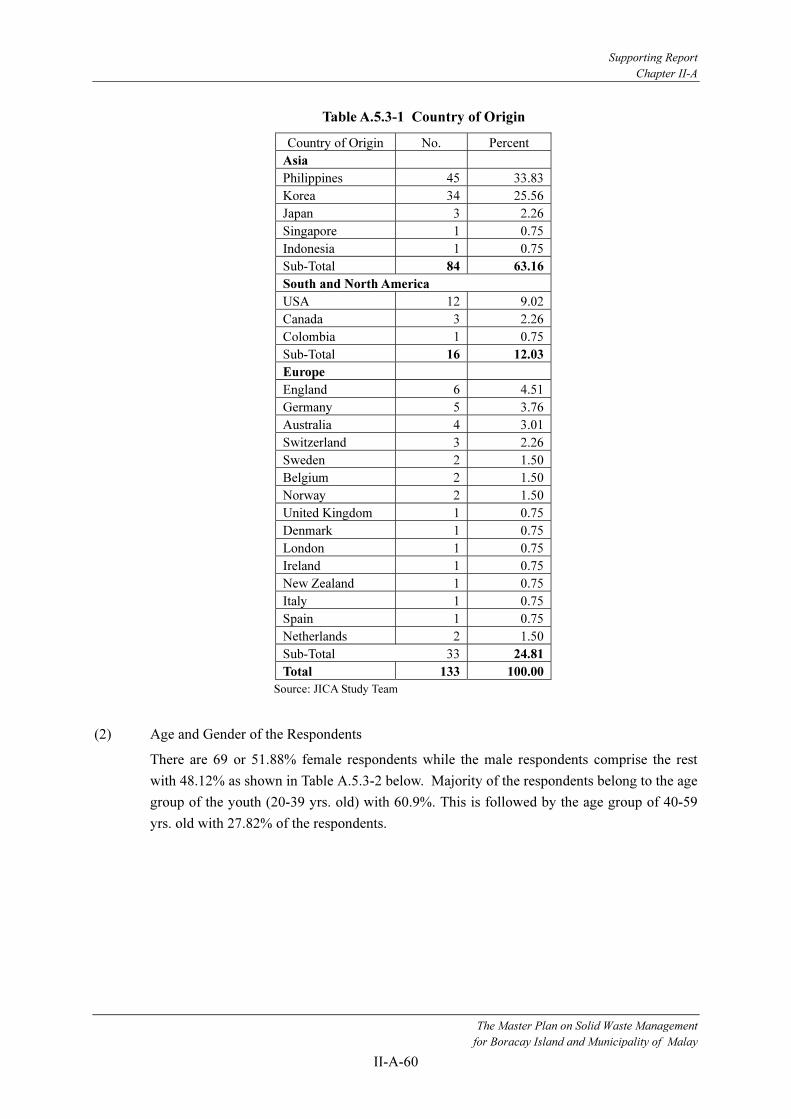
Supporting Report
Chapter II-A
The Master Plan on Solid Waste Management
for Boracay Island and Municipality of Malay
II-A-60
Table A.5.3-1 Country of Origin
Country of Origin No. Percent
Asia
Philippines 45 33.83
Korea 34 25.56
Japan 3 2.26
Singapore 1 0.75
Indonesia 1 0.75
Sub-Total 84 63.16
South and North America
USA 12 9.02
Canada 3 2.26
Colombia 1 0.75
Sub-Total 16 12.03
Europe
England 6 4.51
Germany 5 3.76
Australia 4 3.01
Switzerland 3 2.26
Sweden 2 1.50
Belgium 2 1.50
Norway 2 1.50
United Kingdom 1 0.75
Denmark 1 0.75
London 1 0.75
Ireland 1 0.75
New Zealand 1 0.75
Italy 1 0.75
Spain 1 0.75
Netherlands 2 1.50
Sub-Total 33 24.81
Total 133 100.00
Source: JICA Study Team
(2) Age and Gender of the Respondents
There are 69 or 51.88% female respondents while the male respondents comprise the rest
with 48.12% as shown in Table A.5.3-2 below. Majority of the respondents belong to the age
group of the youth (20-39 yrs. old) with 60.9%. This is followed by the age group of 40-59
yrs. old with 27.82% of the respondents.

Supporting Report
Chapter II-A
The Master Plan on Solid Waste Management
for Boracay Island and Municipality of Malay
II-A-61
Table A.5.3-2 Gender and Age Range of Tourist Respondents
Gender No. Percent
Female 69 51.88
Male 64 48.12
Total 133 100
Age Range No. Percent
10 - 19 year-old 8 6.02
20 - 39 year-old 81 60.90
40 - 59 year-old 37 27.82
Over 60 year-old 7 5.26
Total 133 100.00
Source: JICA Study Team
(3) Educational Attainment of the Respondents
Table A.5.3-3 below shows the educational attainment where majority (80.45%) are
university degree holders. Some 7.52% are master’s degree holders. The rest are senior and
junior secondary holders with 9.77% and 2.26% respectively.
Table A.5.3-3 Educational Attainment
Degree No. Percent
University (Bachelor or College degree) 107 80.45
Graduate school (Masters degree) 10 7.52
Senior secondary school 13 9.77
Junior secondary school 3 2.26
Total 133 100.00
Source: JICA Study Team
(4) Occupation of the Respondents
As revealed in Table A.5.3-4, majority of the respondents (39.1%) are company employees.
Some 15% are independent business owners, 14% are students, 7% are housewives and 6.7%
are government employees. Some 3.01% are unemployed and another 3.01% are
owner/executives. Other occupations not listed comprise 9%. These other occupations
include retirees (3.01%), independent consultant (0.75%) and musician (0.75%)

Supporting Report
Chapter II-A
The Master Plan on Solid Waste Management
for Boracay Island and Municipality of Malay
II-A-62
Table A.5.3-4 Main Occupation
Occupation No. Percent
Company Employee 54 40.60
Independent business (incl. Shop owner) 22 6.54
Student 19 4.29
Housewife 10 7.52
Government Employee 9 6.77
Others, (Specify ) 8 6.02
Unemployed 4 3.01
Owner executive 4 3.01
Temporary worker (Except student) 2 1.50
Farmer/Fisherfolk 1 0.75
Total 133 100.00
Source: JICA Study Team
(5) Purpose of the Visit
The dominant purpose of tourists in visiting Boracay is for relaxation (107 responses) and
marine sports (15 responses). Others came to visit acquaintances (7 responses), check
business prospects (7 responses) and for business transactions (3 responses).
Table A.5.3-5 Purpose of Visit
Activity Number
Do marine sports 15
Relax in Beach 107
Visit Acquaintance 7
Check Business Prospects 7
Do business transaction 3
Total 139
Source: JICA Study Team
(6) Frequency of the Visit
The bulk of tourists are first time visitors (60.9%) as revealed in Table A.5.3-6 below. Some
21.8% are second time visitors and 6.77% are third time visitors. The rest 10.53% have
visited for more than three times.
Table A.5.3-6 Number of Visits to Boracay Island
Number of Visits Frequency Percent
First time 81 60.90
Second time 29 21.80
More than 3 times 14 10.53
Third time 9 6.77
Total 133 100.00
Source: JICA Study Team
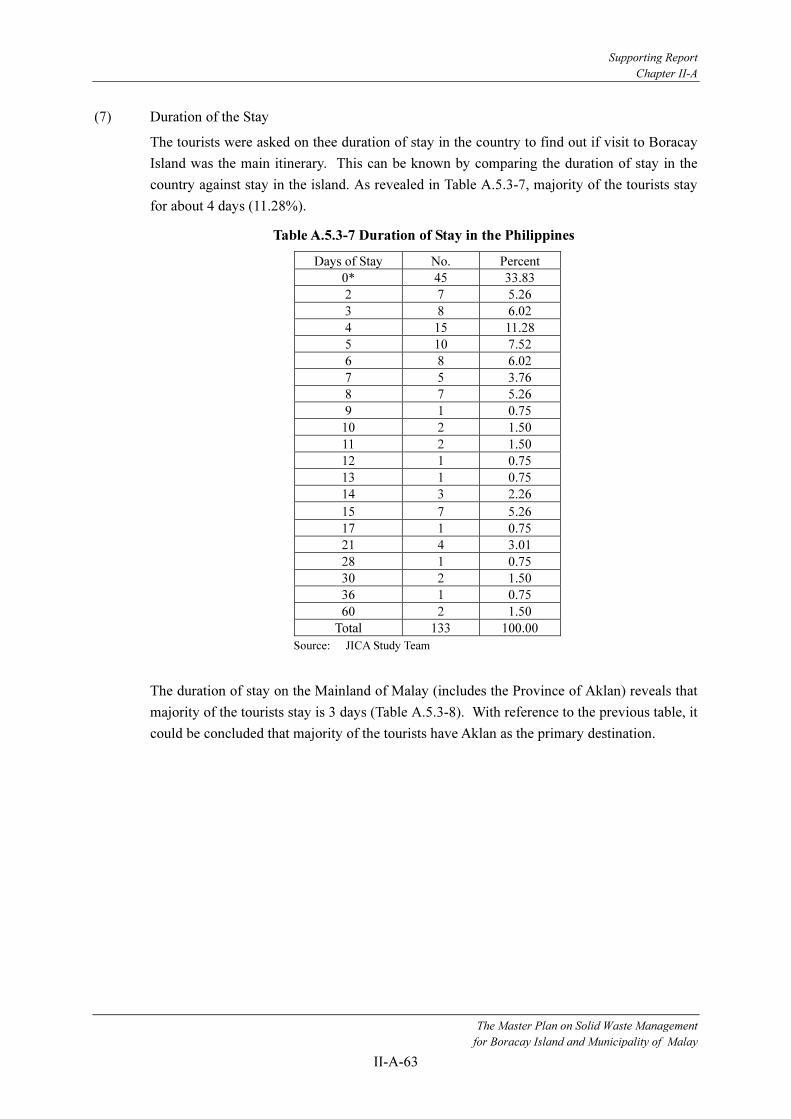
Supporting Report
Chapter II-A
The Master Plan on Solid Waste Management
for Boracay Island and Municipality of Malay
II-A-63
(7) Duration of the Stay
The tourists were asked on thee duration of stay in the country to find out if visit to Boracay
Island was the main itinerary. This can be known by comparing the duration of stay in the
country against stay in the island. As revealed in Table A.5.3-7, majority of the tourists stay
for about 4 days (11.28%).
Table A.5.3-7 Duration of Stay in the Philippines
Days of Stay No. Percent
0* 45 33.83
2 7 5.26
3 8 6.02
4 15 11.28
5 10 7.52
6 8 6.02
7 5 3.76
8 7 5.26
9 1 0.75
10 2 1.50
11 2 1.50
12 1 0.75
13 1 0.75
14 3 2.26
15 7 5.26
17 1 0.75
21 4 3.01
28 1 0.75
30 2 1.50
36 1 0.75
60 2 1.50
Total 133 100.00
Source: JICA Study Team
The duration of stay on the Mainland of Malay (includes the Province of Aklan) reveals that
majority of the tourists stay is 3 days (Table A.5.3-8). With reference to the previous table, it
could be concluded that majority of the tourists have Aklan as the primary destination.

Supporting Report
Chapter II-A
The Master Plan on Solid Waste Management
for Boracay Island and Municipality of Malay
II-A-64
Table A.5.3-8 Duration of Stay on the Mainland of Malay
Days of Stay No. Percent
0* 8 6.02
1 7 5.26
2 8 6.02
3 36 27.07
4 21 15.79
5 14 10.53
6 4 3.01
7 16 12.03
9 1 0.75
10 5 3.76
11 1 0.75
12 1 0.75
14 4 3.01
15 3 2.26
17 1 0.75
28 1 0.75
36 1 0.75
60 1 0.75
Total 133 100.00
Source: JICA Study Team
Majority of the respondents (30.08%) stayed for 3 days. Again, this shows that the tourists’
main reason in visiting the country is to go to Boracay. Table A.5.3-9 shows the duration of
stay in the island of the tourists.
Table A.5.3-9 Duration of Stay on Boracay Island
Days of Stay No. Percent
1 8 6.02
2 10 7.52
3 40 30.08
4 22 16.54
5 14 10.53
6 4 3.01
7 16 12.03
9 1 0.75
10 6 4.51
11 1 0.75
12 1 0.75
14 6 4.51
15 1 0.75
28 1 0.75
35 1 0.75
60 1 0.75
Total 133 100
Source: JICA Study Team

Supporting Report
Chapter II-A
The Master Plan on Solid Waste Management
for Boracay Island and Municipality of Malay
II-A-65
(8) Name of the Hotel or Resort Which the Respondent Stay in
Majority (9.02%) of the respondents were booked in Boracay Regency Hotel, seconded by
Real Maris Resort (6.77%) and Boracay Tropics Resort (5.26%). The other respondents
stayed in other hotels and resort in the area as shown in Table A.5.3-10.
Table A.5.3-10 Hotel Accommodations
Hotel/Resort Name No. Percent
Alago Park (free accommodation) 1 0.75
Alice in Wonderland Resort 4 3.01
Angol Point Beach Resort 3 2.26
Apartment 2 1.50
Artista Resort 1 0.75
Asya Resort 2 1.50
Bans Beach Resort 2 1.50
Blue Mango Resort 4 3.01
Boracay Beach Resort 1 0.75
Boracay Chalet Resort 1 0.75
Boracay Holiday Resort 1 0.75
Boracay Peninsula Hotel 3 2.26
Boracay Regency Hotel 12 9.02
Boracay Strand Resort 2 1.50
Boracay Tropics Resort 7 5.26
Boracay True Homes 1 0.75
Casa Fiesta Resort 2 1.50
Casa Pilar Resort 1 0.75
Chez de Paris 1 0.75
Chusoy Building 1 0.75
Club Panoly Resort 1 0.75
Dante's Hideaway 1 0.75
Ericko's House 3 2.26
Fairways and Bluewater Resort 1 0.75
Faith Village Resort 3 2.26
Forest Hills Resort 1 0.75
Friday's Resort 2 1.50
Friends' house 1 0.75
Grand Vista Resort 2 1.50
Holiday Resort 2 1.50
Jat Sulsi Room 1 0.75
La Fiesta Resort 1 0.75
Laguna de Boracay Resort 1 0.75
Le Soleil de Boracay 1 0.75
LM Beach Resort 1 0.75
Mandarin Hotel 2 1.50
Mango Ray Resort 5 3.76
Marzon Resort 2 1.50
Merly's Place 1 0.75
Microtel 1 0.75
Nami Beach Resort 1 0.75
Nami Private Villa 1 0.75
Nigi Nigi Nu Noos 2 1.50
Noeme's Place 2 1.50
Noe's Resort 1 0.75
Orchids Resort 2 1.50
Paradise Bay 1 0.75
Paradise Garden Hotel 1 0.75
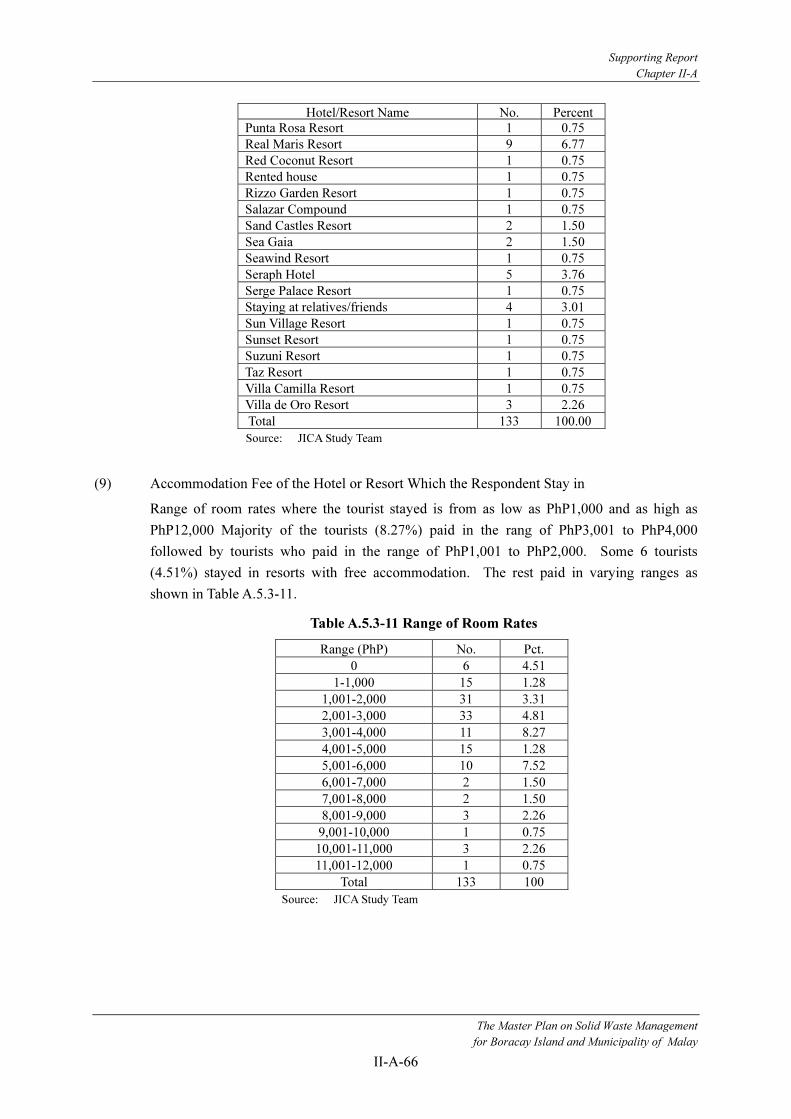
Supporting Report
Chapter II-A
The Master Plan on Solid Waste Management
for Boracay Island and Municipality of Malay
II-A-66
Hotel/Resort Name No. Percent
Punta Rosa Resort 1 0.75
Real Maris Resort 9 6.77
Red Coconut Resort 1 0.75
Rented house 1 0.75
Rizzo Garden Resort 1 0.75
Salazar Compound 1 0.75
Sand Castles Resort 2 1.50
Sea Gaia 2 1.50
Seawind Resort 1 0.75
Seraph Hotel 5 3.76
Serge Palace Resort 1 0.75
Staying at relatives/friends 4 3.01
Sun Village Resort 1 0.75
Sunset Resort 1 0.75
Suzuni Resort 1 0.75
Taz Resort 1 0.75
Villa Camilla Resort 1 0.75
Villa de Oro Resort 3 2.26
Total 133 100.00
Source: JICA Study Team
(9) Accommodation Fee of the Hotel or Resort Which the Respondent Stay in
Range of room rates where the tourist stayed is from as low as PhP1,000 and as high as
PhP12,000 Majority of the tourists (8.27%) paid in the rang of PhP3,001 to PhP4,000
followed by tourists who paid in the range of PhP1,001 to PhP2,000. Some 6 tourists
(4.51%) stayed in resorts with free accommodation. The rest paid in varying ranges as
shown in Table A.5.3-11.
Table A.5.3-11 Range of Room Rates
Range (PhP) No. Pct.
0 6 4.51
1-1,000 15 1.28
1,001-2,000 31 3.31
2,001-3,000 33 4.81
3,001-4,000 11 8.27
4,001-5,000 15 1.28
5,001-6,000 10 7.52
6,001-7,000 2 1.50
7,001-8,000 2 1.50
8,001-9,000 3 2.26
9,001-10,000 1 0.75
10,001-11,000 3 2.26
11,001-12,000 1 0.75
Total 133 100
Source: JICA Study Team
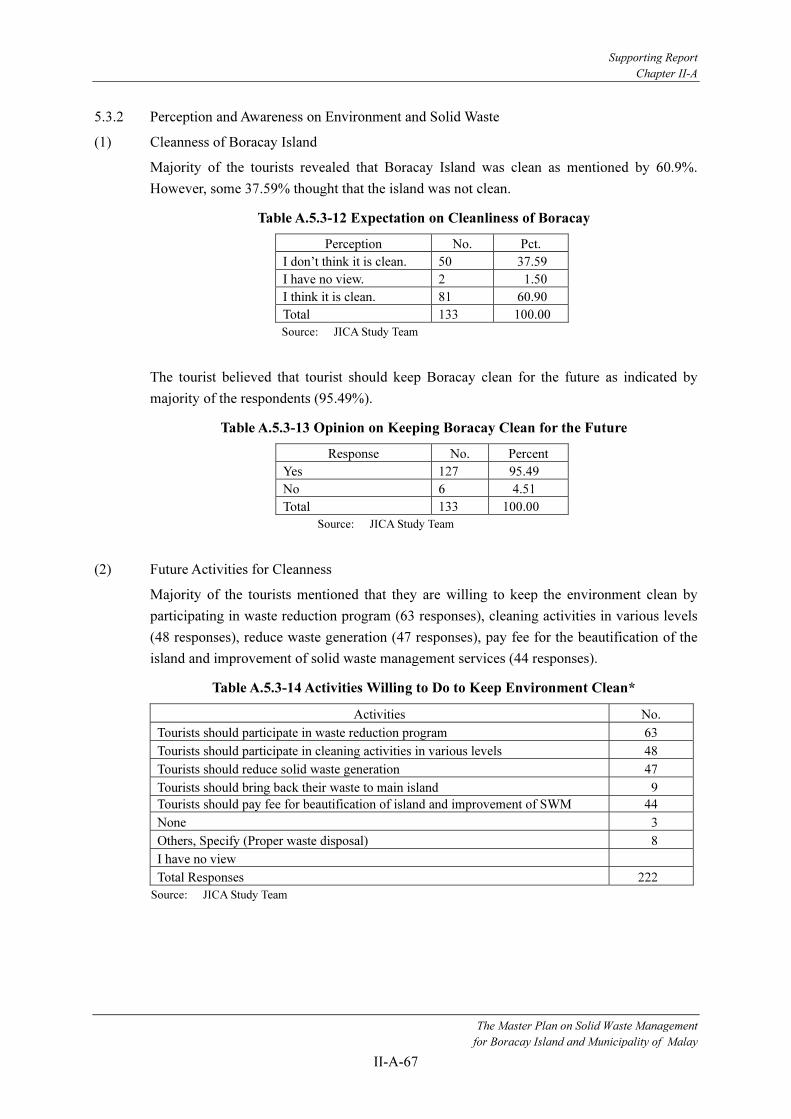
Supporting Report
Chapter II-A
The Master Plan on Solid Waste Management
for Boracay Island and Municipality of Malay
II-A-67
5.3.2 Perception and Awareness on Environment and Solid Waste
(1) Cleanness of Boracay Island
Majority of the tourists revealed that Boracay Island was clean as mentioned by 60.9%.
However, some 37.59% thought that the island was not clean.
Table A.5.3-12 Expectation on Cleanliness of Boracay
Perception No. Pct.
I don’t think it is clean. 50 37.59
I have no view. 2 1.50
I think it is clean. 81 60.90
Total 133 100.00
Source: JICA Study Team
The tourist believed that tourist should keep Boracay clean for the future as indicated by
majority of the respondents (95.49%).
Table A.5.3-13 Opinion on Keeping Boracay Clean for the Future
Response No. Percent
Yes 127 95.49
No 6 4.51
Total 133 100.00
Source: JICA Study Team
(2) Future Activities for Cleanness
Majority of the tourists mentioned that they are willing to keep the environment clean by
participating in waste reduction program (63 responses), cleaning activities in various levels
(48 responses), reduce waste generation (47 responses), pay fee for the beautification of the
island and improvement of solid waste management services (44 responses).
Table A.5.3-14 Activities Willing to Do to Keep Environment Clean*
Activities No.
Tourists should participate in waste reduction program 63
Tourists should participate in cleaning activities in various levels 48
Tourists should reduce solid waste generation 47
Tourists should bring back their waste to main island 9
Tourists should pay fee for beautification of island and improvement of SWM 44
None 3
Others, Specify (Proper waste disposal) 8
I have no view
Total Responses 222
Source: JICA Study Team
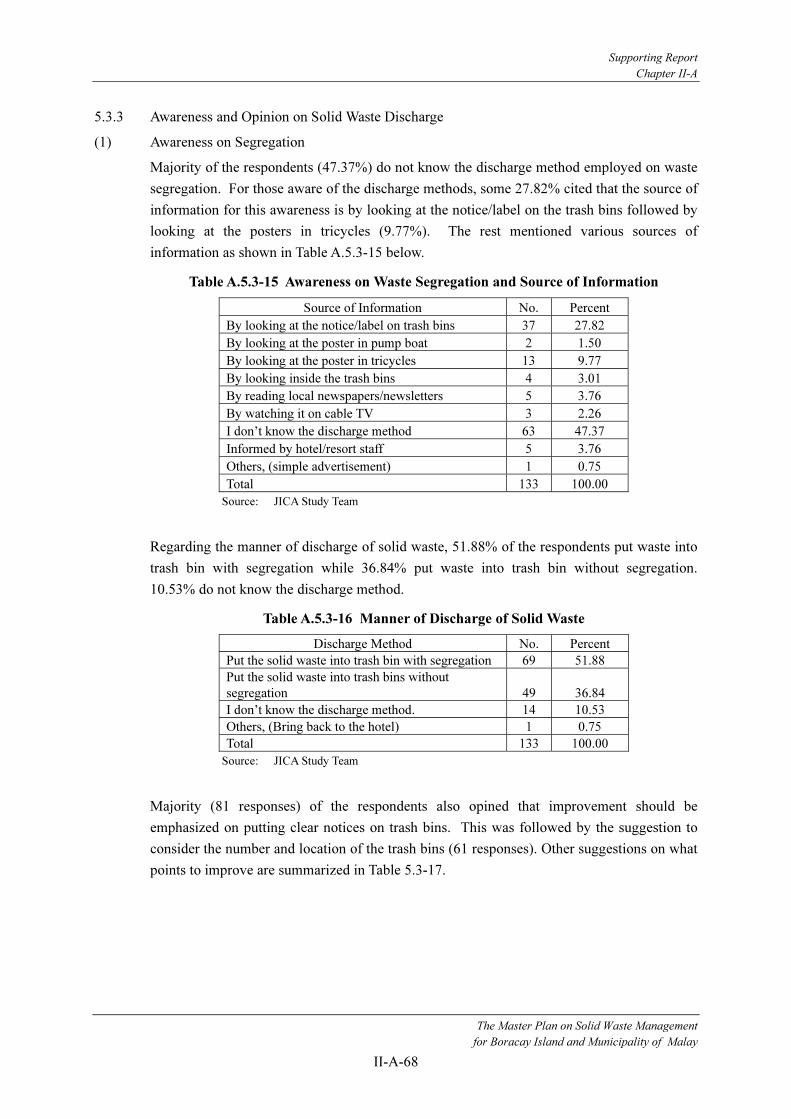
Supporting Report
Chapter II-A
The Master Plan on Solid Waste Management
for Boracay Island and Municipality of Malay
II-A-68
5.3.3 Awareness and Opinion on Solid Waste Discharge
(1) Awareness on Segregation
Majority of the respondents (47.37%) do not know the discharge method employed on waste
segregation. For those aware of the discharge methods, some 27.82% cited that the source of
information for this awareness is by looking at the notice/label on the trash bins followed by
looking at the posters in tricycles (9.77%). The rest mentioned various sources of
information as shown in Table A.5.3-15 below.
Table A.5.3-15 Awareness on Waste Segregation and Source of Information
Source of Information No. Percent
By looking at the notice/label on trash bins 37 27.82
By looking at the poster in pump boat 2 1.50
By looking at the poster in tricycles 13 9.77
By looking inside the trash bins 4 3.01
By reading local newspapers/newsletters 5 3.76
By watching it on cable TV 3 2.26
I don’t know the discharge method 63 47.37
Informed by hotel/resort staff 5 3.76
Others, (simple advertisement) 1 0.75
Total 133 100.00
Source: JICA Study Team
Regarding the manner of discharge of solid waste, 51.88% of the respondents put waste into
trash bin with segregation while 36.84% put waste into trash bin without segregation.
10.53% do not know the discharge method.
Table A.5.3-16 Manner of Discharge of Solid Waste
Discharge Method No. Percent
Put the solid waste into trash bin with segregation 69 51.88
Put the solid waste into trash bins without
segregation 49 36.84
I don’t know the discharge method. 14 10.53
Others, (Bring back to the hotel) 1 0.75
Total 133 100.00
Source: JICA Study Team
Majority (81 responses) of the respondents also opined that improvement should be
emphasized on putting clear notices on trash bins. This was followed by the suggestion to
consider the number and location of the trash bins (61 responses). Other suggestions on what
points to improve are summarized in Table 5.3-17.
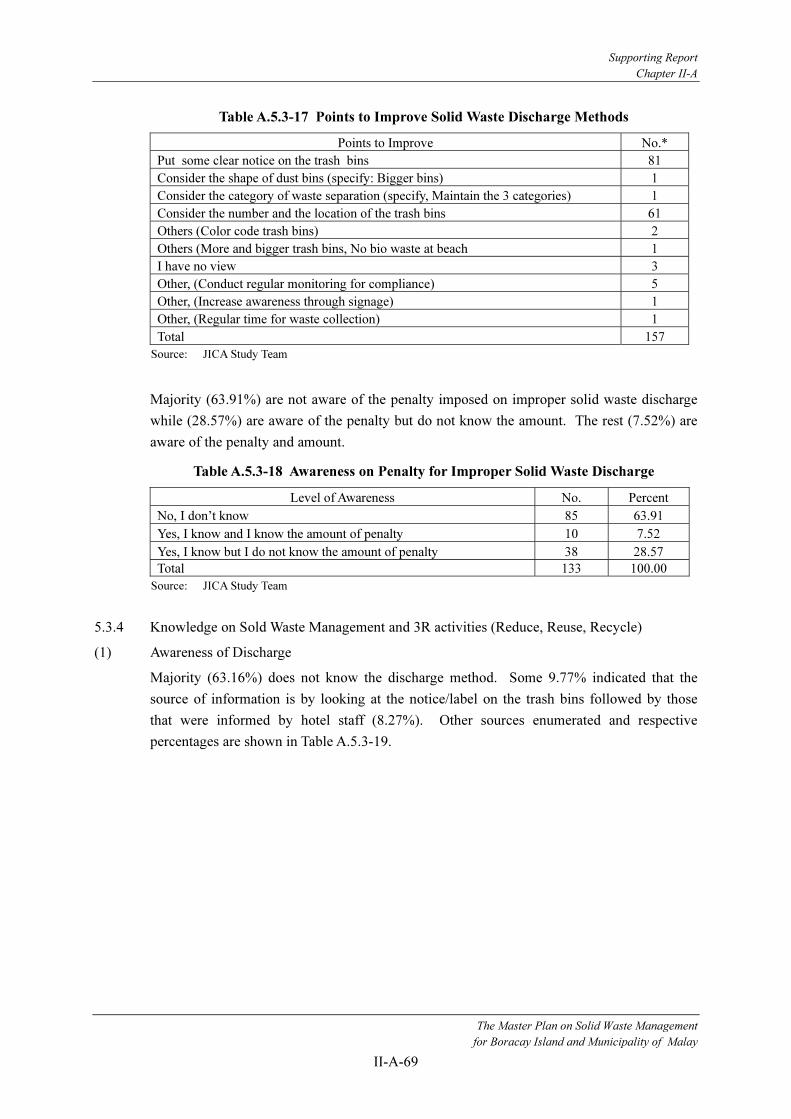
Supporting Report
Chapter II-A
The Master Plan on Solid Waste Management
for Boracay Island and Municipality of Malay
II-A-69
Table A.5.3-17 Points to Improve Solid Waste Discharge Methods
Points to Improve No.*
Put some clear notice on the trash bins 81
Consider the shape of dust bins (specify: Bigger bins) 1
Consider the category of waste separation (specify, Maintain the 3 categories) 1
Consider the number and the location of the trash bins 61
Others (Color code trash bins) 2
Others (More and bigger trash bins, No bio waste at beach 1
I have no view 3
Other, (Conduct regular monitoring for compliance) 5
Other, (Increase awareness through signage) 1
Other, (Regular time for waste collection) 1
Total 157
Source: JICA Study Team
Majority (63.91%) are not aware of the penalty imposed on improper solid waste discharge
while (28.57%) are aware of the penalty but do not know the amount. The rest (7.52%) are
aware of the penalty and amount.
Table A.5.3-18 Awareness on Penalty for Improper Solid Waste Discharge
Level of Awareness No. Percent
No, I don’t know 85 63.91
Yes, I know and I know the amount of penalty 10 7.52
Yes, I know but I do not know the amount of penalty 38 28.57
Total 133 100.00
Source: JICA Study Team
5.3.4 Knowledge on Sold Waste Management and 3R activities (Reduce, Reuse, Recycle)
(1) Awareness of Discharge
Majority (63.16%) does not know the discharge method. Some 9.77% indicated that the
source of information is by looking at the notice/label on the trash bins followed by those
that were informed by hotel staff (8.27%). Other sources enumerated and respective
percentages are shown in Table A.5.3-19.

Supporting Report
Chapter II-A
The Master Plan on Solid Waste Management
for Boracay Island and Municipality of Malay
II-A-70
Table A.5.3-19 Source of Information on Awareness of Penalty for Improper Discharge
Source of Information No. Percent
I don’t know the discharge method 84 63.16
By looking at the notice/label on trash bins 13 9.77
Informed by hotel/resort staff 11 8.27
By watching it on cable TV 7 5.26
By reading local newspapers/newsletters 6 4.51
By looking at the poster in tricycles 2 1.50
By looking inside the trash bins 1 0.75
By looking at the poster in multi-cab 1 0.75
By listening to the radio 1 0.75
Others, (Poster along the road ) 2 1.50
Others, (Informed by friends) 3 2.26
Others, (Common sense ) 1 0.75
Others, (Attended local solid waste mgt program) 1 0.75
Total 133 94.74
Source: JICA Study Team
Majority (63%) of the respondents opined that there are few trash bins while 21.8% opined
that the number of trash bins and allocation is sufficient. Some 5.26% said that the number
of trash bins is sufficient but allocation should be improved. Of this percentage, four
responses indicated that more trash bins should be placed at the beach. Some 6.77% do not
have any view.
Table A.5.3-20 Opinion on the Present Provision of Trash Bins
Category No. Percent
Number of trash bins and the allocation is sufficient. 29 21.80
Number is sufficient but allocation should be improved 7 5.26
Every resort in front should provide trash bins (1)
More trash bins at the beach (4)
Put in more areas where there are none (1)
Put more trash bins with segregation inside hotels (1)
Trash bins should be placed in area where visible and easily noticed (1)
Number of trash bins is too few. 85 63.91
Number of trash bins is too many
Others (Specify 3 2.26
Place more bins with design so that they will be more beautiful (1)
I don't think it's bad to add trash bins as long as it's being used. (1)
Put more trash bins rather than more garbage scattered everywhere (1)
I have no view. 9 6.77
Total 133 100.00
Source: JICA Study Team
(2) Waste Segregation
Majority (80 responses) of the respondents revealed that they prefer to practice segregation
during discharge followed by bringing own shopping bag to avoid /reduce packaging (45
responses). Some respondents (33 responses) were willing to have a refund system for
returnable bottles and containers while others (4 responses) prefer to collect the tin cans and
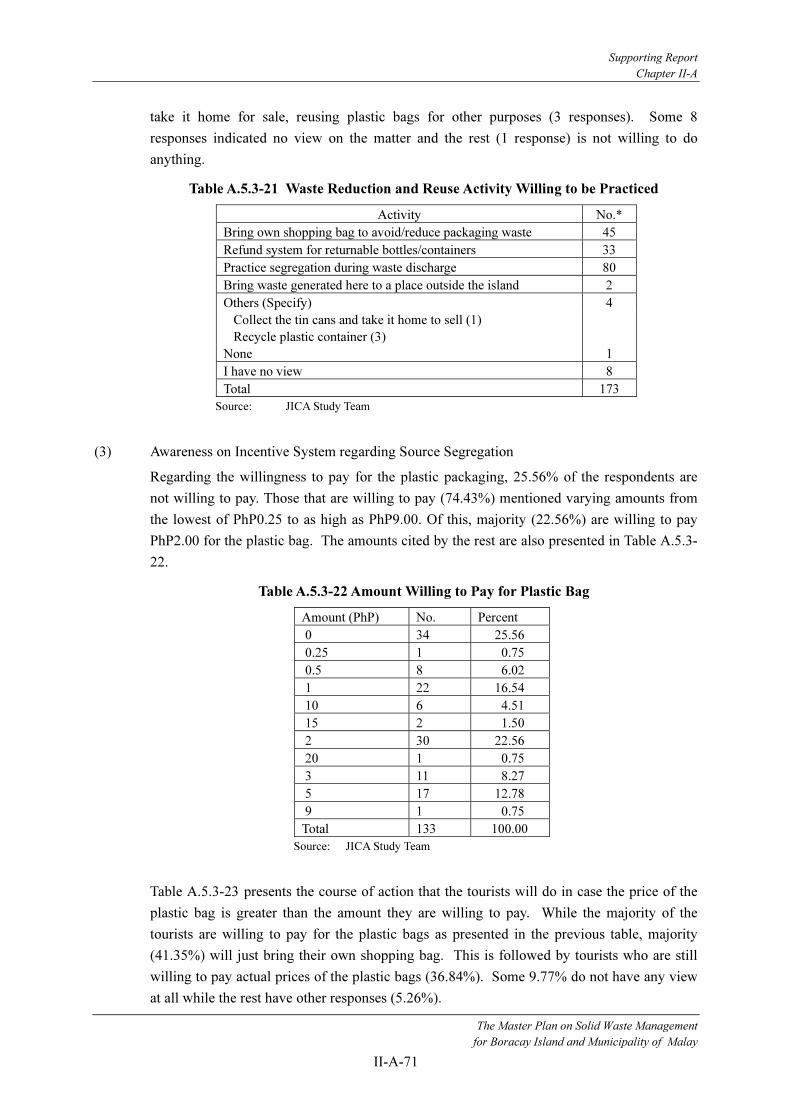
Supporting Report
Chapter II-A
The Master Plan on Solid Waste Management
for Boracay Island and Municipality of Malay
II-A-71
take it home for sale, reusing plastic bags for other purposes (3 responses). Some 8
responses indicated no view on the matter and the rest (1 response) is not willing to do
anything.
Table A.5.3-21 Waste Reduction and Reuse Activity Willing to be Practiced
Activity No.*
Bring own shopping bag to avoid/reduce packaging waste 45
Refund system for returnable bottles/containers 33
Practice segregation during waste discharge 80
Bring waste generated here to a place outside the island 2
Others (Specify) 4
Collect the tin cans and take it home to sell (1)
Recycle plastic container (3)
None 1
I have no view 8
Total 173
Source: JICA Study Team
(3) Awareness on Incentive System regarding Source Segregation
Regarding the willingness to pay for the plastic packaging, 25.56% of the respondents are
not willing to pay. Those that are willing to pay (74.43%) mentioned varying amounts from
the lowest of PhP0.25 to as high as PhP9.00. Of this, majority (22.56%) are willing to pay
PhP2.00 for the plastic bag. The amounts cited by the rest are also presented in Table A.5.3-
22.
Table A.5.3-22 Amount Willing to Pay for Plastic Bag
Amount (PhP) No. Percent
0 34 25.56
0.25 1 0.75
0.5 8 6.02
1 22 16.54
10 6 4.51
15 2 1.50
2 30 22.56
20 1 0.75
3 11 8.27
5 17 12.78
9 1 0.75
Total 133 100.00
Source: JICA Study Team
Table A.5.3-23 presents the course of action that the tourists will do in case the price of the
plastic bag is greater than the amount they are willing to pay. While the majority of the
tourists are willing to pay for the plastic bags as presented in the previous table, majority
(41.35%) will just bring their own shopping bag. This is followed by tourists who are still
willing to pay actual prices of the plastic bags (36.84%). Some 9.77% do not have any view
at all while the rest have other responses (5.26%).
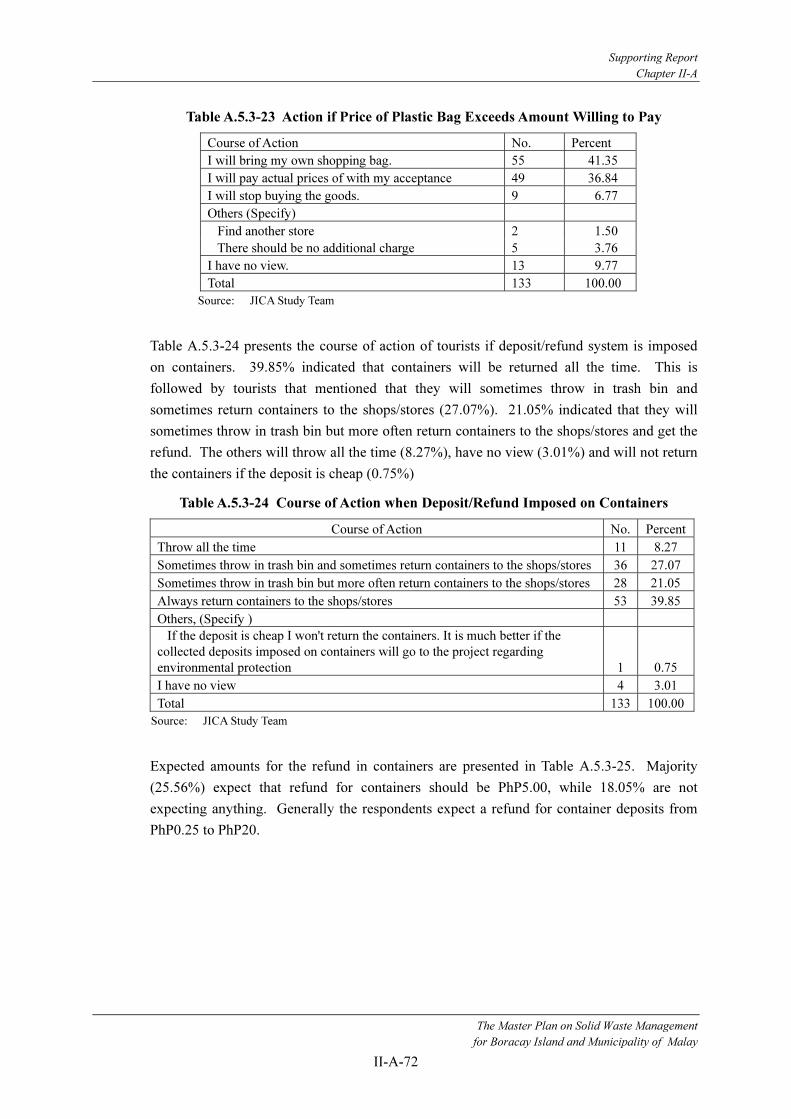
Supporting Report
Chapter II-A
The Master Plan on Solid Waste Management
for Boracay Island and Municipality of Malay
II-A-72
Table A.5.3-23 Action if Price of Plastic Bag Exceeds Amount Willing to Pay
Course of Action No. Percent
I will bring my own shopping bag. 55 41.35
I will pay actual prices of with my acceptance 49 36.84
I will stop buying the goods. 9 6.77
Others (Specify)
Find another store 2 1.50
There should be no additional charge 5 3.76
I have no view. 13 9.77
Total 133 100.00
Source: JICA Study Team
Table A.5.3-24 presents the course of action of tourists if deposit/refund system is imposed
on containers. 39.85% indicated that containers will be returned all the time. This is
followed by tourists that mentioned that they will sometimes throw in trash bin and
sometimes return containers to the shops/stores (27.07%). 21.05% indicated that they will
sometimes throw in trash bin but more often return containers to the shops/stores and get the
refund. The others will throw all the time (8.27%), have no view (3.01%) and will not return
the containers if the deposit is cheap (0.75%)
Table A.5.3-24 Course of Action when Deposit/Refund Imposed on Containers
Course of Action No. Percent
Throw all the time 11 8.27
Sometimes throw in trash bin and sometimes return containers to the shops/stores 36 27.07
Sometimes throw in trash bin but more often return containers to the shops/stores 28 21.05
Always return containers to the shops/stores 53 39.85
Others, (Specify )
If the deposit is cheap I won't return the containers. It is much better if the
collected deposits imposed on containers will go to the project regarding
environmental protection 1 0.75
I have no view 4 3.01
Total 133 100.00
Source: JICA Study Team
Expected amounts for the refund in containers are presented in Table A.5.3-25. Majority
(25.56%) expect that refund for containers should be PhP5.00, while 18.05% are not
expecting anything. Generally the respondents expect a refund for container deposits from
PhP0.25 to PhP20.
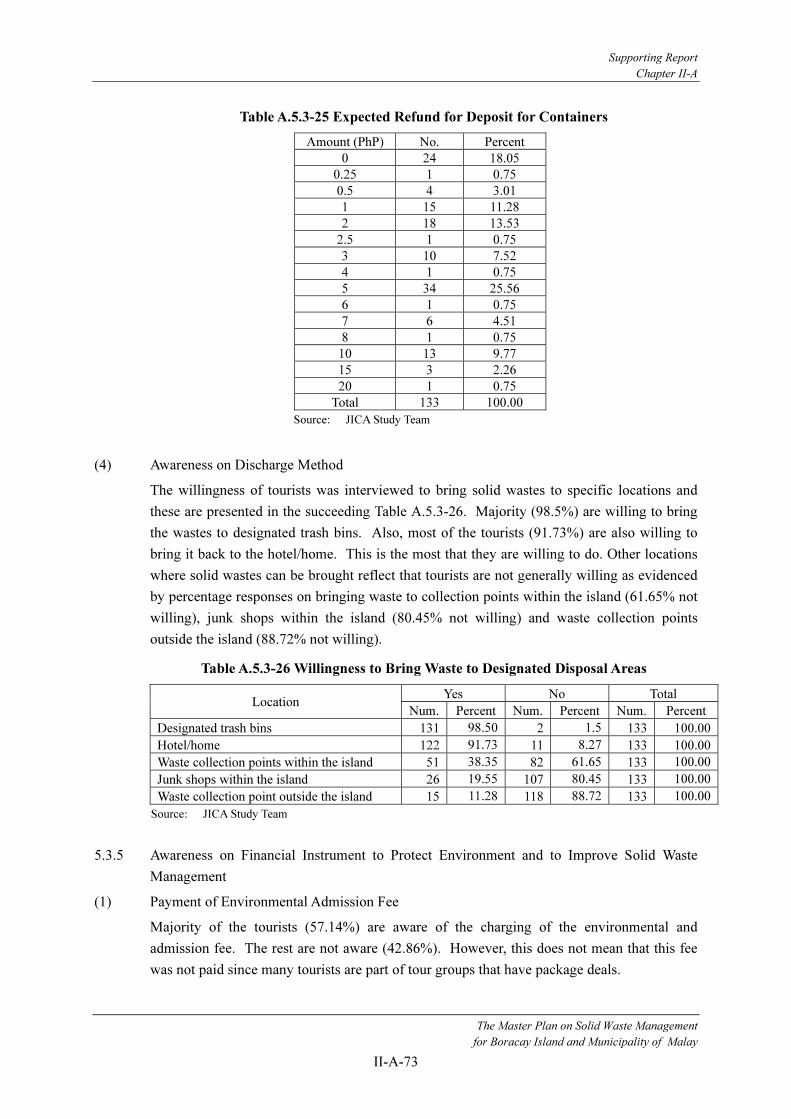
Supporting Report
Chapter II-A
The Master Plan on Solid Waste Management
for Boracay Island and Municipality of Malay
II-A-73
Table A.5.3-25 Expected Refund for Deposit for Containers
Amount (PhP) No. Percent
0 24 18.05
0.25 1 0.75
0.5 4 3.01
1 15 11.28
2 18 13.53
2.5 1 0.75
3 10 7.52
4 1 0.75
5 34 25.56
6 1 0.75
7 6 4.51
8 1 0.75
10 13 9.77
15 3 2.26
20 1 0.75
Total 133 100.00
Source: JICA Study Team
(4) Awareness on Discharge Method
The willingness of tourists was interviewed to bring solid wastes to specific locations and
these are presented in the succeeding Table A.5.3-26. Majority (98.5%) are willing to bring
the wastes to designated trash bins. Also, most of the tourists (91.73%) are also willing to
bring it back to the hotel/home. This is the most that they are willing to do. Other locations
where solid wastes can be brought reflect that tourists are not generally willing as evidenced
by percentage responses on bringing waste to collection points within the island (61.65% not
willing), junk shops within the island (80.45% not willing) and waste collection points
outside the island (88.72% not willing).
Table A.5.3-26 Willingness to Bring Waste to Designated Disposal Areas
Yes No Total Location
Num. Percent Num. Percent Num. Percent
Designated trash bins 131 98.50 2 1.5 133 100.00
Hotel/home 122 91.73 11 8.27 133 100.00
Waste collection points within the island 51 38.35 82 61.65 133 100.00
Junk shops within the island 26 19.55 107 80.45 133 100.00
Waste collection point outside the island 15 11.28 118 88.72 133 100.00
Source: JICA Study Team
5.3.5 Awareness on Financial Instrument to Protect Environment and to Improve Solid Waste
Management
(1) Payment of Environmental Admission Fee
Majority of the tourists (57.14%) are aware of the charging of the environmental and
admission fee. The rest are not aware (42.86%). However, this does not mean that this fee
was not paid since many tourists are part of tour groups that have package deals.

Supporting Report
Chapter II-A
The Master Plan on Solid Waste Management
for Boracay Island and Municipality of Malay
II-A-74
Table A.5.3-27 Awareness on Charging of Environmental and Admission Fee
Awareness No. Percent
Aware 76 57.14
Not Aware 57 42.86
Total 133 100.00
Source: JICA Study Team
Of the tourists that are aware of the environmental and admission fee, only 48.12% know the
amount that was paid. Majority (51.88%) was aware of the fee but did not know the amount
as shown in Table A.5.3-28.
Table A.5.3-28 Awareness on Amount of Environmental and Admission Fee
Awareness No. Percent
Aware 64 48.12
Not Aware 69 51.88
Total 133 100.00
Source: JICA Study Team
Tourists that were aware of the environmental and admission fee and the amount comprise
about half (50.38%) while the rest (49.62%) do not know the amount.
Table A.5.3-29 Number of Tourists that are Aware of P50.00 Amount
Awareness No. Percent
Aware 67 50.38
Not Aware 66 49.62
Total 133 100.00
Source: JICA Study Team
With regard to the opinion of respondents on the amount the environmental and admission
fee of PhP50, majority (72.18%) indicated that the amount is suitable while 18.8% think that
the fee is too much. On the other hand, some 3.01% said that it is too small. The rest
(6.02%) do not have a view.
Table A.5.3-30 Opinion on P50.00 Environmental and Admission Fee
Opinion No. Percent
I think it is suitable 96 72.18
I think it is too much 25 18.80
I think it is too small 4 3.01
I have no view 8 6.02
Total 133 100.00
Source: JICA Study Team
Of those that responded that the fee is too much, some 44% indicated that the appropriate fee
should be PhP20 followed by those that indicated PhP30 (20%). The rest mentioned varying
amounts based on their preference as shown in Table A.5.3-31.
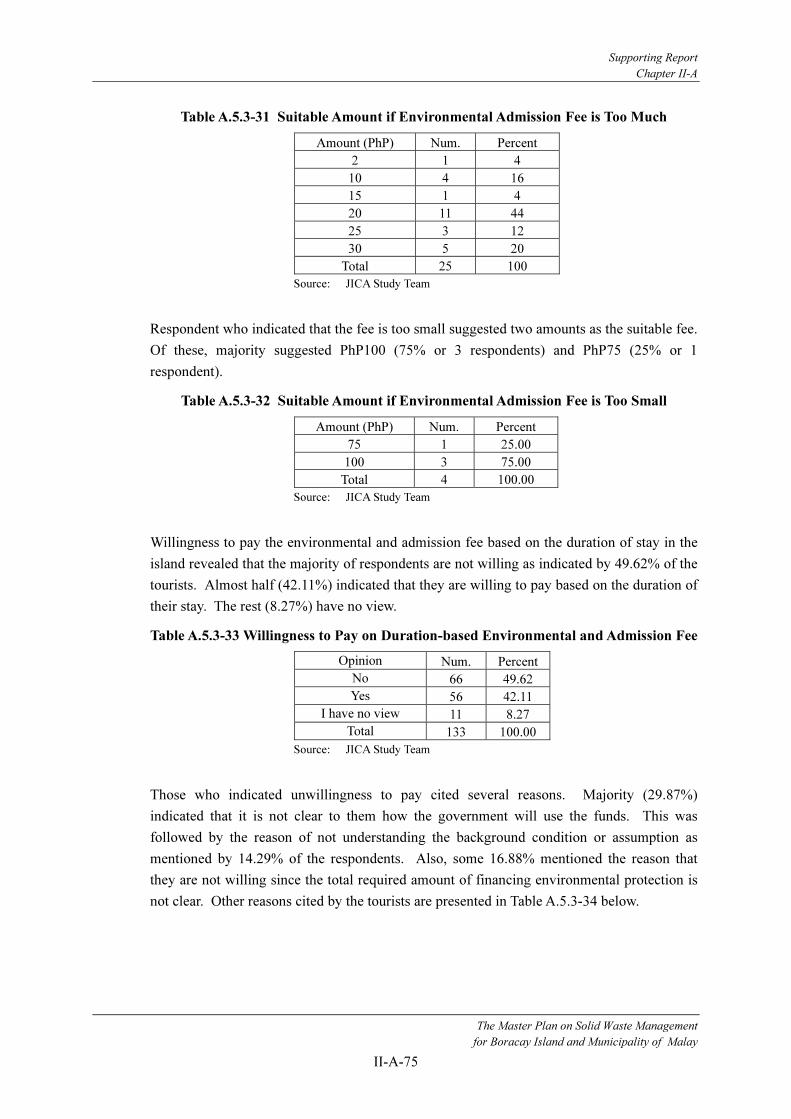
Supporting Report
Chapter II-A
The Master Plan on Solid Waste Management
for Boracay Island and Municipality of Malay
II-A-75
Table A.5.3-31 Suitable Amount if Environmental Admission Fee is Too Much
Amount (PhP) Num. Percent
2 1 4
10 4 16
15 1 4
20 11 44
25 3 12
30 5 20
Total 25 100
Source: JICA Study Team
Respondent who indicated that the fee is too small suggested two amounts as the suitable fee.
Of these, majority suggested PhP100 (75% or 3 respondents) and PhP75 (25% or 1
respondent).
Table A.5.3-32 Suitable Amount if Environmental Admission Fee is Too Small
Amount (PhP) Num. Percent
75 1 25.00
100 3 75.00
Total 4 100.00
Source: JICA Study Team
Willingness to pay the environmental and admission fee based on the duration of stay in the
island revealed that the majority of respondents are not willing as indicated by 49.62% of the
tourists. Almost half (42.11%) indicated that they are willing to pay based on the duration of
their stay. The rest (8.27%) have no view.
Table A.5.3-33 Willingness to Pay on Duration-based Environmental and Admission Fee
Opinion Num. Percent
No 66 49.62
Yes 56 42.11
I have no view 11 8.27
Total 133 100.00
Source: JICA Study Team
Those who indicated unwillingness to pay cited several reasons. Majority (29.87%)
indicated that it is not clear to them how the government will use the funds. This was
followed by the reason of not understanding the background condition or assumption as
mentioned by 14.29% of the respondents. Also, some 16.88% mentioned the reason that
they are not willing since the total required amount of financing environmental protection is
not clear. Other reasons cited by the tourists are presented in Table A.5.3-34 below.

Supporting Report
Chapter II-A
The Master Plan on Solid Waste Management
for Boracay Island and Municipality of Malay
II-A-76
Table A.5.3-34 Reason Why Not Willing to Pay based on Duration of Stay
Reason No. Percent
I cannot afford 5 6.49
I don’t feel the value of protection of environment of Boracay Island 5 6.49
Total required amount of finance for environmental protection is not clear 13 16.88
I cannot understand the background condition or assumption 11 14.29
It is government’s responsibility to protect environment and budget for it 6 7.79
It is not clear how government will use the funds 23 29.87
Others (specify) 3 3.90
I have no view 11 14.29
Total 77 100.00
Source: JICA Study Team
(2) Payment Procedure
Those that are willing to pay based on the duration of stay cited the manner by which they
will pay the fee. Majority (53.37%) selected government collectors as currently practiced
followed by 23.21% of the tourists who choose to pay through the transport fares and
19.64% who choose to pay through the accommodation fee in the hotel. The rest (3.57%)
are willing to pay through the restaurants. None of the tourists are willing to pay through the
goods bought in the souvenir shop.
Table A.5.3-35 Manner of Payment for Environmental and Admission Fee
Manner of Payment Num. Percent
Through government collectors as currently practiced 30 53.57
Through transport fares 13 23.21
Through accommodation fee in hotel 11 19.64
Through charge for food or drink in restaurant 2 3.57
Through the goods in souvenir shop 0 -
Total 56 100.00
Source: JICA Study Team
(3) Opinion on Solid Waste Management
With regard to the opinion of the respondents on SWM, the most common comment is the
need to increase/improve trash bins around the island especially at the beach (31 responses).
This was the most common comment heard from the tourists during the interviews that were
conducted. An ocular survey of the beach confirmed the lack of very minimal trash bins on
the beach front. In the few places where there are trash bins, these are mostly the initiative
of the hotels or resorts that operate there. Although, the Municipality of Malay is very clear
on this (Section 2, Municipal Ordinance No. 84, S. 1995), compliance may be very minimal.
Hence, compliance should be strictly enforced.
This was followed by the suggestion to increase awareness on solid waste management (23
responses). There is very low awareness particularly on waste segregation as evidenced by
majority who said that they do not know the discharge method. This is a very critical step in
the solid waste management program of the municipality since the volume of tourists that
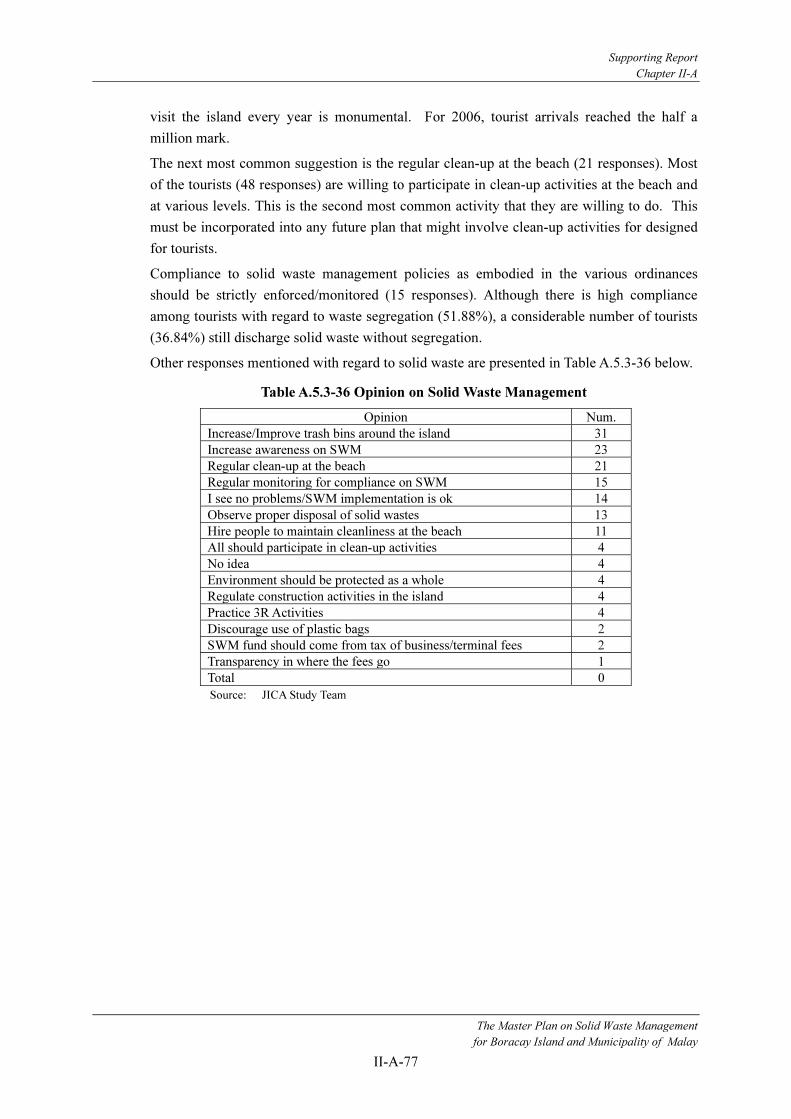
Supporting Report
Chapter II-A
The Master Plan on Solid Waste Management
for Boracay Island and Municipality of Malay
II-A-77
visit the island every year is monumental. For 2006, tourist arrivals reached the half a
million mark.
The next most common suggestion is the regular clean-up at the beach (21 responses). Most
of the tourists (48 responses) are willing to participate in clean-up activities at the beach and
at various levels. This is the second most common activity that they are willing to do. This
must be incorporated into any future plan that might involve clean-up activities for designed
for tourists.
Compliance to solid waste management policies as embodied in the various ordinances
should be strictly enforced/monitored (15 responses). Although there is high compliance
among tourists with regard to waste segregation (51.88%), a considerable number of tourists
(36.84%) still discharge solid waste without segregation.
Other responses mentioned with regard to solid waste are presented in Table A.5.3-36 below.
Table A.5.3-36 Opinion on Solid Waste Management
Opinion Num.
Increase/Improve trash bins around the island 31
Increase awareness on SWM 23
Regular clean-up at the beach 21
Regular monitoring for compliance on SWM 15
I see no problems/SWM implementation is ok 14
Observe proper disposal of solid wastes 13
Hire people to maintain cleanliness at the beach 11
All should participate in clean-up activities 4
No idea 4
Environment should be protected as a whole 4
Regulate construction activities in the island 4
Practice 3R Activities 4
Discourage use of plastic bags 2
SWM fund should come from tax of business/terminal fees 2
Transparency in where the fees go 1
Total 0
Source: JICA Study Team

Appendix

Questionnaire for Residents
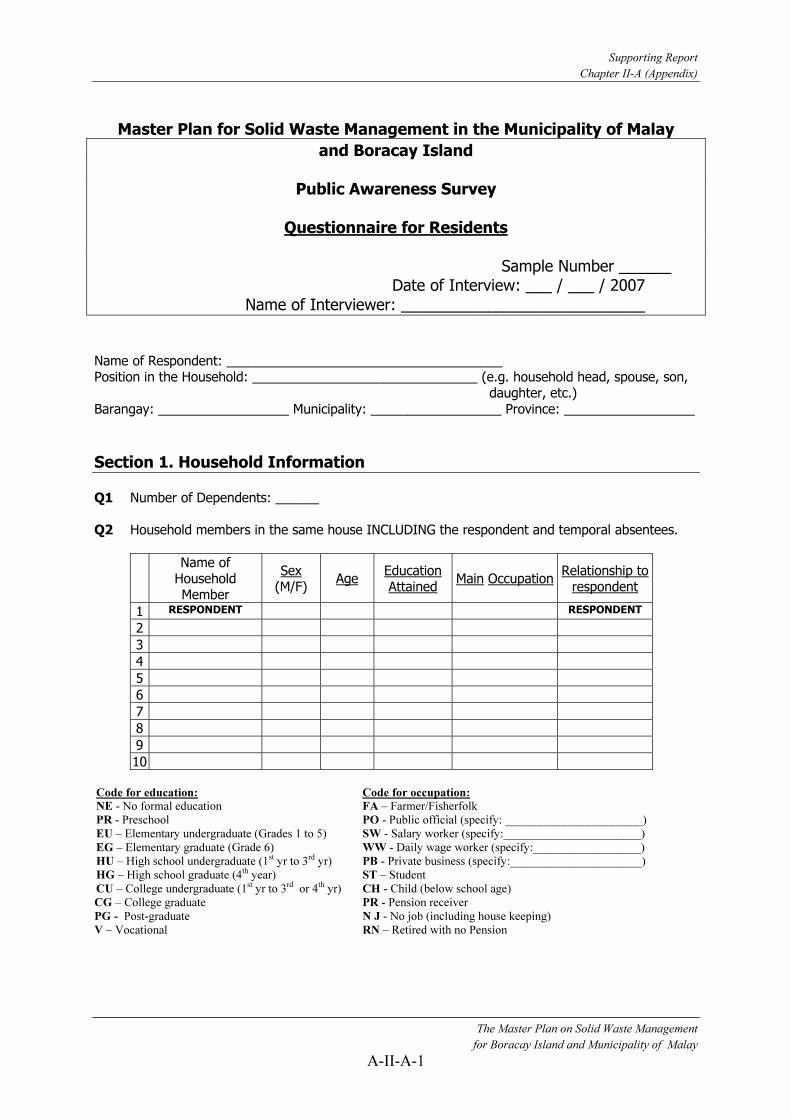
Supporting Report
Chapter II-A (Appendix)
The Master Plan on Solid Waste Management
for Boracay Island and Municipality of Malay
A-II-A-1
Master Plan for Solid Waste Management in the Municipality of Malay
and Boracay Island
Public Awareness Survey
Questionnaire for Residents
Sample Number ______ Date of Interview: ___ / ___ / 2007
Name of Interviewer: ____________________________
Name of Respondent: ______________________________________ Position in the Household: _______________________________ (e.g. household head, spouse, son,
daughter, etc.) Barangay: __________________ Municipality: __________________ Province: __________________
Section 1. Household Information Q1 Number of Dependents: ______ Q2 Household members in the same house INCLUDING the respondent and temporal absentees.
Name of
Household Member
Sex (M/F)
Age
Education Attained
Main OccupationRelationship to
respondent
1 RESPONDENT RESPONDENT
2
3
4
5
6
7
8
9
10 Code for education: Code for occupation:
NE - No formal education FA – Farmer/Fisherfolk
PR - Preschool PO - Public official (specify: _______________________)
EU – Elementary undergraduate (Grades 1 to 5) SW - Salary worker (specify:_______________________)
EG – Elementary graduate (Grade 6) WW - Daily wage worker (specify:__________________)
HU – High school undergraduate (1st yr to 3rd yr) PB - Private business (specify:______________________)
HG – High school graduate (4th year) ST – Student
CU – College undergraduate (1st yr to 3rd or 4th yr) CH - Child (below school age)
CG – College graduate PR - Pension receiver
PG - Post-graduate N J - No job (including house keeping)
V – Vocational
RN – Retired with no Pension

Supporting Report
Chapter II-A (Appendix)
The Master Plan on Solid Waste Management
for Boracay Island and Municipality of Malay
A-II-A-2
Q3 Major income sources of the household (Please indicate the annual income for each source, and then give us your order of importance: 1, 2, 3...)
Income Source Items
Annual Income (Peso)
(A)
Importance (B)
1. Selling agricultural & fisheries products
(specify: _ )
2. Salary & wage from permanent job (specify: )
3. Remittance from family member (specify: _ )
4. Private business (specify: _____ )
5. Others (specify: )
Q4 Total annual household income
A. Agricultural & fisheries income (1)
Peso / year
B. Other income (2+3+4+5)
Peso / year
Total Income [A + B here in Q4 ]
Peso
/
year
Q5 Housing Materials
1 Light-made materials (e.g., bamboo and nipa) 2 Hardwood-made
3 Semi-concrete made (combination of wood and concrete) 4 Concrete-made
5 Others (specify): Q6 Ownership of the land where your house is built
1 Owned 2 Rented 3 Rent-free occupant
Q7 Ownership of the house
1 Owned 2 Rented 3 Rent-free occupant
Q8 Total floor area of the house: ________square meters Q9 Total area of the yard/garden: ________square meters Q10 What are the major sources of information in your household? (Multiple answers
allowed) 1 Television 5 Government Announcements 2 Radio 6 NGOs / CBOs 3 Newspapers/Magazines 7 Neighbors 4 Pamphlets/Posters 8 Others (specify_____________)

Supporting Report
Chapter II-A (Appendix)
The Master Plan on Solid Waste Management
for Boracay Island and Municipality of Malay
A-II-A-3
Section 2. Environment and Solid Waste Concerns Q11 What do you think of the cleanliness in your house and surrounding area?
1 I don’t think that it is so clean. 2 I think that it is clean but not enough to be proud of. 3 I think that it is too clean to be proud of. 4 I have no idea. Q12 Does your house and your surroundings have any problem caused by solid waste?
(Multiple answers allowed) 1 Littering wastes anywhere 2. Dumping of waste anywhere and not in designated collection points 3. Scattering trash in waste collection points 4. Offensive odor from surrounding waste treatment, disposal facility and collection points 5. Insects, pests, worms or animals proliferate due to scattering solid waste 6. Contamination or pollution of water or water sources by leachate from dumping site, other
solid waste treatment facilities and solid waste in street 7. Degradation of landscape due to solid waste treatment, disposal facility and solid waste on
roadside 8. Burning of municipal waste 9. Others (Specify ____________________________) 10. No, I don’t. Q13 How do you keep your house and surrounding environment clean? (Multiple
answers allowed)
1 Clean around my house only 2. Practice waste segregation 2 Discharge waste at the designated time and place 3 Participate in voluntary cleaning activities 4 Educate my family to keep house and surrounding clean 5 Others (Specify ____________________) 6 None
Section 3. Knowledge on Solid Waste Management and 3R activities (Reduce, Reuse, Recycle)
Q14 Are you aware of the Ordinance on Solid Waste Management of the Municipality of
Malay? 1 Yes 2 No 3 No Idea Are you aware of the following policies on solid waste management? Q15 Date/day of solid waste collection in your area? 1 Yes 2 No Q16 Time to discharge solid waste 1 Yes 2 No Q17 Place to discharge solid waste 1 Yes 2 No Q18 Category of segregation when solid waste is discharged 1 Yes 2 No Q19 Others (Specify ____________________________) 1 Yes 2 No
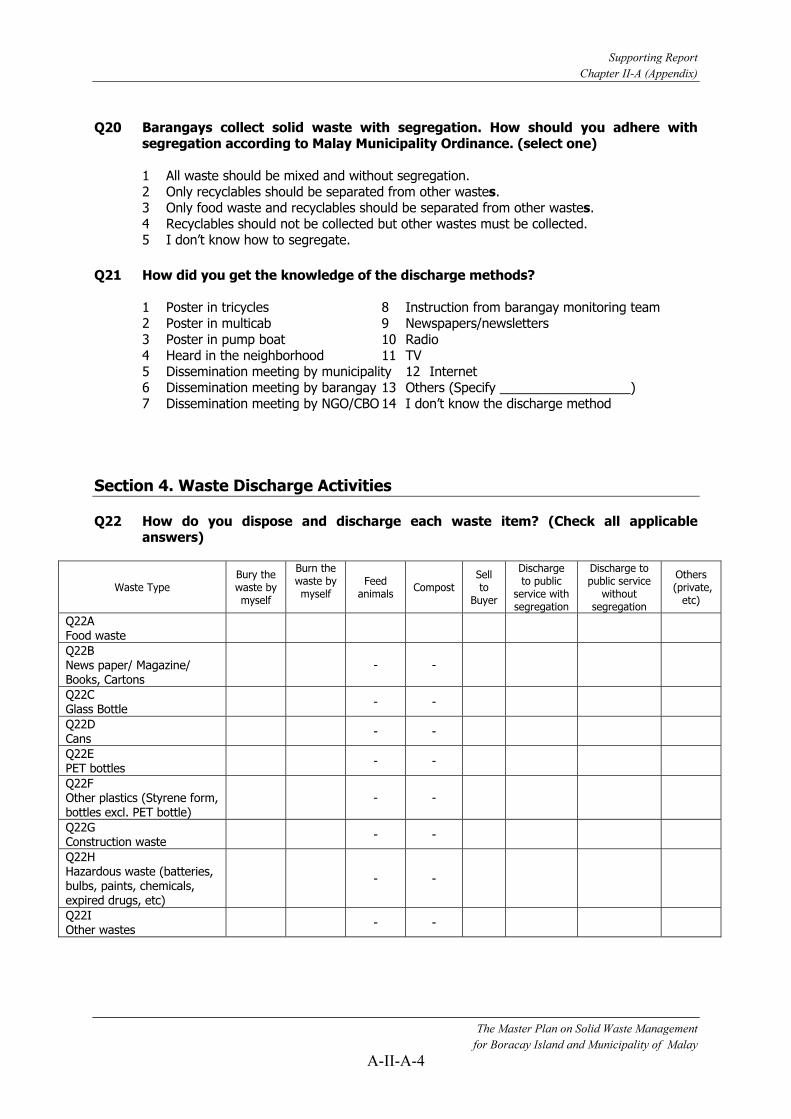
Supporting Report
Chapter II-A (Appendix)
The Master Plan on Solid Waste Management
for Boracay Island and Municipality of Malay
A-II-A-4
Q20 Barangays collect solid waste with segregation. How should you adhere with segregation according to Malay Municipality Ordinance. (select one)
1 All waste should be mixed and without segregation. 2 Only recyclables should be separated from other wastes. 3 Only food waste and recyclables should be separated from other wastes. 4 Recyclables should not be collected but other wastes must be collected. 5 I don’t know how to segregate.
Q21 How did you get the knowledge of the discharge methods? 1 Poster in tricycles 8 Instruction from barangay monitoring team 2 Poster in multicab 9 Newspapers/newsletters 3 Poster in pump boat 10 Radio 4 Heard in the neighborhood 11 TV 5 Dissemination meeting by municipality 12 Internet 6 Dissemination meeting by barangay 13 Others (Specify __________________) 7 Dissemination meeting by NGO/CBO 14 I don’t know the discharge method
Section 4. Waste Discharge Activities Q22 How do you dispose and discharge each waste item? (Check all applicable
answers)
Waste Type Bury the waste by myself
Burn the waste by myself
Feed animals
CompostSell to
Buyer
Discharge to public
service with segregation
Discharge to public service
without segregation
Others (private,
etc)
Q22A Food waste
Q22B News paper/ Magazine/ Books, Cartons
- -
Q22C Glass Bottle
- -
Q22D Cans
- -
Q22E PET bottles
- -
Q22F Other plastics (Styrene form, bottles excl. PET bottle)
- -
Q22G Construction waste
- -
Q22H Hazardous waste (batteries, bulbs, paints, chemicals, expired drugs, etc)
- -
Q22I Other wastes
- -

Supporting Report
Chapter II-A (Appendix)
The Master Plan on Solid Waste Management
for Boracay Island and Municipality of Malay
A-II-A-5
Q23 In case you of avail collection service, how frequently do you discharge solid waste? If you use for solid waste discharge, how do you pack solid waste to discharge with the plastic bag? (Show the sample garbage bags for reference in size used)
Waste Type Frequency of
discharge Number of bags to discharge waste
Size of the plastic bag
Small = __kg Medium = __kg Large = __kg
Price of the plastic bag
Food waste ______ Times/week ____ bags/time
[S] ___ Size/piece [M] ___ Size/piece [L] ___ Size/piece
_____ Peso/piece _____ Peso/piece _____ Peso/piece
Recyclables ______ Times/week ____ bags/time
[S] ___ Size/piece [M] ___ Size/piece [L] ___ Size/piece
_____ Peso/piece _____ Peso/piece _____ Peso/piece
Residual waste ______ Times/week ____ bags/time
[S] ___ Size/piece [M] ___ Size/piece [L] ___ Size/piece
_____ Peso/piece _____ Peso/piece _____ Peso/piece
Q24 Storage Capability and Discharge Methods
Waste Type
How many days can you keep the
waste in household?
How far from your household can you
discharge?
How much can you pay for the plastic bag for waste discharge monthly?
Food waste days meters
Recyclables days meters
Residual waste days meters
__________ Peso/month
Q25 How much do you implement following 3R activities (Reduce, Re-Use, Recycle)
waste in your house? (Check one in each activity)
3R Activity Type I don’t do it at
all
I sometimes
do it
I often do it (sometimes don’t do it)
I do it every time
25a Reduce kitchen waste in cooking process as much as possible.
25b Repair and Reuse it when something is broken.
25c I bring my own bag to reduce waste when I go shopping.
25d I use kitchen waste (peelings, etc. to feed animals/pets
25e I use kitchen waste to make compost
25f I segregate recyclables and sell to buyer
Section 5. Opinion of Current Public Collection Service Q26 Are you satisfied with current public collection service? (Select one) 1 I am very satisfied. � proceed to Q27a
2 I am a little satisfied � proceed to Q27a
3 I am not satisfied at all � proceed to Q27b

Supporting Report
Chapter II-A (Appendix)
The Master Plan on Solid Waste Management
for Boracay Island and Municipality of Malay
A-II-A-6
4 No opinion � proceed to Q28
Q27a What aspect are you satisfied with? (To be answered by respondent that selected 1 or 2 in “Q26”) (Encircle appropriate answers)
1 Collection time is done on schedule. 2 Collection frequency is often. 3 Segregation at our house is actively done. 4 It is easy to understand what item should be separated. 5 Instruction for source separation is not that strict and easy to comply. 6 Others (Specify ________________________)
Q27b What aspect are you not satisfied with? (To be answered by respondent that
selected 3 in “Q26”) (Encircle appropriate answers)
1 Collection time is too early to discharge waste. 2 Collection frequency is few. 3 Segregation at our house is an additional burden and too laborious for us. 4 It is not easy to understand what item should be separated. 5 Instruction for source separation is very strict. 6 Others (Specify ________________________)
Q28 Please give your honest opinion for each system in the current public collection
service of waste (To be answered by all respondents). 28a Time to be discharged (collection time)
1 Keep it as is 2 Change the schedule to ( ___:___ ) 28b Food Waste Collection Frequency 1 Keep it as is 2 Increase collection frequency to ( ___ times / week) 3 Reduce the collection frequency ( ___ times / week) 28c Recyclables Collection Frequency 1 Keep it as is 2 Increase collection frequency to ( ___ times / week) 3 Reduce the collection frequency ( ___ times / week) 28d Residual Wastes Collection Frequency 1 Keep it as is 2 Increase collection frequency to ( ___ times / week) 3 Reduce the collection frequency ( ___ times / week)
28e Number of Source Separation Categories (Food Waste, Recyclables and
Residual Wastes) 1 Keep it as is 2 Reduce it. What category should be removed and combined with another
category? (specify combination: _______________________________________________)
3 Increase it. How many categories are acceptable? ______ categories
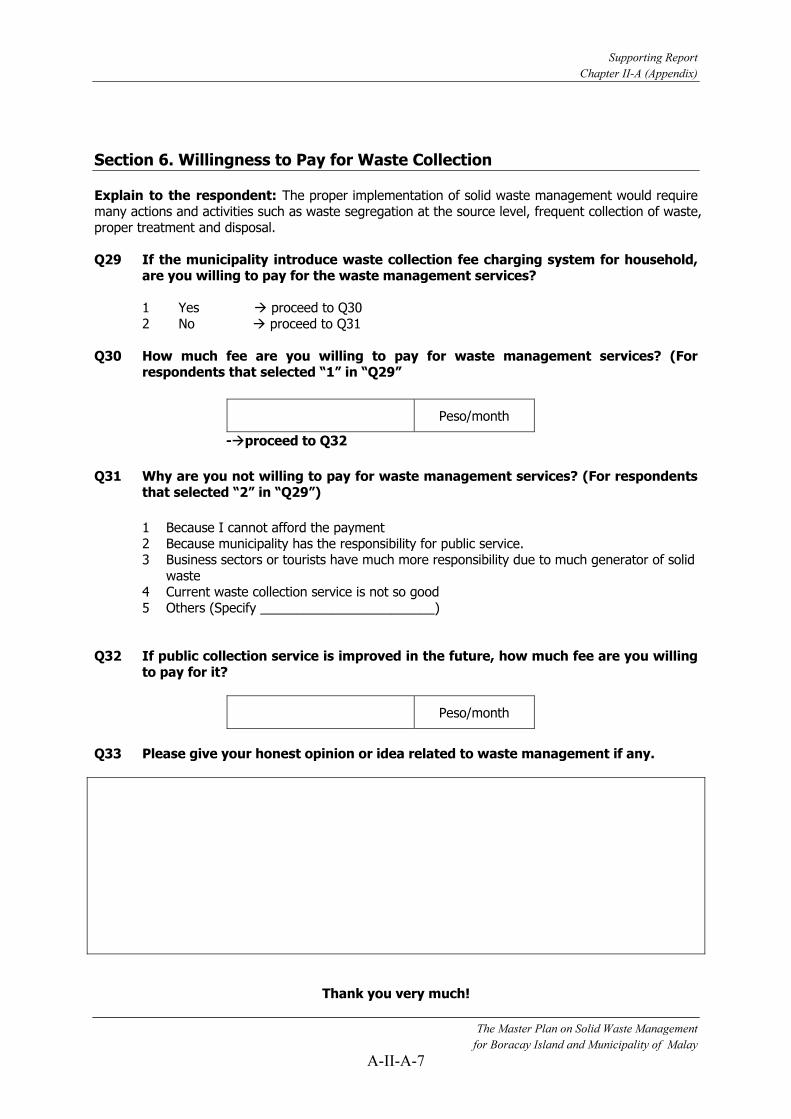
Supporting Report
Chapter II-A (Appendix)
The Master Plan on Solid Waste Management
for Boracay Island and Municipality of Malay
A-II-A-7
Section 6. Willingness to Pay for Waste Collection Explain to the respondent: The proper implementation of solid waste management would require many actions and activities such as waste segregation at the source level, frequent collection of waste, proper treatment and disposal. Q29 If the municipality introduce waste collection fee charging system for household,
are you willing to pay for the waste management services? 1 Yes � proceed to Q30 2 No � proceed to Q31 Q30 How much fee are you willing to pay for waste management services? (For
respondents that selected “1” in “Q29”
Peso/month
-�proceed to Q32
Q31 Why are you not willing to pay for waste management services? (For respondents
that selected “2” in “Q29”)
1 Because I cannot afford the payment 2 Because municipality has the responsibility for public service. 3 Business sectors or tourists have much more responsibility due to much generator of solid
waste 4 Current waste collection service is not so good 5 Others (Specify ________________________) Q32 If public collection service is improved in the future, how much fee are you willing
to pay for it?
Peso/month
Q33 Please give your honest opinion or idea related to waste management if any.
Thank you very much!

Questionnaire for Business Establishments

Supporting Report
Chapter II-A (Appendix)
The Master Plan on Solid Waste Management
for Boracay Island and Municipality of Malay
A-II-A-8
Master Plan for Solid Waste Management in the Municipality of Malay
and Boracay Island
Public Awareness Survey
Questionnaire for Business Establishment
Sample Number ______
Date of Interview: ___ / ___ / 2007
Name of Interviewer: ____________________________
Section 1. General Information
Q1 Name of Business Establishment
Q2 Barangay
Q3 Municipality
Q4
Address
Province
Q5 Telephone Q6 Fax Q7
Contact Information
Q8
Establishment Type 1 Hotel 2 Restaurant 3 Hotel and Restaurant 4 Small Shop (food, daily sundries, souvenirs) 5 Public Facility 6 Others (Specify ______________________)
Q9 Year Established Q10 Number of Employees Q11 Total Floor Area (m2)
Q12 Annual Turnover / Gross Income (PHP)
Q13 Estimated Capital (PHP)
Q14 Number of Guest Rooms (hotels and accommodation establishment)
Q15 Occupancy Rate a. Peak Season : _____ % b. Off Season : _____ %
Q16 Number of Tables (restaurants and eating/drinking places
Section 2. Respondent Information
Q17 Name
Q18
Position 1 Manager 4 Technical staff 2 Deputy manager 5 Other permanent staff( Specify______________) 3 Section manager
Q19 Sex 1 Female 2 Male
Q20 Age 1 Less than 20 3 40-59 year-old
2 20-39 year-old 4 More than 60 year-old

Supporting Report
Chapter II-A (Appendix)
The Master Plan on Solid Waste Management
for Boracay Island and Municipality of Malay
A-II-A-9
Section 3. Environment and Solid Waste Concerns
Q21 What do you think of the cleanliness in your business establishment? (Select one)
1 I don’t think that it is so clean.
2 I think that it is clean but not enough to be proud of.
3 I think that it is very clean and something to be proud of.
4 I have no view.
Q22 What does your business do to keep your surrounding environment clean? (Select any)
1 Clean around our business establishment only
2 Segregate solid waste
3 Participate in voluntary clean-up activities
4 Train / Teach our staff to maintain cleanliness
5 Other activities (Specify ____________________________)
6 None
Q23 Does your business establishment have any problem caused by solid waste? (Select any)
1 Indiscriminate throwing of solid waste anywhere
2 Scattering waste in waste collection points
3 Foul odor from surrounding waste treatment and disposal facility
4 Insect, pest, worms or animal proliferation due to scattering solid waste
5 Contamination or pollution of water or water source by leachate from dumping site or other solid
waste treatment facilities
6 Degradation of landscape due to solid waste treatment and disposal facility
7 Others (Specify ____________________________)
8 None
Section 4. Knowledge Regarding Solid Waste Management and 3R activities (Reduce,
Reuse, Recycle)
Q24 Does your business establishment encounter problems in the public waste collection service (Encircle
one)?
1 Yes 2 No 3 No Idea Are you aware of the following policies on solid waste management?
Q25 Date/day of solid waste collection in your area? 1 Yes 2 No
Q26 Time to discharge solid waste 1 Yes 2 No
Q27 Place to discharge solid waste 1 Yes 2 No
Q28 Classification of segregated solid wastes upon discharge 1 Yes 2 No
Q29 Others (Specify ____________________________) 1 Yes 2 No

Supporting Report
Chapter II-A (Appendix)
The Master Plan on Solid Waste Management
for Boracay Island and Municipality of Malay
A-II-A-10
Q30 Sources of Information on Solid Waste Management (Encircle all applicable answers)
1 Television 5 Government Announcements
2 Radio 6 NGOs / CBOs
3 Newspapers/Magazines 7 Neighbors
4 Pamphlets/Posters 8 Others (specify_____________)
Q31 Each Barangay collects solid waste with segregation. How should your business establishment adhere with segregation according to Malay Municipality ordinance (select one)
1 All waste should be mixed and without segregation.
2 Only food waste should be separated and discharged from other waste.
3 Only recyclables should be separated from other waste.
4 Only food waste and recyclables should be separated from other waste.
5 Recyclables should not be collected but other waste must be collected.
6 I don’t know how to segregate.
Section 5. Waste Discharge Activities
Q32 How does your business establishment dispose and discharge each waste item? (Check all applicable
answers)
Waste Type
Bury the
solid waste
by myself
Burn the
solid waste
by myself
Feed to animal
CompostSell to Buyer
Discharge (Public
service w/ separation
Discharge (Public
service w/o separation
Others (specify)
Q32A
Food waste
Q32B
News paper/ Magazine/ Books, Kartons
- -
Q32C
Glass Bottle
- -
Q32D
Cans
- -
Q32E
PET bottles
- -
Q32F
Other plastics (Styrene form, bottles excl. PET bottle)
- -
Q32G Construction waste - - Q32H
Hazardous Waste (batteries, bulbs, paints, chemicals, expired drugs, etc)
- -
Q32I
Other wastes (specify)
- -

Supporting Report
Chapter II-A (Appendix)
The Master Plan on Solid Waste Management
for Boracay Island and Municipality of Malay
A-II-A-11
Q33 In case of your business establishment utilizes public waste collection service how many times do
your business establishment discharge solid waste? If your business establishment use plastic for
solid waste discharge, how does your business establishment pack solid waste to discharge with
the plastic bag? (Show the sample garbage bags for reference in size used)
Waste Type Frequency of
discharge
Number of bags to discharge
waste
Size of the plastic bag Small = __kg Medium = __kg Large = __kg
Price of the plastic bag
Food waste ____ Times/week ____ Bags/time
[S] _____ Size/piece [M] _____ Size/piece [L] _____ Size/piece
____ Peso/piece____ Peso/piece____ Peso/piece
Recyclables ____ Times/week ____ Bags/time
[S] _____ Size/piece [M] _____ Size/piece [L] _____ Size/piece
____ Peso/piece____ Peso/piece____ Peso/piece
Residual waste ____ Times/week ____ Bags/time
[S] _____ Size/piece [M] _____ Size/piece [L] _____ Size/piece
____ Peso/piece____ Peso/piece____ Peso/piece
Q34 Storage Capability and Discharge Method
Waste Type How many days can you keep the waste in your
area?
How far from your area can you carry waste to discharge?
How much can you pay for the plastic
bags/container for waste discharge monthly
Food waste days meters
Recyclables days meters
Residual waste days meters
__________Peso/month
Q35 How much does your business establishment implement following 3R activities (Reduce, Re-use,
Recycle) for waste? (Check one in each activity)
3R Activity Type Don’t do it
at all Sometimes
do it
Often do it (sometimes don’t do it)
All the time
Q34a Our staff reduce kitchen waste in cooking process as much as possible.
Q34b Our staff use kitchen waste to feed animals/pets.
Q34c Our staff use kitchen waste to make compost
Q34d Our business fixes/repairs broken things and reuses them.
Section 6. Opinion of Current Public Collection Service Q36 Is your business establishment satisfied with current public collection service?
(Select one)
1 I am very satisfied. � proceed to Q37a
2 I am a little satisfied � proceed to Q37a
3 I am not satisfied at all � proceed to Q37b
4 No opinion � proceed to Q38

Supporting Report
Chapter II-A (Appendix)
The Master Plan on Solid Waste Management
for Boracay Island and Municipality of Malay
A-II-A-12
Q37a What aspect are you satisfied with? (To be answered by respondent that selected 1 or 2 in “Q36”)
(Encircle appropriate answers)
1 Collection time is done on schedule.
2 Collection frequency is often.
3 Segregation at source is actively done by our business establishment.
4 It is easy to understand what item should be separated.
5 Instruction for source separation is not that strict and easy to comply.
6 Others (Specify ________________________)
Q37b What aspect are you not satisfied with? (To be answered by respondent that selected 3 in “Q36)
(Encircle appropriate answers)
1 Collection time is too early to discharge waste.
2 Collection frequency is few.
3 Segregation at source is burdensome for our business establishment.
4 It is not easy to understand what item should be separated.
5 Instruction (or Compliance monitoring ) for source separation is very strict.
6 Others (Specify ________________________)
Q38 Please give your honest opinion for each system in the current public collection service of waste (To be answered by all respondents).
38a Time to be discharged (collection time)
1 Keep it as is
2 Change the schedule to ( ___:___ )
38b Food Waste Collection Frequency
1 Keep it as is
2 Increase collection frequency to ( ___ times / week)
3 Reduce the collection frequency ( ___ times / week)
38c Recyclables Collection Frequency
1 Keep it as is
2 Increase collection frequency to ( ___ times / week)
3 Reduce the collection frequency ( ___ times / week)
38d Residual Wastes Collection Frequency
1 Keep it as is
2 Increase collection frequency to ( ___ times / week)
3 Reduce the collection frequency ( ___ times / week)
38e Number of Source Segregation Categories (Biodegradable Waste, Recyclables and
Residual Wastes)
1 Keep it as is
2 Reduce it. What category should be removed and combined with another category?
(specify combination: ____________________________________ )
3 Increase it. How many categories are acceptable? ______ categories
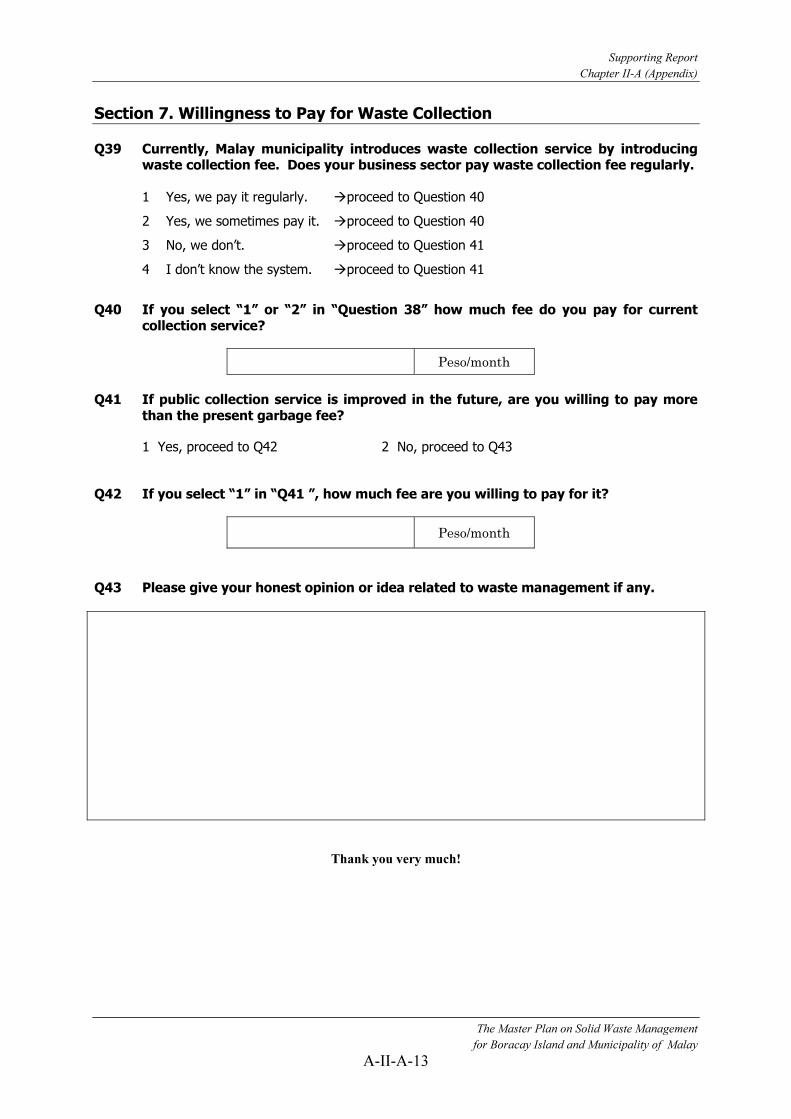
Supporting Report
Chapter II-A (Appendix)
The Master Plan on Solid Waste Management
for Boracay Island and Municipality of Malay
A-II-A-13
Section 7. Willingness to Pay for Waste Collection Q39 Currently, Malay municipality introduces waste collection service by introducing
waste collection fee. Does your business sector pay waste collection fee regularly.
1 Yes, we pay it regularly. �proceed to Question 40
2 Yes, we sometimes pay it. �proceed to Question 40
3 No, we don’t. �proceed to Question 41
4 I don’t know the system. �proceed to Question 41
Q40 If you select “1” or “2” in “Question 38” how much fee do you pay for current
collection service?
Peso/month
Q41 If public collection service is improved in the future, are you willing to pay more
than the present garbage fee?
1 Yes, proceed to Q42 2 No, proceed to Q43
Q42 If you select “1” in “Q41 ”, how much fee are you willing to pay for it?
Peso/month
Q43 Please give your honest opinion or idea related to waste management if any.
Thank you very much!
Questionnaire for Tourists
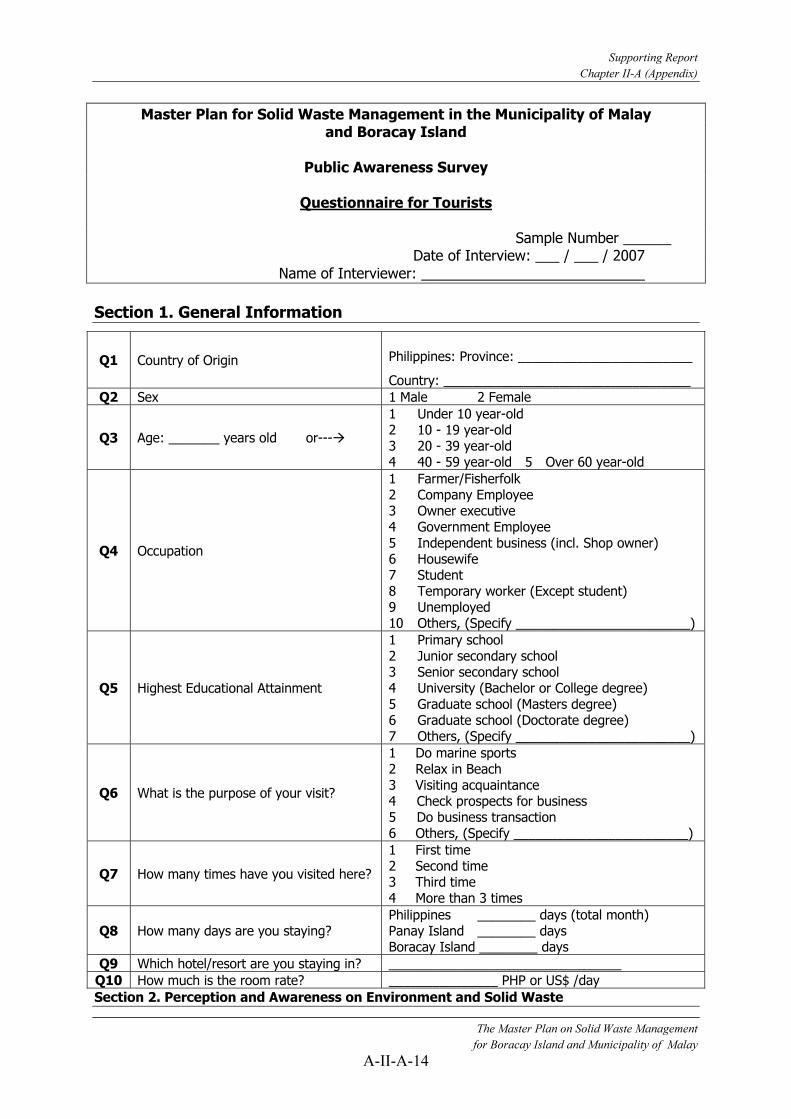
Supporting Report
Chapter II-A (Appendix)
The Master Plan on Solid Waste Management
for Boracay Island and Municipality of Malay
A-II-A-14
Master Plan for Solid Waste Management in the Municipality of Malay and Boracay Island
Public Awareness Survey
Questionnaire for Tourists
Sample Number ______ Date of Interview: ___ / ___ / 2007
Name of Interviewer: ____________________________
Section 1. General Information
Q1 Country of Origin
Philippines: Province: ________________________
Country: __________________________________
Q2 Sex 1 Male 2 Female
Q3 Age: _______ years old or---�
1 Under 10 year-old 2 10 - 19 year-old 3 20 - 39 year-old 4 40 - 59 year-old 5 Over 60 year-old
Q4 Occupation
1 Farmer/Fisherfolk 2 Company Employee 3 Owner executive 4 Government Employee 5 Independent business (incl. Shop owner) 6 Housewife 7 Student 8 Temporary worker (Except student) 9 Unemployed 10 Others, (Specify ________________________)
Q5 Highest Educational Attainment
1 Primary school 2 Junior secondary school 3 Senior secondary school 4 University (Bachelor or College degree) 5 Graduate school (Masters degree) 6 Graduate school (Doctorate degree) 7 Others, (Specify ________________________)
Q6 What is the purpose of your visit?
1 Do marine sports 2 Relax in Beach 3 Visiting acquaintance 4 Check prospects for business 5 Do business transaction 6 Others, (Specify ________________________)
Q7 How many times have you visited here?
1 First time 2 Second time 3 Third time 4 More than 3 times
Q8 How many days are you staying? Philippines ________ days (total month) Panay Island ________ days Boracay Island ________ days
Q9 Which hotel/resort are you staying in? ________________________________
Q10 How much is the room rate? _______________ PHP or US$ /day
Section 2. Perception and Awareness on Environment and Solid Waste

Supporting Report
Chapter II-A (Appendix)
The Master Plan on Solid Waste Management
for Boracay Island and Municipality of Malay
A-II-A-15
Q11 What do you think about the cleanliness of Boracay Island compared to your
expectation? (Encircle one)
1 I don’t think it is clean. 2 I think it is clean. 3 I have no view.
Q12 Do you think that tourists should keep the environment clean for the future of
Boracay Island? (Encircle one)
1 Yes 2 No 3 No Opinion
Q13 What kind of activities are you willing to do to keep the environment clean now
and in the future? (Multiple answers allowed)
1 Tourists should participate in waste reduction program
2 Tourists should participate in cleaning activities in various levels
3 Tourists should reduce solid waste generation
4 Tourists should bring back their waste to main island
5 Tourists should pay a fee for the beautification of the island and improvement of Solid
Waste Management services
6 None
7 Others, Specify (_________________________)
8 I have no view.
Section 3. Awareness and Opinion on Solid Waste Discharge
Q14 Are you aware that there is a way of waste segregation and discharge in the island
& Malay? If so, how did you become aware of it? (Encircle one)
1 By looking at the poster in tricycles 7 By watching it on cable TV
2 By looking at the poster in multicab 8 By listening to the radio
3 By looking at the poster in pump boat 9 Informed by hotel/resort staff
4 By looking at the notice/label on trash bins 10 Others (Specify_____________)
5 By looking inside the trash bins 11 I don’t know the discharge method
6 By reading local newspapers/newsletters
Q15 How do you discharge solid waste here? (Encircle one)
1 Put the solid waste into trash bins without segregation
2 Put the solid waste into trash bin with segregation
3 Others (specify: __________________________)
4 I don’t know the discharge method.
Q16 Do you think there are some points to be improved about solid waste discharge
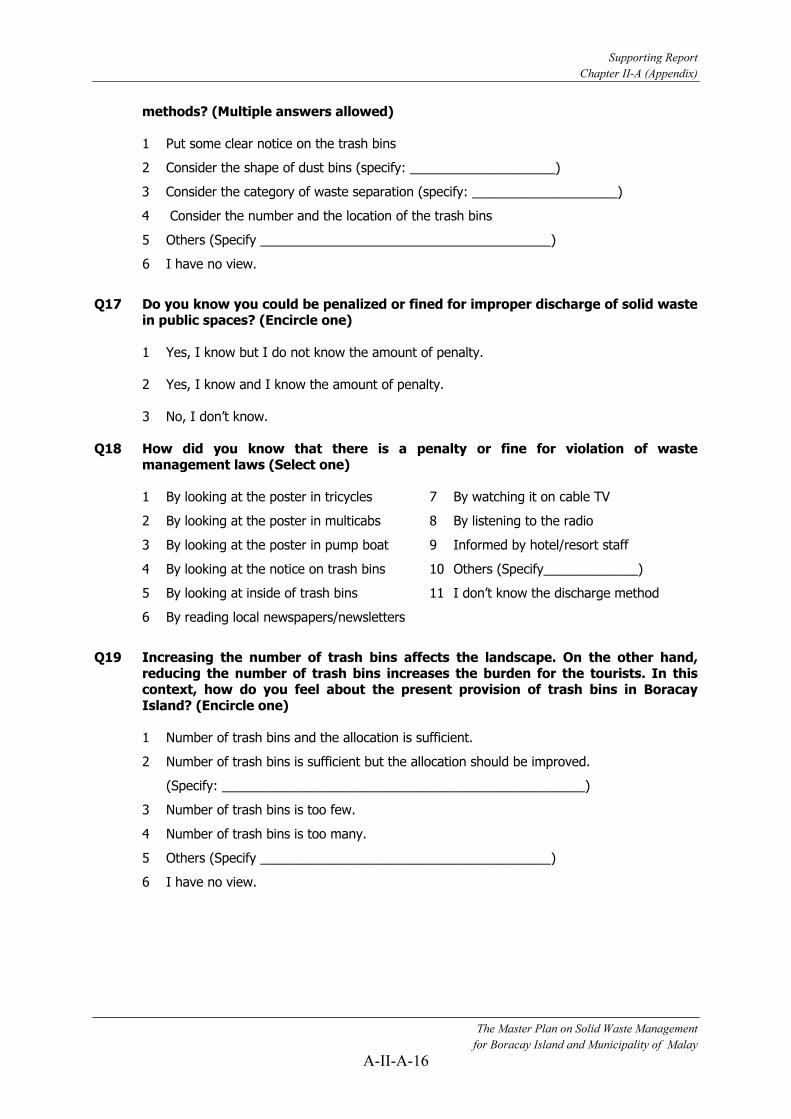
Supporting Report
Chapter II-A (Appendix)
The Master Plan on Solid Waste Management
for Boracay Island and Municipality of Malay
A-II-A-16
methods? (Multiple answers allowed)
1 Put some clear notice on the trash bins
2 Consider the shape of dust bins (specify: ____________________)
3 Consider the category of waste separation (specify: ____________________)
4 Consider the number and the location of the trash bins
5 Others (Specify ________________________________________)
6 I have no view.
Q17 Do you know you could be penalized or fined for improper discharge of solid waste
in public spaces? (Encircle one)
1 Yes, I know but I do not know the amount of penalty. 2 Yes, I know and I know the amount of penalty. 3 No, I don’t know.
Q18 How did you know that there is a penalty or fine for violation of waste
management laws (Select one)
1 By looking at the poster in tricycles 7 By watching it on cable TV
2 By looking at the poster in multicabs 8 By listening to the radio
3 By looking at the poster in pump boat 9 Informed by hotel/resort staff
4 By looking at the notice on trash bins 10 Others (Specify_____________)
5 By looking at inside of trash bins 11 I don’t know the discharge method
6 By reading local newspapers/newsletters
Q19 Increasing the number of trash bins affects the landscape. On the other hand,
reducing the number of trash bins increases the burden for the tourists. In this context, how do you feel about the present provision of trash bins in Boracay Island? (Encircle one)
1 Number of trash bins and the allocation is sufficient.
2 Number of trash bins is sufficient but the allocation should be improved.
(Specify: __________________________________________________)
3 Number of trash bins is too few.
4 Number of trash bins is too many.
5 Others (Specify ________________________________________)
6 I have no view.

Supporting Report
Chapter II-A (Appendix)
The Master Plan on Solid Waste Management
for Boracay Island and Municipality of Malay
A-II-A-17
Section 4. Knowledge on Solid Waste Management and 3R activities
(Reduce, Reuse, Recycle) Q20 What kind of waste reduction and reuse activities will you be willing to
practice/adopt? (Multiple answers allowed)
1 Bringing your own shopping bag to avoid or reduce packaging waste.
2 Introduction of refund system for returnable bottles/containers.
3 Practice segregation during waste discharge.
4 Bringing the waste generated here to a place outside the island.
5 Others (Specify ________________________________________)
6 None
7 I have no view.
Q21 If stores start selling the plastic bag for packing the goods you buy instead of
getting it for free, how much will you be willing to pay?
Peso/bag
Q22 If actual price of the plastic bag is more than the price of “Q19”, what will you do?
(Encircle one)
1 I will bring my own shopping bag.
2 I will pay actual prices of “Q19” with my acceptance.
3 I will stop buying the goods.
4 Others (Specify ________________________________________)
5 I have no view.
Q23 If there is a deposit/refund imposed on containers (e.g. glass bottles, aluminum
cans, plastic bottles and cans), what would you do? (Encircle one)
1 Throw all the time.
2 Sometimes throw in trash bin and sometimes return containers to the shops/stores.
3 Sometimes throw in trash bin but more often return containers to the shops/stores.
4 Always return containers to the shops/stores
5 Others (Specify ________________________________________)
6 I have no view.
Q24 How much do you expect if you return the empty container?
Peso/container
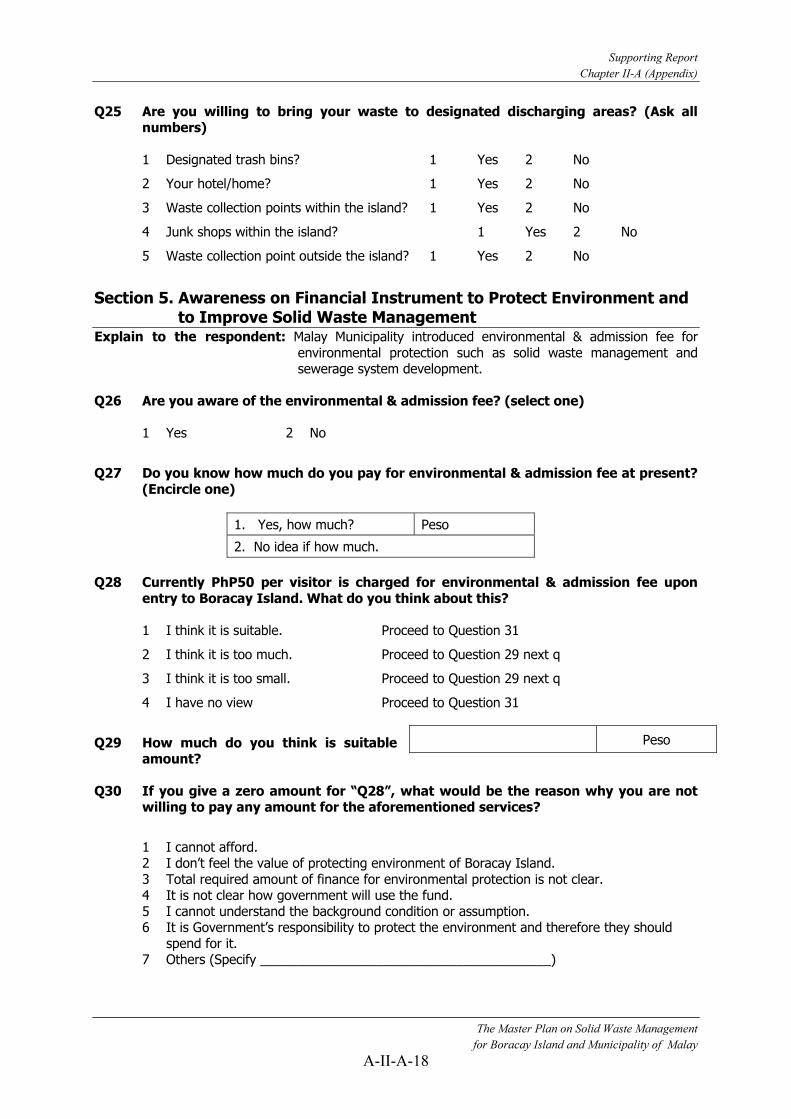
Supporting Report
Chapter II-A (Appendix)
The Master Plan on Solid Waste Management
for Boracay Island and Municipality of Malay
A-II-A-18
Q25 Are you willing to bring your waste to designated discharging areas? (Ask all numbers)
1 Designated trash bins? 1 Yes 2 No
2 Your hotel/home? 1 Yes 2 No
3 Waste collection points within the island? 1 Yes 2 No
4 Junk shops within the island? 1 Yes 2 No
5 Waste collection point outside the island? 1 Yes 2 No
Section 5. Awareness on Financial Instrument to Protect Environment and to Improve Solid Waste Management
Explain to the respondent: Malay Municipality introduced environmental & admission fee for environmental protection such as solid waste management and sewerage system development.
Q26 Are you aware of the environmental & admission fee? (select one)
1 Yes 2 No
Q27 Do you know how much do you pay for environmental & admission fee at present?
(Encircle one)
1. Yes, how much? Peso
2. No idea if how much.
Q28 Currently PhP50 per visitor is charged for environmental & admission fee upon
entry to Boracay Island. What do you think about this?
1 I think it is suitable. Proceed to Question 31
2 I think it is too much. Proceed to Question 29 next q
3 I think it is too small. Proceed to Question 29 next q
4 I have no view Proceed to Question 31
Q29 How much do you think is suitable
amount? Q30 If you give a zero amount for “Q28”, what would be the reason why you are not
willing to pay any amount for the aforementioned services?
1 I cannot afford. 2 I don’t feel the value of protecting environment of Boracay Island. 3 Total required amount of finance for environmental protection is not clear. 4 It is not clear how government will use the fund. 5 I cannot understand the background condition or assumption. 6 It is Government’s responsibility to protect the environment and therefore they should
spend for it. 7 Others (Specify ________________________________________)
Peso

Supporting Report
Chapter II-A (Appendix)
The Master Plan on Solid Waste Management
for Boracay Island and Municipality of Malay
A-II-A-19
Q31 Presently, Environmental & admission fee is paid by tourists per entry to Boracay Island. However, many tourists stay for a long time. Do you think the payment of these fees should be based on the duration of their stay in Boracay Island? (Encircle one)
1 Yes Proceed to Question 32 2 No Proceed to Question 34 3 I have no view. Proceed to Question 34
Q32 In what manner should you pay for environmental fee? (Select any)
1 Through government collectors as currently practiced
2 Through transport fares
3 Through accommodation fee in hotel
4 Through charge for food or drink in restaurant
5 Through the goods in souvenir shop
6 Others (Specify ________________________________________)
7 I have no view.
Proceed to Question 34 Q33 If you select the answers of “2” or “3” for “Q31”, what would be the reason why
you are not willing to pay any amount for the aforementioned services?
1 I cannot afford.
2 I don’t feel the value of protection of environment of Boracay Island.
3 Total required amount of finance for environmental protection is not clear.
4 I cannot understand the background condition or assumption.
5 It is government’s responsibility to protect environment and budget for it
6 It is not clear how government will use the funds
7 Others (specify) ______________________________________________
Q34 Please give your honest opinion or idea related to waste management if any.
Thank you very much!

Supporting Report
Chapter II-A (Appendix)
The Master Plan on Solid Waste Management
for Boracay Island and Municipality of Malay
A-II-A-20
Appendix II-A-2 Photos
Interview of Tourist at Boracay Island
Interview of Tourist at Boracay Island
Interview of Business Establishment (Vendor)
at Boracay Island
Interview of Business Establishment (Eatery) at Caticlan in the
Mainland of Malay
Interview of Resident at the Mainland of Malay
Interview of Resident at the Mainland of, Malay

PART II: 10-YEAR SOLID WASTE
MANAGEMENT PLAN
B: WASTE CHARACTERISTIC SURVEY
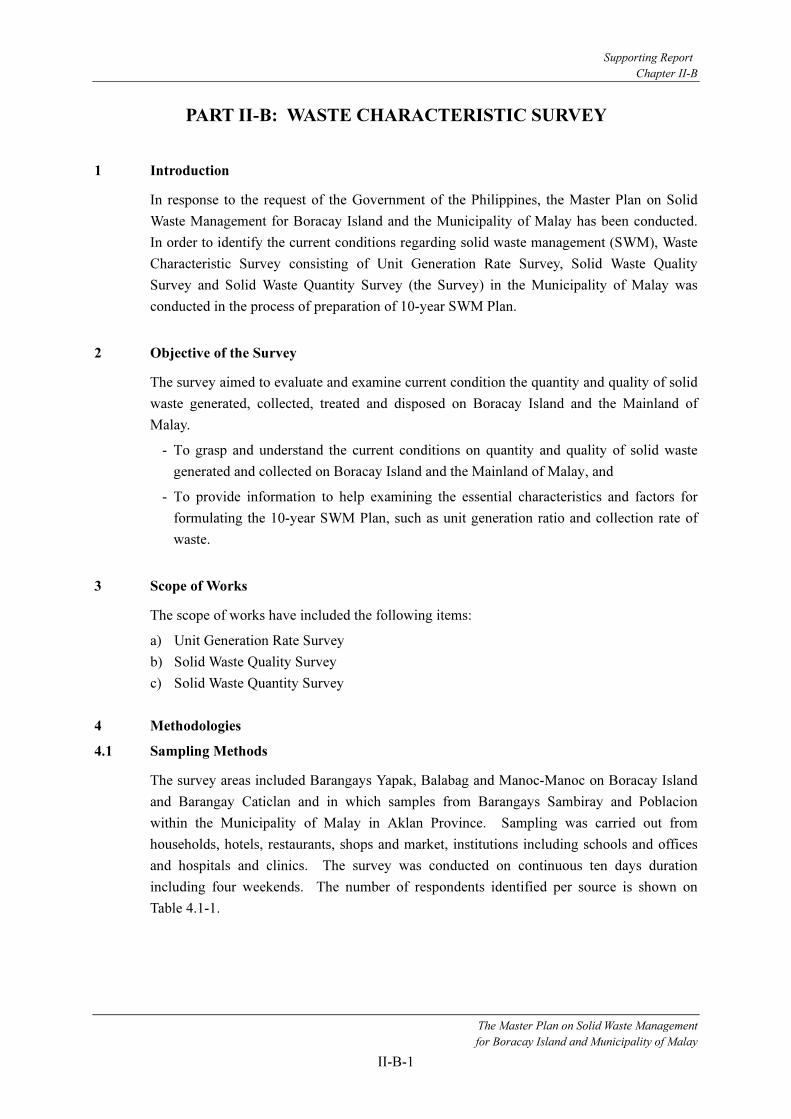
Supporting Report
Chapter II-B
The Master Plan on Solid Waste Management
for Boracay Island and Municipality of Malay
II-B-1
PART II-B: WASTE CHARACTERISTIC SURVEY
1 Introduction
In response to the request of the Government of the Philippines, the Master Plan on Solid
Waste Management for Boracay Island and the Municipality of Malay has been conducted.
In order to identify the current conditions regarding solid waste management (SWM), Waste
Characteristic Survey consisting of Unit Generation Rate Survey, Solid Waste Quality
Survey and Solid Waste Quantity Survey (the Survey) in the Municipality of Malay was
conducted in the process of preparation of 10-year SWM Plan.
2 Objective of the Survey
The survey aimed to evaluate and examine current condition the quantity and quality of solid
waste generated, collected, treated and disposed on Boracay Island and the Mainland of
Malay.
- To grasp and understand the current conditions on quantity and quality of solid waste
generated and collected on Boracay Island and the Mainland of Malay, and
- To provide information to help examining the essential characteristics and factors for
formulating the 10-year SWM Plan, such as unit generation ratio and collection rate of
waste.
3 Scope of Works
The scope of works have included the following items:
a) Unit Generation Rate Survey
b) Solid Waste Quality Survey
c) Solid Waste Quantity Survey
4 Methodologies
4.1 Sampling Methods
The survey areas included Barangays Yapak, Balabag and Manoc-Manoc on Boracay Island
and Barangay Caticlan and in which samples from Barangays Sambiray and Poblacion
within the Municipality of Malay in Aklan Province. Sampling was carried out from
households, hotels, restaurants, shops and market, institutions including schools and offices
and hospitals and clinics. The survey was conducted on continuous ten days duration
including four weekends. The number of respondents identified per source is shown on
Table 4.1-1.
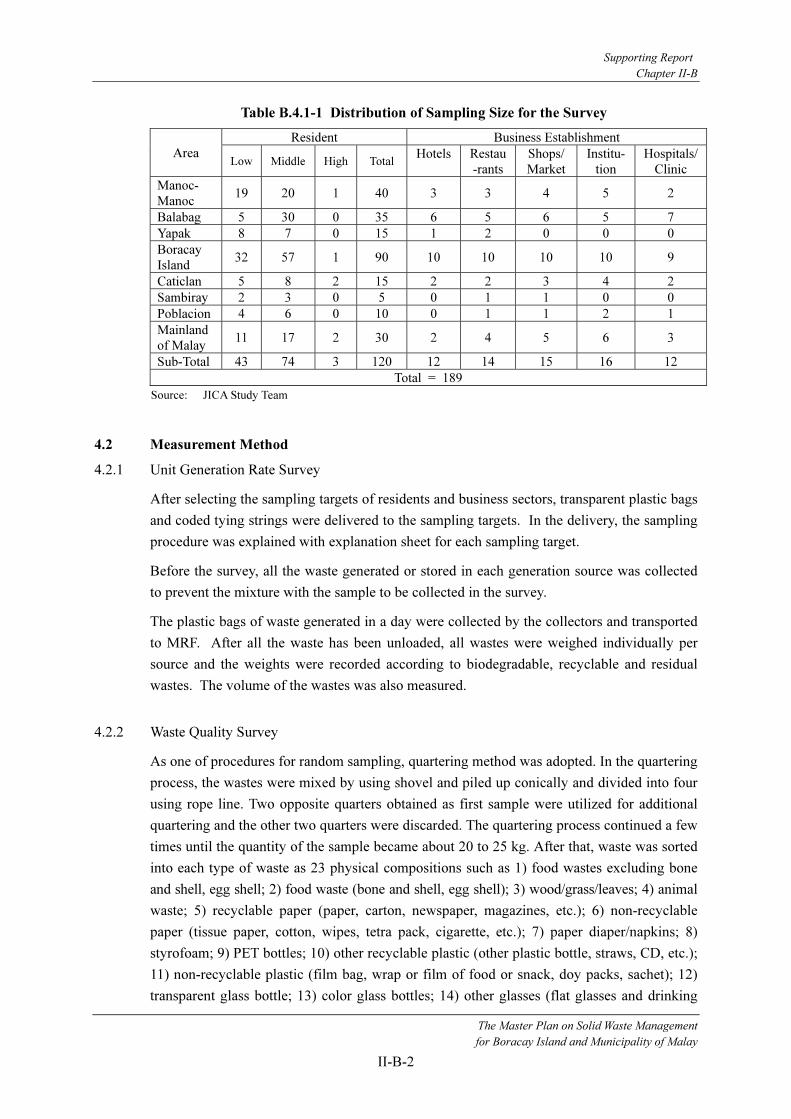
Supporting Report
Chapter II-B
The Master Plan on Solid Waste Management
for Boracay Island and Municipality of Malay
II-B-2
Table B.4.1-1 Distribution of Sampling Size for the Survey
Resident Business Establishment
Area Low Middle High Total
Hotels Restau
-rants
Shops/
Market
Institu-
tion
Hospitals/
Clinic
Manoc-
Manoc 19 20 1 40 3 3 4 5 2
Balabag 5 30 0 35 6 5 6 5 7
Yapak 8 7 0 15 1 2 0 0 0
Boracay
Island 32 57 1 90 10 10 10 10 9
Caticlan 5 8 2 15 2 2 3 4 2
Sambiray 2 3 0 5 0 1 1 0 0
Poblacion 4 6 0 10 0 1 1 2 1
Mainland
of Malay 11 17 2 30 2 4 5 6 3
Sub-Total 43 74 3 120 12 14 15 16 12
Total = 189
Source: JICA Study Team
4.2 Measurement Method
4.2.1 Unit Generation Rate Survey
After selecting the sampling targets of residents and business sectors, transparent plastic bags
and coded tying strings were delivered to the sampling targets. In the delivery, the sampling
procedure was explained with explanation sheet for each sampling target.
Before the survey, all the waste generated or stored in each generation source was collected
to prevent the mixture with the sample to be collected in the survey.
The plastic bags of waste generated in a day were collected by the collectors and transported
to MRF. After all the waste has been unloaded, all wastes were weighed individually per
source and the weights were recorded according to biodegradable, recyclable and residual
wastes. The volume of the wastes was also measured.
4.2.2 Waste Quality Survey
As one of procedures for random sampling, quartering method was adopted. In the quartering
process, the wastes were mixed by using shovel and piled up conically and divided into four
using rope line. Two opposite quarters obtained as first sample were utilized for additional
quartering and the other two quarters were discarded. The quartering process continued a few
times until the quantity of the sample became about 20 to 25 kg. After that, waste was sorted
into each type of waste as 23 physical compositions such as 1) food wastes excluding bone
and shell, egg shell; 2) food waste (bone and shell, egg shell); 3) wood/grass/leaves; 4) animal
waste; 5) recyclable paper (paper, carton, newspaper, magazines, etc.); 6) non-recyclable
paper (tissue paper, cotton, wipes, tetra pack, cigarette, etc.); 7) paper diaper/napkins; 8)
styrofoam; 9) PET bottles; 10) other recyclable plastic (other plastic bottle, straws, CD, etc.);
11) non-recyclable plastic (film bag, wrap or film of food or snack, doy packs, sachet); 12)
transparent glass bottle; 13) color glass bottles; 14) other glasses (flat glasses and drinking
Supporting Report
Chapter II-B
The Master Plan on Solid Waste Management
for Boracay Island and Municipality of Malay
II-B-3
glasses); 15) steel cans, etc.; 16) aluminum cans, etc.; 17) other metals; 18) textile and other
fibers; 19) leathers and rubber including tire; 20) bulky waste (old appliances, equipments,
etc.; 21) ceramics/stone, cement, soil; 22) batteries and lamps bulbs; and 23) others. Each
waste component was placed in a pre-weighed crate or garbage bag with labels. Items on
every category were weighed and recorded. Volume per item was also recorded.
Representative samples of biodegradable wastes for each source were also obtained and send
to CRL Environmental Corporation for the laboratory analysis of moisture content.
4.2.3 Waste Quantity Survey
All wastes collected were transported to their respective MRFs (Yapak MRF, Balabag MRF,
Manoc-Manoc MRF and Caticlan MRF) by collection vehicles as normal collection and
transportation activities. The waste were weighed and recorded by using a 60-kg capacity of
weighing scale after unloading at each MRF. The main component and the source of the
wastes collected were also being observed. The collected wastes were recorded for each
collection vehicle and observed for 10 consecutive days including four weekends.
The weight and volume of recyclable, biodegradable and residual wastes were also recorded
being sorted out from the collected wastes. Identification of the recorded recyclable wastes
was also done in order to determine the exact quantity for each type of recyclable wastes.
This was done for 10 consecutive days including four weekends as stated in the contract.
The landfilled or residual wastes were determined by deducting the combined weight of
biodegradable wastes and recyclable wastes from the total collected wastes.
5 Results of the Waste Quality and Quantity Survey
5.1 Waste Quantity Survey
The unit generation ratio was determined in every source considering the number of persons
generating the wastes based on the data stated in the attribution survey.
5.1.1 Waste from Household
There is no high income residential representative during the survey in Barangays Balabag
and Yapak because some of them refuse to participate in the survey for being busy in their
business and most of the time they are not at home and they will not able to generate the
expected waste that belongs to high income group. The result of the waste generation survey
is presented in Table B.5.1-1.

Supporting Report
Chapter II-B
The Master Plan on Solid Waste Management
for Boracay Island and Municipality of Malay
II-B-4
Table B.5.1-1 Results of Daily Waste Generation at Household
Dry Season Rainy Season Average
Area and Type of
Household Waste Generation per
Person (kg/tourist/day)
Waste Generation per
Person (kg/tourist/day)
Waste Generation per
Person (kg/tourist/day)
Boracay Island 0.35 0.38 0.36
High Income 0.34 0.41 0.37
Middle Income 0.36 0.37 0.37
Low Income 0.34 0.35 0.35
Balabag - - 0.44
High Income - 0.49 0.49
Middle Income 0.41 0.48 0.45
Low Income 0.40 0.41 0.41
Manoc-Manoc - - 0.33
High Income 0.34 0.33 0.34
Middle Income 0.34 0.33 0.34
Low Income 0.31 0.34 0.33
Yapak - - 0.32
High Income - - -
Middle Income 0.33 0.33 0.33
Low Income 0.32 0.30 0.31
Mainland of Malay 0.33 0.34 0.33
High Income 0.35 0.34 0.35
Middle Income 0.35 0.34 0.35
Low Income 0.29 0.32 0.30
Source: JICA Study Team
The quantity of waste generation per person is 0.36 kg/person/day on Boracay Island, and is
0.33 kg/person/day on the Mainland of Malay. The difference of quantity of waste
generation per person between rainy season and dry one is not so much. There is no
significant difference on Boracay Island as well as on the Mainland of Malay.
5.1.2 Waste from Business Establishments
There are five sources of business establishments that considered in the survey, including
hotel, restaurant, shop/market, institution and clinic/hospital.
Table B.5.1-2 Results of Daily Waste Generation at Hotel
Dry Season Rainy Season Average
Waste
Generation
Waste
Generation per
Guest
Waste
Generation
Waste
Generation per
Guest
Waste
Generation
Waste
Generation per
Guest
Areas
(kg/hotel/day) (kg/tourist/day) (kg/hotel/day) (kg/tourist/day) (kg/hotel/day) (kg/tourist/day)
Boracay
Island 15 0.40 16 0.39 15 0.40
Yapak 21.39 0.41 17.52 0.39 19.46 0.40
Balabag 6.95 0.41 5.30 0.40 6.13 0.40
Manoc-
Manoc 15.53 0.40 25.77 0.20 20.65 0.40
Mainland
of Malay 2.03 0.41 1.60 0.40 1.81 0.41
Source: JICA Study Team

Supporting Report
Chapter II-B
The Master Plan on Solid Waste Management
for Boracay Island and Municipality of Malay
II-B-5
As shown in Table B.5.1-2, the average waste generation per person in a hotel is 0.40
kg/person/day on Boracay Island during dry season and about 0.41 kg/person/day on the
Mainland of Malay during dry season as well as rainy season. The quantity of waste
generation per day in a hotel is 15 kg/hotel/day on Boracay Island while it is approximately 2
kg/hotel/day on the Mainland of Malay because the capacity of the hotel on the Mainland of
Malay is smaller than on Boracay Island. The quantity of waste generation per hotel in dry
season is more than in rainy season due to the seasonal fluctuation of tourist arrival.
Table B.5.1-3 Results of Daily Waste Generation of at Restaurant
Dry Season Rainy Season Average
Waste Generation
Waste
Generation per
Customer
Waste
Generation
Waste
Generation per
Customer
Waste Generation
Waste
Generation per
Customer Areas
(kg/restaurant/day) (kg/tourist/day) (kg/restaurant/day) (kg/tourist/day) (kg/restaurant/day) (kg/tourist/day)
Boracay
Island 8.00 0.21 6.00 0.20 7.00 0.21
Yapak 6.47 0.21 5.37 0.20 5.92 0.21
Balabag 13.32 0.23 10.27 0.21 11.80 0.22
Manoc-
Manoc 4.71 0.20 3.70 0.19 4.21 0.20
Mainland
of Malay 2.46 0.20 7.58 0.21 5.02 0.21
Source: JICA Study Team
The restaurant in Barangay Balabag had the highest average waste generation per day on
target barangays which is about 13.3 kg/restaurant/day. The reason will be that the barangay
is the center of island wherein most of the tourists stayed. The average waste generation per
restaurant on Boracay Island is 7.0 kg/restaurant/day with an average of 0.21 kg/person/day
while on the Mainland of Malay, the restaurant there generated about 5 kg/restaurant/day
with an average of 0.21 kg/person/day. The quantity of waste generation per restaurant in
dry season is more than in rainy season due to the seasonal fluctuation of tourist arrival on
Boracay Island. On the other hand, the fact that quantity of waste generation in rainy season
is more than in dry one might be caused by the weight increase by rain or other factors.
Table B.5.1-4 Results of Daily Waste Generation at Shop/Market
(kg/shop/day)
Areas Dry Season Rainy Season Average
Boracay Island 4.46 4.33 4.40
Yapak - - -
Balabag 4.47 4.33 4.40
Manoc-Manoc 4.46 4.34 4.40
Mainland of Malay 4.64 4.36 4.40
Source: JICA Study Team
The average waste generation per shop is 4.40 kg/shop/day for shops/market on Boracay
Island as well as on the Mainland of Malay. There are some differences in dry season and
rainy one. Considering the degree of the differences, it will be in the range of the fluctuation.

Supporting Report
Chapter II-B
The Master Plan on Solid Waste Management
for Boracay Island and Municipality of Malay
II-B-6
Table B.5.1-5 Results of Daily Waste Generation at Institution
(kg/office/day)
Areas Dry Season Rainy Season Average
Boracay Island 3.08 3.88 3.00
Yapak - - -
Balabag 3.12 2.94 3.00
Manoc-Manoc 3.05 2.91 3.00
Mainland of Malay 3.13 2.88 3.01
Source: JICA Study Team
The average waste generation per institution is 3.00 kg/institution/day for institution on
Boracay Island and 3.01 kg/institution/day as well as on the Mainland of Malay. There are
some differences in dry season and rainy one. Considering the degree of the differences, it
will be in the range of the fluctuation.
Table B.5.1-6 Results of Daily Domestic Waste Generation at Clinic/Hospital
(kg/hospital/day)
Areas Dry Season Rainy Season Average
Boracay Island 1.65 1.01 1.32
Yapak - - -
Balabag 1.88 1.04 1.50
Manoc-Manoc 1.68 0.98 1.32
Mainland of Malay 1.26 1.40 1.33
Source: JICA Study Team
The domestic waste generated from hospital on the Mainland of Malay was 1.32
kg/hospital/day similar to on Boracay Island which is 1.33 kg/hospital/day. Comparing the
dry and rainy seasons, the quantity of waste generated in dry season was more than in rainy
one on Boracay Island, but vise versa on the Mainland of Malay. It was considered to be
impacts of tourists on Boracay Island but other factors such as infectious disease in rainy
season cause the increase of the waste from hospitals.
5.2 Waste Quality Survey
5.2.1 Physical Composition
The physical composition of solid waste generated on Boracay Island is shown in Figure
5.2.1. The waste from hotels and restaurants includes the large quantity of biodegradable
waste, while the waste from institutions does not generate a large quantity of biodegradable
waste. Totally biodegradable, recyclable and residual wastes occupy the almost same
portions of the total waste generation, i.e. 37 % of biodegradable, 35% of recyclable and
28% of residual waste respectively.
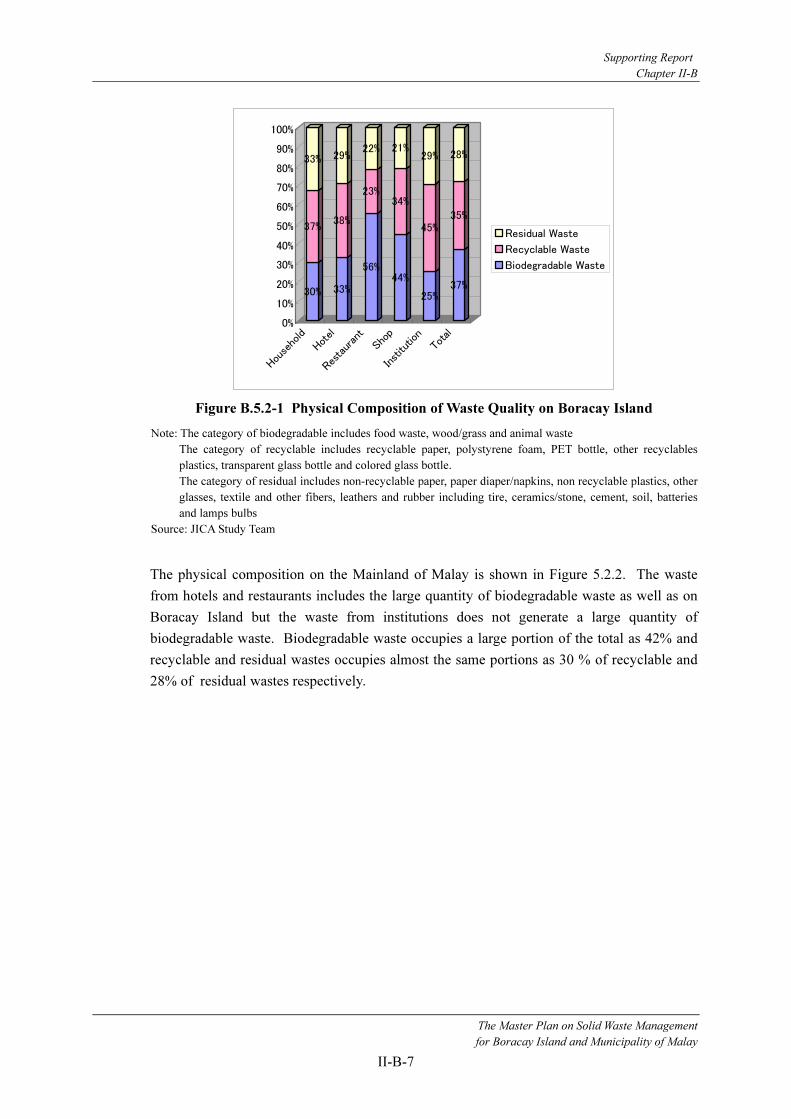
Supporting Report
Chapter II-B
The Master Plan on Solid Waste Management
for Boracay Island and Municipality of Malay
II-B-7
30%
37%
33%
33%
38%
29%
56%
23%
22%
44%
34%
21%
25%
45%
29%
37%
35%
28%
0%
10%
20%
30%
40%
50%
60%
70%
80%
90%
100%
Household
Hotel
Restaurant
Shop
Institution
Total
Residual Waste
Recyclable Waste
Biodegradable Waste
Figure B.5.2-1 Physical Composition of Waste Quality on Boracay Island
Note: The category of biodegradable includes food waste, wood/grass and animal waste
The category of recyclable includes recyclable paper, polystyrene foam, PET bottle, other recyclables
plastics, transparent glass bottle and colored glass bottle.
The category of residual includes non-recyclable paper, paper diaper/napkins, non recyclable plastics, other
glasses, textile and other fibers, leathers and rubber including tire, ceramics/stone, cement, soil, batteries
and lamps bulbs
Source: JICA Study Team
The physical composition on the Mainland of Malay is shown in Figure 5.2.2. The waste
from hotels and restaurants includes the large quantity of biodegradable waste as well as on
Boracay Island but the waste from institutions does not generate a large quantity of
biodegradable waste. Biodegradable waste occupies a large portion of the total as 42% and
recyclable and residual wastes occupies almost the same portions as 30 % of recyclable and
28% of residual wastes respectively.
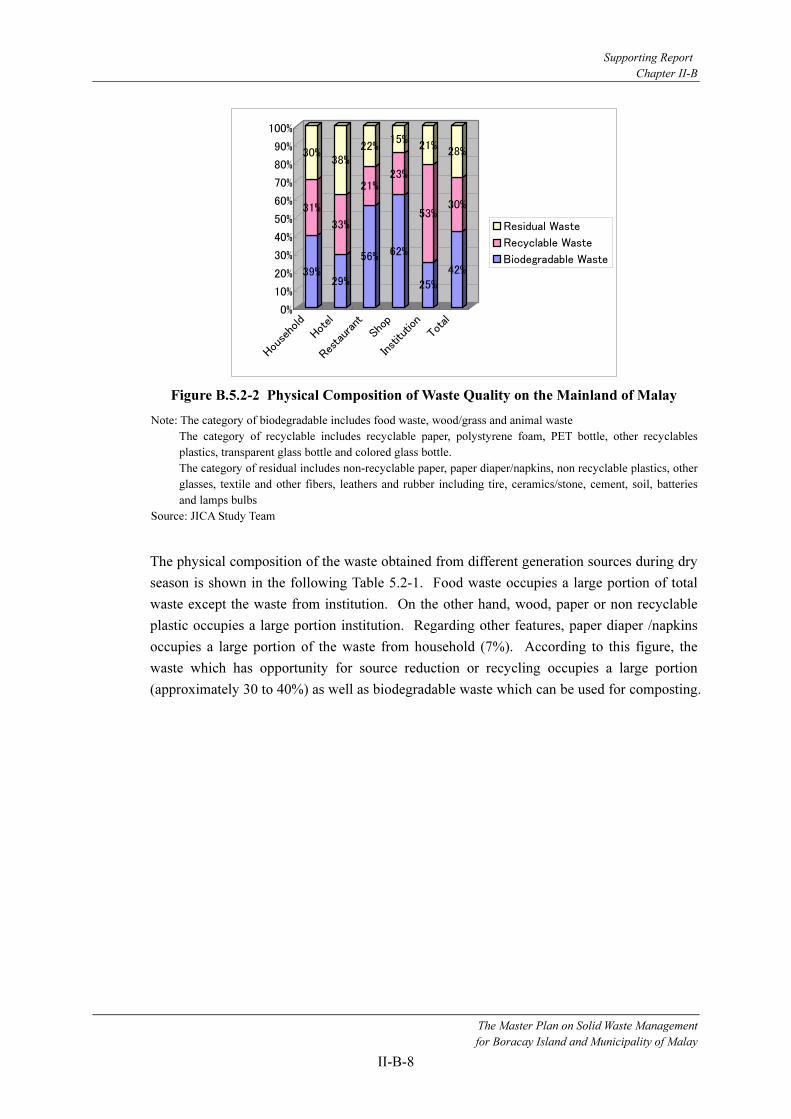
Supporting Report
Chapter II-B
The Master Plan on Solid Waste Management
for Boracay Island and Municipality of Malay
II-B-8
39%
31%
30%
29%
33%
38%
56%
21%
22%
62%
23%
15%
25%
53%
21%
42%
30%
28%
0%
10%
20%
30%
40%
50%
60%
70%
80%
90%
100%
Household
Hotel
Restaurant
Shop
Institution
Total
Residual Waste
Recyclable Waste
Biodegradable Waste
Figure B.5.2-2 Physical Composition of Waste Quality on the Mainland of Malay
Note: The category of biodegradable includes food waste, wood/grass and animal waste
The category of recyclable includes recyclable paper, polystyrene foam, PET bottle, other recyclables
plastics, transparent glass bottle and colored glass bottle.
The category of residual includes non-recyclable paper, paper diaper/napkins, non recyclable plastics, other
glasses, textile and other fibers, leathers and rubber including tire, ceramics/stone, cement, soil, batteries
and lamps bulbs
Source: JICA Study Team
The physical composition of the waste obtained from different generation sources during dry
season is shown in the following Table 5.2-1. Food waste occupies a large portion of total
waste except the waste from institution. On the other hand, wood, paper or non recyclable
plastic occupies a large portion institution. Regarding other features, paper diaper /napkins
occupies a large portion of the waste from household (7%). According to this figure, the
waste which has opportunity for source reduction or recycling occupies a large portion
(approximately 30 to 40%) as well as biodegradable waste which can be used for composting.

Supporting Report
Chapter II-B
The Master Plan on Solid Waste Management
for Boracay Island and Municipality of Malay
II-B-9
Table B.5.2-1 Physical Composition of Waste Quality During Dry Season
Items Household Hotel Restaurant Shop/Market Institution Total Ratio
1
Food Waste
excluding bone and
shell, egg shell
14% 20% 47% 20% 8% 21%
2 Food Waste (bone
and shell, egg shell) 5% 4% 7% 12% 4% 7%
3 Wood/Grass 10% 4% 8% 3% 16% 7%
4 Animal waste 0% 0% 0% 0% 0% 0%
5
Recyclable paper
(paper carton, news
paper,
magazine,etc.)
8% 18% 6% 19% 17% 12%
6
Non recyclable
paper
(tissue paper, cotton,
wipes, tetra-pack,
cigarette, etc.)
4% 9% 8% 9% 14% 7%
7 Paper diaper/
napkins 7% 3% 1% 1% 0% 4%
8 Styrene Foam 1% 1% 0% 1% 5% 1%
9 PET bottle 2% 3% 2% 3% 4% 2%
10
Other recyclable
plastic (other bottle,
straw, CD)
6% 8% 2% 8% 5% 6%
11
Non recyclable
plastics
(film bag, wrap or
film for food or
snack, doypack,
sachet)
12% 12% 10% 10% 11% 11%
12 Transparent glass
bottle 8% 6% 4% 3% 7% 6%
13 Colored glass bottle 3% 1% 2% 2% 0% 2%
14
Other glasses (flat
glasses and drinking
glasses)
6% 0% 0% 2% 0% 3%
15 Steel can, etc. 4% 6% 2% 1% 4% 4%
16 Aluminum can, etc. 1% 1% 1% 1% 2% 1%
17 Other metal 1% 0% 0% 0% 0% 0%
18 Textile and other
Fibers 3% 4% 0% 1% 1% 2%
19 Leathers and Rubber
including Tire 2% 0% 0% 3% 0% 2%
20
Bulky wastes (old
appliance
equipment, etc.)
0% 0% 0% 0% 0% 0%
21 Ceramics/Stone,
Cement, Soil 2% 0% 0% 0% 1% 1%
22 Batteries and lamp
bulb 1% 0% 0% 0% 1% 0%
23 Others 0% 0% 0% 1% 0% 1%
Total 100% 100% 100% 100% 100% 100%
Source: JICA Study Team
The physical composition of the waste obtained from different generation sources during
rainy season is shown in Table B.5.2-2. Food waste occupies a large portion of total waste
except the waste from institution as well as dry season. On the other hand, wood, paper or
non recyclable plastic occupies a large portion in institution. Regarding other features,
transparent glass bottle occupies a large portion of the waste from household (17%) as well
as paper diaper /napkins (7%). According to this figure, the waste which has opportunity for

Supporting Report
Chapter II-B
The Master Plan on Solid Waste Management
for Boracay Island and Municipality of Malay
II-B-10
source reduction or recycling occupies a large portion (approximately 30 to 40%) as well as
biodegradable waste which can be used for composting.
Table B.5.2-2 Physical Composition of Waste Quality During Rainy Season
Item Household Hotel Restaurant Shop/Market Institution Total Ratio
1
Food Waste
excluding bone and
shell, egg shell
13% 23% 42% 51% 9% 28%
2 Food Waste (bone
and shell, egg shell) 2% 4% 4% 1% 1% 3%
3 Wood/Grass 15% 10% 4% 1% 13% 9%
4 Animal waste 1% 1% 0% 0% 1% 0%
5
Recyclable paper
(paper carton, news
paper,
magazine,etc.)
8% 11% 8% 17% 19% 11%
6
Non recyclable
paper
(tissue paper,
cotton, wipes, tetra-
pack, cigarette, etc.)
4% 11% 6% 6% 11% 6%
7 Paper diaper/
napkins 7% 2% 1% 0% 3% 3%
8 Styrene Foam 1% 1% 0% 0% 5% 1%
9 PET bottle 3% 5% 4% 2% 4% 3%
10
Other recyclable
plastic (other bottle,
straw, CD)
4% 3% 3% 3% 7% 3%
11
Non recyclable
plastics
(film bag, wrap or
film for food or
snack, doypack,
sachet)
15% 14% 13% 9% 14% 13%
12 Transparent glass
bottle 17% 6% 5% 3% 6% 10%
13 Colored glass bottle 4% 2% 1% 2% 3% 3%
14
Other glasses (flat
glasses and drinking
glasses)
0% 1% 0% 0% 0% 0%
15 Steel can, etc. 4% 3% 4% 2% 1% 3%
16 Aluminum can, etc. 0% 0% 0% 1% 1% 0%
17 Other metal 0% 0% 0% 0% 0% 0%
18 Textile and other
Fibers 0% 0% 0% 1% 0% 0%
19
Leathers and
Rubber including
Tire
1% 0% 1% 0% 1% 0%
20
Bulky wastes (old
appliance
equipment, etc.)
0% 0% 0% 0% 0% 0%
21 Ceramics/Stone,
Cement, Soil 1% 1% 2% 0% 1% 1%
22 Batteries and lamp
bulb 0% 0% 0% 0% 0% 0%
23 Others 0% 2% 2% 1% 0% 3%
Total 100% 100% 100% 100% 100% 100%
Source: JICA Study Team

Supporting Report
Chapter II-B
The Master Plan on Solid Waste Management
for Boracay Island and Municipality of Malay
II-B-11
5.2.2 Bulk Density
The bulk density of the generated wastes in the study area is shown on Table B.5.2-3. It
shows that bulk density during dry season on Boracay Island is higher compared to rainy
season while on the Mainland of Malay the bulk density during dry season does not increase
so much during the rainy season.
Table B.5.2-3 Bulk Density of Generated Waste [kg/L]
Area Dry Season Rainy Season
Yapak 0.194 0.163
Balabag 0.280 0.279
Manoc-Manoc 0.272 0.263
Caticlan 0.101 0.103
Source: JICA Study Team
5.2.3 Moisture Content
Samples were taken from biodegradable waste for each source for moisture content analyses
and being conducted for 5 consecutive days. Table B.5.2-4 shows the result of the moisture
content during the dry season survey and Table B.5.2-5 shows the result during the rainy
season survey.
During dry season, samples taken from the household in Balabag on Boracay Island have the
highest moisture content value as about 81%, while in Caticlan on the Mainland of Malay the
highest moisture content value was about 71%. During rainy season, most of the
biodegradable wastes had high value of moisture content ranging from 68% to 92% because
the samples were wet when they were taken.

Supporting Report
Chapter II-B
The Master Plan on Solid Waste Management
for Boracay Island and Municipality of Malay
II-B-12
Table B.5.2-4 Results of Moisture Content Analyses on Dry Season
Moisture Content, % Area/Source
Day 1 Day 2 Day 3 Day 4 Day 5 Average
Yapak
Household 94.15 52.44 84.07 79.88 78.99 77.91
Hotel 72.04 50.08 53.06 - 45.39 55.14
Restaurant 61.72 84.75 63.21 73.95 62.82 69.29
Balabag
Household 59.74 83.65 10.14 88.7 92.28 80.84
Hotel 72.52 38.64 66.67 58.06 83.1 70.09
Restaurant 50.95 78.68 77.3 96.68 91.54 79.03
Shops/Market 53.34 20.56 16.68 79.74 15.94 66.54
Institution 70.28 58.98 46.31 92.47 86.81 77.14
Hospital/Clinic 12.56 6.35 35.06 66.58 68.06 67.32
Manok-Manoc
Household 54.76 76.13 59.84 79.51 51.45 64.34
Hotel 69.44 60.92 65.86 71.77 29.14 59.43
Restaurant 54.94 37.22 68.89 62.34 79.31 60.54
Shops/Market 35.97 77.76 88.88 94.9 91.92 77.89
Institution 50.3 61.21 11.85 28.57 41.25 55.76
Hospital/Clinic 54.76 21.82 15.97 - 32.74 54.76
Caticlan
Household 39.74 74.02 67.82 75.44 59.25 69.13
Hotel 47.06 52.58 46.88 52.66 70.66 58.63
Restaurant 67.7 49.26 68.96 66.98 74.4 65.46
Shops/Market 26.08 63.85 80.66 13.08 61.14 68.55
Institution 52.25 52.7 50.87 29.84 73.17 57.25
Hospital/Clinic 86.62 32.86 83.34 58.73 53.8 70.62
Note: Italic value means abnormal data and not included in the computation of average result - means no
sample was taken.
Source: JICA Study Team
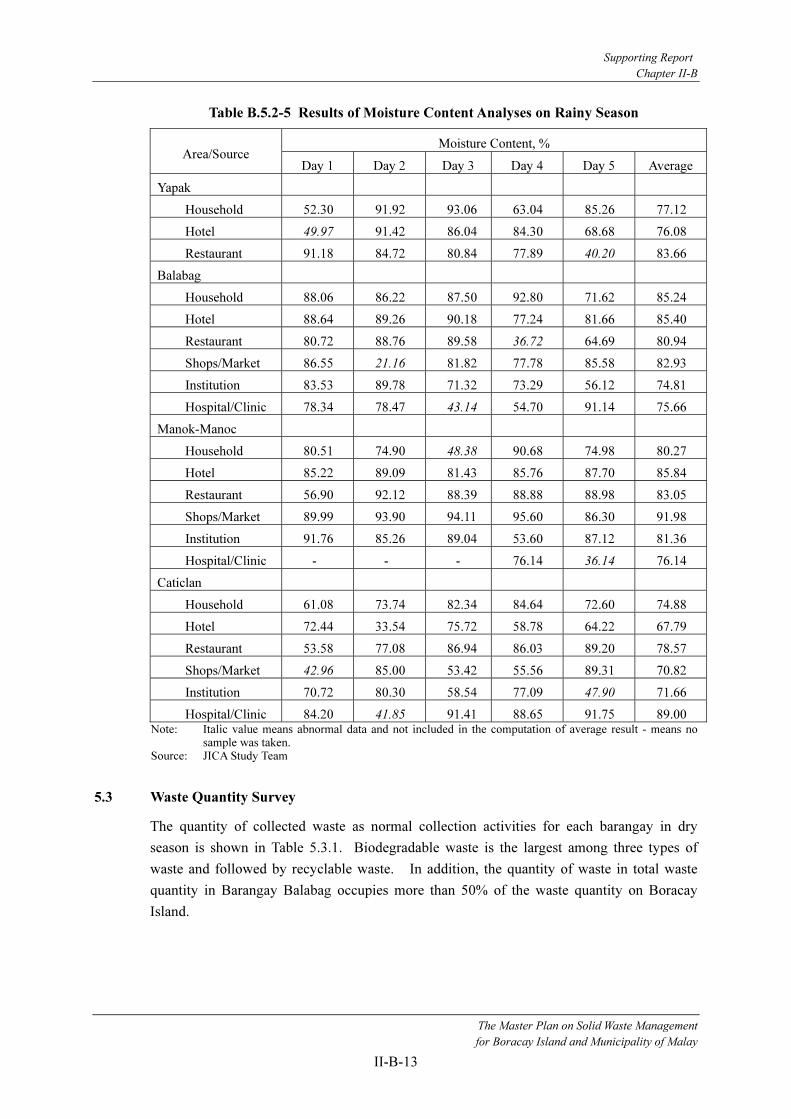
Supporting Report
Chapter II-B
The Master Plan on Solid Waste Management
for Boracay Island and Municipality of Malay
II-B-13
Table B.5.2-5 Results of Moisture Content Analyses on Rainy Season
Moisture Content, % Area/Source
Day 1 Day 2 Day 3 Day 4 Day 5 Average
Yapak
Household 52.30 91.92 93.06 63.04 85.26 77.12
Hotel 49.97 91.42 86.04 84.30 68.68 76.08
Restaurant 91.18 84.72 80.84 77.89 40.20 83.66
Balabag
Household 88.06 86.22 87.50 92.80 71.62 85.24
Hotel 88.64 89.26 90.18 77.24 81.66 85.40
Restaurant 80.72 88.76 89.58 36.72 64.69 80.94
Shops/Market 86.55 21.16 81.82 77.78 85.58 82.93
Institution 83.53 89.78 71.32 73.29 56.12 74.81
Hospital/Clinic 78.34 78.47 43.14 54.70 91.14 75.66
Manok-Manoc
Household 80.51 74.90 48.38 90.68 74.98 80.27
Hotel 85.22 89.09 81.43 85.76 87.70 85.84
Restaurant 56.90 92.12 88.39 88.88 88.98 83.05
Shops/Market 89.99 93.90 94.11 95.60 86.30 91.98
Institution 91.76 85.26 89.04 53.60 87.12 81.36
Hospital/Clinic - - - 76.14 36.14 76.14
Caticlan
Household 61.08 73.74 82.34 84.64 72.60 74.88
Hotel 72.44 33.54 75.72 58.78 64.22 67.79
Restaurant 53.58 77.08 86.94 86.03 89.20 78.57
Shops/Market 42.96 85.00 53.42 55.56 89.31 70.82
Institution 70.72 80.30 58.54 77.09 47.90 71.66
Hospital/Clinic 84.20 41.85 91.41 88.65 91.75 89.00 Note: Italic value means abnormal data and not included in the computation of average result - means no
sample was taken. Source: JICA Study Team
5.3 Waste Quantity Survey
The quantity of collected waste as normal collection activities for each barangay in dry
season is shown in Table 5.3.1. Biodegradable waste is the largest among three types of
waste and followed by recyclable waste. In addition, the quantity of waste in total waste
quantity in Barangay Balabag occupies more than 50% of the waste quantity on Boracay
Island.
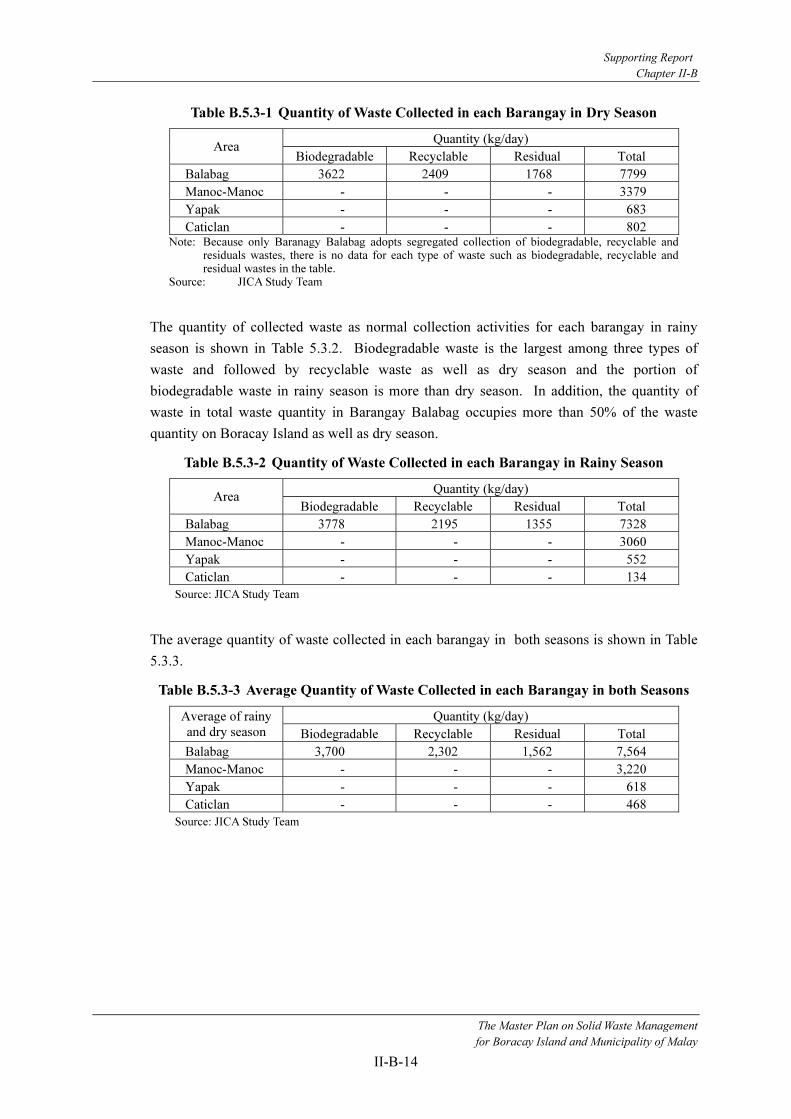
Supporting Report
Chapter II-B
The Master Plan on Solid Waste Management
for Boracay Island and Municipality of Malay
II-B-14
Table B.5.3-1 Quantity of Waste Collected in each Barangay in Dry Season
Quantity (kg/day) Area
Biodegradable Recyclable Residual Total
Balabag 3622 2409 1768 7799
Manoc-Manoc - - - 3379
Yapak - - - 683
Caticlan - - - 802 Note: Because only Baranagy Balabag adopts segregated collection of biodegradable, recyclable and
residuals wastes, there is no data for each type of waste such as biodegradable, recyclable and residual wastes in the table.
Source: JICA Study Team
The quantity of collected waste as normal collection activities for each barangay in rainy
season is shown in Table 5.3.2. Biodegradable waste is the largest among three types of
waste and followed by recyclable waste as well as dry season and the portion of
biodegradable waste in rainy season is more than dry season. In addition, the quantity of
waste in total waste quantity in Barangay Balabag occupies more than 50% of the waste
quantity on Boracay Island as well as dry season.
Table B.5.3-2 Quantity of Waste Collected in each Barangay in Rainy Season
Quantity (kg/day) Area
Biodegradable Recyclable Residual Total
Balabag 3778 2195 1355 7328
Manoc-Manoc - - - 3060
Yapak - - - 552
Caticlan - - - 134
Source: JICA Study Team
The average quantity of waste collected in each barangay in both seasons is shown in Table
5.3.3.
Table B.5.3-3 Average Quantity of Waste Collected in each Barangay in both Seasons
Quantity (kg/day) Average of rainy
and dry season Biodegradable Recyclable Residual Total
Balabag 3,700 2,302 1,562 7,564
Manoc-Manoc - - - 3,220
Yapak - - - 618
Caticlan - - - 468
Source: JICA Study Team

Appendix
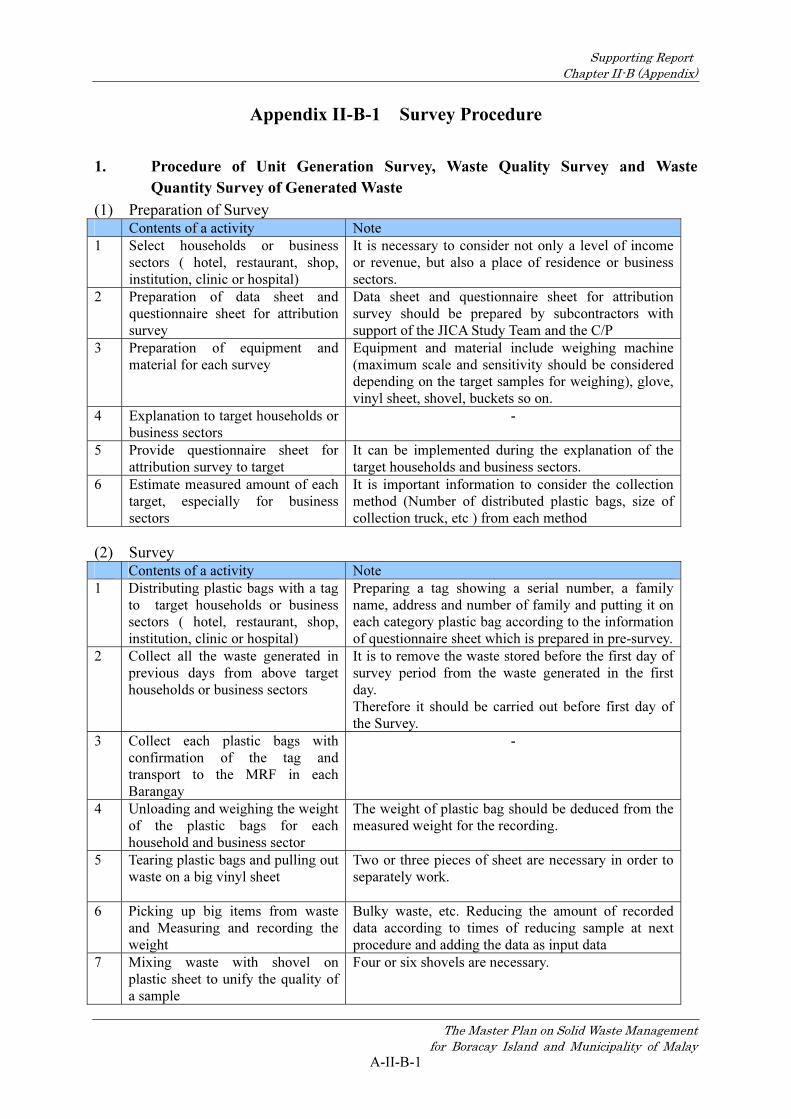
Supporting Report
Chapter II-B (Appendix)
The Master Plan on Solid Waste Management
for Boracay Island and Municipality of Malay
A-II-B-1
Appendix II-B-1 Survey Procedure
1. Procedure of Unit Generation Survey, Waste Quality Survey and Waste
Quantity Survey of Generated Waste
(1) Preparation of Survey Contents of a activity Note
1 Select households or business
sectors ( hotel, restaurant, shop,
institution, clinic or hospital)
It is necessary to consider not only a level of income
or revenue, but also a place of residence or business
sectors.
2 Preparation of data sheet and
questionnaire sheet for attribution
survey
Data sheet and questionnaire sheet for attribution
survey should be prepared by subcontractors with
support of the JICA Study Team and the C/P
3 Preparation of equipment and
material for each survey
Equipment and material include weighing machine
(maximum scale and sensitivity should be considered
depending on the target samples for weighing), glove,
vinyl sheet, shovel, buckets so on.
4 Explanation to target households or
business sectors
-
5 Provide questionnaire sheet for
attribution survey to target
It can be implemented during the explanation of the
target households and business sectors.
6 Estimate measured amount of each
target, especially for business
sectors
It is important information to consider the collection
method (Number of distributed plastic bags, size of
collection truck, etc ) from each method
(2) Survey Contents of a activity Note
1 Distributing plastic bags with a tag
to target households or business
sectors ( hotel, restaurant, shop,
institution, clinic or hospital)
Preparing a tag showing a serial number, a family
name, address and number of family and putting it on
each category plastic bag according to the information
of questionnaire sheet which is prepared in pre-survey.
2 Collect all the waste generated in
previous days from above target
households or business sectors
It is to remove the waste stored before the first day of
survey period from the waste generated in the first
day.
Therefore it should be carried out before first day of
the Survey.
3 Collect each plastic bags with
confirmation of the tag and
transport to the MRF in each
Barangay
-
4 Unloading and weighing the weight
of the plastic bags for each
household and business sector
The weight of plastic bag should be deduced from the
measured weight for the recording.
5 Tearing plastic bags and pulling out
waste on a big vinyl sheet
Two or three pieces of sheet are necessary in order to
separately work.
6 Picking up big items from waste
and Measuring and recording the
weight
Bulky waste, etc. Reducing the amount of recorded
data according to times of reducing sample at next
procedure and adding the data as input data
7 Mixing waste with shovel on
plastic sheet to unify the quality of
a sample
Four or six shovels are necessary.

Supporting Report
Chapter II-B (Appendix)
The Master Plan on Solid Waste Management
for Boracay Island and Municipality of Malay
A-II-B-2
Contents of a activity Note
8 Separation the mixed waste into
four parts and getting rid of two
parts of waste of opposite angle
until the remain is 20 to 25kg
It is necessary to reduce amount of sample in order to
reduce burden of work. Please take care to mix
enough and to select mixed portions as sample to
prevent distortion. In addition, it is important to take a
picture to identify the sample condition.
9 After the remaining became 20 to
25kg, separate waste into each
category (16) on a plastic sheet
It is necessary to prepare container to put separated
item with a tag for each container.
10 Measuring and recording weight of
each item
Details of item of a category, others should be
described.
It should be described if there is anything to wise up.
11 Other remain of 20 to 25 kg should
be utilized for measuring and
recording amount (kg) and volume
(liter) by putting waste in a plastic
container (about 90L to 100L) to
identify the bulk density or/and
measurement of water contents.
-
12 Cleaning up
-
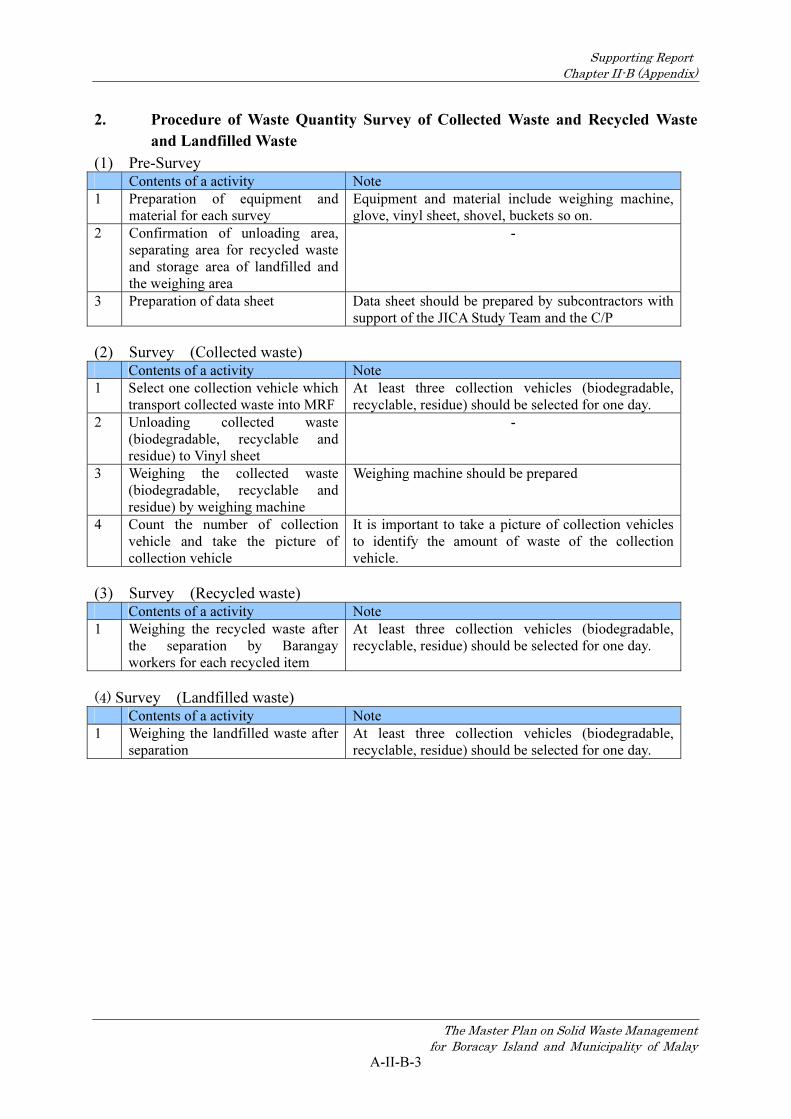
Supporting Report
Chapter II-B (Appendix)
The Master Plan on Solid Waste Management
for Boracay Island and Municipality of Malay
A-II-B-3
2. Procedure of Waste Quantity Survey of Collected Waste and Recycled Waste
and Landfilled Waste
(1) Pre-Survey Contents of a activity Note
1 Preparation of equipment and
material for each survey
Equipment and material include weighing machine,
glove, vinyl sheet, shovel, buckets so on.
2 Confirmation of unloading area,
separating area for recycled waste
and storage area of landfilled and
the weighing area
-
3 Preparation of data sheet Data sheet should be prepared by subcontractors with
support of the JICA Study Team and the C/P
(2) Survey (Collected waste) Contents of a activity Note
1 Select one collection vehicle which
transport collected waste into MRF
At least three collection vehicles (biodegradable,
recyclable, residue) should be selected for one day.
2 Unloading collected waste
(biodegradable, recyclable and
residue) to Vinyl sheet
-
3 Weighing the collected waste
(biodegradable, recyclable and
residue) by weighing machine
Weighing machine should be prepared
4 Count the number of collection
vehicle and take the picture of
collection vehicle
It is important to take a picture of collection vehicles
to identify the amount of waste of the collection
vehicle.
(3) Survey (Recycled waste) Contents of a activity Note
1 Weighing the recycled waste after
the separation by Barangay
workers for each recycled item
At least three collection vehicles (biodegradable,
recyclable, residue) should be selected for one day.
(4) Survey (Landfilled waste) Contents of a activity Note
1 Weighing the landfilled waste after
separation
At least three collection vehicles (biodegradable,
recyclable, residue) should be selected for one day.
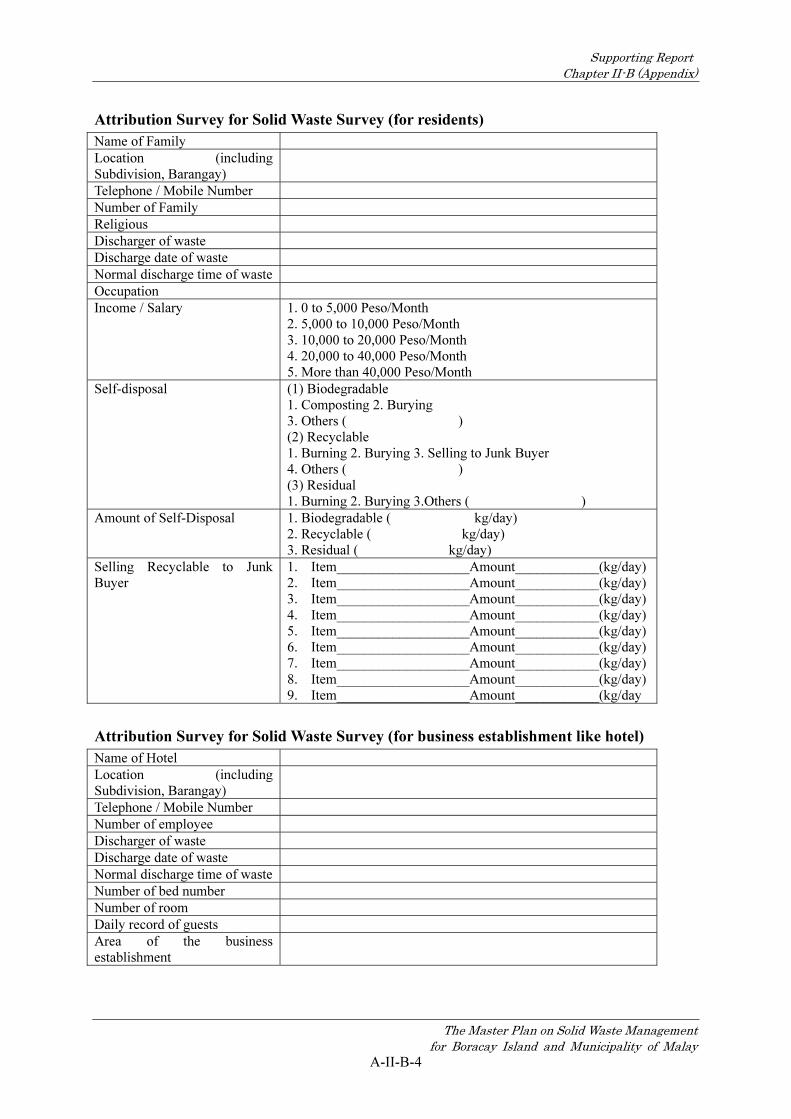
Supporting Report
Chapter II-B (Appendix)
The Master Plan on Solid Waste Management
for Boracay Island and Municipality of Malay
A-II-B-4
Attribution Survey for Solid Waste Survey (for residents)
Name of Family
Location (including
Subdivision, Barangay)
Telephone / Mobile Number
Number of Family
Religious
Discharger of waste
Discharge date of waste
Normal discharge time of waste
Occupation
Income / Salary 1. 0 to 5,000 Peso/Month
2. 5,000 to 10,000 Peso/Month
3. 10,000 to 20,000 Peso/Month
4. 20,000 to 40,000 Peso/Month
5. More than 40,000 Peso/Month
Self-disposal (1) Biodegradable
1. Composting 2. Burying
3. Others ( )
(2) Recyclable
1. Burning 2. Burying 3. Selling to Junk Buyer
4. Others ( )
(3) Residual
1. Burning 2. Burying 3.Others ( )
Amount of Self-Disposal 1. Biodegradable ( kg/day)
2. Recyclable ( kg/day)
3. Residual ( kg/day)
Selling Recyclable to Junk
Buyer
1. Item___________________Amount____________(kg/day)
2. Item___________________Amount____________(kg/day)
3. Item___________________Amount____________(kg/day)
4. Item___________________Amount____________(kg/day)
5. Item___________________Amount____________(kg/day)
6. Item___________________Amount____________(kg/day)
7. Item___________________Amount____________(kg/day)
8. Item___________________Amount____________(kg/day)
9. Item___________________Amount____________(kg/day
Attribution Survey for Solid Waste Survey (for business establishment like hotel)
Name of Hotel
Location (including
Subdivision, Barangay)
Telephone / Mobile Number
Number of employee
Discharger of waste
Discharge date of waste
Normal discharge time of waste
Number of bed number
Number of room
Daily record of guests
Area of the business
establishment
Supporting Report
Chapter II-B (Appendix)
The Master Plan on Solid Waste Management
for Boracay Island and Municipality of Malay
A-II-B-5
Self-disposal (1) Biodegradable
1. Composting 2. Burying
3. Others ( )
(2) Recyclable
1. Burning 2. Burying 3. Selling to Junk Buyer
4. Others ( )
(3) Residual
1. Burning 2. Burying 3.Others ( )
Amount of Self-Disposal 1. Biodegradable ( kg/day)
2. Recyclable ( kg/day)
3. Residual ( kg/day)

Supporting Report
Chapter II-B (Appendix)
The Master Plan on Solid Waste Management
for Boracay Island and Municipality of Malay
A-II-B-6
Appendix II-B-2 Instruction for Solid Waste Quantity and Quality Survey
to Business Sectors
Solid waste sampling for the survey will be continued for 11 consecutive days. This will
include 1 day for preliminary survey and 10 days for actual survey. The procedure is as
follows;
1. Waste Packing
a. If you are usually segregating for solid waste
discharge, segregate all waste for discharge into
plastic bags with tag number. You shall be provided
with 3 bags; one for recyclable, one for
biodegradable and one for residuals. After all waste
is put into the plastic bags, you should tie with
strings according to color; black for residuals, green
for biodegradables and white for recyclable.
b. If you are not practicing segregation, you can
mix all in one bag and tie with black strings with
tag number.
c. If you are directly selling some of recyclable waste to junk buyers, please put all these
materials into one plastic bag and label “for sale” with selling price.
d. If you are disposing of some of solid waste by yourselves, please put all these waste
into one plastic bag and label “for self-disposal”.
e. For restaurants, markets or hotels, please put food leftovers in hard plastic containers, if
possible.
2. Storage of Packed Waste
All the waste that you have generated for one
target day must be kept in your house or yard for
pick-up by survey collectors only. Please do not
discharge the waste along the road or other waste
collection points where solid waste is collected by
government truck.
3. Waste Collection
We will collect the plastic bags from 6:00 a.m. to
7:00 a.m.
For any inquiries or clarifications, please contact
or text Engr. Danny Castillon (09177423084).
Thank you very much for your cooperation.
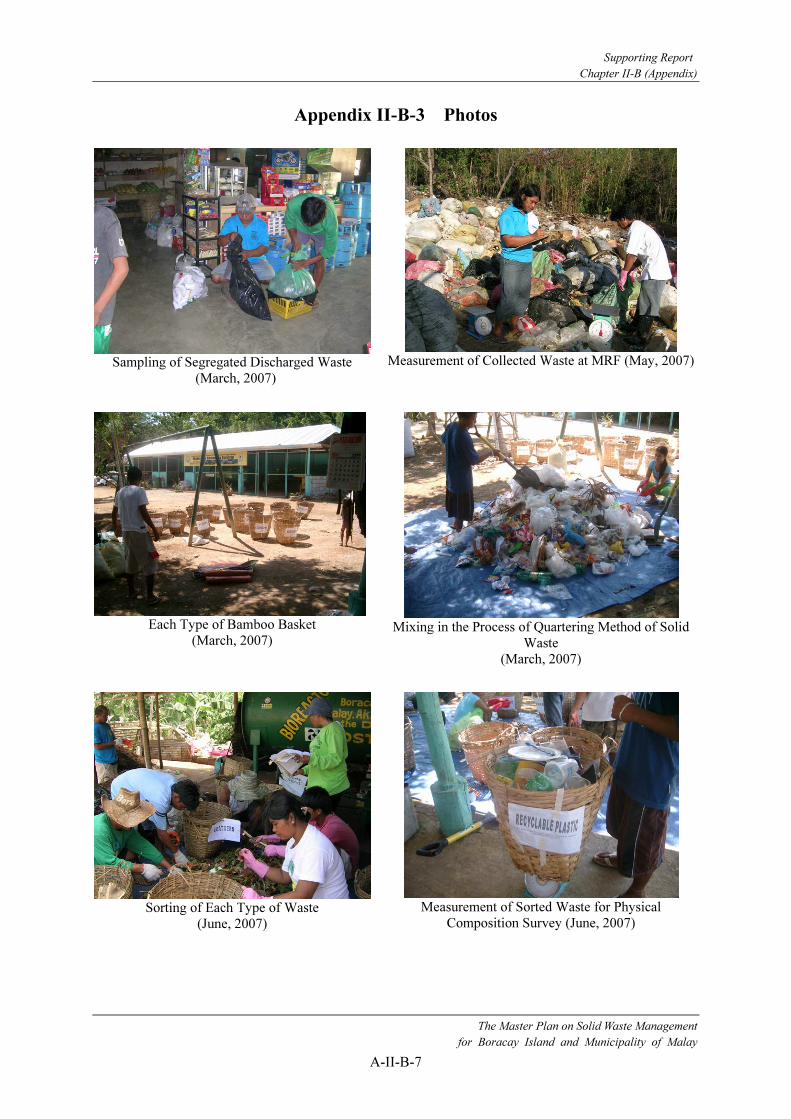
Supporting Report
Chapter II-B (Appendix)
The Master Plan on Solid Waste Management
for Boracay Island and Municipality of Malay
A-II-B-7
Appendix II-B-3 Photos
Sampling of Segregated Discharged Waste
(March, 2007)
Measurement of Collected Waste at MRF (May, 2007)
Each Type of Bamboo Basket
(March, 2007)
Mixing in the Process of Quartering Method of Solid
Waste
(March, 2007)
Sorting of Each Type of Waste
(June, 2007)
Measurement of Sorted Waste for Physical
Composition Survey (June, 2007)