Volume I: Approach and Frame work
131
P U V CM Perfor Urban Volume EPT UniMay 2010 rmanc n Wate e I: App versity 0 ceMe er and proach easure d Sani h and emen itatio Frame nt Fram on ework mewo ork fo or
Transcript of Volume I: Approach and Frame work

P
U
V
CE
M
Perfor
Urban
Volume
EPT Univ
May 2010
rmanc
n Wate
e I: App
versity
0
ce Me
er and
proach
easure
d Sani
h and
emen
itatio
Frame
nt Fram
on
ework
mewo
ork fo
or

PERFORMANCE MEASUREMENT FRAMEWORK FOR
URBAN WATER AND SANITATION
VOLUME I: APPROACH AND FRAMEWORK
CEPT University
May 2010

1
CONTENTS
Acknowledgements 2
Abbreviations 3
Volume I: Approach and Framework
Executive Summary 6
1. Introduction 10
2. PAS Performance Measurement Framework 12
2.1 Approach and Key Indicators in Performance Measurement 12
2.2 Reliability Assessment of Key Performance Indicators 24
2.3 Linking PMF to Accountability in State and Local Monitoring Systems 26
3. Process of Developing the Performance Measurement Framework 29 3.1 Review of International Efforts in Benchmarking 29
3.2 Review of Benchmarking Studies and Use of Performance Measurement
in India 39
3.3 Key Lessons from National and International Experiences 49
3.4 Pilot Test of Performance Measurement Framework 53
3.5 Stakeholder Consultations 56
References 58
Annexure: Tables 63
Volume II: List of Indicators and Reliability Assessment
1. List of Key Performance Indicators
2. Reliability Assessments for Key Performance Indicators
3. Local Action Indicators
Annexure: Performance Assessment System Questionnaire

2
Acknowledgements The Performance Assessment System (PAS) Project was initiated in early 2009. The development of the
Performance Measurement Framework for the Project was a key activity in the initial phase. Fortunately
for us, the Government of India’s Service Level benchmark framework was available as a basis to further
develop our work. The PAS project’s performance measurement framework has also drawn on an
intensive review of international literature on performance benchmarking in the urban water and
sanitation sector, as well as the use of such information in various countries by different stakeholders such
as utility associations, national governments and regulators.
The initial drafts of this framework were discussed in a series of consultative meetings. Our work has
benefited from the insights of a large number of resource persons. We particularly acknowledge feedback
from members of the PAS Project’s Project Advisory Committee and from participants at the Expert’s
group meeting held in Ahmedabad in September 2009.
The work on this review and measurement framework was carried out by a team led by Meera Mehta and
Dinesh Mehta with able contribution and support from Mona Iyer, Anitha Immanuel, Poorva Lalbhai and
Maitri Patel at the CEPT University. The framework and the checklist were discussed extensively with
PAS partners. They have contributed significantly to the development of the checklist and its field testing.
We would like to acknowledge the support of the entire team of partners, particularly Manvita Baradi,
Meghna Malhotra, M.C. Mehta and Arvind Singh of the PAS team from the Urban Management Centre,
and Sneha Palnitkar, N. Kusnur and Gautam Kirtane of the PAS team from the All India Institute of Local
Self Government. The report was edited by Anjali Sen Gupta.
The Performance Measurement Framework is being used in over 400 urban local bodies in the two
western states of Gujarat and Maharashtra. As several other states in India begin to launch state‐wide
performance assessment, the lessons and experiences in using this framework in Maharashtra and Gujarat
will be valuable. We see this as an evolving piece of work that will benefit from this experience.
Meera Mehta
Dinesh Mehta
CEPT University, Ahmedabad, India

3
Abbreviations
ADB Asian Development Bank
ADERASA Association of Water and Sanitation Regulatory Entities of the Americas
ASDWA Association of State Drinking Water Administrators
AWWA American Water Works Association
BESSY Benchmark and Statistic System
BOO Build, Own, Operate
BOT Build, Operate, Transfer
CA Chartered Accountancy
CASCWUA Central Asia and South Caucasus Water Utilities Association
CDM Clean Development Mechanism
CIB Continuous Improvement and Benchmarking
CMAG City Managers Association of Gujarat
CPHEEO Central Public Health and Environmental Engineering Organisation
CRA Water Regulatory Council
CUs Commercial utilities
CV Coefficient of variation
DANVA Danish Water and Wastewater Association
DEs Data elements
DMA Directorate of Municipal Administration (Maharashtra)
DoM Directorate of Municipalities (Gujarat)
EPA Environment Protection Agency
ESC Essential Services Commission
ESR Elevated Service Reservoir
EU European Union
EUREAU European Federation of National Associations of Water and Waste Water
Services
EWURA Energy and Water Utilities Regulatory Authority
FIPAG Fundo de Investimento e Património de Abastecimento de Água (Water
Supply and Asset Holding Fund)
GIS Geographic Information Systems
GMARP Gujarat Municipal Accounting Reform Project
GMFB Gujarat Municipal Finance Board
GoG Government of Gujarat
GoI Government of India
GoM Government of Maharashtra
IBNET International Benchmarking Network for Water and Sanitation Utilities
ICE Information, Communication and Entertainment (a special consumption ta
ISIP Information System Improvement Plan
IWA International Water Association
JMP Joint Monitoring Programme
JNNURM Jawaharlal Nehru National Urban Renewal Mission
km kilometre
KPIs Key Performance Indicators

4
LDG Local Development Grant
lpcd litres per capita per day
MIS Management Information Systems
MoLG Ministry of Local Government
MoU Memorandum of Understanding
MoUD Ministry of Urban Development
MoWI Ministry of Water and Irrigation
MSW Municipal solid waste
NEBC North European Benchmarking Corporation
NFHS National Family Health Survey
NG Nirmal Gujarat
NIS NWASCO Information System
NIUA National Institute of Urban Affairs
NPR National Performance Report
NRW Non‐Revenue water
NWASCO National Water and Sanitation Council
NWI National Water Initiative
NWSC Nairobi Water and Sewerage Company
O&M Operation and Maintenance
OFWAT Office of Water Services
ONEA National Office of Water and Sanitation
OPA Overall Performance Assessment
PAS Performance Assessment System
patraks Set of standard formats
PERPAMSI Persatuan Perusahaan Air Minum Seluruh Indonesia
PI Performance Indicators
PIPs Performance Improvement Plans
PMF Performance Measurement Framework
PSP Private sector participation
PWCs Provincial water companies
RALG Regional Administration and Local Government
RC Residual Chlorine
SALGA South Africa Local Government Association
SAWUN South Asian Water Utilities Network
SDE Sénégalaise des eaux
SEAWUN South East Asian Water Utilities Network
SG Swarnim Gujarat
SGBA Sant Gadge Baba Awards
SGG Swarnim Gujarat Goals
SNIS National Sanitation Information System
SNMA Sujal and Nirmal Maharashtra Abhiyan

5
SONES Société nationale des eaux du Sénégal
SRS Special Regulator Supervision
SLB Service Level Benchmarks
SWM Solid waste management
TDS Total dissolved salts
TERI Tata Energy and Resources Institute
TFC Thirteenth Finance Commission
UARL Unavoidable Annual Real Losses
UDD Urban Development Department
UHRC Urban health resource centre
UIDSSMT Urban Infrastructure Development Scheme for Small & Medium Towns
UIPM Urban Indicators and Performance Measurement
ULBs Urban local bodies
UN United Nations
UNDP United Nations Development Programme
USERS Urban Services Environmental Rating System
UWSAs Urban Water Supply and Sewerage Authorities
UWSS Urban Water Supply and Sanitation
VEWIN Vereniging van Waterbedriven in Nederland (Association of Dutch water
companies)
VUWSDP Vietnam Urban Water Supply Development Project
VWSA Vietnam Water and Sewerage Association
WDS Water Distribution Station
WHO World Health Organization
WOP Water Operators Partnership
WSAA Water Services Association of Australia
WSP Water and Sanitation Program
WSS Water Supply and Sanitation
WSSD Water Supply and Sanitation Department
WTP Water Treatment Plant

6
Executive Summary
Introduction Access to water and sanitation services in urban India is widespread, but little is known about the quality
and level of service, and coverage of the poor households. A key challenge in the sector in India is the lack
of adequate and reliable information. Very little is known about the quantity of water made available to
people, non‐revenue water, quality of water and coverage of poor households. For new investments in
water and sanitation to be effective, it is important to assess the performance of the existing system, as well
as ensure its sustainability and reach for the poor and unserved.
It is in response to this situation that the Centre for Environmental Planning and Technology (CEPT)
University is implementing the Performance Assessment System (PAS) Project, which is funded by the Bill
and Melinda Gates Foundation. Its overarching aim is to develop performance assessment systems for
urban water supply and sanitation at local and state levels. The PAS Project has three main components:
(a) Performance Measurement; (b) Performance Monitoring; and (c) Performance Improvement. This
report presents the Performance Measurement Framework (PMF) developed for the first project
component. The report is in two volumes. Volume I describes the approach and framework, and Volume II
presents the definitions and reliability grades of performance indicators as well as the detailed
questionnaire used for data collection from each urban local body. The PMF is being implemented in
Gujarat and Maharashtra in over 400 cities. The proposed PMF draws on the Government of India’s
ongoing initiative of standardised Service Level Benchmarks (SLB) for urban water supply and sanitation
sectors developed by the Ministry of Urban Development (MoUD). The framework also draws on an
extensive review of previous benchmarking efforts globally and in India. Figure 1.1 (see Chapter 1)
outlines the process of developing the framework.
PAS Performance Measurement Framework The PAS PMF includes the overall approach, key indicators for performance measurement and reliability
assessment to respond to data quality issues.
Approach and Key Indicators in Performance Measurement: Figure 1 outlines the approach to PFM for the PAS Project. The key performance indicators are distinguished for service delivery outcomes
(or main goals of public services) and intermediate operational outcomes that reflect the plans and reforms
needed to achieve the service delivery goals. This enables distinct identification of goals and reforms
needed to achieve these goals. Goals are identified on the basis of a review of the Government of India
(GoI) and state government objectives. Table 2.1 (in Chapter 2) provides details of key service goals and
related benchmarks for: (a) universal coverage; (b) levels and quality of services; and (c) financial
sustainability.

7
Figure 1: PAS Performance Measurement Framework
Intermediate outcomes reflect reforms needed to achieve the service goals as illustrated in Figure 2.2 (in
Chapter 2). Many programmes by the GoI and some state governments have linked programme funding
to the implementation of key reforms that represent such intermediate outcomes. For example, under the
Jawaharlal Nehru National Urban Renewal Mission (JNNURM) two key reforms focus on access for the
poor and on ensuring financial sustainability in operations through full recovery of operation and
maintenance costs through user fees. Based on this, 10 key reforms cutting across the three sub‐sectors
have been identified, as shown in Table 2.2 (in Chapter 2).
In the PAS PMF, additional indicators have also been identified for local government actions to improve
performance on equity, non‐revenue water, water quality and cost recovery. While goals and reform
indicators will be monitored by both higher levels and local governments themselves, indicators for local
action are more suitable for local level planning and monitoring. (See Table 2.3 in Chapter 2.)
Reliability assessments for data quality: Data reliability scales have been developed for each indicator. Five scales of reliability are used: A+ being the highest reliability (fully automated systems for
data management) and D being the lowest (no records maintained). The questionnaire used for PAS
includes questions on data sources and data management for all key information. An advantage of this
approach is that it eliminates subjective assessment of reliability estimates.
Use of PAS in state and local monitoring systems: Drawing on national and international
experiences of benchmarking, it is evident that the effective use of performance indicators is essential to
ensure its sustainability. The PMF has been developed with an idea of creating the necessary institutional
incentives at both state and local levels. These institutional incentives result from the accountability faced
by the urban local bodies (ULBs). Under the monitoring and improvement components of the PAS Project,
PFM will be used for upward accountability through national and state monitoring, internal accountability
through use of PFM in ULB level processes and downward accountability to customers through an
effective consumer grievance redressal system.
Process of Developing the Performance Measurement Framework The PAS performance measurement framework draws on the MoUD’s SLB initiative as well as a review of
international efforts, past studies in India and use of performance information at the state and local levels.
Figure 1.1 (in Chapter 1) highlights the overall process followed in its development.
B. Intermediate Operational Outcomes – Key Reforms
Efficiency in service operations
Equity in service delivery
A. Service Delivery Outcomes – Service Goals
Universal access and coverage
Service levels and quality
Financial sustainability
C. Selected Indicators for Local Action
For instance, for equity, water quality, non‐revenue water,
consumer grievance redressal, staffing, revenue and billing
8
Review of international efforts in benchmarking: Over the past two decades, there have been a
number of efforts to develop and standardise the approach to benchmarking in the water sector. Notable
among them are the efforts of the International Benchmarking Network for Water and Sanitation Utilities
(IBNET), American Water Works Association (AWWA) and the International Water Association (IWA).
IBNET and AWWA provide ready–to‐use templates and a web platform for data collection, analysis and
dissemination of results. The benchmark indicators relate to coverage, service levels, efficiency and
financial viability. Benchmarking has been used by utility associations in several different countries and
regions for comparative assessments and process benchmarking. National governments have used
benchmarking initiatives for performance‐based grants. Regulatory agencies use comparative
benchmarking to drive improvement in service performance. In other contexts, government owners use
performance‐based contracts as a regulatory tool.
Review of benchmarking studies and use of performance measurement in India: A few studies have been carried out for performance benchmarking in the water and sanitation sector in India. Unlike
the international experience, these studies have been piloted in a few cities as ‘one‐off’ exercises. Some of
the issues related to standard definition and measurement that emerged through these few studies have
been addressed in the recent GoI initiative to develop the SLB. In addition, performance information is
being increasingly sought in reform‐linked programmes, such as the JNNURM, as well as for various
awards by state governments. State governments also collect performance information in their routine
monitoring, though the reliability of this is not always ensured. The recommendation by the 13th Finance
Commission that requires state governments to use benchmarking to access performance‐based grants
provides an incentive for state governments to make PAS activity more systematic, regular and reliable.
Various state governments have made use of urban water supply and sanitation (UWSS) performance
information for their routine monitoring. Our review mainly focuses on the efforts in Gujarat and
Maharashtra. UWSS performance information in Maharashtra has been used in that state for three types of
activities: (a) their own reform‐linked investment programme, that is, the Sujal and Nirmal Maharashtra
Abhiyan (SNMA); (b) for an innovative and home‐grown sanitation award scheme called the Sant Gadge
Baba awards; and (c) for their regular routine monitoring. As compared to the national and state level
studies and programmes, there is very little effort to understand and review the processes at the local level
by ULBs. In Gujarat and Maharashtra the ULBs themselves are the service providers. It is important to
involve the ULBs in data capture, analysis and review, and in the preparation of monitoring reports. ULBs
can use PAS indicators for decision‐making and for dissemination to the consumers. Mapping of some key
processes and their assessment to improve information flows within a ULB is also necessary to improve
decision making and increase efficiency.
Pilot test of Performance Measurement Framework: The PMF was pilot tested in 32 cities in the two
states. The first step in pilot testing was to develop a questionnaire for data capture along with detailed
guidelines. The questionnaire was developed as a spreadsheet to simultaneously generate key indicators.
The key lessons drawn were in terms of the process of data capture and measures needed to address data
availability and reliability. Based on the results and lessons from pilot tests as well as feedback from the
Expert Group meeting held following the pilot tests, the questionnaire and PMF tool were finalised for the
state‐level roll out.
Stakeholder consultations: A number of different consultations were carried out during the
development of the PMF. The main purpose of these consultations was to share the PMF tool with both
local and state level stakeholders, and share the results emerging from the pilot tests. For this purpose, a
number of meetings and workshops were held in both the states. Specific meetings with pilot city
representatives were also held for orientation and to familiarise participants with the need for

9
performance measurement. These consultations have been carried out throughout the process of
developing and pilot testing the PMF. They have both contributed to the conceptual issues, and helped to
create awareness about the PAS Project. After the first round of surveys, the results will again be shared
with these stakeholders through meetings, workshops and the web portal being set up for the PAS Project.

10
1. Introduction Though access to water and sanitation services in urban India is widespread, there is not enough
information about the quality and level of service, and coverage of poor households. This lack of adequate
and reliable information is a key challenge in the sector in India. Very little is known about the quantity of
water made available to people or of non‐revenue water, or about quality of water and coverage of poor
households. For new investments in water and sanitation to be effective, it is important to not only assess
the performance of the existing system, but to also ensure its sustainability and reach for the poor and
unserved sections of the population.
It is in response to this situation that Centre for Environmental Planning and Technology (CEPT)
University is implementing the Performance Assessment System (PAS) Project, which is funded by the Bill
and Melinda Gates Foundation. Its overarching aim is to develop a set of key performance indicators for
urban water and sanitation, develop an assessment system at local and state level, and link the planning
and fund allocation process to performance. The PAS project has three main components: (a) Performance
Measurement; (b) Performance Monitoring; and (c) Performance Improvement. This report presents the
Performance Measurement Framework (PMF) developed for the first component. The PMF has been
developed for state‐wide implementation in Gujarat and Maharashtra. It is being used to develop a water
supply and sanitation performance profile for each of the over 400 urban local bodies (ULBs) in these two
states. The results will be used for comparative monitoring and developing improvement plans.
The PMF draws on the Government of India’s ongoing initiative of standardised Service Level
Benchmarks (SLB) for urban water supply and sanitation sectors. For both Gujarat and Maharashtra, the
year 2010 is a landmark – it is the golden jubilee year of their formation from the erstwhile Bombay state.
Both state governments have ambitious programmes and targets for the golden jubilee year through the
ongoing programme initiatives: the Sujal and Nirmal Maharashtra Abhiyan in Maharashtra and Swarnim
Gujarat Goals (SGG) in Gujarat. Efforts have been made to link the PMF to these goals and reforms. The
PMF also draws on an extensive review of previous benchmarking efforts internationally and in India.
Figure 1.1: Iterative Process of Developing PAS Performance Measurement Framework
It includes key performance indicators for goals and reforms using an accountability framework. Efforts
were also made to develop indicators to capture equity concerns and indicators for local level actions for
performance improvement. A key lesson from previous such efforts in India has been the lack of reliable
data. To assess this, the proposed PMF includes an approach to reliability assessment drawing on
reliability assessment under the SLB as well as other international efforts.
Stakeholder Consultations
State agencies, urban local body officials
Sector experts and resource persons
Review of Efforts in India
Indian studies and surveys
Ongoing programme‐linked
monitoring and routine monitoring
at state and local levels
Review of International Efforts
Benchmarking frameworks
Governments, utility associations,
regulations, performance contracts
Pilot Studies
Development of the Performance
Measurement Framework tool
Assessing data availability and reliability
Performance Measurement Framework
Performance indicators/reliability
assessments/data checklists
Key Findings and Lessons

11
A questionnaire was developed for data capture. This was field tested through pilot studies in each state
and lessons were incorporated in the final questionnaire and in the guidebook. Extensive stakeholder
consultations were carried out during the process of developing and pilot testing. Using this
questionnaire, information is now being collected from all the 400 ULBs in Gujarat and Maharashtra.
Box 1.1: Performance Assessment System Project
The Performance Assessment System (PAS) Project aims to build an information system for all urban
local governments in two states of India (Maharashtra and Gujarat). It aims to develop a reliable and
sustainable PAS for urban water and sanitation services. It includes: Performance Measurement,
Performance Monitoring, and Performance Improvement.
Performance measurement refers to development and implementation of measurement metrics. These
relate to development of indicators for performance on service goals and reforms measures. Performance
monitoring includes setting up appropriate systems at the state level for annual and real‐time information,
and detailed analysis of indicators, developing benchmarks, and documenting good practices. A dedicated
web platform will be set up in each state to host this information with access by urban local bodies and
other stakeholders. Performance monitoring will be also linked to performance linked grants, monitoring
performance on reform commitments under the Jawaharlal Nehru National Urban Renewal Mission and
rewards for better performing local governments. Performance improvement relates to use of information
to improve service performance. The Project will provide support to local governments to develop
performance improvement plans for reaching the poor and unserved, and increasing financial viability.
Performance Improvement
Access for the poor and financial
viability
Development of guidance modules
Preparation of Performance
Improvement Plans
Civil society/private sector role
Performance Monitoring and Dissemination
Monitoring:
Monitoring reform commitments under
JNNURM/UIDSSMT
Monitoring under state programmes
Dissemination:
Web platform for urban local bodies
Web posting of good practices
Web posting of profiles by urban local
bodies
Incentives by the state government:
Performance/Performance Improvement
Plans linked grants and funding
Performance linked awards for urban
local bodies
Reviews to identify scope and targets for
performance improvement
Performance Measurement
Development of indicators
Information collection at urban
local body level

12
2. PAS Performance Measurement Framework The PAS Performance Measurement Framework (PMF) is developed for urban water supply and
sanitation, where sanitation includes management of excreta, wastewater and municipal solid waste
including collection and disposal. This chapter presents the approach and key indicators for performance
measurement. It also outlines the approach to reliability assessment to respond to data reliability issues.
2.1 Approach and Key Indicators in Performance Measurement
Figure 2.1 outlines the approach of Goals – Reforms – Local Actions as the performance measurement
framework for the PAS Project.
The key performance indicators are distinguished for service delivery outcomes (or main goals of public
services) and intermediate operational outcomes that reflect the plans and reforms needed to achieve the
service delivery goals. This enables distinct identification of goals and reforms needed to achieve these
goals. In the PAS performance framework additional indicators have also been identified for local
government actions to improve performance on selected key reform areas such as equity, non‐revenue
water, water quality and cost recovery. While goals and reforms will be monitored by both higher levels
and local governments themselves, indicators for local action are more suitable for local monitoring and
for performance improvement planning.
Figure 2.1: PAS Performance Measurement Framework
B. Intermediate Operational Outcomes – Key Reforms
Efficiency in service operations
Equity in service delivery
A. Service Delivery Outcomes – Service Goals
Universal access and coverage
Service levels and quality
Financial sustainability
C. Selected Indicators for Local Action
For instance, for equity, water quality, non‐revenue water,
consumer grievance redressal, staffing, revenue and billing

13
A. Service Delivery Outcomes – Service Goals
Based on a review of objectives of the Government of India and the two state governments, the main
service goals are for: a) universal access and coverage, b) adequate levels and quality of services, and c)
financial sustainability in service operations. The SLB initiative of the Government of India refers to these
goals as “benchmarks”. Drawing on the SLB Initiative, and the Government of Maharashtra’s SNMA and
Government of Gujarat’s SGG, the PMF has identified key service goals – five each for the three sub‐
sectors of water supply, wastewater and sold waste management. Table 2.1 provides details of these goals
and related targets generally set out under these government initiatives.
Table 2.1: Service Goals: Key Performance Indicators and Benchmarks
Goals Water supply Sanitation/wastewater Solid waste
management
Universal
access and
coverage
1. Coverage: % of households
with individual connections to
water supply network (100%)
1. Coverage: % of households
with access to individual
toilets (100%)
1. Coverage: % of
households and
establishments covered by
municipal daily door‐to‐
door SWM services (100%)
2. Coverage: % of households
with individual connections to
sewerage network (100%)
Service levels
and quality
2. Per capita supply of water in
litres per capita per day (lpcd):
(172 lpcd for metro cities, 155
lpcd for other cities with
sewerage and 92 lpcd without
sewerage)
3. Collection efficiency: %
collection of wastewater
generated where
sewerage/underground
drainage exists (100%)
2. Collection efficiency: %
collection of solid waste
generated in the city (100%)
3. Continuity of water supply:
(i) short term: daily supply at
regular hours; (ii) 24*7 over time
4. Sewage treatment: %
Capacity to treat wastewater
collected through
sewerage/open drains to
required standards (100%)
3. Segregation: % of waste
at disposal/treatment point
segregated (100%)
4. Quality of water supplied: %
of samples at WTP and
consumer end meeting the
required standards (100%)
4. Recycling: % of total
solid waste recycled or
processed (>80%)
Financial
sustainability
5. Cost recovery: % recovery of
O&M costs for water supply
through ULB level taxes and
charges (100%)
5. Cost recovery: % recovery of
O&M costs for wastewater
through ULB level taxes and
charges (100%)
5. Cost recovery %
recovery of O&M costs for
SWM through ULB level
taxes and charges (100%)
Note: Figures in brackets are the goals (benchmarks) under the GoI’s SLB Initiative. Some benchmarks have been adjusted to
reflect the Central Public Health and Environmental Engineering Organisation (CPHEEO) norms or the situation at the state
level. For per capita supply refer CPHEEO (1999) Table 2.1, p. 11.
a. Universal access and coverage of services – Over the past few years, there has been greater recognition of the need to provide individual household‐level services to all residents in an urban area.
This is in response to demand pressures and rising income levels in urban areas. However, the articulation
of this goal across the three different sub‐sectors varies considerably:
o Water supply: In the last decade, basic access to water supply services in Indian cities has
reached 96 per cent of the urban population. However, less than 50 per cent of population has

14
access to individual household‐level water connections.1 This highlights the importance of moving
from community‐level water provision to focussing on the goal of universal access to individual
water connections. Universal access would also imply that the population residing in slum
settlements has individual household level connections.
o Sanitation and wastewater: The situation in urban areas is quite bad regarding sanitation. It is estimated that around 75 per cent of the urban population has access to sanitation, but only about
one‐third of the households have individual toilets. The key concerns in urban sanitation relate to
excreta disposal. Sewerage system exists in 35 per cent of large cities and, even in these, the
average coverage is limited to 58 per cent of the population.2 Thus, for sanitation access, two goals
are important: universal access to individual toilets, and connection to a sewerage network. It is
likely that sewerage access remains a long‐term goal for many smaller cities.
o Solid waste management: Solid waste services in urban India have received considerable
importance in recent years due to the Supreme Court of India’s directions to all urban local bodies
(ULBs). There is a specific focus on door‐to‐door collection and segregation of waste. Thus,
universal access to door‐to‐door services is an important service goal in India. It essentially refers
to the proportion of total households that are provided such door‐to‐door services by a municipal
authority for collection of solid waste.
b. Adequate levels and quality of services – The indicators for these goals relate to nationally agreed
standards. The specific indicators for each sub‐sector include:
o Water supply: The goals for level and quality of water supply services have generally been based
on the norms set out by the Central Public Health and Environmental Engineering Organisation
(CPHEEO) of the Government of India (GoI).3 While these norms are used as design standards, in
actual service delivery ULBs supply water for an average of two hours a day and the quantity of
water supplied is often less than what the standards prescribe. Thus, the service goal for quality
combines aspects related to quantity (per capita water supply), continuity (days and hours of water
supply) and quality (of meeting the national norms in all seasons). In recent years, one concept that
has captured the imagination of many policymakers is the 24*7 water supply that helps to address
aspects of quantity, continuity and quality of water supply.4
o Sanitation and wastewater: For wastewater, the emphasis on service quality is essentially in
terms of proper collection of wastewater and quality of treatment to ensure that the norms for
wastewater effluents set by national (CPHEEO and Central Pollution Control Board) and state
agencies (such as the State Pollution Control Boards) are met effectively. This necessitates
1 Based on analysis reported by JMP (2008). This may be even more pronounced as more detailed inquiry in India
based on a recent countrywide Health Survey suggests that overall access to basic services is 95 per cent as
compared to the JMP projections of 96 per cent. National Family Health Survey (NFHS) was conducted in 2005‐
06 which provided country‐ and state‐wide estimates for urban areas. See UHRC (2008) for NFHS results. 2 As given in NIUA (2005): The study covered 300 cities including metropolitan and selected Class I and II cities. 3 CPHEEO 1999a, 1999b and 1999c. These largely reflect the international norms as set out by the World Health
Organization (WHO). 4 Besides providing continuous water supply, 24*7 helps to avoid excessive use through better demand
management, and to improve water quality as the seepage into pipe network is avoided. Continuous supply also
enables use of consumer metering. It would be less expensive if all the coping costs are taken into account.
Finally, it makes it possible to provide continuous water supply all consumers, including poor households, who
are otherwise unable to afford the storage costs to ensure continuous supply in their dwellings. (Refer
Dahasahasra 2007 and Jacobs 2007.)

15
adequate capacity for both collection of wastewater and treatment. Consumer grievance redressal
is also critical in ensuring service quality.
o Solid waste management: The focus in solid waste management (SWM) is on ensuring quality
of collection, especially to ensure segregation of municipal waste to meet the standards as laid
down by the GoI in the Solid Waste Management and Handling Rules, 2000.
c. Financial sustainability in service operations – In improving water and sanitation services, an
emphasis is generally needed on financial sustainability. For example, previous studies suggest that most
cities in India fail to recover their operation and maintenance (O&M) costs.5 In India, the emphasis is
placed on recovery of O&M costs, as the capital investments in urban WSS is usually supported with grant
funds from state and national governments. For example, under the Jawaharlal Nehru National Urban
Renewal Mission (JNNURM), capital funds for water supply and sanitation is provided by the national
and state governments as grants on a condition that ULBs will achieve 100 per cent recovery of their O&M
costs through local charges and taxes. The key indicators across the three sub‐sectors thus focus on
assessing the extent of recovery of O&M costs. An important aspect here is to properly measure O&M
costs including provision for regular and preventive maintenance. Often, ULBs do not provide for
adequate preventive maintenance needed to ensure infrastructure sustainability.
B. Intermediate Outcomes – Key Reforms
Intermediate outcomes reflect reforms needed to achieve the goals or service delivery outcomes. To
identify the key reform measures, specific actions needed to achieve the service goals were identified. This
is illustrated for water supply in Figure 2.2.
Many programmes by the Government of India and some state governments have linked programme
funding to implementation of key reforms. For example, under the JNNURM two key reforms focus on
access for the poor and on ensuring financial sustainability in operations through full recovery of O&M
costs through user fees. Similar measures are also envisaged under the programmes of the two state
governments: the Sujal Nirmal Maharashtra Abhiyan (SNMA) of the Government of Maharashtra and
Swarnim Gujarat of the Government of Gujarat.6 The review of other national and international
benchmarking efforts also suggests several intermediate outcome indicators that need to be captured. A
key gap in the current benchmarking efforts relates to measuring equity in service delivery. In low and
medium income countries like India, with nearly one‐fifth of urban population residing in slums, it is
important that equity in service delivery is captured in performance assessment.
Based on these factors, key reforms have been identified and grouped in those related to: (a) efficiency in
service operations; and (b) equity in service delivery. An effort has been made to identify reforms and
related key performance indicators for which it is possible to specify benchmarks. It is likely that some of
the indicators suggested for local action in the next section may move here after the first round of
comparative assessments are completed across all the cities.
5 For example, in the MoUD and ADB (2007) study only seven out of 20 cities, and in the CRISIL (2007) study
only three out of 10 cities, covered their O&M costs through local taxes and charges for water supply. An older
study of 300 towns and cities also reports that 80 per cent were unable to cover their O&M costs for water supply
(NIUA 2005). 6 The reforms under these programs are captured to some extent in Annex A.

16
Figure 2.2: Illustrative Reforms to Achieve Service Goals for Water Supply
a. Efficiency in service operations is a key aspect for improving service delivery. This helps in
improved services as well as reduction in costs. Drawing on various earlier efforts and commonly accepted
good practices identified in Table 2.2, a set of key performance indicators (Table 2.3) have been identified.
Table 2.2: Possible Reform Actions to Achieve Service Goals for all Sub‐sectors
Reform actions
Efficiency in service operations
1 Ensure reduction of non‐revenue water to acceptable benchmark levels
2 Ensure treatment of wastewater to acceptable standards
3 Plan for reuse of wastewater for unbilled uses (for example, parks) and for billed uses (for example,
industry/agriculture)
4 Ensure that solid waste disposed through landfill is through scientific landfill sites
5 Efficiency in consumer grievance redressal as per service charter for all three sub‐sectors
6 Introduce full metering and ensure functioning for all water supply connections
7 Improve collection efficiency of current demand for: (a) water supply; (b) wastewater; and (c) SWM
Equity in service delivery
8 Ensure access to individual connections/services for all households across different zones in the municipal area
for water supply, wastewater and solid waste collection
9 Ensure full coverage of individual services in slum settlements for all three sub‐sectors
For water, the emphasis on efficiency is captured through two critical parameters related to reduction of
non‐revenue water (NRW) and extent of metering of water connections. Both are important steps in
moving towards the service goal of 24x7 water supply and improving overall efficiency in service delivery.
For wastewater and SWM, the emphasis is on quality of wastewater treated and scientific disposal of
municipal waste as well as the extent of reuse of wastewater or recovery of municipal waste. The approach
to implement improved service levels also reflects a goal of strong consumer orientation as reflected in the
service charters for urban local governments and adherence to these in meeting consumer grievances. For
urban local governments, consumer complaints are linked with adequacy of services. Thus, efficiency in
addressing and resolving consumer grievances is an important measure of good service delivery.
Efficiency in collection of local taxes and charges is important in achieving financial viability. This is an
important aspect that needs emphasis before resorting to tariff increases to avoid passing costs of
inefficiencies onto consumers.
Universal access
and coverage
Quantity of
water supply
Continuity of
water supply
Quality of water
supply
100% recovery of
O&M costs
Reduce non‐revenue water, physical
losses and illegal connections
Ensure high collection efficiency in
current demand for taxes and
charges
Optimise on unit electricity costs
and total O&M production costs
Ensure proper quality monitoring
Identify and cost effectively develop
sources of water of adequate quality Continuous water supply to avoid seepage
in water pipe network
Ensure spatial equity in supply of
water along with metering Ensure adequate staffing for water
supply activities Ensure metering and reduction in
physical losses
Reduce physical losses to economically
acceptable levels Identify and cost effectively develop sources of
water of adequate quality Ensure spatial equity in supply of water along
with metering
Fully cover municipal area with water supply distribution network
Ensure affordable water connection
charges for the poor Identify and regularise illegal
connections Provide individual connections to all
slum households Ensure all zones in city are covered

17
b. Equity in service delivery: Two aspects of equity are important for delivery of water supply and
sanitation services in Indian cities. In most Indian cities there is considerable spatial variation in access to
individual services due to inadequate network. These variations can be minimised by extending trunk and
distribution network in unserved areas. For measuring spatial variations in service levels, it is important to
define the spatial unit of measurement. Generally information within a ULB is available for many different
spatial units. For example, population information is available for census wards, which are different from
the electoral wards. There are also administrative zones, water supply zones and solid waste zones. Given
the diversity of spatial units at which information is maintained in Indian cities, a flexible approach has
been adopted for the PAS Project. Information about various zones in a city is mapped and analysis is
done through maps. An indicator for spatial equity in services is captured through coefficient of variation.
This analysis will also be backed by appropriate representation on maps for ease of visualisation. Under
the PAS Project, basic maps will be prepared for all ULBs to enable spatial analysis of selected key
indicators (Figure 2.3).
Figure 2.3: Spatial Analysis Using Maps
A second set of equity concerns relate to problems faced by slum dwellers in accessing water and
sanitation services through individual connections. While it is common in most Indian cities to provide
shared services in slum areas, slum residents have poor access to individual services. This may be due to
policies that link provision of house level service to tenure issues, high cost of connection relative to
income or procedural issues that require time and effort to overcome bureaucratic hurdles. Equity in
service provision is captured by an indicator that reflects coverage of household level individual services
(for water supply, sewerage, toilets and door‐to‐door solid waste collection) in slum settlements.7 Slum
settlements include both notified and non‐notified settlements; special efforts may be required to identify
all slum settlements.
7The definition of slum areas used is as adopted by the Census of India 2001 as follows: i) All areas notified as
‘Slum’ by state/local government and UT administration under any Act; ii) All areas recognised as ‘Slum’ by
state/local government and UT administration, which have not been formally notified as slum under any Act; iii)
A compact area of at least 300 population or about 60‐70 households of poorly built congested tenements, in
unhygienic environment usually with inadequate infrastructure and lacking in proper sanitary and drinking
water facilities. However, for cities smaller than 100,000 population, settlements with at least 25 households are
also considered as slum settlements as per the Draft Slum Policy of the Government of Gujarat.

18
Table 2.3: Key Performance Indicators and Benchmarks to Monitor Reforms
Performance indicator Benchmark
Efficiency in service operations
1 % of non‐revenue water to total water supply* <25%*
2 % of wastewater samples treated to required standards* 100%*
3 % of wastewater reused for billed or unbilled uses* >20%*
4 % of municipal solid waste disposed off through scientific landfill sites* 100%*
5 Efficiency in consumer grievance redressal as per service charter for all three sub‐sectors* 100%*
6 % of total water supply connections with functional meters* 100%*
7 % collections to current billed demand for all three sub‐sectors* >90%*
Equity in service delivery
8 Coefficient of variation (standard deviation divided by mean) of zonal values of indicator
denoting % of households with individual household level connection/service and per capita
for water supply, wastewater and solid waste collection**
0
9 % of slum households with: (a) individual water connections; (b) individual toilets and
sewerage connections; and (c) and door‐to‐door solid waste management collection 100%
Note: Indicators with asterisks (*) are covered under the GoI’s SLB Initiative; ** The coefficient of variation (CV) or ’relative
variability’ equals the standard deviation divided by the mean. It is expressed as a ratio.
C. Indicators for Local Action
Under the PAS performance measurement framework (PMF), the concept of additional indicators for local
action has been introduced for some of the key performance indicators. These indicators are often referred
to as ‘drill‐down’ indicators as they serve two important purposes. First, they provide more details on the
key performance indicators and help explain the indicator better to the utility managers. Second, and more
importantly, these indicators help in identifying local actions required to achieve improved performance
on service goals and reforms.
Table 2.4 provides details of categories of local action indicators across the main goal and reform themes.
Some of these are described further along with illustrative indicators. It is expected that, as the local ULBs
become familiar with PAS and begin to use it more effectively for local level planning and decision‐
making, there may be a need to develop more indicators for local action and refine the ones suggested
here.
Table 2.4: Categories for Local Action Indicators Goals and reform themes Category of local action indicators
Access and coverage Coverage of utility network across the city
Service levels and quality Quantity of water supply
Quality of water supply
Financial viability Unit costs and revenues
Tariffs and billing
Goals and reform themes Category of local action indicators
Efficiency Non‐revenue water and physical losses
Storm water network
Complaint redressal
Staffing
Equity Equity across slum settlements
Access and coverage: An analysis of the gaps in service provision of household connections requires an assessment of the distribution or collection network in the city. Table 2.5 lists the related indicators.

19
Table 2.5: Indicators for Local Action: Access and Coverage
Storm water drainage
Coverage of utility
network across city
% of inhabited municipal area covered with water supply distribution network
% of inhabited municipal area covered with sewerage network
% of inhabited municipal area covered with sewerage and sullage network
Coverage of storm water drainage network
Quantity and quality: For water supply, the most common problem generally articulated is the lack of
availability of sources to meet the current and projected demand. This requires an assessment of
availability of total supply from current sources and through ongoing projects. In case of issues related to
water quality monitoring, it would be necessary to assess quality at all critical points such as a source,
water treatment plant, water distribution system and at the consumers’ end to identify the probable
location of the problems. Table 2.6 provides illustrative indicators.
Table 2.6: Indicators for Local Action: Quantity and Quality for Water Supply
Water supply
Quantity Percentage of estimated water demand over next three years to available supply from all current sources and
immediate plans to augment through ongoing projects (%)
% of connections that are metered
% of meters that are functional
Average consumption per connection (for residential and others) where consumer meters are in place and
are functional (litres/day)
Quality Quality of water supply at source (fluoride)
Quality of water supply at water treatment plant (residual chlorine (RC), bacteriological, total dissolved salts
(TDS))
Quality of water at elevated service reservoir level (RC, bacteriological, TDS)
Quality of water at consumers’ end (RC, bacteriological, TDS, fluoride)
Non‐revenue water and physical losses: A key aspect among most water utilities worldwide is to focus
on managing NRW to acceptable limits. In many countries, performance contracts with public or private
water utilities use NRW as a key performance measure.8 Despite the importance of NRW to ensure
efficiency in service provision and avoid unnecessary leakages and losses, this has not received adequate
emphasis in most Indian cities and in the water sector in India in general. Under JNNURM and in
Maharashtra, water audits have been advocated to avail funding for water sector projects. This has made it
possible to find out the extent of NRW including physical losses and unauthorised use through illegal
connections. Given a scenario that most cities in India do not practice metering, the challenge is to devise
simple methods that can be used to estimate water supply and water consumption.
Based on the literature available for non‐revenue water assessment, management of physical losses, and
the emerging experience from selected cities in Maharashtra, three types of indicators for local action have
been identified (refer to Table 2.8).
The first set of indicators identifies the share of different components of NRW drawing mainly on the
water balance approach developed by the International Water Association (IWA) (Table 2.7). The IWA
8 For example, this measure is used in the annual performance contract between ONEA, the public water utility
in Burkina Faso, and the national government of Burkina Faso. Similarly, the utility in Uganda uses physical
losses as one of the performance indicators for its internal contracts. On the other hand, in Senegal this is an
important parameter in performance contracts between the private operator (SDE) for urban water services,
SONES the asset holding company and the Water Department, Government of Senegal. Refer to Baieti et al.
(2006), Tremolet (2005) and Brocklehurst (2004) for more details and cases.

20
distinguishes between authorised consumption and water losses. Unbilled authorised consumption may
consist largely of supply to parks, temples and such other uses that are not charged. In most Indian cities
apparent losses largely comprise unauthorised use of water through illegal connections. While this has
been difficult to measure, a few cities in Gujarat and Maharashtra have taken steps to identify and
regularise illegal connections. The real physical losses are likely to be high, especially in cities with old
distribution networks and in service connections that lack adequate maintenance and quality control.
While it may be possible to estimate leakage on transmission and distribution mains, it would be difficult
to estimate leakage on service connections because of unauthorised consumption from illegal connections.
An indicator is suggested to capture the regularisation of all identified illegal connections.
Table 2.7: Water Balance Chart from International Water Association System
input
volume
Authorised
consumption
Billed
authorised
consumption
Billed metered consumption Revenue water
Billed unmetered consumption
Unbilled
authorised
consumption
Unbilled metered consumption Non‐revenue water
Unbilled unmetered consumption
Water losses Apparent
losses
Unauthorised consumption
Customer metering inaccuracies
Real losses Leakage on transmission/distribution mains
Leakage and overflow at utility’s storage
tanks
Leakage on service connections up to point
of customer metering
Source: Alegre et al. 2006, Table 60, p. 128.
A second set of indicators assess performance in relation to the network characteristics. Two indicators for
losses per connection per metre of pressure levels, and losses per kilometre (km) of main network help
assess the extent to which physical losses can be economically managed. The indicator for Unavoidable
Annual Real Losses (UARL) measures the lowest technically achievable real loss for well managed and
well maintained systems with more than 5,000 service connections. Based on UARL, an Infrastructure
Leakage Index can be calculated as a ratio of current annual volume of real losses to UARL.
The third set of indicators for local action helps to measure the financial impact of physical losses. One
indicator measures the annual costs of real losses and the other indicator measures annual revenue loss
from NRW. This indicator is relevant in those ULBs that levy water charges through meters and have a
high proportion of connections monitored through functional meters.
Table 2.8: Indicators for Local Action: Non‐revenue Water
Water balance % Authorised and unbilled consumption to total supply
% Losses from source to water treatment plant (WTP)
% Losses from WTP to water distribution station (WDS)
% Losses from WDS to final consumption (includes both leakage on service
connections and unauthorised consumption)
% of identified illegal connections that are regularised
Indicators for
operational assessment
of water losses
Water losses per connection (litres)
Real losses per service connection per month per meter (head) pressure (litres)
Water losses per mains length (litres)
Unavoidable Annual Real Losses (UARL) (million litres)
Infrastructure Leakage Index (ratio)
Indicators for financial
impact of water loss
Annual cost of losses (real and apparent) (rupees)
Annual revenue loss from NRW (rupees)
Sources: Compiled from IBNET, Alegre et al. 2006 and Agarwal 2008.

21
Complaint redressal and staffing: Complaints from consumers are an important measure of service
delivery. A set of indicators related to complaints and staffing are listed in Table 2.9, to provide a more
detailed look at the nature of complaints and the staffing pattern. For complaint redressal it is important to
find out the share of different types of complaints that are received for each of the three sub‐sectors. Table
2.9 lists the more common complaints from those listed in the service charters used in most cities. These
indicators need to be reviewed and refined based on results from pilot studies. For staffing, adequacy of
staff could be a key issue, especially in smaller towns. At present, in both Gujarat and Maharashtra there is
a cap on any new recruitment by municipalities. It is therefore useful to assess the extent to which the
approved positions have been filled for each of the three sub‐sectors. Also, details on total staff in relation
to operational size of the ULB in terms of total connections or road length for sweepers is important. Once
comparative information across cities is available, useful benchmarks can be developed.
Table 2.9: Selected Indicators for Local Action: Efficiency in Complaint Redressal and Staffing
Water supply Wastewater Solid waste management
Complaint
redressal
1. Total complaints in water
supply per 1,000 connections
per year
1. Total complaints in
wastewater per 1,000
connections
1. Total complaints in solid waste
per 1,000 households
2. Complaints for pipe breaks
and leakages per 1,000
connections per year
2. Complaints for sewerage
blocks per 1,000 sewerage
connections per year
2. Complaints related to garbage
collection per 1,000 households
per year
3. Complaints for low
pressure per 1,000 connections
per year
3. Complaints for
damaged/overflowing
manholes per 1,000 sewerage
connections per year
3. Complaints related to street
sweeping per 1,000 households
per year
4. Complaints for water
quality per 1,000 connections
per year
4. Complaints for
leakage/overflowing lines per
1,000 sewerage connections per
year
4. Complaints related to
odour/nuisance due to
dumpsites/transportation, etc.
per 1,000 households per year
Staffing 5. % of staff recruited for
water supply to total
sanctioned staff strength as
per type of ULB
5. % of staff recruited for
wastewater to total sanctioned
staff strength as per type of
ULB
5. % of staff recruited for solid
waste management to total
sanctioned staff strength as per
type of ULB
6. Total staff (regular and
contract) per 1,000 water
supply connections
6. Total staff (regular and
contract) per 1,000 wastewater
connections
6. Total staff (regular and
contract) per 1,000 households
7. Total sweepers per km of road
length swept
Costs, revenue and billing: Unit costs and revenues are estimated for assessing across cities. Given the
fact that ULBs often do not segregate costs and revenues across different services, combined O&M cost
recovery from local sources is also assessed across all three sub‐sectors. Table 2.10 provides illustrative
indicators.
For measuring collection efficiency two aspects are important. First an estimate of total year‐end
receivables in relation to total annual operating revenues allows an easy assessment of the magnitude of
the problem. It also enables comparison across other utilities as this is an important indicator in most
utility benchmarking efforts in the water sector. Second, pilot studies suggest that arrears form a major
portion of the accounts receivable in many instances. ULBs can focus on increasing the efficiency of arrear
collection and introduce innovative incentive mechanisms for it.

22
Table 2.10: Selected Indicators for Local Action: Cost, Revenue and Billing
Water supply Wastewater Solid waste
management
Overall cost
recovery
Recovery of total O&M costs for water, wastewater and SWM from local taxes and charges (%)
Unit cost Unit electricity cost per production
of water supply (Rs/Kl)
Unit O&M cost of production of
water supply (Rs/Kl)
Unit O&M cost of conveyance
and treatment of wastewater
(Rs/Kl)
Unit O&M cost of solid
waste management
(Rs/tonne)
Unit revenue Average revenue per water
connection (Rs)
Average revenue per
sewerage connection (Rs)
Average revenue per
household (Rs)
Collection
efficiency
Collection period for water supply
charges (days)
Collection period for
wastewater charges (days)
Collection period for SWM
charges (days)
Billed arrears to total billed demand
(%)
Billed arrears to total billed
demand (%)
Billed arrears to total billed
demand (%)
Flooding Incidents: Another aspect related to network efficiency for storm water is the incidence of
water logging/flooding in cities. Table 2.11 lists the related indicator.
Table 2.11: Selected Indicators for Local Action: Efficiency of Storm Water Network
Storm water drainage
Efficiency of storm
water network
Incidence of water logging/flooding
Equity: The equity concerns faced by those residing in slum settlements in accessing water and sanitation
services has generally been attempted through adequate provision of shared services. However, in the past
years, the focus has shifted to individual household level water and sanitation services in slum areas.
Thus, local action needed to improve the access of slum residents to individual household level services
becomes important. The indicators for local action are identified to capture this aspect.
For ensuring equity, it is important for the ULB to ensure that average monthly bills for these services for
the general population, especially for slum settlements, are within an acceptable range of affordability.
While detailed data on household income for each city is not available, state‐wide average incomes for the
poor may be used for estimating the average bill as a share of average monthly incomes. While no
commonly accepted standards are available, generally up to 2.5 per cent of monthly household income is
considered as affordable total expenditure on these services.9 Current data systems at city level do not
permit an assessment of total bills or revenues generated from residential connections. A separate
assessment for slum settlements is even more difficult. Yet, an effort will be made to review the possibility
of generating this data for inclusion during the second round of data collection.
Measures and indicators discussed in Table 2.12 will also help to address inequities in coverage across
different zones in the city. This can be useful in preparing infrastructure proposals.
9 For example, the Environment Protection Agency (EPA) in the USA has historically used 2.5 per cent of
monthly household income as its affordability criterion for water and wastewater services (ASDWA n.d.).

23
Table 2.12: Selected Indicators for Local Action: Equity
Water supply Wastewater
Equity across
slum
settlements
Population per shared/community
stand post in slum settlements
Population per toilet seat in community toilets in
slum settlements
It is expected that after the completion of the first round of surveys in all cities of Gujarat and
Maharashtra, and the use of local action indicators at city level, it will be possible to identify more
indicators as appropriate from the detailed questionnaire developed under the PAS Project.
2.2 Reliability Assessment of Key Performance Indicators
Past experience of reliability assessments: Reliability assessment of key performance indicators is
important when a comparison is made across cities and different service providers. The two key
international benchmarking frameworks for water supply industry have used reliability assessment. The
International Benchmarking Network for Water and Sanitation Utilities (IBNET) provides a simple
framework of reliability through ‘confidence‐bands’ as described in Table 2.13. The reliability framework
of the IWA also uses the concept of data reliability and accuracy for its input data (refer to Table 2.14). It
uses accuracy bands with ranges from (+/‐) 5 per cent to > (+/‐) 50 per cent. Based on this bands for
reliability are developed, ranging from highly reliability data based on sound records to lowest reliability
based on extrapolation or unreliable data.
Table 2.13: Confidence Band Definitions from IBNET
Band Description
A Based on reliable records, procedures, investigations or analyses, that are properly documented
and recognised as the best available
B Generally as in band A, but with minor shortcomings, for example, some documentation is
missing, the assessment is old, or some reliance on unconfirmed reports or extrapolation is made
C Extrapolation from a limited sample for which Band A or B information is available
D Based on the best estimates of utility staff without measurement or documented evidence
Source: Based on IBNET Toolkit Instructions from website: www.ib‐net.org
Two of the previous efforts in India on performance assessment (NIUA 2005 and MoUD‐ADB 2007) did
not provide reliability scales. Another study on performance assessment carried out by CRISIL Advisory
Services discussed the reliability concerns (CRISIL 2007). This framework has been developed further
under the standardised Service Level Benchmarks (SLB) initiative of the GoI. It uses similar principles as
those of the IBNET and IWA, but provides reliability estimates through a series of objective measures
(refer Table 2.15 for a sample reliability assessment under the SLB). The SLB initiative has developed
reliability scales for all the key performance indicators. Given the severe data availability issues, the SLB
approach provides clear directions on assigning reliability levels.

24
Table 2.14: Accuracy and Reliability Bands of IWA
Accuracy
band
Associated uncertainty Reliability
band
Definition
0‐5% Better than or equal to
+5%
Highly reliable data source: data based on
sound records, procedures, investigations or
analyses that are properly documented and
recognised as the best available assessment
methods
5‐20% Worse than + 5%, but
better than or equal to
+20%
Fairly reliable data source: worse than
but better than
20‐50% Worse than +20%, but
better than or equal to
+50%
Unreliable data source: data based on
extrapolation from limited reliable samples or
on informed guesses
>50% Worse than +50%
Source: Alegre et al. (2006) Table 2, p. 14.
Table 2.15: Reliability Assessments under SLB Initiative Continuity of water supply
Definition Continuity of supply is measured as: Average number of hours of pressurised water supply per day
Description Continuity = a,
Where a is the average number of hours of pressurised supply (hrs)
Frequency of measurement: Monthly Spatial unit of measurement: Zone/DMA
level
Reliability A Reliability B Reliability C Reliability D
Calculation based on detailed
operational records at each of the valve
operating points. Pressure adequacy and
number of hours of supply at
consumersʹ end is assessed on basis of
statistically valid sample survey, across
all zones in the city.
Calculation based on detailed
operational records at each of the
valve operating points. Pressure
availability at the consumersʹ end
is assumed to be adequate and
meeting the stated norms.
Not applicable Estimation of number
of hours based on
feedback from field
level engineers. Zone‐
wise data is not
available.
Source: MOUD (2009), op. cit.
Reliability assessments for data quality: The PAS project has adapted the reliability scales of the SLB approach and the IBNET. Thus, reliability scales have been developed for all the key performance
indicators for goals and reforms. Table 2.16 explains the reliability scales for an indicator along with
possible actions for improving reliability of the information. Five scales of reliability are used: A+ being
Table 2.16: Approach of Reliability Assessment under PAS Project Reliability
score
Description Actions needed to achieve reliability
A+ Automated data systems linked to GIS platform,
and regularly updated
Develop GIS linked computerised registers, among
others
A Automated data systems, with regular updating Computerise system of data capture and analysis to
generate information for performance indicators on a
regular basis
B Manual systems of data recording, with periodic
updating
Introduce proper manual registers and log books, and
so on, as appropriate with at least periodic updating
C Partially developed manual systems of
recordings, with extrapolation of missing data.
Develop a system of manual records for registers, log
books, etc
D Estimates as reported by the service provider
without appropriate systems of data recording
–
Note: This approach has been adapted from the IBNET’s reliability bands and the GoI’s SLB initiative.

25
URBAN LOCAL
BODY
State and National
Governments
Utility/Urban Local
Body Associations
INTERNAL
ACCOUNTABILITY
DOWNWARD
ACCOUNTABILITY Citizens and Consumers
Performance benchmarking,
self‐regulation
Grievance redressal, Report Cards
Public dissemination
Reform‐linked funding,
regulatory compliance,
performance awards
Internal accountability for
performance results
Accountability for
regular operations
UPWARD
ACCOUNTABILITY
The highest reliability (fully automated systems for data management) and D being the lowest (no records
maintained). Questions related to data systems and data management are included in the questionnaire.
This enables direct computation of reliability from the questionnaire rather than subjective assessment of
reliability in other performance measurement practices.
Reliability scales have been developed for all key performance indicators. When reliability measures are
associated with each key performance indicator, it enables a transparent and consistent comparison across
all ULBs. It also informs ULBs about the quality of their existing data systems, and encourages them to
keep making improvements in their data management. After the first round of surveys, key actions for
improvements in data systems will be explored with selected ULBs. In addition, where appropriate, state‐
wide information system improvement efforts will also be supported.
2.3 Linking PMF to Accountability in State and Local Monitoring Systems
A key issue in performance measurement relates to its use within an organisation. Currently there are few
incentives or a limited framework of ‘rewards and punishment’ linked to service delivery in most ULBs in
India. Drawing on the national and international experiences in such benchmarking, it is recognised that
there must be effective use of performance indicators at the local level to ensure its sustainability. The
performance measurement framework (PMF) in the PAS Project has thus been developed to create the
necessary institutional incentives at both state and local levels, which will promote its use and work
towards improving performance. These institutional incentives are seen within the framework of
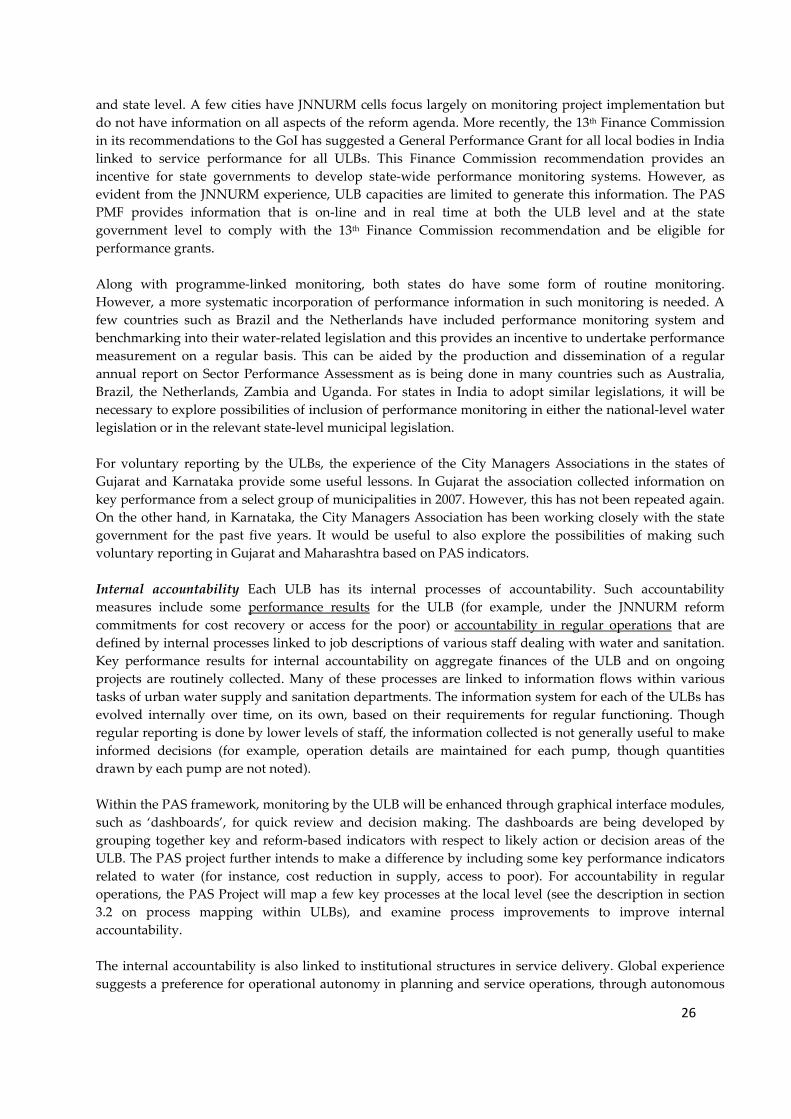
accountability faced by the ULBs. In the local governance system in India, ULBs are faced with three types
of accountability as illustrated in Figure 2.4: upward, downward and internal accountability within the
local body.
Figure 2.4: Accountability and Incentives for Performance Measurement and Monitoring
Upward accountability is of two types: mandatory requirements generally to higher levels of government
(for example, state and/or national governments, or where relevant, to a regulator); and voluntary
requirements to associations of ULBs which are often engaged in benchmarking across their members. As
a mandatory requirement, ULBs are required to routinely report to higher levels of governments. For
example, under the JNNURM, every participating city is required to provide a quarterly progress report
on a set of reform agenda indicators. Similarly, the state‐level programmes – Nirmal Gujarat in
Maharashtra and the Sujal Nirmal Maharashtra Abhiyan – require periodic information from ULBs. A key
‘incentive’ for the ULB and state government to use PAS will be to systematise the information at the ULB
26
and state level. A few cities have JNNURM cells focus largely on monitoring project implementation but
do not have information on all aspects of the reform agenda. More recently, the 13th Finance Commission
in its recommendations to the GoI has suggested a General Performance Grant for all local bodies in India
linked to service performance for all ULBs. This Finance Commission recommendation provides an
incentive for state governments to develop state‐wide performance monitoring systems. However, as
evident from the JNNURM experience, ULB capacities are limited to generate this information. The PAS
PMF provides information that is on‐line and in real time at both the ULB level and at the state
government level to comply with the 13th Finance Commission recommendation and be eligible for
performance grants.
Along with programme‐linked monitoring, both states do have some form of routine monitoring.
However, a more systematic incorporation of performance information in such monitoring is needed. A
few countries such as Brazil and the Netherlands have included performance monitoring system and
benchmarking into their water‐related legislation and this provides an incentive to undertake performance
measurement on a regular basis. This can be aided by the production and dissemination of a regular
annual report on Sector Performance Assessment as is being done in many countries such as Australia,
Brazil, the Netherlands, Zambia and Uganda. For states in India to adopt similar legislations, it will be
necessary to explore possibilities of inclusion of performance monitoring in either the national‐level water
legislation or in the relevant state‐level municipal legislation.
For voluntary reporting by the ULBs, the experience of the City Managers Associations in the states of
Gujarat and Karnataka provide some useful lessons. In Gujarat the association collected information on
key performance from a select group of municipalities in 2007. However, this has not been repeated again.
On the other hand, in Karnataka, the City Managers Association has been working closely with the state
government for the past five years. It would be useful to also explore the possibilities of making such
voluntary reporting in Gujarat and Maharashtra based on PAS indicators.
Internal accountability Each ULB has its internal processes of accountability. Such accountability
measures include some performance results for the ULB (for example, under the JNNURM reform
commitments for cost recovery or access for the poor) or accountability in regular operations that are
defined by internal processes linked to job descriptions of various staff dealing with water and sanitation.
Key performance results for internal accountability on aggregate finances of the ULB and on ongoing
projects are routinely collected. Many of these processes are linked to information flows within various
tasks of urban water supply and sanitation departments. The information system for each of the ULBs has
evolved internally over time, on its own, based on their requirements for regular functioning. Though
regular reporting is done by lower levels of staff, the information collected is not generally useful to make
informed decisions (for example, operation details are maintained for each pump, though quantities
drawn by each pump are not noted).
Within the PAS framework, monitoring by the ULB will be enhanced through graphical interface modules,
such as ‘dashboards’, for quick review and decision making. The dashboards are being developed by
grouping together key and reform‐based indicators with respect to likely action or decision areas of the
ULB. The PAS project further intends to make a difference by including some key performance indicators
related to water (for instance, cost reduction in supply, access to poor). For accountability in regular
operations, the PAS Project will map a few key processes at the local level (see the description in section
3.2 on process mapping within ULBs), and examine process improvements to improve internal
accountability.
The internal accountability is also linked to institutional structures in service delivery. Global experience
suggests a preference for operational autonomy in planning and service operations, through autonomous

27
utilities owned by local or state governments. However, in India, and particularly in the two states of
Gujarat and Maharashtra, such separation of operations is not practiced. It is the local governments that
provide water and sanitation services directly through their own departments. The accountability
structures and the incentive systems for performance in a local government structure are likely to be
different from those for an independent utility. It will thus be useful to explore and design appropriate
performance linked accountability and incentives in local government.
Downward accountability refers to a ULB’s response to the residents or customers in terms of services
provided. Information sharing with citizens by ULBs in India is, in general, very weak. Performance
indicators of services, when available, are rarely shared with citizens and civil society organisations. E‐
governance (that is, use of websites, and Internet) for citizen interaction is often limited to payment of
taxes. Procurement decisions are still not open and transparent. It was for these reasons that the JNNURM
reform agenda includes promoting downward accountability of urban local governments to its residents.
It requires state governments to enact a public disclosure law and provide information on a range of
financial transactions to citizens. It also requires states to promote community participation through ward
committees and ‘area sabha’ to be constituted under a community participation law. Despite the fact that
these reforms are mandatory, many states have not yet constituted such laws. A few states that have
complied with these requirements have enacted the laws but have made little effort to implement them.
Citizens have to take recourse to the “Right to Information” Act, a national legislation that empowers
citizen to obtain information from public entities.
Downward accountability is often articulated through an effective consumer grievance redressal system
and through a transparent sharing of information. In many Indian states, the ULBs are required to have a
citizen charter that lists the obligations of the ULB towards citizens and also identifies response time in
addressing citizen grievances. While the consumer grievance system exists in many ULBs, its effective
functioning has been a major issue. In most cases, citizens have to personally visit the ULB office to lodge a
complaint. However, in a few cities, there are attempts to evolve a system of citizen interaction through
call centres, toll‐free numbers and SMS services. These systems record all the complaints received and
track them till they are redressed. E‐governance practiced in many ULBs allows citizen grievances to be
recorded and tracked. However, it is seen that detailed analysis of nature of complaints and response time
is not undertaken. There are no conscious efforts to analyse complaints in future planning and staff
appraisals. Further strengthening is needed to improve the interaction with citizens and to promote use of
analysis of consumer feedback in service planning. With self‐assessment of property taxes, residents in
many cities can compute their own taxes and pay them on‐line. These initiatives have helped in improving
citizen interaction. The PAS web portal intends to make a difference in increasing ULB‐citizen interaction
in provision of water and sanitation services. It will also enable citizens to become better informed about
the performance of ULBs on water and sanitation.

28
3. Process of Developing the Performance Measurement Framework The PAS performance measurement framework (PMF) described in the previous chapter was developed
through an intensive review of international benchmarking efforts, past benchmarking studies in India
and use of performance information at the state and local levels. It also draws upon the indicators
developed under the Ministry of Urban Development’s (MoUD’s) standardised Service Level Benchmarks
(SLB) initiative. Based on the review, a preliminary framework was developed along with a detailed
questionnaire which was pilot tested in both states. In addition, a number of consultations were carried
out with government officials, experts and resource persons. Figure 1.1 (in Chapter 1) highlights the
iterative process that was followed. This chapter provides brief highlights of the process.
3.1 Review of International Efforts in Benchmarking
Since the mid 1990s, increasing attention has been paid to benchmarking performance of urban water
service providers. The benchmarking concept was introduced in the private sector in 1981 by Xerox to
identify the best performers in the sector and to adopt the best practices to achieve better performance.
Since then the benchmarking framework has been adopted by different types of industry groups,
governments, regulators, trade associations, academic associations and consultancy firms to manage,
supervise or regulate service quality using performance indicators.
The initial development in benchmarking in the water sector was in Europe and North America. More
recently, a number of efforts have been made to develop benchmarking frameworks specifically focused
on the water and sanitation sector. These have been adapted for use by different players including utility
associations, governments and regulators. Use of benchmarking in developing countries has gained
increased momentum particularly through utility associations and governments. Indicators of
performance are also increasingly used in performance‐based contracts between governments and public
utilities as well as private service providers.
Development of benchmarking frameworks for the water sector: Over the past years, there have been a number of efforts to develop and standardise the approach to benchmarking in the water sector.
Among them some notable efforts have been made by the International Benchmarking Network for Water
and Sanitation Utilities (IBNET) of the World Bank; the American Water Works Association (AWWA); and
the International Water Association (IWA). Both IBNET and AWWA provide ready‐to‐use frameworks
and a platform for data collection, analysis, quality check, dissemination of results and networking for the
participants. These frameworks provide indicators for coverage, service levels, efficiency and financial
viability.
The use of IBNET spans across 85 countries and over 2,000 utilities. It provides a platform for posting time‐
series information across participating utilities with user‐friendly query features. IBNET has made some
efforts to add specific indicators that focus on equity and access for the poor (see Box 3.1)
The IWA provides a baseline framework and guidelines for operators or associations that want to
undertake benchmarking. Its framework has been used in many European countries. More recently, the
IWA has initiated support to Water Operators Partnership (WOP) being developed with United Nations
(UN) support. WOPs have become active in Africa and South‐East Asia. At a regional level, the Asian
Development Bank (ADB) has provided support to benchmarking efforts and facilitated development of
utility data books across utilities in different sub‐regions and countries in Asia. The IBNET and IWA have
developed systems that enable monitoring of performance over the years, unlike ADB utility data books
which have been largely a one‐off effort.

29
Table 3.1: Frameworks and Indicators: IBNET, IWA and ADB Utility Data Books IBNET system IWA system ADB (utility data books)
Consists of a ‘dataset’ broadly covering
aspects of utility information, service area,
water and sewerage service, financial and
customer information.
The indicators are drawn from the above
dataset, along with additions of utility
specific indicators.
No. of data items: 148
No. of Performance Indicators (PI): 27
(including water and wastewater)
Consists of broadly four parts,
namely, ‘data elements’ that feed
into variables used for the
performance indicators.
PIs are analysed further with
respect to ‘explanatory factors’, and
with reference to ‘context
information’.
No. of variables: 232
No. of PIs: 170 (for water only)
Consists of a set of PIs and
utility profiles that are
used for comparative
performance across major
utilities.
No. of PIs: 10 (for water
only)
Box 3.1: IBNET: Equity and Access for the Poor
Recognising that the vast majority of developing‐country utilities fail to deliver services to significant populations
residing within their nominal service areas, IBNET has introduced special indicators that focus on equity sand
affordability aspects. This would help in measuring performance in serving poor consumers, along with other
measures of efficiency and financial sustainability. IBNET has added two types of indicators:
a) those focussing on access to water and sanitation services for the poor – captured through an indicator of pro‐poor
options such as a standpost or community‐managed kiosks for water, and shared toilet facilities; and
b) those focussing on affordability by assessing whether the utility offers a flexible/amortised repayment option to
spread the costs of connection to the water network, and assessing the monthly water bill for a household consuming 6
M3 of water per month through a household or shared yard tap (but excluding the use of standposts).
Source: Based on Evans (n.d.) and the list of indicators reported on the IBNET website (www.ib‐net.org) as retrieved on April 16, 2010.
Box 3.2: IWA’s Performance Benchmarking Framework
The International Water Association (IWA) has developed an extensive performance measurement system with sub‐
components of data elements, variables, performance indicators and context information. Under the IWA system,
‘data’ is derived from the ‘data elements’ or DEs; various DEs are used to generate variables, which in turn are
combined to produce the performance indicators. The ‘variable’ has two aspects: the numerical value (resulting from
measurement/record), and the grade that represents the quality of the data. Context information can also be generated
from the variables in the IWA system. A fifth and important component of the IWA system is ‘explanatory factors’ or
driving factors, which can be used to interpret the performance indicators (PIs) better. Explanatory factors can be
certain variables themselves, PIs or even context information, as all of these help to understand the PIs clearly.
Source: Alegre et al. (2006).
Both IBNET and IWA highlight the importance of reliability of information and resultant indicators. Both
also suggest methods for assessing the reliability of indicators and related level of confidence. However,
interestingly, actual results for different utilities do not always provide reliability assessments. For
example, the utility results, as reported on the IBNET website, do not provide reliability bands for any of
the results posted on their websites.
Performance benchmarking in the water sector: Over the past two decades benchmarking in the water
sector has been widely used by different actors including: (a) utility associations in several different
countries and regions, mainly for comparative assessments and process benchmarking; (b) national
governments for improved information systems that can then be used for performance‐based sector

30
funding, and process benchmarking; and (c) for regulation – both by regulators as well as through
performance‐based contracts.
Table 3.2: Use of Performance Information around the World Utility associations Government Regulation
Coverage National and regional level National and state (province)
level
National and regional level
Examples Utility associations in
Africa, South‐East Asia,
Australia, Netherlands,
South Africa, Canada,
Vietnam and Indonesia
Performance monitoring: Brazil,
Australia, Tanzania and South
Africa
Performance‐based funding:
Ecuador, Uganda and Tanzania
Regulators: UK, Zambia and
Philippines
Performance‐based contracts:
Senegal, Uganda, Burkina
Faso, Malaysia and Bangkok
Objectives Sharing information
across utilities
Promote process
benchmarking
Support decision making and
improvement plans, promote
process benchmarking
Funding as incentive for improved performance
Comparative regulation
Review against agreed performance targets in
contract
Major themes Service levels, finance,
consumer services,
environment
Service levels, consumer
services, finance, environment,
health and asset management
Service levels, consumer
services, finance
Frequency of
measurement
Annual (Netherlands: once
in three years)
Annual Annual
Utility associations: In many countries, utility associations have undertaken benchmarking as a voluntary
tool for performance assessment for its member operators (see Box 3.3). Participation in a benchmarking
exercise is usually charged through a fee. In Europe, utility associations in the Netherlands and Denmark
have been using benchmarking as a tool since the late 1990s, and have well‐established metric and process
benchmarking. They have been actively promoting benchmarking in other European nations and have
established the North European Benchmarking Corporation for regional comparative performance
assessment. As a result of benchmarking efforts by these utility associations, it has at times been made a
statutory requirement as in the Netherlands or Australia.
Box 3.3: Performance Benchmarking by Selected National Utility Associations
The Netherlands: Vereniging van Waterbedriven in Nederland (Vewin), which is the association of Dutch water
companies, and the Association of Dutch Water Boards are two key players in water supply and treatment of
wastewater, while municipalities are responsible for collection and discharge of wastewater. All 10 water companies
and 26 regional water authorities of the Netherlands are members in Vewin and Dutch Water Boards, respectively.
The associations have taken up process benchmarking in the areas of water quality, service levels, environmental
performance, finance and efficiency. Performance assessment of the services provided by utilities is conducted once in
every three years, while financial assessment is done every year. The revised Drinking Water Act 2008 has made the
process of benchmarking mandatory for all players in the water sector in the Netherlands. As the founder member of
the Northern European Benchmarking Cooperation (NEBC), Vewin is also associated with benchmarking efforts at an
international level.
Denmark: Benchmarking initiatives started in 1999 by the Danish Water and Wastewater Association (DANVA) have
led to the development of a web‐based reporting and analysis system known as BESSY (Benchmark and Statistic
System). Other processes initiated by the benchmarking exercise include the preparation of customer surveys, process
of benchmarking projects, definition of service level targets and related indicators. As a member of the EUREAU and
IWA, the DANVA has influence in matters relating to EU regulations and directives in the sector. It is also part of the
NEBC and is actively involved in the research and exchange of experience within the sector.

31
NEBC: The Northern European Benchmarking Cooperation was established by a group water associations and utilities
of Denmark, Finland, the Netherlands, Norway and Sweden in 2004, is an initiative to promote benchmarking and
sharing of best practices across utilities/associations. The benchmarking framework of the NEBC is based on IWA’s
framework, and a web‐based tool has been developed for using the framework. Key areas of performance assessment
are water quality, reliability, service quality, sustainability, finance and efficiency at three levels, namely basic, metric
and advanced. Metric benchmarking helps identify areas for improvement, while advance benchmarking helps to
identify the processes needed. The three levels of benchmarking help utilities participate at a level that is appropriate
to their development requirements.
Vietnam: The Vietnam Water and Sewerage Association (VWSA) started the benchmarking exercise primarily to create
a database for water and sanitation costs for national reference for industry stakeholders. Sixty‐seven provincial water
companies (PWCs) participated for assessment of technical, financial, human resources and environmental aspects;
data for three years, from 1997‐2000, was collected. This initiative gained further thrust through the ‘performance
grant’ component of the World Bank‐funded Vietnam Urban Water Supply Development Project, where funds to the
PWCs were to be disbursed on the basis of the performance results of the 2001 benchmarking exercise. Vietnam is a
member of the South East Asian Water Utilities Network and has the support of regional partners to further
strengthen its benchmarking initiative.
Indonesia: PERPAMSI, the national water suppliers’ association representing all the local utilities in Indonesia, started
benchmarking efforts in 2001. However, problems faced in data collection, verification and analysis led to another
initiative in 2002. Key objectives of PERPAMSI have been to represent utilities, lobby for policies and regulations,
disseminate information between utilities on innovative approaches, and conduct performance assessment. In the 2002
initiative, 80 out of 306 utilities participated, and the process looked at technical, financial, managerial and customer
satisfaction aspects. In the second phase that began in 2007, emphasis has been to develop a more sustainable system.
Training workshops have been conducted at the province and central level. The data is collected and verified by the
utilities at the province level and is sent to the central offices for analysis and dissemination. Interestingly, after five
years, PERPAMSI has not been able to increase the number of participation utilities in the benchmarking process.
Sources: The Netherlands: Accenture (2006); Denmark: Bastrup (2005); NEBC: NEBC (2008)
http://www.waterbenchmark.org/content/documents.html; Vietnam: Sharifian (2002); Indonesia: Brenner (2005).
Amongst developing countries, a few national utility associations such as in Indonesia and Vietnam have
also started benchmarking which has been supported by the national governments. Following the UN’s
support for setting up the WOPs, regional utility associations have also taken up benchmarking, as in
Africa and South‐East Asia.
An industry‐wide benchmarking approach has been adapted in the water sector by utility associations
through two formats: (a) metric benchmarking that focuses on quantitative comparison on key
performance indicators (of the type listed in the Annex tables) across ‘water utilities’10 or over time in the
same utility; and (b) process benchmarking that focuses on learning from best performers who concentrate
on the underlying utility processes to improve performance. A large body of experience is available for use
of metric benchmarking in both developed and developing countries – essentially, comparative reporting
of performance indicators.
Compared to metric benchmarking, process benchmarking has not evolved much in the water sector. In
some instances, metric benchmarking over a period of time has organically evolved to process
benchmarking. In general, however, adoption of process benchmarking in Europe seems to have been
largely voluntary and non‐systematic in nature.11 There are some examples of its use in customer services
process benchmarking facilitated by the IWA and Water Services Association of Australia (WSAA) (see
10 The term ‘utilities’ is used more broadly here to encompass various forms of service providers including,
amongst others, autonomous public utilities to departments within urban local governments. 11 Parena et al. 2002.

32
Box 3.4). The WSAA has also carried out process benchmarking exercises for asset management.12 The
Asian Development Bank (ADB) has also supported process benchmarking in Asia through twinning
arrangements between utilities as well as training activities for continuous improvement in key service
areas.
Box 3.4: Examples of Process Benchmarking Supported by Utility Associations
Customer Services Process Benchmarking in Australia: The Water Services Association of Australia (WSAA) has
initiated the project in 2000 for industry performance comparison by providing robust, comparable and internally
consistent operational and capital benchmarking information on water supply and wastewater reticulation for WSAA
members. In 2002, the WSAA carried out a study with the UMS group (an international utility management consulting
firm) against a broader peer group of global participants, including water, gas and electric utilities from Australia,
North America, the UK, Europe and South America. The study analysed, at a detailed level, the cost to serve; it
provided insights into best practices for key customer service processes such as order fulfilment, revenue collection
and field response. Overall, the key finding was that WSAA participants, in general, had a high level of performance
compared to UMS’ global database and about a 14 per cent industry cost saving opportunity when compared to
overall WSAA best performers. A ‘re‐run’ of the study was done in 2006 with an increased number of international
participants.
Continuous Improvement and Benchmarking (CIB): The Water Operators Partnership (WOPs) in Asia, a
collaboration between the Asian Development Bank and the Global Water Partnership, works to enable water utilities
to improve service coverage and delivery, financial sustainability, and other aspects of their performance. One of the
aspects addressed is Continuous Improvement and Benchmarking (CIB), which involves collecting, analysing and
comparing key performance data of water and sanitation utilities and, on the basis of analysis, developing a strategy
and work programme to improve specific aspects of a utility’s performance on a continuous basis. CIB workshops
have been conducted for water utilities networks. Member utilities have also agreed to participate in the WOPs’ CIB
programme—SAWUN: 21 utilities, SEAWUN: 17 utilities and CASCWUA: 11 utilities.
Sources: Australia: IWA 2006; CIB‐Asia: ADB 2005.
Government initiatives: National‐level performance measurement and benchmarking have been initiated
by governments in several countries, often with support from an international association or a national
funding agency (see Box 3.5). Brazil, Australia and South Africa have institutionalised performance
monitoring and benchmarking. Australia has the most experience in successful benchmarking at the state
level and has recently undertaken a national‐level initiative. Brazil, through the National Sanitation
Information System (SNIS), has considerable experience and has been slowly increasing the number of
participants. These efforts are backed by appropriate statutes as the development of a sector information
system is included in the Water Law in Brazil. South Africa adopted benchmarking in 2001 as an initiative
of its utility association, but failed to operationalise it. Subsequently, a national initiative was started in
2006.
Box 3.5: Selected Government Initiatives in Performance Benchmarking
Brazil SNIS: A national information system established in 1996 for water and sanitation sector in Brazil, the National
Sanitation Information System (SNIS) has now become a database with over 10 years’ historical data. The Water Law
of Brazil provides for the establishment of a National Information System for Water Supply, Sewerage, Solid Waste and
Drainage sector. The performance criterion for utility operators in the allocation of federal resources is a crucial
element in the law. The Growth Acceleration investment programme of the government (2007‐2010) with a fund
allocation of US$ 23 billion would be result‐based, and thus depends largely on SNIS information. Coverage of SNIS,
in 2007, has been over 70 per cent of the municipalities in Brazil. The SNIS generates over 80 indicators related to
technical performance, financial viability and customer satisfaction. There are two levels of data within the SNIS: the
12 Foley 2005.

33
utility level and the municipality level, as regional utilities in Brazil serve different municipalities. The annual SNIS
cycle consists of the data collection process, data quality control and transfer of data to the SNIS database, data
analysis and reports, and dissemination of reports. SNIS Innovations have been in terms of outsourcing data quality
control to a private firm, which initially was handled by the SNIS team. Additionally, other processes have been
outsourced such as providing helpdesk services to utilities, verifying whether data has been received from utilities,
and follow up on returning data forms to SNIS.
Australia: As part of the National Water Initiative (NWI), each year the state governments report on benchmarking of
services and pricing for urban water delivery. A National Performance Report (NPR) on water supply and sanitation
sectors has over 150 indicators related to social data, health, environmental and financial aspects. The annual NPR
cycle consists of data collection by the Water Services Association of Australia (WSAA) or states, collation of
information by the WSAA as per agreed requirements of the NWI, auditing of information by the WSAA or states as
per standards agreed by the NWI, and preparation of reports by the WSAA. The NWI has been able to ensure
consistency between WSAA and NWI indicators. A key NWI innovation is the auditing process that ensures a
consistent approach to issues of independence, level of expertise and adherence to relevant standards. The audit
process assesses data collection (whether based on sound records and satisfactory processes/systems) and quality of
data (whether data matches previous reports, missing or unusual data which may suggest data manipulation). Where
the data fails to meet auditing standards, it is not published in the NPR.
South Africa: The initial efforts for performance benchmarking for the water and sanitation sector were initiated by the
South Africa Local Government Association. Following this unsuccessful attempt, these were taken over by the
government through the Water Research Commission and named the National Water Services Benchmarking project.
A key feature of the project is to initiate both metric and process benchmarking. The benchmarking project has over 60
indicators related to service delivery, finance, customer satisfaction, human resources and environmental aspects. The
annual cycle consists of data collection (data entry on web‐based system restricted to designated staff at municipality),
data checking and auditing, and publishing of performance indicators.
Tanzania: Water supply and sewerage services in Tanzania are provided by Urban Water Supply and Sewerage
Authorities (UWSAs), and are monitored on the basis of memoranda of understanding (MoUs) signed with the
Ministry of Water and Irrigation (MoWI). These MoUs set performance targets that are to be achieved for each UWSA
over three years, after which targets are refined. Initially, the monitoring process was done manually through the
analysis of reports that were generated monthly. This process was quite cumbersome given the fact that data accuracy
was an issue, and therefore had to be validated. Also, the lack of an understanding about reporting data for the key
performance indicators did not allow comparisons across UWSAs. In 2006, a computerised information system, ‘Majls’
was established. The database content was designed to generate reports based on the MoUs. Additionally, it also
consisted of a set of data sheets relating to technical, commercial, human resources and financial information. These
were filled in by the UWSAs on a monthly basis, and at the end of a fiscal year. Majls is currently administered by the
Energy and Water Utilities Regulatory Authority, which is responsible for monitoring all the UWSAs and other
commercially run water utilities. Majls also has an internal MIS component for the utilities so that the UWSAs can
analyse their own data, monitor trends and track their progress towards targets. Data accuracy is improved over time
through feedback given to the UWSAs on submission of their annual reports.
Sources: Brazil: Marinho (2008); Australia: Essential Services Commission (2004)
http://www.esc.vic.gov.au/public/Water/Regulation+and+Compliance/Performance+reports/Water+performance+reports/Performa
nce+reports.htm; South Africa: Water Research Commission (2004); Tanzania: Kingu and Schaefer (2008).
Box 3.6: Selected Examples of Performance‐linked Funding
Ecuador: In 2004, the Ministry of Economy and Finance decreed that national government transfers to the water and
sanitation service providers be linked to their performance, specifically operational efficiency, institutional separation
and the degree of autonomy from the municipal administration. By this decree, a 10 per cent tax was levied on the
revenues from the Special Consumption Tax (ICE) which have so far formed a part of the municipal administration’s
kitty. This has ensured that the municipalities have incentives to adopt tariffs that cover operating costs, and adopt
autonomous management models. Financial incentives were given to those municipalities that introduced a delegated
management model. The incentives are calculated on the basis of a formula that captures the level of delegation to an
autonomous provider and the extent of cost recovery achieved. In addition, technical assistance was provided for the

34
delegation process by autonomous service providers. The level of government transfers are now higher for poorer
municipalities, and also to those that have improved their service delivery and adopted more sustainable institutional
arrangements through autonomy in their functioning.
Uganda and Tanzania: Performance‐linked funding in Uganda and Tanzania is in the form of Local Development
Grant (LDG), where transfer of funds to local governments is based on achieving certain minimum reform
requirements. The requirements are assessed on the basis of performance measures related primarily to financial
management. The capital funding is given to those local governments that qualify in terms of an entire project cycle.
Additionally, the governments performing well are given 20 per cent more and the ones performing poorly are given
20 per cent less of their LDG allocation. Capacity‐building grants are also provided to those local governments that
have capacity‐building plans in place. The local governments are given extended time limits to ensure they meet the
minimum requirements to avail the LDGs. These pertain mainly to the functional capacities of local governments in
terms of development planning, finance management, internal audit, revenue performance improvement and
capacity‐building initiatives. The assessment in terms of performance measures relates to linkages of the development
plan with the budget, staff functional capacity, capacity‐building linkages with the plan, accountability performance,
operation and maintenance of investments, and functionality of the water and sanitation department.
Sources: Ecuador: Drees‐Gross
http://www.esc.vic.gov.au/public/Water/Regulation+and+Compliance/Performance+reports/Water+performance+reports/Performa
nce+reports.htm (2005), World Bank (2005); Uganda: MoLG (2005), Tanzania: World Bank (2006) and RALG (2006).
Use of performance information for regulation: Performance information and benchmarking have
been used by regulators to oversee water and wastewater services in a number of countries (see Box 3.7).
Regulatory agencies in the UK and in the Australian state of Victoria have been employing benchmarking
successfully as a regulatory tool to monitor water and wastewater services under their jurisdiction since
the mid‐1990s. The systems are well developed in both cases and have been internalised by utilities in their
own management information systems. It also plays a key role in the price regulation of the services.
Regular target setting, testing for compliance and linking compliance with financial incentives has ensured
continuous performance improvement over time. In Zambia a similar role has been played by the
regulator, the National Water and Sanitation Council (NWASCO). The regulatory agencies of the
Philippines and Mozambique have adopted benchmarking more recently. Linking performance with
financial incentives and compulsory participation has resulted in the realisation of some benefits, despite
some problems in the adoption of the frameworks. Performance information has also been useful for
comparative regulation and to create healthy competition amongst utilities. This approach is being used
by most water regulators reviewed.
Box 3.7: Use of Performance Benchmarking for Regulation in Selected Countries
UK‐OFWAT: OFWAT is the independent economic regulator of the water and sewerage industry in England,
established in 1989 when the water and sewerage companies were privatised. Its primary role includes: price
determination, ensuring quality service to consumers by water companies, monitoring companies’ performance by
setting efficiency targets and encouraging competition where it benefits the consumers. It regulates over 34 companies
with a consumer base of 54 million. Annual reports are submitted by OFWAT to the respective ministries, which are to
be presented before the Parliament. Overall Performance Assessment (OPA) was used as a mechanism to incentivise
performance across a range of service areas. OPA is determined by measuring performance against service indicators,
which are weighted to reflect consumer priorities. The performance score achieved by companies is taken into account
when OFWAT reviews its price setting on consumer charges. Companies that have performed better are allowed to
charge their consumers more than companies that provided poor services. As the sector has now reached acceptable
levels of service delivery, OFWAT uses OPA to also capture the innovative service measures taken up by companies to
address the consumers’ changing requirements. Many of the current OPA measures focus on the reliability and
response times of companies. They do not measure the quality of the company’s response. There has been a consensus
among stakeholders for some time that the qualitative aspects of service need to be incentivised. As a result OFWAT
plans to now introduce a new ‘service incentive mechanism’ that will focus more on the quality of service and the

35
actual customer experience. OFWAT also uses comparative competition as an important regulatory tool. For this, it
compares the companies in terms of bills, service levels, quality compliance, leakage, operational costs, capital
expenditure, relative efficiency, network activity and financial performance. Comparative competition has enabled
efficiency and service improvements when setting price limits, thus benefiting both customers and the environment,
leading to better services at lower costs. It also does systematic international comparisons to put the UK companies in
a wider context, in relation to similar enterprises that have a distinct corporate identity and independence.
Zambia: The National Water Supply and Sanitation Council (NWASCO) is the autonomous regulator established by
an Act of Parliament to ensure the quality of service provision as per standards. The NWASCO regulates the 10
commercial utilities (CUs) which were set up under sector reform in Zambia. The CUs are filly owned by the
municipalities and cater to 84 per cent of the urban population. The lean structure of the NWASCO (a staff of 16) is
complemented by part time inspectors trained for the specific purpose, and water watch groups comprising volunteer
consumers to ensure public participation. The key regulatory tools developed by NWASCO include: licensing
measures to be undertaken by CUs, performance guidelines, NWASCO Information System (NIS), benchmarking and
a Special Regulator Supervision (SRS) tool. Guidelines developed include minimum service levels, accounting
standards, human resource development, extension of service to peri‐urban areas, and cooperative governance. Using
the NIS, NWASCO prepares an Annual Sector Report each year. This report provides performance details and
benchmarks, and also ranks providers. The top three CUs are rewarded during the launch; the worst‐performing ones
are reprimanded. The SRS is an enforcement tool used by NWASCO whereby utilities which perform poorly have to
submit performance improvement plans and monthly reports that highlight progress achieved against these plans.
Performance targets have been included in the staff incentive packages by the CUs. Over the past years, use of
regulation has resulted in performance improvement for different CUs.
Latin America: ADERASA, the Association of Water and Sanitation Regulatory Entities of the Americas, represents
regulators from 10 Latin American countries. The key objectives of ADERASA are to promote cooperation and
coordination of efforts in the development of the water sector in Latin America by facilitating the exchange of
experiences and collaboration around common initiatives in the field of regulation. As countries are at different stages
of development, it provides an opportunity for south‐to‐south learning. Further, many of the tools can be generic and
regional efforts in developing them would be valuable. As one of the main tools, ADERASA has encouraged
performance monitoring. Its use in decision making – while promoting accountability within the system – also
supports developmental activities in a cost‐effective manner, and encourages information and best practice sharing.
ADERASA uses the IBNET and IWA performance frameworks as a guide and has developed about 80 indicators on
different aspects of both the sectors. Data quality and analysis is also done with the help of the IWA analysis tool, and
external agencies are also contracted to analyse the data sets.
Mozambique: The Delegated Management Framework, formulated after the National Water Policy in 1995, gave the
Water Supply and Asset Holding Fund (FIPAG) the overall responsibility for water and wastewater services. Initial
funding and activities for rehabilitation, expansion and efficient operations has now made it possible to use regulation
more effectively. The Water Regulatory Council (CRA) was given responsibility for regulating water services, through
regulatory function is also shared with the municipalities. The key values of the CRA include: universal services,
accountability and transparency. CRA also has defined strategies for regulating services in the peri‐urban areas. Under
the regulatory framework, it is compulsory for utilities to participate in the benchmarking process for water quality,
access to service, customer care, planning and reporting, investment evaluation, and commerce and finance. Under the
monitoring framework of the CRA, key performance indicators have been developed, and utilities can select the
indicators that are most suitable to their objectives. CRA has developed custom‐made software, the Outcome
Protection System, for this purpose. The software enables CRA technical staff to access the service quality by category,
city and sub‐system, and produce a range of reports of the service quality to suit the needs of the government, or as
communication to the assets’ owner or operator, or simply for the purpose of conveying information to the community
and public.
Australia: The Essential Services Commission (ESC) is the independent economic regulator for the state of Victoria.
Since 2004, it has undertaken inquiries into government processes for setting South Australia Water’s water and
wastewater charges. As water and wastewater services are not regulated services, the commission has no other
regulatory role in relation to them. The Commission’s objective is to inform the customers about the level of service
and to make information available to other stakeholders. The Commission seeks to initiate competitive comparisons
across businesses. Over the past five years, annual reports have been published each year by the ESC. The experience

36
suggests that the public disclosure and reporting of information can be a strong driver for performance. Key areas of
reporting are affordability for consumers, customer services, network reliability, water quality, conservation and
environment and historical performance. The data provided by businesses are independently audited, and businesses
are given an opportunity to comment on their performance. However, the Commission is not responsible for
regulating or driving improvement in reporting.
Sources: UK: OFWAT (2009); Zambia: Chanda (2006), Mbilima (2008), NWASCO (2008); Latin America: Carton and Molinari
(2007); Mozambique: Alvarinho (2007), Beete (2007), Cistac (2007), Remane and Shellshear (2007); Australia: Essential Services
Commission (2004) and (2010).
Use of performance indicators for regulation is also through performance‐based contracts. A number of
different forms of such contracts have been used within the water sector (refer Box 3.8). These may be
between the government and service providers such as the ones used in Uganda, Burkina Faso,
Johannesburg and Senegal (see Box 3.8) or with staff in utilities such as in Durban, Nairobi and the
National Water and Sewerage Corporation (NWSC) in Uganda. The contracts made with utilities “serve to
define roles and responsibilities as well as establish performance targets within set time frames. They can
also limit day to day political interference.”13 Performance contracts are also used internally within the
utility, such as with staff to achieve targets backed by both incentives and rewards. These are either
directly with individual employees (as in Kenya or eThekwini municipality in South Africa) or with units
within the utility as done by the NWSC in Uganda.
Box 3.8: Use of Performance‐based Contracts in the Water Sector
Use of Performance Contracts between Government and Water Utilities: Performance‐based contracting is based on
the clear identification of sector development goals and resources, and the roles and performance that service
providers need to achieve. They impose strict time‐bound performance targets to be achieved by the public or private
service providers along with incentives linked to improved performance. Performance targets may include the level
and quality of service, management and operational efficiency, financial and investment requirements, and
institutional improvement. Such contracts need to be the outcome of a shared vision between the government and the
utility, which in turn helps define resources and financing needed to realise the vision.
A number of countries in Africa use performance contracts with their utilities to guide sector reforms and to achieve
targets. These contracts also help to move towards efficient and financially sustainable water utilities. Countries that
use such contracts with the public utilities include: Uganda, Burkina Faso and Kenya. In Senegal, a similar
performance contract is between the public asset holder (SONES) and private operator (SDE), which is backed by a
financial model that facilitates target setting and performance monitoring within a framework of financial equilibrium.
The contract incorporated targets to be met for two parameters of leakage and bill collection by the private operator,
based on which revenue would be generated for the operator.
Use of Performance Contracts within Utilities: Often the utilities translate their commitments with the national
governments to use contracts internally with staff to ensure that the targets are actually met through the cumulative
efforts of all staff within the utility. Individual performance contracts for senior staff are a practical tool to improve
financial viability and to meet other targets. “At both Nairobi Water and Sewerage Company (NWSC) in Kenya and
eThekwini municipality in Durban, South Africa, all senior management staff have agreed to five‐year performance
contracts, and are accountable to the Board of Directors or the municipal council. All employees have clear
performance targets that are reviewed annually.” (Mehta et al. 2007, p. 17)
The NWSC in Uganda provides water services in Kampala as well as in 14 other towns. It has introduced performance
contracts through an internal bidding system where the winning management team enters into an Area Management
Contract with the NWSC headquarters. The contract lays down the performance to be achieved, incentives for good
performance and penalties for poor performance or failing to meet the agreed targets. These contracts were made with
units in all the towns. Within Kampala the Area office in turn entered into contracts with the branch offices. Incentive
13 Mehta et al. (2007) p. 17.

37
mechanisms used performance indictors related to: cash operating margins, unaccounted‐for water, working ratio,
days receivable ratio and connection efficiency.
Use of Performance‐based Service Contracts: Use of performance information can also be valuable for making the
typical conventional service or short‐term management contracts performance based. This requires providing clear
incentives linked to improved performance and disincentives or penalties for failing to meet agreed performance
levels. Payments for service are linked to actual results achieved. “Such an approach could be especially attractive in
situations where the government has decided to keep the water utility under public management, but is looking for
ways to capitalise on the technical expertise and potential efficiency of the private sector.” (Kingdom et al. 2006, p. vi)
Such contracts can be developed for any services provided by the private sector for activities such as reduction of non‐
revenue water, efficiency improvement in billing and collection systems, or meeting targets for new connections or
consumer grievance redressal.
Kingdom et al. (2006) discuss such contracts for reduction of non‐revenue water. They emphasize that “the driving
factor when designing a performance‐based service contract for NRW reduction is to establish an incentive framework
that encourages the private sector to deliver results in the most cost‐effective manner and allocates risk appropriately
between the parties. Key lessons from the cases reviewed include the need to leave sufficient flexibility to the private
partner, to set appropriate and realistic targets, and to limit cost. In the context of most water utilities in the
developing world, the challenge will be to find a balance between accountability for end results on one side and a cost‐
effective level of risk transfer to the private sector on the other side.” (Kingdom et al. 2006, p. vi)
Sources: Mehta et al. (2007) for NWSC (Uganda), Nairobi, Senegal, Burkina Faso and South Africa; Baietti et al. (2006) for
NWSC (Uganda) and ONEA (Burkina Faso); Brocklehurst et al. (2004) for Senegal; Mugisha et al. (2004) for NWSC (Uganda);
and Kingdom et al. (2006) for NRW related contracts.
While the use of performance contracts has been common in many African and South‐East Asian
countries, these have been preceded by institutional reforms that have generally helped to establish
operational autonomy of the service provider in urban settings. Thus, the use of such contracts would
necessitate appropriate sector reforms that make it possible to use the system of incentives and penalties
effectively.
3.2 Review of Benchmarking Studies and Use of Performance Measurement in India
This section reviews the development and use of performance information for urban water and sanitation
sector in India. First, it provides a review of various studies that have been carried out for performance
benchmarking in the water and sanitation sector that have been done in India over the past decade. Some
of the issues that emerged through these studies are being addressed through the recent initiative of the
Government of India to develop SLBs. In addition, performance information is being increasingly used in
reform‐linked programmes, including the Jawaharlal Nehru National Urban Renewal Mission (JNNURM)
as well as for various awards by state governments. State governments also collect performance
information in their routine monitoring, though the reliability of this is not ensured, and information
collection may also tend to be ad hoc. The recent recommendation by the 13th Finance Commission to
require the state governments to make this information available to access performance‐based grants
provides an incentive to make this activity more systematic, regular and reliable.
Review of past studies in India: Over the past decade, there have been three major efforts to measure
performance for urban water and sanitation in selected cities (refer Table 3.3 and Box 3.9 for details). Their
purposes have varied, ranging from providing baseline information to exploring the possibility of
introducing benchmarking practice to cities in India. While the National Institute of Urban Affairs (NIUA)
study has covered all class I cities, the CRISIL Advisory Services and ADB studies were limited to about 20
cities each. These have been largely a one‐time effort and have used different indicator sets. Annex Table
A2 provides highlights of results across a few cities in India drawing on the results from the ADB and

38
WSP studies. While both studies were published in the same year, there is some variance on results for
some indicators. This makes it difficult to prepare comparative assessments across cities and evolve
benchmarks. For example, the CRISIL study states: “coverage, metering and production statistics are not
fully reliable. Therefore, there is no data to support a decision to choose between non‐revenue water
(NRW) reduction and capacity addition as a means to improve the quantity of water supplied to the
consumers” (p. 5). The NIUA study also emphasises the difficulty in getting the necessary data.
Table 3.3: Review of Past UWSS Performance Benchmarking Studies in India
Description
and sponsors
Survey
year
Purpose Coverage of
cities
Nature and type of sub‐
sectors and indicators
NIUA study
sponsored by
CPHEEO
1999‐00 To determine the status of
water supply, sanitation
and SWM services
300 Class I towns
and cities in India
Water supply, sanitation and
SWM sectors; 18 indicators in
water supply, 8 indicators in
wastewater and sanitation, and
11 indicators in SWM
CRISIL Advisory
Services study
sponsored by
WSP
2003‐04 To create awareness
about benchmarking and
develop performance
indicators
13 utilities in
Phase 1 and 16
utilities in Phase
2.
Water and wastewater; 12
indicators related to coverage,
production and consumption,
financial and resource
management
Utility data book
sponsored by
ADB and MoUD
2007 To provide baseline
information for JNNURM
cities, to initiate
benchmarking in
operations and annual
business planning, and
promote transparency
20 cities: 15
Municipal
corporations, 2
city boards, 2
municipalities,
and a private
operator
Water supply; 13 indicators
related to coverage, availability
and consumption of water,
metering, financial and human
resources management
Sources: NIUA (2005), CRISIL (2004), ADB (2007). The abbreviations: ADB: Asian Development Bank, CPHEEO: Central
Public Health and Environmental Engineering Organisation, JNNURM: Jawaharlal Nehru National Urban Renewal Mission,
MoUD: Ministry of Urban Development, NIUA: National Institute of Urban Affairs, WSP: Water and Sanitation Program.
Box 3.9: Urban Performance Benchmarking Studies in India
NIUA Report for UWSS in 300 Towns: This major study was done in 1999‐00 for all metropolitan and Class I and II
towns in India covering both physical and financial aspects of water supply, wastewater and solid waste management.
Besides assessing the current situation, the focus was also on determining investment requirements. The study was
done by the National Institute of Urban Affairs (NIUA) and funded by the Central Public Health and Environmental
Engineering Organisation (CPHEEO). Though not specifically a benchmarking study, it assessed performance across s
large number of towns. However, it also suggests that the data can be used for inter‐city comparisons, and thus is one
of the first Indian studies with an intrinsic suggestion for employing benchmarking practice in the sector. Despite
considerable efforts, data gaps and reliability of data remained an issue.
UWSS Utility Data Book for 20 cities: This study by the Ministry of Urban Development, Government of India
(MoUD, GoI), and the Asian Development Bank (ADB) was for 20 Indian cities which are covered under the
Jawaharlal Nehru National Urban Renewal Mission (JNNURM), and focused on 10 key indicators. A workshop was
conducted to help the participants understand benchmarking as a tool for performance measurement and determine
the most appropriate performance measurement indicators. The compilation of a performance assessment data book
and benchmarking for the water utilities was envisaged to be an important step for performance improvement
activities. Availability of reliable performance information for planning and monitoring is recognised as an important
factor in sustaining the reforms under this programme. The report acknowledges that despite the effort to make the
data as reliable as possible there are some inconsistencies and estimates in the information provided by the utilities.
A clear message from this study was the need to focus on 24x7 water supply to achieve better services while ensuring
financial sustainability. It provides a standardised utility profile for each city, inter‐city comparisons and a list of good

39
practices. This compilation uses the standard indicators as in other utility data books developed with support from the
ADB for cities in Asia, and thus makes it possible to compare Indian cities with their counterparts in Asia.
UWSS Performance Benchmarking: A similar performance assessment and benchmarking project was undertaken by
the MoUD in partnership with the Water and Sanitation Program‐South Asia in response to the need for better
baseline data on the performance of water utilities in urban India to support the JNNURM programme. The study was
carried out by the CRISIL Infrastructure Advisory Services. The project was carried out in two phases. The first phase
covered 13 utilities in 2003‐04 and focused on creating awareness about benchmarking and its benefits as a tool for
improvements in this sector. It helped to develop locally relevant and useful performance indicators. In the second
phase, 16 cities were taken up in 2006 with the objective to scale up and identify measures to improve existing data
collection systems for future benchmarking efforts. However, only 10 utilities provided the required data. A major
innovation was to assess data quality and introduce a reliability scale. Two cycles of data collection were done to
ensure consistency of the collected data and to understand the data collection system.
The completion of the second phase of the project has reinforced the importance of benchmarking as a performance
improvement tool by the utilities and the need to institutionalise it. It customised IBNET indicators in the Indian
context and did detailed assessment across 12 key performance indicators. The focus on reliability assessments paved
the way for incorporating this aspect in detail in the recent SLB Initiative by the GoI.
Urban Services Environmental Rating System (USERS): The Government of India undertook a project with United
Nations Development Programme (UNDP) and Tata Energy and Resources Institute (TERI) to develop a regulatory
mechanism that would enable monitoring, information sharing and adoption of best practices in the water supply
sanitation and solid waste management sectors. Referred as the ‘Urban Services Environmental Rating System’
(USERS), this initiative aimed to develop a framework for benchmarking, test it in a few cities and disseminate across
other cities. A set of indicators were developed in consultation with different stakeholders for all the three sectors. The
performance indicators for the utilities would be used to identify information gaps, prioritise issues, identify targets,
improvement measures and allocation of funds. Apart from benchmarking against targets, it also encourages inter‐
utility benchmarking, which could eventually be used to develop a rating system as an indicator of municipal services.
The cities of Delhi and Kanpur were identified as the pilot cities. The benchmarking initiative was to be extended to
other cities after the pilot phase; however, no literature is available to review the progress of the project.
Urban Indicators and Performance Measurement (UIPM): The City Managers’ Association of Gujarat (CMAG) with
technical assistance from International City/County Management Association (ICMA) and financial assistance from
USAID had undertaken a programme to introduce benchmarking as an analytical tool for policy makers to support the
decision‐making process in 2000. The performance assessment in this programme was applicable to all infrastructure
aspects that come under the jurisdiction of a municipality and the financial aspects. The performance measurement
results analysis was envisaged to be used to address issues of infrastructure and municipal finances in urban
governance. The project aimed at providing urban local bodies, decision makers/implementation agencies with an
analytical tool, which would enable effective planning and decision making. The study sought to analyse the situation
of the urban local body (ULB) with regard to financial situation and service delivery. The indicators were developed to
determine service levels, service coverage and its costs and efficiency. An overall ranking of various services and a
comparison of 10 ULBs was done. The long‐term objective of the study was to develop a management information
system to collect and document the data in the required format, which would enable continuous monitoring of
performance over time in a municipal body as well as comparison with other ULBs. The study would also heighten
sensitivity and awareness of stakeholders towards urban management issues and create a healthy competition to
improve performance.
CMAG used the UIPM study to advocate for uniform accounting codes in cities across Gujarat and numerous
handholding workshops were organised to promote use of performance information. For example, Surat Municipal
Corporation (SMC) which had a poor coverage of services to slum population under the study introduced several
improvements. Today SMC provides piped water supply to 95 per cent and sewerage network to 97 per cent of its
population. The UIPM programme was adopted by other city network associations in states of Madhya Pradesh and
Karnataka and also served as a learning tool for associations of Indonesia.
Sources: Refer Tables 3.3 and 3.4.

40
In addition to the WSS‐specific studies, a few other efforts have focused on a wider scope encompassing all
urban services, environment and customer satisfaction (refer Table 3.4 and Box 3.9 for details). In these,
water and sanitation are included as part of city level civic services.
Table 3.4: Performance Benchmarking for All Urban Services
Description
and sponsors
Survey
year
Purpose Coverage of
cities
Nature and type of sub‐
sectors and indicators
TERI study
sponsored by
UNDP
2002 To develop a mechanism
for monitoring,
information sharing and
adoption of best practices
Pilot testing of the
USERS in Delhi
and Kanpur
Quantity and quality of
drinking water, sewage
treatment, solid waste
collection, and satisfaction
levels of citizens
UIPM study of
Gujarat by
CMAG
2000 To introduce
benchmarking as an
analytical tool for policy
makers to support the
decision making process
10 cities: 6
municipal
corporations and
4 municipalities
(Class A) in
Gujarat
Service levels and coverage,
costs, quantity and quality of
drinking water supply, sewage
treatment, roads and storm
water drainage, streetlights,
solid waste management, staff
efficiency, health
Sources: TERI (2002), CMAG (2001).
The abbreviations stand for: CMAG: City Managers’ Association of Gujarat, TERI: Tata Energy and Resources Institute, UIPM:
Urban Indicators and Performance Measurement, UNDP: United Nations Development Programme, USERS: Urban Services
Environmental Rating System.
Use of performance information in national reform‐linked funding programme: Over the past five years, use of performance information has been envisaged under the new national programme, JNNURM,
which was launched by the GoI in 2005. Funding under the JNNURM is linked to ULB commitments on
selected reforms. The JNNURM envisages significant investments with a commitment of Rs 50,000 crore
(about US$11 billion) by the GoI over a seven‐year period till 2012. Interestingly, while the JNNURM
funds are available for all urban infrastructure, water supply, sewerage, sanitation and drainage comprise
about 73 per cent of projects sanctioned by 2010 and 81 per cent of total project costs approved.14 Thus,
UWSS is an important component of investment funding through this national programme.
The programme requires all participating ULBs to commit to selected mandatory reforms along with a
timeline. In addition, the respective state governments also have to commit to mandatory state‐level
reforms. With reference to the urban water supply and sanitation sector, key areas of reforms include
commitments on: equity – coverage and funding for the urban poor; financial viability – recovery of
operation and maintenance costs through local revenues including property tax and reasonable user
charges as well as improved financial systems; accountability – public disclosure of performance
parameters and service levels, and improved consumer links through e‐governance. The ULBs are also
expected to introduce the necessary administrative structural reforms and public private partnerships to
enhance efficiency in delivery of civic services. The reform commitments outlined under the JNNURM
have been signed by nearly 70015 ULBs across India.
14 Based on monitoring reports retrieved from the JNNURM website (http://jnnurm.nic.in) on January 2010. 15 This is estimated on the basis of 62 cities covered under the main JNNURM component and about 635 cities
and towns under the UIDSSMT component. While the MoAs signed by the 62 cities are available on the
JNNURM website, those for the 635 cities under UIDSSMT are not easily available in the public domain.

41
Table 3.5: UWSS‐related Performance Parameters in Reforms under the JNNURM At state government level
1. Public Disclosure Law Enactment of Public Disclosure Law to ensure release of quarterly performance information
to all stakeholders, particularly information on financial and operating parameters; also
service levels for various services being rendered by the municipality
2. Community
participation
Enactment of Community Participation Law to institutionalise citizens’ participation and
introduce concept of area sabhas (that is, local committees)
3. Service delivery
responsibility and
accountability
Transferring special agencies for civic services to urban local bodies and accountability
platforms for service providers in transition
At urban local body level
4. E‐governance Focus on transparent administration, quick service delivery, effective management
information systems, and improvement in service delivery links
5. Municipal accounting Accounting systems based on double‐entry and accrual principles, leading to better
financial management, transparency and self‐reliance; development of state manual,
transition to double‐entry accrual systems, external auditing
6. Property tax Establishing a transparent and equitable property tax regime; Full coverage of property tax
to all taxable properties, geographic information system‐based property tax systems,
efficient property tax collection systems
7. O&M cost recovery
through levy of
reasonable user
charges
Focus on securing effective linkages between asset creation and maintenance, ultimately
leading to sustainable delivery of urban services; policy on user charges enabling full
recovery of operation and maintenance costs, volumetric based tariff, reduction in non‐
revenue water
8. Internal earmarking of
funds for urban poor
Focus on earmarking of funds in local city budgets specifically for services for urban poor;
budget allocation for service delivery specific to urban poor; accounting and budget
systems to track revenue and expenditure on services for urban poor
9. Provision of basic
services for urban poor
Focus on provision of basic services at affordable prices including water supply and
sanitation and housing
10. Byelaws on use of recycled water*
Focus on framing byelaws related to reuse and recycling of wastewater
11. Structural reforms and PPP*
Focus on urban sector management such as organisation structure, decentralisation where
necessary, improved coordination mechanisms amongst city level agencies, and PPP
models for more efficient delivery of civic services.
Source: Based on MoUD (2005). Reforms marked with an asterisk (*) are the optional reforms.
An implicit prerequisite for the success of reform linked programmes envisaged under the JNNURM is the
ability of national and state level agencies to monitor performance on these reforms. Under the JNNURM,
appropriate institutional arrangements have been developed for such monitoring at the state and national
level with assessments conducted through independent institutions. However, such monitoring also
requires capacity at the local level among ULBs and other service providers, especially for reforms related
to key basic services such as water supply, sanitation and solid waste management. While most cities and
state governments do have large volumes of data, these are often not analysed and no systematic approach
is available for standard indicators. Thus capacities will need to be built at the local and state government
levels to track reform implementation meaningfully.
Performance benchmarking through standardised Service Level Benchmarking (SLB): A recent initiative of the GoI attempts to address some of the issues facing UWSS benchmarking in India. It aims to
develop a set of standardised service level indicators and related benchmarks for water supply,
wastewater, solid waste management and storm water drainage. The main objectives of the SLB
framework are to develop a common minimum framework for monitoring and reporting on service level
indicators along with the guidelines to operationalise the framework in a phased manner, to support cities
to develop an Information System Improvement Plan to improve quality and reliability of information,
and to encourage the adoption of this framework for performance monitoring as well as for formulating
performance improvement plans.

42
In the first phase of SLB development, a series of indicators have been developed through a consultative
process for each of the four sub‐sectors (see Table 3.6). For each indicator, its definition, means of
measurement, and frequency and jurisdiction of measurement and a reliability scale have been developed.
The detailed work was carried out by a core group of experts from various institutions over the past two
years. Under the MoUD’s leadership, the SLB framework has been piloted in 26 cities across India. The
availability of such a nationally agreed and mandated basic set of standardised indicators makes it
possible to gradually develop a state‐wide performance benchmarking system that can be later scaled up
to other states.
Table 3.6: Government of India’s Standardised Service Level Indicators and Benchmarks Water supply Benchmark Wastewater Benchmark
1 Coverage of water supply connections 100% 1 Coverage of toilets 100%
2 Per capita supply of water 135 lpcd 2 Coverage of wastewater network services 100%
3 Extent of metering of water connections 100% 3 Collection efficiency of wastewater
network
100%
4 Extent of non‐revenue water 20% 4 Adequacy of wastewater treatment
capacity
100%
5 Continuity of water supply 24 hours 5 Quality of wastewater treatment 100%
6 Efficiency in redressal of customer
complaints
80% 6 Extent of reuse and recycling of
wastewater
20%
7 Quality of water supplied 100% 7 Extent of cost recovery in wastewater
management
100%
8 Cost recovery in water supply services 100% 8 Efficiency in redressal of customer
complaints
80%
9 Efficiency in collection of water supply
related charges
90% 9 Efficiency in collection of sewerage related
charges
90%
Solid waste management Benchmark Storm water drainage Benchmark
1 Household level coverage of SWM
services
100% 1 Coverage of storm water drainage
network
100%
2 Efficiency of collection of municipal
solid waste
100% 2 Incidence of water logging/flooding Zero
3 Extent of segregation of municipal solid
waste
100%
4 Extent of municipal solid waste
recovered
80%
5 Extent of scientific disposal of
municipal solid waste
100%
6 Extent of cost recovery in SWM services 100%
7 Efficiency in redressal of customer
complaints
80%
8 Efficiency in collection of SWM related
user charges
90%
Source: MoUD (2009).
The SLB initiative also puts emphasis on issues around data reliability. For each of the 28 indicators across
different sub‐sectors, reliability scores have been worked out depending on the manner in which data
required for the specific indicator is captured, recorded and analysed. Each reliability level has been
developed on the basis of reliability of data source and its accuracy. This approach is developed on the
basis of previous studies and knowledge about likelihood of available information among Indian cities.
While a reliability score of ‘A’ suggests the highest level of reliability, lower levels would suggest that the
urban local authority/utility needs to improve its data and monitoring systems. Table 2.15 in the previous
chapter provides an illustration of the development of such reliability scales.
The 13th Finance Commission which recently gave its recommendations to the GoI has suggested a General
Performance Grant for all local bodies in India. For ULBs this grant is estimated to range from about Rs
850 crore (US$185 million) in 2011‐12 to Rs 8,000 crore (US$1.85 billion) by 2014‐15. This grant requires the

43
state governments to assess and publish information on service performance. To quote, “For a start, State
Governments must notify or cause all the municipal corporations and municipalities to notify by the end
of a fiscal year (31 March) the service standards for four service sectors – water supply, sewerage, storm
water drainage, and solid waste management proposed to be achieved by them by the end of the
succeeding fiscal year. These levels may be different for different municipalities. We envisage such a
commitment to be achieved through a consultative process with the local bodies. Such a notification will
be published in the State Government gazette and the fact of publication will demonstrate compliance
with this condition” (GoI 2010, p. 169). This recommendation provides an incentive for state governments
to develop state‐wide performance monitoring systems. However, as with the JNNURM experience
earlier, this will require local capacities to generate the base information and gradually improve the
quality and reliability of information.
Use of performance information at state level: Various state government efforts have also made use of
UWSS performance information for their own programmes, for constituting performance awards as well
as for their regular routine monitoring. Our review focuses mainly on the efforts in Gujarat and
Maharashtra. UWSS performance information in Maharashtra has been used in Maharashtra for three
types of activities: (a) the government’s own reform‐linked investment programme, namely Sujal and
Nirmal Maharashtra Abhiyan (SNMA); (b) for an innovative and home‐grown sanitation award scheme
called the Sant Gadge Baba awards; and (c) for the government’s regular routine monitoring (refer to Box
3.10).
Box 3.10: Use of Performance Information in Maharashtra
SNMA: Sujal Nirmal Maharashtra Abhiyan (2009‐2012) is a state‐level reform linked investment programme initiated
by the Government of Maharashtra (GoM) for improving the service delivery of basic water supply and sanitation
infrastructure in urban areas. Key reform outcomes as envisioned in SNMA include: full coverage of individual water
supply connections to households, full metering of all bulk and individual connections, migration from single entry to
double entry financial systems, water and energy audit for water supply systems, identification and regularisation of
illegal connections, preparation of city sanitation plans, etc. Scores are allotted to each urban local body (ULB) based
on its performance in the above areas. Funding for reforms is available to all ULBs and reforms are required to be done
before embarking on major capital investments to increase capacity for water supply or extending utility networks.
Annex Table A6 provides a summary of SNMA reforms at ULB level and respective weightages.
Sant Gadge Baba Awards (SGBA, 2002) were initiated by the GOM to promote cleanliness in rural areas. After the
great success of SGBA in rural Maharashtra, the GoM initiated the same awards for urban areas in 2002. The awards
are meant to incentivise ULBs for improving public and individual cleanliness including open defecation free status,
adequate supply of clean drinking water, management of wastewater and solid wastes, and overall enhancement of
public health. All ULBs are eligible to apply; the winners are identified through a transparent process starting at the
district level. Awards are presented to ULBs in different categories with a focus on the extent of improvement
achieved. Annex Table A7 provides a summary of SGBA reforms at ULB level and respective weightages.
Routine Monitoring by Department of Urban Development: The Directorate of Municipal Administration (DMA) is
the nodal agency responsible for all the municipalities in the state. The central and state funds are directly disbursed to
ULBs or through the collector when administrative approval is required. In the monitoring process, the collector holds
monthly review meetings, and DMA representatives conduct quarterly review meetings. Information is collected on a
quarterly basis by the district collector with consolidation taking place at the divisional level. There is, however, no
uniform system of data collection and aggregation at the state level at present.
Sources: SNMA: GR of GoM (2008); SGBA: WSSD (2002); Routine monitoring – based on discussions with GoM officials.
The Gujarat government, on the other hand, does not have a specific UWSS reform linked investment
programme, but has introduced a common information system for regular routine monitoring. A newly

44
constituted Gujarat government municipal award uses performance information to recognise and reward
ULBs which have made remarkable progress in urban service delivery (refer to Box 3.11).
Box 3.11: Use of Performance Information in Gujarat
Regular Monitoring by Department of Urban Development: The state level monitoring framework involves a set of
standard formats (‘patraks’) used to collect service related information of water supply, sanitation and finance. While
some of the performance information is reported on a monthly basis, the finance information is on an annual basis.
Information related to water supply and sanitation is reported to the Directorate of Municipalities (DoM) within the
Urban Development Department, and finance information is reported to the Gujarat Municipal Finance Board
(GMFB). Similarly, in the case of grant transfers under devolution from the state to local governments, a quarterly
monitoring and reporting system is in place. However, there is a need for on‐ground verification of asset creation and
performance improvements. In general, there is only limited reporting of performance information and most of is not
backed by a detailed database. New efforts are being now made to develop a common database across all
municipalities that can be used for meeting various monitoring needs. Annex Table A9 provides a summary of reports
used for regular monitoring.
Performance Monitoring under Nirmal Gujarat (NG) and Swarnim Gujarat (SG) (2007): NG is policy initiative of GoG
aiming at clean air, water and land in Gujarat. All recent state programmes and initiatives in the arena of water,
sanitation, energy efficiency and CDM fall under this programme launched in 2007. It focuses on delineating scope for
participating 25 state government departments and all municipalities with a holistic approach, by facilitating them to
plan and develop strategy for implementation internally. Under SG, the GoG has an ambitious set of goals to celebrate
its golden jubilee as it was set up 50 years ago. Both NG and SG goals are being monitored at the highest level and
feedback is received from nodal officers of different departments. This programme monitoring also encourages cross‐
learning between the department and ULBs.
Best Municipality Awards in Gujarat (2009) was launched by Urban Development Department (UDD) of GoG. The
nodal agency for conducting the evaluation of ULBs is the GMFB. The performance of ULBs under various schemes
proposed by state and central government is reviewed for 2006‐07 and 2007‐08. The award scheme is based on a 100
point system given to each ULB in various parameters related to administration, finance and planning. All four classes
of ULBs in the state (A, B, C and D Class) are evaluated differently. The first two ULBs in each class and their chief
officers are awarded for their efforts. Unfortunately, again, service performance information is not included in this
award.
Sources: Regular monitoring and performance monitoring under NG and SG: based on discussions with concerned officials;
Municipal Awards: GoG (2009).
The Government of Gujarat (GoG) has also supported state‐wide development of accounting and property
tax systems for all municipalities in the state (refer to Box 3.12). This not only provides a uniform system of
accounting across ULBs but also facilitates faster and more simple retrieval of information on income and
expenses in service delivery, which can be further used to design financial performance improvement
plans. Similar state‐wide efforts are needed to improve the quality of UWSS performance information.
Box 3.12: Gujarat: State‐wide Efforts to Improve Quality of Information
Computerised Property Tax Systems for Municipalities in Gujarat (2008) is implemented by Gujarat Municipal
Finance Board (GMFB) in coordination with All India Institute of Local Self‐Government (AIILSG), Ahmedabad
Regional Centre. AIILSG carried out survey, data entry, and software development for a property tax system for all
141 municipalities of the state. This is the first such state‐wide effort in India. The programme also included training
for municipality staff in the operation and management of software and the overall system. As an outcome of this
exercise all municipalities have computerised databases for property tax and the associated software helps to generate
regular bills for property tax.

45
Gujarat Municipal Accounting Reform Project (GMARP, 2005): GMARP has been developed and is being coordinated
by the City Managers’ Association Gujarat (CMAG) with support of GoG, UDD and GMFB since November 2005. The
CMAG first supported accounting reforms based on National Accounting Manual published by the Comptroller and
Auditor General of India. Under the project, local chartered accountancy firms were appointed to implement a
computerised, accrual‐based, double‐entry accounting system in all municipalities in Gujarat. This is being funded
through GoG grants. The support to municipalities is planned to be gradually phased out with the expectation that the
ULBs will either develop internal capacity or meet the costs of outsourcing this from their own funds. The main
outputs include: (a) preparation of balance sheets; (b) municipal fixed asset valuation; and (c) budgetary reforms.
Sources: Based on discussions with concerned agencies and officials.
ULB level processes for data capture, review and use of performance information: As compared to
national and state level studies and programmes, there is very little effort to understand and review the
processes at the local level by ULBs. As in Gujarat and Maharashtra, ULBs themselves are largely the
service providers these processes include data capture, analysis and review, preparation of monitoring
reports for upward accountability to national and state governments, use of information for decision
making and for dissemination of results, especially to the consumers.
As per the current practices in most ULBs and the UWSS sector in general in India, the emphasis in
infrastructure planning for water supply within ULBs is on new investments, largely for expanding source
capacity or extending distribution network to new areas. At best, the focus is also on rehabilitation of
existing distribution network though the emphasis tends to be on augmentation of storage capacity or the
pipe network rather than reducing physical losses. Table 3.7 identifies an illustrative set of processes for
water supply operations to meet the overall goals of full coverage at adequate service levels, while
ensuring financial sustainability. These processes will need to be mapped and assessed in detail at the ULB
level for data capture, analysis, review, and performance improvement. As such studies have not been
done in Indian cities, detailed process studies were undertaken in two ULBs in Gujarat to gain preliminary
insights in a few of these selected processes.
Table 3.7: Illustrative ULB Processes for Performance Improvement in Water Supply
Water production, supply and distribution
Water production and
supply
Process for production and supply of water to different zones – quantity of water,
hours of supply and water quality
Process for water quality surveillance
Extension of
distribution network
Process for extending distribution network to uncovered areas
Process for providing internal distribution network in slum settlements
Maintenance of
distribution network
Plans for reducing physical losses through leakage management and other processes
Developing and carrying out regular maintenance plans for distribution network
Consumer relations
Consumer connections Process for new connections and recording
Process for new residential connections in slum areas
Illegal connections Process for identifying and regularising illegal connections
Consumer grievance
redressal
Process for receiving, recording and addressing consumer complaints related to water
supply
Tariff setting Process for setting tariffs for water consumption and for new connections, including
separately for the poor
Billing and collection Process for billing to consumers and collection of payments
Source: Based on process studies in two cities in Gujarat under the PAS Project.

46
Figure 3.1: Process Chart for Water Production in a City in Gujarat
Figure 3.1 illustrates the process for water production monitoring in a city in Gujarat. It took considerable
studies by the PAS Project team to draw up such process charts for a few key areas of operations. These
studies revealed that as part of routine daily operations, a large amount of information is collected in the
field but not always analysed. Using such process charts, it was possible to identify the key stages of
decision making where some target setting and monitoring would be possible (that is, at the level of wards
and zones in terms of operating hours, quality and complaint redressal). It was also possible to identify
some key information that is not collected at present (for example, information on water pressure). Thus,
more effort will be needed on introducing process reengineering for use of information for improved
performance as illustrated in Figure 3.2. Further studies are planned to be taken up after the first round of data collection is completed.
Figure 3.2: Process Reengineering to Introduce KPIs in Water Production Monitoring

47
3.3 Key Lessons from Review of National and International Efforts
The reviews in the previous sections highlight the increasing recognition and emphasis on the need to
develop systematic measurement of service performance and to use these for improving delivery of water
and sanitation services. The types of efforts have ranged from developing standardised frameworks for
performance measurement (for example, by IBNET, IWA and under the GoI’s SLB Initiative) to carrying
out periodic studies of performance levels across service providers. Many governments and utility
associations have also taken up comparative benchmarking on a regular basis, increasing their efforts to
make results widely available and promoting ready comparisons through use of web‐based technology to
enable user‐led query mechanisms. Performance information has also been used for regulation in different
settings by regulators and in performance contracts. The latest innovation has been to develop
performance‐based funding to local service providers by donors and higher levels of government. Key
findings from the Indian experience and lessons from international experiences are identified here.
Measuring performance: Past experience in India highlights the wide variation in indicators used across
different studies as well as across different programmes, though the recent effort of the GoI under the SLB
Initiative provides a standardised set of service indicators with related definitions.
Common standard definitions and local choice of indicators: Interestingly, international
experience suggests that while the efforts to develop standardised performance indicators (for
example, by the IBNET and IWA) have helped to evolve standard definitions, the actual choice of
key indicators has been through a local process. It is possible that a similar process will be needed
in India where the state governments can use the SLB as a guiding framework.
Indicators for monitoring versus local actions for performance improvement: Measurement of
performance can be for benchmarking or regulation which requires a few key performance
indicators (KPIs) that match with the overall sector goals and key reform areas to achieve
efficiency and equity. These need to be identified carefully in the given context. Benchmarks for
these would also need to be set in relation to sector goals and key strategies. On the other hand,
more detailed indicators may be needed for designing and monitoring performance information at
the local level. These would ideally be derived from an understanding of underlying processes.

48
Absence of equity related indicators: In general, most benchmarking frameworks do not address
the equity issues. While under the JNNURM reforms in India, the concerns about equity have been
raised, lack of clear definitions makes it difficult to measure and monitor these properly. The
IBNET has also attempted to develop a few key indicators to address equity concerns.
Improving quality and reliability of information: The review of studies and performance
assessments in India clearly highlights the need to focus on ensuring good quality and reliable
information, without which any comparisons or use of this information become difficult. The international
literature also highlights its importance. However, it is interesting to note that in most benchmarking
reports and comparative performance assessments, quality of information is not reported explicitly. Based
on the review, a number of lessons have been identified to ensure that quality of information is assessed
and gradually improved over time.
Capacity building support to service providers: At initial stages of benchmarking, the local service
providers often lack the capacity to collect the necessary data and develop indicators. In many
cases agencies have resorted to outsourcing components of performance measurement when the
in‐house capacity is insufficient or stretched for such exercises. For example, in Brazil, for SNIS,
this has included activities such as providing helpdesk services to local service providers,
verification of data received from the utilities and follow up on returning data forms to SNIS.
Standardised measurement of information quality and improvements over time: Given the
concerns over quality of information, it is essential to develop a standardised approach to
measurement of quality of information used for developing key indicators. This is essential to
measure information quality across a large number of service providers as well as to measure
improvements in information quality over time.
Supporting information system improvements: The approach to measurement should be linked
with identifying the steps needed to improve information quality. This will enable each service
provider to identify ways in which it can improve quality of information. Such improvements may
also be achieved through state level policies (for example, through state‐wide adoption of double
entry accrual accounting or improving slum information through surveys in all slum settlements
as being done in Gujarat)
Regular monitoring of performance: The review highlights the wide variety in how performance
information could be used, ranging from benchmarking initiatives by utility associations and governments
to regulators who also have tended to generate regular reports and used this for comparative regulation
and to create healthy competition across service providers. Essentially the key to these various uses lies in
regular monitoring of performance information through different efforts. To ensure that this happens
regularly and is made available to stakeholders, a number of lessons emerged from the review:
Regular reports and dissemination: Most benchmarking efforts generate regular annual reports of
comparative assessments. This is important as it helps to create a discipline of regular reporting. It
is important that such reports are shared with the service providers and are made accessible to
other stakeholders through appropriate dissemination channels. Experience with many efforts also
suggests that public disclosure can be a strong driver for performance.
Role of technology: Technology plays a critical role in developing and disseminating regular
reports on comparative assessments. Web‐based tools are increasingly being used for data capture
and standard analysis to generate and update reports in real‐time. With the advent of geographic

49
information systems (GIS) there is an increasing use of linking comparative analysis to maps for
analysis and more user‐friendly visual presentation. Experience also suggests the need for custom‐
made software that can help ease tasks in a cost effective manner, as suggested by the experience
of CRA in Mozambique.16
Use of performance monitoring for funding: Use of monitoring is more commonly done when
linked with funding. However, this requires careful design of the funding programme with
appropriate performance‐linked incentives and disincentives. It also necessitates a rigorous
monitoring regime with reliable information. The funding generally is linked to setting out local
level targets for improved performance.
Linking monitoring to improved performance: While regular monitoring has become increasingly
common, the use of this information to improve performance, however, has not been as common. While
there have been some attempts at process benchmarking, these attempts have been less systematic, and
require greater attention and efforts.
Need for rigorous peer‐to‐peer benchmarking: While regular reports are generally made in most
performance benchmarking efforts, these are more in the nature of utility‐wise reports. With
benchmarking being now done across many regions and countries using standard definitions,
there are clearly more opportunities for such analysis. However, compared to other sectors (such
as, for example, in microfinance17) our review did not find such analysis to be very commonly
done.18 Such peer‐to‐peer analysis is essential to identify benchmark values for key performance
indicators. It would also enable more meaningful use of performance results by individual utilities
to arrive at appropriate targets for performance improvement.
Process reengineering for performance improvement: While process benchmarking is recognised as
an important outcome of comparative assessments, it has been not taken up in a systematic
manner. More work is needed to assess and map out the existing processes that determine both
information capture and review as well as for improving performance. Such studies can draw on
the business process mapping used in many industries. This will help define performance
improvements that can be achieved through process reengineering, rather than the traditional
emphasis in the water and sanitation sector on new capital investments.
Incentives for improved performance: Use of performance contracts has been increasingly used by
governments with service providers as a way to meet the sector goals and reform agenda. As this
is regularly reviewed and used in conjunction with funding, it provides incentives for utilities to
improve performance. Some utilities, such as the NWSC in Uganda, have also used the concept of
performance‐based contracts within the utility. Thus incentives for improved performance need to
be built into upward (external) accountability as well as within the service provider as an internal
16 Alia and Shellshear (2007) and Gilles (2007). 17 For example, in the microfinance sector, Mixmarket does an annual benchmarking report that provides results
for nearly 60 key performance indicators grouped in themes such as: financial structure, outreach, financial
performance, efficiency, productivity, etc. The peer groups for analysis include: age, outreach, type of institution,
scale, sustainability, region and target market. (Mix, 2007) 18 One exception, however, was the use of international comparisons carried out by OFWAT for a set of about
nine indicators including: customers’ bills, unit costs, customer service levels, water quality, environmental
performance, water balance, water efficiency, leakage, and network activity. This is done across utilities selected
carefully to reflect distinct corporate identity and independence. The results are used to challenge all companies
to deliver a better service. (OFWAT, 2008)

50
system of accountability for outputs and results.19 This would require capacity building support
and simple methods and tools that can be used by service providers to determine performance
targets and track performance over time.
Ensuring sustainability of performance assessment systems: Given the past trend of several one‐time studies in India, it is important to plan from the outset to ensure long‐term sustainability of
performance assessment systems. While it is difficult to clearly lay down specific steps for this, a number
of factors could be identified that would promote sustainability:
Regular use at national, state and local levels: The most important factor in sustainability is the
regular use of performance information and comparative analysis generated. This may be through
its use at state or national levels by linking it to performance‐based funding, regulation or for use
in performance contracts with service providers. Alternatively it may be regular use within the
service provider organisations through internal processes for monitoring and performance
rewards. In initial years, there may also be a concern with sharing of results widely, especially by
the relatively poorly performing service providers. In such situations, political will is an important
factor for successful institutionalisation of a benchmarking project.
It is also interesting that sustainability requires good use of performance benchmarking
information and that widespread use first requires standard, comparable and reliable
(trustworthy) information across a sizeable (all for links to inter‐governmental transfers) number
of service providers. The need for regular reporting – as seen in the regulators in the UK, Australia
and Zambia – have led to well‐developed systems which are then internalised by utilities in their
own management information systems. This makes it easier to ensure sustainability.
Importance of scale: While not essential, another key aspect of sustainability is scale achieved
through universal coverage across all service providers in a given jurisdiction. This is important
for a number of reasons. First, this makes it possible for state and national governments to use this
information to funding and routine monitoring. Over time, this can become mainstreamed in
government processes.
Second, scale also forces identification of more cost‐effective methods for data capture and
analysis, as well as for data systems improvements. Some level of data collection is done by most
service providers often for their own management and/or to report to higher levels of government
or regulators. The presence of many data collection systems can be cost intensive, especially for
smaller utilities. Thus, the introduction of a new data collection regime needs to be aligned with
the existing system, to control costs for data collection and to make benchmarking an
improvement tool rather than a burden.
Finally, universal coverage makes it easier for higher levels of government to justify allocating
budgets. In general, compared to voluntary participation under schemes run by utility
associations, government involvement makes it mandatory and ensures universal participation.
Role of government to provide mandate: While some developed countries such as the Netherlands
and Australia do have regular benchmarking being carried out by their utility associations, in
most developed countries it is through the mandate provided by governments (for instance, in
19 This is also the approach suggested in the literature on new public management as a means to improve utility
performance. See Baieti et al. (2006)

51
Brazil, Tanzania and South Africa) or government agencies such as the regulator (for example, in
Zambia and the Philippines). Similarly, some countries such as Brazil have incorporated the
setting up of a National Information System in their Water Law.
3.4 Pilot Test of Performance Measurement Framework
The Performance Measurement Framework (PMF) described in Chapter 2 was pilot tested in Gujarat and
Maharashtra. The first step in pilot testing was to develop a detailed questionnaire for data capture. Key
lessons from pilot studies were drawn in terms of the process of data capture and measures needed to
address data availability and reliability. Based on the results and lessons from pilot tests as well as
feedback from the Expert Group meeting held following the pilot tests, the questionnaire and PMF tool
were finalised for the state level roll out.
Development of PMF Tool: The overall PMF Tool included: (a) detailed definition of all indicators; (b)
development of reliability scores for all key indicators; and (c) a detailed questionnaire for data capture to
generate key performance indicators (KPIs)20 as per the performance framework. Volume II of this report
provides the full set of indicators with detailed definitions and reliability assessment and scores for all
KPIs.21
Development of a questionnaire: The process of developing the questionnaire was iterative. The
CEPT team initiated the process by identifying the required information for assessing the PFM
indicators as well as reliability levels for all KPIs. To develop a standardised, comparable and
consistent reliability assessment across all ULBs, it was necessary to add a number of standard
qualitative questions. A preliminary checklist was developed by CEPT in consultation with the
PAS partners (UMC, AIILSG) and other stakeholders. The process of development of this
questionnaire and its pre‐testing took nearly three months.
In Gujarat, a major information system improvement has been in the area of finance. As per the
Gujarat Municipal Accounting Reform Project (GMARP 2005), all the 141 municipalities in Gujarat
(excluding municipal corporations) have now transitioned to computerised double entry accrual
based accounting systems. The data checklist has been developed to ensure easy retrieval of
information related to finance.
Scope of questionnaire: The questionnaire was developed keeping in mind that the water supply
and sanitation services provision is undertaken by the local governments. This played a key role in
the organisation of the questionnaire as various sections were organised on the basis of the
departments functioning within ULBs. It has 10 sections including those related to water supply,
sewerage and sanitation, solid waste management, consumer grievance redressal, staffing,
services in slum settlements, and finance. It also captures information at the lowest spatial unit of
the city for the KPIs related to coverage and some aspects of service levels in order to assess spatial
variation in related indicators.
The questionnaire also captured questions related to reliability assessment. This was necessary as
the state‐wide performance assessment needs to do a systematic measurement of reliability
through direct questions on records and documentation for data capture in the ULB.
20 KPIs include indicators for goals and reforms across all three sub‐sectors. 21 A detailed manual for data capture has also been prepared by the Urban Management Centre incorporating the
guidelines as well as other instructions for ULBs and enumerators.

52
Linking questionnaire with PMF indicators and KPI reliability: The questionnaire was developed
as a standard spreadsheet with inbuilt links to generate all performance indicators and the
reliability scores for all KPIs. This enables the ULB to assess its performance at the end of data
capture.
Pilot testing of the PMF tool: The PMF tool was pilot tested in 30 cities across Gujarat and
Maharashtra. The selection of ULBs for pilot tests was done in consultation with the respective state
governments. It was ensured that the selected ULBs included each class of ULB (refer to Table 3.8). Four
pilot cities were also included in the GoI’s SLB Initiative. The process started with a workshop where cities
were briefed on the project objectives and their role in developing performance measurement systems.
Various state agencies were also part of the workshop. A critical aspect was to test the process of data
collection as well as identify any issues in data availability and reliability.
In Gujarat, 12 pilot cities were selected, including one city under the GoI’s SLB Initiative. In Maharashtra,
18 pilot cities were chosen, including three cities under the SLB Initiative. Table 3.8 and Figure 3.3 provide
details. In both states, the data collection process involved field visits to municipal offices, interactions
with the chief officer and department heads, and also specific site visits to sources of water production,
slum settlements, etc. Moreover, in Maharashtra, the process included orientation and capacity building
workshops.
Table 3.8: Pilot Cities Selected in Figure 3.3: Pilot Cities
Gujarat and Maharashtra
Key lessons from pilot tests: The pilot studies helped to give an insight into the ground level situation of water supply and sanitation systems in different types of cities in terms of data availability, capture and
flow of information. Key findings identified from pilot studies are discussed below:
Class Gujarat Maharashtra
Municipal
corporation
1. Ahmedabad 1. Nagpur
2. Bhiwandi‐
Nizampur
2. Bhavnagar 3. Pimpri
Chinchwad
4. Nasik
5. Kolhapur
6. Nanded
Class A 3. Kalol 7. Bhusawal
4. Morbi 8. Barshi
9. Latur
10. Wardha
11. Yavatmal
12. Panvel
Class B 5. Bhuj 13. Baramati
6. Deesa 14. Shirpur‐Warwade 7. Upleta
Class C 8. Jasdan 15. Sawantwadi
9. Dhandhuka 16. Tuljapur
17. Satana
18. Mahabaleshwar
Class D 10. Chanasma
11. Dhrol
12. Kutiyana

53
Issues in data availability and information processing: In general, while ULBs seemed to gather a
large volume of data generated on routine operations, these were not always analysed and used
adequately to monitor system performance. This was compounded by the fact that many ULBs,
particularly the small ones, have very limited technical staff (often just one person) who manages
several functions in addition to water supply and sanitation. This suggests that identification of
processes by which WSS data is generated, analysed and monitored at ULB level is essential. Such
process mapping would help improve data availability and reliability, and its processing and use
at the local level. This has been already initiated under the PAS Project and further work is
planned after the first round of surveys is completed.
Pilot studies also helped to identify critical gaps in data availability or more often in information
processing, including for assets, relationship between households and connections, household
level sanitation facilities, water production and supply, wastewater collection and treatment, and
services in urban poor or slum settlements. In some aspects such as for monitoring of water
quality and consumer grievance redressal, while some data is available, the results indicate
possible problems with processes and proper reporting. Similarly, while data for ULB assets for
water supply, wastewater and solid waste management (SWM) are generally available, the WSS
department does not have ready access to this information in a meaningful way. More
importantly, records are not updated in terms of asset conditions, and proper maps with
utility/pipe networks are generally lacking. As a result, they are not used to develop systematic
maintenance plans. Similarly, while most ULBs do have basic information on the existence and
location of slum settlements, updated information on levels of quality of services is generally not
available. This again makes it difficult to make use of this information for developing city‐level
plans to provide universal access to services for the urban poor.
These gaps in information processing practices point to the need to develop a systematic
assessment of data reliability so that improvements can be planned and measured in subsequent
rounds.
Spatial organisation of information: A key issue in the organisation of information relates to
different spatial units identified for different operations. The electoral wards, water zones, solid
waste zones, administrative zones, etc, are often different; each department within the ULB
maintains the information for its respective boundaries. It was often difficult to reconcile these
boundaries and collate the information pertaining to each of these zones.
Participation of local institutions with data collection and assessment process: The pilot studies
also highlighted the need to involve local institutions such as local colleges, non‐governmental
organisations and state level associations in supporting data collection as well as regular updating,
monitoring and use especially for data related to services in slum areas. These efforts are planned
to be taken up after the first round of data collection is completed.
3.5 Stakeholder Consultations
A number of different consultations were carried out during the process of PMF development. The main
purpose during the development of the framework was to share initial development of the PMF tool with
both local and state level stakeholders. During the pilot testing stage, a number of meetings and
workshops were held in both the states for orientation and to familiarise participants with the need for
performance measurement and its use.

54
Initial meetings with government agencies: As a process of introducing the state governments to the
PAS Project, state‐level meetings were conducted both in Gujarat and Maharashtra. In Maharashtra, this
was with the Water and Sanitation Department and in Gujarat with the Urban Development Department.
Participation in these meetings was from various state‐level agencies as well as officials.
Apart from the general departmental meetings, specific meetings with other state level organisations in the
UWSS sector – such as with the Gujarat Water Supply and Sewerage Board, Gujarat Water Infrastructure
Limited, Gujarat Urban Development Mission and Directorate of Ministries – were conducted. The major
areas of findings were in terms of the resource availability at the state level, water pricing,
programmes/schemes for UWSS development, and reporting formats for various areas of UWSS.
Along with this, meetings were conducted with the City Managers’ Association of Gujarat to understand
the Gujarat Municipal Accounting Reforms Programme, the likely convergence of these data systems for
purposes of the PAS programme, and city level information that could be gathered.
Similar meetings were also held with a few agencies in Maharashtra including the Maharashtra Jal
Pradhkaran and Directorate of Municipalities. In addition, in Maharashtra, a State Cell has been set up
which provided inputs in the development of the PFM tool.
In addition to these state level meetings, the PAS Project was also part of the Steering Group set up by the
GoI for launching the pilot phase of the SLB Initiative. This has provided a good link with the GoI
initiative. The PAS performance measurement framework draws on the SLB Initiative.
State‐level stakeholders’ workshops: In each state, workshops were held to introduce the PAS Project,
and the need for such a system given the sector’s development. The preliminary performance framework
and associated questionnaire were discussed at these meetings. Based on the discussions and suggestions,
revisions to the framework and questionnaire were incorporated. To brief various state level organisations
and the chosen pilot cities about the PAS programme and need for such performance assessment,
workshops for the state‐level stakeholders, along with the pilot cities, were conducted in both the states.
Feedback from national resource persons: The preliminary designs were also shared with the PAS
Project’s Project Advisory Committee to get its feedback. After the pilot cities surveys in Gujarat and
Maharashtra, a special review meeting was held at the CEPT University on September 18, 2009, to discuss
the results and compare experiences. The external resource persons at this meeting included national
experts and representatives of leading national institutions such as National Institution of Urban Affairs,
Arghyam Foundation and Administrative Staff College of India, besides leading non‐governmental
organisations, individual consultants and academics.22
These consultations have been carried out throughout the process of developing and pilot testing the
performance measurement framework. They have contributed not only to brainstorming conceptual
issues, but also helped in creating awareness about the PAS Project. After the first round of surveys, the
results will again be shared with these stakeholders through meetings, workshops and the web portal
being set up for the PAS Project.
22 See Mehta and Mehta (2009) for a report based on this meeting.

55
References Accenture. 2007. “Reflections on Performance”. Netherlands: Vewin.
ADB (Asian Development Bank). n.d. Water Operations – Partnerships. Retrieved February 5, 2010, from
www.adb.org: http://www.adb.org/water/wop/wop‐improvement.asp
Agarwal, Pronita. 2008. “Designing an Effective Leakage Reduction and Management Program”. New
Delhi: Water and Sanitation Program.
Alegre, H., J.M. Baptista, E. Cabrera, F. Cubillo, P. Duarte, W. Hirner, W. Merkel, and R. Parena. 2006.
“Performance Indicators for Water Supply Services”. Manual of Best Practices, Second edition. London,
UK: IWA Publishing House.
Alvarinho, Manuel. 2007. “The Vision of CRA”. Maputo: Presentation at the Regulatory Conference,
Mimeo.
Association of State Drinking Water Administrators (ASDWA). n.d. “Revised Position Statement: Small
System Affordability”. Mimeo.
Baieti, Aldo, W. Kingdom, and M. Ginneken. 2006. “Characteristics of Well Performing Public Water
Utilities”. Water Supply and Sanitation Working Note No. 9, World Bank.
Bastrup, J. F. 2005. “Benchmarking in the Water Industry in Denmark”.
Beete, Nelson. 2007. “Evolution of the Water Utilities and Regulation”. Maputo: Presentation at the
Regulatory Conference, Mimeo. http://www.cra.org.mz/?target=evt_conf_papers
Beliappa, Saswati. 2009. “Urban Water Supply and Sanitation: Sector Status, Gujarat: Draft report”.
Brenner, W. 2005. “Indonesian Experiences in Water Utility Benchmarking”, South‐East Asia Water and
Waste Water Convention.
Brocklehurst, C., and J. Janssens. 2004. “Innovative Contracts, Sound Relationships, Urban Water Reform
in Senegal”. WB Water Sector Board Discussion Paper Series #1.
Carton, M., and A. Molinari. 2007. “Regulation Collaboration in the Americas: ADERASA”. Mimeo.
CEPT PAS Project. 2009. “Meeting Report of National Review Meeting of Experts for PAS Project”. CEPT
University, Mimeo.
Chanda, Osward. 2006. “Monitoring of Urban Water Utilities: The Experience of the Water Regulator in
Zambia”. Nairobi: Presentation at the International WSS‐SIMS workshop, Mimeo.
Cistac, Gilles. 2007. “Shared Regulation between CRA and Municipalities in the Water Supply Sector in
Mozambique”. Maputo: Presentation at the Regulatory Conference, Mimeo.
CMAG (City Managers Association of Gujarat). 2001. “Urban Indicators and Performance Measurement
Program: A Pilot of Ten Cities of Gujarat. City Sectoral Analysis and Graphs”. Mimeo.

56
CPHEEO (Central Public Health and Environmental Engineering Organisation). 1999a. “Manual for Water
Treatment: CPHEEO Guidelines”. MoUD.
________ 1999b. “Manual for Sewage and Sewerage treatment: CPHEEO Guidelines”. MoUD.
________ 1999c. “Manual for Operation and Maintenance: CPHEEO Guidelines”. MoUD.
CRISIL Advisory Services. 2007. “Benchmarking Urban Water and Sanitation – Phase II”. Report for the
Water and Sanitation Program, World Bank.
Dahasahasra, S. 2007. “A Model for Transforming an Intermittent into a 24*7 Water Supply System”.
Geospatial Today, August.
Drees‐Gross, Franz, Luis Andrade, and Beatriz Schippner. 2005. “Delegating Water and Sanitation Services
to Autonomous Operators: Lessons from Small Municipalities in Ecuador”. Water and Sanitation Program.
ESC (Essential Services Commission). 2004. “Performance Reporting Framework Metropolitan and
Regional Businesses”. Melbourne. ________ 2010. “Performance of Urban Water and Sewerage Businesses 2008‐09”. April, Melbourne.
Evans, Barbara. n.d. “International Benchmarking of Water and Sanitation Utilities: Position Paper on New
Indicators for Poverty”. Paper for the IBNET, World Bank, Mimeo.
Foley, Andrew.2005. “Benchmarking Asset Management”. Water Asset Management International, March,
22‐25.
Government of Gujarat. 2009. “Government Regulation No: NPE/112008/4363/R”. Ministry of Urban
Development and Urban Housing, Secretariat, Gandhinagar. Dated: 01/06/2009.
Government of India. 2010. “Report of the Thirteenth Finance Commission”. Ministry of Finance.
Government of Maharashtra. 2008. “Maharashtra State Golden Jubilee Year 2010–11 Sujal and Nirmal
Abhiyan. Implementation of revised Financial Pattern for Demand Driven and Reform oriented Urban
Water Supply and Sewerage Programme”. GR No./Napapu‐2008/CR No.1/WS ‐22.
Jacobs Engineering India. 2007. “Water Distribution 24*7”. Presentation at the CEPT University, Mimeo.
JMP (Joint Monitoring Programme for Water Supply and Sanitation). 2008. “Progress on Drinking Water
and Sanitation: Special Focus on Sanitation”. New York: UNICEF, and Geneva: WHO.
Kingdom, Bill, Roland Liemberger, and Philippe Marin. 2006. “The Challenge of Reducing Non‐Revenue
Water (NRW) in Developing Countries. How the Private Sector Can Help: A look at Performance Based
Contracting” Water Supply and Sanitation Sector Board Discussion Paper Series, Paper No. 8.
Kingdom, Bill, and S. Gordon‐Walker. 2004. “IBNET: International Benchmarking Network”. Brussels:
Presentation at the Workshop on IBNET, Mimeo.
Kingu, Elizabeth, and Dirk Schaefer. 2008. “Performance Monitoring and Benchmarking for Urban Water
Supply and Sanitation in Tanzania”. Water Utility Management International, June (3:2), 20‐23.

57
International Water Association. 2006. Building Water Operators Partnerships.
Lambert, Alan. n.d. “Assessing Non‐Revenue water and Its Components: A Practical Approach”. IWA
Water Loss Task Force. Water 21: Article No. 2.
Marinho, N. 2008. “The Evolution of Monitoring in the Water Supply, Sewerage and Solid Waste Sectors in
Brazil. Water Utility Management International” IWA Publishing, 3 (2), 14‐16.
Mbilima, C. K. 2008. “Water Supply and Sanitation in Zambia: Reform and Regulation”. Proceedings of the
Institution of Civil Engineers, 161 (4), 255‐261.
Mehta, Meera. 2008. “Assessing Microfinance for Water and Sanitation: Exploring Opportunities for
Sustainable Scaling Up”. Report for the Bill and Melinda Gates Foundation, Mimeo.
Mehta, Meera, and Dinesh Mehta. 2009. “Performance Assessment Systems for Urban Water Supply and
Sanitation National Review Meeting of Experts, PAS Project: Presentations and Discussions,” Mimeo.
Mehta, Meera, Rachel Cardone, and Thomas Fugeslnes. 2007. “How Can Reforming Water Utilities Tap
Local Capital Markets?”. Africa: Water and Sanitation Program.
Mix. 2007. “Microbanking Bulletin: 2007 Benchmarks,” Spreadsheet results.
MoLG (Ministry of Local Government). 2005. “Assessment Manual of Minimum Conditions and
Performance Measures for Local Governments” PIP Annex XVII. Republic of Uganda.
MoUD (Ministry of Urban Development). 2005. “Jawaharlal Nehru National Urban Renewal Mission:
Overview”.
________ . 2005. “Checklist for the Urban Reforms Agenda under JNNURM”. Mimeo.
________. 2009. “Handbook on Service Level Benchmarks”. Government of India.
MoUD (Ministry of Urban Development) and ADB (Asian Development Bank). 2007. “2007 Benchmarking
and Data Book on Water Utilities in India”.
Mugisha, Silver, Sanford V. Berg, and Gaddi Ngirane Katashaya. 2004. “Short Term Initiatives to Improve
Water Utility Performance in Uganda: The Case of National Water Supply and Sewerage Corporation”.
National Institute of Urban Affairs (NIUA). 2005. “Status of Water Supply, Sanitation and Solid Waste
Management in Urban Areas”. Report for the CPHEEO and MOUD, Government of India.
North European Benchmarking Cooperation (NEBC). 2008. “International Benchmark – Project
Overview”.
NWASCO (National Water and Sanitation Council). 2008. “Performance management for water supply
services”. Communication, Mimeo.
OFWAT (Office of Water Services). 2008. “International Comparison of Water and Sewerage Service 2008
Report”. OFWAT.

58
_______ 2009. “Service Incentive Mechanism – A Consultation on Moving Forward from the Overall
Performance Assessment”. Mimeo.
Parena, R., E. Smeets, and I. Troquet. 2002. “Process Benchmarking in the Water Industry”. IWA.
Regional Administration and Local Government (RALG). 2006. “Local Government Capital Development
Grant System: Manual for the Assessment of Councils against Minimum Access Conditions and
Performance Measurement Criteria”. United Republic of Tanzania.
Remane, Alia, and David Shellshear. 2007. “Service Quality Monitoring: Promoting Efficiency of
Operations”. Maputo: Presentation at the Regulatory Conference, Mimeo.
Satara NP (Nagar Parishad). 2009. “Annual Inspection Report: 2008‐09”. Mimeo.
Sharifian, Jabiz. 2002. “Benchmarking the Urban Water Sector: Vietnam”. Report for the World Bank,
Mimeo.
Shellshear, D. 2007. “Service Quality Monitoring – Promoting Efficiency of Operations” Retrieved from
Water Regulatory Council of Mozambique’s website.
TERI (Tata Energy and Resources Institute). 2002. “Urban Services Environmental Rating System”.
Ministry of Environment and Forests, Government of India and UNDP.
Tremolet, S. 2005.”Case Study on Senegal’s Water and Sanitation Sector Economic Regulation”. Report by
Castalia for the World Bank.
UHRC (Urban Health Resource Centre). 2008. “Key Indicators for Urban Poor in India from NFHS‐3 and
NFHS‐2”. Mimeo.
Van der Berg, Caroline, and Alexander Danilenko. 2008. “IBNET – A Global Database of the Water Sector’s
Performance”. Water Utility management International, June, 3:2, 8‐11.
Water and Sanitation Program. 2005. “Philippines – Small Towns Water Utilities Data Book”. Partnership
between Government of Philippines, WSP and Government of Australia.
WSSD (Water Supply and Sanitation Department). 2002. “Sant Gadge Baba Urban Sanitation Campaign”.
Government of Maharashtra, Mimeo.
Water Research Commission. 2004. “The Development and Upgrading the SAAWU Benchmarking Project.
The Benchmark (2)”. Mimeo.
World Bank. 2005. “Philippines: Meeting Infrastructure Challenges”. World Bank.
_________ 2006. “Project Paper on a Proposed Additional Financing for Local Government Support
Project”. World Bank.

59
Annexure: Tables
Table A1: Indicator Sets used in IBNET, IWA and ADB Utility Data Book
IBNET IWA ADB (Utility Data
Books)
Access and
coverage
Household connections and
population served
Resident population covered
by service connections
Household connections
and population served
Service levels
and quality
Quantity, continuity and quality of
service
‘Physical’ indicators such as
quantity, continuity and
quality of service
Production and
consumption
Financial
sustainability
Operating ratios Capital and investment
costs, operating ratios
Operating ratio
Efficiency in
service
operations
NRW estimations, tariff and user
charge levied, staffing and
customer satisfaction
‘Operational’ indicators of
NRW estimations, tariff and
user charge levied, staffing
and customer satisfaction
UFW, staffing and
collection efficiency
Equity in
service
delivery
Population with access to water
through public standposts
Monthly water bill for a household
consuming 6 m3 of water through a
household or shared yard tap
Table A2: Comparative Information on Key Indicators: ADB and WSP Utility Benchmarking (2007)
Category
Indicators
Bangalore Chandigarh Chennai Indore Jamshedpur Rajkot
ADB WSP ADB WSP ADB WSP ADB WSP ADB WSP ADB WSP
Service coverage and operational performance
1. Coverage Population covered (%) 93 91 100 100 89 98 77 54 74 79 98 98
2. Water
balance
Water production (lpcd) 185 143 332 290 131 108 108 102 808 608 146 126
% Metered connections 95.5 90 79.0 71 3.5 4 0.1 0.0 0.9 1 0.4 0.4
Unaccounted for water
(%)
45 40 39 18 17 16 n.d. 20 13 9 23 11
3. Service
levels and
quality
Water consumption
(lpcd)
74 85 147 239 87 95 87 81 203 554 101 112
Water availability
(hours/day)
4.5 2.5 12.0 12.0 5.0 3.0 0.8 0.8 6.0 6.0 0.3 0.3
Financial performance
4. Cost
efficiency
and staff
productivity
Cost/Kl of water
production
10.1 11.1 3.9 4.6 6.1 34.7 13.2 12.8 2.4 3.4 2.8 10.2
Power cost/operating
cost (%)
65 n.a. 60 63 33 8 57 74 57 40 28 27
Staff/1,000 connections 5.2 3.3 8.6 10.7 13.3 12.6 18.7 8.8 5.6 6.9 1.1 1.1
5. Cost
recovery
and tariffs
Non‐revenue water (%) 49 25 16 50 9 12
Collection performance
(%)
112 57 94 100 152 37 89 n.a. 100 n.a. 45 0
Operating ratio 0.8 1.0 1.4 1.3 0.4 1.4 5.3 5.5 0.6 0.9 1.6 6.6
Sources: Based on information from CRISIL (2007) and Ministry of Urban Development and Asian Development Bank (2007).

60
Table A3: Indicators used in Performance‐Linked Funding Programmes JNNURM SNMA
Water supply
Coverage Population covered by piped water supply,
number of household level water connections
Service levels and
quality
Quantity of water supplied and per capita supply,
with hours of water supplied in a day
Hours of water supplied in a day
Financial
sustainability
O&M cost recovery and unit cost for water
produced
Expenditure towards O&M and depreciation
Equity in service
delivery
Per capita supply of water and continuity of
supply
Provision of access to water supply
Efficiency in service
operation
Quantity of NRW, along with number of
connections that are metered; consumer redressal
systems
Introduction of consumer metering system and
consumer redressal systems
Sanitation and wastewater
Coverage Households with individual toilets/low cost
sanitation units, along with population covered by
sewerage network
Connecting public and individual toilets to the
sewerage network
Service levels and
quality
Quantity of sewage treated and means of disposal
Financial
sustainability
O&M cost recovery and unit cost for wastewater
Equity in service
delivery
Access to sanitation in slums
Efficiency in service
operation
Consumer redressal systems Introduction of user charges and consumer
redressal systems
Municipal solid waste management
Coverage Primary collection of waste in cities Primary collection of waste in a segregated
manner: compulsory reform
Service levels and
quality
Source segregation and waste treated Source segregation, treatment of waste and
scientific disposal of waste
Financial
sustainability
O&M cost recovery and unit cost for SWM
operations
Equity in service
delivery
Efficiency in service
operation
Consumer redressal systems Introduction of user charges and consumer
redressal systems
Sources: JNNURM: MoUD (2005), SNMA: Government of Maharashtra (2008).
Table A4: Performance Information in Municipal Awards in Gujarat and Maharashtra Municipal Awards of GoG SGBA
Water supply
Coverage Improve/increase water supply scheme:
compulsory reform
Service levels and quality Quantity of water supplied Water availability and quality of water
supplied: compulsory reform
Financial sustainability Expenditure incurred (<50%) against
revenue earned
Water tax improvement: compulsory reform
Equity in service delivery Increase in water supply and distribution
network within slums
Provision to special classes during water
scarcity/shortage: compulsory reform
Efficiency in service operation Collection efficiency (>90%), along with
the cost of electricity for water produced
Consumer satisfaction reports: compulsory
reform
Sanitation and wastewater
Coverage Toilet management
Service levels and quality Collection efficiency of wastewater Adequacy of treatment capacity: compulsory
reform
Financial sustainability Expenditure incurred (<50%) against
revenue earned
Financial management
Equity in service delivery Increase in wastewater network within
slums
Provision of access to toilets in slums:
compulsory reform

61
Efficiency in service operation Collection efficiency (>90%) is monitored. Effective wastewater disposal systems.
Consumer satisfaction reports: compulsory
reform
Municipal solid waste management
Coverage Primary collection of municipal waste
Service levels and quality Segregation at source Treatment of waste and scientific disposal:
compulsory reforms
Financial sustainability Expenditure incurred (<50%) against
revenue earned
Equity in service delivery
Efficiency in service operation Collection efficiency (>90%) is monitored Consumer satisfaction reports: compulsory
reform
Sources: Municipal Awards: GoG (2009), SGBA: Government Resolution No./NSA2007/C.R.64/WS‐21, dated 26/10/2007.
Table A5: Performance Information in Regular State Monitoring in Gujarat and Maharashtra
Monitoring under NG/SG Monitoring By DMA in Maharashtra
Water supply
Coverage No. of residential, non‐residential and public
connections
Service levels and
quality
Per capita water supplied (100 lpcd) and
quality of water supplied (100%)
Per capita water supplied and quality of water
supplied
Financial
sustainability
Reporting of various taxes collected Reporting of various taxes collected
Equity in service
delivery
Reporting of slum settlements and in‐situ
schemes implementation
Reporting on budget allocation and expenditure
related to water supply in slums
Efficiency in service
operation
Staff management and e‐governance: key goals Reporting on illegal connections and actions taken
to regularise them
Sanitation and wastewater
Coverage Monitoring of sanitation facilities and
underground sewerage system
No. of individual and public toilets; population
served by sewerage network
Service levels and
quality
Staff management and e‐governance: key goals
Financial
sustainability
Reporting of various taxes collected Reporting of various taxes collected
Equity in service
delivery
Reporting of slum settlements and in‐situ
schemes.
Reporting on budget allocation and expenditure
related to toilets in slums
Efficiency in service
operation
Staff management and e‐governance: key goals
Municipal solid waste management
Coverage Primary collection for residential and
commercial properties
Primary collection for residential and non
residential properties; reporting on primary
collection for special waste
Service levels and
quality
Scientific disposal of waste Disposal of waste
Financial
sustainability
Reporting of various taxes collected Income and expenditure related to cleaning
Equity in service
delivery
Reporting of slum settlements and in‐situ
schemes
Efficiency in service
operation
Staff management and e‐governance: key goals
Sources: NG/SG: Based on details given by urban local bodies during field work in Gujarat; DMA: Satara NP (2009).
Table A6. Performance Improvement Measures for SNMA Reform
1. Water supply management
1 Identification and authorisation of unauthorised connections
2 100% billing and recovery system (PSP)
3 Programme of water audit, energy audit and rehabilitation
4 Private sector participation in overall O&M
5 To increase the water supply hours

62
6 To cover the complete expenditure towards O&M and depreciation
7 Consumer metering
8 Incentives to pay arrears towards water bills, ‘New Revised Nirbhay Yojana‘
9 100% consumer redressal
10 Urban bye‐laws for rain water harvesting and related incentives
2. Toilet management
1 Survey of the individual and public toilets in the city and necessary provision in annual budget
2 Repair and construct public toilets in city and slums (specific reference to gender sensitivity)
3 Private sector participation (BOT/BOO) or NGO for the efficient O&M of the public toilets in the city
4 Connect the public and individual toilets to sewerage system in the city
5 To abandon open defecation
3. Wastewater and sewerage
1 To connect the properties with sewerage system
2 Reuse of water (decentralised process on wastewater and other advanced technologies)
3 To levy user charges
4 Check quality of treated wastewater
4. Solid waste management
1 Segregation at source
2 Door to door collection of segregated waste, ‘Ghantagadi system’
3 Treatment plant (centralised and decentralised using appropriate technology and private sector
participation)
4 Separate collection of waste from vegetable and mutton market, hotels
5 Levy user charges
6 Sanitary landfill facility
Sources: SNMA: Government of Maharashtra (2008).
Table A7. Performance Indicators for Sant Gadge Baba Awards (SGBA) COMPULSARY REFORMS
1. Water supply and management
1. Water availability as per norms (lpcd)
2 Attempts to improve/increase water supply schemes
3 Quality of supplied water (annually)
4 Water supply audit and improvements
5 Water tax improvement
6 Provision during water shortage/scarcity, supply to special classes
7 Consumer satisfaction report
2. Wastewater management
1 Wastewater treatment capacity
2 Expenditure and recovery
3 Financial management
4 Consumer satisfaction report
3. Sanitation (toilet) management (individual, public, toilets)
1 Public places/toilet facility for floating population
2 Toilet facilities in slums, residential area, public/administrative buildings, schools (gender and age
sensitivity)
3 Innovative models adopted for construction of toilets
4 Consumer satisfaction report
5 Information, education and communication for defecation free city, public health, IEC
4. Solid waste management
1 Implementation of central government’s MSW Rules, 2000
2 Effectiveness and implementation of ban on plastic use and penalising actions
3 Improvements/innovations in solid waste management
4 Consumer satisfaction report

63
OPTIONAL REFORMS
1 Implementation of urban facilities, surroundings, betterment of roads, beautification and development
2 Encroachment removal, prevention of unauthorised construction
3 Education, social facilities, mother‐child welfare
4 Human resources, financial management and good governance
5 Financial progress, employment, poverty alleviation
Source: Government of Maharashtra – Government Resolution No./NSA2007/C.R.64/WS‐21,dated 26/10/2007.
Table A8: Department‐wise Data Requirements for ULBs in Gujarat
I. Water Works Department
1. Asset registration and regular maintenance
2. Water production and supply
3. Water quality surveillance
II. Drainage Department
4. Asset registration and regular maintenance
5. Sewage treatment and disposal
6. Sewage treatment effluent quality surveillance
III. SWM Department
7. Asset registration and regular maintenance
8. SWM treatment and disposal
IV. Finance and Taxation
9. Water/drainage connections records, preparation of bills and cost recovery, tariff schedule
10. Finance‐Budget allocation and expenditure
V. UCD/SLUM Cell
11. Slum population and other services related data.
VI. General Administration
12. Staffing and management
13. Boundaries and demography
VII. Public Relations Department
14. Consumer grievance and complaint recording system
Table A9: UWSS Information in Reports for Routine and Programme Monitoring in Gujarat Report
no.
Department of Urban Development Frequency
Water
9 Drinking water source and chlorination details Monthly
10 Drinking water chlorination and testing Monthly
11 Details of active leakages Monthly
14 Details of school tours organised at water works every Saturday Monthly
24 Details of drinking water facilities in government primary schools Monthly
Sanitation
1 Pay and use toilet Quarterly
1A Details of completed pay and use toilets Quarterly
2 Details of individual toilet programme Quarterly
23 Information regarding toilet facilities available in government primary schools Monthly
Solid waste management
3A Door to door collection details (for domestic properties) Monthly
3B Door to door collection details (for commercial properties) Monthly
4 Sanitation Tax‐related information Annually
8 Information related to street sweeper motivation programmes Annually
15 Information related to cleaning of schools Monthly
16 Information related to cleaning of vegetable markets Monthly
5 Information related to door to door collection of solid waste and its transportation Monthly

64
6 Information related to transportation of solid waste Monthly
Finance
26 Total Tax Collection Statement (Including Education Cess) Annually
27 Heading‐wise Tax Collection Statement Annually
27A Details of reforms for Tax Collection Annually
35 Details of double entry accounting system implementation (GMARP) Quarterly
36 Details of other audits done by ULBs Annually
39 ULB Budget details Annually
40 Details of the proposals for the revision of existing taxes and charges Annually
45 Income and Expenditure Statement Annually
46 Grouping of the Schedules to Balance Sheet Annually
47 Information related to Professional Tax (category‐wise) Annually
Reports received by Gujarat Municipal Finance Board (GMFB)
Finance
1 Statement of Total Income Annually
2 Statement of Total Expenditure Annually
3 Details of Property Tax Billing and Collection Annually
5A Details of Revenue Grant Annually
5B Details of Capital Grant Annually
7 Information related to wages of sweepers Quarterly
8 Information related to details of salary of municipal staff Quarterly
9 Information related to various taxes levied by the municipality Annually
10 Information related to status of collection various taxes Annually
11 Information related to total tax collection (including Education Cess) Annually
12 Information related to implementation of Area Base Property Tax System Annually
13 Information related to comparative information regarding Area Base Property Tax Annually
Source: Based on details given by urban local bodies during field work in Gujarat.

65
Table A10: Details of UWSS Information in Revised Reporting Formats Report
no. Department of Urban Development (UDD – Central Data Management Cell) Frequency
Water
1‐A Planning drinking water Monthly
1‐B Approved projects under UIDSSMT Quarterly
1‐C Progress under Amritdhara and 12th FC Quarterly
Sanitation
1 Underground drainage Annually
3‐A Pay and use toilets’ progress report Quarterly
3‐B Pay and use toilets’ NGO‐wise details Quarterly
3‐C Pay and use toilets’ NGO‐wise status Quarterly
3‐D Progress report under Nirmal Shauchalya Yojana Quarterly
3‐E Pay and use toilets – physical and financial planning Quarterly
3‐F Individual toilets – physical and financial planning Quarterly
Solid waste management
4‐A SWM door to door collection Monthly
3B SWM vermin‐compost details Monthly
Finance
7‐A Demand of tax – current year Annually
7‐B Tax recovery Annually
7‐C Professional tax Annually
7‐D Maintenance exp. Quarterly
7‐E Establishment exp. details Annually
9 Financial management Annually
Slums
5‐A Slum areas – infrastructure facilities Quarterly
5‐B Slum areas – construction of new houses Quarterly
6‐A Umeed – centres Monthly
6‐B Umeed – for municipalities where there are no Umeed centres Monthly
Governance
8 E‐governance Quarterly
11‐A Establishment details of municipalities Annually
Source: From the Urban Development Department, Government of Gujarat website:
http://udd.gujarat.gov.in/Default_files/VCPatrakwise.htm, Retrieved May 18, 2010; and details of frequency as given by urban
local bodies during field work in Gujarat.

66
Table A11: Reports Used by State Agencies for Monitoring in Maharashtra Report
no.
Directorate of Municipal Administration (DMA)
Water Supply
22 A Water connections and their rates
22 B Checking of water samples in public health laboratory
22 C Water supply expenditure
23 Information of water supply schemes
Sanitation
62 Information on wastewater systems like type of system, toilet connections, and tax levied
SWM
63 A Sources of waste, collection and transportation
64 Details of street sweeping
Finance
14 & 46 Information related to income and ward wise expenditure on cleaning for past five years
65 Information related to expenditure on infrastructure in urban sector for past five years
Slums
42 Information related to demographics, tenure, budget allocation and expenditure related to water
supply and sanitation.
Source: Based on formats in Annual Inspection Reports prepared ULBs for routine monitoring. See for example Satara NP (2009).

P
U
V
C
M
Perfor
Urban
Volume
CEPT Uni
May 2010
rman
n Wate
e II: Li
iversity
0
ce Me
er an
ist of In
easur
d San
ndicat
emen
nitatio
tors an
nt Fra
on
nd Reli
mewo
iability
ork fo
y Asse
or
essmennt

PERFORMANCE MEASUREMENT FRAMEWORK FOR
URBAN WATER AND SANITATION
VOLUME II: LIST OF INDICATORS AND
RELIABILITY ASSESSMENT
CEPT University
May 2010

1
CONTENTS
Introduction 2
Abbreviations 3
1. Key Performance Indicators 4
1.1 Summary List of Indicators 4
1.2 Definition and Description of Key Indicators 5
Water Supply 5
Wastewater 7
Solid Waste Management 9
2. Reliability Assessments of Key Indicators 11
2.1 Water Supply 11
2.2 Wastewater 17
2.3 Solid Waste Management 23
3. Local Action Indicators 29 3.1 Summary List of Indicators 29
3.2 Definition and Description of Local Indicators 32
Water Supply 32
Wastewater 36
Solid Waste Management 38
Annexure: Performance Assessment System Questionnaire 39

2
Introduction
Over the past many years, a significant number of Indians, especially the poor, have had to rely on
unsafe sources of water supply and suffer inadequate water and sanitation services. Very little is
known about the quantity of water made available to people, non‐revenue water, quality of water and
coverage of poor households. A key challenge in the sector in India is the lack of adequate and
reliable information. For new investments in water and sanitation to be effective, it is important to
assess the performance of the existing system, as well as ensure its sustainability and reach for the
poor and unserved.
It is in response to this situation that the Centre for Environmental Planning and Technology (CEPT)
University is implementing the Performance Assessment System (PAS) Project, which is funded by
the Bill and Melinda Gates Foundation. Its overarching aim is to develop performance assessment
systems for urban water supply and sanitation at local and state levels.
This report is an accompanying publication to Volume I of ‘Performance Measurement for Urban
Water Supply and Sanitation’. Volume I dealt with approach and framework. This volume presents
descriptions and definitions of the key performance indicators (KPI) for water supply, wastewater
and solid waste management. Reliability assessment for each KPI is also explained. The report also
includes descriptions and definitions for more detailed local action indicators.
The annexure to this Volume further has the Performance Assessment System (PAS) questionnaire
that would be used for data collection and generation of key and local action indicators. The
questionnaire covers aspects related to general demographics, water supply, wastewater, municipal
solid waste management, information on slums, finance, etc. The questionnaire is essentially an excel
workbook with validation checks in‐built into it as well as automatic generation of the key
performance and local action indicators. It is developed to handle both quantitative and qualitative
datasets related to the various areas mentioned above. The qualitative datasets are essential to assess
and generate the reliability of the quantitative datasets. The reliability grades are calculated based on
the band description as listed in this report.

3
Abbreviations
BOD Biochemical oxygen demand
CBO Community‐based organisation
COD Chemical oxygen demand
CPHEEO Central Public Health and Environmental Engineering Organisation
cu m cubic metre
DCB Demand Collection Balance
ESR Elevated service reservoir
GIS Geographic information systems
Ha Hectare
HH Household
ILI Infrastructure Leakage Index
Kl Kilolitres
km Kilometre
KPI Key performance indicator
m metre
m3 metre cubed
MSW Municipal solid waste
NGO Non‐governmental organisation
no. Number
NRW Non‐revenue water
O&M Operation and maintenance
PAS Performance Assessment System
QN Question number
RC Residual chlorine
Rs Rupees
STP Sewage treatment plant
SWM Solid waste management
TDS Total dissolved salts
UARL Unavoidable Annual Real Losses
ULB Urban local body
WDS Water distribution station
WTP Water treatment plant

4
1. Key Performance Indicators
The PAS Performance Measurement Framework has outlined service goals and reform actions under
the broad categories of access and coverage, service levels and quality and financial sustainability.
1.1 Summary of Key Indicators for Goals for Water, Wastewater and SWM Water supply Wastewater Solid waste management
(SWM)
Indicators for goals
Access and
coverage
1. Coverage of water
supply connections at
household level
1. Coverage of households with
access to individual toilets
1. Household level coverage
of SWM services
2. Coverage of households with
individual connections to
sewerage network
Service levels
and quality
2. Per capita supply of
water
3. Collection efficiency of
wastewater network
2. Efficiency of collection of
municipal solid waste
3. Continuity of water
supply
4. Sewage treatment capacity 3. Extent of segregation of
municipal solid waste
4. Quality of water
supplied
4. Extent of municipal solid
waste processed and
recycled
Financial
management
5. Extent of cost
recovery (O&M) in
water supply services
5. Extent of cost recovery (O&M)
in wastewater management
5. Extent of cost recovery
(O&M) in SWM services
Indicators for reform actions
Efficiency in
service operation
6. Extent of non‐
revenue water
6. Quality of wastewater treatment 6. Extent of scientific
disposal of municipal solid
waste
7. Extent of reuse and recycling of
wastewater
7. Efficiency in
redressal of customer
complaints
8. Efficiency in redressal of
customer complaints
7. Efficiency in redressal of
customer complaints
8. Extent of functional
metering of water
connections
9. Efficiency in
collection of water
supply‐related charges
9. Efficiency in collection of
sewerage‐related charges
8. Efficiency in collection of
SWM‐related user charges
Equity 10. Spatial variations
in coverage of water
supply connections
10. Spatial variations in coverage
of households with access to
individual toilets
9. Spatial variations in
household level coverage of
SWM services
11. Spatial variations
in per capita water
supply
11. Spatial variations in coverage
of household connections to
sewerage network
12. Coverage of water
supply connections in
slum settlements
12. Coverage of toilets in slum
settlements
10. Household level
coverage of SWM services in
slum settlements 13. Coverage of household
connections to sewerage network
in slum settlements

5
1.2 Definition and Description of Key Indicators
Water Supply
Water supply Unit Description
Access and coverage
1. Coverage of water
supply connections
% The indicator captures the extent of the household/individual water supply
connections in the ULB. It is an important factor to measure the extent of service
delivery of the ULB.
Total households connected to the water supply network with a private (not shared)
service connection, as percentage of total households in the ULB
Service levels and quality
2. Per capita supply of
water
lpcd This indicator captures the quantity of treated water that is supplied to the
consumer daily. It is the aggregate of all sources of water from which the ULB
supplies water. This quantum of water is to include only treated water that goes
into the distribution system.
Total treated water supplied per day into the distribution system expressed by population
served
3. Continuity of water
supply
Hours This indicator captures the number of hours of supply at the consumers’ end.
This indicator coupled with the per capita supply of water denotes a key aspect
of the service delivery of the ULB.
Continuity of supply is measured as: Average number of hours of pressurised water
supply per day
4. Quality of water
supplied
% This indicator captures the extent of samples for residual chlorine and
bacteriological tests, and fluoride and TDS tests for surface and ground water
sources, that have passed (at treatment plant and consumer end) as per the
standards.
Percentage of water samples that meet or exceed the specified potable water standards and
sampling regime, at treatment plant outlet and consumer points as defined by the
CPHEEO
Financial management
5. Cost recovery
(O&M) in water
supply services
% This indicator captures the revenues (taxes, user charges, fees) recovered by the
ULB against the expenses incurred. This denotes the cost control measures, if
any, that need to be considered by the ULB, and also a critical factor in tariff
charges.
Percentage of total operating revenues from water supply‐related charges to total
operating expenses on water supply
Efficiency in service operations
6. Extent of non‐
revenue water
% This indicator captures the quantum of water losses occurring through physical
losses, unauthorised consumption, and authorised but unbilled consumption. It
indicates the extent of revenue losses incurred by the ULB.
Difference between total water produced (ex‐treatment plant) and total water sold
expressed as a percentage of total water produced. NRW includes: (a) consumption which
is authorised but not billed, such as public standposts; (b) apparent losses such as illegal
water connections, water theft and metering inaccuracies; (c) real losses which are
leakages in the transmission and distribution networks
7. Efficiency in
redressal of customer
complaints
% This indicator captures the number of complaints made by consumers that have
been redressed by the ULB, as per service charter standards. It is an important
indicator and a direct assessment of customer satisfaction levels.
Total number of water supply‐related complaints redressed within time as stipulated in
service charter of the ULB, as a percentage of the total number of water supply‐related
complaints received in the year

6
Water supply Unit Description
Efficiency in service operations
8. Extent of functional
metering of water
connections
% This indicator captures the extent to which the connections that are metered and
functional. Functional metering of connections is an important aspect in
understanding the accuracy of consumption quantities in each city.
Total number of functional metered water connections expressed as a percentage of total
number of water supply connections (including public standpost connections)
9. Efficiency in
collection of water
supply‐related charges
% This indicator captures the extent of collection of revenues that are billed by the
ULB. It denotes the revenues that are due to the ULB, and hence an important
factor in its cost recovery efforts.
Percentage of current year revenues collected from water supply related taxes and
charges as a percentage of total billed amounts (for water supply)
Equity
10. Coverage of water
supply connections in
slum settlements
% This indicator captures the number of individual water connections that are
provided by the ULB in slum settlements. This assesses the level of service
delivery to the urban poor.
Total households in slum settlements connected to water supply network with a private
(not shared) service connection, as percentage of total households in all slum settlements
in the ULB
11. Spatial variations
in coverage of water
supply connections
CV This indicator captures the variations in coverage of connections across wards
within an ULB. Spatial variation with a value ‘0’ implies there are no variations
in coverage across the wards in the city.
Coefficient of variation (defined as standard deviation divided by mean) of zonal values
for “total households connected to the water supply network with a private (not shared)
service connection, as percentage of total households” (indicator 1 above)
12. Spatial variations
in per capita water
CV This indicator captures the variations in per capita supply across wards within
an ULB. Spatial variation with a value ‘0’ implies there are no variations in per
capita supply across the wards/zones in the city.
Coefficient of variation (defined as standard deviation divided by mean) of zonal values
for “Total treated water supplied into the distribution system expressed by population
served per days of water supplied” (indicator 2 above)

7
Wastewater
Wastewater Unit Description
Access and coverage
1.Coverage of
households with
access to individual
toilets
% This indicator captures the number of households with access to individual
toilets. It is an important indicator that assesses the level of sanitation services in
the city.
Total number of households with access to individual toilets as a percentage of total
number of households in the city.
2. Coverage of
households with
individual
connections to
sewerage network
% This indicator captures the extent of coverage in terms of individual sewerage
connections for each household. This indicator is significant in estimating the
level of sanitation services in the city.
Total number of households with individual connections to sewerage network as a
percentage of total number of households in the city.
Service levels and quality
3. Collection efficiency
of sewerage network
% This indicator captures the quantity of wastewater that is collected at the
treatment plant for treatment. This is an important indicator to understand the
efficiency of the network in collecting and conveying the wastewater to the
treatment plant.
Quantum of wastewater collected at the intake of the treatment plant to the quantity of
wastewater generated (as per CPHEEO, 80% of water consumed is wastewater
generated)
4. Sewage treatment
capacity
% This indicator captures the adequacy of treatment plants to treat wastewater
collected to secondary treatment standards. This is important to measure as in
most cities where treatment plant exists, it is not functional.
Quantum of wastewater treated to secondary treatment standards (removal of BOD and
COD) as a percentage of normative wastewater generated.
Financial management
5. Cost recovery
(O&M) in wastewater
management
% This indicator captures the revenues (taxes, user charges, fees) recovered by the
ULB against the expenses incurred. This denotes the cost control measures, if
any, that need to be considered by the ULB, and also a critical factor in tariff
charges.
Percentage of total operating revenues from sewerage related charges to total operating
expenses on sewerage network services
Efficiency in service operations
6. Quality of
wastewater treatment
% This indicator captures the quality of wastewater that is released into the
environment after treatment. This is important to monitor as it assesses if the
wastewater has been adequately treated before being released.
Total number of wastewater samples (BOD and COD) that have passed to number of
wastewater samples conducted, at the outlet of the treatment plant
7. Extent of reuse and
recycling of
wastewater
% This indicator captures the quantity of wastewater that is reused after treatment
for purposes like irrigation, gardening, etc. This is an important indicator as it
helps to assess the efficient use of the available water resources.
Quantity of wastewater that is recycled or reused as a percentage of quantity of
wastewater received at the treatment plant.
8. Efficiency in
redressal of customer
complaints
% This indicator captures the number of complaints made by consumers that have
been redressed by the ULB, as per service charter standards. It is an important
indicator which directly assesses the consumer satisfaction level.
Total number of wastewater‐related complaints redressed within time as
stipulated in service charter of the ULB, as a percentage of the total number of
wastewater‐related complaints received in the year

8
Wastewater Unit Description
Efficiency in service operations
9. Efficiency in
collection of sewerage
related charges
% This indicator captures the extent of collection of revenues that are billed by the
ULB. It denotes the revenues that are due to the ULB, and hence an important
factor in its cost recovery efforts.
Percentage of current year revenues collected from wastewater‐related taxes and charges
as a percentage of total billed amounts (for wastewater)
Equity
10. Spatial variations
in coverage of
households with
access to individual
toilets
CV This indicator captures the variations in coverage of sewerage connections
across wards within a city. Spatial variation with a value ‘0’ implies there are no
variations in coverage across the wards in the city.
Coefficient of variation (defined as standard deviation divided by mean) of zonal values
for “total households connected to the sewerage network, as percentage of total
households” (indicator 1 above)
11. Spatial variations
in coverage of
household
connections to
sewerage network
CV This indicator captures the variations in coverage of toilets across wards within
a city. Spatial variation with a value ‘0’ implies there are no variations in
coverage across the wards in the city.
Coefficient of variation (defined as standard deviation divided by mean) of zonal values
for “total households with individual toilets, as percentage of total households”
(indicator 1 above)
12. Coverage of
household
connections to
sewerage network in
slum settlements
% This indicator captures the extent of sewerage network connections in the slum
settlements. This is relevant to measure as it gives the level of services that are
provided to the urban poor.
Total number of slum households connected to sewerage network as a percentage of total
number of slum households
13. Coverage of
individual toilets in
slum settlements
% This indicator captures the number of individual toilets that are provided in
slum settlements. This is relevant to measure as it gives the level of services that
are provided to the urban poor.
Total number of slum households with individual toilets as a percentage of total number
of slum households

9
Solid waste management
SWM Unit Description
Access and coverage
1.Household level
coverage of SWM
services
% This indicator captures the door‐to‐door collection of municipal solid waste
(MSW). This is relevant as it forms a major part in the quantum of waste that
can be treated, and scientifically disposed.
Total number of households with door‐to‐door collection of MSW to the total number of
households in the city
Service levels and quality
2. Efficiency of
collection of
municipal solid waste
% This indicator captures the total quantum of waste that is collected at the
treatment and/or disposal sites. This is relevant as it forms a major part in the
quantum of waste that can be treated/ disposed.
Quantum of waste that is collected at the treatment/disposal sites to the total quantity
of waste that is generated in the city
3. Extent of
segregation of
municipal solid waste
% This indicator captures the segregation of waste, typically as dry and wet
waste, but ideally as biodegradable and non‐biodegradable waste. Segregated
waste enables increased efficiencies in treatment, recycling and scientific
disposal of waste.
Quantity of segregated waste received at treatment/disposal sites to the total waste
collected by the service providers
4. Extent of municipal
solid waste
processed/recycled
% This indicator captures the quantity of waste that is recycled or processed at
the treatment plant.
Quantum of waste that is recycled or processed to the total waste that is collected by
the service providers
Financial management
5. Extent of cost
recovery (O&M) in
SWM services
% This indicator captures the revenues (taxes, user charges, fees) recovered by the
ULB against the expenses incurred. This denotes the cost control measures, if
any, that need to be considered by the ULB, and also a critical factor in tariff
charges.
Percentage of total operating revenues from SWM‐related charges to total operating
expenses on SWM
Efficiency in service operations
6. Extent of scientific
disposal of municipal
solid waste
% This indicator captures the quantum of waste that is disposed in scientific
engineered landfills. This is an important indicator as it assesses the amount of
waste that is safely disposed as against waste that is disposed in open dumps.
Quantum of waste that is disposed in scientific/compliant landfills to the total
quantum of waste disposed in compliant and open disposal sites
7. Efficiency in
redressal of customer
complaints
% This indicator captures the number of complaints made by consumers that
have been resolved by the ULB, as per service charter standards. It is an
important indicator which directly assesses the consumer satisfaction level.
Total number of SWM related complaints redressed within time as stipulated in the
service charter of the ULB, as a percentage of the total number of SWM‐related
complaints received in the year
8. Efficiency in
collection of SWM‐
related charges
% This indicator captures the extent of collection of revenues billed by the ULB. It
denotes the revenues that are due to the ULB from taxes and charges.
Percentage of current year revenues collected from SWM‐related taxes and charges as a
percentage of total billed amounts (for SWM)

10
SWM Unit Description
Equity
9. Spatial variations in
household level
coverage of SWM
services
CV This indicator captures the variations in door‐to‐door coverage of SWM across
wards within an ULB. Spatial variation with a value ‘0’ implies there are no
variations in coverage across the wards in the city.
Coefficient of variation (defined as standard deviation divided by mean) of zonal values
for “total households with door‐to‐door collection of MSW, as % of total households”
(indicator 1 above)
10. Household level
coverage of SWM
services in slum
settlements
% This indicator captures the number of households serviced by door‐to‐door
MSW collection in slum settlements. This measures the service level provision
to the urban poor.
Total households in slum settlements serviced by door‐to‐door collection of MSW as a
percentage of total number of households in slums.

11
2. Reliability Assessments of Key Indicators
2.1 Water supply
Access and Coverage
1. Coverage of individual water supply connections (%) Definition Total households connected to the water supply network with individual service connection, as
percentage of total households in the city
Description Coverage = (a/b)*100; where
a: is the total number of households with individual water connection (no.)
b: is the total number of households in ULB, as projected from Census or as reported by the ULB
(no.)
Reliability bands Households with individual service
connections
Actions needed to achieve reliability
A+ GIS database of property level details and
water connections
Develop GIS linked computerised property tax,
connection registers, etc
A Computerised records; households served
per connection and connections
maintained, with periodic updation
Computerise property tax, connection registers, etc,
along with household records
B Manual records; households served per
connection and connections maintained,
with periodic updation
Introduce households served per connection and
number of connections in manual records for property
tax, connection registers, etc
C Manual records of connections
maintained; households served per
connection as estimated or assumption of
one household = one connection
Introduce household estimate in manual records for
property tax, connection registers, etc, or develop a
system of manual records for connection registers, etc
D No records; as reported by ULB –
Service Levels and Quality
2. Per capita supply of water (lpcd) Definition Total treated water supplied per day into the distribution system expressed by population served.
Description Per capita supply = a/b; where
a: is the quantity of treated water supplied for a month, based on aggregate of daily water supplied
into the distribution system, from various sources, for example, ex‐treatment plant, treated bulk
water purchase, water drawn from ground sources, and any other sources like desalinated water,
rainwater harvesting (litres per day); Quantity of water supplied in bulk to large water intensive
industries to be excluded from this estimate of total supply.
b: is the population of the city, as projected from Census. In cases where cities have a substantial
floating population, this is also included. (no.)
Reliability bands Quantity of water produced Actions needed to achieve reliability
A+ Computerised systems linked to
GIS database
Computerised records linked to GIS database at District
Metering Area Zones
A Computerised systems to enable
daily monitoring of water supplied
Computerised records and analysis of measurement of water
quantity supplied through bulk flow meters at WTP and
WDS
B Manual records; daily quantities of
water supplied assessed by flow
meters
Improved manual records of water quantity supplied
through bulk flow meters at WTP and WDS
C Manual records; daily quantities of
water supplied assessed by
pumping details
Improved manual records of pump operations and/or level
measurements to measure quantity supplied at WTP and
WDS, backed by periodic surveys using portable bulk flow
meters
D No records; as reported by ULB –

12
Service Levels and Quality
3. Continuity of water supply (hours) Definition Weighted average of number of hours of pressurised water supply per day for a zone
Description Continuity = ∑(ai*(bi/B));where
a: is the average number of hours of pressurised supply in a day in a zone i (in hours) as measured for the
last month
b: estimated population or households in zone i as estimated from the census or as reported by the ULB,
and B is total population or households in the city as estimated from Census or as reported by the ULB
Reliability
bands
Hours of supply and
population/households of zones
Actions needed to achieve reliability
A+ Computerised system linked to GIS
database for recording hours of supply
Computerised records linked to GIS database at District
Metering Area Zones
A Computerised systems of hours of
supply
Computerised system for daily measurement of hours of
supply in each zone
B Manual records; hours of supply
maintained for each zone.
Develop a system of manual records for hours of water supply
in each zone on a daily basis and analysed daily and monthly,
along with periodic estimation of population/households for
each water zone
C Manual records; hours of supply as
reported by ULB for each zone.
Develop a system of manual records for hours of water supply
in each zone on a daily basis and analysed daily and monthly
D No records; hours of supply for city as a
whole as reported by ULB.
–
Service Levels and Quality
4. Quality of water supplied (%) Definition Percentage of water samples that meet or exceed the specified potable water standards and sampling
regime, as defined by CPHEEO
Description Quality of water supplied = (b/a)*100; where
a: is the total number of water samples taken/conducted in a month, from WTP/bulk production points
and consumer points (no.)
b: is the total number of water samples that have passed the standard, taken from WTP/bulk production
points, bore wells and consumer points (no.)
Reliability
bands
Sampling locations, audit of water quality Actions needed to achieve reliability
A+ Automated systems, linked to GIS
database. Proper sampling regimen for
consumer end tests. Independent audits
carried out regularly
Develop automated systems to monitor water quality at
all locations (source, WTP/bulk production points, ESR
and consumer), along with GIS database. Regular
independent audits to be conducted
A Automated systems to monitor water
quality. Proper sampling regimen for
consumer end tests. Independent audits
carried out regularly
Introduce automated systems to monitor water quality.
Regular independent audits need to be conducted
B Manual records; monitoring at all
locations. Proper sampling regimen for
consumer end tests. Independent audits
carried out occasionally
Develop a system of manual records for monitoring water
quality at all locations. Independent audits to be carried
out

13
Reliability
bands
Sampling locations, audit of water quality Actions needed to achieve reliability
C Manual records; internal audits carried out Develop a system of manual records for monitoring
water quality for all locations. Internal audits to be
carried out
D No records; no audits conducted –
Financial Sustainability
5. Cost Recovery (O&M) in water supply services (%) Definition Percentage of total operating revenues from water supply‐related charges to total operating expenses on
water supply
Description Cost recovery = (b/a)*100; where
a: is the total annual operating expenses in water supply, excluding loan interest payment and
depreciation
b: is the total annual operating revenues in water supply from local sources and excluding revenue
grants
Reliability
bands
Accounting systems and segregation of budget heads Actions needed to achieve reliability
A+ Computerised accounting systems with accrual based
double entry system. Clear segregation of budget heads
related to water. Regular reporting of financial statements
Develop computerised accrual based
double entry systems, with full migration
from cash‐based system. Accounting
system to enable clear segregation of
budget heads
A Computerised accounting systems with accrual based
double entry system, but parallel to cash‐based system.
Clear segregation of budget heads related to water.
Regular reporting of financial statements
Develop computerised accrual based
double entry system, enabling clear
segregation of budget heads
B Computerised accounting systems with accrual based
double entry system, with partial segregation of budget
heads related to water
Develop computerised accrual based
double entry system
C Cash‐based accounting systems with manual records Develop manual systems of cash based
accounting systems
D Not applicable –
Efficiency in Service Operation
6. Extent of non‐revenue water Definition Difference between total water produced (at source) and total water sold expressed as a percentage
of total water produced
Description Non‐revenue water = [((a‐b)/a)*100]; where
a: is the quantity of treated water supplied for a month, based on aggregated of daily water
supplied into the distribution system, from various sources, for example, ex‐treatment plant, treated
bulk water purchase, water drawn from ground sources, and any other sources like desalinated
water, rainwater harvesting (million litres per month); quantity of water supplied in bulk to large water
intensive industries to be excluded from this estimate of total supply.
b: is the total quantum of water sold/billed(million litres per month)
Reliability bands Quantity of water sold and water produced Actions needed to achieve reliability
A+ Computerised systems linked to GIS
database
Computerised records linked to GIS database at
District Metering Area Zones

14
Reliability bands Quantity of water sold and water produced Actions needed to achieve reliability
A Computerised systems to enable daily
monitoring of water supplied, with records
of metered quantities for all consumers
Computerised records and analysis of measurement
of water quantity supplied through bulk flow
meters at source, WTP and WDS, along with records
on metered quantities for all consumers
B Manual records; daily quantities of water
supplied assessed by flow meters, with
records of metered quantities for
commercial and bulk consumers. Domestic
consumption estimated based on periodic
surveys
Improved manual records of water quantity
supplied through bulk flow meters at source, WTP
and WDS, along with records on metered quantities
for bulk and commercial consumers. Domestic
consumption estimates conducted through periodic
surveys
C Manual records; daily quantities of water
supplied assessed by pumping details, with
records. Consumption estimates assessed
through spot surveys
Improved manual records of pump operations
and/or level measurements to measure quantity
supplied at WTP and WDS, backed by periodic
surveys using portable bulk flow meters. Introduce
consumption estimates in manual records, through
spot surveys
D No records; as reported by ULB –
Efficiency in Service Operation
7. Efficiency in redressal of customer complaints Definition Total number of water supply‐related complaints redressed within time as stipulated in service charter of
the ULB, as a percentage of the total number of water supply‐related complaints received in a year
Description Efficiency in redressal of customer complaints =(a/b)*100; where
a: is the no. of water supply complaints redressed as per service standards over the past year(no.)
b: is the total no. of water supply complaints received over the past year (no.)
Reliability
bands
Complaints received and redressed Actions needed to achieve reliability
A+ Computerised records linked to GIS
database
Introduce computerised systems with links to GIS
database to monitor and analyse complaints received
A Computerised records; complaints
segregated and collated from various means
Develop fully automated complaint redressal system,
with proper categorisation of complaints and capturing
complaints made through various means
B Manual records; complaints segregated and
collated from various means
Develop a system of manual records for complaints
received and redressed, with proper categorisation of
complaints and capturing complaints made through
various means
C Manual records; no segregation or collation
of complaints
Develop a system of manual records for complaints
received and redressed
D No records; as reported by ULB –
8. Extent of functional metering of water connections (%) Definition Total number of functional metered water connections expressed as a percentage of total number of water
supply connections
Description Extent of metered connections = (a/b)*100; where
a: is the number of metered connections that are functional
b: is the total number of water connections (residential, commercial, institutional, industrial and others)

15
Reliability
bands
Metered connections that are functional Actions needed to achieve reliability
A+ GIS database of property level details and
water connections, with information on
meters and their functionality incorporated
Develop GIS‐linked computerised property tax, connection
registers, etc, along with incorporating details like metered
connections and their functionality
A Computerised records; information on
meters and functionality assessed through
periodic surveys
Computerise records of metered connections, and assess
functionality of metered connections through periodic
surveys
B Manual records; information on meters and
functionality assessed through periodic
surveys
Develop a system of manual records for connections
registers/billing records, along with periodic surveys on
metered connections and their functionality
C Manual records; estimates of metered
connections that are functional
Introduce estimates on functional metered connections in
manual records for connection registers, billing records, etc
D No records; as reported by ULB –
9. Efficiency in collection of water supply related charges (%) Definition Percentage of current year revenues collected from water supply‐related taxes and charges as a percentage
of total billed amounts for water supply
Description Collection efficiency = [(a/b)*100]; where
a: is the water supply revenues collected in the given year for the current demand
b: is the total billed demand for water supply during the given year
Reliability
bands
Demand Collection Balance tables Actions needed to achieve reliability
A+ Automated generation of DCB tables,
linked to billing and collection systems,
with regular updation. Accrual based
double entry system
Develop a computerised system for demand and collection,
linked to billing and collection, along with automatic
generation of the tables. Computerised accrual‐based
double entry system
A Manual records of DCB tables linked to
billing and collection systems. Accrual‐
based double entry system
Develop a system of manual records of demand and
collection. Manual records of accrual‐based double entry
systems
B Manual records; accrual based double
entry system, practiced in parallel to cash‐
based system
Develop a system of manual records for demand and
collection. Develop manual systems for double entry
accounting parallel to cash‐based system
C Manual records; no segregation of current
year revenues vs. arrears. Cash‐based
accounting system
Develop a system of manual records for billing and
collection, along with cash‐based accounting system
D No records; as reported by ULB –
Equity in Service Delivery
10. Spatial variations in coverage of water supply connections (ratio) Definition Coefficient of variation (defined as standard deviation divided by mean) of zonal values for “total
households connected to the water supply network with an individual service connection, as percentage
of total households” (indicator 1 above)
Description Coefficient of variation = standard deviation of ‘a’/mean of ‘a’, where
a: coverage, derived from number of households with individual water connections divided by total
population/households in the ward/zone
The coefficient of variation is ‘0’, when coverage is the same across all the zones/wards in the city
Reliability
bands
Ward‐wise households with individual
service connections
Actions needed to achieve reliability
A+ GIS database of property level details and
water connections, for each ward/zone
Develop GIS‐linked computerised property tax, connection
registers, etc, incorporating ward level details on
households served

16
Reliability
bands
Ward‐wise households with individual
service connections
Actions needed to achieve reliability
A Computerised records; households served
per connection and connections maintained
for each ward/zone, with periodic updation
Computerise property tax, connection registers, etc, along
with household records, for each ward/zone
B Manual records; households served per
connection maintained for each ward/zone
Introduce households served per connection in manual
records for property tax, connection registers, etc, at
ward/zone level
C Manual records of connections maintained;
assumption of one household = one
connection
Develop a system of manual records for connections as part
of property tax, connection registers etc
D No records; as reported by ULB –
Equity in Service Delivery
11. Spatial variations in per capita supply of water (ratio) Definition Coefficient of variation (defined as standard deviation divided by mean) of zonal values for “Total treated
water supplied into the distribution system expressed by population served per days of water supplied”
(indicator 2 above)
Description Coefficient of variation = standard deviation of ‘a’/mean of ‘a’, where
a: coverage, derived from number of households with individual water connections divided by total
population/households in the ward/zone
The coefficient of variation is ‘0’, when coverage is the same across all the zones/wards in the city
Reliability
bands
Quantity of water produced,
Zone‐wise population/households
Actions needed to achieve reliability
A+ Computerised systems linked to GIS
database at WDS level. Estimates of zone‐
wise population/households through past
trends/surveys
Computerised records with analysis of water production
linked to GIS systems. Surveys conducted periodically to
estimate population/households
A Computerised systems to monitor daily
production of water at WDS. Estimates of
zone‐wise population/households through
past trends/surveys
Computerised records and analysis of measurement of
water quantity supplied through bulk flow meters at
WDS
B Manual records; daily quantities of water
supplied assessed by flow meters
Improved manual records of water quantity supplied
through bulk flow meters at WDS
C Manual records; daily quantities of water
supplied assessed by pumping details
Improved manual records of pump operations and/or
level measurements to measure quantity supplied at
WDS, backed by periodic surveys using portable bulk
flow meters
D No records; as reported by ULB –
12. Coverage of water supply connections in slum settlements (%) Definition Total households in slum settlements connected to water supply network with individual service
connection, as percentage of total households in all slum settlements in the ULB
Description Coverage = (a/b)*100; where
a: is the total number of households with individual water supply connection in slums
b: is the total number of households in the slums
Reliability
bands
Number of households in slums and services Actions needed to achieve reliability
A+ Computerised records; household level
connection details maintained
Computerise records of slum households and
household level services provided
A Manual records; household level connection
details maintained
Develop manual recording systems of households and
water connections provided

17
Reliability
bands
Number of households in slums and services Actions needed to achieve reliability
B Recent surveys; households and connection
details maintained
Conduct periodic surveys to assess the slum household
nos. and basic services provided to each household
C Past surveys; households and connection
details maintained
Maintain records of past surveys conducted that give
information of households and connections provided
D No records; as reported by ULB –
2.2 Wastewater
Access and Coverage
1. Coverage of toilets at household level (%) Definition Households with individual toilets within premise as a percentage of total households in the ULB
Description Coverage of toilets = (a/b)*100; where
a: is the total number of households with individual toilets in the premises (no.)
b: is the total number of households in the ULB (as per indicator 1 in water supply) (no.)
Reliability bands Households with individual toilets in
premises
Actions needed to achieve reliability
A+ GIS database of property level details
and toilet connections
Develop GIS‐linked computerised property tax,
connection registers, etc
A Computerised records; households with
toilets maintained, with periodic
updation
Computerise property tax, connection registers, etc,
along with household records
B Manual records of households with toilet
connections maintained; alternatively,
this can be estimated on basis of periodic
surveys
Develop a system of manual records of toilet
connections, incorporating households with access to
toilets
C Manual records of properties with access
to toilets in their premises. Assumption:
1 property = 1 household
Develop a system of manual records for property tax,
connection registers, etc
D No records; as reported by ULB –
Access and Coverage
2. Coverage of sewerage connections at household level (%) Definition Households with individual connections to the sewerage network as a percentage of total households
in the ULB
Description Coverage of sewerage connections = (a/b)*100; where
a: is the total number of households with individual connections to the sewerage network (no.)
b: is the total number of households in the ULB (as per indicator 1 in water supply) (no.)
Reliability
bands
Households with individual toilets in
premises
Actions needed to achieve reliability
A+ GIS database of property level details and
sewerage connections
Develop GIS‐linked computerised property tax,
connection registers, etc
A Computerised records; records on households
with individual sewerage connections
maintained, with periodic updation
Computerise property tax, connection registers, etc,
along with household records

18
Reliability
bands
Households with individual toilets in
premises
Actions needed to achieve reliability
B Manual records of households with sewerage
connections maintained.
Develop a system of manual records of sewerage
connections, incorporating households connected to
network
C Manual records of sewerage connections.
Assumption: 1 household = 1 connection
Develop a system of manual records for sewerage
connections
D No records; as reported by ULB –
Service Levels and Quality
3. Collection efficiency of wastewater network (%)Definition Total quantity of wastewater collected, as measured at the inlet of treatment plants, as a percentage of
total estimated wastewater generated in the ULB
Description Collection efficiency of wastewater networks = b/(a*0.8); where
a: is the total water produced, including estimated water use from other sources as given by ULB and
excluding losses (MLD)
b: is the quantum of wastewater collected at the inlet of the wastewater treatment plant (MLD)
Reliability
bands
Quantity of wastewater collected, quantity
of water produced
Actions needed to achieve reliability
A+ Computerised systems linked to GIS
database
Introduce GIS database systems, linked to
computerised systems, enabling analysis of collection
efficiencies of the network
A Computerised systems to enable daily
monitoring of wastewater collected
Computerised records and analysis of measurement of
wastewater collected at treatment plants
B Manual records; daily quantities of
wastewater assessed by flow meters
Improved manual records of wastewater collected
through inflow meters at the intake of the plant
C Daily quantities of wastewater estimated on
the basis of dimensions of inflow channel
Introduce estimations of wastewater quantum based on
dimensions of inflow channel to treatment plant
D No records; as reported by ULB –
Service Levels and Quality
4. Adequacy of wastewater treatment capacity (%)Definition Quantum of wastewater that can be treated to secondary treatment standards (removal of BOD and
COD) as a percentage of total estimated wastewater generated in the ULB
Description Adequacy of wastewater treatment capacity = [b/(a*0.8)]; where
a: is the total water produced, including estimates from non‐ULB sources, and excluding losses.(MLD)
b: is the quantity of wastewater that can be treated to secondary treatment standards (that is, removing
oxygen demand as well as solids, normally biological) (MLD)
Reliability
bands
Quantity of wastewater that can be treated,
quantity of water produced
Actions needed to achieve reliability
A+ Computerised systems linked to GIS
database
Introduce GIS database systems, linked to
computerised systems, enabling analysis of collection
efficiencies of the network
A Computerised systems to enable daily
monitoring of wastewater that can be treated
Computerised records and analysis of measurement of
wastewater treated to secondary treatment levels
B Manual records; daily quantities of
wastewater assessed by flow meters
Improved manual records of wastewater that can be
treated based on outflow meters at treatment plant
Reliability
bands
Quantity of wastewater that can be treated,
quantity of water produced
Actions needed to achieve reliability
C Estimated based on installed capacity of STP Improved manual records of installed capacities of
STPs
D No records; as reported by ULB –

19
Financial Sustainability
5. Cost recovery (O&M) in wastewater services (%) Definition Percentage of total operating revenues from wastewater‐related charges to total operating expenses on
wastewater services
Description Cost recovery =(b/a) * 100; where
a: is the total annual operating expenses in wastewater, excluding loan interest payment and depreciation
(in Rs)
b: is the total annual operating revenues in wastewater from local sources and excluding revenue grants
(in Rs)
Reliability
bands
Accounting systems and segregation of budget
heads
Actions needed to achieve reliability
A+ Computerised accounting systems with accrual‐
based double entry system. Clear segregation of
budget heads related to sanitation and sewerage.
Regular reporting of financial statements
Develop computerised accrual‐based double entry
systems, with full migration from cash‐based
system. Accounting system to enable clear
segregation of budget heads
A Computerised accounting systems with accrual‐
based double entry system, but parallel to cash‐
based system. Clear segregation of budget heads
related to sanitation and sewerage. Regular
reporting of financial statements
Develop computerised accrual‐based double entry
system, enabling clear segregation of budget heads
B Computerised accounting systems with accrual‐
based double entry system, with partial segregation
of budget heads related to wastewater
Develop computerised accrual‐based double entry
system
C Manual records. Cash‐based accounting system Develop manual systems of cash‐based accounting
systems
D Cash‐based accounting system –
Efficiency in Service Operation
6. Quality of wastewater treatment (%) Definition Total number of wastewater samples (all key parameters as specified by the CPHEEO) that have passed to
number of wastewater samples conducted, at the outlet of the treatment plant
Description Quality of treatment = (b/a)*100;where
a: is the total number of wastewater samples conducted in a month (no.)
b: is the number of wastewater samples that pass the specified secondary treatment standards in the given
month (no.)
Reliability
bands
Sampling locations, periodic audit of
wastewater quality
Actions needed to achieve reliability
A+ Automated systems, linked to GIS
database. Proper sampling regimen
wastewater quality tests. Independent
audits carried out regularly
Develop automated systems to monitor wastewater quality,
and linked to GIS database. Regular independent audits to be
conducted
A Automated systems to monitor
wastewater quality. Independent audits
carried out regularly
Introduce automated systems to monitor and analyse
wastewater quality. Regular independent audits need to be
conducted
Reliability
bands
Sampling locations, periodic audit of
wastewater quality
Actions needed to achieve reliability
B Manual records. Independent audits
carried out occasionally
Develop a system of manual records for monitoring
wastewater quality. Independent audits to be conducted at
least occasionally
C Manual records; internal audits carried
out
Develop a system of manual records for monitoring
wastewater quality. Internal audits to be carried out
D No records; no audits conducted –

20
Efficiency in Service Operation
7. Extent of reuse and recycling of wastewater (%) Definition Quantum of wastewater recycled or reused as a percentage of wastewater collected by the sewerage
network
Description Extent of wastewater recycled or reused = (b/a)*100; where
a: is the quantity of wastewater collected (MLD)
b: is the quantity of wastewater, recycled or reused for various purposes (MLD)
Reliability
bands
Quantity of wastewater recycled or reused Actions needed to achieve reliability
A+ Computerised systems linked to GIS database Introduce computerised systems with links to GIS
database
A Computerised systems to enable daily
monitoring of quantity of wastewater recycled
or reused
Computerised records and analysis of quantum of
wastewater reused
B Manual records; daily quantities of wastewater
reused assessed by flow meters
Improved manual records of wastewater reused
through outflow meters at the outlet of plant
C Estimated based on channel dimensions Introduce estimations of wastewater quantum based
on channel dimensions
D No records; as reported by ULB –
Efficiency in Service Operation
8. Efficiency in redressal of customer complaints Definition Total number of wastewater‐related complaints redressed within time as stipulated in service charter of
the ULB, as a percentage of the total number of wastewater‐related complaints received in the year
Description Efficiency in redressal of customer complaints =(a/b)*100; where
a: is the number of wastewater complaints redressed as per service standards over the past year (no.)
b: is the total number of wastewater complaints received over the past year (no.)
Reliability
bands
Complaints received and redressed Actions needed to achieve reliability
A+ Computerised records linked to GIS
database
Introduce computerised systems with links to GIS
database to monitor and analyse complaints received
A Computerised records; complaints
segregated and collated from various means
Develop fully automated complaint redressal system,
with proper categorisation of complaints and capturing
complaints made through various means
B Manual records; complaints segregated and
collated from various means
Develop a system of manual records for complaints
received and redressed, with proper categorisation of
complaints and capturing complaints made through
various means
C Manual records; no segregation or collation
of complaints
Develop a system of manual records for complaints
received and redressed
D No records; as reported by ULB –
Efficiency in Service Operation
9. Efficiency in collection of wastewater‐related charges (%) Definition Percentage of current year revenues collected from wastewater‐related taxes and charges as a percentage
of total billed amounts for wastewater
Description Collection efficiency = [(a/b) * 100]; where
a: is the current wastewater revenues collected in the given year for current demand
b: is the total billed demand for wastewater during the given year

21
Reliability
bands
Demand Collection Balance tables Actions needed to achieve reliability
A+ Automated generation of DCB tables, linked
to billing and collection systems, with
regular updation. Accrual‐based double
entry system
Develop a computerised system for demand and
collection, linked to billing and collection, along with
automatic generation of the tables. Computerised accrual‐
based double entry system
A Manual records of DCB tables linked to
billing and collection systems. Accrual‐based
double entry system
Develop a system of manual records of demand and
collection. Manual records of accrual‐based double entry
systems
B Manual records; accrual‐based double entry
system, practiced in parallel with cash‐based
system
Develop a system of manual records for demand and
collection. Develop manual systems for double entry
accounting parallel to cash‐based system
C Manual records; no segregation of current
year revenues vs. arrears. Cash‐based
accounting system
Develop a system of manual records for billing and
collection, along with cash‐based accounting system
D No records; as reported by ULB –
Equity in Service Delivery
10. Spatial variations in coverage of toilets (ratio) Definition Coefficient of variation (defined as standard deviation divided by mean) of ward values for “total
households with individual toilets within premises as percentage of total households” (indicator 1 above)
Description Coefficient of variation = standard deviation of ‘a’/mean of ‘a’, where
a: coverage, derived from number of households with individual water connections divided by total
population/households in the ward/zone
The coefficient of variation will be ‘0’, if coverage is the same across all the zones/wards in the city
Reliability
bands
Ward‐wise households with individual toilets in
premises
Actions needed to achieve reliability
A+ GIS database of property level details and toilet
connections, for each ward/zone
Develop GIS‐linked computerised property tax,
connection registers, etc, incorporating ward
level details on households served
A Computerised records; households with toilets
maintained for each ward/zone, with periodic
updation
Computerise property tax, connection registers,
etc, along with household records for each
ward/zone
B Manual records of households with toilet connections
maintained for each ward/zone; alternatively, this can
be estimated on basis of periodic surveys
Develop a system of manual records of toilet
connections at ward/zone level, incorporating
households with access to toilets
C Manual records of properties with access to toilets in
their premises. Assumption: 1 property = 1 household
Develop a system of manual records for property
tax, connection registers, etc
D No records; as reported by ULB –
Equity in Service Delivery
11. Spatial variations in coverage of sewerage connections (ratio) Definition Coefficient of variation (defined as standard deviation divided by mean) of zonal values for “total
households to sewerage network with an individual connection as percentage of total households”
(indicator 2 above)
Description Coefficient of variation = standard deviation of ‘a’/mean of ‘a’, where
a: coverage, derived from number of households with individual water connections divided by total
population/households in the ward/zone
The coefficient of variation will be ‘0’, if coverage is the same across all the zones/wards in the city

22
Reliability
bands
Ward‐wise households with individual sewerage
connections
Actions needed to achieve reliability
A+ GIS database of property level details and toilet connections,
for each ward/zone
Develop GIS‐linked computerised
property tax, connection registers, etc,
incorporating ward level details on
households served
A Computerised records; households with individual sewerage
connections maintained for each ward/zone, with periodic
updation
Computerise property tax, connection
registers, etc, along with household
records for each ward/zone
B Manual records of households with sewerage connections
maintained for each ward/zone
Develop a system of manual records of
sewerage connections at ward/zone level,
incorporating number of households
C Manual records of number of sewerage connections for each
ward/zone. Assumption: 1 household = 1 connection
Develop a system of manual records for
connection registers
D No records; as reported by ULB –
Equity in Service Delivery
12. Coverage of toilets in slum settlements (%) Definition Total households in slum settlements with individual toilets as percentage of total households in all
slum settlements in the ULB
Description Coverage of toilets = (a/b)*100; where
a: is the total number of households with individual toilets in the slums
b: is the total number of households in the slums
Reliability bands Number of households in slums and
services
Actions needed to achieve reliability
A+ Computerised records; household level
connection details maintained
Computerise records of slum households and
household level services provided
A Manual records; household level
connection details maintained
Develop manual recording systems of households and
toilet connections provided
B Recent surveys; households and
connection details maintained
Conduct periodic surveys to assess the slum household
nos. and basic services provided to each household
C Past surveys; households and connection
details maintained
Maintain records of past surveys conducted that give
information of households and connections provided
D No records; as reported by ULB –
Equity in Service Delivery
13. Coverage of sewerage connections in slum settlements (%) Definition Total households in slum settlements with sewerage connections as percentage of total households in all
slum settlements in the ULB
Description Coverage of sewerage connections = (b/a)*100; where
a: is the total number of households in the slums
b: is the total number of households with sewerage connections in the slums
Reliability
bands
Number of households in slums and services Actions needed to achieve reliability
A+ Computerised records; household level
connection details maintained
Computerise records of slum households and household
level services provided
A Manual records; household level connection
details maintained
Develop manual recording systems of households and
sewerage connections provided
B Recent surveys; households and connection
details maintained
Conduct periodic surveys to assess the slum household
nos. and basic services provided to each household
C Past surveys; households and connection
details maintained
Maintain records of past surveys conducted that give
information of households and connections provided
D No records; as reported by ULB –

23
2.3 Solid Waste Management
Access and Coverage
1. Coverage of households and establishments for primary collection of MSW (%) Definition Total households and establishments that are covered by daily doorstep collection system, as a
percentage of total households and establishments in the city.
Description Coverage =(b/a)*100; where
a: is the total number of households and establishments in the service area, as projected from Census or
as reported by ULB (no.)
b: is the total number of households covered by and establishments with daily doorstep collection (no.)
Reliability
bands
Households and establishments covered
by doorstep collection
Actions needed to achieve reliability
A+ GIS database of households and
establishments
Develop GIS database of households and establishments,
with details on primary collection
A Computerised records; households and
establishments served by primary
collection maintained, with periodic
updation
Computerise property tax, primary collection records, etc,
incorporating households and establishments
B Manual records; primary collection
records maintained
Develop a system of manual records for primary collection,
along with households and establishments served
C Estimation of primary collection of
households and establishments based
on surveys
Conduct surveys to estimate households and
establishments served by primary collection
D No records; as reported by ULB –

24
Service levels and Quality
2. Efficiency of collection of municipal solid waste (%) Definition Total waste collected by ULB and/or authorised service providers as a percentage of total waste
generated within the ULB, excluding recycling or processing at the generation point
Description Collection efficiency = (b/a)*100; wherea: is the total waste that is generated and which needs to be collected (tons per month) b: is the total waste that is collected by the ULB and/or authorised service providers (tons per month)
Reliability
bands
Quantum of waste collected,
quantum of waste generated
Actions needed to achieve reliability
A+ Automated systems, linked to GIS database; quantum
of waste collected measured at weighbridge. Sample
surveys conducted to estimate quantum of waste
generation
Introduce automated systems linked to GIS
database for monitoring waste collection
processes. Conduct sample seasonal surveys
to estimate waste generation
A Automated systems; quantum of waste collected
measured at weighbridge. Sample surveys conducted
to estimate quantum of waste generation
Automated systems for monitoring waste
collection from primary points to
treatment/disposal points
B Manual records; quantum of waste collected measured
at weighbridge. Spot surveys conducted to estimate
quantum of waste generation
Develop a system of manual records for
monitoring waste collection at the
treatment/disposal site. Conduct spot
surveys to estimate waste generation
C Manual records; quantum of waste collected based on
trips to treatment/disposal site. Estimates of waste
generation based on size of the city
Develop a system of manual records of
transportation of waste to
treatment/disposal site
D No records; as reported by ULB –
Service levels and Quality
3. Extent of segregation of municipal solid waste (%) Definition Total quantity of waste that arrives at the treatment/disposal site in a segregated manner as a
percentage of total waste received at the treatment/disposal site
Description Extent of segregation = (a/b)*100; where
a: is the quantity of waste that arrives in a segregated manner at the treatment/disposal site (tons
per month)
b: is the total quantity of waste received at the treatment/disposal site (tons per month)
Reliability bands Quantum of waste segregated,
quantum of waste collected
Actions needed to achieve reliability
A+ Automated systems, linked to GIS database;
quantum of waste measured at weighbridge
Introduce automated systems linked to GIS
database for monitoring waste collection
processes
A Automated systems; quantum of waste
measured at weighbridge
Automated systems for monitoring waste
segregation and collection
B Manual records; quantum of waste measured at
weighbridge
Develop a system of manual records for
monitoring waste segregation and collection
C Manual records; quantum of waste based on
trips to treatment/disposal site
Develop a system of manual records of
transportation of waste to treatment and/or
disposal site
D No records; as reported by ULB –

25
4. Extent of municipal solid waste processed and recycled (%) Definition Total quantity of waste that is processed and recycled as a percentage of total waste collected
Description Extent of recovery = (a/b)* 100; wherea: is the quantity of waste that is processed and recycled (tons per month)
b: is the total quantum of waste that is collected by the ULB or authorised service providers (tons
per month)
Reliability bands Quantum of waste processed and recycled Actions needed to achieve reliability
A+ Automated systems, linked to GIS
database; quantum of waste measured at
weighbridge
Introduce automated systems linked to GIS database
for monitoring waste collection processes
A Automated systems; quantum of waste
measured at weighbridge
Automated systems for monitoring waste segregation
and collection
B Manual records; quantum of waste
measured at weighbridge
Develop a system of manual records for monitoring
waste segregation and collection
C Manual records; quantum of waste based
on trips to treatment/disposal site
Develop a system of manual records of
transportation of waste to disposal site
D No records; as reported by ULB –
Financial Sustainability
5. Extent of cost recovery (O&M) in SWM services (%) Definition Percentage of total operating revenues from solid waste management charges to total operating
expenses on solid waste management
Description Cost recovery = (b/a)*100; wherea: is the total annual operating expenses in SWM, excluding loan interest payment and depreciation b: is the total annual operating revenues in SWM from local sources and excluding revenue grants
Reliability bands Accounting systems and segregation of budget heads Actions needed to achieve reliability
A+ Computerised accounting systems with accrual‐
based double entry system. Clear segregation of
budget heads related to SWM. Regular reporting of
financial statements
Develop computerised accrual‐based
double entry systems, with full migration
from cash‐based system. Accounting
system to enable clear segregation of
budget heads.
A Computerised accounting systems with accrual‐
based double entry system, but parallel to cash‐based
system. Clear segregation of budget heads related to
SWM. Regular reporting of financial statements
Develop computerised accrual‐based
double entry system, enabling clear
segregation of budget heads.
B Computerised accounting systems with accrual‐
based double entry system, with partial segregation
of budget heads related to SWM
Develop computerised accrual‐based
double entry system
C Manual records. Cash‐based accounting system Develop manual systems of cash‐based
accounting systems
D Cash‐based accounting system –
Efficiency in Service Operation
6. Extent of scientific disposal of municipal solid waste (%) Definition Total quantum of waste that is disposed in ‘compliant’ landfills as a percentage of total quanta of
waste disposed in all landfill sites, including open dump sites
Description Extent of scientific disposal of MSW = (a/b)*100; where
a: is the total quantum of waste disposed in scientific/compliant landfills (tons per month)
b: is the total quantum of waste disposed in all landfills, including open dumps (tons per month)

26
Reliability bands Quantum of waste disposed at compliant sites Actions needed to achieve reliability
A+ Automated systems, linked to GIS database;
quantum of waste measured at weighbridge
Introduce automated systems linked to GIS
database for monitoring waste collection
processes
A Automated systems; quantum of waste
measured at weighbridge
Automated systems for monitoring waste
segregation and collection
B Manual records; quantum of waste measured at
weighbridge
Develop a system of manual records for
monitoring waste segregation and collection
C Manual records; quantum of waste based on
trips to treatment/disposal site
Develop a system of manual records of
transportation of waste to disposal site
D No records; as reported by ULB –
Efficiency in Service Operation
7. Efficiency in redressal of customer complaints (%)Definition Total number of SWM‐related complaints redressed as per standards specified in service charter of
the ULB, as a percentage of the total number of SWM complaints received daily
Description Efficiency in redressal of complaints = (b/a)*100; wherea: is the total number of SWM‐related complaints received in a year (no.)
b: is the total number of SWM complaints redressed as per service standards in that given year (no.)
Reliability bands Complaints received and redressed Actions needed to achieve reliability
A+ Computerised records linked to GIS
database
Introduce computerised systems with links to GIS
database to monitor and analyse complaints received
A Computerised records; complaints
segregated and collated from various
means
Develop fully automated complaint redressal system,
with proper categorisation of complaints and capturing
complaints made through various means
B Manual records; complaints segregated
and collated from various means
Develop a system of manual records for complaints
received and redressed, with proper categorisation of
complaints and capturing complaints made through
various means
C Manual records; no segregation or
collation of complaints
Develop a system of manual records for complaints
received and redressed
D No records; as reported by ULB –
8. Efficiency in collection of SWM‐related user charges (%) Definition Percentage of total revenues collected from solid waste‐related taxes and charges as a percentage of
total billed amounts in the year
Description Collection efficiency = (a/b)*100; wherea: is the revenues collected in SWM during the given year for current demand
b: is the total billed demand in SWM during the given year
Reliability bands Demand Collection Balance tables Actions needed to achieve reliability
A+ Automated generation of DCB tables, linked
to billing and collection systems, with
regular updation. Accrual‐based double
entry system
Develop a computerised system for demand and
collection, linked to billing and collection, along
with automatic generation of the tables.
Computerised accrual‐based double entry system
A Manual records of DCB tables linked to
billing and collection systems. Accrual‐
based double entry system
Develop a system of manual records of demand and
collection. Manual records of accrual‐based double
entry systems

27
Reliability bands Demand Collection Balance tables Actions needed to achieve reliability
B Manual records; accrual‐based double entry
system, practiced in parallel to cash‐based
system
Develop a system of manual records for demand
and collection. Develop manual systems for double
entry accounting parallel to cash‐based system
C Manual records; no segregation of current
year revenues vs. arrears. Cash‐based
accounting system
Develop a system of manual records for billing and
collection, along with cash‐based accounting system
D No records; as reported by ULB –
Equity in Service Delivery
9. Spatial coverage of SWM services (%) Definition Coefficient of variation (defined as standard deviation divided by mean) of zonal values for
“Percentage of households covered by daily doorstep collection system to total number of households”
(indicator 1 above)
Description Coefficient of variation = standard deviation of ‘a’/mean of ‘a’, where
a: coverage, derived from number of households with individual water connections divided by total population/households in the ward/zone
The coefficient of variation will be ‘0’, if coverage is the same across all the zones/wards in the city
Reliability
bands
Ward‐wise households with doorstep
collection of SWM
Actions needed to achieve reliability
A+ GIS database of households and establishments, for
each ward/zone
Develop GIS database of households and
establishments, with details on primary
collection at ward/zone level
A Computerised records; households and
establishments served by primary collection
maintained for each ward/zone, with periodic
updation
Computerise property tax, primary collection
records, etc, incorporating households and
establishments at ward/zone level
B Manual records; primary collection records
maintained for each ward/zone
Develop a system of manual records for
primary collection at ward/zone level, along
with households and establishments served
C Estimation of primary collection of households and
establishments based on surveys
Conduct surveys to estimate households and
establishments served by primary collection
D No records; as reported by ULB –
Equity in Service Delivery
10. Household level coverage of SWM services in slum settlements Definition Percentage of households that are covered by daily doorstep collection system to the total number
of households in the slum settlements
Description SWM coverage = (b/a)*100; wherea: is the total number of households in the slum (no.) b: is the total number of households with daily doorstep collection of SWM (no.)
Reliability bands Number of households in slums and
services
Actions needed to achieve reliability
A+ Computerised records; household
level collection details maintained
Computerise records of slum households and household
level services provided
A Manual records; household level
collection details maintained
Develop manual recording systems of households and
primary collection details

28
Reliability bands Number of households in slums and
services
Actions needed to achieve reliability
B Recent surveys; households and
collection details maintained
Conduct periodic surveys to assess the slum household
nos. and basic services provided to each household
C Past surveys; households and
collection details maintained
Maintain records of past surveys conducted that give
information of households and primary collections
provided
D No records; as reported by ULB –

29
3. Local Action Indicators 3.1 Summary List of Indicators
Water supply Wastewater1 Solid waste management
Access and coverage
Coverage of utility
network across the city 1. % of inhabited municipal
area covered with water
supply distribution
network
1. % of inhabited municipal
area covered with sewerage
network
2. Spatial coverage of
sewerage and sullage system
3. Coverage of storm water
drainage
Service levels and quality
Quantity 2. Percentage of estimated
water demand over next
three years to available
supply from all current
sources and immediate
plans to augment through
ongoing projects
3. % of connections that are
metered 4. % of meters that are
functional 5. Average consumption
per connection (for
residential and others)
where consumer meters
are in place and are
functional Quality 6. Quality of water supply
at WTP (residual chlorine
(RC), bacteriological, total
dissolved salts (TDS))
7. Quality of water at ESR
Level (RC, bacteriological,
TDS) 8. Quality of water at
consumer end (RC,
bacteriological, TDS,
fluoride)
Financial sustainability
Overall cost recovery 9. Recovery of O&M costs for water, wastewater and SWM from local taxes and charges
1Wastewater includes storm water drainage.

30
Water supply Wastewater Solid waste management
Efficiency in service operations
Non‐revenue water
and physical losses
10. % Authorised and
unbilled consumption to
total supply
11. % Losses from source
to water treatment plant
(WTP) 12. % Losses from WTP to
water distribution station
(WDS) 13. % Losses from WDS to
final consumption
(includes both leakage on
service connections and
unauthorised
consumption) 14. % of identified illegal
connections that are
regularised 15. Water losses per
connection
16. Real losses per service
connection per month per
meter (head) pressure
17. Water losses per mains
length
18. Unavoidable Annual
Real Losses (UARL)
19. Infrastructure Leakage
Index
20. Annual cost of losses
Complaint redressal 21. Total complaints in
water supply per 1,000
connections per year
4. Total complaints in
wastewater per 1,000
connections per year
1. Total complaints in solid
waste per 1,000 households
22. Complaints for pipe
breaks and leakages per
1,000 connections per year
5. Complaints for sewerage
blocks per 1,000 sewerage
connections per year
2. Complaints related to
garbage collection per 1,000
households per year
23.Complaints for low
pressure per 1,000
connections per year
6. Complaints for
damaged/overflowing
manholes per 1,000 sewerage
connections per year
3. Complaints related to
street sweeping per 1,000
households per year
24. Complaints for water
quality per 1,000
connections per year
7. Complaints for
leakage/overflowing lines per
1,000 sewerage connections
per year
4. Complaints related to
odour/nuisance
Staffing 25. % of staff recruited to
sanctioned for water
supply
8. % of staff recruited to
sanctioned for wastewater
5. % of staff recruited to
sanctioned for SWM

31
Water supply Wastewater Solid waste management
Efficiency in service operations
26. Total staff (regular and
contract) per 1,000 water
supply connections
9. Total staff (regular and
contract) per 1,000 wastewater
connections
6. Total staff (regular and
contract) per 1,000
households
7. Total sweepers per km of
road length swept
Unit costs and
revenues
27. Electricity expenditure
as a share of water
production
10. Unit cost of treatment of
wastewater
8. Unit cost of transportation
of solid waste
28. Unit cost of production
of water
29. Average revenue per
connection
11. Average revenue per
connection
9. Average revenue per
connection
Collection efficiency 30. Collection period for
water supply charges
12. Collection period for
wastewater charges
10. Collection period for
SWM charges
31. Billed arrears to total
billed demand
13. Billed arrears to total
billed demand
11. Billed arrears to total
billed demand
Flooding incidents 14. Incidence of water
logging/flooding
Equity in service delivery
Equity across slum
settlements
32. Population per
shared/community
standpost in slum
settlements
15. Population per toilet seat
in community toilets in slum
settlements

32
3.2 Definition and Description of Local Indicators Water Supply
Water supply Unit Description
Access and coverage
1. % of inhabited municipal
area covered with water
supply distribution network
% This indicator captures the geographical area of the water supply network
with respect to total area of the city. It is an important indicator in assessing
the coverage of water connections in the city.
Percentage of municipal area covered by water supply network to total area of the
city
Service levels and quality
2. Percentage of estimated
water demand over next three
years to available supply from
all current sources and
immediate plans to augment
through ongoing projects
% This indicator captures the percentage of water demand that is estimated
over the next three years to the available supply in the ULB.
Percentage of estimated water demand, over next three years, to available supply
from current sources and immediate plans to augment through ongoing projects
3. % of connections that are
metered
% This indicator captures the percentage of connections that are metered to
the total connections in the ULB. This indicator coupled with functional
metering of connections gives the actual extent of metering of connections
in the ULB.
Percentage of connections metered to total connections in the ULB
4. % of meters that are
functional
% This indicator captures the functional meters of the total number of meters
installed.
Percentage of meters that is functional to total number of meters
5. Average consumption per
connection (for residential and
others) where consumer
meters are in place and are
functional
litres/
day
This indicator captures the average consumption per connection, where
consumer meters are in place and are functional. This is an important
indicator in terms of resource use, across various agro climatic regions of
the state.
Average consumption per connection, in litres per day, where consumer meters are
in place and functional
6. Quality of water supply at
WTP (RC, bacteriological,
TDS)
% This indicator captures the quality of water produced at WTP, according to
physical, chemical and bacteriological tests. These indicators give an
important indication of the quality aspects from source to consumer.
Percentage of samples that have passed as per standards to number of samples
conducted, for RC, bacteriological, TDS, and fluoride at WTP 7. Quality of water at ESR level
(RC, bacteriological, TDS)
% This indicator captures the quality of water produced at ESR, according to
physical, chemical and bacteriological tests. These indicators give an
important indication of the quality aspects from source to consumer.
Percentage of samples that have passed as per standards to number of samples
conducted, for RC, bacteriological, TDS, and fluoride at ESR 8. Quality of water at
consumer end (RC,
bacteriological, TDS, fluoride)
% This indicator captures the quality of water produced at consumer end,
according to physical, chemical and bacteriological tests. These indicators
give an important indication of the quality aspects from source to
consumer.
Percentage of samples that have passed as per standards to number of samples
conducted, for RC, bacteriological, TDS and fluoride at consumer end

33
Water supply Unit Description
Financial sustainability
9. Recovery of O&M costs
for water, wastewater and
SWM from local taxes and
charges
% This indicator captures the extent of recovery of O&M costs for water,
wastewater and SWM. This indicator, when interpreted with the cost
recovery for individual sectors, helps to understand how they are
performing.
Percentage of operating revenues for water supply, wastewater and SWM to
operating expenses in a year
Efficiency in service operations
10. Authorised and
unbilled consumption to
total supply
% This indicator captures the extent of authorised and unbilled consumption.
This indicator is used for policy level decisions.
Percentage of authorised and unbilled consumption to total water supply
11. Losses from source to
water treatment plant
(WTP)
% This indicator captures the losses in transmission of water from source to
treatment plant, and is a sub‐component of non‐revenue water. This is an
important indicator as it identifies the stages of quantity loss.
Percentage of losses in water supplied from source to water treatment plant
12. Losses from WTP to
water distribution station
(WDS)
% This indicator captures the losses in transmission of water from treatment
plant to water distribution station, and is a sub‐component of non‐revenue
water. This is an important indicator as it identifies the stages of quantity
loss.
Percentage of losses in water supplied from water treatment plant to water
distribution station
13. Losses from WDS to
final consumption
% This indicator captures the losses in transmission of water from water
distribution station till consumer point, and is a sub‐component of non‐
revenue water. This is an important indicator as it identifies the stages of
quantity loss.
Percentage of losses in water supplied from water distribution station to final
consumption point (includes both leakage on service connections and unauthorised
consumption)
14. % of identified illegal
connections that are
regularised
% This indicator captures the number of illegal connections that have been
identified and regularised. This essentially forms the unauthorised
consumption within the system.
Percentage of illegal connections that have been identified and regularised to total
number of connections in water supply.
15. Water losses per
connection
Litres This indicator captures the quantity of water loss per connection, and is a
conventional performance indicator for NRW.
NRW losses per total number of connections in water supply per day
16. Real losses per service
connection per month per
meter (head) pressure
Cu m/
connection
/m/day
This indicator captures the quantity of water loss per connection, and it is a
useful indicator for comparing different areas of the same water utility, or
different utilities with systems operating at different pressure.
Real losses expressed in terms of daily volume of water lost per connection per
average meter of pressure
17. Water losses per mains
length
cum/km/
day
This indicator captures the quantity of water loss per length of trunk
network. This indicator is more useful to know the condition of the
network.
NRW losses to total length of main network, per day

34
Water supply Unit Description
Efficiency in service operations
18. Unavoidable Annual Real
Losses (UARL)
Index This indicator captures the losses that are unavoidable per year. This
indicator is used to know the lowest technically achievable real loss for a
well managed and well maintained system.
UARL is defined as the minimum losses expressed in terms of length of mains and
number of connections
19. Infrastructure Leakage
Index (ILI)
Index This indicator captures the unavoidable real losses that occur in the system.
It is an indicator of water supply system expressing the technical condition
of the system from point of view of water losses.
Ratio between the actual real losses and an estimate of the minimum real losses
that could be technically achieved for the system operating pressure, average
service connection length and service connection density
20. Annual cost of losses Rs This indicator captures the yearly production cost occurring due to losses
in quantity of water supplied. This indicator gives the annual production
cost of real losses.
Real losses in non‐revenue water (losses from source to consumer point) expressed
in terms of production cost
21. Total complaints in water
supply per 1,000 connections
per year
Ratio This indicator captures the complaints in water supply per 1,000 water
connections. This is an important indicator to understand the level of
service provided across cities.
Total complaints received per 1,000 water supply connections in a year
22. Complaints for pipe breaks
and leakages per 1,000
connections per year
Ratio This indicator captures the complaints for pipe breaks and leakages per
1,000 water connections. Along with city level comparison, it is an
important factor in non‐revenue water.
Total complaints received for pipe breaks and leakages that are recorded per 1,000
water supply connections in a year
23.Complaints for low
pressure per 1,000 connections
per year
Ratio This indicator captures the complaints for low pressure per 1,000 water
connections. Along with city level comparison, it is an important factor in
intermittent supply of water.
Total complaints received for low pressure that is recorded per 1,000 water supply
connections in a year
24. Complaints for water
quality per 1,000 connections
per year
Ratio This indicator captures the complaints for water quality per 1,000 water
connections. This is an important indicator to understand the level of
service provided across cities.
Total complaints received for water quality that is recorded per 1,000 water supply
connections in a year
25. Percentage of recruited
staff to sanctioned staff
% This indicator captures the number of staff that is recruited as a percentage
of the sanctioned staff in water supply.
Number of recruited staff as a percentage of sanctioned staff for water supply
operations
26. Total staff (regular and
contract) per 1,000 water
supply connections
Ratio This indicator captures the staffing ratio for each city. This is an important
indicator for comparisons across cities.
Total staff, including regular and contracted, employed in water supply per 1,000
water supply connections
27. Electricity expenditure as a
share of water production
Rs/Kl This indicator captures the expenditure of electricity incurred in daily
production of water supply.

35
Water supply Unit Description
Efficiency in service operations
Total expenditure on electricity on water supply services per day (total expenditure
during the year divided by number of days in the year) divided by average water
supplied per day in Kl
28. Unit cost of production of
water
Rs/Kl This indicator captures the O&M cost of water that is produced. This
indicator is relevant when coupled with electricity cost per production of
water, and also for city level comparisons.
O&M cost, excluding depreciation and loan interest repayment, in terms of
production of water, in Kl
29. Average revenue per
connection
Rs This indicator captures the average revenue charged to the consumer per
connection. This indicator is relevant in terms of the affordability aspect of
the consumer.
Average revenue per water connection as charged by ULB
30. Collection period for water
supply charges
Days This indicator captures the number of days required to collect charges
levied, and is relevant as it indicates delayed or faulty billings, and
inefficiencies in collection of charges.
Year‐end accounts receivable per total annual operating revenues per day
31. Billed arrears to total billed
demand
% This indicator captures the percentage of arrears for billed demand.
Percentage of billed arrears to total billed demand in water supply
Equity in service delivery
32. Population per
shared/community standpost
in slum settlements
Ratio This indicator captures the slum population with access to
shared/community standpost in slum settlements.
Ratio of population in slum settlements per shared/community standpost

36
Wastewater
Wastewater Unit Description
Access and coverage
1. % of inhabited municipal
area covered with sewerage
network
% This indicator captures the geographical area of the sewerage network with
respect to total area of the city. It is an important indicator in assessing the
coverage of sewerage connections in the city.
Percentage of inhabited municipal area covered by sewerage network to total area of
the city
2. Spatial coverage of
sewerage and sullage
network
% This indicator captures the geographical coverage of the wastewater
collection system, both sewerage and sullage. This is important to measure
as, in most cities, only sullage systems exist.
Percentage of inhabited municipal area covered by sewerage and sullage network, to
the total area of the city
3. Coverage of storm water
drainage network
% This indicator captures the extent of storm water drainage network in the
city.
Percentage of road length covered by storm water drainage network
Efficiency in service operations
4. Total complaints in
wastewater per 1,000
connections per year
Ratio This indicator captures the complaints in wastewater per 1,000 sewerage
connections. This is an important indicator to understand the level of service
provided across cities.
Total complaints received that is recorded per 1,000 sewerage connections in a year
5. Complaints for sewerage
blocks per 1,000 sewerage
connections per year
Ratio This indicator captures the complaints for sewerage blocks per 1,000
sewerage connections. Along with city level comparisons, it is important
factor in physical condition of the network.
Total complaints received for sewerage blocks per 1,000 sewerage connections in a
year
6. Complaints for
damaged/overflowing
manholes per 1,000 sewerage
connections per year
Ratio This indicator captures the complaints for damaged/overflowing manholes
per 1,000 sewerage connections. This indicator helps to assess infrastructure
conditions across cities.
Total complaints received for damaged/overflowing manholes per 1,000 sewerage
connections in a year
7. Complaints for
leakage/overflowing lines
per 1,000 sewerage
connections per year
Ratio This indicator captures the complaints for leakage/overflowing lines per
1,000 sewerage connections. Along with city level comparisons, it is
important factor in physical condition of the network.
Total complaints received for leakage/overflowing lines per ,1000 sewerage
connections in a year
8. Percentage of recruited
staff to sanctioned staff
% This indicator captures the number of staff that is recruited as a percentage of
the sanctioned staff in wastewater.
Number of recruited staff as a percentage of sanctioned staff for wastewater
operations
9. Total staff (regular and
contract) per 1,000
wastewater connections
Ratio This indicator captures the staffing ratio for each city. This is an important
indicator for comparisons across cities.
Total staff, including regular and contracted, employed in wastewater per 1,000
wastewater connections

37
Wastewater Unit Description
Efficiency in service operations
10. Unit cost of conveyance
and disposal of wastewater
Rs/Kl This indicator captures the O&M cost of wastewater collected and disposed.
O&M cost, excluding depreciation and loan interest repayment, in terms of
collection and disposal, in Kl
11. Average revenue per
connection
Rs This indicator captures the average revenue charged to the consumer per
connection. This indicator is relevant in terms of the affordability aspect of
the consumer.
Average revenue per wastewater connection as charged by ULB
12. Collection period for
wastewater charges
Days This indicator captures the number of days required to collect charges levied,
and is relevant as it indicates delayed or faulty billings, and inefficiencies in
collection of charges.
Total year end accounts receivable per total annual operating revenues per day
13. Billed arrears to total
billed demand
% This indicator captures the percentage of arrears for billed demand.
Percentage of billed arrears to total billed demand in wastewater
14. Incidence of water
logging/flooding
No This indicator captures the incidence of water logging/flooding in the city.
Number of times water logging is reported in a year at flood prone points within the
city
Equity in service delivery
15. Population per toilet seat
in community toilets in slum
settlements
Ratio This indicator captures the access of toilets to the slum population, in terms
of number of toilet seats. In the absence of appropriate individual toilet
coverage, it is important to assess whether the city has provided community
toilets as per standards.
Ratio of total number of toilets seats to slum population, in ‘000’s

38
Solid Waste Management
SWM Unit Description
Efficiency in service operations
1. Total complaints in solid
waste per 1,000 household
Ratio This indicator captures the complaints in SWM per 1,000 households.
Total complaints received in SWM that is recorded per 1,000 households in a year
2. Complaints related to
garbage collection per 1,000
households per year
Ratio This indicator captures the complaints for garbage collection per 1,000
households. Along with city level comparisons, it is an important factor in
quantity of waste that is collected.
Total complaints received for garbage collection that is recorded per 1,000 households in
a year
3. Complaints related to
street sweeping per 1,000
households per year
Ratio This indicator captures the complaints for street sweeping per 1,000 households.
Along with city level comparisons, it is an important factor in quantity of waste
that is collected.
Total complaints received for street sweeping per 1,000 households in a year
4. Complaints related to
odour/nuisance
Ratio This indicator captures the complaints for odour or nuisance due to dumpsites,
transportation, etc per 1,000 households.
Total complaints received for odour or nuisance due to dumpsites, transportation, etc,
per 1,000 households in a year
5. Percentage of recruited
staff to sanctioned staff
% This indicator captures the number of staff that is recruited as a percentage of
the sanctioned staff in SWM.
Number of recruited staff as a percentage of sanctioned staff for SWM
6. Total staff (regular and
contract) per 1,000
households
Ratio This indicator captures the staffing ratio for each city. This is an important
indicator for comparisons across cities.
Total staff, including regular and contracted, employed in SWM per 1,000 households
7. Total sweepers per km of
road length swept
Ratio This indicator captures the staffing ratio for each city. This is an important
indicator for comparisons across cities.
Number of sweepers per road length swept (in km)
O&M cost of collection of municipal solid waste, excluding depreciation and loan
interest payment
8. Average revenue per
connection
Rs This indicator captures the average revenue charged to the consumer per
connection. This indicator is relevant in terms of the affordability aspect of the
consumer.
Average revenue per household as charged by ULB
9. Collection period for
SWM charges
Days This indicator captures the number of days required to collect charges levied,
and is relevant as it indicates delayed or faulty billings, and inefficiencies in
collection of charges.
Year end accounts receivable per total annual operating revenues per day
10. Billed arrears to total
billed demand
% This indicator captures the percentage of arrears for billed demand.
Percentage of billed arrears to total billed demand in SWM

39
Annexure
Performance Assessment System Questionnaire
The Performance Assessment System (PAS) questionnaire captures basic information from the ULBs
for estimating both key performance indicators and local action indicators. It includes both
quantitative and qualitative questions related to all three sub‐sectors (water supply, wastewater and
solid waste management) as well as cross cutting aspects related to finance, staffing, consumer
grievance redressal and service levels in slum settlements.
The questionnaire is developed as an excel workbook with in‐built validation checks as well as
appropriate links to generate key performance and local action indicators. It also generates reliability
scores for all key indicators. Detailed guidelines have been developed for the use of this questionnaire
at the local level as a part of the Operations Manual.

Performance Assessment System for Urban Water Supply and
Sanitation (PAS for UWSS)
Key Contacts
Department Heads Name Designation
Phone
No. E‐Mail
General Admin
Water Supply
Sewerage
Solid Waste Management
Urban Community Development
(UCD)
Accounts
Tax Superintendent
Health Officer
ULB Seal
Signature of ULB Commissioner/ Chief Officer
Name of ULB
Address
District
State
Class of ULB
Mayor/
President of ULB
Commssioner/
Chief Officer of ULB
Telephone no
Fax no
Email ID
Website
Data provided as on March 2009

Performance Assessment System for UWSS
Performance Assessment System for Urban Water Supply and
Sanitation
(PAS for UWSS)
Contents
Section Data sheets
Page
No
I Population and Area 1
II Water Production, Storage and Distribution 2‐4
III Water Connections 5‐6
IV Water Quality 7
V Sanitation, Waste Water and Storm Water Drainage 8‐10
VI Solid Waste Management 11‐12
VII Information on Slums 13
VIII Consumer Grievance Redressal 14
IX Staff and Management 15
X Finance, Demand Collection Balance (DCB) Tables and Tariffs 16‐18
Appendix‐1 List of Formats 19
Appendix‐2 List of Maps 20

Performance Assessment System for UWSS Date:
I. Population & Area 1 Demography of ULB
Year Population Number of
Households
Area (sq. km) Source of
Information
Methodology used for
estimation of current
population
1991
2001
Current year of latest available population estimate1
1 Latest available estimates of population, HH and area, as given by ULB, are to be noted. This should be total population, including the expanded/ merged areas
after 2001. Note the methodology for estimation of current population in the last column
1.1 Average daily floating population in the ULB2
2The daily floating population should exclude population due to special events, festivals,fairs, etc
2 Expansion of ULB limits from 2001 to 2008 ‐ 09 (Insert additional rows/ sheets, if required)
2.1 Have any areas been added to the ULB after 2001?(Y/N) If No, go to QN 3
2.2 How many areas have been added?
2.3 Names of areas added to
municipal limits3
Year added Census Population
of added areas
(2001)
Current Admin
Ward No
Total 0
Source of Information:
3 Mark newly added areas on ULB map
3 Demography by wards (Insert additional rows/ sheets, if required)
3.1 What is the spatial unit used for records of population/ HHs?(1/2/3/4)* * 1: Admin ward, 2: Election ward, 3:
Property tax ward.4: Others, specify 3.2 Total number of wards for population and households in the city
3.3 Ward No4 Population
(2009)
No of households**
(2009)
** Households as defined in census
Total 0 0
Source of Information:
4 Mark the ward boundaries on the map or collect map 4 Properties by wards (Insert additional rows/ sheets, if required)
4.1 What is the spatial unit used for records of properties?(1/2/3/4)* * 1: Admin ward, 2: Election ward, 3:
Property tax ward.4: Others, specify 4.2 Total number of wards in the city for recording properties
4.3 Ward No5 Total no of
properties6
(2009)
No of residential
properties***
(2009)
*** Properties as defined in property tax records
Total 0 0
Source of Information:
5Mark the ward boundaries on map or collect map
6This should include all types of properties, including properties exempted from property tax Respondent Name: Page no 1/20
Contact Details: Enumerator Name

Performance Assessment System for UWSS Date:
II. Water Production, Storage and Distribution ‐ a
1 Water Sources for Municipal Supply
Sources Average Daily volume (in MLD) If B or C, specify
method of
estimation
(1/2/3/4)
Are automated
systems used at
source?*
(Y/N)
* Computerised systems
used for monitoring daily
production volumes at
source.
Metered Not
Metered
( C )
Functional
(A)
Non‐Functional
(B)
Groundwater
Surface water (Own
source)
Bulk purchase‐ Raw
water
Bulk purchase‐Treated
water
Other sources2
Total 0.0 0.0 0.0 N
Source of Information: 1 1: Level measurement backed by periodic assessment through portable flow meters, 2: Level measurement, with no calibration, 3: Using pump efficiency and
daily record of number of hour; records maintained, 4: No records are maintained
2Other sources include water procured through tankers from private bore wells, desalination, rainwater harvesting, etc
1.1. Augmentation of water sources from projects to be commissioned in the next three years (2009‐2012)
1.1.1.
Does the ULB have any projects/ schemes that will be commissioned over the next 3 years to
augment present water supply? (Y/N)3
3e.g. from sources such as irrigation
scheme, wells
1.1.2. If Yes, capacity addition/ augmentation to present supply (MLD)
Source of Information:
2 Ground Water Source (Insert additional rows/sheets, as required)
2.1 Does the ULB use any ground water sources? (Y/N) If No go to QN 3
2.2 Number of wells used for ground water supply
2.3 Name of
well4
Type of well
(Tube well/
Open well)
Depth of
well
(m)
Avg depth of
ground water
(m)
Average daily
quantity of
water drawn
(MLD)
Method of measurement
of quantity of water
drawn
(1/2/3/4/5/6)5
Total #DIV/0! #DIV/0! 0
Source of Information:
4 Mark location of tube wells on map
5 1: Computerised system with flow meters, 2: Manual records with flow meters, 3: Level measurement backed by periodic assessment through portable flow
meters, 4: Level measurement, with no calibration, 5: Using pump efficiency and daily record of number of hours; records maintained, 6: as said by ULB, no
records
3 Surface Source (Insert additional rows/sheets, as required)
3.1 Does the ULB use its own surface water sources? (Y/N) If No go to QN 4
3.2 Number of surface sources used for water supply
3.3 Name of source Type of
source6
Type of
transmission line
(Closed conduit/
Open channel)
Distance
from
source to
city
(km)
Average daily
quantity of water
drawn
(MLD)
Method of
measurement of
quantity of water
drawn
(1/2/3/4/5/6)7
Total 0
Source of Information:
6 Type of source can be Dam, River, Lake, etc
7 1: Computerised system with flow meters, 2: Manual records with flow meters, 3: Level measurement backed by periodic assessment through portable flow
meters, 4: Level measurement, with no calibration, 5: Using pump efficiency and daily record of number of hours; records maintained, 6: as said by ULB, no
records
Respondent Name Page no: 2/20
Contact Details Enumerator Name:

Performance Assessment System for UWSS Date:
II. Water Production, Storage and Distribution ‐ b
4 Treatment Plant details (Insert additional rows/sheets, as required)
4.1 Does the city have Water Treatment Plant? (Y/N)
If No go to QN 5
4.2 If Yes, number of water treatment plants used by the ULB
4.3 Water
Treatment
Plant No
(WTP No)
Installed
capacity
(in MLD)
Is the treatment
plant functional?
(Y/N)
If yes, no of
years of
operation
Average daily
volume treated
(MLD)8
Type of treatment
(1/2)9
Total 0 N 0
Source of
Information:
8 Average of daily quantities of the last month are to be noted here.
9 1: Only Chlorination, 2: Chlorination and Filtration
4.4 What is the basis of measurement of volume treated at the WTPs? (1/2/3/4)*
*1:Flow meters with automated systems,2: Flow meters with manual records,3: Pump operation/Level measurement details with manual
records,4:as said by ULB(no records)
4.5 Are records of daily quantity of water treated maintained? (Y/N)
4.6 Are records of pump operation details at the treatment plant maintained? (Y/N)
4.7 Are automated systems linked to GIS database? (Y/N)
5 Water Distribution Stations (Insert additional rows/sheets, as required)
5.1 Total number of WDS in the ULB ** 1: Admin ward, 2: Election ward, 3: Property tax
ward.4: Others, specify 5.2 Which wards are used to demarcate coverage by WDS? (1/2/3/4)**
5.3 Water
Distributio
n Station
Name
(WDS)10
Type of WDS:
(Sump+ ESR/
Sump+ ESR+
direct pumping/
Direct pumping/
Sump/ ESR)
WDS
Storage
Capacity
(ML)
Wards (numbers) served
by the WDS11
Population
served by
the WDS
Average
daily
quantity
of water
supplie
d
(MLD)12
Hours of
supply
from
WDS to
consumer
end12
Averag
e no. of
days of
supply
in a
month12
Average
pressure of
water
supplied (m) Wards
covered
partially
Wards
covered fully
Total 0 0 0 0 0 0
Source of
Information:
10 Mark the area served by each WDS on a map
11Wards mentioned here should be the same as
given in Sheet I, as appropriate.
12Average of daily values of the last month are to be noted here.
5.4 Does the ULB supply water to bulk and/or large industrial consumers?(Y/N)
If Yes, quantity of water supplied (MLD)
5.5 Basis of estimation of quantity of water supplied from WDS (1/2/3/4/5/6)***
*** 1: Computerised system with flow meters, 2: Manual records with flow meters, 3: Level measurement backed by periodic assessment through portable
flow meters, 4: Level measurement, with no calibration, 5: Using pump efficiency and daily record of number of hours, 6: as said by ULB
5.6 Basis of estimation of population served for each WDS (1/2)***
*** 1: Past trends/ surveys, 2: as reported by the ULB
5.7 Does the ULB have automated systems(e.g. SCADA)to monitor quantity, hours of supply, pressure to consumers?(Y/N)
If No, are manual records of hours of supply at consumer end maintained? (Y/N)
5.8 Are there any variations in hours/days of water supply over different seasons? (Y/N)
If yes, average quantity of total supply in summer months (MLD)
If yes, average hours of supply in summer months (hrs)
Respondent Name Page no 3/20
Contact Details Enumerator Name

Performance Assessment System for UWSS Date:
II. Water Production, Storage & Distribution ‐ c
6 Sources of Water Supply for Unserved Areas in ULB and/or Outgrowths
6.1. Does ULB have areas which do not have piped municipal supply? (Y/N) If No go to QN 6.2
Mark areas without piped municipal supply on
map
6.1.1. If Yes, source of water supplied to these areas within its limits? (1/2/3)13
13 1: Municipal supply through non‐piped means, 2: Private supply by private providers, 3: by households themselves
6.1.2. Quantity of water supplied in non‐piped areas (MLD)
6.2 Are there outgrowths14 with significant population outside ULB boundary? (Y/N) If No go to QN 7
Mark outgrowths on
map 14 Outgrowths include contiguous areas outside ULB limits, like railway colonies, revenue villages, etc.
6.2.1 If Yes, does the ULB provide water supply to these outgrowths? (Y/N)
6.2.2 If Yes, quantity of water supplied to outgrowths (MLD)
6.2.3 If municipal supply is not provided, source of supply for outgrowths (1/2)15
15 1: Supply by private providers, 2:by households
themselves
6.2.4 Estimated population of the outgrowths
7 Water Supply Network
Total length of trunk main (km) Mark the water supply network on map including trunk mains,
transmission lines and distribution mains
Total length of transmission main (km)
Total length of distribution network (km)
Total length of road network in city (in km)
Total area under water distribution network (sq.km)
8 Unauthorised consumption details
8.1 Has any survey been conducted by the Municipality to assess unauthorised connections and/or consumption?(Y/N)
If No, go to QN 8.5
8.2 No. of illegal connections based on survey
8.3 % of unauthorised water quantity to total supply based on survey
8.4 No. of illegal connections regularised
Go to QN 9
8.5 Number of illegal connections as estimated by ULB staff
8.6 Unauthorized use of water as % to total supply as estimated by ULB staff
9 Audits for water balance and electricity
9.1 Has an energy audit been carried out by the ULB? (Y/N) If yes, collect a copy of the report 9.1.1 If yes, has is it been implemented? (1,2,3)16 16 1: Fully, 2: Partially, 3: Not at all 9.2 Has a water audit been carried out by the ULB? (Y/N) If yes, collect a copy of the report 9.2.1 If yes, has is it been implemented?(1,2,3)16 16 1: Fully, 2: Partially, 3: Not at all 9.3 Does the ULB do a pre‐audit (technical) of water electricity bill regularly?(Y/N) If yes, collect copy of report
Respondent Name Page no: 4/20
Contact Details Enumerator Name

Performance Assessment System for UWSS Date:
III. Water Connections ‐ a
1 Number of connections: ULB level
1.1 Does the ULB maintain and update records of connections for water supply? (Y/N)
1.2 If Yes, how does the ULB maintain records? (1,2,3)*
* 1: connection registers, 2: as part of property tax registers, 3: Water billing system
1.3 Number of connections by type
Type of connection Number of
connections
Residential
Industrial
Public taps/ Stand
posts
Others1
Total 0
Source of Information:
1Others include commercial, institutional, municipal, government agency
connections
1.4 Are computerised systems used for data related to water connections? (Y/N)
1.5 If Yes, is GIS database of properties and connections used by ULB? (Y/N)
1.6 Exempted connections/ properties for water charges/ taxes
1.6.1 No. of connections that are exempt from property tax and/or water bill or tax2
2Exempted connections could be for charitable institutions, gardens, fountains, municipal building, fire fighting department,etc
1.6.2
Estimated total consumption per day for exempted connections/ properties (litres per day per
connection)
2 Consumption quantities‐ metered connections
2.1 Does the ULB have metered connections? (Y/N)
If No, go to QN 3
2.2 If Yes, are records of metered connections maintained? (Y/N)
If No, go to QN 3
2.3 If Yes, are records of metered connections that are functional maintained? (Y/N)
2.4 If Yes, percentage of meters that are functional?
2.5 If Yes, does ULB have automated meter reading system at consumer end? (Y/N)
2.6
If yes, is the process of installation of new water connections, new meters, and generation of water
bills interlinked?(Y/N)
2.7 Type of connection % of metered
connections
% of functional metered
connections
Quantity
consumption
(ML per yr)
Residential
Industrial
Public taps/ Stand posts
Others3
Total 0 0 0
Source of Information:
3Others include commercial, institutional, municipal, government agency connections
3 Estimated consumption per connection ‐ for unmetered connections and metered connections that are not functional
3.1 Size of connection No. of connections Estimated consumption
(litres per day per
connection)**
Estimated
consumption
quantity
(ML per year)
** Estimated consumption quantities are to be
filled where information on metered
connections is not available.
1/2ʺ 0
3/4ʺ 0
1ʺ 0
>1ʺ 0
Total 0 0 0
Source of Information:
3.2 Basis of estimation of consumption per connection (1/2/3) 4
4 1: From regular periodic survey by the ULB, 2:From spot survey, 3: As reported by the ULB without backup surveys
Respondent Name Page no 5/20
Contact Details Enumerator Name:

Performance Assessment System for UWSS Date:
III. Water Connections ‐ b
4 Households served by water connections at ULB level
4.1 Are records on HHs with individual water connections maintained by the ULB? (Y/N)
If No, go to QN 6
4.2 If Yes, total number of households with individual water connections
4.3 If Yes, how does the ULB maintain records?(1/2/3)1
1 1: connection registers, 2: as part of property tax registers, 3: Water bills
4.4 If Yes, is this data updated regularly? (Y/N)
5 Ward wise households served by connections
5.1 Is there ward wise information/estimates on number of HHs with individual water connection?(Y/N)
If No, go to QN 6. If Yes, skip QN 6
5.2
If Yes, which wards are used for details on households served by water connections as provided in
QN 5.4?(1,2,3,4)*
* 1: Admin ward, 2: Election
ward, 3: Property tax ward.4:
Others, specify. 5.3 If Yes, number of wards for which details on households with connections is given in QN 5.4
5.4 Ward No Total no of HHs with
individual water connection
Total no of HHs
Total 0 0
Source of Information:
5.5 Is data regarding HHs with connection regularly (quarterly/annually) updated by ULB?(Y/N)
6 Ward wise number of residential water connections
6.1 Is there ward wise information or estimates on number of residential water connections?(Y/N)
If No, go to QN 7
6.2
If Yes, which wards are used for details on residential water connections as given in QN
6.4?(1,2,3,4)*
* 1: Admin ward, 2: Election
ward, 3: Property tax ward.4:
Others, specify. 6.3 Number of wards for which details on residential water connections is given in QN 6.4
6.4 Ward No No. of residential water
connections
Total no of HHs
Total 0 0
Source of Information:
7 Estimated Households served per connection
7.1 Does the ULB have residential connections serving more than 1 HH per connection? (Y/N)4
4This may apply to ULBs with multi‐storied apartments, where one connection serves many HHs
If No go to Next Worksheet on Water Quality
7.2 Size of residential
connection
Estimated no of HH served
per connection
No. of residential
connections
Total no. of estimated HHs
served per connections
1/2ʺ 0
3/4ʺ 0
1ʺ 0
>1ʺ 0
Total 0
Source of Information:
Respondent Name Page no: 6/20
Contact Details Enumerator Name:

Performance Assessment System for UWSS Date:
IV. Water Quality
1 For Surface & Ground sources : Residual Chlorine, Bacteriological and TDS tests
Sample location Residual Chlorine tests Bacteriological tests TDS tests
No of tests
conducted per
year
No of tests that
met the standards
per year
No of tests
conducted per
year
No of tests
that met the
standards per
year
No of tests
conducted per
year
No of tests that
met the
standards per
year
At the outlet of WTP/
bore wells
At intermediate (ESR)
points
At consumer end
Total 0 0 0 0 0 0
Source of Information:
2 For Ground Sources: Fluoride testing
Sample location Fluoride tests
No of tests conducted
per year
No of tests that met the
standards per year
At source
At consumer end
Total 0 0
Source of Information:
2.1 Average values of TDS at city level (ppm)
2.2 Average value of Fluoride at city level (ppm)
2.3 Are chemical tests conducted by the ULB? (Y/N)
2.4 If Yes, Give details on parameters that were tested and period of tests conducted
3 Information recording system for water quality
3.1 Are records of tests conducted maintained by the ULB? (Y/N)
3.2 If Yes, are records of tests computerised? (Y/N)
3.3 If Yes, are computerised records linked to GIS database? (Y/N)
3.4 Is sampling regimen for tests at consumer end well documented and practiced? (Y/N)
3.5 Are audits for water quality conducted?(1/2/3/4)*
* 1: Independent and regular audits, 2: Independent but occasional/ Ad‐hoc audit, 3: Periodic internal audit, 4: No audits conducted
Respondent Name: Page no 7/20
Contact Details Enumerator Name:

Performance Assessment System for UWSS Date:
V. Sanitation, Waste Water & Storm Water Drainage ‐ b
5 Ward wise households with individual toilets
5.1 Is there ward wise information or estimates on number of HHs with access to individual toilets?(Y/N)
If No, go to QN 5.5
5.2
If Yes, which wards are used for details on households with access to individual toilets as provided
in QN 5.4? (1,2,3,4)9
9 1: Admin ward, 2: Election
ward, 3: Property tax ward.4:
Others, specify. These should
match with ward details on
Sheet 1
5.3
Number of wards for which details on households with access to individual toilets is provided in QN
5.4
5.4 Number of households with access to individual toilets (insert additional rows/sheets if required)
Ward No Total no of HHs with access to
individual toilets
Total no of
HHs
Total 0 0
Source of Information:
5.5
Is there ward wise information or estimates on number of residential properties with access to
individual toilets?(Y/N)
If No, go to QN 6
5.6
If Yes, which wards are used for details on residential properties with access to individual toilets as
provided in QN 5.7? (1,2,3,4)10 101: Admin ward, 2: Election
ward, 3: Property tax ward.4:
Others, specify. These should
match with ward details on
Sheet 1
5.7 Number of residential properties with access to individual toilets (insert additional rows/sheets if required)
Ward No Total no of residential
properties with access to
individual toilets
Total no of
residential
properties
Total 0 0
Source of Information:
6 Ward wise households with sewerage connections
6.1 Is there ward wise information or estimates on number of HHs served per connection?(Y/N)
If No, go to QN 7
6.2
If Yes, which wards are used for information on households served by sewerage connections as
provided in QN 6.4? (1,2,3,4)11 111: Admin ward, 2: Election ward,
3: Property tax ward.4: Others,
specify. These should match with
ward details on Sheet 1
6.3 Number of wards used for details on households by sewerage connections as provided in QN 6.4?
6.4 Ward wise households served by sewerage connections (insert additional rows/sheets if required)
Ward No Total no of HHs with individual
sewerage connection
Total no of HHs
Total 0 0
Source of Information:
7 Ward wise Residential sewerage connections
7.1 Is there ward wise information or estimates on number of residential sewerage connections?(Y/N)
If No, go to QN 8
7.2
If Yes, which wards are used for information on residential sewerage connections as provided in
QN 7.4? (1,2,3,4)12 121: Admin ward, 2: Election ward,
3: Property tax ward.4: Others,
specify. These should match with
ward details on Sheet 1
7.3 Number of wards for which details on residential sewerage connections is provided in QN 7.4
7.4 Number of residential sewerage connections by wards (insert additional rows/sheets if required)
Ward No No of residential sewerage
connections
Total no of HHs
Total 0 0
Source of Information:
Respondent Name: Page no: 9/20
Contact Details: Enumerator Name:

Performance Assessment System for UWSS Date:
V. Sanitation, Waste Water & Storm Water Drainage ‐ c
8 Areas without sewerage network
8.1 Does the ULB have areas without piped sewerage network? (Y/N)
If No, go to QN 9
8.2 Area without sewerage network (in sq. km)13 13Mark areas without sewerage network on map
8.3 Means of disposal of sewage in these areas (1/2/3)14 141: Septic tanks, 2:Open drains, 3: Soak pits
8.4
If means of disposal is by septic tanks, agency for cleaning septic
tanks?(3/4)15 15 3: ULB, 4:Private agency
8.5 Location of disposal of septic tank waste (mark on map)
9 Sewage Treatment Plants (insert additional rows/ sheets if required)
9.1 Does the ULB have pumping stations?(Y/N)
9.2 If Yes, total number of pumping stations in the ULB
Mark locations of all pumping stations on map 9.3 Does the ULB have Sewage Treatment Plants?(Y/N)
If No, go to QN 11
9.4 If Yes, total number of STPs in the ULB Mark locations of all STPs on map
9.5 Details of STPs
Name of
STP
Installed
Capacity of
STPs
(MLD)
No of sewage
zones/ wards
covered
Location in
Ward/
outside city
Is inflow
meter
present?
(Y/N)
Daily avg
inflow
(MLD)
Type of
Treatment:
Primary (P),
Secondary (S),
Tertiary (T)
Is outflow
meter
present?
(Y/N)
Water conveyed
for recycling/
reuse after
treatment
(MLD)
Total 0 N 0 0 N 0
Source of Information
9.6 Are log records of treatment plant operations maintained?(Y/N)
9.7 If No, is quantity of waste water collected estimated on the basis of inflow channel dimensions? (Y/N)
9.8 Are automated systems adopted for monitoring waste water treatment plant operations? (Y/N)
9.9 Are automated systems linked to GIS database? (Y/N)
10 Quality of waste water treatment
10.1 Effluent samples tested (number per year)(BOD , COD, Suspended solids, etc)
10.2 Effluent samples passed (number per year)(BOD , COD, Suspended solids, etc)
10.3 Are all parameters (BOD , COD, Suspended solids, etc) for waste water treatment tested? (Y/N)
10.4 Is sampling regimen for waste water samples well documented and practiced? (Y/N)
10.5 If yes, are the records of sampling regimen computerised? (Y/N)
10.6 If yes, are the records linked to GIS database? (Y/N)
10.7 Are audits for waste water quality conducted?(1/2/3/4)*
* 1: Independent and regular audits, 2: Independent but occasional/ Ad‐hoc audit, 3: Periodic internal audit, 4: No audits conducted
11 Untreated waste water
11.1 Location of Sewage Outfalls for Untreated Waste Water (Admin ward no./ Outside city)16
11.2 Estimated quantity of untreated waste water disposed (MLD)
11.3 Basis of estimation of quantity of untreated waste water (1/2)17
16Mark location of sewage outfalls on map (marking need not be to
scale) 171: Based on outfall channel dimensions, 2: as reported by ULB without any back up
12 Storm water drainage (SWD) network
12.1 Type of network 12.2 Flooding incidents in the ULB (insert additional sheets if required)
At ULB level Total Length
of SWD
(km)
Discharge
point
Name of flooding
locations18
Frequency
(no/yr)
Period of
water
flooding
(hrs)
Reason of
flooding
(1/2/3)*
Under‐ground
Surface: Covered
Surface:
Uncovered
Total 0 Total 0 #DIV/0!
Source of Information: Source of Information:
* 1: Choked drains, 2: low lying areas, 3: Others (specify)
18Mark locations of flooding on map
12.3 Are records of location of flooding points/ duration of floods maintained by ULB?(Y/N)
Respondent Name: Page no: 10/20
Contact Details: Enumerator Name:

Performance Assessment System for UWSS Date:
VI. Municipal Solid Waste Management ‐ a
1 Generation of Solid Waste in ULB
1.1 Total waste generated in ULB (TPD)* * Tonnes per day
1.2 Basis of estimation of waste generated (1/2/3/4)1
1 1: Sample survey (seasonal variations in quantity also captured), 2: spot surveys to validate norms(MSW 2000), 3: per capita waste
generation, 4: as said by ULB
1.3 If estimation is based on per capita norms, what is the rate of generation used?(gms/capita/day)
2 Primary Collection at ULB level
2.1 Total no of residential HHs served by door to door collection of solid waste
2.1.1 Number of HHs provided with two bins system for bio‐degradable and recyclable specified
2.1.2 Are bins provided: 1. by HHs at their cost, or 2. by ULB? (1/2)
2.2 Total no of establishments2 served by door step collection
2.3 Total no of establishments in the city
2.4 What is the source of information of primary collection of solid waste? (1/2/3/4/5)3
2Establishments include offices, institutions, hotels, restaurants, and other commercial establishments
31: GIS database on MSWM, 2: Computerised records, 3: Manual records(property tax/connection registers/ billing records), 4: Surveys, 5: as reported by
ULB; no records
3 Primary Collection of Solid Waste: Residential Households at Ward level
3.1. Is there ward wise information or estimates on number of HHs served? (Y/N)
If No, Go to QN 4
3.2
If Yes, which wards/ zones are used for details on households served by primary collection as provided in QN
3.4? (1,2,3,4)4
4 1: Admin ward, 2: Election ward, 3: Property tax ward, 4: Others, specify. These should match with ward details on Sheet
1
3.3 If Yes, number of wards for which details on HHs served by primary collection is provided in QN 3.4
3.4 Households served by door to door collection (add rows/ sheets if required)
Ward no Number of HHs
served by primary
collection
Total
number of
HHs
Agencies
involved
(1/2/3/4)5
Total 0 0
Source of Information:
51: ULB, 2: CBO or Sakhimandal, 3: Private contractors, 4: Resident Welfare Associations
4 Street Sweeping Details
4.1. Total length of streets swept daily by mechanical means (km)
4.2. Total length of streets swept daily by manual means (km)
4.3. No. of sweepers deployed (No)
Source of Information:
5 Segregation of waste
5.1 Is waste collected in a segregated manner through door to door services? (Y/N)
If No, go to
QN 5.4
5.2 If Yes, is waste collected & transported in separate vehicle trips to treatment/ disposal site?(Y/N)
5.2.1 If Yes, quantity of bio‐degradable waste received at treatment/disposal site (TPD)
5.2.2 If Yes, quantity of recyclable waste received at treatment/disposal site (TPD)
5.3
Quantity of waste received at disposal site as non recyclable, non bio‐degradable waste and residue &
rejects (TPD)
5.4 Quantity of waste taken away by recyclers from intermediate points (TPD)
6 Treatment Plant details
6.1 Does the ULB have treatment plants? (Y/N) If No, go to
QN 7;
Skip QN 8 6.2 If Yes, is weigh bridge present near the treatment facility? (Y/N)
7 Mode of disposal for MSWM
7.1 Is mode of disposal of MSW through open dumping? (Y/N)
7.2 Is mode of disposal of MSW through scientific engineered landfills/compliant sites? (Y/N)
7.3 Is mode of disposal of MSW through open dumping and compliant sites? (Y/N)
Respondent Name Page no: 11/20
Contact Details Enumerator Name

Performance Assessment System for UWSS Date:
VI. Municipal Solid Waste Management ‐ b
8 Treatment/ Processing facility
8.1 Are log records of daily intake of waste quantity, based on measurement at weighbridge, maintained? (Y/N)
8.1.1 If Yes, are computerised systems used for monitoring operations at treatment plant? (Y/N)
8.1.2 If Yes, are monitoring systems linked to GIS database? (Y/N)
8.2 If No, is quantity of waste intake estimated based on vehicle trips to treatment plant? (Y/N)
8.3 Type of treatment Installed capacity
(TPD)
Quantity of waste
input (TPD)
Quantity of recovered
end products (TPD)
Composting
Vermi‐composting
Community level composting
RDF
Waste to energy
Others, specify
Total 0 0 0
Source of Information:
8.4 Quantity of waste rejected after treatment (e.g., inert matter) (TPD)
8.5 Are there any formal recycling facilities in the ULB? (Y/N)
8.6 If yes, capacity of the facility(TPD)
9 Existing system of disposal of MSW
9.1 Open dumps: General details
9.1.1 Name of open
dumps*
Distance from
the city (km)
Area
(Ha)
Remaining age
of landfill (yrs)
Does ULB pay tipping fee for
disposing waste rejects?6 (Y/N)
If yes, to whom
is it paid
Tipping fee
(Rs/ton)
Source of Information:
* Mark location of open dumps on map 6 This is applicable in the case where the disposal site is operated by a private operator
9.1.2 Open dumps: Details on waste disposed
Name of open
dumps
Capacity
(Tonnes)
Quantity of
waste received
(TPD)
Is weighbridge
present?
(Y/N)
Are log records
maintained?
(Y/N)
If No, Basis
of
estimation7
7 1: based on vehicle trips, 2: as
said by ULB
Total 0 0 N N
Source of Information:
9.1.3 Are computerised systems used for monitoring operations at disposal site? (Y/N)
9.1.4 If yes, are monitoring systems linked to GIS database? (Y/N)
9.2 Compliant/ Scientific engineered landfills
9.2.1 Name of compliant/
scientific engineered
landfill8
Area
(Ha)
Remaining age
of landfill (yrs)
Capacity
(Tonnes)
Quantity of
waste received
(TPD)
Is
weighbridge
present? (Y/N)
Are log records
maintained?(Y/
N)
If No, Basis
of
estimation
Total 0 0 N N
Source of Information:
8As per MSW Rules 2000, Mark location of landfills on map
9.2.2 Are computerised systems used for monitoring operations at landfill site? (Y/N)
9.2.3 If yes, are monitoring systems linked to GIS database? (Y/N)
10 Transportation of Solid Waste (Insert additional rows/sheets if required)
10.1 Are records of daily trips to treatment/ disposal site maintained? (Y/N)
10.2 Details on trips of waste transportation vehicles
Type of vehicle Number Capacity (T) Trips/ Day Tons/ Month
Lorries/ Trucks 0
Tractor trailers 0
Compactors 0
Tipper trucks 0
Dumper placers 0
3‐wheeler auto tippers 0
Others (Cycle Rickshaws/Bullock carts, etc) 0
Source of Information:
Respondent Name: Page no: 12/20
Contact Details: Enumerator Name:

Performance Assessment System for UWSS Date:
VII. Information of Slums
1 General Information
1.1 Total number of slum settlements in the ULB1 1 Mark settlements on map
Of total slums, Number of notified slums in the ULB
1.2 Number of slum settlements on public land
1.3 Total no of HHs in slum settlements
1.4 Total population in slum settlements
1.5 Total no. of BPL families in the ULB
2 Services in slums
2.1 Number of individual water connections
2.2 Number of group connections
2.3 Number of stand posts
2.4 Number of individual toilets
2.5 Number of seats in pay‐n‐use toilets (functional toilets)
2.6 Number of seats in community toilets (functional toilets)
2.7 Number of sewerage connections
2.8 Number of slum HHs served by primary collection
Source of Information:
3 Information systems for slums
3.1 What is the source of information for QN 1? (1/2/3/4)2
3.2 What is the source of information for QN 2? (1/2/3/4)2
2 1: Records, 2: Survey of all slums, 3: past surveys (more than 5 years), 4: as told by ULB; no records.
3.3 If records are maintained for slum information, how frequently are they updated? (1/2/3)3
3 1: Annually, 2: Occasionally (once in 3‐5 yrs), 3: No updation
3.4 Do records provide settlement level details? (Y/N) If Yes, attach formats
3.5 Do records provide household level details? (Y/N) If Yes, attach formats
3.6 Is the slum information computerised? (Y/N)
3.7 If Yes, collect data on slum separately from ULB
4 Ongoing/ Completed Projects or schemes related to UWSS for slums in the ULB (Insert additional rows/ sheets as required)
Name of program/
scheme for slum related
activities1
Year of
inception of
program
Duration of
program
(no. of years)
Brief Description of program (in terms of
infrastructure and services provided)
Source of Information:
1 Nirmal Gujarat, IHSDP, BSUP, MSNA, Other programs
5 List the major NGOs and/ or CBOs working in slums in the ULB
Respondent Name: Page no: 13/20
Contact Details: Enumerator Name:

Performance Assessment System for UWSS Date:
VIII. Consumer Grievance Redressal
1 Citizensʹ Charter
1.1. Does the ULB have a citizen charter ? (Y/N)
1.1.2 If yes, is it displayed/ disseminated to the citizen? (Y/N)1
1 Collect copy of the citizen charter of the ULB
2 Means of making complaints
Means Y/N Number of complaints (2009)
In person
Letter
Telephone
SMS
E‐mail
Total 0
Source of Information:
2.1 Are complaints received through above means recorded? (Y/N)
3 Service wise complaints
Service Average number of complaints
received monthly
Number of complaints
redressed monthly*
* Complaints redressed as per standards mentioned in
the citizen charter
Water supply
Waste water
SWM
SWD
3.1 Does the ULB maintain records on complaints received and redressed? (Y/N)
3.2 If Yes, is the complaint systems computerised? (Y/N)
3.3 If Yes, are the complaint redressal systems linked to GIS database? (Y/N)
3.4 What are the major complaint areas?
3.4.1 Service Type of complaint2 Number of
complaints
received monthly
Number of
complaints
redressed monthly*
* Complaints redressed as per
standards mentioned in the citizen
charter
Water supply
Non‐ availability of water
Low water pressure
Contaminated water
Pipe breakage/leakage
Others (specify)
Total 0 0
Waste water
Sewer blocks
Overflowing manholes
Sewer pipe breakage
Others (specify)
Total 0 0
SWM
Door to door collection
Overflowing bins
Infrequent street sweeping
Odor/nuisance of dumpsites/
transportation vehicles
Others (specify)
Total 0 0
SWD
Water logging
Cleaning of storm drains
Disinfection of post‐flooded areas
Others (specify)
Total 0 0
Source of Information:
2Collect all types of complaints as received and segregated by ULB for each service
Respondent Name: Page no: 14/20
Contact Details: Enumerator Name:

Performance Assessment System for UWSS Date:
IX. Staff and Management
1 Details of Municipal Staff
1.1 Does the ULB maintain manual systems for staff records? (Y/N)
1.2 If Yes, does the ULB have computerised systems for staff records? (Y/N)
1.3 Does ULB maintain records for recruited staff? (Y/N)
1.4 Department Permanent Staff No of
temporary/
contract
staff
No of
daily
wage
staff
Total
staff
Sanctioned Filled
Total municipal staff 0
Administration 0
Finance/Accounts 0
Water supply 0
Waste water & SWD 0
SWM 0
Source of Information:
1.5 Technical and Non‐technical staff for WSS
Department No of
technical staff
No of non‐
technical
staff
Water Supply
Waste water
SWM
Total 0 0
Source of Information:
2 Private Sector Participation in WSS (Insert additional rows/sheets, as required)
Title of contract Sector
(1/2/3/4)1
Type of
contract 2
Tenure
(yrs)
Value
(Rs)
Source of Information:
1 1: Water, 2: Waste water, 3: SWM, 4: SWD
2 Service contract, Management contract, Lease contract, BOOT/BOT, others
(specify)
3 Computer Proficiency of Staff
3.1 Does ULB staff use computers in daily operations? (Y/N)
3.2 If Yes, list departments where computerised systems are used3
3 Admin/Accts/Water/Sanitation/SWM/SWD
3.3 Softwareʹs used in the computers4
4 MS‐Office (Word, Excel),AutoCAD, Others:
specify
3.4 Is Internet facility present for the ULB? (Y/N)
3.5 If Yes, type of facility (1/2/3)5 51: Broadband, 2: Dial‐up, 3: Others
Respondent Name Page no: 15/20
Contact Details Enumerator Name

Performance Assessment System for UWSS Date:
X. Finance and Tariffs ‐ a
1 Accounting systems
1.1 Is accrual based double entry accounting system followed? (Y/N)
1.2 If Yes, is accrual based double entry system followed in parallel to cash based system?(Y/N)
1.3 If Yes, is accrual based double entry accounting systems followed on a regular basis? (Y/N)
1.4 Does the ULB have computerised accrual based double entry accounting systems? (Y/N)
2 ULB Budgets
2.1 Is the information as reported in QN 3, 4, 6 & 7 for 2007‐08 based on ʹactualsʹ or ʹrevised estimatesʹ? (AC/RE)1
2.2 Is the information as reported in QN 3, 4, 6 & 7 for 2008‐09 based on ʹactualsʹ or ʹrevised estimatesʹ? (AC/RE)1
1 For Financial statement, collect Actual Budget for 2007‐08 & 2008‐09; However, if actual budget is not available, collect Revised
Budget Estimates (RE) for 2008‐09
3 Capital Account ‐ for the ULB
3.1
Sources of Funds for Capital Account (In
Rs.) 3.2 Capital Expenditure (In Rs.)
Sources
2007‐08 2008‐09
2007‐08 2008‐09
0 0 0 0
Grants Projects, schemes, etc
Borrowing Principal repayment on loans
Internal ULB funds Others
Others
Total 0 0 Total 0 0
Source of Information: Source of Information:
4 Capital expenditure for Municipal Services in Water, Sanitation, SWM and SWD(in Rs)
Water supply Waste water Solid waste Storm water drainage
2007‐08 2008‐09 2007‐08 2008‐09 2007‐08 2008‐09 2007‐08 2008‐09
0 0 0 0 0 0 0 0
On Projects,
schemes
Principal
Repayment on
loans
Others
Total
If loan repayment is not available sector wise, estimated share of total ULB loan repayments for these sub‐sectors
% share of ULB
principal
repayments on
loans
Source of
Information:
5 Ongoing/ Recently Completed Capital Investment Projects for Water, Sanitation, SWM and Slums
Sector Brief Description Sources of funds
(1/2/3/4)2
Start Date
(Year)
End Date3
(Year)
Total estimated
project cost
Water Supply
Waste water/
Sewerage
SWM
Slums: Housing
Slums: Basic services
Total 0
Source of Information:
2 Sources of funds: 1: JNNURM/MSNA, 2:Other grants, 3: Only own funds and donations, 4: Others, specify
3 For ongoing projects, give estimated date of project completion
Respondent Name: Page no: 16/20
Contact Details: Enumerator Name:

Performance Assessment System for UWSS Date:
X. Finance and Tariffs ‐ b
6 Total Revenue Income & Expenditure of the ULB (in Rs)4
Income Heads
2007‐08 2008‐09
Expenditure Heads
2007‐08 2008‐09
0 0 0 0
Tax income Establishment
Non‐tax income Administrative
Revenue grants O & M
Other income Loan interest payment
Misc. Income Depreciation
Total 0 0 Others (Program Sp. Exp + misc)
Source of
Information: Total 0 0
Source of Information:
4 For Gujarat, the data for the above tables are to be taken from segment reports of the GMARP Annual Accounts statements
7 Revenue Income & Expenditure by municipal services (in Rs)
7.1 Revenue Income
Heads
Water supply Waste water Solid waste Storm water drainage
2007‐08 2008‐09 2007‐08 2008‐09 2007‐08 2008‐09 2007‐08 2008‐09
0 0 0 0 0 0 0 0
Tax income
Non‐tax income
Revenue grants
Other income
Misc. Income
Total 0 0 0 0 0 0 0 0
Source of Information:
7.2 Revenue Expenditure
Heads
Water supply Waste water Solid waste Storm water drainage
2007‐08 2008‐09 2007‐08 2008‐09 2007‐08 2008‐09 2007‐08 2008‐09
0 0 0 0 0 0 0 0
Establishment
Administrative
Energy consumption
Other expenses in
O&M
Loan interest
payment
Depreciation
Bulk water Not applicable
Others (Program Sp.
Exp + misc)
Total 0 0 0 0 0 0 0 0
Source of Information:
Respondent Name
Page no 17/20
Contact Details: Enumerator Name:

Performance Assessment System for UWSS Date:
X. Finance and Tariffs ‐ c
8 Service taxes and Charges
8.1 Does the ULB levy service taxes for water/sanitation linked to property taxes? (Y/N)
If Yes, collect copy of tax rates
8.2 Does the ULB levy charges (fixed/volumetric) for water? (Y/N)
If Yes, collect copy of charges
8.3
.
Does the ULB levy any other charges7 for water/ sanitation/sewerage/ SWM? (Y/N)
If Yes, collect copy of types of other charges
7 Water charges includes development charges, regularisation fees, user charges, penalties & fees, and other fees
9 Demand and Collection: 2008‐095
9.1 Heads Billed demand (in Rs) Collected amount (in Rs) Arrears yet to be collected
Arrears as
on 1.4.2008
(a)
Current
Billed
Demand
2008‐09
(b)
Total
Billed
Demand
(a + b)
Collectio
n from
Arrears
(c)
Collectio
n from
Current
Billed
Demand
(d)
Total
collected
amount
during the
year 2008‐
09
(c + d)
Arrears
of past
deman
d
(e)
Arrears of
current
demand
(f)
Total
amount in
arrears at
the end of
the year
2008‐09
(e + f)
Water supply
Water Tax6 0 0 0 0 0
User charges
(Fixed/ Volumetric) 0 0 0 0 0
Other charges7 0 0 0 0 0
Total 0 0 0 0 0 0 0 0 0
Waste water
Sewerage tax 0 0 0 0 0
Sewerage charge 0 0 0 0 0
Others 0 0 0 0 0
Total 0 0 0 0 0 0 0 0 0
SWM
SWM charge 0 0 0 0 0
Others 0 0 0 0 0
Total 0 0 0 0 0 0 0 0 0
Source of Information:
5Billed demand, collection and arrears to be taken from the Demand Collection Balance statement as provided by
ULB.
6 Water tax includes water tax, special water tax, water benefit tax, etc
7 Water charges includes development charges, regularisation fees, user charges, penalties & fees, and other fees
9.2 Are DCB tables properly maintained and updated by the ULB?(Y/N)
9.3 Is DCB analysis linked to billing and collection systems? (Y/N)
9.4 Is the billing and collection systems computerised and DCB tables automatically generated?(Y/N)
Respondent Name: Page no 18/20
Contact Details: Enumerator Name

Performance Assessment System for UWSS
List of Reports/ Formats to be collected
No Description
1 Sample copies of
a) Property tax bills
b) Water bills
c) Waste water bills
d) Solid Waste bills
2 Application forms
a) Water connections
b) Sewerage connections
3 Copy of format used in the following registers or log books:
a) Water Connection Register
b) Complaint register formats for Water, Waste water, and Solid Waste
c) Log books for pumping, storage, treatment, new connections, staff for water, waste water, and solid
waste
d) Log books for details of ESR/ sump
e) Log books for operations at water treatment plant
f) Asset register for water, sewerage and sanitation related assets
4 Detailed Project Reports (DPRʹs) related to water, waste water and solid waste
5
Wherever possible, collect other City Reports‐ e.g. a) City Development Plan (CDP), Environment Status
Report (ESR), Annual maintenance plan for WSS, etc
6 Energy Audit Reports and Water Audit Reports
7
Budgets ‐Documents that provide details of Budget estimates for current year (2008‐09) and Actual
amounts for previous year (2007‐08)
8
Collect copies of formats as sent to DoM for Gujarat, Inspection Reports for Maharashtra, MOA and
progress reports for UIDSSMT and JnNURM, etc
9 Collect copies of formats of slum related information as maintained by ULB
10 Collect copies of Government Resolutions (GR) related to staff recruitments
Page no: 19/20

Performance Assessment System for UWSS
Information on Maps*
N
o Theme Name of Map
Source
(ULB/ Other
agency, specify)
Type of
map
(jpeg,
acad,
etc)
1 ULB level Maps Development Plans (if available)/Survey Maps.
Administrative Wards
Census wards
Location of newly added areas to ULB
2 Water Supply
Trunk, Transmission and Distribution Network, within and outside
ULB
Water Distribution Stations/ Zones within and outside the ULB
Location of WTP, ESR/Sump, Tube wells
3 Sewerage Location of sewerage zones within ULB
Underground sewerage system
On ground piped drainage
Combined storm and sewer drainage
Unserved areas within ULB limits
Location of Sewage Treatment Plant
Location of final outfall of sewage, after treatment
Location of land used for sewage farming
Location of sewage outfalls for untreated waste water
4
Storm Water
Drainage Flooding locations within the ULB
5 SWM Primary collection zones for SWM (door step collection)
Location of Solid Waste Treatment plant
Location of dump site
Location of Sanitary Engineered Landfill
6 Slums Location of Slums (Mark on Base Maps)
* Collect Hard and Soft copy formats of the maps
Page no: 20/20

Th
Th
im
thr
pe
M
CE
Pr
Ce
M
PA
CE
Ka
In
Te
Fa
ww
he Perfor
he PAS Pr
mprove del
ree majo
erformance
aharashtra
EPT Unive
roject. It i
entre (UM
aharashtra
AS Proje
EPT Unive
asturbhai
ndia
el: +91‐79‐2
ax: 91‐79‐26
ww.pas.or
rmance A
roject aim
livery of w
or compo
e improve
a.
ersity has
is being i
MC) in Gu
a.
ect
ersity
Lalbhai C
26302470
6302075
rg.in
Assessme
ms to deve
water and s
nents of
ement. It
received a
mplement
ujarat and
Campus, U
ent System
elop appr
sanitation
perform
covers all
a grant fro
ted by CE
d All Ind
University
m (PAS)
opriate m
in cities a
mance me
l the 400+
m the Bill
EPT Unive
dia Institu
Road, Na
Project
methods an
and towns
asuremen
+ urban l
l and Meli
ersity wit
ute of Lo
avrangpura
nd tools t
in India. T
t, perform
ocal gove
inda Gates
th support
ocal Self‐G
a, Ahmed
to measur
The PAS P
mance m
rnments i
s Foundati
t of Urba
Governme
abad 380
e, monito
Project inc
monitoring
in Gujara
ion for the
n Manage
ent (AIILSG
009 Gujar
r and
cludes
and
at and
e PAS
ement
G) in
rat,