Volume Five Number Four Q4 2016 Published by Mitchell International Industry Trends … · ·...
54
FEATURED IN THIS ISSUE By Norman Tyrrell Director of Product Management, Casualty Solutions Group, Mitchell The State of Third Party Auto: Claim Costs, Consistency and a New Generation of Adjusters Volume Five Number Four Q4 2016 Published by Mitchell International Volume Five Number Four Q4 2016 Published by Mitchell International Industry Trends Report Volume Five Number Four Q4 2016 Published by Mitchell International
Transcript of Volume Five Number Four Q4 2016 Published by Mitchell International Industry Trends … · ·...

FEATURED IN THIS ISSUE
By Norman Tyrrell Director of Product Management, Casualty Solutions Group, Mitchell
The State of Third Party Auto: Claim Costs, Consistency and a New Generation of Adjusters
Volume Five Number Four Q4 2016 Published by Mitchell InternationalVolume Five Number Four Q4 2016 Published by Mitchell International
Industry Trends
ReportVolume Five Number Four Q4 2016 Published by Mitchell International

Industry Trends
Report
Volume Five Number Four
4 Top Ten Trends from the 2016 P&C Conference
16 Quarterly FeatureThe State of Third Party Auto: Claim Costs, Consistency and a New Generation of Adjusters
25 Bonus Features 5 Ways to Use Visual Reporting Effectively to Improve Claim Outcomes Understanding SB1160—New California Utilization Review Requirements
32 Compliance Corner
38 Data Insights
42 ACS Medical Price Index
46 WCS Medical Price Index
50 Partner Spotlight
52 About Mitchell
53 Mitchell in the News
Table of Contents
The Industry Trends Report is published by Mitchell.The information contained in this publication (i) was obtained from sources deemed reliable; (ii) is provided for informational purposes only; (iii) should not be construed as legal or regulatory advice on any specific subject matter; and (iv) Mitchell does guarantee the accuracy or completeness of the information provided. You should not act on the basis of any content in the publication without seeking legal or other professional advice to address a specific customer issue. This publication is intended to provide general information and may not reflect the most current legal or regulatory environment or address your situation specifically. Mitchell disclaims all liability for a customer’s acts or omissions related to the content of this publication. Mitchell and the Mitchell logo and all associated logos and designs are registered and unregistered trademarks of Mitchell International, Inc. All other trademarks, service marks and copyrights are the property of their respective owners.

A Message from the CEO
P&C Conference Trends
Welcome to the Q4 edition of the 2016 Mitchell Casualty Industry Trends
Report. As you may know, we held our annual Property & Casualty
Conference in mid-October. I enjoyed the opportunity to engage with
many of our customers about how the industry is evolving as well as
share my own insights for where I see it heading. In this issue, we’re
excited to share some of the top trends from the conference covering
everything from augmented reality to information security. I hope you
enjoy reading how technology and social trends are changing the way
we do business and how they may affect your own organization.
In this issue, we have a selection of informative articles from our team of
casualty solutions experts. In our feature article, The State of Third Party
Auto: Claim Costs, Consistency and a New Generation of Adjusters, author
Norman Tyrrell breaks down the three biggest industry challenges
facing the auto casualty market. Norman goes into detail about each
of these challenges and offers solutions for how insurance companies
can increase efficiency, combat rising costs, reduce claim evaluation
inconsistency, and better manage the aging workforce.
Additional articles include tips for successfully using visual reports to
measure claims operations performance. Visual reporting can help
insurance carriers ask the right questions and get on the right path
to improving accuracy and consistency of claim settlements across the
board. We also look into what the new California utilization review
requirement means for workers’ compensation programs and the
various stakeholders that will be impacted by these new changes.
As we close out our 70th anniversary year, I’m grateful for all we’ve
been able to achieve and the part you’ve played in helping us reach this
milestone. It was an honor seeing so many of you at our conference,
and I thank you for your continued partnership. I wish you all a safe and
enjoyable holiday season.
Alex Sun President and CEO Mitchell
Q4 2016
Alex Sun President and CEO, Mitchell
View the Auto Physical Damage Edition

TOP 10 TRENDS FROM THE MITCHELL 2016 P&C CONFERENCE

At the 2016 Mitchell Property and Casualty Conference, keynotes, breakouts and everything in between were focused on technology and social trends that are changing the way we interact with one another and do business.
From augmented reality to information security, here are 10 of the many trends that were top of mind at the conference.

1VIRTUAL AND AUGMENTED REALITY ARE LITERALLY SHOWING US THE WAYThis summer’s Pokémon Go craze reminded us that
augmented reality can be really engaging and fun—
but it also has incredible practical applications for
the P&C and collision repair industries. For instance,
Los Angeles-based Daqri makes a smart helmet that
projects information to guide the wearer through
complex repair scenarios. Technology like this could
be a boon to auto insurers and collision repairers
looking to ensure increasingly complex repairs are
done correctly. It could also help prevent injuries
in high-risk jobs, ultimately reducing workers’
compensation claims.
Meanwhile, at Cedars Sinai Medical Center, a trial
is underway that uses inexpensive virtual reality
headsets to ease patient pain. Early results suggest
an average 24 percent decrease—similar to the pain
reduction they see when administering narcotics.
Collision repairers are under incredible pressure to train their staff and ensure repairs can be certified. It’s easy to see how augmented reality solutions could be helpful.Alex Sun, President and CEO, Mitchell
“ “Top Ten Trends6
1 CONSUMER SELF SERVICE IS THE WAY OF THE FUTUREDriven by the ubiquity of mobile devices and a
growing preference among consumers, particularly
Gen Y and Gen Xers, to communicate exclusively
through digital self-service, Mitchell believes that
consumer self-service interactions will grow from
five percent today to 20 percent by 2020.
Since a positive first notice of loss (FNOL) experience
is a the second largest contributor to customer
satisfaction—only settlement has a greater
influence—insurers seeking to tap into this growing
audience would do well to invest in technology that
facilitates this process.
Further, when FNOL is submitted via a mobile app
and incorporates images, cycle time is significantly
reduced. An expeditious claims resolution process
benefits both insurance companies, with less hands-
on case-management time, and the insured, with a
more user-friendly process. 2Mitchell believes consumer self-service interactions will grow from five percent today to 20 percent by 2020.

HUMAN LEADERSHIP IS THE FUTURE OF BUSINESS
83%In his keynote address, Soft Power: The Software
Engineering Humanity into Leadership, social strategist
John Gerzema spoke about how people—millennials in
particular—are seeking human business leadership in
which companies get more involved in solving today’s
issues. In fact, 72 percent of them would take a $7,600
pay cut to work for a company with a culture and values
they admire.
Why does this matter to the P&C industry? According
to Gerzema, insurers can build trust with this important
buying group by using AI interfaces and automating
processes to reduce transaction time and claims costs.
83 percent of millennials want businesses to get more involved in solving today’s issues.
John Gerzema, Chairman & CEO, BAV Consulting
Top Ten Trends8
3

While charge severity has remained flat in first
party auto casualty—influenced, in part, by policy
limits—overall severity is on the rise. This time, the
culprit is an increase in nerve and disc injuries over
the typically more common—and less expensive—
soft tissue injuries. Certain states are seeing a higher
incidence than others—in New York, New Jersey and
Michigan diagnoses of nerve and disc injuries have
increased by 10 percent2. At the national level, the
increase is approximately 6 percent1.
Third party auto and workers’ compensation insurers
should also take heed—regardless of coverage
type, the introduction of a nerve and disc-related
diagnosis is generally at least twice as costly as soft
tissue damage.
FIRST PARTY AUTO CASUALTY: NERVE AND DISC INJURIES
ARE ON THE RISE
4
6% 10%the amount nerve and disc injuries1 have increased at the national level
the amount nerve and disc injuries have increased in New York, New Jersey and Michigan2
1 Mitchell data2 Mitchell data

In 2015, there was a 38 percent increase in security
incidents over 2014. And at an average cost of $1.2
million to contain an incident—out of the average
$3 million security budget1—there is a lot at stake.
Companies that experience a data breach have more
to lose than money—reputation and customer trust
are hard to win back.
So what’s a business to do? According to Verizon’s
2016 Data Breach Investigations Report, there’s no
easy answer. However, two tactics that could prove
to be particularly useful are web app patching and
multifactor authentication. Together, these could
have prevented almost half the 2015 incidents.5
INFORMATION SECURITY MATTERS MORE THAN EVER
Companies that experience a data breach have more to lose than money—reputation and customer trust are hard to win back.Erez Nir, Mitchell, Executive Vice President and CTO
“ “
38%
the amount security incidents increased between 2014 and 2015
1 PWC Global State of Information Security® Survey 2016
Top Ten Trends10

According to comScore’s 2016 Mobile App report, “digital media time in the U.S. continues to increase—
growing more than 50 percent in the past three years, with nearly 90 percent of that growth directly
attributable to the mobile app.”
For insurance companies, mobile applications help improve customer relationships and build satisfaction in a
number of ways: delivering information to prevent claims, allowing them to submit claims information like first
notice of loss, and providing real-time updates of claims status.
Companies like Lemonade, recently licensed in New York, and Spixii, soon to be licensed in the U.K., are even
using artificial intelligence-driven chat bots to power 100 percent digital interactions with customers.
6MOBILE IS A MUST
Hours Spent Using Mobile Apps Each Month by Age Range1
Smartphone
Tablet
100
75
50
25
018-24 25-34 35-44 45-54 55-64 65+
1 ComScore, 2016 Mobile App Report

Charge severity is on the rise for third party auto and workers’ compensation insurers. In third party auto,
average charge per claimant in 2011 was $8,285. Through the third quarter of 2016, it was $13,499—that’s a
62 percent increase1. Workers’ compensation is seeing an even more dramatic increase over 2011—a whopping
202 percent2. The third party charge severity increase is being driven by a combination of increased unit cost
and utilization, while the workers’ compensation increase is primarily due to increased utilization.
Interestingly, first party auto charge severity has stayed relatively flat, influenced, in part, by policy limits.
THIRD PARTY AUTO CASUALTY AND WORKERS’ COMPENSATION: CHARGE SEVERITY IS RISING
7
$7,463
$6,325
$2,469
$8,285$9,063
$10,412
$11,408$12,949
$13,499
2011 2012 2013 2014 2015 2016$0
$5,000
$10,000
$15,000
Ch
arg
e p
er C
laim
ant
Auto First Party Auto Third Party Workers Compensation
Top Ten Trends12
1 Mitchell data2 Mitchell data

DATA IS DELIVERING ON ITS PROMISEThe insurance industry as a whole is seeing
technology transformations of all types—and
making use of data is at the forefront of their
investments. In fact, a recent study by Strategy
Meets Action indicates 82 percent of insurers
are focusing on strategic projects related to data
analytics. This expenditure is second only to
customer experience projects.
So how do companies go from Big Data to
actionable insights? One good place to start is by
understanding claims analytics personas. What a
claims executive is looking for is not necessary what
an adjuster needs to know. Further, where and when
that information is available makes a difference—
while dashboards and reports are cornerstones of
any analytics program, it’s important that access
to information that informs decision making is
embedded throughout claims workflows.
8
82%
While dashboards and reports are cornerstones of any analytics program, it’s important that access to information that informs decision making is embedded throughout claims workflows.Shahin Hatamian, Vice President of Product Management, Mitchell
“ “
82 percent of insurers are focusing on strategic projects related to data analytics.
Top Ten Trends14
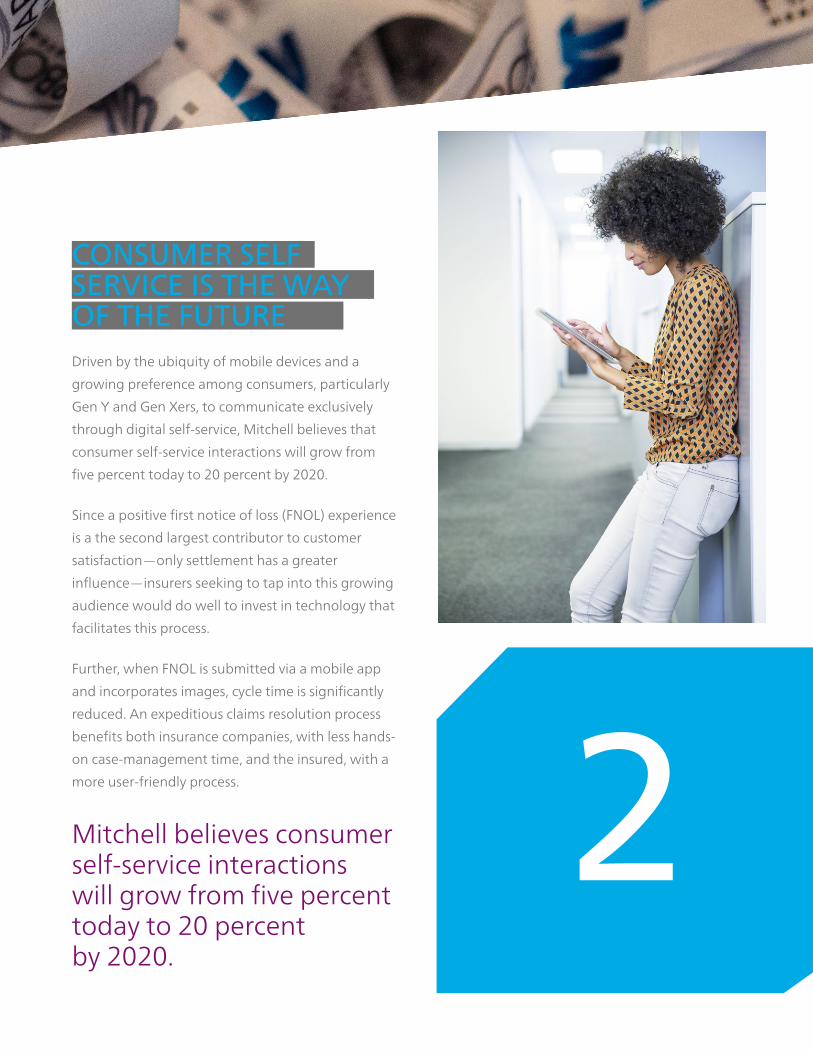
Opioid abuse has reached epidemic proportions—
in fact, every 19 minutes, someone in the U.S. dies
from an opioid overdose. With $1.5 billion in opioid-
related expenditures, the P&C industry has a lot at
stake. Earlier this year, the CDC released their official
Guideline for Prescribing Opioids for Chronic Pain
that offers specific steps physicians can take to curb
the problem.
There are also some actions insurers can take,
including using formularies with built-in controls;
putting first-fill restrictions in place; monitoring total
morphine equivalent doses by patient; ensuring
their PBM solution has built-in risk calculation alerts;
and implementing managed care solutions.
9
$6+billion 50% 70%
spent in workers’
compensation on
prescription drugs1
is spent on pain
management drugs1
of those
are opioids1
OPIOID ABUSE IS AN INSURANCE PAIN POINT
Mitch Freeman, Pharm. D., Vice President and Chief Clinical Officer, Mitchell
1 Prescription Drug Management in Workers’ Compensation, The Twelfth Annual Survey Report (2014 data)

10
A recent Towers Watson study indicates that to succeed, insurers will need to adapt to meet the needs of the
next generation of customers. In fact, in the U.S., 93 percent of millennials would buy a usage-based insurance
(UBI) policy if the rates didn’t increase, while 72 percent believe it’s a better way to calculate rates. UBI presents
additional opportunity with value-added services: 80 percent of millennials would pay more than $45 a month
for options like theft tracking or automated emergency calls.
While the trend toward UBI is just getting off the ground in the U.S.—Towers Watson anticipates 17 million
people will have tried it by the end of 2016—it’s gaining ground in other countries. It’s achieved double-digit
market share in Italy and markets are maturing in Germany, Spain and France.
MILLENNIALS ARE DRIVING ADOPTION OF USAGE
BASED INSURANCE
93%
72%
80%
of millennials in the U.S. would buy a usage-based insurance policy if the rates didn’t increase
of millennials in the U.S believe it’s a better way to calculate rates
of millennials in the U.S would pay more than $45 a month for options like theft tracking or automated emergency calls

1616
The State of Third Party Auto: Claim Costs, Consistency and a New Generation of Adjusters
The cost of third party auto claims is rising quickly,
and many insurance carriers are struggling to
keep up. As the number of attorney-represented
claims grows, adjusters are getting more and more
demand packages, which are often disorganized
or incomplete, though they require a timely
response. Without the correct tools, these complex
demand packages often result in lost opportunities
or inconsistencies, which can expose insurers to
lawsuits. Because there are so many different
variables when handling represented third party
claims, things can quickly get complicated for
adjusters. Often, those complications and problems
lead to unnecessary spending. In a competitive auto
casualty market, an insurance company can’t afford
to leave these costly problems unaddressed.
Though there are many issues that arise while
adjudicating third party claims and demands, three
major problems stand out across the industry—
the rising cost of third party claims, inconsistent
evaluation and claim settlements, and a new
generation of adjusters.
Quarterly Feature
By Norman Tyrrell Director of Product Management, Mitchell Casualty Solutions Group
Since 2011, the average bodily injury claim cost for third party medical specials has increased about 12 percent.
17

Breaking Down the Three Biggest Industry Challenges
Challenge 1: Rising Cost of Third Party Claims One of the biggest obstacles the industry is facing
is rising claim costs which are directly related to
increased medical specials. Since 2011, the average
bodily injury claim cost for third party medical
specials has increased about 12 percent.
Year-Over-Year Bodily Injury Claim Cost
Ave
rag
e Pa
id C
laim
Co
st ($
)
14,500
14,000
13,500
13,000
12,500
12,0002011 2012 2013 2014 2015
ISO Fast Track Data
In fact, when we look more closely at the numbers
behind these increases, we see that average
utilization, or the frequency of using medical
services, has also increased by 18 percent during the
same period according to Mitchell data.
Loss Development (National)
Source: Mitchell Data
100 11860
40
20
02011 2012 2013 Q1-14 Q2-14 Q3-14 Q4-14 Q1-15 Q2-15 Q3-15A
vera
ge
Un
its
Per
Clai
man
t
Causes and Effects The cause of the rising costs can’t be attributed
to just one single factor, such as inflation. Medical
specials on third party auto claims are rising due to
a few complex reasons that fall into three categories:
provider-related trends, fraud and adjuster struggles.
Provider-Related TrendsMany of the cost drivers of third party claims are
centered on issues related to provider visits and
treatments. There’s the new trend of claimants
visiting providers more frequently than before, and
the overall length of time taken to treat injuries is
increasing as well. In addition to more frequent
visits, there has also been an increase in providers
using costly procedures, like more expensive
imaging procedures, such as MRI or CT scans, to
diagnose injuries. Not only are injuries becoming
more expensive to diagnose, but some have also
become more expensive to treat.
A partner that offers an integrated solution set is a great choice, since the integration ensures that no parts of the process get lost.
Quarterly Feature17
18 Quarterly Feature
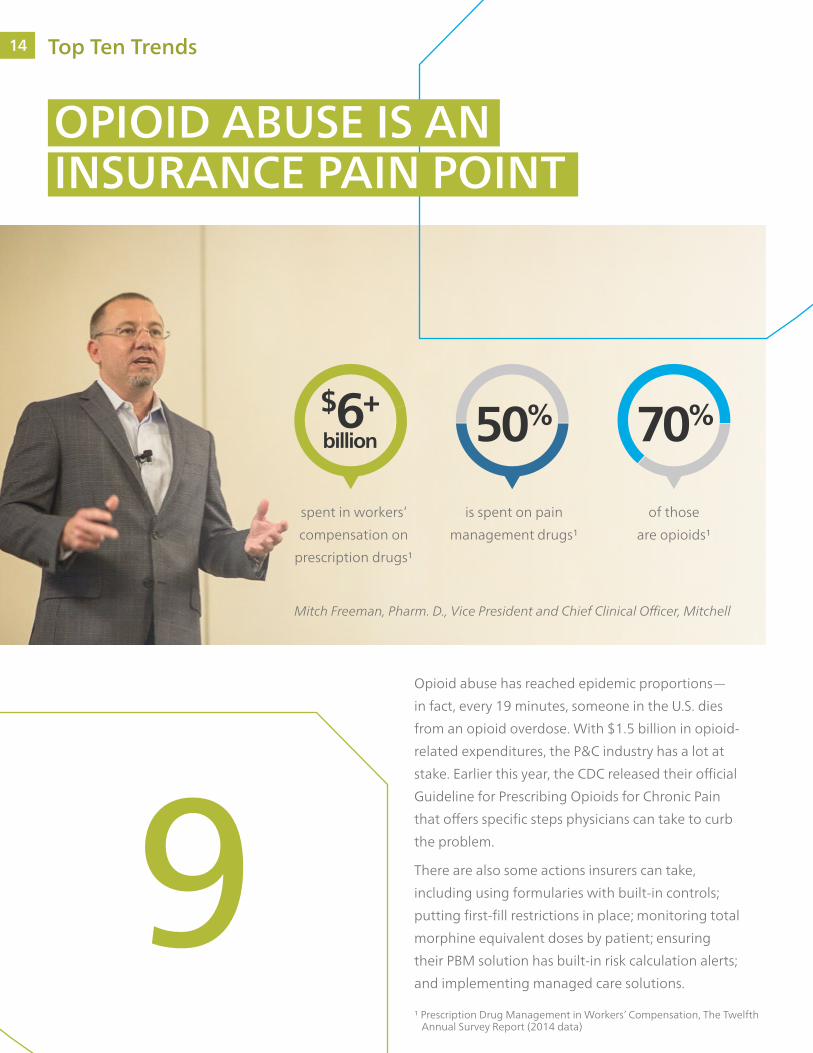
Providers have been diagnosing more serious
injuries more frequently as well. For example, since
2011, there’s been a 34 percent increase in average
charge per claimant with nerve or disk injuries while
the frequency of this type of injury has increased
about 18 percent. One reason for the increase in
treatment costs is that providers are now using
surgeries and injections as treatment more often
than other, less expensive options.
Different areas of the country are currently seeing
recommended surgeries as a more common part
of third party demands, though this isn’t due to
new technology or surgical procedures that help
with auto injuries. This is coupled with a trend of
increased use of surgeries as standard practice and
increased tolerance in certain venues. Not only are
all of these different factors driving third party claim
costs on their own, but on top of that, providers are
charging auto carriers at a higher rate than they are
charging other payors. This is most likely occurring
because third party insurers don’t have access to
networks with lower contracted rates like other
payors, including Medicare and group health.
Cases of FraudFraud is another leading driver of rising third party
claims. There are a couple of different categories
of fraud to look out for. First, there is a trend of
providers not only treating pre-existing conditions
that are unrelated to the third party claim, but also
using more expensive procedures, like surgeries or
nerve treatments to do so.
Second, some attorney-represented claims are
falling victim to “the build-up model,” which is a
term used to describe what happens when attorneys
direct treatment in a particular (self-serving) way.
For example, an attorney could refer a claimant to
a medical provider who he has a relationship with.
Though that claimant was initially diagnosed at
the hospital with a soft tissue problem, they might
end up getting treated for it at the chiropractor
who refers them to an expensive orthopedist. The
orthopedist then recommends injections or surgery
for this minor injury even though such treatment
recommendation deviates from the standard of care.
This recommendation then increases the value of
the demand request, so the attorney ends up asking
the insurance company for more money even before
the procedure occurs. Many times, the claimant
doesn’t end up getting the surgery, resulting in pure
profit for the attorney and claimant and causing
the insurance company to pay much more than the
fair price for that claim. Only a small percentage of
claims might result from attorneys participating in
the build-up model, but when they do, the results
can be extremely costly for insurance companies.
Loss Development—Nerve/Disk Injuries (National)
$10,000
$5,000
$0
2011 2012 2013 Q1-14 Q2-14 Q3-14 Q4-14 Q1-15 Q2-15 Q3-15
134.2
100.0
Ner
ve/D
isk
Inju
ry
Avg
. un
its
per
cla
iman
t
19

About the Quarterly Feature author…
By Norman Tyrrell Director of Product Management, Mitchell Casualty Solutions Group
Norman Tyrrell is Director of Product
Management for Mitchell’s Casualty
Solutions Group. In this role Norman
directs the product management and
strategic planning activities for the
company’s Auto Casualty Solutions
division leading a passionate team
of product professionals focused on
delivering smart technology, deep
industry expertise, and the broadest
range of solutions to Mitchell
customers. As an experienced product
and technology executive, Norman
brings to Mitchell more than 20 years’
business and product management
expertise across a variety of markets
and industries. Prior to joining
Mitchell, Norman served in multiple
capacities at Qualcomm, a leader in
mobile communications technology,
across product management,
technical marketing, and global
business development. Norman
also has previous leadership roles in
marketing and product management
within the enterprise software and
enterprise communications industries
and has broad international
experience including spending five
years in Japan. Norman holds an
MBA from the Thunderbird School
of Global Management and an
undergraduate degree in Physics
from St. John’s University.
Adjuster Struggles Inside the Claims ProcessFinally, there are a few factors affecting third
party claim costs that are within the insurance
company’s claims process itself. Claims with attorney
representation pose additional challenges for
adjusters. There is a general consensus among
carriers that the number of represented claims is
growing, which is concerning because attorney
represented claims are much more complex than
unrepresented claims, since attorney representation
adds in an extra step of negotiation. Further
complicating this aspect of third party claims is
that adjusters often have to deal with daunting
demand packages. The demands that are presented
are frequently disorganized, include poor-quality
images and duplicate billings. Adjusters are typically
already extremely busy. With a lot of work on their
plate, it is difficult for them to find the time required
to sort through demand packages and organize
them in the best way so that they can negotiate the
claims to the fairest price. Disorganized demands
already make negotiations and the third party claim
process a pain point for adjusters. But to make that
even worse, recently, negotiation training has fallen
by the wayside at many insurance companies. As a
result, adjusters aren’t trained to consistently use
the best practices to negotiate with attorneys on
demands, leading to less successful negotiations—
which means insurance companies are more
frequently overpaying on third party claims.
Quarterly Feature19

20 Quarterly Feature
perform a liability assessment. Though they were
given the same information, the liability rates the
adjusters came up with were different across the
board. Even the group of adjusters in the category
of 15+ years of experience category came up with
different answers than each other. This variation
demonstrates the major consistency problem
adjusters are facing when assessing liability—
even with years of training and practice, adjusters
struggle to settle claims consistently with their
peers. Inconsistent claims adjusting means insurers
are either frequently overpaying or underpaying on
claims. While paying more than the accurate price is
obviously problematic for insurers, underpaying can
result in litigation that often ends up unnecessarily
driving up settlement costs.
The root cause of this problem stems from a few
different areas. One reason for inconsistency could
be that while the company’s methods and liability
assessment techniques are documented, they might
not be fully integrated within the claim system or
Challenge 2: Claim Evaluation Inconsistency
Third party auto claims are different than first party
claims since there aren’t as many defined standards
of payment and because claims are typically set-
tled in chunks instead of by individual medical bills.
Because of this and a lack of fee schedules in third
party, it’s tough to get every adjuster to consistently
come up with accurate values across similar claims.
Inconsistency stems from two major areas: liability
assessment and injury evaluation.
Liability Assessment
Without any tools in place, adjusters frequently
use different methods to assess liability. In a
customer study, Mitchell documented this adjuster
inconsistency in assessing liability third party
claims. A variety of adjusters from a specific carrier,
with experience ranging from zero to 15+ years,
were given the same set of facts for an accident
involving a left turn at an intersection and asked to
Actual Distribution of Liability Rate EvaluationsAccident Scenario: Intersection (left turn)
Sou
rce:
Act
ual
car
rier
res
ult
sfr
om
Mit
chel
l eva
luat
ion
stu
dy
Adjuster’s Years of ExperienceGiven the same set of facts, even experienced adjusters offer varied liability rates on a single left turn scenario.
Eval
uat
ed L
iab
ility
Rat
e
100%
90%
80%
70%
60%
50%
40%
30%
20%
10%
0%0 5 10 15 20
21

adjuster computing workspace. An example of what
this gap might look like is a series of Post-it Notes
explaining the procedure around the adjuster’s
desk. If companies don’t have their adjusting
requirements integrated into their third party claims
adjusting process, then it’s easy for one adjuster
to forget to make certain changes or interpret
guidelines in a different way than the next adjuster.
Injury Evaluation
Another reason for inconsistency is that injuries
are being evaluated by adjusters who aren’t using
tools to support them in the process. Many times,
the threshold of how much money an adjuster
can spend on a claim, which is determined by a
supervisor, shapes the way an adjuster looks at a
claim. In this scenario, adjusters may try to keep their
settlements under that threshold, and decide to cut
or allow medical treatments only based on keeping
the cost under that number instead of evaluating
based on best practices. Since there are usually
multiple different supervisors at one company, there
can be a wide distribution of all of the payouts
with a wide gap between the lowest and highest
payouts. This gap could lead to increased litigation
for insurance companies.
Challenge 3: A New Generation of Adjusters The consistency problem insurers are facing in
the third party market could get a lot worse if
companies aren’t prepared. About 25 percent
of insurance industry professionals are slated to
retire by the year 2018, meaning thousands of the
industry’s most senior adjusters will walk out the
door, taking their industry knowledge and expertise
with them. This will be felt more profoundly in
third party claims departments since adjuster
knowledge is key to reaching accurate settlements
and succeeding in negotiations. When many
experienced employees leave, companies will have
to train many new, younger adjusters which will take
time. Third party claims are complicated, and it could
take a while for employees who are new to the
industry to become experts at their jobs. This
could leave insurers with sub-optimal settlements
on claims for years.
Another factor with the more experienced
generation retiring and the new generation
entering into the industry is that younger employees
are generally more tech savvy. The millennial
generation, defined as people born from the early
1980s until about the year 2000, is entering the
workforce and bringing their love for technology
with them. In fact, a study by the U.S. Chamber of
Commerce Foundation found that compared to
older generations, millennials are 2.5 times more
likely to try out new technologies as early adopters.
Millennials are also more likely to use the internet.
Millennials want to use the latest and greatest
technology to help them get their jobs done
efficiently, which contrasts with much of the older
generation’s unwillingness to try out new platforms
and solutions.
The Solution
To combat these three major issues facing the third
party market, it is critical to provide adjusters with
expert decision support tools to help them make
the best decisions when evaluating third party
demands and negotiating settlements. By providing
adjusters with a third party solution suite that
comes filled with comprehensive, integrated expert
technology and services, insurance companies can
start to see improved outcomes and more consistent
settlements.
Quarterly Feature21

22 Quarterly Feature
this medical review process should be linked with
the rest of the company’s solutions. This way, it’s
easy to make sure no recommendations are lost or
diminished. This helps insurance carriers contain
costs by making sure they only pay for treatments
the patient actually needs and for injuries that are
related to the accident, helping protect them
from fraud.
Insurance companies should also make sure to
provide adjusters with tools to assist them as
they negotiate with attorneys. In order to reach
the most accurate settlement, adjusters have to
successfully negotiate with attorneys, which can be
a complicated and difficult process. That’s why it’s
valuable to have solutions that provide an organized
set of facts to help with the negotiation process. This
not only helps drive consistency across adjusters, but
also empowers adjusters to negotiate the specific
facts of the case, not just a dollar figure.
By using medical reviewers, adjusters are assured of
having a strong, evidence-based foundation when
discussing the merits of their settlement offer.
Another great way to improve negotiations is
to provide adjusters with liability and generals
assessment tools that empower them to settle the
claim at the precise amount of liability and negotiate
more successfully. These types of solutions provide
organized information that can help adjusters
explain their decisions to attorneys so that they are
completely prepared for the negotiation process.
This helps adjusters better explain the investigation
and liability assessment process and ultimately
results in more consistent, accurate settlements on
third party claims.
Here is an example of a recommended suite of third
party tools: medical bill review, liability and injury
evaluation, general damages assessment, claims
process services, demand package management,
medical professional review and direct-to-provider
negotiation services. This combination of technology
and services covers all of the most important areas
of third party claims, allowing insurance companies
to increase efficiency and combat rising costs,
reduce claim evaluation inconsistency, and the
aging workforce.
Rising Costs of Third Party Claims
Specifically, in order for insurance companies to
combat rising costs based on provider-related
charges, they should make sure their bill review
process includes benchmarking. By comparing
provider charges on auto casualty claims to provider
charges for the same treatment in other areas like
workers’ compensation or group health, insurance
companies can be more confident that they are
paying the fairest price on claims—instead of a price
that was inflated just because the injury happened
in an auto accident.
Another important tool to have in an insurance
company’s third party toolkit is medical review
services. Medical reviewers help verify that insurers
are only paying for injuries related to the accident
and also aren’t overpaying for treatments. This
service can help protect the insurance company
from fraud and help identify “the build-up model”
as well. For example, a charge might show up on a
bill for a treatment on a patient’s shoulder. When
a nurse or other medical professional reviews the
record, they might realize that based on their
professional opinion, the accident wasn’t the cause
for the patient’s shoulder injury, and then the nurse
can alert the adjuster. In order to get the most value
out of a medical professional’s recommendations,
23

Inconsistent Claim Evaluation
An efficient way to improve assessment and
settlement consistency throughout the claims
organization is to take the time to build the
company’s strategy into an easy-to-operationalize
knowledgebase. A liability assessment and injury
evaluation tool can help an insurance carrier
improve consistency and manage costs from settling
too high or too low by integrating and distributing
the company’s knowledge base into adjusters’ daily
workflows. A tool that also comes with reporting
capabilities can help an insurance company address
any problems with inconsistency or overpayment
right away instead of waiting a year or two to
finally notice that their severity is trending upward.
This can help save companies from overpaying or
underpaying on settlements over a long period
of time.
Another area a robust software solution can help
insurers improve outcomes is in liability assessment.
Without a robust solution, carriers typically have
a low rate of claims that are approved for shared
liability, meaning they are missing an opportunity
for cost containment in situations where liability
is shared. A liability assessment tool can help
companies improve their approved liability averages
while also increasing their shared liability averages
across the board. This helps enable consistency in
liability evaluation which improves accuracy, helps
manage costs and improves third party outcomes.
View the Auto Physical Damage Edition
Quarterly Feature23

24 Quarterly Feature
By implementing friendly, effective and easy-to-use
software solutions, companies can attract more of
the technology-loving millennial generation to fill
the gap it will be facing in a few years.
Conclusion
Choosing to work with an experienced partner that
offers a complete, integrated suite of products and
services specifically targeted to the unique needs of
the third party market is an easy way for insurance
companies to manage all of the knowledge and
tools adjusters need to successfully settle claims and
manage costs. A partner that offers an integrated
solution set is a great choice, since the integration
ensures that no parts of the process get lost. When
adjusters are empowered to make great decisions
and their claims management system works
seamlessly with bill review, medical review, liability
assessment and all of the other steps in the claim
life cycle, the insurer can consistently pay the most
accurate price on claims.
A good solution can also enable adjuster
independence while providing guidance to
them where needed. If a company can prove its
methodology and can show that it has paid the
same price on similar claims on every instance, they
can have a better chance of winning any lawsuits
that could come their way. By using an assessment
and evaluation solution correctly, companies can see
major improvements in consistency and optimize
their medical spend.
A New Generation of Adjusters
One of the most helpful pieces of a third party
solution suite to ease the human resource transition
is a liability and injury assessment tool that
incorporates the best practices and knowledge
that retiring adjusters will be taking with them. By
capturing the company’s knowledge and culture
within its workflow, companies can easily apply it
across the organization even after all of its most
experienced adjusters have retired. One example of
what to build in to the software system is the best
practices that their adjusters are using in the field to
negotiate with attorneys.
With the millennial generation entering the
workplace and naturally taking to new technology,
now is the time to start considering how using more
of the latest technology in the claims process can
improve outcomes. By implementing advanced
software solutions that will help adjusters learn
and do their jobs quicker and more efficiently,
companies can better match the millennial desire for
using technology at work. For example, in assessing
third party claims, new adjusters need to learn
the best practices for negotiating with attorneys.
A great way to assist them is to use a technology
solution that’s integrated with the investigation and
liability process, which simplifies the most important
negotiation points into a table or list.
25

Insurance carriers who aren’t looking at visual
performance reports on a regular basis could be
missing out on major opportunities to improve their
operations and to move toward more standardized
and efficient processes.
Visual reporting lets insurance companies
understand areas of their performance that might
have taken weeks to uncover in a spreadsheet,
making it easier for them to know where they
are having successes and where they need to
improve. Here are some tips for using visual reports
successfully when it comes to measuring claims
operations performance:
1) Pinpoint outliers and identify red flags
Visual reporting, when used effectively, helps
insurance companies quickly and easily make
informed decisions and changes to correct issues
plaguing their bill review process. Monitoring
specific red flags in the bill review process is the first
step to making important changes. For example, a
visual report can help pinpoint with a simple click of
the mouse in which counties in Michigan a company
is paying more than the industry average for neck
sprain treatments. This way, the company can focus
in on this specific outlier to understand why it is
happening and then work to make improvements
in that category.
5 Ways to Use Visual Reporting Effectively to
Improve Claim Outcomes
By Shahin Hatamian VP Product Management & Strategy, Mitchell Casualty Solutions Group
Visual reporting lets insurance companies understand areas of
their performance that might have taken
weeks to uncover in a spreadsheet.
Bonus Feature25
2626
processes. For example, if a company is interested
in which types of adjustments their adjusters are
making to bills, visual reporting provides easy access
to view a general breakdown of those adjustments.
A company can also easily drill down on this data
—to look at adjustments in specific states or lines
of insurance, like workers’ compensation or third
or first party auto casualty. The interactive filtering
capabilities within a visual report help companies
simply view the exact data they are looking for
without spending a large amount of time sorting
through all of the information.
Without visual reporting, the company might
have noticed an increase in spending via their
spreadsheet report, but might not have been able to
realize that specific treatment in that specific region
was the problem. With visual reports, companies
can easily and quickly zero in on the anomalies or
flags and start asking the right questions to improve
performance in those areas.
2) Interact with the report to dig deeper into the most important data
With a spreadsheet, companies have to balance
robust performance reporting against the amount
of employee time it would take to generate and
find patterns in that data. But with visual reporting,
companies are able to easily change and modify
filters to quickly view that data, eliminating manual
processes. Visual reporting allows for more flexibility
in the types and groupings of data that are available
for review. It also allows companies to focus in on
the areas that specifically match their business
needs, making it easier to look at relevant data that
can help make significant improvements in business
With visual reports, companies can easily and quickly zero in on the anomalies or flags and start asking the right questions to improve performance in those areas.
Bonus Feature 27

Mitchell's DecisionPoint® Bill Review platform allows companies to compare their performance to the industry in various categories and different locations around the country to help pinpoint potential problem areas.
Visual reporting can help companies focus in on specific areas of the operations to determine where to focus in on for improvement. For example, this Procedure Code Analysis report lets companies analyze frequency and severity trends by procedure group.
Bonus Feature27

28 Bonus Feature
3) Use industry comparison data to your advantage
A robust reporting solution should provide the
ability to compare one company’s performance to
the industry based on a robust set of industry data.
Carriers are always looking to improve accuracy
and consistency, and an industry comparison report
allows them to get closer to achieving those goals.
By understanding, for example, the percentage
allowed to total charged compared to the industry
average for this statistic, insurance carriers can know
if they are consistently paying the fairest price on
medical charges. Comparing performance to the
industry is a great tool to help carriers manage
their medical costs and focus on specific regions
or counties where they are paying more than the
industry average price, allowing them to be better
prepared to remedy the situation.
4) Assess provider network performance
Understanding which provider networks are
performing best in each state and on each type
of bill is a key piece of information to have. If an
insurance company has a deep understanding of
which networks are performing best in certain
situations, they are better prepared to optimize
their cost containment stacking to achieve better
outcomes. For example, if a company views a
report and learns that negotiation services are
outperforming a specific network in a certain
state, they are able to readjust the position of their
solutions within their stack to reach optimal cost
containment levels.
5) Review categories you couldn’t easily uncover in a spreadsheet
In addition to focusing in on areas that a
company already knows aligns with its business
needs, insurance carriers can identify completely
different categories that they had not previously
considered. The beauty of a visual reporting
tool is that a company can spend minimal time
gathering information about different areas of their
performance that they wouldn’t have assessed
otherwise. For example, a company could more
easily identify a procedure code that’s trending
upward that they might not have looked at
otherwise. Many companies only look at the top-10
or top-20 procedure codes, but visual reports can
give companies more insight into other procedure
codes as well so they can catch those that are
trending up before they become a problem—a
statistic that would be much more difficult for
someone looking at the raw data to recognize.
New insight into different areas, like less-costly
procedure codes, can help companies make
informed and precise decisions. Companies should
use the knowledge to their advantage to identify
areas of improvement which are highlighted in
the visual reports.
By using visual reports to review claims processing
performance, insurance carriers can easily ask
the right questions and get on the right path
to improving accuracy and consistency of claim
settlements across the board.
29

In the scant months leading up to its signature by
California Governor, Jerry Brown, SB1160 gained
a tremendous amount of attention from those in
the California workers’ compensation industry. This
bill, which was signed into law on Sept. 30, 2016,
speaks to persistent delays and denials of medical
care for injured workers, contains reforms that
could considerably impact workers’ compensation
programs and influence utilization review
requirements nationwide.
The excerpts pulled below from SB1160 Sec.
4.5, are just a handful of utilization review (UR)
provisions addressed by the legislature. Based on
the highlighted language below, we can expect
to see many UR entities in the next year making
modifications to their current operations to ensure
they are compliant with the new requirements:
• Prospective review of medical treatment will not
be required with certain exceptions in the first 30
days following the date of injury occurring on or
after Jan. 1, 2018.
• The employer or utilization review entity
conducting UR on behalf of the employer, shall
neither offer nor provide any financial incentive
or consideration to a UR physician reviewer
based on the number of modification or denial
decisions made.
• Prospective decisions regarding requests for
medications covered by the formulary shall be
made no more than five working days from the
date of receipt of the medical treatment request.
There is no extension of the turnaround time to
14 calendar days.
Understanding SB1160— New California Utilization
Review Requirements By Jackie Payne
Vice President, Medical Management Services, Mitchell Casualty Solutions Group
The workers’ compensation industry
in California has been seeking managed
care cost containment and faster delivery of
medically necessary care.
Bonus Feature29

3030
• A utilization review process that modifies or
denies requests for authorization of medical
treatment shall be accredited on or before July
1, 2018, and shall retain active accreditation
while providing utilization review service, by
an independent, nonprofit organization to
certify that the utilization review process meets
specified criteria.
So what does this mean for workers’ compensation
programs in California? To understand that, we
need to look at the various stakeholders that will be
impacted by these new changes.
Various Stakeholders
Injured WorkerThe bill, effective for work injuries occurring on or
after Jan. 1, 2018, focuses on reducing treatment
delays for injured workers during the first 30
days following the date of injury. During this 30-
day treatment window in an accepted workers’
compensation claim, an injured worker, assuming
that they are being treated by a medical provider
network (MPN) or health care organization (HCO)
doctor or another employer-directed doctor/facility,
can get the care they need without being subject to
“prospective” utilization review —which can result
in denial of care when it is most needed. This bill
continues the effort to ensure that injured workers
are being put on the right path to recovery as
quickly as possible.
Treating Providers Treating physicians are required to follow rules ad-
opted by the administrative director of the Division
of Workers’ Compensation (DWC) for submitting
requests for authorization for medical treatment
with supporting documentation to the claims ad-
ministrator for the employer, insurer or other entity.
These rules are meant to help ensure that requests
for authorization of treatment will be directed to the
appropriate entity to ensure timely processing of
the request.
Only treatments consistent with the medical
treatment utilization schedule (MTUS) are exempt
from utilization review in the first 30 days following
an injury, and treating physicians must render
treatment consistent with the MTUS, including
the drug formulary, to avoid being removed as
the predesignated treating physician, employer-
selected physician or member of the MPN or HCO,
or be subjected to prospective review of all further
treatment rendered.
PayorElectronic reporting of utilization review is
mandated under this law, requiring that claims
administrators route all UR data to the Division of
Workers’ Compensation for increased monitoring.
The DWC can also review the financial contracts
between the employer, UR entity and UR
physician reviewers.
The new law also prohibits insurers and third party
administrators (TPAs) from referring UR services to
an entity in which the insurer or TPA has a financial
interest unless the insurer/TPA discloses the name
of the UR entity and the insurer or TPA’s financial
interest in the entity to the employer and the DWC.
UR EntitiesThe bill calls for greater oversight over UR entities by
requiring that UR plans that address modification
or denial of treatment requests be approved by the
DWC and accredited by an independent nonprofit
organization by July 1, 2018. Many smaller UR
entities who are not currently accredited will have
to decide whether to go through the accreditation
process or only issue UR authorization decisions.
Bonus Feature 31
The new statutes should have only minor effects to
those UR entities that have practiced in compliance
previously. For others, it may end up that these
smaller entities will instead choose to partner with
other UR entities that are already accredited to avoid
operational setbacks.
Industry as a WholeThe workers’ compensation industry in California
has been seeking managed care cost containment
and faster delivery of medically necessary care.
SB1160 certainly has the potential to help with
both. However, it also puts payors and UR entities
in the position of retrospectively monitoring the
delivery of treatment and potentially disrupting
that treatment well after the development of a
physician-patient relationship. Another factor to
consider is the necessity for the provider community
to understand the requirements for treating
workers’ compensation patients as well as the MTUS
treatments recommended for the patient’s injury.
Educating the provider community has been a
barrier in prior DWC regulatory changes and payors
and UR entities have had to take over that burden,
often at the expense of timely delivery of care.
While the changes made by SB1160 removes
potential delays in seeking needed treatment and
increases the potential for delivery of consistent,
medically necessary care for injured workers, the
impact on the MPN, HCO and employer-chosen
physician groups could be significant. And as we
remove barriers for the injured worker to have
access to treatment with limited preauthorization
requirements, payors risk losing the managed care
cost containment benefits SB1160 brings through
increased medical costs in the first 30 days after the
injury and extension of the overall claim resolution
timeframe due to disruption in the physician-
patient relationship. UR Entities and TPAs may be
scrambling to meet the accreditation requirements
and find innovative solutions to balance the impact
of SB1160 on their customers claim cost. Here at
Mitchell, our workers’ compensation Utilization
Management program has been accredited by
URAC since 2009. We will continue to monitor the
impacts of SB1160 to continue empowering better
outcomes for injured workers, payors and the
broader workers’ compensation industry.
Bonus Feature31

3232
A change is in the wind, or more like a tornado,
when it comes to new healthcare reforms,
particularly on the payment side. In 2019, the
Medicare Access and CHIP Reauthorization Act of
2015 (MACRA) will be introduced requiring new
quality measurements. In a “be careful what you
wish for” scenario, MACRA was put in place after
physician groups pushed back on the Sustainable
Growth Rate (SGR) formula which lowered
payments from Medicare to physicians.
Since the SGR method of paying physicians is being
eliminated, MACRA will be implementing a new
payment framework that is based on the quality of
care provided to a patient rather than the quantity
of care. MACRA consists of two separate payment
programs; Merit Based Incentive Payment System
(MIPS) and Alternative Payment Models (APMs). As
if we didn’t need more acronyms, these programs
are loaded with new definitions and more acronyms
that will eventually roll off the tongue as part of the
new health world terminology in the United States.
Some definitions before moving on to how the components of MACRA are combined. They are:
• Physician Quality Reporting System (PQRS)—A
reporting system developed by the Center for
The Compliance Corner
The Compliance Corner
By Michele Hibbert-Iacobacci, OHCC, CCSP Vice President, Information Management & Support, Mitchell Casualty Solutions Group
Understanding MACRA—Medicare Access and CHIP Reauthorization Act of 2015, in Relation to the Property and Casualty Industry
In 2019, the Medicare Access and CHIP Reauthorization Act of 2015 (MACRA) will be introduced requiring new quality measurements.
33

Medicare/Medicaid Services (CMS) to encourage
physicians/practices to report quality. This
reporting allows providers to quantify how often
they are meeting quality metrics. Starting in 2015,
providers who did not report these metrics were
paid less than those that did through the fee for
service schedule (CMS, 2016).
• Value Modifier (VM or Value-based Payment
Modifier)—This modifier is an indicator to CMS
the physician/practices quality of care rating
during a performance period of reporting PQRS.
This modifier indicates adjustments to payments
made to the providers who perform under the
Medicare Physician Fee Schedule (PFS). This
modifier is connected to the provider’s Tax
Identification Number (TIN) to be applied to
individual physicians and practices (CMS, 2016).
This program was being phased in starting in
2015. In 2017, the adjustment will apply to solo
practitioners and physicians in groups of two
or more and, in 2018, all physicians will be
included with the addition of physician assistants,
nurse practitioners, clinical nurse specialists
and certified registered nurse anesthetists
who are solo or in groups of two or more.
The performance is rated on what occurred
for these providers going back two years
(CMS, 2016).
• Medicare Electronic Health Record (EHR) —
Requirements were established for the capture
of clinical data which included providing patients
with EHRs. In the second phase, the quality
improvement was focused on the point of care
and the exchange of information (CMS, 2016).
The incentive programs were established as part
of the American Recovery and Reinvestment Act
of 2009 (ARRA) enacted Feb. 17, 2009.
The Compliance Corner33

34 Compliance Corner
• Eligible Professionals (EPs)—Applies to individual
EPs, groups of EPs or virtual groups. The provider
types these new quality programs apply to
are: physicians, physician assistants, certified
registered nurse anesthetists, nurse practitioners,
clinical nurse specialists and groups that include
these professionals. After 2021 the CMS can
add additional EPs. Those that are excluded are
qualifying Alternative Payment Model (APM)
participants; partial qualifying APM participants;
and low volume threshold exclusions (CMS, 2015).
The first model is the MIPS model which combines
the PQRS, VM and EHR incentive programs into
one single program for the EPs effective in 2019.
The measurements will consist of quality, resource
use, clinical practice improvements and use of EHR
technology. The second model is the APM which
from 2019–2024 may pay some participating health
care providers one lump sum based on either the
covered life or case type (e.g., hip replacement).
These lump sum models are intriguing for P&C
when we conceptualize the course of care for a
workers’ compensation injury or auto accident and
the possibilities of moving away from fee for service.
This is the main reason we are keeping track of these
new models as they can be “bell weathers” for future
payments through the healthcare continuum.
The American Medical Association (AMA) has been involved in encouraging physi-cians who are willing to spend the time to develop APMs and work with the system. In addition, they are supporting:
• Identifying opportunities to remove barriers in our existing payment systems in the performance of quality of care
• Identifying unintended consequences of APMs and monitoring the performance
• Maintaining a vigilant and constant attention to realizing the benefits to patients
• Focusing on improving care outcomes for patients, while at the same time achieving savings for payers (AMA, 2016)
35

ReferencesAMA. (2016). Medicare Payment Reform. Retrieved September 2016, from www.ama-assn.org: www.ama-assn.org/ama/pub/advocacy/topics/medicare-alternative-payment-models.page
CMS. (2015, September 28). MACRA RFI Posting. Retrieved September 2016, from innovation.cms.gov: innovation.cms.gov/files/x/macra-faq.pdf
CMS. (2016). Electronic Health Records (EHR) Incentive Programs. Retrieved September 2016, from www.CMS.gov: www.cms.gov/Regulations-and-Guidance/Legislation/EHRIncentivePrograms/index.html?redirect=/ehrincentiveprogramsincentiveprogram
CMS. (2016). Physician Quality Reporting System. Retrieved September 2016, from www.CMS.gov: www.cms.gov/Medicare/Quality-Initiatives-Patient-Assessment-Instruments/PQRS/index.html?redirect=/pqri/
CMS. (2016). Value Based Payment Modifier. Retrieved September 2016, from www.CMS.gov: www.cms.gov/Medicare/Medicare-Fee-for-Service-Payment/PhysicianFeedbackProgram/ValueBasedPaymentModifier.html
CMS. (2016). Value Modifier Program. Retrieved September 2016, from www.CMS.gov: www.cms.gov/Medicare/Quality-Initiatives-Patient-Assessment-Instruments/Value-Based-Programs/VMP/Value-Modifier-VM-or-PVBM.html
The Physicians Foundation by Merritt Hawkins. (2016, September). The Physicians Foundation Survey. Retrieved September 2016, from www.physiciansfoundation.org: www.physiciansfoundation.org/uploads/default/Biennial_Physician_Survey_2016.pdf
Lastly, the payment models and initiatives for
quality of care, MACRA contains the “Social Security
Number Removal Initiative”. This initiative requires
SSNs be removed from all Medicare cards.
So what does this really mean for P&C medical
payments? To understand that, we simply need
to look at how Medicare affected P&C with just
a fee schedule. If we think that value based
healthcare is the silver bullet in the payment of
medical payments, we need to think again. We still
have state laws to contend with and adoption of
models and policies. P&C is risky business, not likely
where we will attempt to try these new models
until we can understand the benefit. Providers
are consolidating, physicians are retiring at higher
numbers and they’re really not that enthusiastic
for these changes, according to the 2016 Survey
of America’s Physicians: Practice Patterns and
Perspectives which surveyed over 17,236 physicians
(The Physicians Foundation by Merritt Hawkins,
2016). These new models could affect change in
P&C specifically in negotiating BI claims. As we did
with fee schedule adoption in P&C, the results of the
new models will need to be evaluated over time.
The Compliance Corner35

36 Compliance Corner
International Classification of Diseases, 10th Revision-Clinical Modification and Procedural Coding System (ICD-10-CM/PCS) Update
ICD-10-Clinical Modification (CM) and Procedural
Coding System (PCS) has over 5,000 changes and/
or additions in fiscal year 2017. The information was
released in June 2016 for fiscal year beginning Oct.
10, 2016. The effective date of Oct. 1 for these new
revisions applies to all sectors of health payment,
including Property and Casualty (P&C) where ICD-10
is specifically adopted. Mitchell has been working
to implement all of the new changes within our
databases to be on time for usage by our customers.
The significant number of new codes being added
are due for a freeze on updates to ICD-10 codes
before the Oct. 1, 2015 implementation date,
caused by an overlap of ICD-9 expiration.
On June 2, 2016, the Centers for Medicare
and Medicaid Services (CMS) released the PCS
(procedure) codes. The PCS codes are used by
hospitals to report procedures performed on
inpatient admissions.
Summary of updates for PCS (Procedure) Codes are:• 3,836 New/Added• 12 Deleted • 491 Revised
The new codes are found in the Medical and
Surgical, Administration, Measurement and
Monitoring and New Technology sections.
On June 24, 2016 the Centers for Disease Control
and Prevention released the CM (Diagnosis) codes.
The CM codes are used for all bill types reporting
diagnoses (CMS/UB).
Summary of updates for CM (Diagnosis) Codes are:• 2,305 new/added• 212 deleted• 551 revised
The following is a brief synopsis of additions and
changes throughout the code set that are relevant
to the Property & Casualty industry. Mitchell has
observed many changes to the code sets we
frequently use in P&C.
• Chapter 6 (Diseases of the Nervous System) include carpal tunnel disorder and various lesions of specific nerves.
• Chapter 13 (Diseases of the Musculoskeletal System and Connective Tissue) added pain in joints of the hand, more specificity to temporomandibular joints, cervical disc disorders at specific levels, atypical femoral fractures and periprosthetic fractures.
• Chapter 19 (Injuries, Poisoning and Certain Other Consequences of External Causes) made significant additions regarding fractures to bones of skull and foot.
• Chapter 20 (External Causes of Morbidity) updated some of the vehicular accident codes and added contact with paper or sharp objects and overexertion external cause codes.
The final code updates and addendum were posted to the links below:
• PCS (Procedure) www.cms.gov/Medicare/Coding/ICD10/index.html
• CM (Diagnosis) www.cdc.gov/nchs/icd/icd10cm.htm, www.cms.gov/Medicare/Coding/ICD10/index.html
Coding and ReportingThe ICD-10-CM Official Guidelines for Coding
and Reporting has been updated for FY 2017.
These guidelines have been approved by the
37

four organizations that make up the cooperating
parties for the ICD-10-CM: the American Hospital
Association (AHA), the American Health Information
Management Association (AHIMA), Center for
Medicare and Medicaid (CMS), and National Center
for Health Statistics (NCHS), www.cdc.gov/nchs/
data/icd/10cmguidelines_2017_final.pdf
Managing New York Durable Medical Equipment in P&C
Recently, Mitchell’s Internal Regulatory Committee
was called to research and provide factual
information on the proper billing and payment of
Durable Medical Equipment (DME) charges under
New York Workers’ Compensation fee schedule for
both auto and workers’ compensation claims. In
researching, we found several references that should
help customers with their claims.
To set the background, New York State Workers’
Compensation Board (NY WCB) had previously
adopted the NYS Medicaid fees and rules governing
DME payments. Per an email response provided to
Mitchell from the NY WCB on March 20, 2013:
“For DME items that do not have an MRA, the rental
fee is calculated at 1/6th of the equipment provider’s
acquisition cost. The total accumulated monthly
rental charges may not exceed the actual purchase
price of the item. If the item is eventually purchased,
all accumulated monthly rental payments including
Medicare and other third party payments will be
applied to the total purchase price of the item. Where
there is prolonged need for a piece of DME and
purchase is either undesirable or unavailable, rental
terms will be set by the DOH Medical Director.”
New York Workers’ Compensation fee schedule
adopted the New York State Medicaid fee schedule
for DME under Part 442 of Title 12 NYCRR, section
442.2. Previously, the rules of NYS Medicaid,
including the reference to allowing 1/6th the
purchase price on rental charges were also adopted.
However, per notification in April 2009 the following
change was made:
“Note: The Medicaid provider manual for durable
medical equipment and the policy guidance do not
apply to workers’ compensation except to the extent
such documents contain the Medicaid durable
medical equipment fee schedule. Application of the
durable medical fee schedule is based on Workers’
Compensation statute, rules and regulations in
addition to the durable medical equipment fee
schedule. Only the Board in the exercise of its
adjudicatory function is authorized to determine
entitlement to benefits based on the specific facts
of a given claim and the application of the law
to those facts. No-Fault cases may be subject to
differing interpretations. For information regarding
No-Fault Insurance, contact NYS Department of
Financial Services at dfs.ny.go” (New York Workers’
Compensation Board)
As stated, the updated DME fee schedule under
442.2 no longer follows the Medicaid guidelines
(NYS Medicaid Program Durable Equipment Manual
Policy Guidelines Version 2009-2) when the DME
code is not in the fee schedule. Therefore, pricing
for DME codes not listed would be considered “By
Report” and payable at carrier’s discretion.
New York Workers’ Compensation Board. (n.d.). Retrieved September 2016, from www.wcb.ny.gov/content/main/hcpp/FeeSchedules.jsp
The Compliance Corner37

3838
In previous editions of the Industry Trends Report
we reviewed the top 10 procedure codes used in
various states of jurisdiction for the automobile
insurance marketplace. What we discovered was
that the top 10 medical service codes served as a
fingerprint for each state revealing how providers
avail themselves to various medical services to
a greater or lesser extent based on jurisdiction.
For example, in the Pacific Northwest, the top 10
procedure codes represented nearly 50 percent of
the total charges, while in New York, the top 10
procedure codes only represented 10 percent of the
total charges. Additionally, the Pacific Northwest
top 10 consisted purely of physical medicine services
while the New York top 10 included both physical
medicine and advanced diagnostic imaging services.
In this edition of the Industry Trends Report, we are
going to look at the use of diagnosis codes in the
emergency room and throughout the entire first party
automobile insurance claim lifecycle to determine if
it too serves as a state's fingerprint.
It is worth noting that not all states are created equal
when it comes to available policy limits and there
is potential for these limitations to mitigate the use
of more extensive injury diagnoses. However, the
diagnosis assigned at the emergency room is rarely
impacted by this factor as it is typically one of the
earliest bills presented on a claim. Since the emergency
room bill is one of the earliest bills presented, we
can take a look at results based on loss year and
immediately start to see differences state by state.
By Ed OlsenSr. Business Process Consultant, Mitchell Casualty Solutions Group
Data Insights
Data Insights
Since the emergency room bill is one of the earliest bills presented, we can take a look at results based on loss year and immediately start to see differences state by state.
39

In Michigan, with unlimited personal injury
protection (PIP), there is a fairly consistent split
between those seeking emergency room treatment
and those who do not, with approximately 42
percent choosing not to go to the emergency room
while 58 percent decide to visit the emergency
room. Comparing Michigan’s result with either Texas
or Florida we can see pretty remarkable differences
as it relates to the single decision of whether or
not to treat in the emergency room. In Texas,
approximately 80 percent of claimants do not treat
in the emergency room while in Florida the percent
of claimants choosing not to go the emergency
room has been steadily declining to its current state
that closely approximates Michigan’s result with
approximately 46 percent of claimants opting to
not treat in the emergency room.
By scoring and categorizing every diagnosis as
either a non-traumatic, soft tissue, nerve and/or
intervertebral disk, fracture and/or dislocation and
head injury, each medical bill processed and every
claimant can be categorized according to their worst
diagnosis. Upon investigating the worst diagnosis
assigned to each individual claimant by the doctors
that examined and billed for services rendered in
the emergency room we start to see similarities
emerge. For instance, it is readily apparent that in
Florida and Texas the majority of claimants have a
soft tissue sprain and/or strain injury as their worst
diagnosis. The next factor observed is that claimants
with fractures and/or dislocation injuries make up
the second largest group of claimants treated in
the emergency room. The final two factors involve
claimants with nerve and intervertebral disk injuries
(IVD) and head injuries (i.e. concussions, traumatic
brain injury). The trend observed for both of these
diagnosis categories is interesting—in both Texas
and Florida the percent of claimants leaving the
emergency room with some type of head injury
diagnosis started to increase in 2015 while the
percent of claimants leaving the emergency room
with a nerve or disk injury has remained relatively
consistent at approximately two percent.
Michigan Claimants Seeking Emergency Room Treatment
Florida Claimants Seeking Emergency Room Treatment
Texas Claimants Seeking Emergency Room Treatment
Data Insights39

40 Data Insights
By continually monitoring a claimant’s diagnosis
progression after they leave the emergency room
we find that both Florida and Texas see a marked
increase in the number of claimants diagnosed with
nerve and IVD injuries. In Florida, while only 1.5
percent of claimants leave the emergency room with
a nerve or IVD injury, a full 20 percent of claimants
who sought emergency room treatment ultimately
end up with a nerve related injury diagnosis.
Texas sees a similar phenomenon with two percent
of claimants leaving the emergency room with a
nerve related injury and approximately nine percent
of these claimants ultimately being diagnosed
with a nerve or IVD injury. An interesting side note
is that the progression to a nerve or IVD injury
occurs earlier in the claim life cycle in Florida than in
Texas as reflected by the marked decrease in Texas
claimants seen in loss year 2016 and the consistent
nature of Florida’s result throughout all periods.
Looking a little deeper and considering all claimants,
whether they visited the emergency room or not,
we see that even a greater percentage of claimants
ultimately end up with a nerve or IVD related
injury. If we compare claimants who visited the
emergency room with those who did not, we find
that in 20 percent of Florida claimants who visited
the emergency room and 40 percent of those
claimants that never treated in the emergency
room are ultimately diagnosed with nerve or IVD
injury. For those Florida claimants never treated in
the emergency room the percent of claimants with
nerve and IVD related injuries has been gradually
increasing, and starting with loss year 2013, the
percent of claimants with nerve or IVD related
injuries actually surpassed the percent of claimants
with soft tissue injuries. The average charge per
claimant in Florida for nerve and disk injured
claimants has remained consistently higher than soft
tissue injury claimants and the gap is getting wider.
While nerve injury related treatment in 2011 was 20
percent higher than soft tissue injury treatment, by
2014 nerve related treatment was twice that of soft
tissue claims in Florida. In Texas the average charge
per claimant has remained a fairly constant—56
percent higher for nerve and IVD related treatment
when compared to soft tissue injury treatment.
It should not be a surprise that treatment for nerve
and IVD related injuries has a higher average charge
per claimant as they may require more advanced
and costly diagnostic testing and/or surgeries.
What is at least intriguing is the number of claimants
having never sought emergency room treatment
who are ultimately diagnosed with nerve related
injuries. This should not be interpreted to mean
that nerve and IVD injuries in claimants that never
treated in the emergency room are not possible.
What it should be interpreted to mean is that
review of medical documentation is essential to
the determination of medical necessity and
causal relationship.
41

Florida Claimants with Nerve/Disk Injuries
Florida ER ClaimantsWorst Diagnosis
Florida ER Claimants with Nerve/Disk Injuries
Texas ER Claimants with Nerve/Disk Injuries
Texas ER ClaimantsWorst Diagnosis
Texas Claimants with Nerve/Disk Injuries
Data Insights41

4242 ACS Medical Price Index
The National CPI for All Services, as reported by
the Bureau of Labor Statistics, is presently 119.68,
which is up 0.35 percent in Q2 2016 since Q1 2016.
For the same period of time, Q1 2016 to Q2 2016,
the National Auto Casualty MPI increased by 2.56
percent and presently sits at 121.54. Since Q1 2006,
the MPI has increased 21.54 percent while the
National CPI for All Services increased 19.68 percent.
(Source: U.S. Bureau of Labor Statistics, adjusted. Consumer Price Index—All Services—All Urban Consumers, Series CUUR0000SA0. Available at data.bls.gov/cgi-bin/surveymost?cu)
• Charges associated with physical medicine
services experienced a 2.15 percent increase
in Q2 2016 from Q1 2016. This increase brings
the total unit cost change for physical medicine
since Q1 2006 to 6.3 percent, significantly below
the National CPI for All Services reported by the
Bureau of Labor Statistics. Recall that the physical
medicine MPI is looking strictly at unit charge
while holding utilization constant. No significant
changes in technology to deliver physical
medicine services have been discovered that
might influence the unit charge of these services.
Auto Casualty Medical Price IndexBy Ed OlsenSr. Business Process Consultant, Mitchell Casualty Solutions Group
Charges associated with physical medicine services experienced a 2.15 percent increase in Q2 2016 from Q1 2016.
43

• The unit cost for major radiology services
increased 3.35 percent in Q2 2016 from Q1 2016
and presently sits at 127.65. Despite this increase,
MPI for major radiology services remains 1.1
percent below the service groups high of 128.75
experienced in Q4 2013.
• The unit cost for evaluation and management
services increased 3.87 percent in Q2 2016 when
compared with its Q1 2016 result. Since Q1 2006
evaluation and management services have seen
unit charge increase 78.9 percent as reflected by
the index value 178.9. In the first two quarters of
2016, the index for evaluation and management
services has increased 6.5 points.
• The unit charge for professional services in the
emergency room continues to rise. In Q2 2016,
professional services in the emergency room
experienced a 3.22 percent increase since Q1 2016
Since Q1 2006, this service group has experienced
a 93.75 percent increase in the unit charge of
professional emergency room evaluation and
management services. In the first two quarters
of 2016, the index for professional services in the
emergency room has increased 5.5 points.
ACS Medical Price Index43

44 ACS Medical Price Index
Emergency Room MPI
Physical Medicine MPI
45

Evaluation & Management MPI
Major Radiology MPI
National MPI
ACS Medical Price Index45

4646
The National CPI for All Services, as reported by the
Bureau of Labor Statistics, is presently 119.68 which
is up 0.35 percent in Q2 2016 since Q1 2016. For
the same period of time, Q1 2016 to Q2 2016, the
National Workers’ Compensation MPI is virtually
unchanged and presently sits at 112.33. Since Q1
2006, the National Workers’ Compensation MPI has
increased 12.33 percent while the National CPI for
All Services increased 19.68 percent.
(Source: U.S. Bureau of Labor Statistics, adjusted. Consumer Price Index—All Services—All Urban Consumers, Series CUUR0000SA0. Available at data.bls.gov/cgi-bin/surveymost?cu)
• Charges associated with physical medicine
services experienced a 0.82 percent increase since
Q2 2016. This increase brings the total unit cost
change for physical medicine since Q1 2006 to
7.45 percent, significantly below the National CPI
for All Services reported by the Bureau of Labor
Statistics. In the first two quarters of 2016, the
MPI for physical medicine services has increased
4.6 percent. Recall that the physical medicine MPI
is looking strictly at unit charge while holding
utilization constant. No significant changes in
technology to deliver physical medicine services
have been discovered that might influence the
unit charge of these services.
Workers’ Compensation Medical Price Index
WCS Medical Price Index
By Ed OlsenSr. Business Process Consultant, Mitchell Casualty Solutions Group
In the first two quarters of 2016, the MPI for physical medicine services has increased 4.6 percent.
47

evaluation and management unit charge has
increased 28.69.
• Since Q1 2016, the unit charge of professional
services performed in the emergency room
setting has increased 15.57 percent. This increase
brings the MPI to 168.1 which reflects a 68.1
percent increase in the unit charge since Q1
2006. In the previous edition of ITR we reported a
3.16 percent improvement in unit charge for the
period Q4 2015 to Q1 2016 and indicated that
we believed it to be a temporary improvement.
The current reporting periods’ result supports
that conclusion.
• While the unit cost for major radiology services
experienced by the workers’ compensation
industry has increased 2.05 percent in Q2 2016,
when compared to Q1 2016, it remains virtually
unchanged since Q1 2006. This service groups
current index value of 100.4 indicates the unit
charge has increased 0.4 percent since Q1 2006.
• The unit cost for evaluation and management
services decreased 1.04 percent in Q2 2016
bringing the workers compensation index to
128.69. The 1.04 percent increase experienced in
Q2 2016 essentially eliminated the 1.07 percent
decrease experienced in Q1 2016. Since Q1 2006,
WCS Medical Price Index47

48 WCS Medical Price Index
National MPI
Evaluation & Management MPI
Emergency Room MPI
49
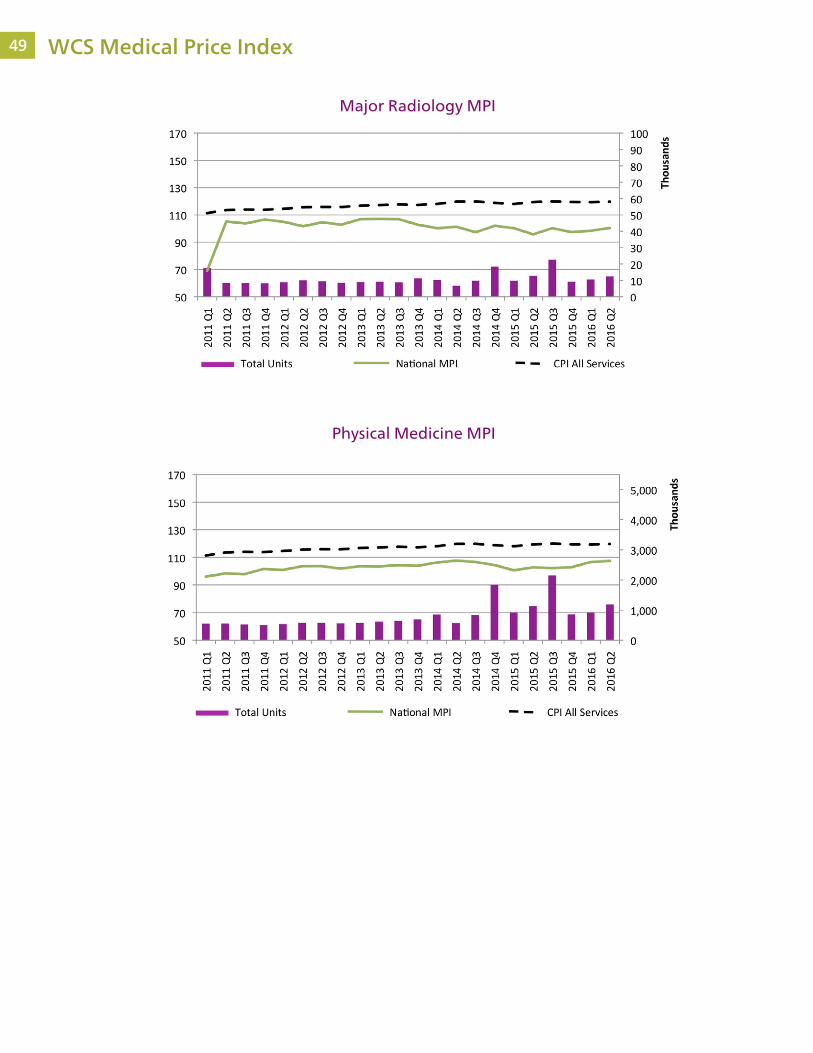
Physical Medicine MPI
Major Radiology MPI
WCS Medical Price Index49

5050
Nearly $1.2 billion is spent annually on pain
management services within the workers’
compensation industry. To address the increasing
demand for cost containment solutions in the
market, Mitchell is pleased to announce the addition
of Adva-Net to its portfolio of Strategic Partners.
Adva-Net has access to over 23,000 contracted
in-network providers and locations. The specialty
solution generates new and enhanced penetration
and savings through a custom EDI bridge within
Mitchell’s SmartAdvisor® bill review platform. Adva-
Net’s expansive network provides negotiated rates
for all facets of comprehensive pain management
treatment, including evaluations, injections, physical
and behavioral rehabilitation, drug screening
and addiction recovery. The prospective and
Partner Spotlight—Adva-Net
Partner Spotlight
retrospective application of Adva-Net’s provider
agreements, coupled with its expansive network,
creates the opportunity to generate substantial
savings on specialty pain management bills.
Read more about Mitchell and Adva-Net’s
partnership in the official Mitchell press release.
Adva-Net has access to over 23,000 contracted in-network providers and locations.

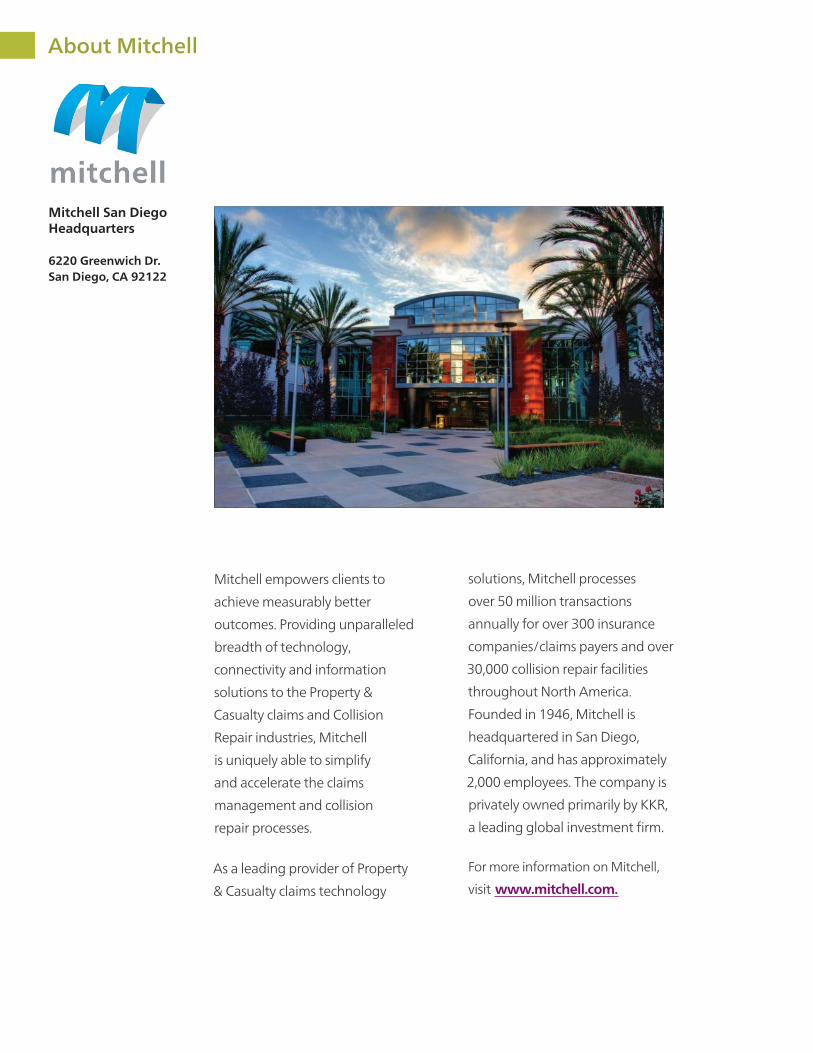
About Mitchell
Mitchell San Diego Headquarters 6220 Greenwich Dr. San Diego, CA 92122
Mitchell empowers clients to
achieve measurably better
outcomes. Providing unparalleled
breadth of technology,
connectivity and information
solutions to the Property &
Casualty claims and Collision
Repair industries, Mitchell
is uniquely able to simplify
and accelerate the claims
management and collision
repair processes.
As a leading provider of Property
& Casualty claims technology
solutions, Mitchell processes
over 50 million transactions
annually for over 300 insurance
companies/claims payers and over
30,000 collision repair facilities
throughout North America.
Founded in 1946, Mitchell is
headquartered in San Diego,
California, and has approximately
2,000 employees. The company is
privately owned primarily by KKR,
a leading global investment firm.
For more information on Mitchell,
visit www.mitchell.com.

Mitchell in the News
For More Mitchell News:
Mitchell Acquires QmedtrixMitchell announced the acquisition of Qmedtrix, a provider of speciality
bill review and strategic negotiations to the workers' compensation and
auto casualty markets.
Read More
Mitchell to Acquire Integrated Prescription Solutions Mitchell announced it has acquired the assets of Integrated Prescription
Solutions, a pharmacy benefit management (PBM) company for the
workers' compensation industry.
Read More Mitchell Adds Adva-Net to Portfolio of Provider Network SolutionsMitchell announces the addition of Adva-Net as a new strategic partner
to SmartAdvisor.
Read More
7 steps to paying the right amount for bodily injury claimsChris Tidball looks at the factors that have contributed to the rise
in bodily injury claims and the steps adjusters should take while
investigating them.
Read More
Around the P&C insurance industry: September 28, 2016Mitchell announces enhancements to the DecisionPoint medical bill
review solution for first- and third-party auto casualty markets.
Read More
Press Releases Mitchell_IntlMitchell International MitchellRepair Mitchell ClaimsMitchellPBM

©2016 Mitchell All Rights Reserved.
The Industry Trends Report is a quarterly snapshot of the auto physical damage collision and casualty industries. Just inside— industry highlights, plus illuminating statistics and measures, and more. Stay informed on ongoing and emerging trends impacting the industry, and you, with the Industry Trends Report!
Questions or comments about the Industry Trends Report may be directed to:
Melinda Szkaradnik Marketing Specialist, Mitchell [email protected]
Industry Trends
Report
Volume Five Number FourQ4 2016 Published by Mitchell