Multivariate Volume Visualization through Dynamic Projections
description

Volume Data Analysis and Visualization
Stefan BrucknerDepartment of Informatics
University of Bergen

VISUAL KNOWLEDGE DISCOVERYmake sense of mountains of data
A Data-Driven World …
EARTH SCIENCESMEDICINE BIOLOGY ENGINEERING

Mission Statement
Enable visual knowledge discovery inlarge spatial data collections
1 Effective Navigation in Spatial Data Collections
3 Distributed Collaboration and Communication
2 Real-Time Visualization of Large Datasets
GENERAL METHODOLOGY
ALGORITHMIC SOLUTIONS
TECHNICAL FRAMEWORK

VOLUME DATA ANALYSIS AND VISUALIZATION
Selected Success Stories
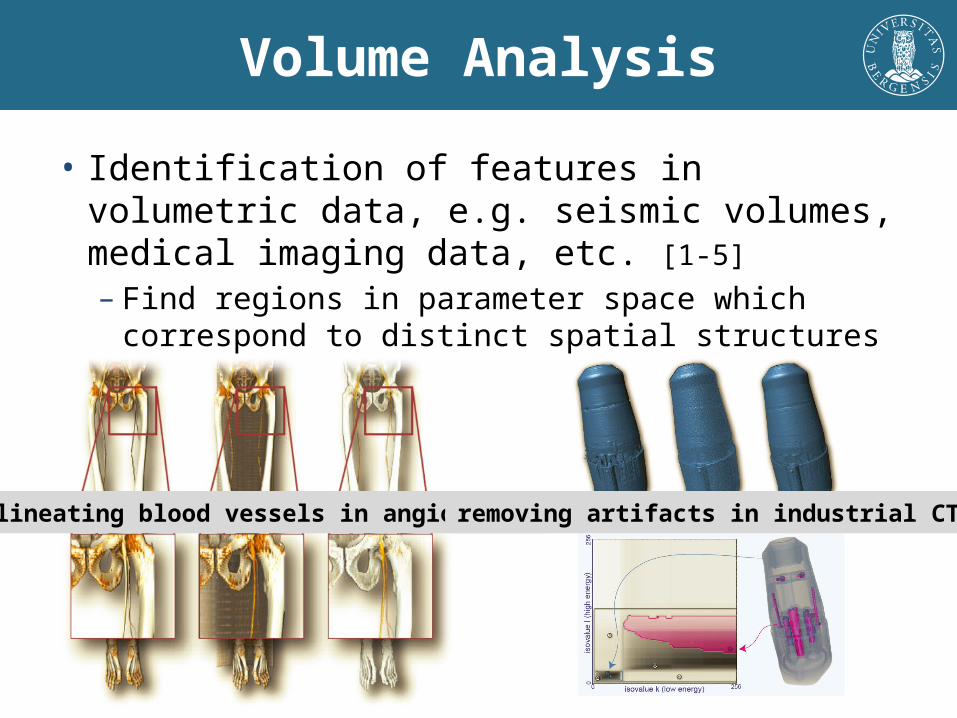
Volume Analysis
• Identification of features in volumetric data, e.g. seismic volumes, medical imaging data, etc. [1-5]– Find regions in parameter space which correspond to
distinct spatial structures
delineating blood vessels in angiography
removing artifacts in industrial CT
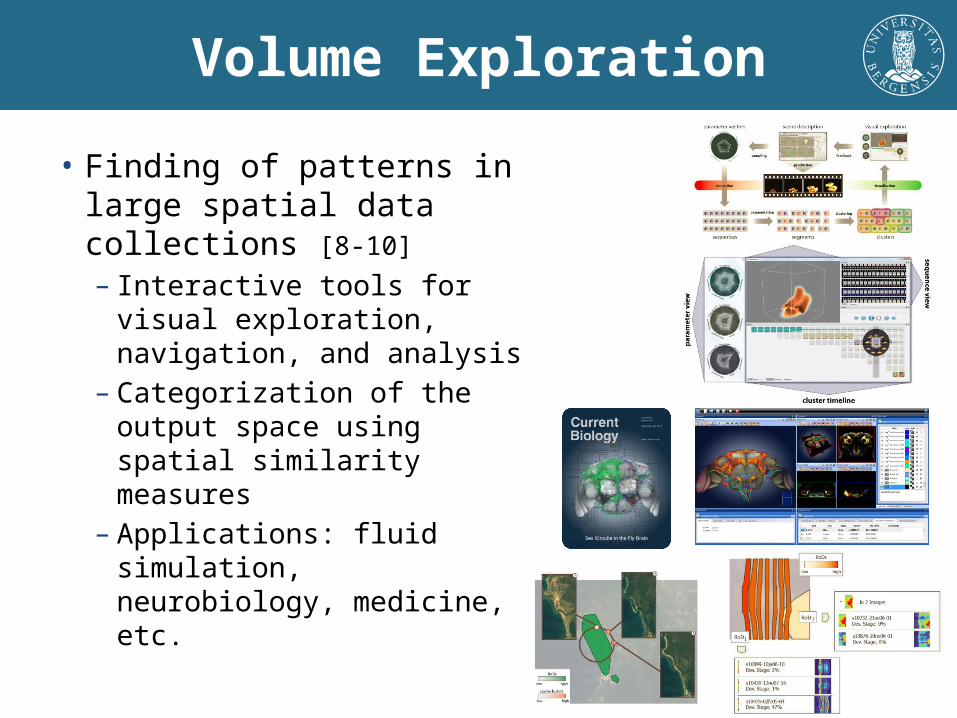
Volume Exploration
• Finding of patterns in large spatial data collections [8-10]– Interactive tools for visual
exploration, navigation, and analysis
– Categorization of the output space using spatial similarity measures
– Applications: fluid simulation, neurobiology, medicine, etc.

Smart Interaction
• AngioVis: advanced visualization for improved diagnosis of vascular decease [11-13]– Next-generation radiology workstation, in daily clinical use at the Vienna
General Hospital
• LiveSync: synchronized interaction with 2D and 3D images in medical workstations [14-17]– Integrated into AFGA HealthCare software, several granted patents
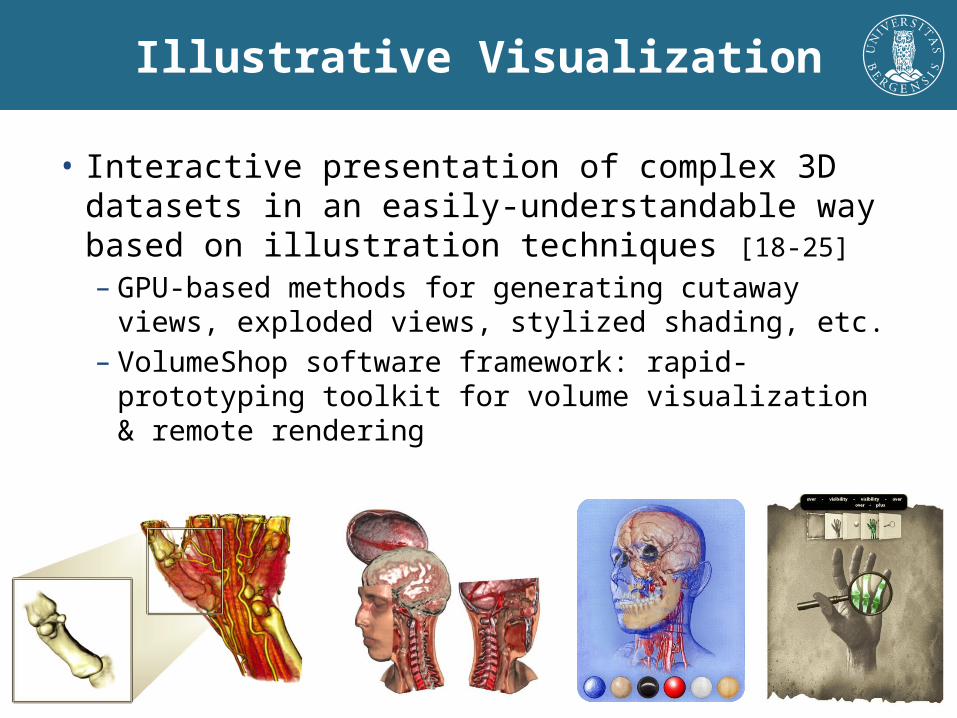
Illustrative Visualization
• Interactive presentation of complex 3D datasets in an easily-understandable way based on illustration techniques [18-25]– GPU-based methods for generating cutaway views,
exploded views, stylized shading, etc.– VolumeShop software framework: rapid-prototyping
toolkit for volume visualization & remote rendering

Real-Time Rendering
• Real-time realistic volume visualization from live 4D ultrasound data [26-28]– High-quality rendering with at a fraction
of the cost of previous methods– Research and technology transfer project
with GE Healthcare, available on Voluson US scanners
References (1)[1] M. Haidacher, S. Bruckner, A. Kanitsar, and M. E. Gröller, “Information-based transfer functions for multimodal visualization,” in Proceedings of Visual Computing for Biomedicine 2008, pp. 101–108, 2008.[2] M. Haidacher, D. Patel, S. Bruckner, A. Kanitsar, and M. E. Gröller, “Volume visualization based on statistical transfer-function spaces,” in Proceedings of IEEE Pacific Visualization 2010, pp. 17–24, 2010.[3] D. Patel, S. Bruckner, I. Viola, and M. E. Gröller, “Seismic volume visualization for horizon extraction,” in Proceedings of IEEE Pacific Visualization 2010, pp. 73–80, 2010.[4] S. Bruckner and T. Möller, “Isosurface similarity maps,” Computer Graphics Forum, vol. 29, no. 3, pp. 773–782, 2010. EUROVIS 2010 BEST PAPER AWARD.[5] M. Haidacher, S. Bruckner, and M. E. Gröller, “Volume analysis using multimodal surface similarity,” IEEE Transactions on Visualization and Computer Graphics, vol. 17, no. 6, pp. 1969–1978, 2011.[6] S. Bruckner, V. Šoltészová, M. Gröller, J. Hladuvka, K. Bühler, J. Y. Yu, and B. J. Dickson, “BrainGazer – Visual queries for neurobiology research,” IEEE Transactions on Visualization and Computer Graphics, vol. 15, no. 6, pp. 1497–1504, 2009.[7] S. Bruckner and M. E. Gröller, “Instant volume visualization using maximum intensity difference accumulation,” Computer Graphics Forum, vol. 28, no. 3, pp. 775–782, 2009.[8] S. Bruckner and T. Möller, “Result-driven exploration of simulation parameter spaces for visual effects design,” IEEE Transactions on Visualization and Computer Graphics, vol. 16, no. 6, pp. 1467–1475, 2010.[9] P. Mindek, S. Bruckner, M. E. Gröller, “Contextual Snapshots: Enriched Visualization with Interactive Spatial Annotations,” in Proceedings of the Spring Conference on Computer Graphics 2013. SCCG 2013 BEST PAPER AWARD.[10] J. Schmidt, M. E. Gröller, and S. Bruckner, “VAICo: Visual Analysis for Image Comparison,“ IEEE Transactions on Visualization and Computer Graphics, vol. 19, no. 6, pp. 2090-2099, 2013.[11] G. Mistelbauer, H. Bouzari, R. Schernthaner, I. Baclija, A. Köchl, S. Bruckner, M. Sramek, M. E. Gröller, “Smart Super Views – A Knowledge-Assisted Interface for Medical Visualization,” in Proceedings of IEEE VAST 2012, pp. 163–172, 2012.[12] G. Mistelbauer, A. Morar, A. Varchola, R. Schernthaner, I. Baclija, A. Köchl, A. Kanitsar, S. Bruckner, M. E. Gröller, “Vessel Visualization using Curvicircular Feature Aggregation,“ Computer Graphics Forum, vol. 32, no. 3, pp. 231–240, 2013.[13] T. Auzinger, G. Mistelbauer, I. Baclija, R. Schernthaner, A. Köchl, M. Wimmer, M. E. Gröller, and S. Bruckner, “Vessel Visualization using Curved Surface Reformation,“ IEEE Transactions on Visualization and Computer Graphics, vol. 19, no. 6, pp. 2858–2867, 2013.[14] P. Kohlmann, S. Bruckner, A. Kanitsar, and M. E. Gröller, “LiveSync: Deformed viewing spheres for knowledge-based navigation,” IEEE Transactions on Visualization and Computer Graphics, vol. 13, no. 6, pp. 1544–1551, 2007.
References (2)[15] S. Bruckner, P. Kohlmann, A. Kanitsar, and M. E. Gröller, “Integrating volume visualization techniques into medical applications,” in Proceedings of the International Symposium on Biomedical Imaging 2008, pp. 820–823, 2008.[16] P. Kohlmann, S. Bruckner, A. Kanitsar, and M. E. Gröller, “LiveSync++: Enhancements of an interaction metaphor,” in Proceedings of Graphics Interface 2008, pp. 81–88, 2008.[17] P. Kohlmann, S. Bruckner, A. Kanitsar, and M. E. Gröller, “Contextual picking of volumetric structures,” in Proceedings of the IEEE Pacific Visualization 2009, pp. 185–192, 2009.[18] S. Bruckner and M. E. Gröller, “VolumeShop: An interactive system for direct volume illustration,” in Proceedings of IEEE Visualization 2005, pp. 671–678, 2005.[19] S. Bruckner, S. Grimm, A. Kanitsar, and M. E. Gröller, “Illustrative context-preserving exploration of volume data,” IEEE Transactions on Visualization and Computer Graphics, vol. 12, no. 6, pp. 1559–1569, 2006.[20] S. Bruckner and M. E. Gröller, “Exploded views for volume data,” IEEE Transactions on Visualization and Computer Graphics, vol. 12, no. 5, pp. 1077–1084, 2006.[21] S. Bruckner and M. E. Gröller, “Style transfer functions for illustrative volume rendering,” Computer Graphics Forum, vol. 26, no. 3, pp. 715–724, 2007. EUROGRAPHICS 2007 3RD BEST PAPER AWARD.[22] P. Rautek, S. Bruckner, and M. E. Gröller, “Semantic layers for illustrative volume rendering,” IEEE Transactions on Visualization and Computer Graphics, vol. 13, no. 6, pp. 1336–1343, 2007.[23] S. Bruckner and M. E. Gröller, “Enhancing depth-perception with flexible volumetric halos,” IEEE Transactions on Visualization and Computer Graphics, vol. 13, no. 6, pp. 1344–1351, 2007.[24] P. Rautek, S. Bruckner, and M. E. Gröller, “Interaction-dependent semantics for illustrative volume rendering,” Computer Graphics Forum, vol. 27, no. 3, pp. 847–854, 2008.[25] S. Bruckner, P. Rautek, I. Viola, M. Roberts, M. C. Sousa, and M. E. Gröller, “Hybrid visibility compositing and masking for illustrative rendering,” Computers & Graphics, vol. 34, no. 4, pp. 361–369, 2010.[26] V. Šoltészová, D. Patel, S. Bruckner, and I. Viola, “A multidirectional occlusion shading model for direct volume rendering,” Computer Graphics Forum, vol. 29, no. 3, pp. 883–891, 2010.[27] T. Ropinski, S. Diepenbrock, S. Bruckner, K. Hinrichs, and M. E. Gröller, “Unified Boundary-Aware Texturing for Interactive Volume Rendering,” IEEE Transactions on Visualization and Computer Graphics, vol. 18, no. 11, pp. 1942–1955, 2012.[28] D. Patel, V. Šoltészová, J. M. Nordbotten, and S. Bruckner, “Instant Convolution Shadows for Volumetric Detail Mapping,“ ACM Transactions on Graphics, vol. 32, no. 5, pp. 154:1–154:18, 2013.