VOLUME 87 NUMBER 6 7 FEBRUARY 2006 NS PAGES … Precursors and Forecasts... · Monitoring the...
17
Following more than 30 years of seismic and volcanic quiescence, the Canary Islands region located off the northwestern coast of Africa started to show signs of seismovolca- nic activity at the end of 2003 (Figure 1). In spring 2004, there was a significant increase in the number of seismic events (a mixture of volcano-tectonic events and regional earthquakes with pure volcanic events such as tremors and long-period signals) located inland on Tenerife Island. The increase ofactivity in 2004 coincided with an increase of fumarolic activity at the Teide volcano on Tenerife Island, an increase in the emission of carbon dioxide in the northwestern part of the island, and changes in the gravimetric field on the northern flank of the volcano.After several seismic events had been felt by the population, the first alert level was declared by the civil protection divi- sion of the local government. This apparent reawakening of Teide, which last erupted in 1909, provides an opportunity to study from the initial stages the reactivation of this volca- nic area and its related phenomena. This article presents an automatic seismic monitoring system, the Teide Information Seismic Server (TISS), that is monitoring the internal status of the volcano by means of real-time seismic background noise analysis. The system’s main goal is to detect precur- sors to a potentially dangerous eruptive epi- sode at an early stage.The system, in opera- tion at Teide volcano since November 2004, has proven useful in monitoring changes in the behavior of the volcano’s processes, such as fumarole venting and seismic activity.These external manifestations of the volcano’s pro- cesses have been preceded by changes in the monitored parameters (see Figure 2). A Brief History Several eruptions have taken place in the Canary Islands in the last 500 years, all of them of the effusive type, where lava flows freely without explosive power.Teide (28.27ºN, 16.6ºW) is a complex stratovolcano, the third-tallest volcano on Earth from base to tip, reaching an altitude of 3717 meters above sea level and approximately 7000 meters above the adjacent seabed.Teide’s last explosive-type eruptions have been dated as having occurred around 1500 years ago. Future eruptions are considered likely and will include the risk of highly dangerous pyroclastic flows similar to those on Mount Pelée (Martinique) and Mount Vesuvius (Italy).The Teide volcano’s explosive erup- tions are the result of magma mixing pro- cesses in which basaltic eruptions act as a triggering mechanism. In 1990, the International Association of Vol- canology and Chemistry of the Earth’s Interior (IAVCEI) identified Teide as being worthy of particular study in light of its history of large, destructive eruptions and its proximity to pop- ulated areas. For the present high-risk level, since 1992 Teide has been considered by the IAVCEI as one of the European Laboratory Volcanoes, thus receiving special consider- ation from the European Union concerning research proposals. VOLUME 87 NUMBER 6 7 FEBRUARY 2006 PAGES 61–72 Eos, Vol. 87, No. 6, 7 February 2006 EOS, TRANSACTIONS, AMERICAN GEOPHYSICAL UNION PAGES 61, 65 Monitoring the Reawakening of Canary Islands’Teide Volcano BY A. GARCÍA, J.VILA, R. ORTIZ, R. MACIA, R. SLEEMAN, J. M. MARRERO, N. SÁNCHEZ, M. T ÁRRAGA, AND A. M. CORREIG Fig. 1. (top) Signs of activity at the Teide volcano (October 2004). Picture provided by the munici- pal government of Icod de los Vinos (Tenerife, Canary Islands, Spain). (bottom left) Epicentral locations of events from January 2000 to June 2005. Red dots indicate events from May 2004 to July 2005. (bottom right) Evolution of the cumulative seismic energy released by earthquakes located inland on Tenerife (data provided by the Spanish Instituto Geográfico Nacional).
Transcript of VOLUME 87 NUMBER 6 7 FEBRUARY 2006 NS PAGES … Precursors and Forecasts... · Monitoring the...

Following more than 30 years of seismicand volcanic quiescence, the Canary Islandsregion located off the northwestern coast ofAfrica started to show signs of seismovolca-nic activity at the end of 2003 (Figure 1). Inspring 2004, there was a significant increasein the number of seismic events (a mixtureof volcano-tectonic events and regionalearthquakes with pure volcanic events suchas tremors and long-period signals) locatedinland on Tenerife Island.
The increase ofactivity in 2004 coincidedwith an increase of fumarolic activity at the Teide volcano on Tenerife Island, an increase in the emission of carbon dioxide in the northwestern part of the island, and changes in the gravimetric field on the northern flank of the volcano.After several seismic events had been felt by the population, the first alert level was declared by the civil protection divi-sion of the local government. This apparent reawakening of Teide, which last erupted in 1909, provides an opportunity to study from the initial stages the reactivation of this volca-nic area and its related phenomena.
This article presents an automatic seismicmonitoring system, the Teide InformationSeismic Server (TISS), that is monitoring theinternal status of the volcano by means ofreal-time seismic background noise analysis.The system’s main goal is to detect precur-sors to a potentially dangerous eruptive epi-sode at an early stage.The system, in opera-tion at Teide volcano since November 2004,has proven useful in monitoring changes inthe behavior of the volcano’s processes, suchas fumarole venting and seismic activity.Theseexternal manifestations of the volcano’s pro-cesses have been preceded by changes inthe monitored parameters (see Figure 2).
A Brief History
Several eruptions have taken place in theCanary Islands in the last 500 years, all of
them of the effusive type, where lava flowsfreely without explosive power.Teide(28.27ºN, 16.6ºW) is a complex stratovolcano,the third-tallest volcano on Earth from baseto tip, reaching an altitude of 3717 metersabove sea level and approximately 7000meters above the adjacent seabed.Teide’slast explosive-type eruptions have beendated as having occurred around 1500 yearsago. Future eruptions are considered likelyand will include the risk of highly dangerous
pyroclastic flows similar to those on MountPelée (Martinique) and Mount Vesuvius(Italy).The Teide volcano’s explosive erup-tions are the result of magma mixing pro-cesses in which basaltic eruptions act as atriggering mechanism.
In 1990, the International Association of Vol-canology and Chemistry of the Earth’s Interior(IAVCEI) identified Teide as being worthy ofparticular study in light of its history of large,destructive eruptions and its proximity to pop-ulated areas. For the present high-risk level,since 1992 Teide has been considered by theIAVCEI as one of the European Laboratory Volcanoes, thus receiving special consider-ation from the European Union concerning research proposals.
VOLUME 87 NUMBER 6
7 FEBRUARY 2006
PAGES 61–72
Eos, Vol. 87, No. 6, 7 February 2006
EOS, TRANSACTIONS, AMERICAN GEOPHYSICAL UNION
PAGES 61, 65
Monitoring the Reawakening of Canary Islands’Teide Volcano
BY A. GARCÍA, J.VILA, R. ORTIZ, R. MACIA, R. SLEEMAN, J. M. MARRERO, N. SÁNCHEZ, M. TÁRRAGA, AND A. M. CORREIG
Fig. 1. (top) Signs of activity at the Teide volcano (October 2004). Picture provided by the munici-pal government of Icod de los Vinos (Tenerife, Canary Islands, Spain). (bottom left) Epicentral locations of events from January 2000 to June 2005. Red dots indicate events from May 2004 to July 2005. (bottom right) Evolution of the cumulative seismic energy released by earthquakes located inland on Tenerife (data provided by the Spanish Instituto Geográfico Nacional).

Eos, Vol. 87, No. 6, 7 February 2006
TEGETEIDE Project
The special topographic characteristics ofthe Canary Islands, combined with the distri-bution of the islands’ more than two millioninhabitants, increase the level of volcanicrisk in this area. A Teide eruption similar tothe last dated explosive type eruption (witha volcanic explosivity index (VEI) of 3) andcomparable with the last eruptions of UnzenVolcano in Japan could affect up to 30,000people; a VEI of 4 could affect more than400,000 people.
The reported increase in seismic activitythat has been observed since spring 2004could represent the beginning of a reactiva-tion of Teide Volcano. An urgent call by theSpanish government to the Spanish NationalCommission on Seismic and Volcanic RiskEvaluation to organize and manage theavailable scientific resources to evaluate thepossibility of an imminent eruption has been considered. As a result of this call, financialsupport for research projects on this areawas provided, and in the spring of 2005, theSpanish National Research Council (CSIC)initiated the TEGETEIDE project (Geophysi-cal and Geodetic Techniques for the Studyof the Teide-Pico Active Volcanic Area) .
This project will develop and implementTISS, which is capable of characterizing thepredominant frequencies and the seismicenergy released that is observed in the back-ground seismic noise at diverse frequencybands.TISS is capable of monitoring in realtime changes of the status of the volcano bycollecting information in the time and thespectral domains, using parameters in whichchanges due to variations in the recordedsignals are easy to observe.The goal is todetect changes before the expected epi-sodes of activity.
TISS is based on a real-time quality-control (RT/QC) analysis of continuously-collected waveform data from seismic stations, and it monitors changes in the behavior of the seis-mic signals.These changes reveal variations in local site effects caused by changes in the volcanic activity.The present TISS process involves two different stages: The first stage,termed ‘data preparation,’ and the second stage, called ‘data analysis.’The main tasks in data preparation are to build the basic data format and to provide visual Live Internet Seismic Server-like outputs (http://www.liss.org).The data analysis stage, which is devoted to waveform analysis, selects fixed-length seg-ments from the already established database,assigns time stamps, and applies subroutines of spectral analysis.
The current RT/QC analysis was devel-oped in 2002 to test permanent stations atthe Observatori Fabra in Barcelona, Spain[Llobet et al., 2003]. Its expansion to largenetworks was accomplished in 2004 whenan adaptation of the QC procedure wasdeveloped [Sleeman and Vila, 2006] to moni-tor all stations of the Virtual European Seis-mic Network [Van Eck et al., 2004]. Its off-line application for monitoring changes inbackground noise near active volcanoes is
presented by Vila et al. [2005], who showedthat continuous monitoring of the back-ground seismic noise levels may providesigns of activity more than 40 days soonerthan classical seismological methods basedon earthquake analysis.
The adaptation of TISS for the CanaryIslands uses a power spectral density (PSD)estimation to perform spectral analysis ofthe continuously incoming data [Welsh,1978].TISS computes the PSD of 60-minutesegments, extracted from the pool of contin-uous data, and stores selected parameters astime series.These time series are selectedfrequencies of the PSD, integrated PSD invarious frequency bands (energy relatedparameters), and absolute maximum PSDamplitude and its corresponding frequency,also in various frequency bands. Moreover,the lower envelope of all the PSD curves(minimum value for each frequency)obtained after processing time intervals of24 hours is tracked, thus giving an estimationof all nontransient signals during one fullday of operation.This envelope contains thenoise that is always present at every fre-quency component [Vila et al., 2005] and iscontinuously compared with previous days.TISS provides details of the evolution of thisinformation by means of report plots.
The post-analysis derived time series have asampling rate of the order of one sample perhour, determined by the length of the seg-ments analyzed.These time series are thensuitable to be compared directly with manyother signals, such as deformation, tempera-ture, and gas emission, that are sampled at sim-
ilar sampling rates, thus resulting in a multidis-ciplinary analysis.The sampling rates of thepost-analysis derived time series also allow afast and easy representation of the volcano’sseismic activity.The time series also can beused as new input for any supplementarynear-real-time analysis.This corresponds to thethird level of observatory automatic proce-dures [ESF-EVOP Working Group, 1994].
Evaluation of TISS During 2004
Since first becoming operational in Novem-ber 2004,TISS has shown itself to be very use-ful for monitoring changes in the behavior of the Teide volcano’s processes, such as fuma-roles and seismic activity. For example, on 5 December 2004 a new fissure with fumarole emission appeared in La Orotava valley, on the northeastern flank of Teide volcano (see Figure 2).This was preceded by a significant increase in low-frequency seismic energynine days earlier, with a return to the normal level a few hours after the fissure aperture.During those nine days, the scientific team remained on alert.
TISS archives the original time series datain standard formats such as SEED (Standardfor the Exchange of the Earthquake Data) orGSE (Group of Scientific Experts) and isthus a complete and open system that allows the data to be processed by means of stan-dard seismological software packages.The software package runs under Linux, and all software used can be obtained through GNU and other free software sites.There are no intrinsic limitations for the number of chan-
Fig. 2.Variations in parameters provided by TISS before and after the appearance on 5 December 2004 of the fumarole emission in La Orotava Valley: (a) Daily lower envelope of all 60-minute PSD curves; (b) Evolution of the amplitude; (c) Predominant frequency; (d) Integrated PSD amplitude. Plots (b), (c), and (d) relates data in four frequency bands.
Eos, Vol. 87, No. 6, 7 February 2006
The 20 to 30 years following the first Inter-national Polar Year in 1882–1883 was a period of quickly advancing knowledge and under-standing of auroral phenomena.This was the time when hypotheses of aurora being due to,for example, reflections of fires from the inte-rior of the Earth or sunlight from ice particles were abandoned and replaced by the mecha-nism of precipitating electrons.
One of the auroral researchers at that timewas the Dane Adam Frederik Wivet Paulsen(1833–1907). However, when reading litera-ture about auroral history, his ideas andwork do not seem to have attracted muchinterest outside his own and neighboringcountries. For example, in his sweeping his-torical account Majestic Lights:The Aurora inScience, History, and the Arts [1980], authorRobert Eather only referred to Paulsen in acouple of lines.
Eather did not mention any of Paulsen’s original and still valid ideas, namely, that elec-trical currents flowing parallel to the Earth’s magnetic field exist and move upward within the auroral bands, that the aurora is pro-duced by cathode rays (electrons), and that the source of the cathode rays is located in the upper regions of the Earth’s atmosphere.The purpose of this article is to draw atten-tion to Adam Paulsen and his contributions to the understanding of the aurora.
Paulsen and the 1882–83 Expedition to Greenland
Paulsen was born on 2 January 1833 inNyborg, Denmark. He had planned to be an
officer in the Danish army, and from 1849to 1851 he participated in a war againstGermany. However, an interest in physicschanged his career path. Adam Paulsenearned a master’s degree in physics in1866 from the University of Copenhagen,Denmark, and two years later he wasawarded a gold medal by the same for aprize essay on the different theories ofgalvanism (electricity produced bychemical processes).
After completing his university studies,Paulsen became a high school teacher inCopenhagen. In 1880, at the age of 47, hequit teaching after he was asked by thedirector of the Danish Meteorological Insti-tute to head a Danish expedition to Green-
land during the upcoming Polar Year. Den-mark, as part of an international consortiumthat had pooled their resources to study theArctic, was to conduct meteorological, geo-magnetic, and auroral observations (includ-ing the shape, color, strength, movement, andposition of aurorae). Paulsen, along with fiveother men, sailed from Copenhagen aboardthe Royal Greenland Trade Department’ssmall three-masted sailing ship Ceres on 17May 1882, bound for Godthaab (64º10’N,51º40’W), a small town on the west coast ofGreenland. After a four-week voyage theyarrived at their destination.
The location was found favorable for auro-ral observations. Godthaab is located just onthe poleward side of the belt of maximumauroral activity, an area advantageous for thestudy of the periodic variations of auorae.The team also planned to investigate rela-tionships between the aurora and magneticdisturbances, and to attempt to measure theheight above the ground of the aurora,because such knowledge might help to dis-close its causal mechanisms.
The height measurements were not suc-cessful, because the distance of about fivekilometers between two observation sites onthe ground was much too short for a goodquality triangulation to be made. However,the study of the relation between aurora andmagnetic disturbances inspired Paulsen tosuggest that field-aligned currents exist.Thiswas a milestone in auroral research.
The expedition team returned to Denmarkin the autumn of 1883, and the followingyear Paulsen became the director of theDanish Meteorological Institute, a positionhe held until his death in 1907.
Paulsen’s Discoveries
In a comprehensive report about observa-tions during the International Polar Year andthe following years in Greenland, Paulsen[1893] presented, among other discoveries,observations indicating the existence and
nels or computations.The performance analy-sis of the system reveals that a 1.2 GHz Pen-tium III personal computer can handle more than 400 channels at 100 samples per second.
Sources of data and programming facilities can be found on the TISS Web pages (http://www.sistegeteide.info/tiss and http://sismic.am.ub.es/tiss). Examples of RT/QC implemen-tations are available at http://sismic.am.ub.es/ISEV/ and http://www.orfeus-eu.org/data-info/dataquality.htm.
Acknowledgments
TEGETEIDE (Tenerife) is a project fundedby the Spanish Ministry of Education andScience (contract CGL2003-21643-E).TISS ishosted by the Departament d’Astronomiai Meteorologia of the Universitat de Barce-lona, Spain, and by the municipal govern-ment of Icod de los Vinos (Tenerife). Soft-ware developments are performed together
with the Institut d’Estudis Catalans and theObservatories and Research Facilities forEuropean Seismology.
References
ESF-EVOP Working Group (1994),Automated Systemsfor Volcano Monitoring, Eur.Volcanol. Proj. Monogr.,vol. 2, 20 pp., Eur. Sci. Found., Strasbourg, France.
Llobet,A., J.Vila, O. Fors, and R. Macià (2003), Linuxbased LISS systems:The ISEV and SISLook exam-ples,ORFEUS Electron. Newsl., 5(1), 5.
Sleeman, R., and J.Vila (2006),Towards an automateduniform quality control of the Virtual EuropeanBroadband Seismograph Network (VEBSN),ORFE-US Electron. Newsl.,. In Press.
Van Eck,T., C.Trabant, B. Dost,W. Hanka, and D. Giardini (2004), Setting up a virtual broadbandseimograph network across Europe,Eos Trans.AGU,85(13), 125, 129.
Vila, J., R. Macià, D. Kumar, R. Ortiz, and A. M. Correig(2005), Real time analysis of the unrest of active vol-canoes using variations of the base level noise seis-mic spectrum,J.Volcanol. Geotherm. Res., in press.
Welsh, P. D. (1978),The use of fast Fourier transform forthe estimation of power spectra:A method based
on time averaging over short modified periodo-grams, IEEE Trans.Audio Electroacoust.,AU-15, 70–73.
Author Information
Alicia García, Ramon Ortiz, Jose M. Marrero,Nieves Sánchez, and Marta Tárraga, Departamentode Volcanología, National Museum of Natural Sci-ences–CSIC, Madrid; Josep Vila and Antoni M. Cor-reig, Departament d’Astronomia i Meteorologia,Universitat de Barcelona and Laboratori d’EstudisGeofísics “Eduard Fontserè,” Institut d’Estudis Cata-lans, Barcelona, Spain; Ramon Macià, Departamentde Matemàtica Aplicada 2, Universitat Politècnicade Catalunya, Barcelona, Spain; Reinoud Sleeman,Koninklijk Nederlands Meteorologisch Instituut, DeBilt, Netherlands.
For further information, contact J.Vila; E-mail:[email protected]
Adam Paulsen, a Pioneer in Auroral ResearchPAGES 61, 66
BY T. S. JØRGENSEN AND O. RASMUSSEN
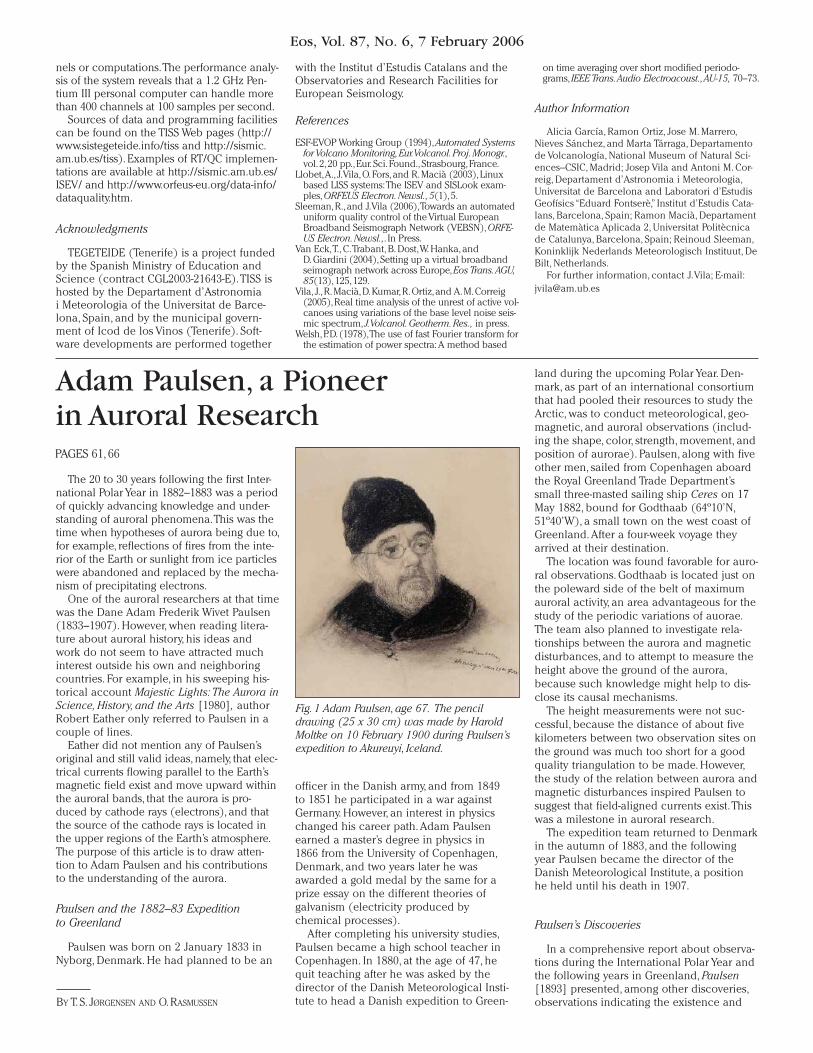
Fig. 1 Adam Paulsen, age 67. The pencil drawing (25 x 30 cm) was made by Harold Moltke on 10 February 1900 during Paulsen’s expedition to Akureuyi, Iceland.

Eos, Vol. 87, No. 43, 24 October 2006
When a volcano that has been dormant
for many centuries begins to show possible
signs of reawakening, scientists and civil
authorities rightly should be concerned
about the possibility that the volcanic unrest
might culminate in renewed eruptive activity.
Such was the situation for Teide volcano,
located on Tenerife in the Canary Islands,
when a mild seismic swarm during April–
July 2004 garnered much attention and
caused public concern. However, that atten-
tion completely ignored the fact that the
seismic recordings of the swarm were due to
a much improved monitoring system rather
than due to an actual event of alarming
magnitude or extent.
It is important in any effective program of
volcano-risk mitigation that the response to
an apparent change in the status of a vol-
cano should include the immediate imple-
mentation or augmentation of monitoring
studies to better anticipate possible outcomes
of the volcanic unrest. Equally important,
emergency-management officials, using avail-
able scientific information and judgment, must
take appropriate precautionary measures—
including information of the populations at
potential risk—while not creating unjust
anxiety or alarm.
This article briefly reviews the circumstances
and unfortunate societal consequences of
the scientific, governmental, and media response
to the seemingly heightened seismic activity
on Tenerife in 2004. This article describes a
series of misinterpretations of geophysical
and geological data that led to raised levels
of alarm on the island, although being of lit-
tle actual volcanological significance.
Volcanological and Structural Evolution
of Mount Teide
At 3718 meters, Mount Teide volcano is
the third-highest volcanic structure on the
planet and the highest peak in the Atlantic
Ocean. Conversely to the intensely studied
and geologically well-understood Hawaiian
volcanoes, many crucial geological aspects
of Teide volcano were insufficiently addressed
until quite recently. As an example, until 2001,
only a single radiometric age was available
for the most recent activity of the Teide vol-
canic complex.
A joint Spanish-French project in 2001–2005
produced a detailed geological map of Teide
and its northwest and northeast rifts, and
provided 28 new radiocarbon ages and 26
K/Ar (potassium/argon) ages. This project
completely changed the understanding of
the geological and structural evolution of
the Teide volcanic complex, allowing the
majority of the eruptions to be separated
into a stratigraphic sequence, particularly
those eruptions that have occurred in the
past 10,000 years (the Holocene).
The results of this study indicated that the
central differentiated (phonolitic) Teide vol-
canic complex was the direct consequence
of the activity of the rifts. The rifts developed
a progressively steepening and unstable vol-
cano at the center of Tenerife, and about
180,000–200,000 years ago rift activity trig-
gered a massive landslide that generated an
impressive horseshoe-shaped collapse
embayment. The embayment’s headwall is
the 17 by 10 kilometer Las Cañadas caldera.
Subsequent rift and central activity progres-
sively filled the embayment, finally building
up the 3718-meter-high Teide stratovolcano,
which is nested in the collapse embayment.
The main phase of construction of Teide
concluded 30,000 years ago. Since then, the
stratovolcano has erupted just once: the
eighth-century summit eruption, during
which the vent system and lavas increased
the elevation of the volcano from about
3600 to 3718 meters.
This recent eruptive history is in stark con-
trast to the much higher explosivity, with fre-
quent plinian eruptions, of the precollapse
activity of the Cañadas volcano (>200,000
years ago). In the past 30,000 years, erup-
tions have occurred at a rate of only four to
six per millennium, with a predominance
(70%) of very low hazard, basaltic eruptions
from fissures and cones on the rift zones,
and the remaining eruptions from phonolitic
lava domes with only localized explosive
activity (e.g., Mña Blanca, ~2000 years ago)
at the basal perimeter of the main stratovol-
Recent Unrest at Canary Islands’ Teide Volcano?PAGE 462, 465
Fig. 1. Seismicity within the island of Tenerife: (a) From 1 January 1985 to 31 December 1999; val-ues listed are the local ‘Richter’ magnitudes; (b) From 1 January 2000 to 1 April 2005 (modified from Instituto Geográfico Nacional, Spain); MbLg is the body wave magnitude using the Lg wave (a surface wave). Note that the MbLg values in (b) are essentially equivalent to the local mag-nitudes in (a), suggesting that seismic intensity between these two time periods has remained constant.

Eos, Vol. 87, No. 43, 24 October 2006
cano. The recent eruptive record, combined
with the available petrological and radiometric
data, provides a rather optimistic outlook on
major volcanic hazards related to Teide and
its rift zones, posing only very localized threats
to the one million inhabitants of Tenerife
and the 4.5 million annual visitors to Teide
National Park.
Unrest at Teide Volcano?
The prediction of an explosive eruption in
2004 was based on reports of significantly
increased earthquake activity and volcanic
gas emissions. However, no major eruption
followed and questions remain whether the
available evidence was used in a correct and
sensible way.
From 22 April to 28 July 2004, about 50
low-magnitude (M = 1–3) earthquakes were
recorded in Tenerife, with most of the epi-
centers localized at the northwest rift zone,
in the area of the Icod Valley. Only three
were felt by residents. Earthquakes of this
type are normal in volcanic oceanic islands
(e.g., Hawaiian Islands, Reunión). In addition,
low-magnitude earthquakes (generally M <
3) have been reported in all of the Canary
Islands (Figure 1). In May 1998, a bigger
earthquake (M = 5.3) hit Tenerife, but television
and newspaper sources notified the public
that the seismic activity was not hazardous,
and the event was promptly forgotten. Prior
to 1998, smaller earthquakes were frequently
recorded throughout the archipelago, but no
volcanic activity took place since the 1971
Teneguía eruption on La Palma island.
In 2004, however, the local and interna-
tional mass media were bombarded with
persistent reports of unrest at Teide volcano
with little to no mention of more conserva-
tive views, and predictions were made of an
imminent, large-scale explosive eruption that
was dubbed ‘El Volcán de Octubre’ (the
‘October Volcano’). The tourist island of
Tenerife was renamed ‘Terrorife’ in the inter-
national press [Christie, 2004], and residents
along the northern coast towns began sleeping
fully dressed and panic-buying food and
other household supplies.
Instead of providing clarifying and reas-
suring press communiqués, the authorities
decided to raise the level of alert on the
basis of a reported increase in seismicity
and the emission of volcanic gases. At no
time was there universally accepted scien-
tific evidence of volcanic activity on the
island, but the ‘volcanic crisis’ alert was offi-
cially maintained until February 2005, with
frequent reports in the media of enormous
emissions of volcanic gases, boiling of the
island aquifer, movements of magma under-
neath the volcano, and impending explosive
eruptions of Teide forecast for October 2004.
Was there any convincing evidence for
this at all? The official institution responsible
for monitoring seismic and volcanic activity
in Spain—the Instituto Geográfico Nacional
(IGN)—improved the seismic network of
Tenerife in 2000. According to the IGN, the
addition of new seismic stations immediately
led to low-magnitude events within the island
being recorded for the first time since sur-
veillance work began in 1985 (Figure 1).
The focal depths of the majority of these
events were not determined as part of the
routine seismic monitoring, and therefore
one of the most powerful constraints in
locating the source of the seismicity was
lacking. An initial interpretation of the seis-
micity suggested dyke emplacement at a
depth of three to four kilometers. However,
the majority of the epicenters were located
far from the rift zone, in an area in the Icod
Valley that satellite interferometry has shown
to have subsided by up to 10 centimeters
[Fernández et al., 2003]. Groundwater has
been continuously and intensively extracted
in this area since the 1960s, depleting the aqui-
fer and causing the ground to sink. Micro-
faulting associated with the subsidence may
well have caused seismicity. It is noteworthy
that according to the interferometry study,
this is the only area of recent ground defor-
mation in Tenerife. The putative eruptive
regions of Teide and Las Cañadas are com-
pletely stable.
But if the source of the seismicity is non-
volcanic, what about the reported enor-
mous increase in gas emission? Continuous,
real-time monitoring of gas emissions at
Teide and the rifts [Martín, 1999] provided
evidence of the nearly constant total gas
emission of the volcanic system (Figure 2a).
Significant diurnal and seasonal variations
in gas emission rates are observed [Soler et
al., 2004] and linked to systematic changes
in barometric pressure (Figure 2b). There-
fore, if discrete measurements are taken
and reported, apparent ‘significant’
increases in gas emissions can be obtained,
which simply correspond to barometric
pressure changes.
Nevertheless, a recent article [García
et al., 2006] insists on the reawakening of Teide
based on the aforementioned seismicity and
volcanic gas emissions. In support of the pre-
diction of increasing volcanic activity, these
authors have cited two apparently new fea-
tures: fumaroles at the summit crater of
Teide and a new fumarole inside the Oro-
tava Valley. Spectacular ‘plumes’ in the sum-
mit area of Teide (known locally as ‘la Toca
del Teide,’ or ‘Teide’s headdress’) are caused
by strong winds and other atmospheric con-
ditions as well as by increased fumarolic
activity related to barometric pressure changes,
and have frequently been cited over the cen-
turies in ships’ logs (Figures 2c and 2d). The
new ‘fumarole’ of the Orotava Valley, in turn,
which gave a clear meteoric water isotopic
signature, is located 50 meters from an
unlined 40-meter-deep well used for the dis-
posal of high-temperature wastes from a
nearby cheese factory, suggesting a rather
more simple explanation for the origin of
this particular vapor exhalation site [Car-
racedo et al., 2006].
It would thus seem that the prediction of an
imminent volcanic eruption at Teide was and
is lacking hard scientific evidence, and its dra-
matic presentation by the media was not only
Fig. 2. (a) Long-term variation in CO2 emission in Tenerife [Martín, 1999]. (b) Short-term varia-
tion of radon-222 (222Rn) and carbon dioxide (CO2) in a deep borehole in Las Cañadas caldera
[from Soler et al., 2004]. (c) Frequent spectacular ‘plumes’ in the summit area of Teide known locally as ‘la Toca del Teide,’ or ‘Teide’s headdress’ (Photo by J. C. Carracedo). (d) Model of the formation of clouds at the summit of Teide volcano by local orographic convergence (see http://www.acanmet.org.es/menu_archivos/documentos/FTLCTeide.doc).

Eos, Vol. 87, No. 43, 24 October 2006
NASA should invest more money in data
analysis for its planetary science missions,
even if it means delaying or canceling a
future mission, members of the science com-
mittee of the NASA Advisory Council (NAC)
suggested at a 12 October meeting.
Science committee member Mark Robinson,
director of the Center for Planetary Sciences
at Northwestern University in Chicago, Ill.,
said that large amounts of data from NASA
planetary science missions are accumulating,
and the funds for data analysis often are
inadequate to properly analyze all of it. For
example, there is a large amount of currently
unanalyzed Mars data that could be used in
planning for the Mars Science Laboratory
(expected to launch in 2009), and particu-
larly for site selection. This includes data
from the recently arrived Mars Reconnais-
sance Orbiter, which is likely to send more
data to Earth in its first year than has been
collected by all previous Mars missions
combined.
Science committee member Alan Stern,
executive director of the Space Science and
Engineering Division of the Southwest Research
Institute in San Antonio, Tex., explained that
missions need to have more research and
analysis (R&A) funds attached to them from
the beginning. As a comparison, in the field
of astrophysics, researchers who are awarded
observing time with the Hubble Space Tele-
scope also are provided funds for analyzing
the data and publishing results. In planetary
missions, the data usually are certified and
archived, but very little of it is properly ana-
lyzed and transformed into scientific results,
he said.
“This is really an issue of getting our value
for the dollar. We spend hundreds of millions,
sometimes billions, [of dollars] on these
planetary missions, and very little of the data
is ever looked at,” Stern said. “I think that it is
the sense of the planetary [science] commu-
nity that skipping a future mission to solve
this problem would be worth it,” he said.
Mary Cleave, associate administrator for
NASA’s Science Mission Directorate, said that
the agency has been trying to maintain an
opportunity for launching a mission to Mars
every 26 months. The agency could skip one
of these launch opportunities and put more
money into R&A, but it needs guidance from
the NAC, she said.
NAC Chair Harrison Schmidtt asked Robin-
son to draw up a formal recommendation
emphasizing the need for NASA to provide
funds for data analysis for these missions.
The council could consider the recommen-
dation at its next meeting in February 2007.
Another issue that could be addressed by
the NAC in February, following initial discus-
sion at the October meeting, is the future
availability of rockets for small- and medium-
sized science missions.
Science committee member Neil DeGrasse
Tyson, director of the Hayden Planetarium at
the American Museum of Natural History in
New York, N.Y., noted that the marketplace
for these rockets has diminished, and that
this could threaten the ability of NASA to
obtain them on time and in needed quanti-
ties. He suggested that the NASA administra-
tor should discuss with other federal agencies
the potential for using other types of rockets
as launch vehicles for NASA science missions.
Science Committee Chair Edward David,
Jr., president of EED, Inc., and a former presi-
dential science advisor, said that “it is impor-
tant that the whole NAC continues to monitor
the situation and make suggestions how to
address the shortage of access.” Schmidtt noted
that there are many other potential launch
systems available and in use by other federal
agencies, particularly the U.S. Department of
Defense.
David also told the NAC that the science
committee needed a member with expertise
in Earth science, citing the departure of former
committee chair Charles Kennel. Schmidtt
said that he hoped such an appointment
would be made by the NASA administrator
within the next few weeks. Kennel was one
of three science committee members who
resigned in August and were replaced the
next month (see Eos 87(40), 2006).
—SARAH ZIELINSKI, Staff Writer
unnecessarily damaging to the tourism-based
economy of the island industry, but also
caused undue anxiety and hardships for citi-
zens coping with the alarmist forecasts (Note,
none of the authors is in any form associated
with the tourism industry anywhere).
Effective and reliable communications
must be established among scientists, gov-
ernment officials, the news media, and the
populace affected, and must be tried and
tested before an actual crisis. This is an
essential step in restoring the credibility of
the scientists and civil authorities, so that
they, working together, will be much better
positioned to respond adequately to a potential
genuine volcanic crisis at Teide.
Acknowledgments
Insightful reviews by Robert I. Tilling and
Chris Stillman greatly improved this contri-
bution and are gratefully acknowledged.
References
Carracedo, J. C., F. J. Pérez Torrado, E. Rodríguez Badiola, A. Hansen, R. Paris, H. Guillou, and S. Scail-let (2006), Análisis de los riesgos geológicos en el Archipiélago Canario: Origen, características, probabilidades y tratamiento, Anu. Estud. Atl., 51, 513–574.
Christie, M. (2004), Welcome to Terrorife, Daily Record, 16 June.
Fernández, J., T. T. Yu, G. Rodríguez-Velasco, and J. González-Matesanz (2003), New geodetic moni-toring system in the volcanic island of Tenerife, Canaries, Spain: Combination of InSAR and GPS techniques, J. Volcanol. Geotherm. Res., 124, 241–253.
García, A., J. Vila, R. Ortiz, R. Macia, R. Sleeman, J. M. Marrero, N. Sánchez, M. Tárraga, and M. Correig (2006), Monitoring the reawakening of Canary Island´s Teide volcano, Eos Trans. AGU, 87(6), 61, 65.
Martín, M. C. (1999), Variación espacio-temporal del nivel de emisión de radón en una zona volcánica activa: Tenerife (Islas Canarias), Ph.D. dissertation, 270 pp., Univ. of La Laguna, Laguna, Spain.
Soler, V., et al. (2004), High CO2 levels in boreholes
at El Teide volcano complex (Tenerife, Canary Islands): Implications for volcanic activity moni-toring, Pure Appl. Geophys., 161, 1519–1532.
Author Information
Juan Carlos Carracedo, Estación Volcanológica de Canarias, Consejo Superior de Investigaciones Científicas (CSIC), La Laguna, Tenerife, Spain; E-mail: [email protected]; Valentin R. Troll, Department of Geology, Trinity College, Dublin, Ireland; Francisco J. Pérez Torrado, Departamento Física-Geología, Universidad de Las Palmas de Gran Canaria, Spain; Eduardo Rodríguez Badiola, Departamento de Geología, Museo Nacional de Ciencias Naturales, CSIC, Madrid, Spain; Alex Han-sen Machín, Departamento de Geografía, Universi-dad de Las Palmas de Gran Canaria; Raphael Paris, Maison de la Recherche, Centre Nationale de Recherche Scientifique (CNRS), Clermont-Ferrand, France; and Hervé Guillou and Stéphane Scaillet, Laboratoire des Sciences du Climat et de l’Environnement, Comision Energie Atomique, CNRS, Paris, France.
newsRefocusing NASA Planetary Science FundingPAGE 463

Eos, Vol. 88, No. 28, 10 July 2007
Successful communication between scien-tists, officials, media, and the public is impera-tive during a volcanic crisis. Misunderstanding can lead to confusion and distrust, and it ulti-mately can transform an emergency into a disaster.
Experience developed during volcanic cri-ses in the Caribbean has helped identify ‘good practice’ guidelines for communication by sci-entists during volcanic emergencies (see “Communication during volcanic emergen-cies: An operations manual for the Caribbean, by C. Solana et al., Benfield Greig Haz. Res. Cent., Univ. Coll. London, 2001; available at http://www.bghrc.com). Key actions include the following:
• Ensuring effective communication and appropriate understanding of information within and between groups managing the cri-sis.
• Disseminating only one clear and consis-tent message—the one established by the offi-cials in charge.
• Building trust among participants and the public through unanimous support of official decisions, maintaining the credibility of all
groups and individuals involved in the crisis, and being responsible and honest with media by keeping them informed of all facts and any changes in the situation.
However, during the 2004–2005 seismic crisis on the Canary Island of Tenerife (see “Monitor-ing the reawakening of Canary Islands’ Teide volcano,” by A. García et al., Eos Trans AGU, 87(6), 61, 2006), scientists did not always follow this protocol, and confusion and occasional panic within the population ensued (see “Recent unrest at Canary Islands’ Teide vol-cano?,” by J. C. Carracedo et al., Eos Trans. AGU, 87(43), 2006). The island is volcanically active, and the most recent eruption took place in 1909. In 2004, scientists working on the island interpreted observed changes in geochemistry and seismicity as being of volcanic origin, which led to the creation of an official scien-tific committee to forecast the likely evolution of the crisis and to assess different possible sce-narios.
At the beginning of the crisis, the flow of information was constrained to the monitor-ing scientists and civil authorities. When the general population felt three earthquakes, the scientific committee deemed it necessary to communicate the nature of the crisis to the
public. As the media pressed for news, scien-tists involved in the official committee, and some who were not involved, volunteered their views on potential scenarios, including improbable catastrophic ones that made headlines. This information contradicted the official ‘call to calm’ and caused confusion among the public. Although the head of the official committee tried to clarify the situation, the official scientific team was continually crit-icized by scientists not involved in the man-agement of the crisis, some of whom had rejected the offer to become a part of the offi-cial team.
While the crisis in Tenerife did not result in an eruption, it is vital to learn from it lessons about scientific communications and relations, specifically during volcanic crises. While vol-canic areas host many competent experts, dur-ing times of crisis responsible scientists should never volunteer their personal forecasts and opinions to the media and should support the decisions taken by the civil authorities and the official scientific group. Differences of opinion among scientists are expected, and dialogue and discussion should be encouraged. How-ever, this should be conducted out of the pub-lic eye. Before a crisis, encouraging open dia-logue between the parties involved to agree to a protocol of communication can prevent a future recurrence of the situation encountered on Tenerife.
—Carmen Solana and Claire Spiller, School of Earth and Environmental Sciences, University of Portsmouth, Portsmouth, UK; E-mail: [email protected]
Communication Between Professionals During Volcanic Emergencies
forum
PAGE 288

© Blackwell Publishing Ltd, Geology Today, Vol. 22, No. 4, July–August 2006138
FEATURE
In recent months the media has been drawing attention to the possibility ofa dangerous eruption of the Teide Volcano on Tenerife in the Canary Islands.Before accepting this prediction, which may well be detrimental to thetourist-based economy of the island, it would be wise to examine theevidence on which it is based.
eruption’ was the final summit eruption of Teide, butthe new radiometric data now shows that eruption tohave been much older, 1140 ± 60 years beforepresent, i.e. in the eighth century AD.
One of the interesting features this study hasrevealed is that the Teide central volcanic complexwas a direct consequence of the activity of the rifts.The rifts developed a progressively steepening,unstable volcano at the centre of the island, andabout 180–200 000 years ago triggered a massivelandslide that generated the impressive horseshoe-shaped collapse embayment, whose headwall is the
FeatureSeismicity and gas emissions on Tenerife: areal cause for alarm?
Juan CarlosCarracedo1 &Valentin R. Troll2
1Estación Volcanológica de
Canarias, IPNA-CSIC, La
Laguna, Tenerife, Spain,
[email protected];2Department of Geology,
Trinity College Dublin,
Dublin 2, Ireland,
Teide has long been recognized as a significantvolcano. At 3718 m above sea level, it is the thirdhighest volcanic structure on the planet (Fig. 1), afterMauna Loa and Mauna Kea in the Hawaiian Islands,and early drew the attention of renowned scientistssuch as Leopold von Buch and Alexander vonHumboldt. Regrettably this interest was not sustainedinto the twentieth century; whilst Hawaii attractedintense study, geological investigations of Teide’shistory languished. For example, hundreds ofradiocarbon age determinations have allowed for aprecise reconstruction of the Hawaiian volcanichistory, but until 2001 only one single radiometricage was available for Teide volcano. With no regularrecordings, evidence of historic seismic and volcanicactivity has only been by word of mouth.
The situation changed in 2001 when a five-year,joint Spanish–French research project began; aproject which produced a detailed geological map ofTeide and the NW and NE rifts (Fig. 2), petrographicanalysis of numerous samples, and radiometricstudies, which produced 28 new radiocarbon agesand 26 new K/Ar ages.
This project completely changed ourunderstanding of the geological and structuralevolution of the Teide volcanic complex, andidentified the sequence of eruptions that had occurredin the last 10 000 years. For example, one eruption ofhistoric significance was that of 24 August 1492,which Christopher Columbus reported as ‘a big fire inthe sierra of Tenerife... similar to those of Mount Etnain Sicily’. It seems it was not a summit eruption ofTeide; a radiocarbon age from an eruption of the BocaCangrejo cinder cone (Crab’s Mouth cone), located inthe NW Rift, is in close agreement with this historicdate. It had been believed that the ‘Columbus
Fig. 1. View of Teide volcanofrom the north east.

139© Blackwell Publishing Ltd, Geology Today, Vol. 22, No. 4, July–August 2006
FEATURE
famous 17 × 10 km Las Cañadas caldera (Fig. 3).Following this, further rift and central activityprogressively filled the embayment and built up the3718 m-high Teide stratovolcano, nested in thecollapse embayment (Fig. 4). The main phase ofconstruction ended 30 000 years ago, since whenthe stratovolcano has erupted only once. Thateruption was the eighth century AD summit eruption,which raised the volcano from a height of 3600 m toits present 3718 m.
This recent eruptive history is in stark contrast tothe pre-collapse activity of the Cañadas volcano,which was much more explosive, with frequentplinian eruptions that generated extensive ash flowsand ash falls. In the last 30 000 years, eruptions
have occurred at a rate of only 4–6 per millennium,the majority (70 per cent) being low-hazard basalticeruptions from fissure and cones on the rift zones,and the others producing phonolitic lava-domes withonly very localized explosive activity (Fig. 5), as forexample Mña Blanca, around 2000 years old, whichis situated at the foot of the main stratavolcano.
It can be seen from the results of the study that inthe present phase of the island’s volcanic activitythere appears to be little risk of major volcanichazards, with any eruptions likely to pose only verylocalized threats to the inhabitants of Tenerife or tovisitors to the Teide National Park (about 4.5 millionannually). Why then are there dire predictions ofvolcanic catastrophe (Fig. 6)?
Fig. 2. Geological map of Teideand the caldera, showing incolour the most recent eruptions(last 30 000 years).
Fig. 3. Western view of LasCañadas caldera.

© Blackwell Publishing Ltd, Geology Today, Vol. 22, No. 4, July–August 2006140
FEATURE
Unrest at Teide volcano?
The prediction of an explosive eruption seems to bebased on reports of significantly increased earthquakeactivity and volcanic gas emissions. But is thisevidence correct, and does it imply an imminentviolent eruption?
From 22 April to 28 July 2004, about 50 low-magnitude (1 to 3) earthquakes were recorded inTenerife, with most of the epicentres localized on theNW rift zone in the area of the Icod Valley. Only threewere actually felt by residents. This frequency isnothing special, such earthquakes are normal involcanic oceanic islands; about 10 000 are recordedannually in Hawaii, of which only 1200 are greaterthan magnitude 3. Low magnitude earthquakes(generally less than magnitude 3) have been recordedin all the Canary Islands. In May 1998 a biggerquake (magnitude 5.3) hit Tenerife, but a hazard-disclaiming statement waspublished in the mediaand the event promptlyforgotten.
So why, in 2004, werethe local and internationalmass media bombardedwith persistent reports ofunrest at Teide volcano,and predictions made of animminent, large-scaleexplosive eruption thatbecame dubbed ‘El Volcánde Octubre’ (OctoberVolcano)? The publicityhad such a bad effect thatTenerife was nick-named‘Terrorife’ and residents
along the northern coast in the towns of Icod,Garachico, etc., began sleeping fully dressed andpanic-buying food and other household supplies.Some even sold their houses! Evacuation instructionswere given in schools and hospitals, and gas masks,power generators and other supplies were stockpiledin public buildings.
The situation was made even worse by theauthorities who, instead of clarifying the situation,raised the level of alert apparently only on the basis ofwhat was reported as an increase in seismicity andthe emission of volcanic gases. However, at no timewas there any universally accepted scientificevidence of actual volcanic activity on the island. The‘volcanic crisis’ alert was officially maintained untilFebruary 2005, with frequent reports in the media ofenormous emissions of volcanic gases, boiling of theisland aquifer, presumably from raised volcanictemperatures, movements of magma underneath thevolcano and an explosive eruption forecast forOctober 2004.
Was there really any convincing evidence forany of this?
Firstly, consider the seismicity. Prior to 2000 therewere only two seismic stations on Tenerife, both atthe far north-eastern end of the island. In that year athird station was deployed inside the Caldera de LasCañadas, and immediately low-magnitude eventswithin the island began to be recorded for the firsttime since surveillance began in 1985. Unfortunatelythe focal depths of these events were not determined,thus depriving observers of one of the most powerfulconstraints on locating the source of the seismicity.In the initial reports, the activity was interpreted asbeing due to dyke emplacement at a depth of 3–4 km.However, it is possible that a number of the eventsmay have had a non-volcanic origin, such as trafficor explosions made during the excavation of watertunnels for groundwater mining.
The majority of the epicentres were located farfrom the rift zone, in an area in the Icod Valley whichsatellite interferometry has shown to have subsidedby up to 10 cm. Groundwater has been continuouslyand intensively extracted in this area since the1960s, depleting the aquifer and causing the groundto sink. Microfaulting associated with the subsidencemay well have caused seismicity. It is noteworthythat according to the interferometry study this is theonly area of recent ground deformation in Tenerife.The putative eruptive region of Teide and LasCañadas is completely stable.
Fig. 4. Teide volcano nested inthe Las Cañadas caldera. Imageby NASA.
Fig. 5. Geological map of Teide’s peripheral phonolitic domes.

141© Blackwell Publishing Ltd, Geology Today, Vol. 22, No. 4, July–August 2006
FEATURE
What is the scientific evidence for thereported increase in gas emissions?
Continuous real-time monitoring of gas emissions atTeide and in the rifts, reported in 1999, gaveevidence of a nearly constant total gas emission fromthe volcanic system. On a day-to-day basis, localemissions may vary and significant diurnal andseasonal variations in gas emission rates doapparently relate directly to systematic changes inbarometric pressure. If spot measurements are takenin periods of low barometric pressure, they can showan apparent ‘significant’ increase in emissions. In2004, shortly before the predicted October eruption,a visit to the summit crater of Teide, (in which both ofus took part), did not reveal any fumarolic activity atall.
In support of the prediction of increasing volcanicactivity, observers have cited two apparently newfeatures; fumaroles at the summit crater of Teide anda new fumarole inside the Orotrava Valley. In factspectacular ‘plumes’ are commonly seen in thesummit area of Teide and are known locally as ‘laToca del Teide’ or ‘Teide’s head-dress’ (Fig. 7). Theseare caused by atmospheric conditions as well as byincreases in fumarolic activity related to barometricpressure changes and have frequently been cited overthe centuries in ship’s logs. They are in no way
unusual for the volcano. The new ‘fumarole’ in theOrotava Valley probably has a quite differentexplanation. Its water isotope signature is clearlyphreatic, not volcanic, and it is located 50 m from anunlined 40 m-deep well used for the disposal of high-temperature wastes from a nearby cheese factory.
It would thus seem that the prediction of animminent volcanic eruption at Teide is based ondistinctly flimsy and dubious evidence, and itsdramatic presentation by the media is not onlyunnecessarily damaging to the tourism-basedeconomy of the island, but also to the credibility ofresponsible scientists, the true value of which will becrucial for the correct management of any futuregenuine volcanic crisis.
Suggestions for further reading
Carracedo, J.C. 1994. The Canary Islands: anexample of structural control on the growth oflarge oceanic island volcanoes. Journal ofVolcanological and Geothermal Research, v.60,pp.225–242.
Carracedo, J.C. 1999. Growth, structure, instabilityand collapse of Canarian volcanoes andcomparisons with Hawaiian volcanoes Journal ofVolcanological and Geothermal Research, SpecialIssue, v.94, pp.1–19.
Carracedo, J.C. & Day, S.J. 2002. Geological Guide ofthe Canary Islands. Classic Geology in Europe. TerraPublishing, London.
Guillou, H., Carracedo, J.C., Paris, R. & PérezTorrado, F.J. 2004. Implications for the earlyshield-stage evolution of Tenerife from K/Ar agesand magnetic stratigraphy. Earth and PlanetaryScience Letters, v.222, pp.599–614.
Walter T.R., Troll V.R., Caileau B., Schmincke H.-U.,Amelung F. & van den Bogaard, P. 2005. Riftzone reorganization through flank instability onocean islands – an example from Tenerife, CanaryIslands. Bulletin of Volcanology, v.65, pp.281–291.
Fig. 6. ‘Scientists’ predictions’in the local press.
Fig. 7. A. Frequent spectacular‘plumes’ in the summit area arelocally known as ‘Teide’s head-dress’ and are usually cloudscaused by strong winds andpressure-dependant changes infumarole activity and are notunusual for the volcano (pictureby J.C. Carracedo). B. Model ofcloud formation at Teidevolcano (Alvarez and Hernandez2006, Canary MeteorologicalService, see http://www.acanmet.org.es/menu_archivos/documentos/FTLCTeide.doc).

New evidence for the reawakening of Teide volcano
J. Gottsmann,1,2 L. Wooller,3 J. Martı,1 J. Fernandez,4 A. G. Camacho,4 P. J. Gonzalez,4,5
A. Garcia,6 and H. Rymer3
Received 17 July 2006; revised 13 September 2006; accepted 19 September 2006; published 25 October 2006.
[1] Geophysical signals accompanying the reactivation ofa volcano after a period of quiescence must be evaluated aspotential precursors to impending eruption. Here we reporton the reactivation of the central volcanic complex ofTenerife, Spain, in spring 2004 and present gravity changemaps constructed by time-lapse microgravity measurementstaken between May 2004 and July 2005. The gravitychanges indicate that the recent reactivation after almost acentury of inactivity was accompanied by a sub-surfacemass addition, yet we did not detect widespread surfacedeformation. We find that the causative source was evolvingin space and time and infer fluid migration at depth asthe most likely cause for mass increase. Our resultsdemonstrate that, even in the absence of previous baselinedata and ground deformation, microgravity measurementsearly in developing crises provide crucial insight into thedynamic changes beneath a volcano. Citation: Gottsmann, J.,
L. Wooller, J. Martı, J. Fernandez, A. G. Camacho, P. J. Gonzalez,
A. Garcia, and H. Rymer (2006), New evidence for the
reawakening of Teide volcano, Geophys. Res. Lett., 33, L20311,
doi:10.1029/2006GL027523.
1. Introduction
[2] Anomalous geophysical signals at dormant volca-noes, or those undergoing a period of quiescence, need tobe evaluated as potential precursors to reawakening andpossible eruption [White, 1996]. There are several recentexamples of volcanic re-activation after long repose inter-vals culminating in explosive eruption [Nakada and Fujii,1993; Robertson et al., 2000], but non-eruptive behaviour isequally documented [De Natale et al., 1991; Newhall andDzurisin, 1988]. The dilemma scientists are confronted withis how to assess future behaviour and to forecast thelikelihood of an eruption at a reawakening volcano, whencritical geophysical data from previous activity is missingdue to long repose periods. In Spring 2004, almost a centuryafter the last eruption on the island, a significant increase inthe number of seismic events located inland on the volcanicisland of Tenerife (Figure 1) marked the reawakening of the
central volcanic complex (CVC), the third-highest volcaniccomplex on Earth rising almost 7000 m from the surround-ing seafloor [Garcıa et al., 2006]. The increase in onshoreseismicity, including five felt earthquakes, coincided withboth an increase in diffuse emission of carbon dioxide alonga zone known as the Santiago Rift [Perez et al., 2005] andincreased fumarolic activity at the summit of the 3718 mhigh Teide volcano [Garcıa et al., 2006].
2. Integrated Geodetic Network on Tenerife
[3] As a reaction to the developing crises, we installedthe first joint ground deformation/microgravity network onthe island in early May 2004, two weeks after the start ofincreased seismicity. The network consists of 14 bench-marks, which were positioned to provide coverage of arather large area (>500 km2) of the CVC, including the PicoViejo-Pico Teide complex (PV-PT), the Las Canadas caldera(LCC) as well as the Santiago Rift (SR) (Figures 1 and 2).The network was designed to meet rapid response require-ments, i.e., the network can be fully occupied to a precisionof less than 0.01 mGals of individual gravity readings andless than 0.04 m in positioning errors within six workingdays despite the frequently rugged terrain. The first reoc-cupation of the network was performed in July 2004,followed by campaigns in April 2005 and July 2005.Benchmark locations and cumulative ground deformationand gravity changes between May 2004 and July 2005 aregiven in Table 1 in the auxiliary material.1 All results aregiven with respect to a reference located south of the LCC(benchmark LAJA). Within the average precision of bench-mark elevation measurements (±0.03 m), using two dual-frequency GPS receivers during each campaign, we did notobserve widespread ground deformation. However, betweenMay 2004 and July 2005, four benchmarks, two located inthe eastern sector of the LCC (MAJU and RAJA), onemarking the northern-most end of the network and also thelowest elevation (766 m; CLV1) and finally a benchmarklocated on an isolated rock spur on the western LCC rim(UCAN, supporting online material) did show ground upliftabove measurement precision. Residual gravity changes(corrected for the theoretical Free-Air effect), observedduring the May–July 2004, May 2004–April 2005, andMay 2004–July 2005 periods are listed in the supportingonline material and shown in Figure 2.
3. Results
[4] The observed gravity changes do not fit a simplesymmetrical pattern as observed, for example, during cal-
1Auxiliary materials are available at ftp://ftp.agu.org/apend/gl/2006gl027523.
GEOPHYSICAL RESEARCH LETTERS, VOL. 33, L20311, doi:10.1029/2006GL027523, 2006ClickHere
for
FullArticle
1Institute of Earth Sciences ‘‘Jaume Almera’’, Consejo Superior deInvestigaciones Cientificas, Barcelona, Spain.
2Department of Earth Sciences, University of Bristol, Bristol, UK.3Department of Earth Sciences, Open University, Milton Keynes,
UK.4Institute of Astronomy and Geodesy, Consejo Superior de Investiga-
ciones Cientificas, Universidad Complutense de Madrid, Madrid, Spain.5Environmental Research Division, Institute of Technology and
Renewable Energies, Tenerife, Spain.6Department of Volcanology, Museo Nacional de Ciencias Naturales,
Consejo Superior de Investigaciones Cientificas, Madrid, Spain.
Copyright 2006 by the American Geophysical Union.0094-8276/06/2006GL027523$05.00
L20311 1 of 6

dera unrest at the Campi Flegrei [Gottsmann et al., 2003] orat Long Valley [Battaglia et al., 2003]. The spatial distri-bution of gravity changes across the area under investiga-tion is asymmetrical. The smallest gravity changes wereobserved in the central and eastern depression of the LCC,where cumulative changes over the 14-month period whereonly slightly higher than the precision level (±0.015 mGalon average; 1 mGal = 10 mm/s2). A marked positive gravityanomaly, with a maximum amplitude of around 0.04 mGal,developed in the Northwest of the covered area betweenMay and July 2004, while a negative anomaly was found tothe east, centered on station MIRA. The gravity increasenoted between the first two campaigns (benchmarks C774and CLV1) was followed by a decrease sometime betweenJuly 2004 and April 2005. During the same period, a N-Strending positive anomaly appears northwest of the PV-PTsummit area between, reaching the western part of the LCC(Figures 2a–2b). In addition, gravity increased significantlyalong the northern slopes of Pico Teide, including bench-marks TORR and FUEN located close to the La Orotavavalley between July 2004 and April 2005, adding to theimpression of a spatio-temporal evolution of the causativesource. It is interesting to note that on 5 December 2004 anew fissure with fumarole emission appeared in the Orotavavalley (further information available at http://www.iter.es).A gas plume emanating from the summit fumaroles of PicoTeide was particularly noticeable during October 2004[Garcıa et al., 2006], between surveys 2 and 3. In summary,significant gravity changes occurred mainly across thenorthern flanks of the PV-PT and along a ca. 6 km widezone along the western side of the volcanic complex intothe westernmost parts of the LCC between May 2004 and
July 2005 (Figure 2c). During the same time, a markedgravity decrease was recorded at the intersection of theOrotava Valley (OV) and the LCC (Figure 2c).[5] Except for two benchmarks (MAJU and RAJA)
where observed gravity changes can be explained by free-air effects (gravity changes due to elevation changes), mass/density changes in the sub-surface appear to cause the majorpart of the perturbation of the gravity field.
4. Effect of Water Table Fluctuations
[6] Data from two drill holes, located in the eastern halfof the LCC (Figure 2d), provide information on watertable fluctuations during the period of interest. A drop ofca. 5 cm/month between surveys 1 and 4 was recorded inone drill hole located close to benchmarks 3RDB andMAJU, which is similar to the average monthly drop inwater level due anthropogenic extraction over the past3 years [Farrujia et al., 2004]. Water levels decreased by22 cm/month on average between February 2000 andJanuary 2004 in a drill hole located close to benchmarkMIRA. The gravity decrease of 0.025 mGal recordedbetween May 2004 and July 2005 at benchmark MIRA,located at the intersection of the Las Canadas caldera andthe Orotava valley, can be explained by a net watertable decrease (dh) of 3 m, consistent with this earliertrend, assuming a permeable rock void space (8) of 20%and a water density (r) of 1000 kg/m3 (Dgw = 2pGrfdh)[Battaglia et al., 2003]. Following the same rationale,gravity changes at 3RDB and MAJU are corrected by�0.008 mGal to account for the recorded water table fallin the nearby borehole. Hence, any gravity change observedwithin the central and eastern parts of the LCC (3RDB,MAJU, RAJA, MIRA) can be fully attributed to changes in(shallow) groundwater levels and we treat the net masschange as zero for this area in the computation of overallmass changes in the following sections (Figure 2d).[7] Outside the LCC, comprehensive monitoring data on
groundwater level is lacking and correction for groundwaterlevel variations is difficult. Groundwater is collected andextracted along several hundred (sub)horizontal tunnels(galerias) protruding into the upper slopes of the CVC[Marrero et al., 2005]. Since 1925, a decrease of severalhundred meters in the groundwater level has been noted forthe area covered by the northern and western slopes of theCVC (available at http://www.aguastenerife.org). We there-fore consider it very unlikely that the gravity increase notedin the north and west of the CVC is related to an increase inthe groundwater table, and hence infer deeper processes tobe the most probable cause of gravity change in this region.
5. Interpretation
[8] The coincidence of earthquake epicenter concentra-tion (a mixture of volcano-tectonic events and regionalearthquakes with pure volcanic events such as tremorsand long-period signals) in the area of gravity increase overthe same time period (Figure 2d), suggests that both signalsare related to the same or linked phenomena. Unfortunately,precise data on earthquake hypocentres are not available,but a semi-qualitative analysis suggests a depth of severalkilometres (R. Ortiz, personal communication, 2005). The
Figure 1. Perspective view of Tenerife island located inthe Canarian Archipelago off the coast of northwest Africa(inset), using a colour-coded digital elevation model(DEM; elevation in meters). Highest point is Teide volcano(3718 m a.s.l.) located at 28.27�N and 16.60�W. Blackopen squares indicate epicentres of seismic events recordedbetween May 2004 and July 2005 by the NationalGeographic Institute (available at http://www.ign.es).Black rectangle identifies the area covered by the jointGPS/gravity network. LCC indicates the location of theLas Canadas caldera.
L20311 GOTTSMANN ET AL.: NEW EVIDENCE FOR REAWAKENING TEIDE VOLCANO L20311
2 of 6

spatial coverage of the benchmarks does not allow thewavelength of the May 2004–July 2005 gravity anomalyto be assessed precisely. In particular, the lower limit of thewavelength along the northern slopes of the PV-PT complexcannot be unambiguously retrieved on the basis of theavailable data. The maximum wavelength of the gravityanomaly is on the order of 17 km if defined by bothobserved and interpolated (kriging) data (Figure 2d) onthe northern slopes of the PV-PT complex, which impliesa maximum source depth of between 2.5 to 5.2 km belowthe surface, assuming simple axisymmetrical source geom-etries [Telford et al., 1990]. This would place the source towithin the depth of the shallow magma reservoirs beneath
the PV-PT complex believed to host chemically evolvedmagma [Ablay et al., 1998]. However, since the positiveanomaly is only defined by four benchmarks (CLV1, C774,CRUC, and TORR) its actual wavelength could be smallerthan 17 km and the source depth could be shallower thaninferred above. Furthermore, ambiguities remain on theactual amplitude of the anomaly, which is defined only bydata observed at CRUC. The continuation of the positiveanomaly in the western part of the LCC (Figure 2c) shows ashorter wavelength indicating a shallow (few km deep)source.[9] Due to the spatial separation of benchmarks an
assessment of sub-surface mass addition is greatly biased
Figure 2. Residual gravity changes between (a) May and July 2004, (b) May 2004 and April 2005, and (c) May 2004 andJuly 2005. (d) Same as Figure 2c but corrected for the effect of water table changes. Gravity changes are draped over aDEM of the central volcanic complex (CVC) of Tenerife. Black line in Figure 2a delineates the Las Canadas caldera (LCC)wall. Benchmark locations (crosses) and identification are shown as well as the prominent topographic features of theSantiago Rift, Teide volcano, and the Orotava Valley (OV). Uncertainty in gravity changes are on average ±0.015 mGal(1 mGal = 10 mm/s2). In Figure 2c the area to the east of the CVC, where a gravity decrease was detected, coincides with theintersection of the Las Canadas caldera with the collapse scar of the Orotava valley. This zone represents a majorhydrological outlet of the caldera. In Figure 2d stars represent epicentres of seismic events recorded between May 2004 andJuly 2005. Both gravity increase and seismicity appear to be spatially and temporally correlated. Line A-B represents datumfor profile shown in Figure 4.
L20311 GOTTSMANN ET AL.: NEW EVIDENCE FOR REAWAKENING TEIDE VOLCANO L20311
3 of 6

on the selection of the area affected by gravity increases. Wedefine a maximum area by a kriging-based interpolation ofthe gravity changes between May 2004 and July 2005 in thenorthern and western parts of the CVC. A Gaussian Quad-rature integration over this area gives a mass addition of1.1*1011 kg, with lower and upper 95% confidence boundsof 8.4*109 kg and 2.0*1011 kg, respectively. These valuesshould be regarded as maximum values.[10] In theory, subsurface volume changes derived from
ground deformation data can be correlated to sub-surfacemass changes from gravity data to infer the density of thecausative source. However, in the absence of significantsurface deformation, the source density cannot be deter-mined directly and the nature of the source remains ambig-uous. However, three scenarios are worth considering whenassessing causative processes for the observed gravityincrease: (1) arrival of new magma at depth, (2) migrationof hydrothermal fluids, and (3) a hybrid of both. Volcaniceruptions of the CVC over the past few centuries weredominantly fed by basic and intermediate magmas in theform of fissure eruptions along the Santiago Rift [Ablay andMarti, 2000], implying shallow dyke emplacement alongthis NW-SE trending extension zone. The observed gravityincrease between May 2004 and April 2005 (Figure 2)appears to denote a zone at a 45� angle to the strike ofthe rift. The wavelength of the anomaly in the western andcentral parts of the LCC (Figure 2d) is not consistentwith shallow dyke emplacement to perhaps within a fewtens or hundred meters depth. There is also no otherdirect geophysical or geochemical evidence in support ofmagma emplacement in the form of a shallow dyke over the14-month observation time. However, dyke emplacement atgreater depth (a few km below the surface) into the SantiagoRift (with partial contribution to the gravity increases atbenchmarks CLAV1, C774 and CRUC), perhaps rechargingan existing reservoir, cannot be unambiguously excludedfor the period May–July 2004, coinciding with the peak in
the number of earthquakes recorded by the National Geo-graphic Institute (available at http://www.ign.es). Dykesalong the Santiago Rift are on average less than 1 m wide.Ground deformation caused by an individual dyke of thissize a few km below the surface would be below theprecision of our GPS measurements. Thus, a magma injec-tion into a conjugated fault system, perhaps at some angle tothe Santiago Rift, cannot be unambiguously ruled out asthe trigger for the reawakening of the volcanic complex inMay 2004. There is, however, little evidence to support theidea that the mass increase observed during campaigns 2and 3 is caused solely by magma movement.[11] An alternative explanation for the observed gravity
increase is fluid migration through the CVC. Volcano-tectonic events detected in the seismic record [Garcıa etal., 2006; Tarraga et al., 2006] may have triggered therelease and upward migration of hydrothermal fluids from adeep magma reservoir. Alternatively, fluid migration mayhave resulted from (1) the perturbation of an existing deephydrothermal reservoir and resultant upward movement offluids due to magma injection or (2) from pressurisingseawater saturated rocks.[12] Migration of hydrothermal fluids through a perme-
able medium causes little surface deformation, but thefilling of pore space increases the bulk density of thematerial resulting in a gravity increase at the ground surface.To explore this scenario, and as a first order approximation,we performed a inversion of the gravity change recordedbetween May 2004 and July 2005 along the northern andwestern slopes of the PV-PT complex for a source repre-sented by a N-S striking infinite cylindrical horizontal body[Telford et al., 1990]. The approximation of an infinite bodyis valid as long as the radius of the cylinder is far smallerthan its length. The model results depend linearly on densitychange but non-linearly on both the radius and depth of thebody. Using a global optimization iterative method [Sen andStoffa, 1995] with various initial values for depth and
Figure 3. (a) Predicted and (b) residuals between observed and predicted gravity changes (mGal) for the period May 2004to July 2005. Predicted values are derived from inversion for an infinite horizontal cylinder as an approximation of the zoneundergoing a mass/density increase at the northern and western slopes of the PV-PT complex. Observed gravity changeswere corrected for the effect of water table fluctuations in the central and eastern part of the LCC prior to inversion. Redcolours indicate that the model is predicting higher gravity changes than observed, blue colours indicate the opposite. Greencolours indicate match between predictions and observations.
L20311 GOTTSMANN ET AL.: NEW EVIDENCE FOR REAWAKENING TEIDE VOLCANO L20311
4 of 6

radius, we find convergence of the inversion results at adepth of 1990 ± 120 m below the surface using residualgravity data from all benchmarks. While depth is insensitiveto the assumed source density change, the radius scales tothe inverse of density. Assuming a volume fraction of 30%which is fully permeable, filling this void space with(hydrothermal) fluids of density 1000 kg/m3 would producea bulk density increase of 0.3 kg/m3. The resultant sourceradius is around 80 ± 20 m. Although the fit to the data iswithin errors very good (Figure 3), we find that the positiveanomaly in the eastern part of the LCC cannot be satisfy-ingly modelled. For this area, we conclude on either a localeffect or, more likely, an error in the GPS measurementsduring the installation of benchmark RAJA, since thereported gravity increase results from the free-air effect ofthe 7 ± 4 cm inflation detected over the 14 months period.Ignoring the potentially erroneous GPS measurement, thegravity residual for RAJA matches those of neighbouringbenchmarks MAJU and 3RDB. Combining all availablegeophysical information, we conclude that migration ofhydrothermal fluids along a permeable N-S striking zoneis the most likely cause of the observed perturbation of thegravity field. A conceptual model of mass migration cov-ering the 14-month observation period is shown in Figure 4.
6. Conclusions
[13] While magma recharge at depth into the northwest-ern rift zone of Tenerife is likely to have triggered thereawakening of the CVC, the cause of the 14-month pertur-bation of the gravity field is most probably not related tomagma flow. A more likely scenario is the migration of
fluids inside the complex triggering the observed gravitychanges.[14] We demonstrate that time-lapse microgravity moni-
toring of active volcanoes can provide vital insights intotheir sub-surface dynamics, particularly where structuralcomplexities and heterogeneous mechanical properties ofthe subsurface do not obey a simple linearly elastic rela-tionship of stress generation and resultant ground deforma-tion [Dvorak and Dzurisin, 1997]. Arrival of a small batchof magma at depth and the release and upward migration ofhot fluids may be a common trigger of reactivation afterlong repose periods and may be quantifiable by perturba-tions in the gravity field but may not be accompanied byground deformation. Quantification of sub-surface mass/density changes must be regarded as essential for thedetection of potential pre-eruptive signals at reawakeningvolcanoes before ground deformation or other geophysicalsignals become quantifiable [Rymer, 1994].
[15] Acknowledgments. This research is part of the TEGETEIDEproject funded by the Spanish Ministry of Education and Science (MEC)under contract CGL2003-21643-E. J.G. also acknowledges support from a‘‘Ramon y Cajal’’ grant by the MEC and a Royal Society UniversityFellowship. L.W. acknowledges the support of an Open University Re-search Development Fund fellowship. J.F., A.G.C., and P.J.G. also ac-knowledge support from EU projects ALERTA (MAC/2.3/C56) of theINTERREG III B Program and from Spanish MEC projects REN2002-12406-E/RIES and GEOMOD (CGL2005-05500-C02). The authors thankthe Consejo Insular de Aguas de Tenerife (CIATFE) and I. Farrujia forgranting access to water table data on Tenerife and N. Perez for providingcGPS data.
ReferencesAblay, G. J., and P. Kearey (2000), Gravity constraints on the structure andvolcanic evolution of Tenerife, Canary Islands, J. Geophys. Res., 105,5783–5796.
Ablay, G. J., and J. Marti (2000), Stratigraphy, structure, and volcanicevolution of the Pico Teide-Pico Viejo formation, Tenerife, CanaryIslands, J. Volcanol. Geotherm. Res., 103(1–4), 175–208.
Ablay, G. J., M. R. Carrol, M. R. Palmer, J. Marti, and R. S. J. Sparks(1998), Basanite-phonolite lineages of the Teide Pico Viejo volcaniccomplex, Tenerife, Canary Islands, J. Petrol., 39(5), 905–936.
Arana, V., A. G. Camacho, A. Garcia, F. G. Montesinos, I. Blanco,R. Vieira, and A. Felpeto (2000), Internal structure of Tenerife (CanaryIslands) based on gravity, aeromagnetic, and volcanological data, J. Vol-canol. Geotherm. Res., 103(1–4), 43–64.
Battaglia, M., P. Segall, and C. Roberts (2003), The mechanics of unrest atLong Valley caldera, California. 2. Constraining the nature of the sourceusing geodetic and micro-gravity data, J. Volcanol. Geotherm. Res.,127(3–4), 219–245.
De Natale, G., F. Pingue, P. Allarde, and A. Zollo (1991), Geophysical andgeochemical modelling of the 1982–1984 unrest phenomena at CampiFlegrei caldera (southern Italy), J. Volcanol. Geotherm. Res., 48(1–2),199–222.
Dvorak, J. J., and D. Dzurisin (1997), Volcano geodesy: Search for magmareservoirs and the formation of eruptive vents, Rev. Geophys., 35, 343–384.
Farrujia, I., J. L. Velasco, J. Fernandez, and M. C. Martin (2004), Evoluciondel nivel freatico en la mitad oriental del acuıfero de Las Canadas delTeide: Cuantificacion de parametros hidrogeologicos, paper presented atVIII Simposio de Hidrogeologıa, Assoc. Esp. de Hidrogeol., Zaragoza,Spain.
Garcıa, A., J. Vila, R. Ortiz, R. Macia, R. Sleeman, J. M. Marrero,N. Sanchez, M. Tarraga, and A. M. Correig (2006), Monitoring thereawakening of Canary Islands’ Teide Volcano, Eos Trans. AGU,87(6), 61.
Gottsmann, J., G. Berrino, H. Rymer, and G. Williams-Jones (2003),Hazard assessment during caldera unrest at the Campi Flegrei, Italy: Acontribution from gravity-height gradients, Earth Planet. Sci. Lett.,211(3–4), 295–309.
Marrero, R., P. Salazar, P. A. Hernandez, N. M. Perez, and D. Lopez (2005),Hydrogeochemical monitoring for volcanic surveillance at Tenerife,Canary Islands, Geophys. Res. Abstr., 7, Abstract 09928, sref-id:EGU05–A-09928.
Figure 4. Cross-section through the CVC along the profileA-B shown in Figure 2d, including a conceptual model ofevents between May 2004 and July 2005. (1) Likelyinjection of magma during peak of onshore seismic activitytwo weeks before installation of network (May 2004).(2) Release of fluids or perturbation of existing hydro-thermal system causing migration of fluids from NW to SE(May–July 2004; Figure 2a) and later (July 2004–April2005 and further into July 2005) along a N-S striking zone(Figures 2b–2d). (3) Upward migration of fluids along theupper surface of the high density/low permeability BocaTauce magmatic body situated beneath the western caldera[Ablay and Kearey, 2000]. (4) Fluid migration into anoverlying aquifer, located at a depth greater than 900 mbeneath the LCC floor and thought to feed the PT summitfumaroles [Arana et al., 2000], can explain the increasedfumarolic activity of Teide in 2004. The western calderaboundary fault may act as a pathway for fluids to shallowerdepth.
L20311 GOTTSMANN ET AL.: NEW EVIDENCE FOR REAWAKENING TEIDE VOLCANO L20311
5 of 6

Nakada, S., and T. Fujii (1993), Preliminary report on the activity atUnzen Volcano (Japan), November 1990–November 1991: Dacite lavadomes and pyroclastic flows, J. Volcanol. Geotherm. Res., 54(3–4),319–333.
Newhall, C. G., and D. Dzurisin (1988), Historical Unrest at Large Cal-deras of the World, 1108 pp., U.S. Gov. Print. Off., Washington, D. C.
Perez, N. M., et al. (2005), Premonitory geochemical and geophysicalsignatures of volcanic unrest at Tenerife, Canary Islands, Geophys. Res.Abstr., 7, Abstract 09993, sref-id:EGU05–A-09993.
Robertson, R. E. A., W. P. Aspinall, R. A. Herd, G. E. Norton, R. S. J.Sparks, and S. R. Young (2000), The 1995–1998 eruption of the Sou-friere Hills volcano, Montserrat, WI, Philos. Trans. R. Soc. London, Ser.A, 358(1770), 1619–1637.
Rymer, H. (1994), Microgravity change as a precursor to volcanic activity,J. Volcanol. Geotherm. Res., 61(3–4), 311–328.
Sen, M. K., and P. L. Stoffa (1995), Global Optimization Methods inGeophysical Inversion, 294 pp., Elsevier, New York.
Tarraga, M., R. Carniel, R. Ortiz, J. M. Marrero, and A. Garcıa (2006), Onthe predictability of volcano-tectonic events by low frequency seismicnoise analysis at Teide-Pico Viejo volcanic complex, Canary Islands, Nat.Hazards Earth Syst. Sci., 6(3), 365–376.
Telford, W. M., L. P. Geldart, and R. E. Sheriff (1990), Applied Geophysics,2nd ed., Cambridge Univ. Press, New York.
White, R. A. (1996), Precursory deep long-period earthquakes at MountPinatubo: Spatio-temporal link to a basaltic trigger, in Fire and Mud:Eruptions and Lahars of Mount Pinatubo, Philippines, edited by C. G.Newhall and R. S. Punongbayan, pp. 307–326, Univ. of Wash. Press,Seattle.
�����������������������J. Gottsmann, Department of Earth Sciences, University of Bristol, Wills
Memorial Building, Queens Road, Bristol BS8 1RJ, UK. ([email protected])H. Rymer and L. Wooller, Department of Earth Sciences, Open
University, Walton Hall, Milton Keynes MK7 6AA, UK.J. Martı, Institute of Earth Sciences ‘‘Jaume Almera,’’ CSIC, Lluıs Sole
Sabarıs s/n, Barcelona 08028, Spain.A. G. Camacho, J. Fernandez, and P. J. Gonzalez, Institute of Astronomy
and Geodesy, CSIC-UCM, Ciudad Universitaria, Plaza de Ciencias 3,28040 Madrid, Spain.A. Garcia, Department of Volcanology, Museo Nacional de Ciencias
Naturales, CSIC, C/Jose Gutierrez Abascal, 2, 28006 Madrid, Spain.
L20311 GOTTSMANN ET AL.: NEW EVIDENCE FOR REAWAKENING TEIDE VOLCANO L20311
6 of 6