Volume 47 Number 25 7 July 2018 Pages 8167–8492 Dalton ...
13
Dalton Transactions An international journal of inorganic chemistry rsc.li/dalton ISSN 1477-9226 PAPER Sebastian Bette et al. On verdigris, part II: synthesis of the 2-1-5 phase, Cu 3 (CH 3 COO) 4 (OH) 2 ·5H 2 O, by long-term crystallisation from aqueous solution at room temperature Volume 47 Number 25 7 July 2018 Pages 8167–8492
Transcript of Volume 47 Number 25 7 July 2018 Pages 8167–8492 Dalton ...

Dalton Transactions
An international journal of inorganic chemistryrsc.li/dalton
ISSN 1477-9226
PAPER Sebastian Bette et al. On verdigris, part II: synthesis of the 2-1-5 phase, Cu
3 (CH
3 COO)
4 (OH)
2 ·5H
2 O, by long-term crystallisation from aqueous
solution at room temperature
Volume 47 Number 25 7 July 2018 Pages 8167–8492
DaltonTransactions
PAPER
Cite this: Dalton Trans., 2018, 47,8209
Received 2nd May 2018,Accepted 21st May 2018
DOI: 10.1039/c8dt01758a
rsc.li/dalton
On verdigris, part II: synthesis of the 2-1-5 phase,Cu3(CH3COO)4(OH)2·5H2O, by long-term crystalli-sation from aqueous solution at roomtemperature†‡
Sebastian Bette, *a Reinhard K. Kremer, a Gerhard Eggert b andRobert E. Dinnebier a
Long-term crystallisation from aqueous copper(II)–acetate solution after the addition of ammonia at
25 °C led to the formation of a hitherto poorly characterised phase in the verdigris pigment system
Cu(CH3COO)2–Cu(OH)2–H2O. Laboratory X-ray powder diffraction (XRPD) was successfully employed to
solve the crystal structure. The structure solution reveals a phase composition of the
Cu3(CH3COO)4(OH)2·5H2O ≡ 2-1-5 phase, which was also confirmed by thermal analysis. The 2-1-5
phase crystallises in space group P21/c (14) with lattice parameters of a = 12.4835(2) Å, b = 14.4246(2) Å,
c = 10.7333(1) Å and β = 102.871(1)°. The crystal structure consists of Cu2(CH3COO)2(CH3COO)1/2(OH)4/3H2O
1/6+ dimers that are interconnected by Cu(CH3COO)(CH3COO)1/2(OH)2/31/6− squares forming chains
running in the c-direction. Non-coordinating hydrate water molecules are intercalated inbetween the
chains and mediate the inter-chain interaction. IR and Raman spectroscopy techniques were also
employed to confirm selected aspects of the determined crystal structure. The magnetic properties of the
2-1-5 phase decompose into two independent subsystems: a strongly antiferromagnetically spin exchange
coupled magnetic Cu–Cu dimer and a significantly weaker coupled Cu monomer. The light blue colour of
the sample originates from a reflectance maximum at 488 nm and significantly differs from the known ver-
digris phases. An investigation of several historic verdigris pigment samples revealed that this phase occurs
both as a minor and a major component. Hence, our reference data for the title compound will help to
improve the understanding of the multiphase mixtures occurring in historic verdigris samples.
Introduction
Pigments have been used by mankind since the early StoneAge. At the beginning, only naturally occurring pigments, i.e.minerals, were used. Much later, pigments were also producedartificially. One of the oldest synthetic pigments is “verdigris”,which is a collective term for green and blue copper basedpainting pigments. Until the 19th century, verdigris pigmentswere frequently used for the artistic scope (Fig. 1) and oftenproduced by intentional corrosion of copper using carboxylicacids, mainly acetic acid (from vinegar).1 The pigmentproduction also included purification and recrystallisation
procedures. Numerous “recipes” for all production steps havebeen reported using different ingredients and applyingdifferent conditions in terms of temperature, time, etc. Hence,a great variety of verdigris pigments differing in colour, resis-tivity against degradation and chemical composition exist. Inaddition to their use as pigments, verdigris phases were usedfor other applications, e.g. medical purposes, as well.2
Verdigris is classified into two categories: neutral or some-times distilled verdigris referring to Cu(CH3COO)2·H2O orCu(CH3COO)2 and basic verdigris. The latter category refers toa group of copper(II)–acetate hydroxide salts, also known as“basic copper(II)–acetates”, which are distinguished anddenoted according to their chemical composition:xCu(CH3COO)2·yCu(OH)2·zH2O ≡ x − y − z phase. Numeroussynthesis attempts1,3–6 based on ancient recipes for verdigrisrevealed the existence of at least five distinct phases: 2-1-5,1-1-5, 1-4-3, 1-2-0 and 1-3-2. Only the 1-3-2 phase1,4,5,7–14 andvery recently the 1-2-0 phase15 were characterised in detail, asthe purity of the obtained basic copper acetates could not beproved unambiguously because the phase characterisation led
†Dedicated to Professor David A. Scott on the occasion of his 70th birthday.‡Electronic supplementary information (ESI) available. CCDC 1840957. For ESIand crystallographic data in CIF or other electronic format see DOI: 10.1039/c8dt01758a
aMax Planck Institute for Solid State Research, Heisenbergstr. 1, 70569 Stuttgart,
Germany. E-mail: [email protected] Academy of Art and Design, Am Weißenhof 1, 70191 Stuttgart, Germany
This journal is © The Royal Society of Chemistry 2018 Dalton Trans., 2018, 47, 8209–8220 | 8209
Ope
n A
cces
s A
rtic
le. P
ublis
hed
on 2
2 M
ay 2
018.
Dow
nloa
ded
on 2
/8/2
022
3:41
:33
PM.
Thi
s ar
ticle
is li
cens
ed u
nder
a C
reat
ive
Com
mon
s A
ttrib
utio
n 3.
0 U
npor
ted
Lic
ence
.
View Article OnlineView Journal | View Issue

to contradictory results. In addition, ancient recipes, in par-ticular the intentional corrosion of copper, were proved to leadto complex multiphase mixtures14,16,17 comprising com-ponents which could not be identified due to a lack of reliablereference data. Historic verdigris samples are even morecomplex as most of them are multiphase mixtures, as well asthey are usually already affected by degradation processes.18
This emphasis the need for reliable reference data for the purex − y − z phases which can serve as a basis for phase identifi-cation, e.g. by vibrational spectroscopy or quantification byX-ray powder diffraction (XRPD).
Besides their relevance as pigments, copper carboxylatesattract broad scientific interest as materials for anion exchan-gers,10,11,19,20 for heterogeneous catalysis11 and due to theirtuneable magnetic properties.12,13,21–23 These investigationshowever were focused mainly on the 1-3-2 phase. The crystalstructure of the 1-3-2 phase was solved both from powder7 andsingle crystal8 X-ray diffraction. Crystalline powders of the 1-3-2 phase were obtained by adding NaOH7 or NH3(aq)
4,5 to con-centrated Cu(CH3COO)2 solution
8 at 60 °C. Single crystals weregrown by refluxing a 0.1 M Cu(CH3COO)2 solution at 60 °C for60 h without stirring8 or by crystallisation from gel.25 The 1-3-2phase can be converted into the 1-2-0 phase by ageing in con-centrated Cu(CH3COO)2 solution at 60 °C.4,15 Reported syn-thesis routes that lead to the direct formation of the 1-2-0phase,5,6 as well as the synthesis procedures for the 2-1-5, 1-1-5and 1-4-3 phases, were found to be irreproducible.15
In order to extend the knowledge of the formation, stability,properties, and crystal structures of verdigris phases, we per-formed long-term crystallisation experiments. These werecarried out at room temperature since lower temperaturesusually lead to phases with higher water contents although theformation, transformation and crystallisation of hydroxidesalts can take years.26,27 This procedure led to the successfulsynthesis of the 2-1-5 phase. The thermal behaviour, as well asthe spectral and magnetic properties of this phase, was investi-gated and the crystal structure was solved from laboratoryXRPD data.
Experimental sectionLong-term crystallisation approaches
The investigations of the long term crystallisation of verdigrisphases were carried out by using 3 approaches. The synthesisapproaches are summarised in a scheme in Fig. S1 in the ESI.‡
Approach I
In approach I, 5.9 g (0.030 mol) Cu(CH3COO)2·H2O (Merck,p.A.) were dissolved in 51.9 g of deionised water that had beenboiled several minutes before in order to remove dissolved car-bonate, at 70 °C yielding a 0.57 m (≡ moles Cu(CH3COO)2 perkg of H2O) solution. During stirring, 1.5 mL of 24 wt% NH3(aq)
(≡ 0.019 mol NH3) were added at 70 °C. After 4 minutes, theaddition was completed and the turquoise precipitate that wasformed immediately was filtered off after two additionalminutes of stirring. The filtrate was slowly cooled down toroom temperature. After 4 months, the formation of a lightblue precipitate was observed. The precipitate was finally fil-tered off after 14 months. In order to remove the adheredmother liquor, the solid was suspended in cold (T < 4 °C),deionised water, twice, and once in cold (T < 4 °C) ethanol.Drying was carried out for 48 h at room temperature. Only asmall amount of the solid, approximately 20 mg, wasobtained.
Approach II + III
In approach II and III, 11.8 g (0.060 mol) Cu(CH3COO)2·H2Owere dissolved in 88.3 g of deionised water at 70 °C yielding a0.67 m copper(II)–acetate solution. During stirring, 3.0 mL of24 wt% NH3(aq) (≡ 0.039 mol NH3) were added at 70 °C. After6 minutes, the addition was completed and stirring was con-tinued for 2 minutes. A turquoise precipitate formed immedi-ately. The suspensions were stored for 7 days at 60 °C. Duringthis time, the turquoise solid changed its colour into a deepblue. In approach II, the solid was filtered off and the filtratewas aged further for 12 months at room temperature. Inapproach III, the suspension was cooled down to room temp-erature and aged for 12 months, as well. During ageing, a lightblue solid was formed in approach II and the solid in approachIII turned slowly into a light blue. After ageing, the solids werefiltered off and the removal of the mother liquor and dryingwas conducted as described above.
Fig. 1 “The Magdalen Reading” painted by Rogier van der Weyden ca.1438. Verdigris pigments were used in this picture together with lead-tinyellow for painting the green robe of the Magdalen24 © The NationalGallery London.
Paper Dalton Transactions
8210 | Dalton Trans., 2018, 47, 8209–8220 This journal is © The Royal Society of Chemistry 2018
Ope
n A
cces
s A
rtic
le. P
ublis
hed
on 2
2 M
ay 2
018.
Dow
nloa
ded
on 2
/8/2
022
3:41
:33
PM.
Thi
s ar
ticle
is li
cens
ed u
nder
a C
reat
ive
Com
mon
s A
ttrib
utio
n 3.
0 U
npor
ted
Lic
ence
.View Article Online

Phase characterisation
SEM images of the purified and dried solids were obtainedwith a MERLIN scanning electron microscope (Zeiss) (5.0 kVaccelerating voltage, SE-detector), after coating the samplewith iridium. µ-Raman spectroscopy was carried out using aRenishaw inVia Raman spectrometer with a Leica DMLMmicroscope and a RenCam CCD detector. The spectrometerwas equipped with a He–Ne laser operating at 632.8 nm, withpower maintained below 400 µW on the sample surface.Thermal analysis was carried out using a STA 449 F5-Jupiter(Netzsch) device for TG-measurements. 12.6 mg of the samplewere placed in an Al2O3 crucible and heated up from 30 °C to500 °C with a heating rate of 2 K min−1 in a 50 mL min−1 Ar-stream. The magnetic measurement of a powder sampleenclosed in a gel capsule was carried out in the temperaturerange from 1.8 K to 300 K in a DC mode using a SQUIDmagnetometer (MPMS XL, Quantum Design) at 0.1 T, 1.0 T and7.0 T. XRPD patterns for phase identification were recorded atroom temperature on a laboratory powder diffractometer inDebye–Scherrer geometry (Stadi P-Diffraktometer (Stoe), Cu-Kα1
radiation from a primary Ge(111)-Johann-type monochromator,and a Mythen 1 K detector (Dectris)). The samples were sealed in0.5 mm diameter borosilicate glass capillaries (Hilgenberg glassno. 0140), which were spun during the measurements. Eachpattern was measured in a 2θ range from 5.0° to 70° applying atotal scan time of 5 h. The XRPD pattern for the crystal structuresolution was recorded using the same device applying a scanrange from 5.0° to 100° 2θ and a total scan time of 20 h.Temperature dependent in situ X-ray diffraction experimentswere performed on a D8-Advance diffractometer (Bruker, Cu-Kα1
radiation from a primary Ge(220)-Johannson-type monochroma-tor and a Lynx Eye position sensitive detector (Bruker)) inDebye–Scherrer geometry using a water cooled furnace(mri capillary heater, (25–1000) °C) for heating the capillary.The sample was sealed in a 0.5 mm diameter quartz glass capil-lary (Hilgenberg), which was spun during the measurement.The patterns were measured with a scan range of 5.0 to 40.0°2θ, employing a step size of 0.005 and a total scan time of 4 h.A delay time of 30 min was applied before each measurement toensure thermal equilibration.
Crystal structure solution
The programme TOPAS 6.028 was used to determine and refinethe crystal structure of the 2-1-5 phase. The indexing of thepattern was carried out by an iterative use of singular valuedecomposition (LSI)29 leading to a primitive monoclinic unitcell with lattice parameters given in the ESI (Table S1‡). Theobserved systematic reflection extinction pointed to P21/c (14)as the most probable space group. The peak profile and theprecise lattice parameters were determined by LeBail30 fitsapplying the fundamental parameter approach of TOPAS.31
The background was modeled by employing Chebychev poly-nomials of the 6th order. The refinement converged quickly.
Considering the unit cell volume, the site multiplicities inspace group P21/c (14) and the packing densities of the related
copper(II)–acetate–hydroxide hydrates,7,8,15 the number offormula units per unit cell, Z, was estimated as 4. The methodof Charge Flipping32 with histogram matching33 supported byinclusion of the tangent formula34 was used to determine thepositions of the copper ions. By applying the global optimi-sation method of simulated annealing (SA) in the real space asit is implemented in TOPAS,35 the positions of the acetate andhydroxide ions and water molecules were determined. Rigidbodies for the acetate ions were defined in z-matrix notation andtranslated and rotated freely through the unit cell. Atoms locatedon identical positions were identified by using a merging radiusof 0.7 Å.36 After a few hours, the positions of all atoms werefound. The procedure was carried out several times and as aresult the simulated annealing process always yielded identicalstructural models that were independent from the starting para-meters, i.e. the number of atoms that were initially put into theunit cell. For the final Rietveld refinement,37 all profile andlattice parameters were released iteratively and positions of thecopper and oxygen (hydroxide ions and water molecules) atomswere subjected to free unconstrained refinement. The bondlengths and angles of the rigid bodies of the acetate ions wererefined, restraining them to chemically reasonable values.Hydrogen sites were omitted due to the limits of the powderdiffraction method. The final agreement factors are listed inTable S1,‡ the atomic coordinates and selected bond distancesare given in Tables S2 and S3,‡ the fit of the whole powderpattern is shown in Fig. S2 in the ESI.‡ The crystallographic dataare deposited at the CCDC, deposit number: 1840957.‡
Results and discussionPhase identification and morphology
Long term crystallisation experiments were performed fromclear solution after the filtration of the initially formed 1-3-2phase (approach I), the subsequently formed 1-2-0 phase(approach II) and from a suspension of the 1-2-0 phase(approach III) at room temperature for at least one year (ESIFig. S1‡). All long-term crystallisation approaches led to theformation of light blue powders (ESI, Fig. S1‡). Approach Iresults in the formation of a very small amount of solid(approx. 20 mg), whereas approach II and III yielded morematerials (100 mg–200 mg). The diffraction patterns of theobtained solids differ (Fig. 2c–e).
The diffraction pattern of the solid obtained by approach I(Fig. 2c) which was identified to be the 2-1-5 phase by thecrystal structure solution (see below) can be clearly distin-guished from the pattern of the 1-2-0 phase (a). Due to theidentical position of the basal reflections of the 1-3-2 and 2-1-5phases at ca. 9.6° 2θ (≡ d = 9.3 Å), the diffraction patterns ofthese verdigris phases (Fig. 2b and c) exhibit strong simi-larities. The indexing of the latter phase, however, leads to adifferent space group and different lattice parameters (inset).The broad hump in the background of the XRPD pattern indi-cates some amount of an amorphous phase. The diffractionpattern of the solid obtained by approach II (Fig. 2d) exhibits
Dalton Transactions Paper
This journal is © The Royal Society of Chemistry 2018 Dalton Trans., 2018, 47, 8209–8220 | 8211
Ope
n A
cces
s A
rtic
le. P
ublis
hed
on 2
2 M
ay 2
018.
Dow
nloa
ded
on 2
/8/2
022
3:41
:33
PM.
Thi
s ar
ticle
is li
cens
ed u
nder
a C
reat
ive
Com
mon
s A
ttrib
utio
n 3.
0 U
npor
ted
Lic
ence
.View Article Online
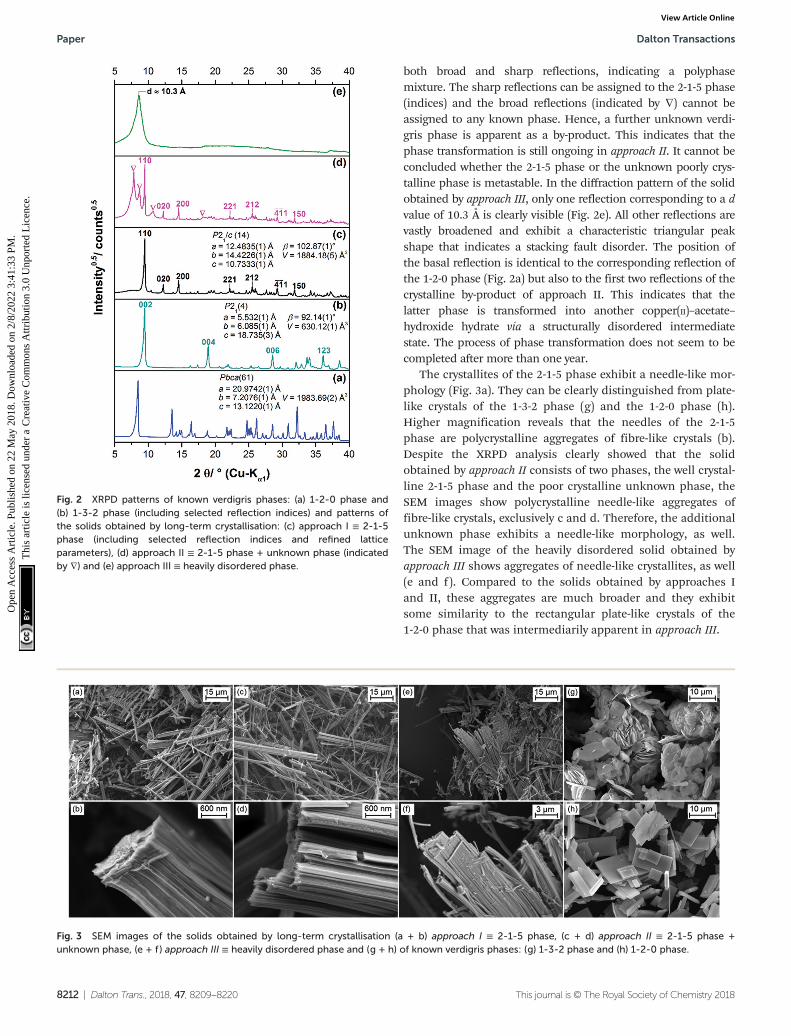
both broad and sharp reflections, indicating a polyphasemixture. The sharp reflections can be assigned to the 2-1-5 phase(indices) and the broad reflections (indicated by ∇) cannot beassigned to any known phase. Hence, a further unknown verdi-gris phase is apparent as a by-product. This indicates that thephase transformation is still ongoing in approach II. It cannot beconcluded whether the 2-1-5 phase or the unknown poorly crys-talline phase is metastable. In the diffraction pattern of the solidobtained by approach III, only one reflection corresponding to a dvalue of 10.3 Å is clearly visible (Fig. 2e). All other reflections arevastly broadened and exhibit a characteristic triangular peakshape that indicates a stacking fault disorder. The position ofthe basal reflection is identical to the corresponding reflection ofthe 1-2-0 phase (Fig. 2a) but also to the first two reflections of thecrystalline by-product of approach II. This indicates that thelatter phase is transformed into another copper(II)–acetate–hydroxide hydrate via a structurally disordered intermediatestate. The process of phase transformation does not seem to becompleted after more than one year.
The crystallites of the 2-1-5 phase exhibit a needle-like mor-phology (Fig. 3a). They can be clearly distinguished from plate-like crystals of the 1-3-2 phase (g) and the 1-2-0 phase (h).Higher magnification reveals that the needles of the 2-1-5phase are polycrystalline aggregates of fibre-like crystals (b).Despite the XRPD analysis clearly showed that the solidobtained by approach II consists of two phases, the well crystal-line 2-1-5 phase and the poor crystalline unknown phase, theSEM images show polycrystalline needle-like aggregates offibre-like crystals, exclusively c and d. Therefore, the additionalunknown phase exhibits a needle-like morphology, as well.The SEM image of the heavily disordered solid obtained byapproach III shows aggregates of needle-like crystallites, as well(e and f). Compared to the solids obtained by approaches Iand II, these aggregates are much broader and they exhibitsome similarity to the rectangular plate-like crystals of the1-2-0 phase that was intermediarily apparent in approach III.
Fig. 2 XRPD patterns of known verdigris phases: (a) 1-2-0 phase and(b) 1-3-2 phase (including selected reflection indices) and patterns ofthe solids obtained by long-term crystallisation: (c) approach I ≡ 2-1-5phase (including selected reflection indices and refined latticeparameters), (d) approach II ≡ 2-1-5 phase + unknown phase (indicatedby ∇) and (e) approach III ≡ heavily disordered phase.
Fig. 3 SEM images of the solids obtained by long-term crystallisation (a + b) approach I ≡ 2-1-5 phase, (c + d) approach II ≡ 2-1-5 phase +unknown phase, (e + f) approach III ≡ heavily disordered phase and (g + h) of known verdigris phases: (g) 1-3-2 phase and (h) 1-2-0 phase.
Paper Dalton Transactions
8212 | Dalton Trans., 2018, 47, 8209–8220 This journal is © The Royal Society of Chemistry 2018
Ope
n A
cces
s A
rtic
le. P
ublis
hed
on 2
2 M
ay 2
018.
Dow
nloa
ded
on 2
/8/2
022
3:41
:33
PM.
Thi
s ar
ticle
is li
cens
ed u
nder
a C
reat
ive
Com
mon
s A
ttrib
utio
n 3.
0 U
npor
ted
Lic
ence
.View Article Online

Investigation of historic pigment samples
Due to the small yield and the long crystallisation time, itappears unlikely that the 2-1-5 phase is relevant for the under-standing of historic verdigris samples. Surprisingly by aninvestigation on three historic pigment samples of theMedicinsk Historisk Museum obtained from the School ofConservation in Copenhagen, however, the presence of the2-1-5 phase was confirmed.
In two of the historic samples which were labelled as“copper acetate”, the 2-1-5 phase was identified as a minorimpurity (3.2 wt% and 6.0 wt%) (ESI, Fig. S3a and b‡). Onesample labelled as “basic copper acetate” with a 1-1-5 phasecomposition (Fig. 4a) was revealed to be a polyphase mixture(b). In the XRPD, most reflections could be assigned to copper(II)–acetate monohydrate (Fig. 4b, green pattern) and to the 2-1-5 phase (black pattern), the measured intensity at the posi-tion of the 011 reflection, however, is too high in relation tothe 110 basal reflection. Hence, at this position, a secondreflection attributed to another phase is apparent. In addition,at ca. 6.5° 2θ, a broad reflection (indicated by ◆) is presentthat is neither attributed to the 2-1-5 phase nor to copper(II)–acetate monohydrate and to any other known verdigris phasesor their degradation products. Hence, a third phase is appar-ent which can neither be identified nor be indexed due to alack of unambiguously assignable reflections, yet. In the SEMimages (Fig. 4c and d), elongated structures are visible buteverything is covered by a solid of an indefinite shape.Copper(II)–acetate monohydrate is most likely crystallised fromadherent solution during the drying process and thereforecovers the verdigris particles.
As the 2-1-5 phase was identified to be a component of his-toric pigments, a more efficient synthesis route in terms oftime and yield most likely exists.
Crystal structure description
In the crystal structure of the 2-1-5 phase, three crystallo-graphically independent copper sites are apparent (Fig. 5a).
Each cation site is coordinated by 4 oxygen atoms from hydrox-ide, water and acetate forming distorted squared planarcoordination spheres (orange bonds) with Cu–O distancesbetween 1.83 Å and 2.07 Å (ESI, Table S3‡), which is in theexpected range for this class of compounds.7,8,15 In addition,carboxylate related oxygen atoms are located in the extendedcoordination sphere (Fig. 5a, grey, dashed bonds) with Cu–Odistances ranging from 2.29 Å to 2.41 Å resulting in squaredpyramidal extended coordination spheres of Cu(1) and Cu(2)and in a Jahn–Teller-like distorted octahedra extended coordi-nation sphere of Cu(3). The coordination polyhedra of Cu(1)and Cu(2) form corner-sharing dimers that are linked to an
Fig. 4 Investigation of a historic verdigris sample labelled as “Basisk Cupriacetat, (CH3COO)2Cu Cu(OH)2, 5 H2O”, (a) photograph ©School ofConservation, Copenhagen, (b) XRPD pattern including assignment of the measured reflections, unassigned reflection are indicated by “◆”, (c + d)SEM images of the sample.
Fig. 5 Coordination spheres of the copper cations (a) and the acetateions (b) in the crystal structure of the 2-1-5 phase, orange bonds indi-cate directly coordinating ligands, and interactions within the extendedcoordination sphere are indicated by grey dashed bonds.
Dalton Transactions Paper
This journal is © The Royal Society of Chemistry 2018 Dalton Trans., 2018, 47, 8209–8220 | 8213
Ope
n A
cces
s A
rtic
le. P
ublis
hed
on 2
2 M
ay 2
018.
Dow
nloa
ded
on 2
/8/2
022
3:41
:33
PM.
Thi
s ar
ticle
is li
cens
ed u
nder
a C
reat
ive
Com
mon
s A
ttrib
utio
n 3.
0 U
npor
ted
Lic
ence
.View Article Online

edge-sharing Cu(3) unit. Bridging occurs via the O(1) and O(3)sites that are coordinated by 3 copper ions. Hence, these sitesare most likely occupied by hydroxide ions. The O(2) site isapical and therefore most likely occupied by water.
There are also 4 independent acetate sites in the crystalstructure of the 2-1-5 phase (Fig. 5b). The carboxylate oxygenatoms are always at apical positions in the coordinationspheres of copper. Acetate (a) bridges Cu(2) and Cu(3) andtherefore it acts as a bidentate and bridging ligand. In contrast,acetate (d) is a pure monodentate ligand in the coordinationsphere of Cu(3). The oxygen site (1) of acetates (b) and (c) ispart of the coordination sphere of Cu(2) and Cu(3), respect-ively. As the second carboxylate, oxygen (O(2b), O(2c)) aresituated within the extended coordination sphere of Cu(3),these acetates obtain a pseudo bidentate and pseudo bridgingcharacter.
The Cu2(CH3COO)2(CH3COO)1/2(OH)4/3H2O1/6+ dimers are
connected by edge-sharing Cu(CH3COO)(CH3COO)1/2(OH)2/31/6−
squares resulting in chains running in the c-direction with analternating orientation of the dimers and the Cu(3)O4 units asthe most prominent structural motif of the 2-1-5 phase (Fig. 6a).Interactions between the chains are mediated by non-coordinated water molecules that occupy the O(4–7) sites(Fig. 7, grey dashed lines). The O–O distances range from 2.68 Åto 2.97 Å which indicate strong interactions between non-coordinated water molecules and hydroxide or acetate ions.Some of these interactions are most likely H-bonds but due tothe limits of the XRPD method, no hydrogen positions could bedetermined. The thermal behaviour (see below) of the phase,however, shows that the non-coordinated water molecules areloosely bound.
The chains in the crystal structure of the 2-1-5 phase arearranged in a layered-like motif, perpendicular to [110] with aninterlayer distance of 9.3 Å (Fig. 6c), which is associated withthe characteristic 110 basal reflection (Fig. 2c). Although thecrystal structure of the 1-3-2 phase with its layered motif(Fig. 6b) completely differs, the strong 002 basal reflection islocated at an identical position (Fig. 2b) which is attributed toan identical interlayer distance of 9.3 Å (Fig. 6d). This can leadto serious problems for the phase identification using XRPD
only. Usually this process is carried out with flat plate devices,i.e. samples may exhibit preferred orientation. In addition, thesecond most intense reflection of the 2-1-5 phase (200) exhibitsa relative intensity of 12.4% and the relating reflection of the1-3-2 phase (004) has a relative intensity of 18.2%. Therefore,phases are often assigned to the appearance of the character-istic strongest reflection. This can be misleading when dealingwith mixtures containing the 2-1-5 phase or the 1-3-2 phase,which is a possible explanation for contradictory data given inthe literature. Accordingly, complementary methods likevibrational spectroscopy are essential for unambiguous phaseidentification.
Spectral properties
The 2-1-5 phase exhibits a characteristic light blue colour(Fig. 8a) that can be clearly distinguished from the turquoise1-3-2 phase (b) and the deep blue 1-2-0 phase (c). This isreflected by the diffuse UV/VIS reflectance spectra, as well
Fig. 7 Illustration of the interaction of the chains in the crystal structureof the 2-1-5 phase, mediated by non-coordinated water molecules.
Fig. 6 Comparison of main motifs of the crystal structures of the 2-1-5 (a, c) and the 1-3-2 phase (b, d).
Paper Dalton Transactions
8214 | Dalton Trans., 2018, 47, 8209–8220 This journal is © The Royal Society of Chemistry 2018
Ope
n A
cces
s A
rtic
le. P
ublis
hed
on 2
2 M
ay 2
018.
Dow
nloa
ded
on 2
/8/2
022
3:41
:33
PM.
Thi
s ar
ticle
is li
cens
ed u
nder
a C
reat
ive
Com
mon
s A
ttrib
utio
n 3.
0 U
npor
ted
Lic
ence
.View Article Online

(Fig. 8d). The 1-2-0 phase shows a sharp reflectance maximumat 472 nm, the maximum of the 2-1-5 phase is slightly broaderand located at 488 nm and the reflectance maximum of the
1-3-2 phase at 517 nm is very broad and shifted furthertowards higher wavelengths, i.e. towards greenish. Historic ver-digris pigments, which are often the multiphase mixture,usually exhibit a broad reflection maximum at approx.500 nm,38 this can be explained by a superposition of the UV/VIS spectra presented in Fig. 8d.
The FT-IR and Raman spectra of the 2-1-5 phase are givenin Fig. 9. For the band assignment, the spectroscopic data ofthe 1-3-2 phase,7,8,10,13 the 1-2-015 phase, Cu(CH3COO)2·H2O
39,40
and Cu(OH)241 as well as the fundamental vibrations of the
acetate ion42 were used. By band assignment and interpretationof the FT-IR-spectrum, several features of the crystal structurecan be confirmed. The Raman spectrum was recorded to obtainreference data for substance identification.
In the high wavenumber region of the FT-IR-spectrum(Fig. 9a, top), a superposition of very broad and intense bands(1) with a maximum at 3127 cm−1 is visible, which can beassigned to water related OH-stretching modes. Due to the lowsensitivity of ATR units in the high wavenumber region andthe high intensity of water related OH-stretching modes,hydroxide related OH-stretching modes that usually materia-lise as sharp bands cannot be identified. The acetate relatedC–H stretching modes (2) are rather broad, which indicatesthat the orientation of the methyl groups is not fixed by strongC–H⋯O bonds. The mid wavenumber region (Fig. 9b, top) con-tains symmetric and asymmetric acetate related C–O stretchingmodes ((3), (4)), as well as C–H bending modes (5). From the
Fig. 8 Photographs of powder samples of the (a) 2-1-5 phase, (b) 1-3-2phase and (c) 1-2-0 phase and comparison of normalised the UV/VISreflectance spectra (d).
Fig. 9 FT-IR spectrum of the 2-1-5 phase and comparison of the Raman spectra of the verdigris phases 2-1-5 (black), 1-3-2 (turquoise) and 1-2-0(blue) in the high (a), mid (b) and low (c) wavenumber region.
Dalton Transactions Paper
This journal is © The Royal Society of Chemistry 2018 Dalton Trans., 2018, 47, 8209–8220 | 8215
Ope
n A
cces
s A
rtic
le. P
ublis
hed
on 2
2 M
ay 2
018.
Dow
nloa
ded
on 2
/8/2
022
3:41
:33
PM.
Thi
s ar
ticle
is li
cens
ed u
nder
a C
reat
ive
Com
mon
s A
ttrib
utio
n 3.
0 U
npor
ted
Lic
ence
.View Article Online

C–O stretching modes, valuable information on the crystalstructure can be drawn. Both the symmetric and the asym-metric C–O stretching modes are split into several bandswhich are attributed to the different coordination spheres ofthe 4 distinct acetate sides in the crystal structure of the 2-1-5phase (Fig. 5b). The splitting of the strongest symmetric(1402 cm−1) and the strongest asymmetric C–O stretchingmode (1526 cm−1) in the IR-spectrum is unusually small, Δν =124 cm−1 (Fig. 9b, top, Table 1). For ionic acetate, usually asplitting of ≈160 cm−1 can be expected.43 A smaller splittingindicates bidentate or bridging coordination. Therefore, thesebands are most likely assigned to the pseudo bidentate andpseudo bridging acetates (b) and (c) (Fig. 5b). A small bandrelated to a symmetric C–O stretching mode is apparent at1445 cm−1. The splitting between this band and the strongestasymmetric C–O stretching mode (1526 cm−1) is extremelysmall (Δν = 81 cm−1), and therefore it can be assigned to theacetate (a) which has a bidentate and bridging characteristic.The splitting (Δν = 167 cm−1) between the broad asymmetricC–O stretching mode at 1569 cm−1 and the strongest sym-metric C–O stretching mode (1402 cm−1) is slightly greaterthan that expected for ionic acetates. Hence, it can be assignedto monodentate coordinating acetate (d). In the low IR-region(Fig. 9c, top), various acetate related C–C-stretching modes (7),carboxylate related bending modes (9), and Cu–O relatedbands (10) are apparent. In addition, broad hydrate waterrelated OH-bending modes are present.
A comparison of a part of the Raman spectra of the knownverdigris phases is presented in Fig. 9, bottom. Due to thepresence of strong hydroxide related OH-stretching modes, the1-2-0 phase (blue) line can be clearly distinguished from other
verdigris phases. The Raman-spectra of the 2-1-5 (black line)and the 1-3-2 phase (turquoise line), however, are very similar,and hence distinguishing between these two phases is nottrivial. Small differences are visible in the mid (4) and lowwavenumber (9 and 10) regions. Using conventional Raman-devices, these bands, however, are very broad and have only alittle intensity. The sharp methyl related CH-stretching (2) andthe bending mode (7) are more favourable for phase identifi-cation. In the 1-3-2 phase, these modes are slightly shiftedtowards lower wavenumbers than in the 2-1-5 phase (Fig. 9,bottom, inserts).
The complete Raman and FT-IR spectra of the 2-1-5 phaseare presented in the ESI, Fig. S4.‡
Thermal behaviour
The complex thermal behaviour of the 2-1-5 phase was investi-gated by thermogravimetric (TG) analysis, as well, as by ex situand in situ XRPD.
The TG-curve (Fig. 10, black line) of the 2-1-5 phase exhibitsseveral overlapping steps and the step size can only be esti-mated by using the DTG-curve (green line), i.e. the first deriva-tive of the TG-curve. The thermal decomposition of the 2-1-5phase starts at 50 °C. The first decomposition step is associ-ated with a mass loss of ≈6.2 wt%, which corresponds to arelease of 2 molecules of hydrate water (calculated mass loss:6.5 wt%). In the in situ XRPD patterns (Fig. 11a and b), theintensity of the reflections of the 2-1-5 phase starts to decreaseat 50 °C and additional reflections appear. This process iscompleted at 70–90 °C. According to the measured mass loss,the additional reflections can be assigned to a phase having a2-1-3 composition. The XRPD pattern of this phase (Fig. 12b)exhibits a very strong basal reflection corresponding to alattice plane distance of 8.6 Å that points to a layered-likestructure motif of this phase. In the TG-curve (Fig. 10, blackTable 1 Band position, shapes and assignments in the IR- and Raman
spectra of the 2-1-5 phase
Band no.
Position/cm−1, shape
AssignmentIR Raman
(1) 3127, br — ν(OH)–H2O(2) ≈2996, br ≈3017, br ν(CH)–CH3
2981, s ≈2987, br2933, sh 2936, vs
(3) ≈1569, br ≈1571, sh νas(CO)–COO−
1526, vs 1550, m(4) 1445, sh 1432, s νs(CO)–COO
−
1402, s 1416, sh(5) 1351, s 1354, m δ(CH)–CH3(6) 1050, m — ρ(CH)–CH3
1031, s —991, br —
(7) 917, br 938, vs ν(CC)–CH3—COO(8) 760, br — δ(OH)–H2O(9) 680, s 677, m δ(OCO)–COO−
615, m ≈617, br(10) — 524, m ν, ρ, ω(Cu–O),
lattice modes— 502, m— 394, m
vs: very strong, s: strong, m: medium, br broad, sh: shoulder.
Fig. 10 Thermogravimetric (TG, black line) and differential thermo-gravimetric (DTG, green line) curves of the 2-1-5 phase applying aheating rate of 2 K min−1.
Paper Dalton Transactions
8216 | Dalton Trans., 2018, 47, 8209–8220 This journal is © The Royal Society of Chemistry 2018
Ope
n A
cces
s A
rtic
le. P
ublis
hed
on 2
2 M
ay 2
018.
Dow
nloa
ded
on 2
/8/2
022
3:41
:33
PM.
Thi
s ar
ticle
is li
cens
ed u
nder
a C
reat
ive
Com
mon
s A
ttrib
utio
n 3.
0 U
npor
ted
Lic
ence
.View Article Online

line), there is no pronounced plateau between the first and thesecond decomposition step, accordingly the DTG-curve (greenline) does not drop down to 0 (grey line). The mass loss startsquickly in the second decomposition step but decelerates incourse of the decomposition process. Finally, there is an
overlap with the subsequent third decomposition step. Withrespect to the minimum in the DTG-curve, the seconddecomposition step is completed at a total mass loss of≈15.8 wt%, which corresponds to the complete release ofhydrate water (calculated mass loss 16.4 wt%). According tothe in situ XRPD analysis (Fig. 11b and c), the decompositionof the intermediarily formed 2-1-3 phase starts at 110 °C andyields two solid phases: anhydrous copper(II)–acetate (Fig. 12c,reflections indicated by ∇) and a solid with a characteristicbasal reflection associated with a lattice plane distance ofapprox. 10.5 Å. The latter phase also occurs during thethermal decomposition of the 1-3-2 (Fig. 12c, turquoisepattern) and the 1-2-0 phases (blue pattern). In the case of the1-2-0 phase, the intermediate was identified asCu3(CH3COO)2(OH)4−2xOx
15 and in the case of the 1-3-2 phaseas Cu2(CH3COO)(OH)3 (≡ 1-3-0 phase).7 Hence, the intermediateformed during the thermal decomposition of the 2-1-5 phase ismost likely an acetate–hydroxide (Cu(CH3COO)x(OH)1−x) with avariable acetate : hydroxide ratio. At 190 °C, the intensity of theCu(CH3COO)x(OH)1−x related reflections starts to decrease, thereflections attributed to anhydrous copper(II)–acetate increasein intensity and additional reflections attributed to Cu2Oappear (Fig. 11c, d and 12d). The course of the TG- (Fig. 10,black line) and DTG-curve (green line) indicates that thisprocess runs slowly. At 250 °C, the final decomposition stepstarts. The DTG-curve reveals that this is a two-step process(Fig. 10, (4) and (5)), which is also confirmed by the in situXRPD analysis (Fig. 11d and e). Anhydrous copper(II)–acetate isdecomposed to a strongly stacking faulted oxy-acetate,Cu(CH3COO)1−2yOy, that is characterised by a strong basalreflection corresponding to a lattice plane distance of 10.0 Å(Fig. 12e). As the complete decomposition of the acetate ionunder a nitrogen atmosphere leads to several redox processes,copper(II) is reduced to copper(I) and copper(0). An ex situXRPD analysis of the brownish-red residue of the thermaldecomposition shows that it consists of Cu2O and Cu(ESI, Fig. S5‡); this is in accordance with the literature data ofthe thermal decomposition of copper(II)–acetate.40,44
Magnetic properties
Fig. 13 displays the inverse magnetic susceptibilities of a 2-1-5polycrystalline sample versus the temperature measured byapplying an external magnetic field of 0.1, 1 and 7 Tesla. Oneobserves a field dependence leading to slight growth of theinverse susceptibilities with higher magnetic fields. This effectcan be understood as due to a minute ferromagnetic impuritywhich becomes gradually more saturated with larger externalfields. Saturation effects are also observed at a very low tem-perature where especially the 7 T data exhibit a levelling-off at afinite value whereas the 0.1 and 1 T inverse susceptibilities to agood approximation exhibit a linear temperature dependencefor T → 0 indicating Curie–Weiss behaviour, χ = C/(T − θ), witha vanishing Curie–Weiss temperature, θ, whereas above ∼100 K,the susceptibilities follow the Curie–Weiss law at a Curie–Weisstemperature of −64(2) K considering the 7 T data. What isalso immediately obvious is the marked change of the slopes
Fig. 11 Temperature dependent in situ XRPD pattern of the 2-1-5phase including the assignment of the measured reflections: (a) 2-1-5phase, (b) 2-1-3 phase, (c) Cu(CH3COO)1−x(OH)x + Cu3(CH3COO)2, (d)Cu3(CH3COO)2 + Cu2O and (e) Cu(CH3COO)1−2yOy + Cu2O.
Fig. 12 In situ XRPD patterns of the 2-1-5 phase taken during thethermal decomposition at (a) 30 °C, (b) 90 °C, (c) 150 °C + in situ XRPDpatterns taken during the decomposition of the 1-2-0 phase at 170 °C(blue) and of the 1-3-2 phase taken at 140 °C (turquoise), (d) 210 °C +in situ XRPD patterns taken during the decomposition of Cu(CH3COO)2·H2O at 200 °C (grey) and (e) at 270 °C + in situ XRPD pat-terns taken during the decomposition of Cu(CH3COO)2·H2O at 270 °C(grey).
Dalton Transactions Paper
This journal is © The Royal Society of Chemistry 2018 Dalton Trans., 2018, 47, 8209–8220 | 8217
Ope
n A
cces
s A
rtic
le. P
ublis
hed
on 2
2 M
ay 2
018.
Dow
nloa
ded
on 2
/8/2
022
3:41
:33
PM.
Thi
s ar
ticle
is li
cens
ed u
nder
a C
reat
ive
Com
mon
s A
ttrib
utio
n 3.
0 U
npor
ted
Lic
ence
.View Article Online

(1/χ ∝ 1/C) of the Curie–Weiss laws at high and at low tempera-tures by a factor of ∼2.7. Since the Curie–Weiss constant C isproportional to the number of active magnetic species, theslope change indicates a marked reduction of the contributingCu moments by a ratio of approximately three. The Curie–Weiss temperature reflects the predominant spin exchangecoupling between magnetic moments. Apparently, the mag-netic species left at low temperatures remain almostuncoupled whereas at high temperatures, significant spinexchange coupling prevails. In view of the crystal structure ofthe 2-1-5 phase, this finding is suggestive of a scenario where arather strongly antiferromagnetically spin exchange thecoupled magnetic Cu–Cu dimer and a significantly weakercoupled Cu monomer contribute to the magnetism. The Curiecontribution of the latter diverges (i.e. θ → 0) at low tempera-tures whereas the former condense into non-magnetic singletswith vanishing magnetic response at temperatures below thesinglet–triplet splitting energy of the spin S = 1/2 Cu2+ dimers.At temperatures sufficiently high compared to the spinexchange coupling energy of the spin dimers, both sub-systems contribute to the magnetisation. Accordingly, we havefitted the magnetic susceptibility of the 2-1-5 phases to thesum of the susceptibility of a S = 1/2 dimer given by theBleaney–Bowers equation45 and a Curie-law contribution fromthe monomer according to
χmolðTÞ ¼ 2NAμB
2gdim2
3kBT1þ 1
3eð�Jdim=kBT
� ��1
þNAμB2gmono
2
3kBTþ χ0;
ð1Þ
where we have added a temperature independent part, χ0,which takes care of diamagnetic contributions from the elec-trons in the closed shells and from the temperature-indepen-dent paramagnetic Van Vleck susceptibility contributions. Thediamagnetic contributions can be estimated from Pascal’sincrements46 for the contributing ions. The van Vleck contri-butions are orientation dependent and are of the order of+100 × 10−6 cm3 per mol per Cu2+ cation and can compensateor even override the diamagnetic contributions.47
Fig. 14 displays a fit of the susceptibility data (7 T) to eqn(1) with parameters summarised in Table 2.
The agreement of the fit with the experimental data is verysatisfactory thus giving strong support for our model assump-tions that the magnetic properties of the 2-1-5 phase decom-pose into two independent subsystems. The fit parameters(Table 2) indicate an antiferromagnetic spin exchange coup-ling of −182 K in the Cu dimer. This value is about 50% ofthat what is typically found e.g. in hydrated copper acetate[Cu(OAc)2·H2O]2 where values of ∼−400 K or somewhat morehave been observed.48
The g factor for the dimer is close to what is expected for apowder average of the Cu2+ g factors, ∼2.13–2.15.49 The g factorof the monomer is somewhat enlarged. A reason could be thatan impurity phase containing Cu2+ S = 1
2 entities contribute inthe same way to the susceptibility as the Cu monomer of the2-1-5 phase.
Conclusions
Copper(II)–acetate hydroxides (xCu(CH3COO)2·yCu(OH)2·zH2O≡ x − y − z phase) are known as the main components of his-toric verdigris pigments. Incomplete precipitation fromaqueous copper(II)–acetate solution at elevated temperaturesusing ammonia solution as a precipitating agent leads to theformation of the well characterised 1-3-2 and 1-2-0 phases. Byfurther ageing of the mother liquors at 25 °C for one year,additional verdigris phases can be obtained. From the motherliquor from the production of the 1-3-2 phase, the hithertopoorly characterised 2-1-5 phase was crystallised. The phasecomposition was confirmed by crystal structure determinationfrom laboratory XRPD data and thermal analysis. In the crystal
Fig. 13 Magnetic susceptibilities of a powder sample of the 2-1-5phase (per three Cu atoms) measured by heating the sample from 2 K to300 K in an external field of 0.1, 1 and 7 Tesla as indicated. Fig. 14 Fit of eqn (1) to the magnetic susceptibility of a powder sample
of the 2-1-5 phase (per three Cu atoms) measured in an external field of7 Tesla.
Table 2 Parameters resulting from a fit of eqn (1) to the magnetic sus-ceptibility data collected as a function of temperature between 2 and300 K in an external magnetic field of 7 Tesla
gdim 2.19(1)gmono 2.390(5)Jdim −182(1) Kχ0 297(12) × 10−6 cm3 mol−1
Paper Dalton Transactions
8218 | Dalton Trans., 2018, 47, 8209–8220 This journal is © The Royal Society of Chemistry 2018
Ope
n A
cces
s A
rtic
le. P
ublis
hed
on 2
2 M
ay 2
018.
Dow
nloa
ded
on 2
/8/2
022
3:41
:33
PM.
Thi
s ar
ticle
is li
cens
ed u
nder
a C
reat
ive
Com
mon
s A
ttrib
utio
n 3.
0 U
npor
ted
Lic
ence
.View Article Online

structure of the 2-1-5 phase, copper ions are coordinated byacetate and hydroxide ions, as well as by water moleculesforming distorted square planar coordination spheres. Theacetate ions act as bidentate and bridging, monodentate andapical and as pseudo bidentate and pseudo bridging (i.e. thereis still some interaction between the non-coordinating carboxy-late oxygen and a copper ion) ligands. This is also reflected bysplitting and degeneration of the symmetric and asymmetriccarboxylate related C–O stretching modes in the IR-spectrum.Cu2(CH3COO)2(CH3COO)1/2(OH)4/3H2O
1/6+ dimers that areinterconnected by Cu(CH3COO)(CH3COO)1/2(OH)2/3
1/6−
squares forming chains running in the c-direction are themain motif of the crystal structure of the 2-1-5 phase. Thismotif is reflected by the magnetic properties that show arather strongly antiferromagnetically spin exchange coupledmagnetic Cu–Cu dimer and a significantly weaker coupled Cumonomer contributing to the magnetism. In the crystal struc-ture, additional molecules of hydrate water are situatedinbetween the sheets and mediate the inter–chain interaction.These loosely bound water molecules can be easily released byheating up to temperatures >50 °C. The light blue colour ofthe solid originates from a reflectance maximum at 488 nmand significantly differs from known verdigris phases. Aninvestigation of several historic verdigris pigment samplesreveals that the 2-1-5 phase occurs both as minor and majorcomponents. Hence, reliable reference data for the identifi-cation of the 2-1-5 phase by XRPD or vibrational spectroscopyare now available that can be used by museums and collec-tions worldwide to identify this verdigris phase in historicartwork and pigment samples.
Conflicts of interest
There are no conflicts to declare.
Acknowledgements
David A. Scott’s1 enthusiasm for historic pigments and theirsynthesis greatly inspired our work. Julia Kröger from the MaxPlanck Institute for Solid State Research is acknowledged formeasuring the UV/VIS spectrum, Eva Brücher from the MaxPlanck Institute for Solid State Research for performing theSQUID measurements, Jörg Stelzner from the State Academy ofArt and Design Stuttgart for taking the Raman-spectrum andMichael X. Müller from the University of Stuttgart is acknowl-edged for taking the IR spectrum. Funding by DFG for theproject “In search of structure” (grant EG 137/9-1) is gratefullyacknowledged. Open Access funding provided by the MaxPlanck Society.
References
1 D. A. Scott, Y. Taniguchi and E. Koseto, Rev. Conserv., 2001,2, 73–91.
2 H. H. A. Dollwet and J. R. J. Sorenson, Trace Elem. Med.,1985, 2, 80–87.
3 J. Gauthier, Rev. Gen. Sci. Pures Appl. Bull. Assoc. Fr. Av. Sci.,1959, 66, 67–78.
4 F. Schweizer and B. Muehlethaler, Farbe Lack, 1968, 74,1159–1173.
5 G. Rahn-Koltermann, D. H. Buss, R. Fuchs and O. Glemser,Z. Naturforsch., B: Chem. Sci., 1991, 46, 1020–1024.
6 T. D. Chaplin, R. J. H. Clark and D. A. Scott, J. RamanSpectrosc., 2006, 37, 223–229.
7 N. Masciocchi, E. Corradi, A. Sironi, G. Moretti, G. Minelliand P. Porta, J. Solid State Chem., 1997, 131, 252–262.
8 S. Švarcová, M. Klementová, P. Bezdička, W. Łasocha,M. Dušek and D. Hradil, Cryst. Res. Technol., 2011, 46,1051–1057.
9 N. Kozai, H. Mitamura, H. Fukuyama, F. Esaka andS. Komarneni, J. Mater. Res., 2005, 20, 2997–3003.
10 A. Jiménez-López, E. Rodríguez-Castellón, P. Olivera-Pastor,P. Maireles-Torres, A. A. G. Tomlinson, D. J. Jones andJ. Rozière, J. Mater. Chem., 1993, 3, 303–307.
11 S. Yamanaka, Solid State Ionics, 1992, 53–56, 527–533.12 K. Suzuki, J. Haines, P. Rabu, K. Inoue and M. Drillon,
J. Phys. Chem. C, 2008, 112, 19147–19150.13 P. Rabu, M. Drillon and C. Hornick, Analusis, 2000, 28,
103–108.14 M. San Andrés, J. M. de la Roja, V. G. Baonza and
N. Sancho, J. Raman Spectrosc., 2010, 41, 1468–1476.15 S. Bette, R. K. Kremer, G. Eggert, C. C. Tang and
R. E. Dinnebier, Dalton Trans., 2017, 46, 14847–14858.16 S. Prati, I. Bonacini, G. Sciutto, A. Genty-Vincent, M. Cotte,
M. Eveno, M. Menu and R. Mazzeo, Appl. Phys. A, 2015,122, 1–16.
17 J. M. de la Roja, V. G. Baonza and M. San Andrés,Spectrochim. Acta, Part A, 2007, 68, 1120–1125.
18 C. Santoro, K. Zarkout, A.-S. Le Hô, F. Mirambet,D. Gourier, L. Binet, S. Pagès-Camagna, S. Reguer,S. Mirabaud, Y. Du, P. Griesmar, N. Lubin-Germain andM. Menu, Appl. Phys. A, 2014, 114, 637–645.
19 S. Yamanaka, Stud. Surf. Sci. Catal., 1994, 83, 147–153.20 S. Yamanaka, T. Sako and M. Hattori, Chem. Lett., 1989, 18,
1869–1872.21 G. Rogez, C. Massobrio, P. Rabu and M. Drillon, Chem. Soc.
Rev., 2011, 40, 1031–1058.22 W. Fujita, K. Awaga and T. Yokoyama, Inorg. Chem., 1997,
36, 196–199.23 V. Laget, C. Hornick, P. Rabu and M. Drillon, J. Mater.
Chem., 1999, 9, 169–174.24 R. Billinge, L. Campbell, J. Dunkerton, S. Foister, J. Kirby,
J. Pilc, A. Roy, M. Spring and R. White, National GalleryTechnical Bulletin, 1997, 18, 68–86.
25 S. Haseloff, PhD-thesis, Albert-Ludwigs-Universität,Freiburg im Breisgau, 2011.
26 S. Bette, M. Pannach, R. E. Dinnebier and D. Freyer,Eur. J. Inorg. Chem., 2017, 2017, 1488–1497.
27 M. Pannach, S. Bette and D. Freyer, J. Chem. Eng. Data,2017, 62, 1384–1396.
Dalton Transactions Paper
This journal is © The Royal Society of Chemistry 2018 Dalton Trans., 2018, 47, 8209–8220 | 8219
Ope
n A
cces
s A
rtic
le. P
ublis
hed
on 2
2 M
ay 2
018.
Dow
nloa
ded
on 2
/8/2
022
3:41
:33
PM.
Thi
s ar
ticle
is li
cens
ed u
nder
a C
reat
ive
Com
mon
s A
ttrib
utio
n 3.
0 U
npor
ted
Lic
ence
.View Article Online

28 Bruker-AXS, TOPAS 6.0, 2017, Karlsruhe.29 A. A. Coelho, J. Appl. Crystallogr., 2003, 36, 86–95.30 A. Le Bail, H. Duroy and J. L. Fourquet, Mater. Res. Bull.,
1988, 23, 447–452.31 R. W. Cheary, A. A. Coelho and J. P. Cline, J. Res. Natl. Inst.
Stand. Technol., 2004, 109, 1–25.32 G. Oszlanyi and A. Sueto, Acta Crystallogr., Sect. A: Found.
Crystallogr., 2004, 60, 134–141.33 C. Baerlocher, L. B. McCusker and L. Palatinus, Z.
Kristallogr., 2007, 222, 47–53.34 A. A. Coelho, Acta Crystallogr., Sect. A: Found. Crystallogr.,
2007, 63, 400–406.35 A. A. Coelho, J. Appl. Crystallogr., 2000, 33, 899–908.36 V. Favre-Nicolin and R. Černý, Mater. Sci. Forum, 2004,
443–444, 35–38.37 H. M. Rietveld, J. Appl. Crystallogr., 1969, 2, 65–71.38 M. Aceto, A. Agostino, G. Fenoglio, A. Idone, M. Gulmini,
M. Picollo, P. Ricciardi and J. K. Delaney, Anal. Methods,2014, 6, 1488.
39 P. Baraldi and G. Fabbri, Spectrochim. Acta, Part A, 1981, 37,89–92.
40 Z. Lin, D. Han and S. Li, J. Therm. Anal. Calorim., 2011,107, 471–475.
41 H. D. Lutz and M. Schmidt, Eur. J. Solid State Inorg. Chem.,1995, 32, 937–945.
42 E. Spinner, J. Chem. Soc., 1964, 4217–4226, DOI: 10.1039/jr9640004217.
43 G. Deacon, Coord. Chem. Rev., 1980, 33, 227–250.44 S. A. A. Mansour, J. Therm. Anal., 1996, 46, 263–274.45 H. Lueken, Magnetochemie, Teubner Studienbücher,
Stuttgart, Leipzig, 1999.46 P. W. Selwood, Magnetochemistry, Interscience Publishers,
Inc., New York, 1956.47 M. G. Banks, R. K. Kremer, C. Hoch, A. Simon,
B. Ouladdiaf, J. M. Broto, H. Rakoto, C. Lee andM. H. Whangbo, Phys. Rev. B: Condens. Matter, 2009, 80,024404.
48 B. Bleaney and K. D. Bowers, Proc. R. Soc. A, 1952, 214, 451–465.
49 A. Abragam and B. Bleaney, Electron ParamagneticResonance of Transition Ions, Oxford University Press,New York, 1970.
Paper Dalton Transactions
8220 | Dalton Trans., 2018, 47, 8209–8220 This journal is © The Royal Society of Chemistry 2018
Ope
n A
cces
s A
rtic
le. P
ublis
hed
on 2
2 M
ay 2
018.
Dow
nloa
ded
on 2
/8/2
022
3:41
:33
PM.
Thi
s ar
ticle
is li
cens
ed u
nder
a C
reat
ive
Com
mon
s A
ttrib
utio
n 3.
0 U
npor
ted
Lic
ence
.View Article Online