Volume 4, Article - Department of Information and Library Science
29
Published in the IBM System Journal, Vol. 36, No.1, (1/97) Submitted to IBM Systems Journal The Effects of the Business Model on Object- Oriented Software Development Productivity by T. E. Potok M. A. Vouk We intend to demonstrate that if the business model cannot adjust to new technology, by recognizing a) its limitations, b) the ability of the organization to control it, and c) by adjusting its deadlines to take advantage of the methodology potentials, it is unlikely that an investment in the technology will result in real productivity benefits. As software development cycles shorten, and software markets become more competitive, improved software development productivity continues to be a major concern in the software industry. Many believe that object-oriented technology provides a breakthrough solution to this problem, but there is little quantitative evidence for this belief. Furthermore, most studies related to object-oriented productivity do not consider it in conjunction with the business constraints under which the software is developed. Business models tend to focus on cost and calendar events and tend to form deadlines that are governed by marketing windows and pressures. In this paper we explore the relationship between the business model and the productivity that a software development methodology can achieve in a commercial environment. We first examine empirical data from several commercial products developed under the same business model and an iterative software development process. The results indicate that lack of incentives for early completion of intermediate project tasks, and a rigorous enforcement of final project deadlines, may trigger Parkinson's Law delays and negatively affect software development productivity, especially when projects are developed using object-oriented methods. We then model and simulate the impact of software task completion incentives and imposed deadlines on productivity that might be expected from potentially high-productivity technology, such as object-orientation. We show how and why some common business practices might lower project productivity and project completion probability. We also discuss to what extent poor software process control and/or use of immature technology compounds the problem. Introduction It is widely believed that object-oriented development has considerable potential for increasing software development productivity. The reasons for the gains range from reuse, through better problem understanding, to better (less complex and less costly ) designs and implementations. However, there is little quantitative evidence that productivity of real- life object-oriented software development is indeed consistently better than that of "classical" or "procedural" software development. Most studies related to object-oriented development productivity do not consider it in conjunction with the business practices under which the software is being developed. Since commercial development always takes place
Transcript of Volume 4, Article - Department of Information and Library Science

Published in the IBM System Journal, Vol. 36, No.1, (1/97)
Submitted to IBM Systems Journal
The Effects of the Business Model on Object-Oriented Software Development Productivity
by T. E. Potok M. A. Vouk
We intend to demonstrate that if the business model cannot adjust to new technology, by recognizing a) its limitations, b) the ability of the organization to control it, and c) by adjusting its deadlines to take advantage of the methodology potentials, it is unlikely that an investment in the technology will result in real productivity benefits.
As software development cycles shorten, and software markets become more competitive, improved software development productivity continues to be a major concern in the software industry. Many believe that object-oriented technology provides a breakthrough solution to this problem, but there is little quantitative evidence for this belief. Furthermore, most studies related to object-oriented productivity do not consider it in conjunction with the business constraints under which the software is developed. Business models tend to focus on cost and calendar events and tend to form deadlines that are governed by marketing windows and pressures. In this paper we explore the relationship between the business model and the productivity that a software development methodology can achieve in a commercial environment. We first examine empirical data from several commercial products developed under the same business model and an iterative software development process. The results indicate that lack of incentives for early completion of intermediate project tasks, and a rigorous enforcement of final project deadlines, may trigger Parkinson's Law delays and negatively affect software development productivity, especially when projects are developed using object-oriented methods. We then model and simulate the impact of software task completion incentives and imposed deadlines on productivity that might be expected from potentially high-productivity technology, such as object-orientation. We show how and why some common business practices might lower project productivity and project completion probability. We also discuss to what extent poor software process control and/or use of immature technology compounds the problem.
Introduction It is widely believed that object-oriented development has considerable potential for increasing software development productivity. The reasons for the gains range from reuse, through better problem understanding, to better (less complex and less costly ) designs and implementations. However, there is little quantitative evidence that productivity of real-life object-oriented software development is indeed consistently better than that of "classical" or "procedural" software development. Most studies related to object-oriented development productivity do not consider it in conjunction with the business practices under which the software is being developed. Since commercial development always takes place

Potok and Vouk 2
DRAFT Potok & Vouk 2
in the context of a business model, an understanding of how business constraints influence commercial software development is imperative. According to Jacobson et al.
a business model shows what the company’s environment is and how the company acts in relation to this environment. By environment we mean everything the company interacts with to perform its business processes, such as customers, partners, subcontractors and so on. It shows employees at every level what must be done and when and how it should be done [Jacobson et al. (1994)].
Business models tend to focus on cost and calendar events (e.g., quarterly reports) and tend to form deadlines that are governed by marketing windows and other pressures, often regardless of the real software engineering capabilities of the organization. Software engineering development models tend to focus on the complexity of a software project and the capabilities of the development team and software methodologies. In a meaningful evaluation of project viability we need to consider both aspects.
In this paper we quantitatively explore and model the relationship between the business incentives and deadlines and the productivity that a software development methodology can achieve in a commercial environment.
Related Work. Lewis et al. performed an experiment with undergraduate software engineering students to study the effects of reuse [Lewis et al. (1991)]. Based on means tests of the recorded productivity metrics, Lewis et al. concluded that the object-oriented paradigm can improve productivity by about 50% when reuse1 is present. However, they did not find any statistically significant evidence that the object-oriented paradigm has higher productivity than procedural methods when reuse is not a factor. Melo et al. conducted an experiment with graduate students that resulted in seven projects ranging is size from 5000 - 25000 lines of code [Melo et al. (1995)]. The projects were developed
using a Waterfall process model, object-oriented design, C++, and varying levels of reuse. Their results support the conclusion that reuse rates can increase programmer productivity as much as two to three times2. Optimistic economic models of reuse indicate that break-even reuse levels may be as low as 10-20% [Henderson-Sellers (1993)], while pessimistic models show that break-even levels may be difficult to achieve even under very high levels of reuse [Schimsky (1992)]. There is also evidence that different development methodologies have differing impacts on the software development process. Boehm-Davis et al. report on a comparison of Jackson program design, object-oriented design, and functional decomposition, using professional programmers [Boehm-Davis et al. (1992)]. Some of the insights from the study are that Jackson’s method, and object-oriented methodologies produce more complete solutions, require less time to design and code a problem, and produce less complex designs than functional decomposition. However, a quantitative comparison of productivity associated with different methodologies was not given. Zweben et al., again in an experiment with graduate and undergraduate students, show that layering
1 In this experiment, the reuse level may have been as high as 25% in some cases.
2 For high-end productivity gains reuse levels were in range 40-50%.

Potok and Vouk 3
DRAFT Potok & Vouk 3
and encapsulation in Ada (an object-oriented trait) may reduce development effort [Zweben et al. (1995)].
There are many other studies and books concerned with the value of the object-oriented approach [e.g., Booch (1991), deChampeaux et al. (1993), Rumbaugh (1991), Wirfs-Brock (1990), Coleman et al. (1994), Hayes et al. (1991), Monarchi et al. (1992), Henderson-Sellers et al. (1994), to name a few]. There are also many studies of the value of reuse [Berlin (1990), Dunn et al. (1991), Gamma et al. (1993), Griss et al. (1991), Henderson-Sellers (1993), Wessale et al. (1993)]. However, what is missing, to a large extent, are quantitative studies that focus on productivity related to software developed for commercial use by professional programmers who use object-oriented methods.
In fact, a recent paper by Hansen indicates that commercial software development should always be considered in the context of the business model [Hansen (1996)]. Our own work supports this. We believe that object-oriented development productivity is strongly influenced by the underlying business factors [Potok and Vouk (1995)]. For example, our results indicate that although the introduction of object-oriented technology does not appear to hinder overall productivity on commercial projects, it neither seems to improve it in a systematic way, at least not in the first two product generations. The data show that the governing influence may not be the methodology, but the business model which includes market and business constraints imposed on schedules, tasks, and resources. We also found that two business model related effects, Parkinson’s Law [Parkinson (1957), Gutierrez (1991)] and the Deadline Effect [Boehm (1981), Borger et al. (1991)], appear to be very important influences in commercial software development.
Parkinson’s Law states that work will expand to fill the allocated time. For example, if a project is given to three similar development teams with three easily achievable, but different deadlines, the projects will not complete at the same time, but according to the deadlines set. The Deadline Effect occurs when programmers are compelled to work extra effort in order to complete a task by a given deadline. If a deadline is set, and there is strong pressure to meet the deadline, people will work additional hours solely to meet the deadline. These effects are supported by industrial psychology literature on “goal theory” that reports significant evidence that productivity increases with specific, challenging goals [Locke et al. (1990), Latham et al. (1982)]. This theory states that there is a linear relationship between the degree of difficulty of a goal, and the performance required to achieve it. As of 1990, over 400 experiments have been performed testing this theory, with over 90% supporting it. The basic structure of such experiments involves participants performing a group of tasks. Some of the participants are given a specific, hard goal that they are expected to achieve, while the others are told to “do their best.” In most cases, the participants given hard goals significantly out performed the other participants. This supports the notion that programmer productivity can be a strong function of the schedule goals, and that team productivity for hard, specific, schedules will most likely be higher (within reason), than it is for less challenging schedules.
Approach. In this study we focus on the effects that some business practices may have on productivity observed in software projects. We use empirical information to identify the effects and help formulate a detailed simulation model of interactions among the iterative software development process, its maturity, and the applied business model. We then use

Potok and Vouk 4
DRAFT Potok & Vouk 4
this model to explore how business constraints can affect productivity and time to market when potentially high-productivity methodologies, such as object-oriented development, are used.
In the next section we present the empirical data that relate business practices and software development productivity. In the section that follows we formulate a simulation model of the interactions, and then we use the model to study the impact of business imposed incentives and deadlines on software development productivity that might be expected from object-oriented methodology. Summary and conclusions are given in the last section.
Empirical Results3 Process and Origin of Data. The empirical data was collected at the IBM Software Solutions Laboratory in Research Triangle Park, North Carolina. The laboratory was ISO 9000 Certified in 1994, and it has consistently received high marks in internal assessment against the Malcolm Baldrige Criteria. The general business model that drives software development at that laboratory recognizes two major software product sub-categories: versions and releases. A new version is typically quite large, and contains a significant product enhancement, or change in functionality. A version is ordinarily followed by one or more maintenance releases that are usually much smaller than a version, and contain fixes to defects, and minor enhancements. The calendar-time duration for development of both versions and releases is strongly driven by market forces. Versions tend to take longer than releases, but are within an 18-24 month window common to the industry today. Release development will normally not be shorter than 9-12 months. There are a number of reasons for this, some of which are distribution costs, arrival rate of release-type fixes and changes, and possibly the issue of user-perceived quality (e.g., scheduling of a release very soon after a version can give the impression of quality problems). While all new development must be completed with a limited number of personnel, existing projects will have an established team, and typically an effort is made to maintain or even increase the size of the team because it may not be cost-effective to dismantle the team between versions. Therefore, it is not unusual to have a large version developed with tight resource and time constraints, yet have a smaller follow-up maintenance release developed over a more relaxed schedule using the same team.
The development of both versions and releases is subject to frequent high-level reviews of their schedule status against key development dates (or milestones) established at the beginning of the product cycle. The progress towards these dates is reviewed regularly and in detail, and schedule slips in any major milestones are strongly discouraged. Detailed project schedules are required at the beginning of the product development cycle, and they trigger business processes including funding, planning, marketing, supporting, and certification of the quality of a product. The most prevalent software development process followed in the organization is called the “iterative” process. The iterative process is a variant of a combination of evolutionary prototyping [Boehm (1981)] and successive versioning approach [Fairley (1985)]. In theory, each software iteration is fully planned, 3 Data used by permission. The scales appearing on the axes of all graphs, and any product and date-related information,
have been altered to provide discretion.

Potok and Vouk 5
DRAFT Potok & Vouk 5
designed, coded, and tested, before work begins on the next iteration. The duration and amount of code produced for each iterations is approximately the same. A typical project activity diagram is illustrated in Figure 1.
15 16 17 18
20
19
21 22 23 24
26
25
3 4 5 6
8
7
9 10 11 12
14
13
1
2
27 28 29 30
31 32 33 34
38
35 36 37
Figure 1 Development process used for a second generation object-oriented project.
Figure 1 shows a high-level PERT diagram of the process used for one of the commercial products developed at the laboratory. The product was a second generation object-oriented port between platforms. In this diagram, edges represent activities, and have durations associated with them, while nodes are milestones. Different activities and milestones are described in Table 1. The final product has approximately 64 thousand lines of C++ code, the port required over 8 person-years of effort, and took 16 months to complete. A Booch type object-oriented methodology was used.
There are five (unfolded) iteration cycles. The first iteration ends with milestones 7 and 8, the second with 13 and 14, the third with 19 and 20, the fourth one with 25 and 26, and the final iteration with node 30. The system testing activities run in parallel but are mainly aimed at the software emerging out of the final cycle. When an iteration is complete the work is reviewed, and the suggested changes and enhancements examined in the planning phase of the next iteration. When all development iterations are completed, and depending on the
Potok and Vouk 6
DRAFT Potok & Vouk 6
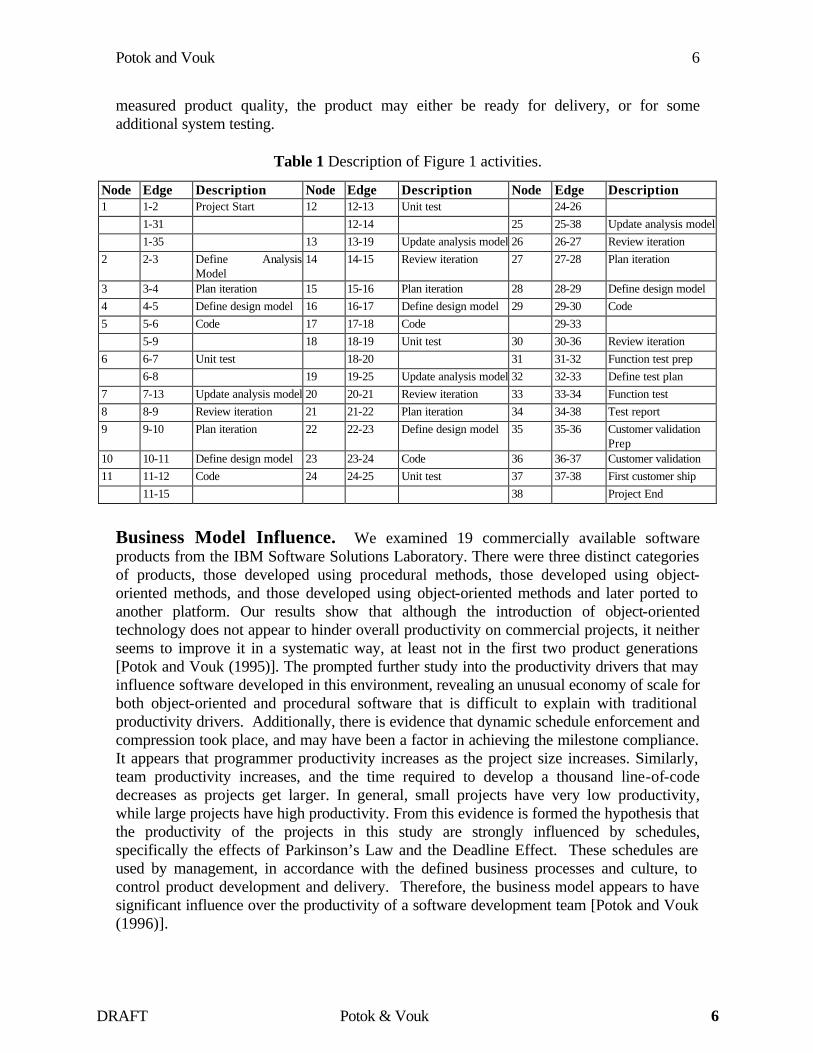
measured product quality, the product may either be ready for delivery, or for some additional system testing.
Table 1 Description of Figure 1 activities.
Node Edge Description Node Edge Description Node Edge Description 1 1-2 Project Start 12 12-13 Unit test 24-26 1-31 12-14 25 25-38 Update analysis model 1-35 13 13-19 Update analysis model 26 26-27 Review iteration 2 2-3 Define Analysis
Model 14 14-15 Review iteration 27 27-28 Plan iteration
3 3-4 Plan iteration 15 15-16 Plan iteration 28 28-29 Define design model 4 4-5 Define design model 16 16-17 Define design model 29 29-30 Code 5 5-6 Code 17 17-18 Code 29-33 5-9 18 18-19 Unit test 30 30-36 Review iteration 6 6-7 Unit test 18-20 31 31-32 Function test prep 6-8 19 19-25 Update analysis model 32 32-33 Define test plan 7 7-13 Update analysis model 20 20-21 Review iteration 33 33-34 Function test 8 8-9 Review iteration 21 21-22 Plan iteration 34 34-38 Test report 9 9-10 Plan iteration 22 22-23 Define design model 35 35-36 Customer validation
Prep 10 10-11 Define design model 23 23-24 Code 36 36-37 Customer validation 11 11-12 Code 24 24-25 Unit test 37 37-38 First customer ship 11-15 38 Project End
Business Model Influence. We examined 19 commercially available software products from the IBM Software Solutions Laboratory. There were three distinct categories of products, those developed using procedural methods, those developed using object-oriented methods, and those developed using object-oriented methods and later ported to another platform. Our results show that although the introduction of object-oriented technology does not appear to hinder overall productivity on commercial projects, it neither seems to improve it in a systematic way, at least not in the first two product generations [Potok and Vouk (1995)]. The prompted further study into the productivity drivers that may influence software developed in this environment, revealing an unusual economy of scale for both object-oriented and procedural software that is difficult to explain with traditional productivity drivers. Additionally, there is evidence that dynamic schedule enforcement and compression took place, and may have been a factor in achieving the milestone compliance. It appears that programmer productivity increases as the project size increases. Similarly, team productivity increases, and the time required to develop a thousand line-of-code decreases as projects get larger. In general, small projects have very low productivity, while large projects have high productivity. From this evidence is formed the hypothesis that the productivity of the projects in this study are strongly influenced by schedules, specifically the effects of Parkinson’s Law and the Deadline Effect. These schedules are used by management, in accordance with the defined business processes and culture, to control product development and delivery. Therefore, the business model appears to have significant influence over the productivity of a software development team [Potok and Vouk (1996)].

Potok and Vouk 7
DRAFT Potok & Vouk 7
This prompted us take a closer look at the interactions between the employed software methodology and processes, and the business-related drivers. For several projects we were able to obtain the following raw scheduling information for each major project task: 1) planned start time, 2) planned end time, 3) actual start time, and 4) actual end time. The planned end time represents the task deadline or milestone. Each task may have its own deadline, or there may be a common deadline for several consecutive tasks. The granularity of the task schedules was typically from 1 to 4 weeks and involved from 1 to 3 software professionals. Examples of tasks are design-level reviews, design of a small component, unit test of a component, etc. (see Table 1). From this data a variety of information can be derived, such as planned task duration, actual task duration, early task starts, late task starts, and so on. It is important to understand that development schedules are often established by the market pressures, and that failure to meet a key deadline usually has strong negative consequences.
Metrics and Definitions. In the context of this paper we define productivity in terms of new and changed product lines of code (LOC), but with an understanding that the effort (or time) expended includes many non-coding activities that are necessary in developing a viable commercial product. We define average productivity of a software professional in LOC per person-month. A software team may consist of one or more software professionals, not all of which need to be engaged in software coding and testing activities. To focus on the calendar-time nature of the marketing windows and other business-related drivers, we will express software team productivity in terms of thousands of LOC (KLOC) per calendar month.
When modeling, we will assume that a software product is a commercially available software system that includes the packaged software, documentation, and support. The software product is thoroughly tested, and its quality certified prior to release. It can be developed using "classical" procedural4 methods, or object-oriented methods. A software product is referenced by version and release. We will refer to second and later versions or releases, as follow-on versions or releases. A software product schedule is the schedule that directs the executions and completion of a series of tasks from the initial planning stages, through the final product shipment. A task or activity is a unit of work that requires a finite amount of time to complete. Tasks can be viewed as individual segments of a project starting at the completion of the previous task, which we call individual tasks. The significant schedule dates are called milestones. In the context of the iterative process, we will distinguish project iterations as conglomerates of individual tasks.
The statistic that seems to best highlight the influence of the business-related drivers over software development tasks is the completion of tasks relative to a planned deadline. We call it task completion delay (see Figure 2). This value is determined from the difference between the planned end date and the actual end date for a given task. A negative value indicates that the task finished early, a zero value indicates the task was on schedule, and a positive value shows that the task was finished late. We use this delay variable to eliminate differences in the individual task start and completion dates so that we can compare the tasks as a population. 4 Procedural software development uses structured analysis, design and coding, or similar techniques, to develop and
implement a software product.

Potok and Vouk 8
DRAFT Potok & Vouk 8
Planned Start
Actual Start Planned End
Actual End
Task Completion Delay
Figure 2 Terminology associated with actual and planned software tasks.
Results. In this subsection we present results for three very different product types developed under the iterative process model described above, and under the same business model. The set includes a follow-on maintenance release of a product where the development team followed a procedural methodology producing 6 KLOCs of C code, a first generation product version (38 KLOC of C++) developed using object-oriented methods, and a second generation product version that was a port of a 64 KLOC of C++ code also developed using object-oriented methods (Figure 1). In addition to the variation in product sizes, the projects showed wide variation in the average team productivity5. The procedural project had the lowest team productivity, the team productivity rate for the first generation object-oriented project was two and a half times greater than that of the procedural project, while the ported object-oriented project had team productivity rate nearly ten times that of the first generation object-oriented project. Although we hope that at least some of the credit for these differences in productivity can be given to the object-oriented methodology, other factors can produce similar variability. It is worth noting that while software ports are expected to exhibit higher productivity [Vouk (1984)], it was surprising to see that, on the average, there was no significant difference between object-oriented and procedural software development productivity [Potok and Vouk (1995)]. Further analysis of task completion delays observed for the three projects above showed some interesting patterns.
In Figures 3, 4, and 5 we plot histograms of individual task completion delays for the three projects (rounded to the nearest week). While all three projects met the original planned shipping deadline, the distribution of task completion delays shows that a number of intermediate milestones have not been met. For example, the plot in Figure 3 shows the fraction of tasks with a given completion delay (in weeks) for the first version product developed using object-oriented methods. The distribution has a peak at zero, indicating that about 45% of the tasks required to develop this project finished on the deadline they were planned for (note that all tasks planned for the final shipping date are in this category). However, the remaining 55% of the tasks missed the deadline against which they were planned to various extents. For instance, the secondary peak around week five is due to a four to five week slip in several of the coding and driver build tasks, while the third peak at
5 Remember that team productivity is in terms of KLOC/calendar_month.

Potok and Vouk 9
DRAFT Potok & Vouk 9
week 12 was due to administrative delays in getting the design specification approval signatures.
Task Completion Distribution for 1st generation OO Product
0.00
0.05
0.10
0.15
0.20
0.25
0.30
0.35
0.40
0.45
-1 0 1 2 3 4 5 6 7 8 9 10 11 12 13
Task Delay in Weeks
Rel
ativ
e Fr
eque
ncy
Figure 3 Task completion delays for the first generation object-oriented project.
Task Completion Distribution for Second Generation OO Product
0.00
0.10
0.20
0.30
0.40
0.50
0.60
0.70
-3 -2 -1 0 1 2 3 4 5 6 7 8
Delay in Weeks
Rel
ativ
e Fr
eque
ncy

Potok and Vouk 10
DRAFT Potok & Vouk 10
Figure 4 Task completion delays for the second generation ported object-oriented project.
Task Completion Distribution for Procedural Product
0
0.05
0.1
0.15
0.2
0.25
0.3
0.35
-2 -1 0 1 2 3 4 5 6 7 8 9 10 11 12 13 14 15 16 17 18 19 20 21 22 23 24
Task Delays in Weeks
Rel
ativ
e Fr
eque
ncy
Figure 5 Milestone completion delays for the procedural project.
Figure 4 shows the completion delay distribution for the tasks in the ported object-oriented project (the project shown in Figure 1). This distribution shows that most of the tasks finished on schedule, over 60%. Again, all tasks scheduled for the final (aggregate) deadline were in this category. However, while this team had the highest productivity level of the three, only one task finished early.
Finally, Figure 5 shows the task completion delay distribution for the procedurally developed project. We again see that most of the tasks did complete on time. This includes all tasks scheduled for the final deadline. However, the fraction of on-time tasks was smaller than in other two projects, and there is a much larger range in the delay distribution. Some intermediate tasks were as many as 23 weeks late. This project was developed at a low productivity rate, which may account for the wider variance in the delay distribution than is seen in the higher productivity projects.
Although projects were quite different in nature, they show some interesting similarities:
1. In all three projects the most frequent value for the task completion delay was zero. About 35%-60% of the tasks finished on the date originally planned. This includes all tasks scheduled for the final, aggregate, project deadline. It is an indicator that a very strong mechanism for enforcement of the final deadline was in effect.
2. Apparently, it is uncommon to finish a task early. Only one project showed a task completing early.

Potok and Vouk 11
DRAFT Potok & Vouk 11
3. In all three cases, a small group of intermediate or low priority tasks was significantly late, from 7 to 23 weeks after the original deadline.
A brief review of previous results shows no apparent productivity difference between object-oriented and procedural projects. This contradicts other object-oriented productivity studies done in a non-commercial environment, leading to the question of the business influences over object-oriented development. The data shows a very strong economy of scale, so that as a project increases in size, the programmer and team productivity increase as well [Potok and Vouk (1996)]. This result, although not unique, counters most previous studies [Boehm (1981) and references within]. Further, there is no obvious explanation as to why this result has occurred. A review of detailed project data reveals that the actual project duration appears to be controlled by enforcement of the key milestones. Additionally, all of the projects finished on schedule, with most tasks within the projects finishing on schedule as well. Very few tasks finished early, and a small number of intermediate tasks finished late, but did not cause the overall project to finish late.
Reviewing these results in light of the business model described above provides what appears to be the only plausible explanation for the contradiction observed. The business model used to guide these projects provides strong discouragement to finishing key milestones late, i.e., monthly executive reviews. However, the same model does not provide strong incentives for early completion of intermediate milestone tasks. Indeed, examination of the significantly late tasks reveals that these tasks were not only of low priority, but they did not in any way gate the development of their product. Releases typically produce small amounts of code, while versions can be quite large. The size of the programming team is relatively constant, as is the development cycle. Key deadlines are strictly enforced, which leads to releases being comparatively overstaffed, with ample development time, and little incentive to complete early, while releases are comparatively understaffed, with short development time, and strong incentive to finish on-time. In simpler terms, teams working on product releases take all the time available to them to complete the project, often known as Parkinson’s Law. While teams working on versions are compelled to put forth extra effort to meet key deadlines, often called the Deadline Effect. This leads to the conjecture that the business model drives smaller releases to have low productivity, and larger versions to have higher productivity. Furthermore, it may be possible that the business model exerts influence over the productivity of object-oriented software development, and this influence may offset potential gains in the methodology.
Model To understand the business model effects on a new technology, such as object-orientation, we have developed a process simulation framework. We represent task durations as functions of team productivity over calendar time, and we incorporate the influence of business-related drivers by allowing for the Parkinson's Law and the Deadline Effect.
Assumptions. The assumptions we used to build the model are the following:
1. The organization is capable of meeting given deadlines. This means that the maturity of the organization is such that it has in place i) technological capabilities for developing required software within the defined schedule, ii) software process and risk

Potok and Vouk 12
DRAFT Potok & Vouk 12
management structures and mechanisms that are capable of ensuring with high probability that the deadlines are met [Paulk et al. (1993)].
2. The projects are driven by calendar schedules, and all changes in the project requirements, personnel, or milestones can be represented as changes in effective team productivity over a period of time.
3. When in effect, the Parkinson’s Law is assumed to affect all deadlines.
4. Project deadlines are enforced only at specified milestones. The most likely deadline to be enforced is the final deadline, however, any set of deadlines can be enforced.
Project Iterations. The granularity of our model is at the level of project iterations (collections of tasks that make a project iteration). Therefore, in addition to an individual iteration, we recognize aggregate iterations. The start of an aggregate iteration is conditioned on completion of the iterations that precede it. Representing the duration of a project iteration as a function of team productivity requires estimation of the effective size or complexity of a project iteration (e.g., in terms equivalent KLOC), and of the average team productivity over the iteration in the same units (e.g., in KLOC/(calendar development month). The duration of an iteration is then [Badiru (1995)]
Iteration Duration = Iteration Size
Team Productivity (1)
The relationship between iteration duration and size is linear if and only if team productivity is constant with size and time. Once an iteration completion time is determined, the duration of the overall project can be computed by adding the estimated durations of the iterations on the critical path(s) of the project, as is typically done with a PERT network. For the remainder of this discussion, we will assume that we operate on the critical path of the project.

Potok and Vouk 13
DRAFT Potok & Vouk 13
Planned Start
Actual Start
Planned End
Actual End6444444744444444
6444444447444444448Planned Duration, ti,plan
Actual Duration, ti,act
144424443
14444444444444442444444443
MinimumDuration, ti,min
Maximum Duration, ti,max
Metrics on Individual Iterations
14444444244444443Iteration Duration Range
8
Figure 6 The planned (shaded box) and actual (heavy line) iteration durations and the corresponding minimum and maximum iteration durations.
One of the characteristics of the schedules we analyzed is wide variance in the average team productivity. To incorporate this variance in the iteration duration estimates, we define the minimum and maximum team productivity and use this range to estimate the minimum and maximum iteration duration range (IDR). The minimum duration for an iteration can be achieved only if the programming team is working at their maximum productivity, this will almost certainly include code developed from overtime work. The maximum iteration duration is theoretically infinite, but in practice is usually limited by market forces, such as a fraction of an 18 month development cycle. Figures 6 illustrates the quantitative characteristics of an iteration.
Figure 6 shows the metrics we define for an individual iteration. Let the duration of an iteration be t. For each iteration i we define the actual iteration duration, which we denote by ti,act, the planned duration ti,plan, the maximum duration ti,max, and the minimum duration ti,min. If we assume that the size of the problem being solved in an iteration remains essentially constant during that iteration, then the minimum and maximum durations are functions of maximum and minimum team productivity, respectively, in that iteration. In practice, a new project iteration will not start before the previous iteration has completed. Hence, for each iteration we can also recognize the chain of events that lead to it, i.e., its aggregate duration, d, that includes durations of all the sequential iterations that precede it. The aggregate duration of iteration i is a function of the preceding sequence of iterations, di=Σti. For example, d1=t1, d2=t1+t2, etc. As with the individual tasks and iterations, there are four aggregate durations: actual, planned, maximum, and minimum.
The minimum and maximum duration times for an iteration define a range of possible completion times for that iteration. We represent the duration of iteration i with the random

Potok and Vouk 14
DRAFT Potok & Vouk 14
variable Ti . Ti can assume the values between the minimum duration time ti,min, and the maximum duration ti,max. Duration of a project with n iterations is a random variable D defined by
D=T1+ T2+...+Tn (2)
For example, adding the minimum iteration duration time from each iteration on the critical path, Σti,min, gives the minimum duration time for the overall project, dn,min. Adding the maximum task duration times, Σti,max, gives the maximum duration time for the project, dn,max.
To simulate the duration of a project whose iterations fall within the intervals [ti,min, ti,max], i=1,...,n, we take a sample from each interval according to the distribution assigned to that interval. This provides an estimate of the individual iteration duration times for the project. From this estimate, the aggregate durations can be determined, as well as the overall project duration time. We repeat this sampling until the required simulation accuracy is achieved. Note that, while in this approach we do no account for possible inter-iteration duration correlation, our experience is that in practice inter-iteration delay correlation is a low-order effect.
One could argue that a triangular or beta distribution may be a good starting representation for the iteration duration. However, there is no evidence that unconstrained iteration durations have a specific distribution, so we have opted for the more general uniform distribution. Note that introduction of business effects such as the Deadline and Parkinson’s Effect will require constrained samples of these intervals, and that the resulting conditional distributions are not uniform. We will now first quantify the Parkinson’s Law and the deadline enforcement, then we will apply these effects to the derived iteration and project duration distribution.
Parkinson’s Law. Cyril Parkinson published a collection of aphorisms about economics in 1957, the most remembered is that “work expands to fill the time, ” or as originally stated, “work expands so as to fill the time available for its completion” [Parkinson (1957)]. Gutierrez et al. have developed a stochastic model to represent the effects of Parkinson’s Law on a project [Gutierrez et al. (1991)]. One of the fundamental concepts they propose is that unconstrained activity modeling (such as that seen in PERT models) may be inappropriate to represent real projects, and that completion time should be a function of the time scheduled for a project. If we consider a project iteration as a single task, then the basis for their model can be expressed as
dn,act=Σti,act+w(dn,plan) (3)
where w(dn,plan) is the work expansion function, and dn,plan is the project deadline. Projects under Parkinson’s Law will generally not have an aggregate duration of less than the scheduled duration. That is, if d1,plan, d2,plan ,..., dn,plan are the scheduled durations for iteration aggregates, then, iteration 1 is planned to complete by time d1,plan, iterations 1 and 2 are planned to complete by time d2,plan, and so on. We model Parkinson’s Law by delaying the aggregate completion times that are less than the planned duration times. An aggregate duration that would normally be shorter than the planned deadline is expanded so that it meets the deadline, while an iteration that would normally finish after the deadline is not modified. Tasks under Parkinson’s Law either finish, or are expanded to finish, within the

Potok and Vouk 15
DRAFT Potok & Vouk 15
interval [di,plan-ε, di,max], where ε is a small time period, typically one or two weeks. The lower bound is defined by the planned aggregate iteration duration, while the upper bound is the actual maximum duration for the aggregate.
Deadline Effect. Boehm defines the Deadline Effect in the phrase “the amount of energy and effort to an activity is strongly accelerated as one approaches the deadline for completing the activity” [Boehm (1981)]. This effect on software is widely known, but surprisingly little studied. However, in industrial psychology this effect has been thoroughly described and studied through goal theory [Locke and Latham (1982)]. The goal theory supports both the Parkinson’s Law, performance is lower if goals are easy, and the Deadline Effect, performance is higher if the deadline is challenging. The Deadline Effect depends on enforcement of milestone (task/iteration) deadlines. We model this by discarding the cases for which any of the hard deadline aggregate tasks in the case finish after their deadline.
The combined effect of the Parkinson’s Law and the deadline enforcement over a set of possible iteration and project durations is described by the algorithm given below. When simulating software development, we generate a number of case samples (j = 1, ...k, e.g., k=100,000) each of which represents one complete set of project iterations (i = 1, .., n). Function HARD() returns true if the deadline is "hard", and false if it is "soft" (i.e., allows slippage).
For (j = 1, ..., k) do Acquire sample t1,act,...,tn,act for case j Calculate d1,act,...,dn,act Loop through all iterations (1, ..., n) If d
i,act < (di,plan -ε) then expand iteration duration to the deadline recompute current and all remaining d
i,act (i, ..,
n) EndIf EndLoop Loop through all d
i,plan (1, ..., n) If [HARD(d
i,plan) and d
i,act > di,plan ] then discard this case and exit loop EndIf EndLoop EndFor
This algorithm, which is equivalent to constrained discrete convolution of iteration completion times, provides a model for how iterations complete around a given milestone. The iteration durations are bound by upper and lower productivity ranges, and are under the influence of both Parkinson’s Law and deadline enforcement.
Maturity. It is worth noting, that the same simulation models allows us to examine the influence of the organizational software process maturity, and of the maturity of software development technology, by varying the iteration (task) productivity ranges (or IDRs). For

Potok and Vouk 16
DRAFT Potok & Vouk 16
example, with reference to Figure 6, we would expect that mature software process and technology would promote small productivity variance (i.e., smaller duration range), while poor process control or immature technology may result in a much wider range of productivities and consequently larger iteration (task) duration ranges. We now have the capability to evaluate the business model influence on the productivity of a software development methodology, such as object-orientation.
Simulation We first used the above simulation model to explore the impact of four business models on the productivity of two hypothetical projects. One project has a “normal” average productivity range in each iteration. The second project differs from the first one only in that the upper bound on its iteration productivity ranges is twice as large as the upper bound on the “normal” ranges. Both sets of ranges have the same lower bounds. This productivity rate gain is consistent with the gains that Lewis et al. and Melo et al. report in their non-commercial studies, as well as the common lower bound for each methodology [Lewis et al. (1991), Melo et al. (1995)]. The normal range set could be considered as procedural development, and the second range set could represent a development technology that has potential for greater average productivity, such as object-orientation. However, note that a larger range (i.e., it has higher productivity variance), implies less control over the development process and/or less mature methodology. We will sometimes refer to the high average productivity project as the “object-oriented project” and to the other one as the “procedural project”. When a business model is applied, both projects operate under the same milestones and constraints. When Parkinson’s Law is in effect, the iteration distribution range (IDR), see Figure 6, lower bound is no earlier than one week before the deadline. When the deadline enforcement is active on iteration i, its IDR upper bound is the same as the planned deadline (di,plan). These restrictions are consistent with our empirical data.
Both simulated projects had five equally sized iterations. The planned duration for each iteration is set to 10 weeks. This translates to planned deadlines at 10, 20, 30, 40 and 50 weeks, respectively. We also assume that an equivalent of 10 KLOC is developed during each iteration. We further assume that the development team productivity6 for the procedural project is from 500 LOC/week to 1250 LOC/week, while the range for the object-oriented project team is from 500 LOC/week to 2500 LOC/week. From equation (1) it follows that each procedural project iteration has duration range between 8 to 20 weeks, while the object-oriented project has IDRs from 4 to 20 weeks. Iteration duration times were sampled from these ranges assuming a uniform distribution.
6 It is also assumed that the average team size is around 10 software professionals.

Potok and Vouk 17
DRAFT Potok & Vouk 17
Comparison of Projects under Business Model A
0
0.1
0.2
0.3
0.4
0.5
0.6
0.7
0.8
0.9
1
22 25 28 31 34 37 40 43 46 49 52 55 58 61 64 67 70 73 76 79 82 85 88 91 94
Duration in Weeks
Cu
mu
lativ
e F
req
uen
cy
OO Project
Proc Project
500-1250 LOC/Week
500-2500 LOC/Week
Figure 7 Cumulative distributions for high and low productivity projects without milestone constraints.
Our first case, Model A, simulates the effect of a business practice that provide incentive to finish a project as soon as possible, with no penalty for finishing late. This represents the situation where the process can be viewed as being free from both the Deadline and the Parkinson’s Effects. The cumulative distributions for the duration of the projects under this model are shown in Figure 7. The mean completion time for an object-oriented project is 59.3 weeks, with a variance of 10.0 weeks, while the mean for the procedural project is 68.0 weeks, with a variance of 7.8 weeks. Further, only about 20% of the object-oriented samples finish at or before the week 50 milestone, and only about 1% of the procedural samples complete in this time frame. It is obvious that, for the type of project in question, the 50 week deadline is quite aggressive and exceeds the capability of either technology to reliably meet it. However, an object-oriented approach still has a better chance than the procedural project of making the 50 week milestone. On the other hand, if we assume that the final project deadline is 72 weeks, we see that the higher-productivity methodology has over 90% chance of meeting it. For comparison, the COCOMO [Boehm 1981] average for a 50 KLOC project is between 145 (organic) to 240 person-months (semidetached) with a completion time of 17 months (or about 68-70 weeks) .

Potok and Vouk 18
DRAFT Potok & Vouk 18
Comparision of Projects under Business Model B
0
0.1
0.2
0.3
0.4
0.5
0.6
0.7
0.8
0.9
1
49 51 53 55 57 59 61 63 65 67 69 71 73 75 77 79 81 83 85 87 89 91 93
Duration in Weeks
Cu
mu
lativ
e F
req
uen
cy
OO Project
Proc Project
Figure 8 Cumulative distributions for high and low productivity projects conducted under Parkinson’s Law
The second case, Model B, provides no incentive for finishing early, and no penalty for finishing late. This represents the situation where Parkinson’s effect is present for all milestones. Figure 8 shows the resulting project completion distribution. The mean completion time for the object-oriented project is now 61.8 weeks, two and a half weeks longer than under Model A, but with a smaller variance of 8 weeks. On the other hand, the procedural project results differ only slightly from the Model A case, with a mean of 68.3 weeks, and a variance of 7.5 weeks. Since under Model B assumptions there is no incentive to finish early, we would expect that any iterations that naturally complete early would be prolonged to complete on or near the deadline. This affects nearly 20% of object-oriented samples but only about 1% of the procedural samples. It is obvious that this lack of incentive to complete early, i.e., Parkinson’s effect, has greater impact in the case of the object-oriented project. Deadlines are often set so that the product can be favorably marketed, for example, product releases may be delayed so that they can be shipped with a new version of an operating system. These delays can limit or negate the potential productivity gain of a technology such as object-orientation, or any potentially high productivity technology is subject to this delaying effect.
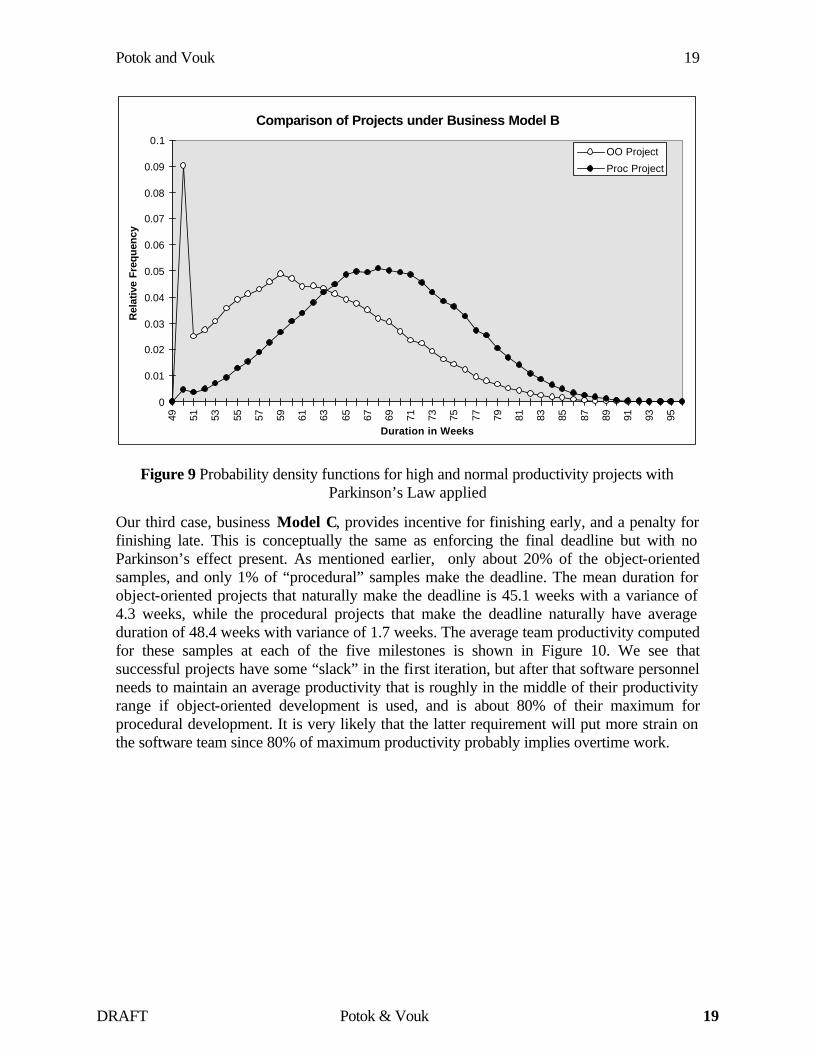
Under this business model, the average project duration and variance become more similar for the two methodologies and the potential for productivity gains from object-oriented development is less pronounced. This is illustrated further in Figure 9 which shows the corresponding estimated probability density functions. We see that the delay in the “early” completions translates into a relaxation spike at week 50, but we also see that this effect is more pronounced in the case of the potentially “more productive” methodology.
Potok and Vouk 19
DRAFT Potok & Vouk 19
Comparison of Projects under Business Model B
0
0.01
0.02
0.03
0.04
0.05
0.06
0.07
0.08
0.09
0.1
49 51 53 55 57 59 61 63 65 67 69 71 73 75 77 79 81 83 85 87 89 91 93 95
Duration in Weeks
Rel
ativ
e Fr
eque
ncy
OO Project
Proc Project
Figure 9 Probability density functions for high and normal productivity projects with Parkinson’s Law applied
Our third case, business Model C, provides incentive for finishing early, and a penalty for finishing late. This is conceptually the same as enforcing the final deadline but with no Parkinson’s effect present. As mentioned earlier, only about 20% of the object-oriented samples, and only 1% of “procedural” samples make the deadline. The mean duration for object-oriented projects that naturally make the deadline is 45.1 weeks with a variance of 4.3 weeks, while the procedural projects that make the deadline naturally have average duration of 48.4 weeks with variance of 1.7 weeks. The average team productivity computed for these samples at each of the five milestones is shown in Figure 10. We see that successful projects have some “slack” in the first iteration, but after that software personnel needs to maintain an average productivity that is roughly in the middle of their productivity range if object-oriented development is used, and is about 80% of their maximum for procedural development. It is very likely that the latter requirement will put more strain on the software team since 80% of maximum productivity probably implies overtime work.

Potok and Vouk 20
DRAFT Potok & Vouk 20
Average Team Productivity Under Model C
800
850
900
950
1000
1050
1100
1150
1200
Iteration 1 Iteration 2 Iteration 3 Iteration 4 Iteration 5
Ave
rage
Pro
duct
ivity
OO Project
Proc Project
Figure 10 Average team productivity required to complete the project by week 50 deadline.
In practice, it is unlikely that either of the three model situations above will occur in pure form. For example, it is unrealistic to assume there is no penalty for late completion, and it is probably equally unrealistic to assume that incentives to finish early are 100% effective. A great deal of planning and effort is required to ship a product, and changing the ship date late in the cycle is costly whatever the reason and direction. Based on the work flows analyzed in this study, a more realistic business situation, Model D, is one where there is little or no incentive to finish earlier than planned, and a penalty for finishing late. Conceptually, this is the same as adding both the Parkinson’s Law and the deadline enforcement to a project.

Potok and Vouk 21
DRAFT Potok & Vouk 21
Average Team Productivity Under Model D
800
850
900
950
1000
1050
1100
1150
1200
Iteration 1 Iteration 2 Iteration 3 Iteration 4 Iteration 5
Ave
rage
Pro
duct
ivity
OO Project
Proc Project
Figure 11 The team productivity per task for both projects
In Figure 11 we show the average team productivity needed around the five modeled milestones assuming that all five operate under Parkinson’s Law and that only the final project deadline (d5,plan) is enforced. We see that the average productivity must increase as we approach the final deadline in order for a project to meet this deadline. It is a clear indication that successful projects that operate under a combination of Parkinson's Law and an aggressive schedule experience the Deadline Effect, an increase in the development effort close to a “hard” milestone [Boehm 1981]. There is another interesting feature that we see in Figure 11. A successful object-oriented project allows the teams more slack (lower productivity) in the early project stages which means that they can operate in a more relaxed fashion than procedural teams. In a schedule this is manifest in missing early deadlines, under the expectation that the final deadline is not in jeopardy. Not surprisingly, we see that the higher productivity project has a higher productivity gain past the second milestone. Relating this to the observed data one could argue that the team that developed the project shown in Figure 4 (the project with the highest productivity rate) was operating near their capacity. A team that performed at a lower productivity would either has to further narrow the distribution variance, or they would not be able to complete the project on schedule. On the other hand, if the team that developed the lowest productivity project, shown in Figure 5, had a greater productivity potential, then the variance in the delay distribution could be even broader than the one shown.

Potok and Vouk 22
DRAFT Potok & Vouk 22
Comparison of Iteration Duration Distribution under Model D
0
0.1
0.2
0.3
0.4
0.5
0.6
0.7
0.8
0.9
19 11 13 15 17 19 21 23 25 27 29 31 33 35 37 39 41 43 45 47 49 51
Duration in Weeks
Rel
ativ
e Fr
eque
ncy
OO Project
Proc Project
Figure 12 The marginal distribution of successful projects around the individual task deadlines under both the Parkinson’s and Deadline Effects.
Another interesting view of the Model D is provided in Figure 12. It shows the iteration duration probability density distributions around the milestones for all project samples that meet the final deadline. The planned duration for each iteration is 10 weeks, so the deadline for iteration 1 is 10 weeks, for iteration 2 is 20 weeks, and so on, with the planned iteration 5 finish at 50 weeks. At the start of each iteration we see the Parkinson relaxation spike. The shape of the curves shown in Figure 12 is similar to the shapes observed empirically, Figures 3 through 5.
While both the procedural and the object-oriented projects finish at the same time, and with the same overall average productivity with respect to the calendar time, the business processes appears to cause a reduction in variance around the deadlines as the projects progress. That is, the hard deadline at the end of iteration 5 forces earlier completions in the iterations closer to the final deadline, and, in this way, it acts as a variance reduction mechanism. This is interesting, since, in an unconstrained development process, convolution of iteration completion times would result in a increasing, rather than decreasing duration variance [Elmaghraby et al. (1995)]. Furthermore, the lower productivity project (filled circles) requires this better process control (lower variance around the intermediate deadlines) in order to make the final one, while the higher productivity project (hollow circles) can have a wider variance (it can slip many of the intermediate milestones) and still make the final deadline.

Potok and Vouk 23
DRAFT Potok & Vouk 23
Maturity and Process Control. So far we have assumed that the two modeled projects have the same lower bound on iteration productivity. This means that the worst case scenario in both methodologies produces projects of the same duration. It could be argued that a mature technology may have a productivity range with less variance than a new technology, even if the new technology has the potential for higher productivity. Similarly, an organization may have better control over projects that use a "classical" methodology, than it may have over those that use a new technology. This may translate into a narrower iteration duration range in situation where one deals with better controlled, mature processes We illustrate the impact of narrower IDRs in Figure 13.
Comparison of Projects under Differing Capabilities
0
0.1
0.2
0.3
0.4
0.5
0.6
0.7
0.8
0.9
1
22 25 28 31 34 37 40 43 46 49 52 55 58 61 64 67 70 73 76 79 82 85 88 91 94
Duration in Weeks
Cu
mu
lativ
e F
req
uen
cy
OO Project
Proc Project
500-2500 LOC/Week
900-1250 LOC/Week
Figure 13 A comparison of duration for two projects with differing productivity capabilities.
In Figure 13 we show the unconstrained cumulative distribution (business Model A) for projects that have average team productivity of 1075 LOC/week (filled circles) and 1500 LOC/week (hollow circles) respectively. However, the lower average productivity project has a productivity range between 900 LOC/week and 1250 LOC/week, while the higher average productivity project range is between 500 LOC/week and 2500 LOC/week. Comparison with Figure 7 shows a striking difference. With the increased control over the process (reduced IDRs) 90% of the procedural (1075 LOC/week) projects are now capable of making the 50 week deadline, a far higher percentage than is seen with the object-oriented approach, even though the latter has potential for twice the productivity of the procedural project.

Potok and Vouk 24
DRAFT Potok & Vouk 24
It is obvious that control over the software process can play an even more important role than potential productivity gains from new technology. While business imposed incentives and deadlines can have an important impact on the perceived team productivity and on the probability that a project finishes on time, it may be even more important to select the methodology and the development approach that an organization has good control over and that yields acceptable productivity with as narrow an IDRs as possible. Doing so may increase the probability of project completion by a given deadline, even when the deadline is aggressively set by market forces.
Next, the model is used to simulate both the methodology and process improvement effects. Figure 14 shows modest improvement in the software development process compared to similar improvements in the productivity that may be seen by using the object-oriented methodology.
Comparison of Process and Methodology Improvements
0%
10%
20%
30%
40%
50%
60%
70%
80%
90%
100%
22 27 32 37 42 47 52 57 62 67 72 77 82 87 92
Durations in Weeks
Cu
mu
lati
ve F
req
uen
cy
10% Procedural
30% Procedural
OO Base
20% OO
Figure 14 A comparison of duration for two projects with differing process maturity, and methodology.
Looking at the duration of projects that have roughly an 80% chance of success shows that both the object-oriented project, and a 10% improvement in the lower bound productivity of the procedural project, results in approximately a 67 week development cycle. In other words, to have an 80% chance of a project successfully complete within 67 weeks, there are two options: either double high-end productivity; or increased low-end productivity by 10%. The other distributions on the graph, “30% Procedural,” and “20% OO,” show a similar result, with an 80% chance of project success at roughly 54 weeks. In both of these

Potok and Vouk 25
DRAFT Potok & Vouk 25
projects the low-end productivity is increased. For the object-oriented project, the low-end productivity is increased by 20%, while the low-end for the procedural project is increased 30%. Again, this illustrates the power of improving the software development process.
It is also interesting to note the effects when combining both process improvements, and potential gains in productivity. The base object-oriented project, solid circles, has a small probability of finishing significantly before the procedural projects, between 23-38 weeks. With the 20% improvement in the object-oriented project, a 47 week deadline has a 50% chance of success, as compared with only a 10% chance with the procedural project under a 30% improvement in low-end productivity. Improvements in the development process appear to reduce the overall project duration variance, while productivity improvements tend to shift the project duration distribution to earlier completion times. Combining these two effects can produce a very desirable project duration distribution that is shifted to shorter development cycles, with relatively small variances. However, as was seen in the simulations above, the business model influences can easily counteract the benefits that may be seen from these results.
Conclusions As market pressures shorten software development cycles, increasing emphasis is being placed on improving software development productivity. Object-oriented software development has emerged as a potential solution, i.e., as technology with great potential for reducing product time to market. While this may be true in cases where high levels of design and code reuse are present (which can be achieved without object-orientation as well), there is little evidence that this occurs in the first few product generations, at least not for commercial projects operating under a common business model.
In this paper we reported on empirical and simulation-based studies of the relationship between common commercial business practices, and the software productivity that might be expected in such an environment. Our data indicate that object-oriented projects suffer from Parkinson’s Law delays, and from the Deadline Effect, in much the same way that “procedural” projects do. Both effects tend to be the product of the applied business model. For example, a rigorous enforcement of final project deadlines, coupled with a lack of incentive to finish intermediate project tasks early may trigger Parkinson's Law delays and negatively influence productivity. This effect may become especially evident when projects are developed using potentially higher productivity methods, such as object-orientation, but operate under business models and deadlines that are more suited for classical, methodologies.
Using simulation, we have shown that, while a methodology which has a potential for higher productivity may enable software development teams to operate in a less stressful mode, the promise of high productivity alone is not enough. An organization must be able to control the range of productivities in which its development teams operate. A wider range implies less control over the process, and a lowered ability to guarantee timely project completion. The decision to use a new technology should be based not on its promised maximum, or even average, productivity but on the organizational ability to control it. If the business model cannot adjust to new technology, by recognizing a) its limitations, b) the ability of the

Potok and Vouk 26
DRAFT Potok & Vouk 26
organization to control it, and c) by adjusting its deadlines to take advantage of the methodology potentials, it is unlikely that an investment in the technology will result in real productivity benefits.
Acknowledgments We would like to thank Al Zollar, Dan Blum, and the IBM Software Solutions Laboratory - RTP for their strong support of this research, and Paritosh Dikshit of NCSU for his assistance with the statistical analyses. Work was supported in part by IBM Canada (CAS, Toronto), by IBM RTP, by the IBM SUR program, and by NCSU Center for Advanced Computing and Communications.
References 1. I. Jacobson, M. Ericsson, and A. Jacobson, The Object Advantage: Business Process
Reengineering with Object Technology, Addison-Wesley, Wokingham, England (1994).
2. J. A. Lewis, S. M. Henry, and D. G. Kafura, “An empirical Study of the Object-Oriented Paradigm and Software Reuse,” Proceedings of the Conference on Object-oriented Programming Systems, Languages and Applications, 184-196 (1991).
3. W. L. Melo, L. C. Briand, and V. R. Basili, “Measuring the Impact of Reuse on Quality and Productivity in Object-Oriented Systems,” Technical Report, University of Maryland, Department Of Computer Science, CS-TR-3395 (January 1995).
4. B. Henderson-Sellers, "The Economics of reusing Library Classes," Journal of Object Oriented Programming, 6, No. 4, 43-50 (1993).
5. D. Schimsky, "Software Reuse Some Realities," Vitro Technical Journal, 10, No. 1, 47-57 (1992).
6. D. A. Boehm-Davis and L. S. Ross, “Program Design Methodologies and the Software Development Process,” International Journal of Man Machine Studies 36, No. 1, 1-19 (1992).
7. H. Zweben, S. H. Edwards, B. W. Weide, and J. E. Hollingsworth, “The Effects of Layering and Encapsulation on Software Development Cost and Quality,” IEEE Transactions on Software Engineering, 21, No. 3, 200-208 (1995).
8. G. Booch, Object-Oriented Design with Applications, The Benjamin/Cummings Publishing Company, Inc., Redwood Ciy, CA. (1991).
9. D. deChampeaux, D. Lea, and P. Fauve, Object-oriented System Development, Addison-Wesley Publishing Company, Reading, Mass. (1993).
10. J. Rumbaugh, M. Blaha, W. Premerlani, F. Eddy, and W. Lorensen, Object-oriented Modeling and Design, Prentice Hall International, Englewook Cliffs, NJ, (1991).

Potok and Vouk 27
DRAFT Potok & Vouk 27
11. R. Wirfs-Brock, B. Wilkerson, and L. Wiener, Designing Object-oriented Software, Prentice-Hall International, Englewook Cliffs, NJ, (1990).
12. D. Coleman, P. Arnold, S. Bodoff, C. Dollin, H. Gilchrist, F. Hayes, and P. Jeremaes, Object-oriented Development The fusion Method, Prentice Hall, Englewook Cliffs, NJ, (1994).
13. F. Hayes and D. Coleman, “Coherent Models for Object-Oriented Analysis,” Proceedings of the Conference on Object-oriented Programming Systems, Languages and Applications, 171-183 (1991).
14. D. E. Monarchi and G. I. Puhr, “A Research Typology for Object-Oriented Analysis and Design,” Communication of the ACM 35, No. 9, 35-47 (1992).
15. B. Henderson-Sellers and J. M. Edwards, BOOKTWO of Object-Oriented Knowledge: The Working Object, Prentice Hall, Sydney (1994).
16. L. Berlin, “When Objects Collide: Experiences with Reusing Multiple Class Hierarchies,” Proceedings of the Conference on Object-oriented Programming Systems, Languages and Applications, 181-193 (1990).
17. M. F. Dunn and J. C. Knight, “Software Reuse in an Industrial Setting: A Case Study,” Thirteenth Intenational Conference on Software Engineering, (1991).
18. E. H. Gamma, R. Johnson, and J. Vlissides, “Design Patterns: Abstraction and Reuse of Object Oriented Design,” Proceedings of the Seventh European Conference on Object Oriented Programming, (1993).
19. M. L. Griss, S. S. Adams, B. Howard, B. J. Cox, A. Goldberg, “The Economics of Software Reuse (Panel),” Proceedings of the Conference on Object-oriented Programming Systems, Languages and Applications, (1991).
20. B. Henderson-Sellers, “The Economics of Reusing Library Classes,” Journal of Object-Oriented Programming, 6, No. 4, 43-50 (1993).
21. W. Wessale, D. Reifer, D. Weller, “Large Project Experiences With Object Oriented Methods and Reuse,” J. Systems Software, 23, No. 2, 151-161 (November, 1993).
22. G. A. Hansen, “Simulating Software Development Processes,” IEEE Computer, 29, No.1, 73-77 (1996).
23. T. E. Potok and M. A. Vouk, “Productivity of Object-Oriented Software Development,” NCSU Techincal Report, (1996).
24. C. N. Parkinson, Parkinson’s Law and Other Studies in Administration, Houghton Mifflin Company, Boston (1957).
25. G. J. Gutierrez and P. Kouvelis, “Parkinson’s Law and its Implications for Project Management,” Management Science 37, No. 8, 990-1001 (August 1991).
26. B. W. Boehm, Software Engineering Economics, Prentice-Hall, Inc. Englewook Cliffs, NJ (1981).

Potok and Vouk 28
DRAFT Potok & Vouk 28
27. D. S. Borger and M. A. Vouk, “Modeling the Behaviour of Large Software Projects,” Center for Communications and Signal Processing Technical Report, TR-91/19, NCSU (1991).
28. E. A. Locke and G. P. Latham, A Theory of Goal Setting and Task Performance, Prentice Hall, Englewood Cliffs, NJ (1990).
29. G. P. Latham and H. A. Marshall, “The Effects of Self-set, Participatively Set and Assigned Goals on the Performance of Government Employees,” Personnel Psychology 35, 399-404 (1982).
30. R. E. Fairley, Software Engineering Concepts, McGraw-Hill Books Company, New York, NY (1985).
31. T. E. Potok and M. A. Vouk, “Development Productivity for Commercial Software Using Object-Oriented Methods,” Proceedings of CASCON’95, (1995).
32. M. A. Vouk, "On the cost of mixed language programming," ACM SIGPLAN Notices, 19 No. 12, 54-60, (1984).
33. M. C. Paulk, B. Curtis, M. B. Chrissis, and C. V. Weber, “Capability Maturity Model, Version 1.1,” IEEE Software, 18-27 (1993)
34. A. B. Badiru and P. S. Pulat, Comprehensive Project Management: Integrating Optimization Models, Management Principles, and Computers, Prentice-Hall, Inc. Englewook Cliffs, NJ (1995).

Potok and Vouk 29
DRAFT Potok & Vouk 29
Tom Potok IBM Software Solution Division, Research Triangle Park, North Carolina 27709 (electronic Mail: [email protected]). Dr. Potok is an advisory programmer at the Software Solutions Laboratory of IBM in Research Triangle Park, North Carolina. He is currently the technical liaison between IBM and Lotus. He has successfully led the Software Solutions RTP lab in achieving ISO 9000 certification. Prior to this, he led a team in creating an object-oriented data model designed to work with CASE tools to improve application development and quality. He has led, and been a member of various other software development efforts. He has a BS in Computer Science, MS in Computer Engineering, and Ph.D. in Computer Engineering all from North Carolina State University. He has authored 11 publications, and has filed 2 patents.
Mladen A. Vouk Computer Science Department, North Carolina State University, Raleigh, NC, (electronic Mail: [email protected]). Dr. Vouk received B.Sc. and Ph.D. degrees from the University of London (UK). He has extensive experience in both commercial software production, and academic computing environments. He is the author, or co-author, of over 100 publications. He is currently an Associate Professor of Computer Science at North Carolina State University. His research and development interests include: software process and risk management, software testing and reliability, issues related to development of large numerical and scientific software-based systems, coding theory and computer-based education. He teaches courses in software engineering, software testing and reliability, software process and risk management and communication networking. Dr. Vouk is the chairman of the IFIP Working Group 2.5 on Numerical Software. He is also a senior member of IEEE, and a member of IEEE Reliability, Communications and Computer Societies, and of IEEE TC on Software Engineering, ACM, ASQC, and Sigma Xi. He is an associate editor of IEEE Transactions on Reliability.