
Volume 3 – Coastal Management
519
GOVERNMENT OF MALAYSIA DEPARTMENT OF IRRIGATION AND DRAINAGE Jabatan Pengairan dan Saliran Malaysia Jalan Sultan Salahuddin 50626 KUALA LUMPUR Volume 3 – Coastal Management
Transcript of Volume 3 – Coastal Management

GOVERNMENT OF MALAYSIA
DEPARTMENT OF IRRIGATION
AND DRAINAGE
Jabatan Pengairan dan Saliran Malaysia Jalan Sultan Salahuddin 50626 KUALA LUMPUR
Volume 3 – Coastal Management

DID MANUAL Volume 3
___________________________________________________________________________________________
___________________________________________________________________________________________ March 2009
i
Disclaimer
Every effort and care has been taken in selecting methods and recommendations that are appropriate to Malaysian conditions. Notwithstanding these efforts, no warranty or guarantee,
express, implied or statutory is made as to the accuracy, reliability, suitability or results of the
methods or recommendations.
The use of this Manual requires professional interpretation and judgment. Appropriate design procedures and assessment must be applied, to suit the particular circumstances under
consideration.
The government shall have no liability or responsibility to the user or any other person or entity with
respect to any liability, loss or damage caused or alleged to be caused, directly or indirectly, by the adoption and use of the methods and recommendations of this Manual, including but not limited to,
any interruption of service, loss of business or anticipatory profits, or consequential damages resulting from the use of this Manual.

DID MANUAL Volume 3
___________________________________________________________________________________________
___________________________________________________________________________________________ March 2009
ii
Foreword
The first edition of the Manual was published in 1960 and was actually based on the experiences and knowledge of DID engineers in planning, design, construction, operations and maintenance of
large volume water management systems for irrigation, drainage, floods and river conservancy. The
manual became invaluable references for both practising as well as officers newly posted to an unfamiliar engineering environment.
Over these years the role and experience of the DID has expanded beyond an agriculture-based
environment to cover urbanisation needs but the principle role of being the country’s leading expert
in large volume water management remains. The challenges are also wider covering issues of environment and its sustainability. Recognising this, the Department decided that it is timely for the
DID Manual be reviewed and updated. Continuing the spirit of our predecessors, this Manual is not only about the fundamentals of related engineering knowledge but also based on the concept of
sharing experience and knowledge of practising engineers. This new version now includes the latest standards and practices, technologies, best engineering practices that are applicable and useful for
the country.
This Manual consists of eleven separate volumes covering Flood Management; River Management;
Coastal Management; Hydrology and Water Resources; Irrigation and Agricultural Drainage; Geotechnical, Site Investigation and Engineering Survey; Engineering Modelling; Mechanical and
Electrical Services; Dam Safety, Inspections and Monitoring; Contract Administration; and
Construction Management. Within each Volume is a wide range of related topics including topics on future concerns that should put on record our care for the future generations.
This DID Manual is developed through contributions from nearly 200 professionals from the
Government as well as private sectors who are very experienced and experts in their respective
fields. It has not been an easy exercise and the success in publishing this is the results of hard work and tenacity of all those involved. The Manual has been written to serve as a source of
information and to provide guidance and reference pertaining to the latest information, knowledge and best practices for DID engineers and personnel. The Manual would enable new DID engineers
and personnel to have a jump-start in carrying out their duties. This is one of the many initiatives undertaken by DID to improve its delivery system and to achieve the mission of the Department in
providing an efficient and effective service. This Manual will also be useful reference for non-DID
Engineers, other non-engineering professionals, Contractors, Consultants, the Academia, Developers and students involved and interested in water-related development and management. Just as it
was before, this DID Manual is, in a way, a record of the history of engineering knowledge and development in the water and water resources engineering applications in Malaysia.
There are just too many to name and congratulate individually, all those involved in preparing this Manual. Most of them are my fellow professionals and well-respected within the profession. I wish
to record my sincere thanks and appreciation to all of them and I am confident that their contributions will be truly appreciated by the readers for many years to come.
Dato’ Ir. Hj. Ahmad Husaini bin Sulaiman,
Director General, Department of Irrigation and Drainage Malaysia.

DID MANUAL Volume 3
__________________________________________________________________________________________
__________________________________________________________________________________________ March 2009 iii
Acknowlegements
Steering Committee:
Dato’ Ir. Hj. Ahmad Husaini bin Sulaiman, Dato’ Nordin bin Hamdan, Dato’ Ir. K. J. Abraham, Dato’
Ong Siew Heng, Dato’ Ir. Lim Chow Hock, Ir. Lee Loke Chong, Tuan Hj. Abu Bakar bin Mohd Yusof, Ir. Zainor Rahim bin Ibrahim, En. Leong Tak Meng, En. Ziauddin bin Abdul Latiff, Pn. Hjh. Wardiah
bte Abd. Muttalib, En. Wahid Anuar bin Ahmad, Tuan Hj. Zulkefli bin Hassan, Ir. Dr. Hj. Mohd. Nor bin Hj. Mohd. Desa, En. Low Koon Seng, En. Wan Marhafidz Shah bin Wan Mohd. Omar, Sr. Md
Fauzi bin Md Rejab, En. Khairuddin bin Mat Yunus, Cik Khairiah bt Ahmad.
Coordination Committee:
Dato’ Nordin bin Hamdan, Dato’ Ir. Hj. Ahmad Fuad bin Embi, Dato’ Ong Siew Heng, Ir. Lee Loke Chong, Tuan Hj. Abu Bakar bin Mohd Yusof, Ir. Zainor Rahim bin Ibrahim, Ir. Cho Weng Keong, En.
Leong Tak Meng, Dr. Mohamed Roseli Zainal Abidin, En. Zainal Akamar bin Harun, Pn. Norazia
Ibrahim, Ir. Mohd. Zaki, En. Sazali Osman, Pn. Rosnelawati Hj. Ismail, En. Ng Kim Hoy, Ir. Lim See Tian, Sr. Mohd. Fauzi bin Rejab, Ir. Hj. Daud Mohd Lep, Hj. Muhamad Khosim Ikhsan, En. Roslan
Ahmad, En. Tan Teow Soon, Tuan Hj. Ahmad Darus, En. Adnan Othman, Ir. Hapida Ghazali, En. Sukemi Hj. Sidek, Pn. Hjh. Fadzilah Abdul Samad, Pn. Hjh. Salmah Mohd. Som, Ir. Sahak Che
Abdullah, Pn. Sofiah bt Mat, En. Mohd. Shafawi Alwi, En. Ooi Soon Lee, En. Muhammad Khairudin
Khalil, Tuan Hj. Azmi Md Jafri, En. Zainal Akamar bin Harun, Ir. Nor Hisham Ghazali, En. Gunasegaran M., En. Rajaselvam G., Cik Nur Hareza Redzuan, Ir. Chia Chong Wing, Pn. Norlida
Mohd. Dom, Ir. Lee Bea Leang, Dr. Hj. Md. Nasir Md. Noh, Pn. Paridah Anum Tahir, Pn. Nurazlina Mohd Zaid, PWM Associates Sdn. Bhd., Institut Penyelidikan Hidraulik Kebangsaan Malaysia
(NAHRIM), RPM Engineers Sdn. Bhd., J.U.B.M. Sdn. Bhd.
Working Group :
En. Ziauddin Abdul Latif, Tuan Hj Shahimi Sharif, En. Zainal Akamar b Harun, En. Azmi Ibrahim, En. Mohd Sor Othman, Pn. Siti Aishah Hashim, Pn. Rosita Salam, Ir. Ahmad Sharmy Mohd Jaafar, Cik
Isalamiah Deni, Pn. Salfarina Mohd Sharif, En. Mahran Mahmud, Pn. Rosnizawati Roslan, En. Abdul
Razak Hassan, En. Ahmad Norfaizal Mohd Jusoh, Pn. Farah Syazana bt Che Noh, Pn. Nordiyana Lee bte Abdullah, En. Idrus Ahmad, Hj. Raja Roslan b Raja Bahrin Shah, Pn. Fairus Ahmad, Ir. Sahak b
Che Abdullah, En. Mat Supri b Kasa, En. Husin b Harun, Pn. Rosnelawati bt Hj Ismail, Tuan Hj. Abu Bakar b Othman, En. Junadi Apandi Jemain, En. Mat Puaat b Mat Husain, Ir. Nasser Salim, En. Miklin
Ationg, Tuan Hj. Mohd Hussin bin Hj. Modzni, En. Mohd Kamal Mustafa, En. Faizul Abdul Wahab, En.
Ahmad Solihin Budarto, Pn. Shamsiah bt Omar, En. Ahmad Shahrir bin Md. Naziri, Pn. Marenawati Abdul Malik, Mr. Saw Hin Seang, Mr. Karsten Mangor, Ir. Woo Heng Kee, Ir. Mohd Akhir b Othman,
Ir. Md Kamal Kassim, Dr. Claus Pederson, Dr. Jacob Hjelmager Jensen, Mr. Henry Kofoed Hansen,
Prof. Hadibah Ismail, Ir. Lee Hin Lee, Ms. Chan Hooi San, En. Kassim Muhammad, En. Hj Ahmad
Jamaluddin, Pn. Nor Aslinda Awang, En. Mohd Fauzi Mohamed, Pn. Suriyani Awang, Pn. Suraya Woon bte Abdullah, Pn. Pang Teng Kean.

DID MANUAL Volume 3
___________________________________________________________________________________________
___________________________________________________________________________________________
March 2009 iv
Registration of Amendments
Amend
No
Page No Date of Amendment Amend
No
Page No Date of Amendment

DID MANUAL Volume 3
__________________________________________________________________________________________
_________________________________________________________________________________________ March 2009
v
Table of Contents
Disclaimer .................................................................................................................................. i
Foreword ...................................................................................................................................ii
Acknowledgements....................................................................................................................iii
Registration of Amendments ......................................................................................................iv
Table of Contents ...................................................................................................................... v
List of Volumes..........................................................................................................................vi
List of Symbols.........................................................................................................................vii
List of Abbreviations ................................................................................................................ viii
List of Glossary.......................................................................................................................... x
Chapter 1 Introduction
Chapter 2 Fundamentals of Coastal Hydraulics and Environment
Chapter 3 Coastal Erosion Control Measures
Chapter 4 Rivermouth/ Tidal Inlet Management and Planning Guidelines
Chapter 5 Malaysian Coastal Inventory
Chapter 6 Hydraulic Study Methodology in Coastal Engineering
Chapter 7 Hydraulic Design in Coastal Engineering
Chapter 8 Tidal-Wave Inundation and Coastal Drainage
Chapter 9 Management of the Coastal Zone
Chapter 10 Legal and Institutional Aspects
Chapter 11 Shoreline Monitoring and Maintenance
Chapter 12 Future Outlooks
DID MANUAL Volume 3
__________________________________________________________________________________________
_________________________________________________________________________________________
March 2009 vi
List of Volumes
Volume 1 FLOOD MANAGEMENT
Volume 2 RIVER MANAGEMENT
Volume 3 COASTAL MANAGEMENT
Volume 4 HYDROLOGY AND WATER RESOURCES
Volume 5 IRRIGATION AND AGRICULTURAL DRAINAGE
Volume 6 GEOTECHNICAL MANUAL, SITE INVESTIGATION AND ENGINEERING SURVEY
Volume 7 ENGINEERING MODELLING
Volume 8 MECHANICAL AND ELECTRICAL SERVICES
Volume 9 DAM SAFETY, INSPECTIONS AND MONITORING
Volume 10 CONTRACT ADMINISTRATION
Volume 11 CONSTRUCTION MANAGEMENT

DID MANUAL Volume 3
___________________________________________________________________________________________
___________________________________________________________________________________________
March 2009 vii
List of Symbols
α Angle Of Incidence
ρ Density of Water
dl Closure Depth C Wave Celerity
F Froude Number
H Wave Height HS Mean Low Water-Level
12 h/y Nearshore Significant Wave Height Exceeded 12 Hours Per Year L Wave Length
R Wave Runup T Wave Period
Ts Significant Wave Period

DID MANUAL Volume 3
___________________________________________________________________________________________
___________________________________________________________________________________________
viii March 2009
List of Abbreviations
ACD Admiralty Chart Datum
ADCP Acoustic Doppler Current Profilers
AIZ Aquaculture Industrial Zones BOD Biological Oxygen Demand
CED Coastal Engineering Division CEM Coastal Engineering Manual (by US Army Corps of Engineers)
COD Chemical Oxygen Demand
CTD Conductivity, Temperature, Depth (measurements) DGPS Differential Global Positioning System
DID Department of Irrigation and Drainage (JPS – Jabatan Pengairan dan Saliran)
DIVA Dynamic Interactive Vulnerability Assessment DLM Department of Land and Mines (PTG – Pejabat Tanah dan Galian) DO District Office
DOE Department of Environment DSS Decision Support System
DTCP Department of Town and Country Planning (JPBD - Jabatan Perancang Bandar dan Desa)
DTM Digital Terrain Models
DVS Department of Veterinary Services DWNP Department of Wildlife and National Parks
EEZ Exclusive Economic Zone EIA Environmental Impact Assessment
EPU Economic Planning Unit (Prime Minister’s Department)
EQA Environment Quality Act EXCO State Executive Council/ Committee
FDM Finite Difference Method FEM Finite Element Method
GIS Geographical Information System GPS Global Positioning System
HAT Highest Astronomical Tide
IAPH International Association of Ports and Harbours ICU Implementation Coordination Unit, Prime Minister’s Department
ICZM Integrated Coastal Zone Management IDMS Integrated Database and Modelling System
INWQS Interim National Water Quality Standards for Malaysia
IPCC Intergovernmental Panel on Climate Change IRBM Integrated River Basin Management
ISM Integrated Shoreline Mangement ISMP Integrated Shoreline Management Plan
JAS Jabatan Alam Sekitar (DOE – Department of Environment) JICA Japan International Cooperation Agency
JKKK Jawatan Kuasa Keselamatan Kampung (Committee of Village Security)
JPBD Jabatan Perancang Bandar dan Desa (Department of Town and Country Planning)
JPS Jabatan Pengairan dan Saliran (DID – Department of Irrigation and Drainage)
JUPEM Jabatan Ukur Pemetaan Semenanjung Malaysia (Department of Survey
and Mapping) LA Local Authority
LAT Lowest Astronomical Tide LEO Littoral Environment Observation
LIDAR Light Detection and Ranging (Laser-based surveying and mapping) LSD Land Survey Datum

DID MANUAL Volume 3
___________________________________________________________________________________________
___________________________________________________________________________________________
March 2009 ix
MHWL Mean High Water Level
MHWS Mean High Water Spring MLWL Mean Low Water Level
MLLW Mean Low Low Water MLWS Mean Low Water Spring
MMS Malaysian Meteorological Services
MRSO Malaysian Rectified Skew Orthomorphic MSL Mean Sea Level
MUs Management Units NCECC National Coastal Erosion Control Council
NCES National Coastal Erosion Study (Study commissioned by Government of Malaysia, 1985)
NGVD National Geodetic Positioning System
NIZM National Integrated Coastal Zone Management NPP National Physical Plan
NRS National River Study PERHILITAN Jabatan Perlindungan Hidupan Liar dan Taman Negara (Department of
Wildlife and National Park Protection)
PIANC Permanent International association of Navigation Congrss PMU Project Management Unit
PTG Pengarah tanah dan galian ( Director of Land and Mines) RTR Relative Tidal Range
SAUH Simplied Armour Unit ‘H’ SEPU State Economic Planning Unit (UPEN –Unit Perancang Ekonomi Negeri) SLR Sea Level Rise
SMP Shoreline Management Plan SPC State Planning Committee
SPM Shore Protection Manual SSMO Surface Ship Meteorological Observations
TLDM Tentera Laut DiRaja Malaysia ( Malaysian Royal Navy) TSS Total Suspended Solids UNCED United Nations Conference on the Environment and Development
UNCLOS United Nations Conference on the Law of the Sea UNEP United Nations Environment Programme
UNFCCC United Nations Framework Convention on Climate Change UPEN Unit Perancang Ekonomi Negeri (SEPU – State Economic Planning Unit)
USACE US Army Corps of Engineers
SURVAS Synthesis and Upscaling of Sea Level Rise Vulnerability Assessment Studies

DID MANUAL Volume 3
___________________________________________________________________________________________
___________________________________________________________________________________________
March 2009 x
List of Glossary
DEFINITION OF COASTAL TERMS
To ensure sound communication it is important to define the coastal terms used in coastal engineering and shoreline management. Therefore, definitions of terms for coastal features,
processes and management issues are given in the following.
Definition of coastal terms, mainly from Shore Protection Manual, 1984.
Term
Definition
Angle Of Incidence (α) The angle between the wave propagation direction and the normal to
the coastline or the angle between the wave front and the coastline.
The deep water angle of incidence is denoted α0.
Backshore The part of the beach lying between the foreshore and coastline. The backshore is dry under normal conditions, is often characterised by
berms and is without vegetation. The backshore is only exposed to
waves under extreme events with high tide and storm surge.
Bar A submerged shore parallel embankment of sand or gravel built in the breaker zone due to the action of breaking waves and cross-currents.
There can be several rows of bars. Bars are very mobile formations,
which tend to be in mobile equilibrium with the presently occurring wave and tide conditions, which means that they are constantly
changing. The overall tendency is that the bars are moving seawards during storm wave conditions and landwards during conditions
dominated by smaller waves and swell. At intervals there are gaps in the bars formed by the rip currents, see under: Rip currents.
Beach Or Shore The zone of unconsolidated material that extends from the mean low water line to the place where there is a marked change in material or
physiographic form, or to the line of permanent vegetation (the effective limit of storm waves and storm surge), i.e. to the coastline.
The beach or shore can be divided in the foreshore and the backshore.

DID MANUAL Volume 3
___________________________________________________________________________________________
March 2009 xi
___________________________________________________________________________________________
Term
Definition
Beach Berm A nearly horizontal shore parallel berm formed on the beach due to the landward transport of the coarsest fraction of the beach material by the
wave uprush. There may be several beach berms and in some cases no berms. Under normal conditions a beach berm is formed on the upper
part of the foreshore, and over the backshore during severe events. During dry periods berms are often formed across openings to minor
streams and lagoons, such blocking are also referred to as bar
formations.
Beach Park A beach park is a scheme which consists of new artificial beaches, stabilising coastal structures and filling/reclamation, which in
combination provides new recreational facilities. The artificial beaches
shall be exposed to wave action and shall have a stable plan and profile shape.
Bluff A high, steep bank or cliff.
Breaker-Zone or
Surf-Zone
There is no clear definition of the breaker-zone, but it can be defined as
the zone extending seaward from the shoreline that is exposed to
depth-limited breaking waves. The outer limit of the breaker-zone is called the BREAKER-LINE. However, the instantaneous width of the
surf-zone varies with the instantaneous wave conditions. In this context we define the surf-zone as the zone valid for the yearly wave climate
defined by the significant wave height HS, 12 h/y, which is the wave
exceeded 12 hours per year. The width of the breaker/surf-zone can thus be defined as the width of the zone within which HS, 12 h/y breaks.
The breaker/surf-zone is somewhat narrower than the littoral zone. It is evaluated that 80 to 90% of the yearly littoral transport takes place
within the breaker or surf-zone.
Closure Depth The depth beyond which no significant longshore or cross-shore
transports take place due to littoral transport processes. The closure depth can thus be defined as the depth at the seaward boundary of the
littoral zone. According to (Hallemeyer, 1981) the closure depth can be calculated using the expression:
2
2
/12,
/12,5.6828.2
s
yhS
yhSlgT
HHd −= (1)
where dl is the closure depth relative to mean low water-level, HS, 12 h/y
is the nearshore significant wave height exceeded 12 hours per year, and Ts is the corresponding significant wave period. This definition is
valid for "normal" sandy coastal profiles.
Coast The strip of land that extends from the coastline inland to the first major
change in the terrain features, which are not influenced by the coastal processes. The main types of coastal features are dunes, cliffs and low-
lying areas, possibly protected by dikes or seawalls.

DID MANUAL Volume 3
___________________________________________________________________________________________
___________________________________________________________________________________________
March 2009 xii
Term
Definition
Coastal Erosion Erosion in the coastal profile. This is taking place in the form of scouring in the foot of the cliffs, in the foot of the dunes or at the escarpment.
Coastal erosion takes place mainly during strong winds, high waves and high tides and storm surge conditions, i.e. normally during monsoon
period. Coastal erosion results in coastline retreat. The rate of erosion is correctly expressed in volume/length/time, e.g. in m3/m/year, but
erosion rate is often used synonymously with coastline retreat, and thus
expressed in m/year.
Coastal Protection/ Defence
- Coastal Ersoion
control Measures
- Tidal Wave
Inundation
Mitigation Meaures
- Shore Restoration
Measures
Three different protection/defence definitions are used as follows:
Measures aimed at protecting the coast against coastline retreat, thus
protecting housing, infrastructure, the coast and the hinterland from erosion often at the expense of losing the beach and the dynamic
coastal landscape. The meaures often consist of hard structures such as revetments or groynes.
Measures aiming at protecting low-lying coast and coastal hinterland
against flooding caused by the combined effect of storm surge and
extreme astronomical tides. The measures often consist of dikes or seawalls of some kind, or in the form of artificial dunes.
Measures aiming at protecting, preserving or restoring the shore and the
dynamic coastal landscape and vegetation as well as protecting against
coastline retreat to the extent possible.
Coastal Area The land and sea areas bordering the shoreline and covered under the Integrated Shoreline Management Plan.
Coastal Engineering
Works
Coastal engineering works covers coastal erosion control measures,
rivermouth improvement works to mitigate siltation problem, and
coastal inundation and drainage outlet works to mitigate tidal flooding and siltation of drainage outlet.
Coastal Hinterland The land that extends landward of the coast and which is not influenced
by coastal processes.
Coastal Management
Coastal management involves managing of coastal erosion, coastal
flooding, saline intrusion and/or rivermouth siltation problems in an integrated approach by taking into consideration the interests/needs of
other coastal users. In the process of instituting mitigating measures,
both structural and non-structural, value-added measures may be incorporated in the design to complement the needs of other coastal
users.

DID MANUAL Volume 3
___________________________________________________________________________________________
March 2009 xiii
___________________________________________________________________________________________
Term
Definition
Coastal Zone
(General, wide planning-oriented characterisation) - The interface between land and sea, delineated as the part of the land affected by its
proximity to the sea, and the part of the sea affected by its proximity to the land.
The coastal zone is broadly defined as the areas where terrestrial and
marine processes interact. These include the coastal plains, deltaic
areas, coastal wetlands, estuaries and lagoons. It is difficult to demarcate a fixed geographical limit on the coastal zone due to the
complex interaction and inter-dependence of fluvial and coastal processes. It encompasses the land and sea areas with a landward limit
of 5 km form high watermark and seaward limit up to the Exclusive
Economic Zone.
Coastline Technically the line that forms the boundary between the COAST and the SHORE, i.e. the foot of the cliff or the foot of the dunes. Commonly,
the line that forms the boundary between the land and the water.
Coastline Retreat Coastal erosion causes the coastline to retreat.
Development Activity Any activity likely to alter the physical nature of the Coastal Zone in any
way including construction of buildings and works, the deposit of waste or other material from outfalls, vessels or by other means, the removal
of sand, sea shells, natural vegetation, sea grass and other substances,
dredging and filling, land reclamation and mining or drilling for minerals, but excluding fishing activities.
Dune Ridges or moulds of loose, wind blown sand (fine to medium) forming
on the backshore and forming the coastal features at certain locations. Dunes are more or less vegetated. Dunes are active coastal form
elements acting as a flexible sand reservoir. At eroding coasts they are
moving backwards in parallel with the erosion process. Dunes act as a kind of flexible natural protection against erosion and flooding. If the
vegetation is damaged by too much traffic or grazing etc. the integrity of the dunes may be endangered.
Environmental Impact Assessment (EIA)
A written analysis of the predicted environmental consequences of a proposed development activity, including:
(i) A description of the avoidable and unavoidable adverse environmental effects;
(ii) A description of alternatives to the activity which might be less
harmful to the environment, together with the reasons why such alternatives were rejected; and
(iii) A description of any required irreversible or irretrievable commitments of resources required by the proposed development
activity.
DID MANUAL Volume 3
___________________________________________________________________________________________
___________________________________________________________________________________________
March 2009 xiv
Term
Definition
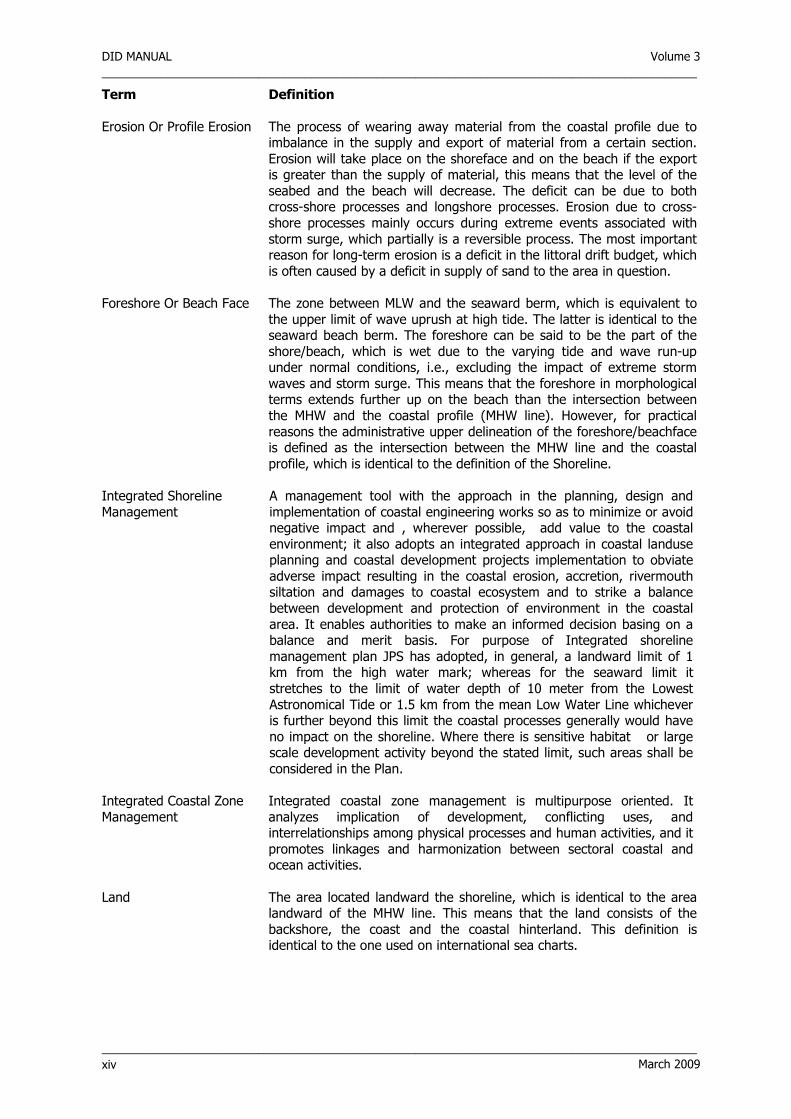
Erosion Or Profile Erosion The process of wearing away material from the coastal profile due to imbalance in the supply and export of material from a certain section.
Erosion will take place on the shoreface and on the beach if the export is greater than the supply of material, this means that the level of the
seabed and the beach will decrease. The deficit can be due to both cross-shore processes and longshore processes. Erosion due to cross-
shore processes mainly occurs during extreme events associated with
storm surge, which partially is a reversible process. The most important reason for long-term erosion is a deficit in the littoral drift budget, which
is often caused by a deficit in supply of sand to the area in question.
Foreshore Or Beach Face The zone between MLW and the seaward berm, which is equivalent to
the upper limit of wave uprush at high tide. The latter is identical to the seaward beach berm. The foreshore can be said to be the part of the
shore/beach, which is wet due to the varying tide and wave run-up under normal conditions, i.e., excluding the impact of extreme storm
waves and storm surge. This means that the foreshore in morphological terms extends further up on the beach than the intersection between
the MHW and the coastal profile (MHW line). However, for practical
reasons the administrative upper delineation of the foreshore/beachface is defined as the intersection between the MHW line and the coastal
profile, which is identical to the definition of the Shoreline.
Integrated Shoreline
Management
A management tool with the approach in the planning, design and
implementation of coastal engineering works so as to minimize or avoid negative impact and , wherever possible, add value to the coastal
environment; it also adopts an integrated approach in coastal landuse planning and coastal development projects implementation to obviate
adverse impact resulting in the coastal erosion, accretion, rivermouth siltation and damages to coastal ecosystem and to strike a balance
between development and protection of environment in the coastal
area. It enables authorities to make an informed decision basing on a balance and merit basis. For purpose of Integrated shoreline
management plan JPS has adopted, in general, a landward limit of 1 km from the high water mark; whereas for the seaward limit it
stretches to the limit of water depth of 10 meter from the Lowest
Astronomical Tide or 1.5 km from the mean Low Water Line whichever is further beyond this limit the coastal processes generally would have
no impact on the shoreline. Where there is sensitive habitat or large scale development activity beyond the stated limit, such areas shall be
considered in the Plan.
Integrated Coastal Zone
Management
Integrated coastal zone management is multipurpose oriented. It
analyzes implication of development, conflicting uses, and interrelationships among physical processes and human activities, and it
promotes linkages and harmonization between sectoral coastal and ocean activities.
Land
The area located landward the shoreline, which is identical to the area landward of the MHW line. This means that the land consists of the
backshore, the coast and the coastal hinterland. This definition is identical to the one used on international sea charts.
DID MANUAL Volume 3
___________________________________________________________________________________________
March 2009 xv
___________________________________________________________________________________________
Term
Definition
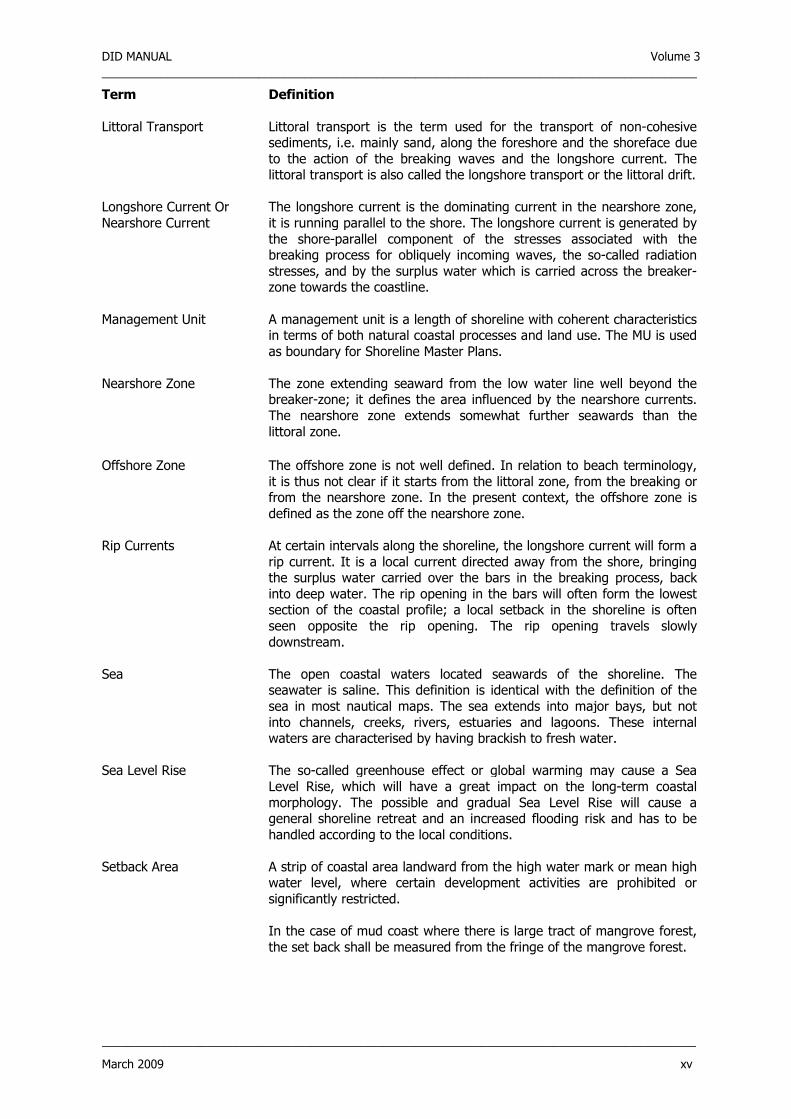
Littoral Transport Littoral transport is the term used for the transport of non-cohesive sediments, i.e. mainly sand, along the foreshore and the shoreface due
to the action of the breaking waves and the longshore current. The littoral transport is also called the longshore transport or the littoral drift.
Longshore Current Or
Nearshore Current
The longshore current is the dominating current in the nearshore zone,
it is running parallel to the shore. The longshore current is generated by
the shore-parallel component of the stresses associated with the breaking process for obliquely incoming waves, the so-called radiation
stresses, and by the surplus water which is carried across the breaker-zone towards the coastline.
Management Unit A management unit is a length of shoreline with coherent characteristics in terms of both natural coastal processes and land use. The MU is used
as boundary for Shoreline Master Plans.
Nearshore Zone
The zone extending seaward from the low water line well beyond the breaker-zone; it defines the area influenced by the nearshore currents.
The nearshore zone extends somewhat further seawards than the
littoral zone.
Offshore Zone The offshore zone is not well defined. In relation to beach terminology,
it is thus not clear if it starts from the littoral zone, from the breaking or from the nearshore zone. In the present context, the offshore zone is
defined as the zone off the nearshore zone.
Rip Currents At certain intervals along the shoreline, the longshore current will form a
rip current. It is a local current directed away from the shore, bringing the surplus water carried over the bars in the breaking process, back
into deep water. The rip opening in the bars will often form the lowest section of the coastal profile; a local setback in the shoreline is often
seen opposite the rip opening. The rip opening travels slowly
downstream.
Sea The open coastal waters located seawards of the shoreline. The seawater is saline. This definition is identical with the definition of the
sea in most nautical maps. The sea extends into major bays, but not
into channels, creeks, rivers, estuaries and lagoons. These internal waters are characterised by having brackish to fresh water.
Sea Level Rise The so-called greenhouse effect or global warming may cause a Sea
Level Rise, which will have a great impact on the long-term coastal
morphology. The possible and gradual Sea Level Rise will cause a general shoreline retreat and an increased flooding risk and has to be
handled according to the local conditions.
Setback Area
A strip of coastal area landward from the high water mark or mean high water level, where certain development activities are prohibited or
significantly restricted.
In the case of mud coast where there is large tract of mangrove forest,
the set back shall be measured from the fringe of the mangrove forest.

DID MANUAL Volume 3
___________________________________________________________________________________________
___________________________________________________________________________________________
March 2009 xvi
Term
Definition
Shoaling Decrease in water depth. The transformation of wave profile as they propagate inshore.
Shore Protection
See Coast Protection/Defence.
Shoreface Or Littoral
Zone
The active littoral zone off the low water line. This zone extends
seaward from the foreshore to some distance beyond the breaker-zone.
The littoral zone is the zone in which the littoral processes take place; these are mainly the long-shore transport, also referred to as the littoral
drift, and the cross-shore transport. The width of the instantaneous littoral zone varies dependent of the wave conditions. In the general
context, we will define the littoral zone as the zone corresponding to the
yearly wave climate. The width of the littoral zone can thus be defined as the width of the transport zone for the significant wave height, which
is exceeded 12 hours per year, HS,12 h/y.
Shoreline The intersection between the mean high water line and the shore. The line delineating the shoreline on Nautical Charts (Sea Maps)
approximates this Mean High Water Line. The shoreline is not easy to
identify in the nature in contract to the coastline, which is based on a clear morphological shift between the shore and the coast.
Shoreline Management The act of dealing - in a planned way - with actual and potential coastal
erosion and its relation to planned or existing development activities on
the coast. The objectives of Shoreline Management are: a) To ensure the development activities in the coastal area follow an
overall land use plan and a general environmental policy, b) To ensure the development activities in the coastal area does not
contribute to or aggravate erosion, c) To ensure that development activities do not occur in sensitive areas,
d) To ensure that erosion control techniques are cost-effective and
socially and environmentally acceptable.
Shoreline Retreat Shore erosion causes the shoreline to retreat.
Storm Surge
Is the rise in water-level on an open coast as a result of the combined
impact of the wind stress on the water surface, the atmospheric pressure reduction, decreasing water depth and the horizontal
boundaries of the adjacent water. The storm surge does not include the effect of the astronomical tide. The storm surge at a location is inversely
proportional with the water depth in the offshore area off the shoreline.
This means that shores out to deep oceans will only be exposed to relatively small surge where as shores out to shallow seas can be
exposed to high surge.
Swell Wind-generated waves that have travelled out of their generating area. Swell characteristically exhibits a more regular and longer period and
has flatter crests than waves within their fetch.
Tidal Flat
Shallow, often muddy, part of foreshore, which are covered and
uncovered by the rise and fall of the tide. As a rule of thumb, a tidal flat normally develops when the relative tidal range RTR, defined as the
ratio between the mean spring tidal range and the annual average HS, is
higher than 15.

DID MANUAL Volume 3
___________________________________________________________________________________________
March 2009 xvii
___________________________________________________________________________________________
Term
Definition
Tidal Wave Is the combined effect of astronomical and meteorological surges - the popular expression for an unusually high and destructive water level
along a shore. The expression tidal wave also includes the influence of the associated waves.
Tide or Astronomical Tide The astronomical tide is generated by the rotation of the earth in
combination with the varying gravitational impact on the water body of
the sun, the moon and the planets. These phenomena cause predictable and regular oscillations in the water level, which is referred to as the
tide. The astronomical tide at a specific location can be predicted and is published in Tidal Tables.
Additional References for Coastal Terminology/ Glossary:
Mangor, Karsten. 2004. “Shoreline Management Guidelines”. DHI Water and Environment - Definition of Coastal Terms.
http://www.encora.eu/coastalwiki/Definitions of coastal terms
CHL (COASTAL AND HYDRAULICS LABORATORY), US ARMY CORPS OF ENGINEERS, CEM (COASTAL
ENGINEERING MANUAL) – GLOSSARY OF COASTAL TERMINOLOGY http://chl.erdc.usace.army.mil/cemglossary
NOAA (NATIONAL OCEANIC AND ATMOSPHERIC ADMINISTRATION) COASTAL SERVICES CENTER – SHORELINE TERMS
http://www.csc.noaa.gov/shoreline/term.html
Brian Voigt, March 1998, Publication No. 98-105, Washington State Department Of Ecology, Olympia,
Wa 98504-7600 - Glossary Of Coastal Terminology. http://www.csc.noaa.gov/text/glossary.html

DID MANUAL Volume 3
___________________________________________________________________________________________
___________________________________________________________________________________________
March 2009 xviii
(This page is deliberately left blank)

Chapter 1 INTRODUCTION
___________________________________________________________________________________________
___________________________________________________________________________________________
March 2009
CHAPTER 1
INTRODUCTION


Chapter 1 INTRODUCTION
___________________________________________________________________________________________
___________________________________________________________________________________________
March 2009 1-i
Table of Contents Table of Contents ....................................................................................................................... 1-i
1.1 HISTORY ...................................................................................................................... 1-1
1.2 DEPARTMENT JURISDICTION AND FUNCTIONS OF COASTAL DIVISION........................... 1-2
1.2.1 Government Gazette: Warta Kerajaan Bil. 48 No. 13 Tambahan No. 65 Perundangan (A) ............................................................................................... 1-2
1.2.2 General Administrative Circular No. 5 of 1987 – Prime Minister’s Department ........ 1-3
1.2.3 Functions of Coastal Division .............................................................................. 1-3
1.3 DEPARTMENT ISSUED GUIDELINES AND RELATION WITH THE GUIDELINES OF OTHER GOVERNMENT DEPARTMENT/AGENCIES ............................................................. 1-3
1.3.1 Garis Panduan JPS 1/97 – Guidelines On Erosion Control For Development Projects In The Coastal Zone.............................................................................. 1-3
1.3.2 Guidelines For Preparation Of Coastal Engineering Hydraulic Study And
Impact Evaluation (For Hydraulic Studies Using Numerical Models)....................... 1-3
1.3.3 Piawaian Perancangan JPBD 6/97 : Piawaian Perancangan - Garis Panduan Perancangan Pembangunan Di Kawasan Pesisiran Pantai
(Planning Standards – Guidelines for Development Planning In Coastal Area);
Department of Town and Country Planning......................................................... 1-4
1.3.4 Piawaian Perancangan JPBD 6/2000: Garis Panduan Dan Piawaian Perancangan Kawasan Pantai
(Coastal Area Planning Guidelines and Standards); Department of Town and Country Planning ............................................................................................... 1-4
1.3.5 Environmental Impact Assessment (EIA): Procedure and Requirements in Malaysia1-4
1.4 MANUAL OBJECTIVE, APPROACH AND USAGE................................................................. 1-4
1.4.1 Objective .......................................................................................................... 1-4
1.4.2 Approach .......................................................................................................... 1-5
1.4.3 Manual Usage ................................................................................................... 1-5
1.5 TERMS AND CONCEPTS ............................................................................................... 1-13
REFERENCES........................................................................................................................... 1-13

Chapter 1 INTRODUCTION
___________________________________________________________________________________________
___________________________________________________________________________________________
1-ii March 2009
APPENDICES
1-A National Coastal Erosion Study (NCES) Report 1986 ......................................................... 1A-1
1-B Coastal Engineering Manual (CEM), US Army Corps of Engineers, 2006 ............................. 1A-2
1-C “Garis Panduan JPS 1/97 - Guidelines on Erosion Control for Development Projects............ 1A-5 in the Coastal Zone”.
1-D Guidelines For Preparation of Coastal Engineering Hydraulic Study and Impact ................. 1A-7
Evaluation (for hydraulic studies using Numerical Models), fifth Edition, December 2001.
1-E Government Gazette: Warta Kerajaan Jil. 48 No. 13 Tambahan No. 65 Perundangan (A) .... 1A-9
1-F General Administrative Circular No. 5 of 1987 – Prime Minister’s Department ................... 1A-15
1-G Piawaian Perancangan JPBD 6/97 : Piawaian Perancangan – Garis Panduan .................... 1A-18 Perancangan Pembangunan Di kawasan Pesisiran Pantai. (Planning Standards – Guidelines for Development Planning In Coastal Area); Department of Town and Country Planning.
1-H Piawaian Perancangan JPBD 6/2000: Garis Panduan Dan Piawaian Perancangan.............. 1A-20 Kawasan Pantai. (Coastal Area Planning Guidelines and Standards); Department of Town and Country Planning.
1-I Environmental Impact Assessment (EIA) : Procedure and Requirements in Malaysia;........ 1A-22 Environmental Impact Assessment (EIA) Guidance Document: For Coastal And Land
Reclamation Activities;
Environmental Impact Assessment (EIA) Guidance Document: For Sand Mining/Dredging Activities; Department of Environment.

Chapter 1 INTRODUCTION
___________________________________________________________________________________________
___________________________________________________________________________________________
March 2009 1-1
1 INTRODUCTION
1.1 HISTORY
Upon completion of the National Coastal Erosion Study (NCES) (refer Appendix 1A), the government
in 1987 entrusted the Department of Irrigation and Drainage Malaysia (DID) with the function of
Coastal Engineering to address the coastal erosion problems faced by the country nationwide. At the same time the National Erosion Control Council (NCECC) headed by the Director General of the
Implementation Coordination Unit (ICU), Prime Minister’s Department was instituted as an advisory body on coastal erosion control with its prime function to recommend to the government regarding
the programme, budget and implementation coordination between Federal and State Governments as well as with the private sector. The Coastal Division of DID (initially known as Coastal Engineering
Technical Centre) was established to carry out technical studies and give advisory services pertaining
to coastal engineering. Since its establishment in 1987, the Coastal Division has expanded its functions beyond the coastal erosion control programme as mentioned in the later section. By the
beginning of the Eighth Malaysia Plan (2001 – 2005) the coastal erosion control programme was effectively administered by the Central Agencies in the same way as the other development
programmes of the Department.
Upon the recommendations stipulated in the NCES report, the Department has adopted the long
term and short term strategies in the formulation of the coastal erosion control plan for the country. The short term strategy was construction focused on structural measures by installing hard and soft
engineering solutions aiming at arresting further loss of facilities, properties and valuable land due to
the threatening coastal erosion situation, whereas the long term strategy is management focused, by instituting non-structural and regulatory measures such as proper landuse planning and control of
development projects in the coastal zone and enforcing set-back or buffer area.
Since then, many coastal erosion control works have been designed, mainly based on the guidelines provided in Shore Protection Manual (SPM) of The Department of The Army, US Army Corps of
Engineers (USACE), which is now being updated and titled Coastal Engineering Manual (CEM) (refer
Appendix 1B). The works are to arrest the advance of coastline erosion in the critical areas. The works include revetment, groynes, breakwater, etc. However with the increasing concern for the
environment, the Department is now inclined towards semi-hard engineering and environmentally friendly solutions such as sand nourishment and mangrove replanting.
In the early nineties, a national study on rivermouths was carried out to identify the rivers facing flooding and navigation problems caused by siltation at and around rivermouths. Subsequently,
especially at the turn of the 21st century, efforts have been stepped up to improve rivermouths, which normally involved dredging of rivermouths and construction of breakwaters or training walls at
the rivermouths.
In view of the increasing incidences of coastal erosion and increasing development activities in
coastal zone, and as part of the long term strategy, the Department in 1997 published guidelines on erosion control for development projects in the coastal zone. The guideline entitled “Garis Panduan JPS 1/97 - Guidelines on Erosion Control for Development Projects in the Coastal Zone” (refer Appendix 1C) aims at ensuring proper planning and implementation of coastal development projects
to obviate the need for expensive coastal protection works in the future and to ensure sustainable
development of the coastal zone.
Complementing the issuance of the Guidelines JPS 1/97, which requires coastal development projects to carry out coastal hydraulic studies, the guideline for the preparation of coastal
engineering hydraulic study and impact evaluation using numerical models was published and issued
with its fifth edition in December 2001 (refer Appendix 1D). The latter guideline is intended to assist the consultants and the developers in carrying out a thorough coastal hydraulic study and impact
assessment and to promote greater transparency on the needs of the Department as well as expedite the process of the preparation of the hydraulic report and the Department’s evaluation and
subsequent approval of the coastal projects.

Chapter 1 INTRODUCTION
___________________________________________________________________________________________
___________________________________________________________________________________________
1-2 March 2009
Realizing the need for an integrated approach in coastal zone management to protect the coastal
environment and coastal resources for sustainable development, the Department has embarked on a
national program to produce Integrated Shoreline Management Plan (ISMP) for the whole country as one of the initiatives of the 21st century in an effort to achieve a balance between development and
environment conservation and protection in coastal areas. The success of the coastal erosion control plan and coastal resources and environment management depends very much on the concerted
effort of all parties concerned working actively together, namely decision makers, planners, researchers, government agencies, developers and public interests groups.
The efforts in coastal erosion control through implementation of engineering solutions coupled with landuse planning control and coastal development regulation since the 1980’s have enabled the
Department to acquire good experience and knowledge in this area which should be captured and documented in the form of a manual to ensure the knowledge and practices in coastal management,
especially for coastal erosion control in Malaysia, is being passed on for further development in this
country.
Of late, the disaster caused by the incidence of Tsunami that hit northern peninsular Malaysia in December 2004, the conclusion of the Inter-governmental Panel of Climate change (IPCC) 2006
report regarding sea level rise due to climate change and the many occurrences of coastal flooding have prompted the Department to consider the need to focus also on coastal inundation due to
storm surge and high tide level. Inclusion of related topics of this area of concern is deemed
appropriate and would serve as a starting point in documenting this area of knowledge for future revised editions of this manual.
1.2 DEPARTMENT JURISDICTION AND FUNCTIONS OF COASTAL DIVISION
The functions of the Department are stated through the notification of Government Gazette on 24 June 2004 as in Appendix 1E. The Administrative Circular No5 of 1987 (refer Appendix 1F) issued by
the Chief Secretary to the Government on the advice of the NCECC requires every ministry, department and agency involved to refer all proposed coastal development projects, activities, and
construction of structures in coastal areas to the Department for comment. Under this instruction the Department renders technical advice to the approving authorities, which may or may not accept the
advice. Realising that the Department cannot effectively carry out its function in coastal
management, the Department has obtained the agreement of the Cabinet to promulgate a suitable law, in consultation with the Ministry of Housing and Local Government, to ensure that all proposed
developments in coastal areas adhered to the requirements in the guideline Garis Panduan JPS 1/97 and the recommendations in the ISMP. To date, a draft Shoreline Management Bill is completed.
However the Department is looking into drafting a bill to cover requirements beyond coastal
management, to include also river management and other aspects of water resources management.
1.2.1 Government Gazette: Warta Kerajaan Jil. 48 No. 13 Tambahan No. 65
Perundangan (A)
The function of the Department which is directly related to coastal management is stated in the
Government Gazette as follows:
“Pembangunaan dan pengurusan zon pantai bagi mengurangkan hakisan pantai serta masalah mendapan muara sungai” which can be translated as ‘Coastal zone development and management for mitigating coastal erosion and rivermouth
siltation problems”
Other functions of the Department, which have indirect relation with coastal management, are stated as:
(a) “Perancangan dan pengurusan sungai” which can be translated as: “River planning and management” ; and (b) “Perancangan dan pengurusan program tebatan banjir” which can be translated as
“Planning and management of flood mitigation programme”.

Chapter 1 INTRODUCTION
___________________________________________________________________________________________
___________________________________________________________________________________________
March 2009 1-3
1.2.2 General Administrative Circular No. 5 of 1987 – Prime Minister’s Department
The circular was issued to establish the regulation which requires every ministry, department and
agency to refer all development projects and activities in coastal zones to the Department of Irrigation and Drainage for comment in an effort to reduce the coastal erosion impact and the cost of
its mitigating measures as well as other impacts that may arise due to these development activities.
1.2.3 Functions of the Coastal Division
In line with the gazetted function of the Department the functions of the Coastal Division have been
established as follows:
• Coastal erosion management and implementation of coastal erosion control works and
measures
• Rivermouth siltation management and implementation of rivermouth improvement works
and measures for navigation and flood mitigating purposes • Management of tidal flooding , tidal wave-inundation and coastal drainage problems and
implementation of their mitigating works and measures
• Management of saline intrusion problems and implementation of saline intrusion prevention
works and measures • Formulation and monitoring the implementation of Integrated Shoreline Management Plan
Within the ambit of DID jurisdiction and adopting the best management practices in coastal management, the functions of the Coastal Division shall be executed in an integrated approach by
taking into consideration the interests/needs of other coastal users. In the process of instituting
mitigating measures, both structural and non-structural, value-add measures may be incorporated in the design to complement the need of other coastal users.
1.3 DEPARTMENT ISSUED GUIDELINES AND RELATION WITH THE GUIDELINES
OF OTHER GOVERNMENT DEPARTMENT/AGENCIES
1.3.1 Garis Panduan JPS 1/97 – Guidelines On Erosion Control For Development Projects In The Coastal Zone
This guideline, Garis Panduan JPS 1/97, was approved by the Cabinet on 27 January 1997 and is aimed at ensuring the proper planning and sustainable development of the coastal zone. The
guideline describes in detail the data requirements and the scope of impact evaluation for the various types of development in the coastal zone namely shorefront development, backshore
development, land reclamation and offshore sand mining and river mouth dredging. The guideline also provides flow charts for the processing of development applications. This guideline provides for
coastal zone development planning control to obviate the expensive erosion control measures.
This guideline is widely accepted by the decision makers, planners, project proponents and
consultants involved in development projects in the coastal zone as well as authorities in approving development projects. This guideline is listed as an appendix to this Chapter. It is necessary for the
Coastal Engineer of the Department to be familiar with this guideline.
1.3.2 Guidelines For Preparation Of Coastal Engineering Hydraulic Study And Impact Evaluation (For Hydraulic Studies Using Numerical Models)
This guideline is published to complement the Garis Panduan JPS 1/97 by spelling out in more details on the requirements for carrying out coastal engineering hydraulic study and impact evaluation by
project proponent. This guideline is also widely accepted by the practitioners and the approving authorities. This guideline is listed as an appendix to this manual and the Coastal Engineer of the
Department is required to be familiar with this guideline.

Chapter 1 INTRODUCTION
___________________________________________________________________________________________
___________________________________________________________________________________________
1-4 March 2009
1.3.3 Piawaian Perancangan JPBD 6/97 : Piawaian Perancangan – Garis Panduan Perancangan Pembangunan Di kawasan Pesisiran Pantai (Planning Standards – Guidelines for Development Planning In Coastal zone);
Department of Town and Country Planning (refer Appendix 1G)
This planning standards and guidelines document is published by the Department of Town and Country Planning (JPBD) with the objective of conserving of coastal areas and that the development of various
coastal zones is compatible with the existing costal environment. This guideline is required to be used
together with the Garis Panduan JPS 1/97, the General Administrative Circular No. 5 of 1987 issued by the Prime Minister’s Department, and the National Coastal Resources Management Policy. Among other
requirements, the guideline specifies development setback required for various development activities, landuse, types of coast and river mouth. This guideline is listed as appendix in this manual and the
user shall take note of the relevant requirements in this guideline not included in the Garis Panduan JPS 1/97.
1.3.4 Piawaian Perancangan JPBD 6/2000: Garis Panduan Dan Piawaian
Perancangan Kawasan Pantai (Coastal Area Planning Guidelines and Standards) ; Department of Town and
Country Planning) (refer Appendix 1H)
This planning standards and guidelines document is an extension of the previous one mentioned
above. This document requires that the approval of DID is necessary regarding coastal hydraulic study for specified development activities which include land reclamation, dredging, outfall to the
sea, breakwater, seawall, jetty, marina, power station, etc. This guideline is also listed as appendix
to this manual and the manual user shall also take note of some of the related requirements set out in this guideline.
1.3.5 Environmental Impact Assessment (EIA) : Procedure and Requirements in Malaysia (refer Appendix 1I)
This guideline summarizes the EIA procedure as an aid to environmental planning of new projects or the expansion of the existing ones. It contains information on the EIA process which requires
proponents of particular projects, classified as “prescribed activities”, to submit EIA to the Director General of Department of Environment (DOE) before the project is approved by the relevant
approving authority. In fact the guideline “Garis Panduan JPS 1/97” complements this document, especially for projects where the project size falls outside that of the prescribed activities in the EIA.
Two further guidance documents were published by the DOE, one for sand mining/dredging activities and the other for coastal and land reclamation activities. In these two documents, Garis Panduan JPS 1/97 and Guidelines for Preparation of Coastal Engineering Hydraulic study and Impact Evaluation, December 2001 are mentioned as guidance that these two documents are complementing.
1.4 MANUAL OBJECTIVE , APPROACH AND USAGE
1.4.1 Objective
This manual aims to provide guidance and references pertaining to the latest information, knowledge
and practices in coastal management to DID engineers and personnel. The manual would enable the DID engineers and DID personnel who are new in coastal management to have a jump start in
carrying out their duties in the aspect of planning, design, operation and maintenance of coastal
erosion control works and in regulating development projects in coastal areas.
Chapter 1 INTRODUCTION
___________________________________________________________________________________________
___________________________________________________________________________________________
March 2009 1-5
1.4.2 Approach
The approach in writing this manual is mainly based on literature review of documented experiences, knowledge and practices both locally and overseas. The review of these literatures is carried out with
the aim of adopting, adapting, updating or modifying of this information to suit the Malaysian condition and situation and eventually compiled to become the Malaysian coastal management
manual.
The manual focuses on subject matters and issues that are relevant to the function of the
Department in coastal erosion control, river mouth improvement for navigation, and coastal inundation mitigation. The subject matters include coastal processes, coastal engineering, coastal
environment, coastal structure, policy, institution, legislation, technology, and coastal development management.
The specific local experiences and knowledge of individuals who have served in the coastal division of the Department and those individuals practicing coastal management in other agencies,
institutions and the private sector are not collated and incorporated into this manual. It is recommended that this tacit knowledge be captured through another initiative of the Department
and incorporated in the next edition of the manual.
It is also intended to make this manual a practical manual for the use of DID engineers. Hence topics
coverage will also include the aspects on shoreline monitoring survey, hydraulic modeling output monitoring, planning and design of shoreline protection projects, emergency and temporary works
etc.
Due to the diversified spectrum of readers of this manual and for smooth presentation of facts,
repetition of certain subject matters under different chapters is unavoidable and in fact is desirable so that a chapter can stand alone and is comprehensive for the targeted reader of each chapter.
1.4.3 Manual Usage
The manual is designed and developed targeting for the use of DID engineers and DID personnel.
Besides related topics on coastal engineering and coastal management, topics on fundamentals of coastal process, tidal-wave inundation, coastal drainage, sea level rise and tsunami are also included.
The manual covers also matters related to jurisdiction of the Department in executing its function of coastal erosion and coastal flooding control and its relation with other government agencies or
authorities.
List of references for each chapter are listed at the end of the chapter for those who wish to read
further on the subject matter. The relevant publications on the guidelines, regulations and procedures of the Department and other government agencies are listed as appendixes in Chapter 1
of this manual. A set of these documents is kept in the main library of the Department and another
set is kept in the library of the coastal section of the Department. For those who wish to own a set of these publications, it can be obtained from the respective department and government agency
concerned.
The manual shall be used as a starting point in planning and design for a solution. Users shall refer or research further for details of the subject matter from technical text books, and standards for
engineering design purpose. Appropriate investigation and analysis shall be carried out and/or expert
advice shall be sought for each case.
This manual is expected to be of interest to a wide spectrum of coastal interest groups and personnel outside the DID, such as engineers, scientists, planners, developers etc. in the private
sector as well as other government agencies. The Department shall not be liable and holds no
obligation for the use of this manual by individuals or bodies outside the Department.

Chapter 1 INTRODUCTION
___________________________________________________________________________________________
___________________________________________________________________________________________
1-6 March 2009
It is pertinent to mention here that this Coastal Management Manual constitutes one of the many
volumes of DID Manual and readers are reminded to cross reference to the related topics in the
other relevant volumes of DID Manual. The complete list of the DID manual is as below:
Volume 1: Flood Management Volume 2: River Management
Volume 3: Coastal Management Volume 4: Hydrology and Water Resources
Volume 5: Irrigation and Agricultural Drainage
Volume 6: Geotechnical Manual, Site Investigation and Engineering survey Volume 7: Engineering Modelling
Volume 8: Mechanical and Electrical Services Volume 9: Dam Safety, Inspection and Monitoring
Volume 10: Contract Administration
Volume 11: Construction Management
To give the reader an overview of what this Coastal Management Manual contains, a brief description of each Chapter is given below.
Chapter 1 gives a brief history of development of coastal management in the Department, which started in 1987 with the focus on implementing coastal erosion control works in the critical erosion
areas. The Coastal Division later evolved and reinvented itself to extend its function to manage the coastal area, within the ambit of DID jurisdiction as stated in the Government Gazette 2004, in
arresting coastal erosion, coastal flooding , coastal drainage, saline intrusion and rivermouth siltation problems in an integrated approach by taking into consideration of the interests/needs of other
coastal users. In the process of instituting mitigating measures, both structural and non-structural, to
address these problems, value added measures may be incorporated in the design to complement the needs of other coastal users. The Administrative Circular issued by the Prime Minister’s
Department in 1987 empowers the Department to regulate development activities and projects in the coastal area to minimize the impacts of such activities and projects. Two guidelines namely Guideline
JPS 1/97 and Guideline for Preparation of Coastal Engineering Hydraulic Study and Impact Evaluation were issued by the Department to provide guidelines for the planning and design of the development
in coastal areas with the aim to protect or conserve coastal environment or to minimize adverse
impacts to the coastline such as coastal erosion, degradation of coastal environment etc. These two guidelines are widely supported and used by the other government agencies such as JPBD and DOE
through their respective departmental guidelines requiring development projects to observe the requirements set out in these two guidelines of the Department. This chapter also sets out the
objectives, approach and usage of this manual. To help the readers to have a common
understanding of terms and concept in coastal management within the ambit of DID jurisdiction, definitions of such terms and concepts are briefly stated in this Chapter. Lastly, to give an overview
of this manual, a brief of each chapter is also provided and the readers are also reminded to cross reference to the other 10 Volumes of DID manual for related topics.
Chapter 2 deliberates on the fundamentals of wave, currents, tides and water level fluctuation in the sea. These are essentially the main elements in the study of coastal hydraulics and the design of
coastal protection measures. There are various factors that cause wave generation but wind
generated waves are most common of all the waves and are the main factor in coastal processes. As waves break on the shore at an angle, it causes a resultant current along the shore called the
longshore current. The strength of the longshore current increases when the wave height and the angle between the incident wave direction and the shore normal increase. Besides this wave-driven
current there are also tidal driven current, wind generated current and storm surge current. Water level in the sea fluctuates due to tide, storm surge, wind setup, wave setup and wave run-up. These
fluctuations of water level are essential considerations in the planning and design of coastal flood
mitigating measures. The phenomenon of tsunami which brings about devastating inundation of coastal areas is also briefly explained. Sediment transport process which is the main mechanism in
the phenomenon of coastal erosion and accretion is discussed in this chapter. The differences in the transport mechanism of sand and mud are explained. Erosion and accretion are part of natural
coastal processes that shape the coastline with features like headland and bay, sand spit, barrier

Chapter 1 INTRODUCTION
___________________________________________________________________________________________
___________________________________________________________________________________________
March 2009 1-7
island, lagoon, delta, rivermouth, tidal inlet and reef (rocky and coral).The formation and stability of
these features are briefly described here. In many cases erosion and accretion at a shoreline are
cyclic and when observed over a long period the shoreline is actually stable. Hence the sediment transport along this shoreline is in dynamic equilibrium. However there are also many cases of
erosion and accretion caused by human activities and man-made interventions which interfere with the coastal sediment transport processes, such as dredging, land reclamation, navigation channel,
port and harbour, artificial lagoon, artificial island, coastal erosion control works etc. This chapter attempts to explain how these activities and man-made structures interfere in the coastal sediment
transport system and cause erosion and accretion.
Chapter 3 reiterates the general objectives and guidelines for coastal erosion control. Construction focused and reactive erosion control measures are normally employed to check the retreating shoreline of critical erosion areas due to its economic and/or social significance. It is the aim of the
Department to obviate the need for expensive coastal erosion control works through regulating and
controlling of the planning and implementation of development projects in coastal areas. In this chapter, hard engineering solutions, environment friendly solutions and non-structural measures
which are the options to consider in managing coastal erosion are discussed. Revetment, seawall, groyne, breakwater, headland and bay are the commonly used coastal erosion control structures
being listed and discussed in this chapter. Issues on structural stability and wave overtopping for each structure are being highlighted. Seawall is a vertical or near vertical wall which can cause high
wave run-up and wave reflection. The wave reflection can cause doubling of wave height where the
crest of the incident wave coincides with the reflected wave, which in turn often results in toe scouring of the sea wall and subsequently the overturning of the wall. Bund and dyke which
function to protect the coastal area from tidal-wave inundation is discussed here because many places have suffered the diminishing protective mangrove belt thus exposing bunds/dykes in these
areas to the threat of erosion. Environment friendly solutions commonly implemented are beach
nourishment and mangrove replanting. Beach nourishment involves replacing the loss material with sand and is a preferred method where there is a need to rehabilitate sandy beach for recreational
purpose. Mangrove belt and reef are known to be a nature coastal erosion defensive system by attenuating the wave energy. Another non-structural measure is through regulation of coastal
development projects whereby sufficient set-back is provided so that these coastal development projects are not constructed within this set-back zone and hence not exposed to the threat of the
natural process of erosion and accretion of the shoreline. One non-structural measure that can also
be considered is retreat. At times it is cheaper to shift the target away from the threat of erosion than to implement a very expensive structural measure to protect it. In times of emergency
situation it is necessary to put in place quick temporary measures to check further aggravation of the situation caused by the erosion. This chapter attempts to describe methods to repair damage to
armour layer of revetment, to handle slip of revetment, to address wave overtopping of revetment
and the use of sand bags in checking the advance of erosion temporarily.
Chapter 4 deals with rivemouth/tidal inlet management and planning guidelines. The rivermouth or tidal inlet stability is often governed by the delicate dynamic balance between the two opposing
mechanisms of sediment infilling and flushing. A rivermouth is in dynamic equilibrium when the
flushing capacity and the annual filling are balanced but a certain degree of variability is expected around the equilibrium as the instantaneous strength between these two mechanisms are expected
to vary in time. The infilling mechanism is related to the sediment supply from the river and/ or littoral sediment transport and the flushing mechanism is related mainly to the river discharge and
the tidal prism. Therefore understanding of river catchment characteristics and coastal characteristics are essential in the process of finding engineering solutions to mitigate rivermouth siltation problems.
The river catchment characteristics are determined by:
• river and catchment size,
• river discharge characteristics,
• sediment discharge characteristics, and
• human influences on catchment characteristics such as landuse change, construction of
dams and weirs, reclamation in lower river system, and river sand mining and climate changes.

Chapter 1 INTRODUCTION
___________________________________________________________________________________________
___________________________________________________________________________________________
1-8 March 2009
Coastal characteristics and morphology is a topic in its own right and this chapter only briefly
describes aspects of particular importance to rivermouths. The wave exposure and the related littoral
sediment transport are dominant factors for the morphological development of coastline. Exposed coastline will generally be sandy as the fine sediments are washed out by the waves which is unable
to settle on the beach, while sheltered coastline is often more muddy or silty depending on the type of sediment supply, tidal range etc. The exposed (sandy) coastline and sheltered (silty/muddy)
coastline in Malaysia are discussed quite extensively in this chapter with examples in Malaysia quoted for illustration.
In modern times rivermouth improvement work has become a key discipline within coastal and river engineering. Rivermouth improvement work denotes human intervention of the rivermouth dynamics
to improve certain conditions of the rivermouth to achieve given objectives. In Malaysia the main objectives of rivermouth improvement work are often two-fold, namely;
• To reduce upstream flooding and/or
• To enhance navigability to provide opportunity for fishing fleets etc to access the sea
through rivermouth frequently
Two main solution strategies to these objectives are;
• Dredging of a deeper navigation channel;
• Construction of breakwaters or training structures in combination with deepening of a
channel.
In Malaysia a large number of rivermouths used for navigation are currently managed by maintenance dredging only. The ‘dredging only’ option is preferred for one or more of the following
reasons
• The siltation extent is limited,
• Maintenance frequency is low,
• The navigation depth requirement is moderate and/or structural intervention is very
expensive and its impact is unacceptable
When dredging option alone is not a viable solution, breakwater systems in combination with dredging is the preferred solution. Different breakwater systems that can be considered are
elaborated in this chapter. Sand bypassing solution which is an option in other countries is discussed
here also.
The human intervention of constructing the breakwater causing possible coastal impact of erosion and accretion to the adjacent coastline is being elaborated. It is also pointed out that maintenance
free rivermouth intervention schemes do not exist. Low frequency periodic maintenance dredging is expected even after the rivermouth improvement is put in place and monitoring of siltation by
measurement of water depth at crucial locations is required to be carried out to decide the right
timing of calling in dredger. Lastly in this chapter Rivermouth management guidelines are outlined to include aspects of:
• Catchment management
• Management of coastline close to rivermouths and tidal inlets
• Rivermouth management
Chapter 5 records an inventory of coastlines in Malaysia. The source of information is mainly from the NCES Report 1985 and the National Rivermouth Study (NRS) 1994. It gives a general description
of the coastlines in East Coast of Peninsular Malaysia, west coast of Peninsular Malaysia, Sabah and Sarawak. The total length of coastlines of Malaysia is about 4,800 km consisting of 860km, 1110km,
1800km and 1040km respectively in east and west coast of Peninsular Malaysia, Sabah and Sarawak. Based on the NCES (1985), about 30 % 0f Malaysia coastlines is retreating either due to natural
process and/or human interventions. The erosion areas are classified into 3 categories as follows: • Category 1, Critical Erosion,
• Category 2, Significant Erosion, and
• Category 3, Acceptable Erosion.
Chapter 1 INTRODUCTION
___________________________________________________________________________________________
___________________________________________________________________________________________
March 2009 1-9
The categorization is in accordance to the economic and/ or social significance and the state of
urgency of the retreating coastline threatening the properties or the settlement behind it.
Tides and waves are important coastal dynamics affecting the coastal morphology movement.
Information regarding these two coastal elements is given in this chapter.
Malaysia coastlines have been classified into coastal reaches. Each reach has its characteristics according to its coastline features, shoreline behaviour, coastal processes and sand sources & sinks.
The characteristics of each reach is informative and useful information for coastal engineers although
it is to be noted that some information has changed due to the dynamic characteristics of the coastal processes as well as the changes in coastal environment. The latest information on coastal inventory
for the states of Pahang, Negeri Sembilan and Sabah shall be obtained from the Integrated Shoreline Management Plan for the respective state.
Chapter 6 introduces the topics on physical modeling and numerical modeling in the coastal hydraulic study. Physical and numerical modeling are carried out to predict the effect of structures on
coastlines as well as to simulate the impact of waves on coastal structures. Physical model for coastal hydraulic study is a scaled down representation of prototype built in a laboratory equipped
with wave generators, and instrumentation for the measurement of flow and waves and it has been widely used to determine the optimum layout of breakwaters, to select the optimum size of armour
rocks, and to investigate the effect of coastal structures on shorelines. Numerical modeling relies on
computers which rapidly and sequentially solve the mathematical equations that approximate physical phenomena such as tidal flow, wave transformation etc. The advantage of numerical
modeling over physical modeling is in its capability to simulate the coastal hydrodynamics over a large area and over long periods of time whereas physical modeling is generally limited to studying
of near-field phenomena particularly wave structure interactions. Other advantages of numerical
modeling over the physical modeling are listed in this chapter.
Part A of Chapter 6 deals with Physical Modeling. It discusses • the benefits and shortcomings of physical modeling
• the use of fixed and movable bed physical models and their strengths and limitations,
• the important elements for selection of wave characteristics for physical model test , namely
model scale ratios, selection of representative sea states, duration of time series, “free’ and
“bound’ long waves, 2D/3D waves, challenges in 3D wave modeling, wave generators and wave generation.
Lastly it also describes at great length various aspects in the planning and execution of physical model tests, such as bathymetric model construction, wave reflection in laboratory, test program,
measurement and analysis of laboratory waves. All the points raised and discussed here give the coastal manager a good list of pointers when looking out for good physical model test results for
decision making.
Part B of Chapter 6 deals with Numerical Modeling. It covers
• a brief account of one dimension (1D), two dimensional (2D) and three dimensional (3D)
numerical models and their applications; • a brief account and comparison of two types of numerical modeling techniques, namely
finite difference method and finite element method in establishing model grid ;
• a brief account and the application of various coastal models namely wave , hydrodynamic,
sediment transport, water quality, profile evolution modules; • a general account of the modeling cycle which involves various processes namely model
acquisition, model set-up, model generation, model validation (calibration and
verification), and model production run; and a specific account of modeling cycle for the
hydrodynamic model; • a brief account on the use of numerical model outputs in analysis of various impacts, namely
coastal erosion, coastal flooding, rivermouth siltation, rivermouth flushing capacity,
deterioration of water quality and damage to the coastal habitat; • an account of hydraulic study and numerical modeling report structure and content as well
as a table summary of what constitutes a good or weak report.

Chapter 1 INTRODUCTION
___________________________________________________________________________________________
___________________________________________________________________________________________
1-10 March 2009
Part B gives coastal managers and young engineers a good account of what are involved in
numerical modeling for coastal hydraulic studies.
Chapter 7 covers hydraulic design for coastal shore protection projects and hydraulic design for rivermouth improvement.
Chapter 7 deliberates on three main criteria related to design considerations, namely structural
integrity, functional performance and constructability. Structural integrity often constitutes the most
important requirement to satisfy, in which the structure must be deigned to stand against the extreme conditions without sustaining significant damages. Design rationale shall be one which
results in a safe, efficient, reliable and cost effective project with appropriate consideration for environmental and social aspects. Before final design of the coastal shore protection project
materializes, various planning and design processes are envisaged, namely;
• Pre-feasibility stage: where system analysis is carried out with the outcome of a layout of
various alternatives. • Feasibility stage: where various options of solutions are considered. With the input of
hydraulic study results together with economic, environmental and social considerations, a
plan shall be developed to provide a conceptual design of the most suitable option of shore protection work inclusive of a preliminary design and preliminary cost estimates.
• Detailed design stage: With inputs of further hydraulic modeling results and considerations
of technical requirements, economic, social and environment aspects, final design shall be established.
This section lists the scope of data requirement and field measurement for hydraulic study. It discusses the application of wave models, hydrodynamic models and sediment transport models and
highlights the significance of the most important design criteria in the hydraulic design of shore protection works, which are the design water level and design wave parameters.
This chapter also provides a list of rivermouth improvement works/structures and their functions. It discusses
• the effect of tidal flow, river discharge, tide and wind generated waves and river geometry
in the hydraulic design of river mouth improvement works, the requirement of field data collection, the expected accuracy for various types of field data, and design criteria for
various types of river improvement works and navigation channels.
Chapter 8 covers the system of coastal bund, coastal outlet and coastal drainage which are designed and constructed to protect thousands of hectares of agricultural, industrial, commercial, and residential areas along the coast from flooding due to tidal wave inundation and high water level
which impedes the drainage of the coastal areas. It gives an account of the design consideration and the construction issues of the coastal bund and stressed the importance of bund monitoring
programme to avoid potential damaging failure of bunds. Tips in looking out for signs of seepage
and settlement of bunds are given as these are the tell tale signs of the impending bund breach. The importance and needs of bund maintenance which covers accessibility of bunds for inspection,
topping of bund level and stopping of seepage are highlighted. Various aspects of design of tidal gates for coastal outlets are discussed and the pitfalls during construction of tidal gates in the soft
marine clay condition are being highlighted. The need for monitoring of siltation of channels, timely and correct operation of the gate and regular maintenance of gates are discussed and stressed.
The incorporation of storage aspect and avoidance of over drainage in the design of the coastal drainage system are emphasized. The construction pitfalls in soft soil condition and the need for
regular and timely maintenance of drainage system are mentioned.

Chapter 1 INTRODUCTION
___________________________________________________________________________________________
___________________________________________________________________________________________
March 2009 1-11
Chapter 9 covers the topics on management of the coastal zone. It traces the starting of serious efforts in coastal zone management in Malaysia with the completion of the NCES in 1985 followed by
the setting up of a NCECC and the Coastal Division in the Department. It highlights the guidelines, policies, legislations and studies related to coastal zone management including Integrated Shoreline
Management Plans in Malaysia that have been issued and/ or published. It deliberates on the various factors and issues related to the coastal management, which include
• erosion and accretion,
• land reclamation,
• offshore sand mining,
• rivermouth sedimentation,
• marine water quality ,
• coastal habitat and wildlife,
• marine habitat,
• fishing and fisheries
• social, cultural and economic factors and
• planning and control
It gives a detailed account of Integrated Shoreline Management Plan (ISMP) covering:
• definition or demarcation of shorelines, sediment dells, and management units in ISMP
• shoreline management planning,
• baseline study,
• management objectives,
• development strategies,
• set back
• relation between ISMP and local plans.
Lastly the chapter discusses about preparation for future ISMP studies
Chapter 10 describes the legal and institutional aspects related to shoreline management. It looks into a range of existing enactments in the country which are applicable for land administration, town
planning and development but do not fully regulate the activities of the shoreline. The enactments include:
• National Land Code 1965, Act 625, National Land Code Act 2003,
• Town and Country Planning Act 1976 -Act 172,
• Local government Act 1976 – Act 171,
• Environment Quality Act – Act 127,
• Land Conservation Act 1960 – Act 385,
• Street, Drainage and Building Act 1974 – Act 133,
• Fisheries Act 1985 – Act 317,
• National Forestry Act 1984 – Act 313
• Protection of Wildlife Act 1972 – Act 76
• The Merchant Shipping Ordinance 1952, Act 70,
• Federation Port Rules 1953, Port Authorities Act 1963 – Act 488, Port Privatisation Act 1990
– Act 422,
• Continental Shelf Act 1972 – Act 83, and
• Other enactments as listed under section 10.2.14 of this Chapter.
Various government circulars and technical guidelines issued are listed and are generally limited to
the area of responsibility and jurisdiction of the particular Ministry or Department concerned and are not integrated with one another. They have no force of law and are of advisory capacity.
As coastal zone management may some times involve trans-boundary issues, this Chapter also looks
into International Convention initiatives which include:
• United Nations conference on Environment and Development (UNCED),
• United Nations Convention on the law of the Sea, 1982 (UNCLOS), and
• International Maritime Conventions

Chapter 1 INTRODUCTION
___________________________________________________________________________________________
___________________________________________________________________________________________
1-12 March 2009
Regarding the institutional framework for coastal zone management, the following aspects are
described and discussed:
• Land administration, • Town planning,
• National Physical Plan(NPP) 2005,
• Government administration system
• Institutions and universities, and
• Community participation
Chapter 11 highlights the topics on shoreline monitoring and maintenance. It deliberates the need for shoreline monitoring and elaborates on the timing and methodology of carrying out the beach profile survey and full scaled nearshore survey. It describes and discusses in details the datum for
survey, baseline, extent of survey and survey intervals. The shoreline survey shall also cover rivermouth survey and other supplementary data such as sediment grab sampling and coastal
features. It highlights the need for shoreline monitoring reporting system and the reports shall also
include: • information or records of storm events,
• indication of category of erosion.
It touches on digitization of shore profile data, its storage and formats for GIS and its analysis.
The other topic covered in this Chapter is the maintenance of revetment and vertical wall along the coastline, which include rock revetment, concrete revetment, concrete and gabion seawall and JPS
Blocks. It discusses the possible failure of these structures and the way to maintain these structures.
Chapter 12 attempts to provide an insight to the future development and requirements of some aspects in coastal management. It has become clearer that the need to conserve, protect, or restore coastal/marine environment is pressing. Therefore in formulating solutions for coastal protection
works or in planning and designing a coastal development project, a coastal engineer is no longer
confined to designing purely from engineering perspective. He will also be expected to incorporate elements in his design to cater for the needs of the sensitive coastal/marine ecosystem as well as
value-added features for the benefit of the coastal/marine environment. The approach in planning and designing coastal protection solutions and coastal development projects is therefore inter-
disciplinary which requires the input of other disciplines such as biologist, chemists etc. The design
also has to take a flexible approach to allow for continual modifications to the design to accommodate changes to the coastal environment.
The implementation of development projects/works, within a river basin, in the neighbouring states
as well as in the neighbouring countries would give rise to trans-boundary impacts between the river catchment and coastal waters, between states as well as between countries due to the adverse
impacts caused by such development projects/works to the other party. This Chapter offers to look
into the following issues as an attempt to mitigate trans-boundary conflicts: • Integrated shoreline management plan – Integrated river basin management linkages
(ISMP-IRBM linkages)
• Legislation covering water in the catchment , water in the river and water in the sea
• Regional environmental impact assessment and post project monitoring
• Decision support system
Monitoring of shoreline changes for the whole country has been limited by aerial photogrammetry
technology. However with the advent of the latest aerial survey technology in video-imaging
technique, satellite positioning and laser based surveying and mapping, shoreline monitoring programme of the Department is expected to take a new dimension to support effective coastal
management. The new technology will also enable a full scale national coastal area risk mapping and the need of which is becoming more apparent due to sea level rise and occurrence of tsunami in this
region. This Chapter elaborates on these latest technologies.

Chapter 1 INTRODUCTION
___________________________________________________________________________________________
___________________________________________________________________________________________
March 2009 1-13
1.5 TERMS AND CONCEPTS
As coastal engineering and coastal management covers a very wide area of subject matters, it is therefore necessary to define, within the ambit of the function, some of the terms and concepts and
responsibility of the Department mentioned in this manual.
Coastal Engineering Works: coastal engineering works covers • coastal erosion control works,
• rivermouth improvement works to mitigate siltation problems,
• coastal flooding and coastal drainage works to mitigate tidal flooding and siltation of drainage
outlets, and
• saline intrusion prevention works
Coastal Management: Coastal management involves managing of coastal erosion, coastal flooding, saline intrusion and/or rivermouth siltation problems in an integrated approach by taking into
consideration the interests/needs of other coastal users. In the process of instituting mitigating measures, both structural and non-structural, value-added measures may be incorporated in the
design to complement the needs of other coastal users.
Integrated Shoreline Management (ISM): A management tool with the approach in the planning,
design and implementation of coastal engineering works so as to minimize or avoid negative impacts
and , wherever possible, add value to the coastal environment. It also adopts an integrated approach
in coastal landuse planning and coastal development projects implementation to obviate adverse
impacts resulting in coastal erosion, accretion, rivermouth siltation and damages to coastal ecosystem
and to strike a balance between development and protection of environment in the coastal area. It
enables authorities to make an informed decision basing on a balance and merit basis. For purpose of
integrated shoreline management plan DID has adopted, in general, the definition of coastal areas as
the land and sea areas with landward limit of 1 km from the high watermark and seaward limit up to
the surf zone where coastal processes still have impacts on the coastline.
Integrated Coastal Zone Management (ICZM): Integrated coastal zone management is multipurpose oriented. It analyzes implication of development, conflicting uses, and interrelationships among
physical processes and human activities, and it promotes linkages and harmonization between sectoral coastal and ocean activities. It encompasses the land and sea areas with a landward limit of 5 km form high watermark and seaward limit up to the Exclusive Economic Zone.
REFERENCE [1] National Coastal Erosion Study,1985
[2] Shoreline Protection Manual (SPM) 1984 (updated as CEM 2006)
[3] National Rivermouth Study, JICA,1994
[4] Garispanduan JPS 1/97 – Guidelines On Erosion Control For Development Projects In The Coastal Zone, 1997
[5] Guidelines for Preparation of Coastal Engineering Hydraulic Study and Impact Evaluation (For
Hydraulic Studies Using Numerical Models), Fifth Edition , Dec 2001
[6] Warta Kerajaan Jil. 48 No. 13 Tambahan No. 65 Perundangan (A) ,24 Jun 2004, Akta Fungsi-Fungsi Menteri 1969, Perintah Menteri-Menteri Kerajaan Persekutuan (No.2) 2004
[7] General Administrative Circular No. 5 of 1987 – Prime Minister’s Department,1987
[8] Piawaian Perancangan JPBD 6/97 : Piawaian Perancangan – Garis Panduan Perancangan Pembangunan Di kawasan Pesisiran Pantai, 1997 (Planning Standards – Guidelines for Development Planning In Coastal Area); Department of Town
and Country Planning, 1997

Chapter 1 INTRODUCTION
___________________________________________________________________________________________
___________________________________________________________________________________________
1-14 March 2009
[9] Piawaian Perancangan JPBD 6/2000: Garis Panduan Dan Piawaian Perancangan Kawasan Pantai,2000 (Coastal Area Planning Guidelines and Standards) ; Department of Town and Country Planning, 2000
[10] Environmental Impact Assessment (EIA) : Procedure and Requirements in Malaysia
[11] Guidance Document for Sand Mining/Dredging Activities
[12] Guidance Document for Coastal and land Reclamation Activities
[13] Coastline Management Manual, New South Wales Government, September 1990, ISBN 0730575063

Chapter 1 INTRODUCTION
___________________________________________________________________________________________
___________________________________________________________________________________________ March 2009 1A-1
APPENDIX 1-A
National Coastal Erosion Study (NCES) Study Report
The NCES gives a comprehensive account of the coastline of Malaysia. It also introduces the topics on fundamentals of coastal engineering. In fact much of the information and knowledge in this
Report are still relevant although readers shall be aware that changes would have happened due to dynamic nature of the coastal processes and development in the coastal areas since this Report was
published more that 25 years ago. In addition to this, some of the data and information have been
updated when a more comprehensive study of Integrated Shoreline Management Plan (ISMP) was carried out for the specific coastline.
Chapter 5 of this manual on Malaysia Coastal Inventory only gives an abstract of some pertinent
information and knowledge in this Report. As there is still so much useful and relevant detail
information contained in this Report, copies of the NCES Report are made available at the DID main library as well as DID Coastal Division library.

Chapter 1 INTRODUCTION
___________________________________________________________________________________________
___________________________________________________________________________________________1A-2 March 2009
APPENDIX 1-B
Coastal Engineering Manual (CEM) , US Army Corps of Engineers, 2006
The following is quoted and rearranged from Part I of CEM:
The Coastal Engineering Manual (CEM) assembles in a single source the current state-of-the-art in coastal engineering to provide appropriate guidance for application of techniques and methods to the
solution of most coastal engineering works. The CEM provides a standard for the formulation,
design, and expected performance of a broad variety of coastal projects namely: navigation improvement at commercial harbors, harbor works for commercial fish handling and service facilities,
and recreational boating facilities; shore protection to mitigate the impacts of navigation projects; beach erosion control and hurricane or coastal storm protection to provide wave damage reduction
and flood protection to valuable costal urban, and tourist communities; environmental restoration to
provide a rational layout and proven approach to restoring the coastal and tidal environs.
The CEM is a much expanded replacement document for the Shore Protection Manual (1984), SPM, and several other U.S. Army Corps of Engineers (USACE) manuals. During the 1970s,’80s and ‘90s,
coastal engineering practice by the USACE and standard engineering for most coastal projects
throughout the world have been based, wholly or in part , on the SPM. Since the SPM was last updated in 1984, the coastal engineering field has witnessed many technical advances and increased
emphasis on computer modeling, environmental restoration, and project maintenance applications. The forerunner of the SPM, Shore Protection Planning and Design (TR-4), that was first published in 1973 and revised in 1975,1977, and 1984, presents the methodology that guided coastal structure and beach fill design for most of the projects to date, which includes harbor entrance channels,
navigation channels and structures, coastal storm damage reduction and shore protection projects.
The TR-4 emphasized designing coastal structures for stability against wave forces. The technology available at that time provided little means to address the functional performance of structures, nor
provide any guidance for predicting the performance of stability of a beach fill. Beach and dune design was only quantitatively addressed. Simple linear wave theory, static terrestrial structural
engineering principles, and trial-and error- experiential data were used to develop the empirical
relationships and rules of thumb presented in TR-4. Beach fills of this era were not usually designed to perform a particular function, but were typically placed as an added feature to increase the
sediment supply in the area of interest and to reduce wave energy striking the protective structures. The SPM was a significant advancement over TR-4 in that it used the results of physical model tests
to develop principles of wave-structure interaction, advancements in wave theory, and statistics and other data from various projects.
The SPM provided significantly more guidance in the positioning and intent of groins and breakwaters, predicting the flood control benefits of seawalls, and predicting the stability of beach
fills, the SPM and beach fill projects of the 1970s and early ‘80s were designed around the objective of beach erosion control and recreational use. The quantity of material to be placed was computed
based on the long-term recession rates, and the amount of surface area desired to support
recreational needs. The SPM presented guidance to assist in predicting maintenance nourishment quantities based on the grain size of the placed fill and its projected stability relative to the native
material grain size. Neither the SPM nor the projects constructed during this time concerned themselves with the performance of the beach fill template during a particular storm. At that time,
beach fills were not usually designed with a primary purpose of providing flood control benefits. The
SPM is commonly used as a university textbook and as a training aid for apprentice engineers. It is also a convenient reference for empirical procedures to compute a particular design parameter.
Approximately 30,000 have been sold through the U.S. Government Printing Office. Translations into other languages, including Chinese and Spanish, further attest to the SPM’s role as international
standard guidance for professional coastal engineers. Even though SPM is a coastal engineering reference, some aspects of navigation and harbor design are not included and its primary focus is
shore protection.

Chapter 1 INTRODUCTION
___________________________________________________________________________________________
___________________________________________________________________________________________ March 2009 1A-3
The advent of numerical models, reliable instrumentation techniques, and improved understanding of
the physical relationship which influence coastal processes lead to more sophisticated approaches in
shore protection design in the later 1980s and 90s Numerous guidance and analytical tools have been developed over the last 15+ years to assist the coastal engineers in predicting not only the
stability of a beach fill, but also its performance during extreme events. Cross-shore and alongshore change models, hydrodynamic hindcast data bases, and stochastic statistical approaches have been
developed to provide the practicing coastal engineer with procedures for quantifying the flood control benefits of a proposed design. The functional interaction of beach erosion control structures
(i.e. groins and breakwaters) can be analyzed with numerical simulation. Seawalls can be designed
not only for stability, but also physically modeled to predict various elements of the wave-structure interaction including scour and overtopping. A “modern” technical document incorporating all the
tools and procedures used to plan, design, construct, and maintain coastal projects are needed. To fulfill this need, the USACE tasked the Coastal Engineering research Center and, later, the Coastal
and Hydraulic Laboratory with producing a new reference, the CEM, incorporating established
science and much of this new technology. The CEM provides a much broader field of guidance and is designed for frequent updates. It is applicable to USACE Commands having civil works responsibility.
With the comprehensive scope and instructions of this manual, a broad spectrum of coastal engineers and scientists beyond the bounds of the USACE will find it useful also to them though
some sections are specific to the mission, authority, and operation of the USACE. Included in the CEM are the basic principles of coastal processes, methods for computing planning and design
parameters, and guidance on how to develop and conduct studies in support of coastal storm
damage reduction, shore protection, and navigation projects. Broader coverage of all aspects of coastal engineering are provided, including new sections on navigation and harbor design, dredging
and dredged material placement, structure repair and rehabilitation, wetland and low energy shore protection, cohesive shores, risk analysis, numerical simulation, the engineering process, and other
topics.
The CEM contains two major groups : science based and engineering based. The science-based
group includes Part II – Coastal hydrodynamics and Part III – Coastal Sediment processes and Part IV – Coastal Geology. These provide the scientific foundation on which the engineering-based parts
rely.
The engineering-based group includes Part V – Coastal Project Planning and Design and Part VI –
Design of Coastal Project Elements, which are oriented toward a project-type approach rather than the individual structure design approach.
Part II – Coastal Hydrodynamics covers the fundamental principles of linear and other wave theories,
including irregular waves and spectral analysis, ocean wave generation, wave transformation,
analysis of water variations including astronomical tides and storm surges.
Part III – Coastal Sediment processes includes topics on sediment properties, along shore and cross-shore transport, wind transport, cohesive sediment processes, and shelf transport.
Part IV – Coastal Geology covers terminology, geomorphology and morphodynamics.
Part V – Coastal Project Planning and Design discusses the planning and design process and site characterization, followed by the planning and design of shore protection projects ( including coastal
armoring, beach restoration, beach stabilization and coastal flood protection projects), beach fill, navigation projects ( including defining the fleet, entrance channel, inner harbor elements,
structures, sedimentation, maintenance, and management and environmental enhancement projects.
Part VI – Design of Coastal Project Elements discusses philosophy of coastal structure design, the
various types and function of coastal structures, site conditions, materials, design fundamentals, reliability, and the design of specific project elements (including a sloping-front structure, vertical-
front structure, beach fill, floating structure, pile structure, and a pipeline and outfall structure.

Chapter 1 INTRODUCTION
___________________________________________________________________________________________
___________________________________________________________________________________________1A-4 March 2009
It is recommended that CEM shall continue to be the main reference material on engineering for the
coastal engineers of the Department.
Hard copies of the CEM are available in the DID main library and DID Coastal Division library. Latest
revised digital copy of the CEM is accessible from the website of U.S. Army Corps of Engineers.

Chapter 1 INTRODUCTION
___________________________________________________________________________________________
___________________________________________________________________________________________ March 2009 1A-5
APPENDIX 1-C
Garis Panduan JPS 1/97 – Guidelines On Erosion Control For Development Projects
In The Coastal Zone
The guideline, Garis Panduan JPS 1/97, was approved by the Cabinet on 27 January 1997 and is aimed at ensuring the proper planning and sustainable development of the coastal zone. The guideline describes in detail the data requirements and the scope of impact evaluation for the
various types of development in the coastal zone namely shorefront development, backshore development, land reclamation and offshore sand mining and river mouth dredging. The guideline
also provides flow charts for the processing of development applications.
This guideline provides for coastal area development planning control to obviate the expensive
erosion control measures. It is widely accepted by the decision makers, planners, project proponents and consultants involved in development projects in the coastal zone as well as authorities in
approving development projects. Copies of this guideline are available in the DID main library and DID Coastal Division library. However, readers are required to incorporate other pertinent
requirements in this manual but not mentioned in this present edition of guideline in the planning of
the future development projects.
Table of Contents of this Guideline is reproduced as below:
Preface
1.0 Background
2.0 Guidelines on Erosion Control for Development Projects in the Coastal Zone
2.1 Introduction
2.2 Data Requirements
2.3 Types of Coastal Development 2.3.1 Shore Front Development Projects
2.3.2 Backshore Development Projects 2.3.3 Land Reclamation
2.3.4 Offshore Sand Mining And River Mouth Dredging
2.4 Conclusion
3.0 Appendix 1 : General Administrative Circular No 5 of 1987
Table of Summary of Guidelines on Erosion Control for Development Projects in the Coastal Zone
No Main Topic Information Required/ Remarks
1.0 Data Requirement
� Plans - Key Plan, Location Plan and Site Plan
� Design calculation and plan - Design by Professional Engineers
� Photographs - Photographs of existing condition including shoreline, neighboring buildings and structures.

Chapter 1 INTRODUCTION
___________________________________________________________________________________________
___________________________________________________________________________________________1A-6 March 2009
2.0 Types of Coastal Development
� Shore front development - Includes construction of ports, marinas,
breakwaters, groynes, jetties and etc.
- Some of the above activities are under the
purview of EIA Order 1987
- Use of computer modelling/ physical modelling as tool for complex projects.
� Back shore development - Includes construction of hotels, housing, agricultural and industrial
- Some of the above activities are under the purview EIA Order 1987.
- To follow setback limits guidelines
� Land reclamation - Hydraulic study/ modeling to study potential impact
- The activity is under the purview of EIA Order
1987 if reclamation area is 50 ha or more.
- To follow setback limits guidelines
- To provide Drainage Facilities for the
hinterland
� Offshore sand mining and river mouth Dredging
- Off shore mining activities change the
bathymetry of sea bed which can alter beach dynamic, waves, swell patterns and coastal
current circulation.
- Sand mining approvals are under the Federal
or States Jurisdiction
- This activity is under the purview of EIA Order
1987 if involving an area of 50 ha or more.
- Sand mining not permitted in nearshore area less than 1.5 Km from Mean Low Water Line or
10 m water depth from LAT whichever is further from the shore. If this is not possible,
further study need to be carried out to
ascertain the technical viability of the sand mining activities.
- River Mouth Dredging: sand mining at river
mouth or sand spit for commercial uses
without proper hydraulic study shall be prohibited.
Note: It is recommended that a new edition of this guideline be published to incorporate all the pertinent requirements set out in this manual and other related volumes of DID Manual.

Chapter 1 INTRODUCTION
___________________________________________________________________________________________
___________________________________________________________________________________________ March 2009 1A-7
APPENDIX 1-D
Guidelines For Preparation of Coastal Engineering Hydraulic Study and Impact Evaluation (For Hydraulic Studies using Numerical Models)
This guideline complements the Garispanduan JPS 1/97 on the aspect of coastal engineering hydraulic study and impact evaluation. It is also widely accepted by the practitioners and the
approving authorities. The Table of Contents of this guideline is reproduced as below:
1. Introduction
2. Components Of A Coastal Hydraulic model
3. Selection Of Model
4. Model Set Up
5. Data Requirement
• Types Of Data Required For Various Modules • Data Analysis
6. Model Calibration
7. Model Verification
8. Simulation Of Impacts and Presentations Of Results
• Nearshore Wave Module
• Hydrodynamic module
• Advection Dispersion And/Or water Quality Module
• Mud/Sand transport Module
• Sediment budget Analysis And Shoreline Evolution module
• Assessment Of Effects To The River Mouth
9. Types Of Impacts
• Coastal Erosion
• Adverse Impacts To The River Mouth Area
• Increase In Suspended Sediment Concentration
10. Assessment Of Impacts
• Impacts On Coral Reef And Sea Grass
• Impacts On Mangrove Forests
• Impacts On Public Beaches
• Impact On Fishing And Aquaculture Areas

Chapter 1 INTRODUCTION
___________________________________________________________________________________________
___________________________________________________________________________________________1A-8 March 2009
11. Identification Of Impacts and Proposed Measures To Minimise These Impacts
12. Monitoring
13. Preparation Of Coastal Engineering Hydraulic Report
14. Technical Presentation Of hydraulic Study
15. Submission of Data and Reports
Note: It is recommended that this guideline be updated to incorporate the relevant requirements set out in this manual but not already included in this guideline, and a new edition of this guideline be published.
.

Chapter 1 INTRODUCTION
___________________________________________________________________________________________
___________________________________________________________________________________________ March 2009 1A-9
APPENDIX 1-E
Government Gazette: Warta Kerajaan Jil. 48 No. 13 Tambahan No. 65
Perundangan (A)

Chapter 1 INTRODUCTION
___________________________________________________________________________________________
___________________________________________________________________________________________1A-10 March 2009

Chapter 1 INTRODUCTION
___________________________________________________________________________________________
___________________________________________________________________________________________ March 2009 1A-11

Chapter 1 INTRODUCTION
___________________________________________________________________________________________
___________________________________________________________________________________________1A-12 March 2009
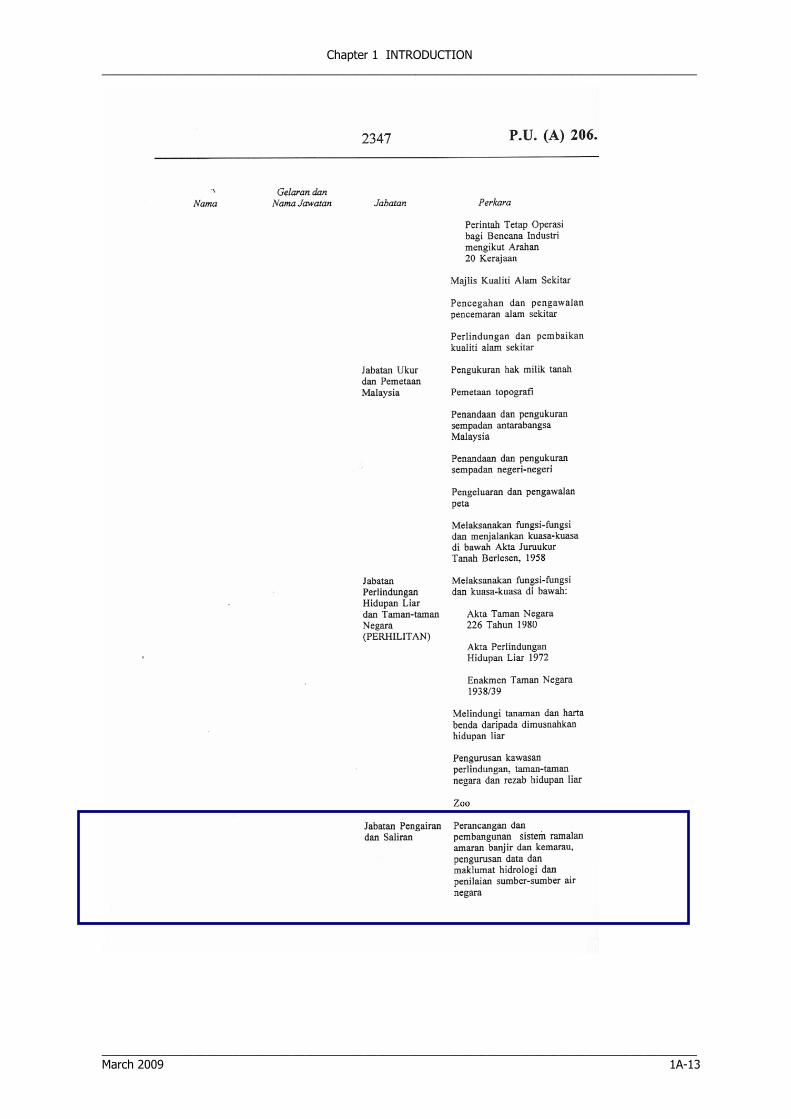
Chapter 1 INTRODUCTION
___________________________________________________________________________________________
___________________________________________________________________________________________ March 2009 1A-13
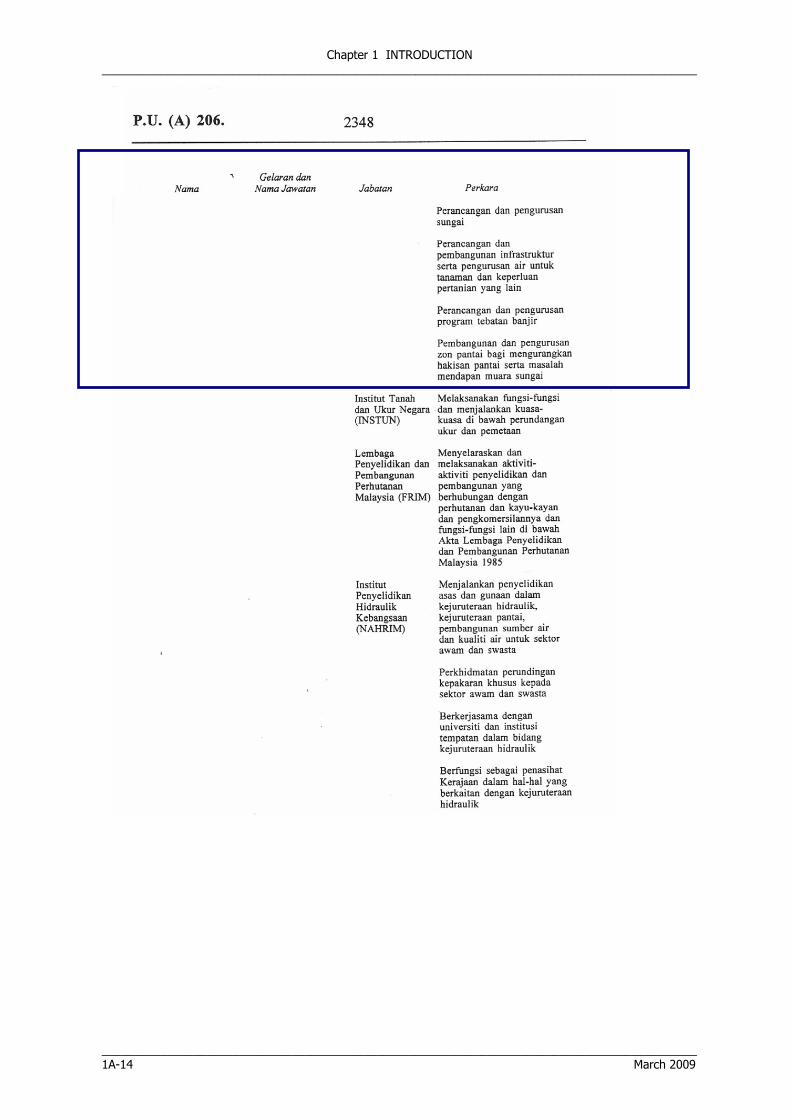
Chapter 1 INTRODUCTION
___________________________________________________________________________________________
___________________________________________________________________________________________1A-14 March 2009

Chapter 1 INTRODUCTION
___________________________________________________________________________________________
___________________________________________________________________________________________ March 2009 1A-15
APPENDIX 1-F
General Administrative Circular No. 5 of 1987 - Prime Minister’s Department -
Jabatan Perdana Menteri Malaysia,
Jalan Dato’ Onn,
50502 Kuala Lumpur
Telefon : 23221957
Kawat : PERDANA
Rujukan Kami : 0.93/380/7-1A/1
Tarikh : 10 September 1987
Ketua-Ketua Setiausaha Kementerian,
Y.B. Setiausaha-Setiausaha Kerajaan Negeri,
Ketua-Ketua Jabatan Persekutuan,
Ketua-Ketua Badan Berkanun Persekutuan.
SURAT PEKELILING AM BIL. 5 TAHUN 1987
PERATURAN MELULUS DAN/ATAU KELAKSANAKAN
PROJEK PEMBANGUNAN DI KAWASAN PANTAI NEGARA
1. TUJUAN
Surat Pekeliling ini bertujuan untuk menetap dan menjelaskan peraturan yang perlu dipatuhi oleh
setiap Kementerian, Jabatan dan badan Berkanun yang terlibat serta semua Kerajaan Negeri ketika
melulus dan/atau melaksanakan projek-projek pembangunan di kawasan pantai.
2. LATARBELAKANG
2.1 Sejak beberapa tahun kebelakangan ini, hakisan pantai telah menyebabkan kerosakan dan
kemusnahan kepada kawasan pertanian, hutan paya bakau, perumahan, rangkaian jalan
perhubungan dan pantai rekreasi. Daripada sepanjang 4,800 km panti di Negeri kita ini, lebih
kurang 1,300 km (atau 27%) sedang mengalami hakisan pantai. Anggaran kasar nilai harta
benda yang terancam oleh fenomena semulajadi ini adalah kira-kira RM200 juta untuk
tempoh lima (5) tahun akan datang.
3. KAWALAN HAKISAN PANTAI NEGARA
3.1 Pengawalan ke atas kesan hakisan pantai Negara sekarang ini telah menjadi satu keperluan
dari segi ekonomi dan sosial. Untuk tujuan ini, Kerajaan akan melaksanakan strategi
pengawalan hakisan pantai yang berbentuk dua peringkat. Sebagai langkah jangka pendek,
harta benda dan kemudahan awam di kawasan kritikal yang terancam oleh fenomena ini akan
dilindungi, sekiranya didapati ekonomikal berbuat demikian. Langkah jangka panjang pula,
adalah untuk mengawal kesan hakisan pantai melalui penyelarasan perancangan dan
pengawalan di kawasan pantai secara bersepadu.
Chapter 1 INTRODUCTION
___________________________________________________________________________________________
___________________________________________________________________________________________1A-16 March 2009
4. PELAKSANAN STRATEGI
4.1 Untuk melaksanakan strategi ini kerajaan telah, antara lain mengujudkan dua institusi
kawalan iaitu majlis Kawalan Hakisan Pantai Negara (MKHPN) dan Pusat Teknikal
Kejuruteraan Pantai (PTKP).
4.2 Majlis Kawalan Hakisan Pantai Negara (MKHPN) adalah merupakan badan penasihat
mengenai kawalan hakisan pantai dan fungsi utamanya ialah untuk memperakukan kepada
Kerajaan mengenai program, pembiayaan dan penyelarasan tindakan, bukan sahaja di antara
Kerajaan Persekutuan dan Negeri tetapi juga dengan sektor swasta. Pusat Teknikal
Kejuruteraan Pantai (PTKP) pula telah ditubuhkan di Jabatan Parit dan Taliair Malaysia dan
bertanggungjawab untuk melaksanakan kajian teknikal dan memberi khidmat nasihat hakisan
pantai.
4.3 Kajian Hakisan Pantai Negara yang telah dijalankan baru-baru ini menunjukkan bahawa
kebanyakan kemusnahan yang berlaku adalah kerana pembangunan telah dilaksanakan di
kawasan yang berpotensi untuk terhakis, di mana kerja-kerja kejuruteraan untuk pengawalan
hakisan memerlukan perbelanjaan yang tinggi. Kemusnahan berlaku juga akibat pembinaan
struktur-struktur yang tidak dirancang di sepanjang pantai serta aktiviti-aktiviti di luar pantai
yang telah menyebabkan berlakunya hakisan ataupun memburukkan lagi keadaan hakisan.
4.4 Sebagai langkah pertama ke arah mengurangkan kesan hakisan pantai dan kos
pencegahannya, perlu dipastikan supaya segala usaha pembangunan di kawasan pantai yang
dilaksanakan di masa hadapan hendaklah mengambil kira kemungkinan risiko hakisan serta
kesan-kesan negatif lain yang mungkin timbul. Demikian juga dengan pembinaan struktur-
struktur di sepanjang pantai seperti jeti, pelabuhan, tembok penahan dan lain-lain seta
aktiviti-aktiviti di lautan berhampiran seperti pengambilan pasir, pembinaan pelantar
minyak, pemasangan paip/kabel dasar laut dan lain-lain hendaklah pada masa akan datang
dirancang supaya tidak akan menyebabkan atau memburukkan lagi hakisan pantai (contoh
struktur/aktiviti pantai yang mungkin dibina/dijalankan adalah seperti di Lampiran A).
Sehubungan dengan ini setiap Kementerian, Jabatan dan Badan Berkanun yang terlibat serta
semua Kerajaan Negeri adalah dinasihatkan supaya merujukkan segala cadangan
pembangunan , aktiviti dan pembinaan struktur di kawasan pantai termasuk di lautan yang
berhampiran, untuk ulasan kepada:
Ketua Pengarah
Jabatan Parit dan Taliair, Malaysia
Jalan Mahameru, 50626 Kuala Lumpur
(u/p : Pengarah
Pusat Teknikal Kejuruteraan Pantai)
5. TANGGUNGJAWAB KETUA JABATAN
5.1 Dengan berkuatkuasanya Surat Pekeliling ini, Ketua-Ketua Setiausaha Kementerian, Ketua-
Ketua Jabatan, Ketua-Ketua Badan Berkanun yang terlibat serta semua Setiausaha-Setiausaha
Kerajaan Negeri adalah bertanggungjawab melaksanakan peraturan yang termaktub dalam
Surat Pekeliling ini. Seberang kemusykilan yang timbul dari Surat Pekeliling ini hendaklah
dirujukkan kepada:
Ketua Pengarah,
Unit Penyelarasan Perlaksanaan, Jabatan Perdana Menteri
Jalan Dato’ Onn, 50502 Kuala Lumpur

Chapter 1 INTRODUCTION
___________________________________________________________________________________________
___________________________________________________________________________________________ March 2009 1A-17
6. TARIKH KUATKUASA
6.1 Tarikh kuatkuasa peraturan ini adalah dari tarikh Surat Pekeliling ini.
“Berkhidmat Untuk Negara”
( t.t.)
( Tan Sri Dato’ Sallehuddin Bin Mohamed )
Ketua Setiausaha Negara
Note:
Paragraph 4.4 line 16 should be changed to
Ketua Pengarah
Jabatan Pengairan dan Saliran, Malaysia
Jalan Sultan Salahuddin
50626 Kuala Lumpur
( u/p : Pengarah,
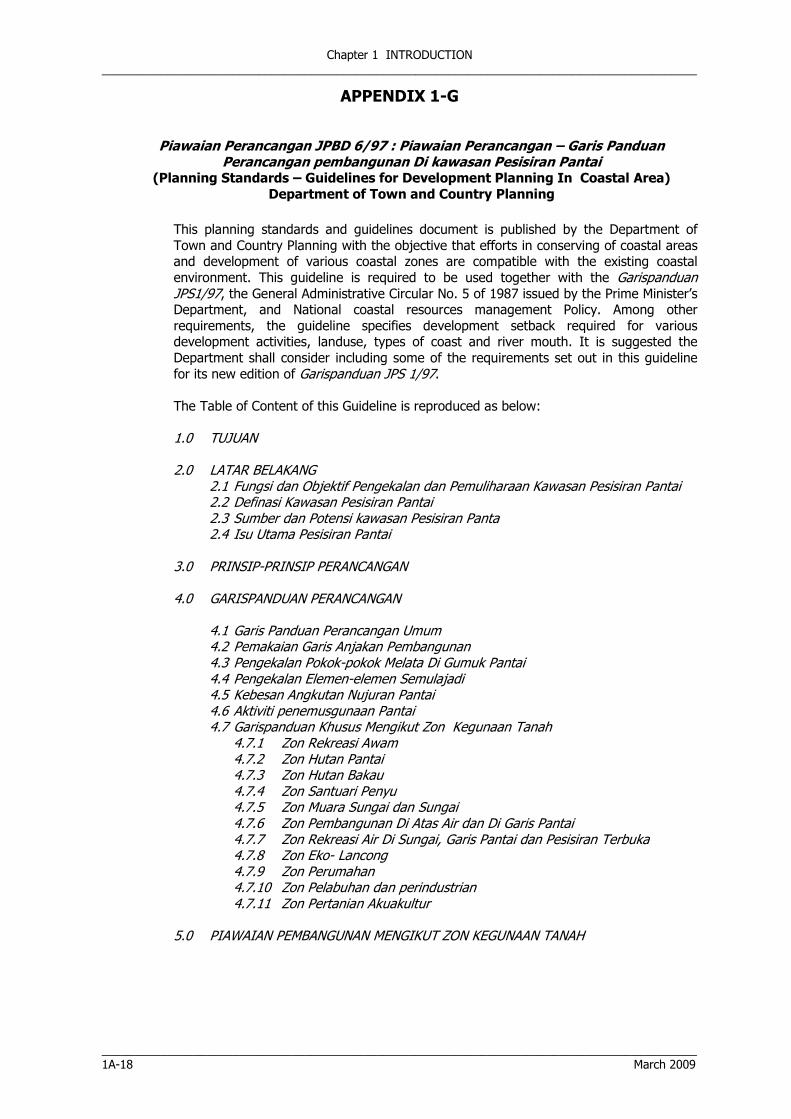
Chapter 1 INTRODUCTION
___________________________________________________________________________________________
___________________________________________________________________________________________1A-18 March 2009
APPENDIX 1-G
Piawaian Perancangan JPBD 6/97 : Piawaian Perancangan – Garis Panduan
Perancangan pembangunan Di kawasan Pesisiran Pantai (Planning Standards – Guidelines for Development Planning In Coastal Area)
Department of Town and Country Planning
This planning standards and guidelines document is published by the Department of
Town and Country Planning with the objective that efforts in conserving of coastal areas and development of various coastal zones are compatible with the existing coastal
environment. This guideline is required to be used together with the Garispanduan JPS1/97, the General Administrative Circular No. 5 of 1987 issued by the Prime Minister’s Department, and National coastal resources management Policy. Among other
requirements, the guideline specifies development setback required for various development activities, landuse, types of coast and river mouth. It is suggested the
Department shall consider including some of the requirements set out in this guideline
for its new edition of Garispanduan JPS 1/97.
The Table of Content of this Guideline is reproduced as below:
1.0 TUJUAN
2.0 LATAR BELAKANG 2.1 Fungsi dan Objektif Pengekalan dan Pemuliharaan Kawasan Pesisiran Pantai 2.2 Definasi Kawasan Pesisiran Pantai 2.3 Sumber dan Potensi kawasan Pesisiran Panta 2.4 Isu Utama Pesisiran Pantai
3.0 PRINSIP-PRINSIP PERANCANGAN
4.0 GARISPANDUAN PERANCANGAN
4.1 Garis Panduan Perancangan Umum 4.2 Pemakaian Garis Anjakan Pembangunan 4.3 Pengekalan Pokok-pokok Melata Di Gumuk Pantai 4.4 Pengekalan Elemen-elemen Semulajadi 4.5 Kebesan Angkutan Nujuran Pantai 4.6 Aktiviti penemusgunaan Pantai 4.7 Garispanduan Khusus Mengikut Zon Kegunaan Tanah
4.7.1 Zon Rekreasi Awam 4.7.2 Zon Hutan Pantai 4.7.3 Zon Hutan Bakau 4.7.4 Zon Santuari Penyu 4.7.5 Zon Muara Sungai dan Sungai 4.7.6 Zon Pembangunan Di Atas Air dan Di Garis Pantai 4.7.7 Zon Rekreasi Air Di Sungai, Garis Pantai dan Pesisiran Terbuka 4.7.8 Zon Eko- Lancong 4.7.9 Zon Perumahan 4.7.10 Zon Pelabuhan dan perindustrian 4.7.11 Zon Pertanian Akuakultur
5.0 PIAWAIAN PEMBANGUNAN MENGIKUT ZON KEGUNAAN TANAH

Chapter 1 INTRODUCTION
___________________________________________________________________________________________
___________________________________________________________________________________________ March 2009 1A-19
SENARAI JADUAL Jadual 1 : Ringkasan Garis Anjakan Pembangunan Jadual 2 : Piawaian Perancangan Pembangunan Mengikut Zon
Kegunaan Tanah SENARAI RAJAH Rajah 1 : Definisi kawasan Pesisiran Pantai Rajah 2 : Cadangan pembangunan Zon Pelancongan yang Mempunyai Jalan Perkhidmatan di Rizab Pantai Rajah 3 : Cadangan Pembangunan Zon Pelancongan di Kawasan Pesisiran Pantai yang Sempit

Chapter 1 INTRODUCTION
___________________________________________________________________________________________
___________________________________________________________________________________________1A-20 March 2009
APPENDIX 1-H
Piawaian Perancangan JPBD 6/2000: Garis Panduan Dan Piawaian Perancangan Kawasan Pantai
(Coastal Area Planning Guidelines and Standards)
Department of Town and Country Planning
This planning standards and guidelines is an extension of the Piawaian Perancangan JPBD 6/97 mentioned in Appendix 1-G. In this document the approval of DID is required regarding coastal hydraulic studies for specified development activities which include
land reclamation, dredging, outfall to the sea, breakwater, seawall, jetty, marina, power
station, etc.
The Table of Contents of this guideline is reproduced as below :
1.0 TUJUAN 2.0 LATAR BELAKANG 3.0 DEFINISI KAWASAN PESISIRAN PANTAI 4.0 CIRI-CIRI ZON PERSISIRAN PANTAI 5.0 PRISIP PERANCANGAN
5.1 Ihsan 5.2 Keselamatan 5.3 Kebersihan dan Keindahan 5.4 Pemeliharaan Alam Sekitar dan Pemeliharaan Sumber Asli Yang Mampan
6.0 DASAR PELAKSANAN 7.0 GARIS PANDUAN UMUM
7.1 Pembangunan Gunatanah 7.2 Pembangunan Fizikal 7.3 Kawalan Biologi 7.4 Pembangunan Socio-Ekonomi
8.0 GARIS PANDUAN KHUSUS 9.0 PIAWAIAN PERANCANGAN PEMBANGUNAN KAWASAN PESISIRAN PANTAI SENARAI JADUAL Jadual 6.1 : Syarat-Syarat Kelulusan Pembangunan Dan Agensi Yang Meluluskan
Jadual 8.1 : Pengkelasan Mengikut Jenis Pantai Dan Zon Pembangunan
Jadual 8.2 : Garis Panduan Pembangunan Pesisiran Pantai
Jadual 9.1 : Piawaian Pembangunan Zon Rekreasi Awam
Jadual 9.2 : Piawaian Pembangunan Zon Hutan Pantai

Chapter 1 INTRODUCTION
___________________________________________________________________________________________
___________________________________________________________________________________________ March 2009 1A-21
Jadual 9.3 : Piawaian Pembangunan Zon Hutan bakau
Jadual 9.4 : Piawaian Pembangunan Zon Santuari Penyu
Jadual 9.5 : Piawaian Pembangunan Zon Muara Sungai Dan Sungai
Jadual 9.6 : Piawaian Pembangunan Zon Di Atas Air Dan Di Garis Pantai
Jadual 9.7 : Piawaian Pembangunan Zon Rekreasi Air Di Sungai, Garis Pantai Dan
Pesisiran Terbuka
Jadual 9.8 : Piawaian Pembangunan Zon Ekolancong
Jadual 9.9 : Piawaian Pembangunan Zon Perumahan
Jadual 9.10 : Piawaian Pembangunan Zon Perindustrian
Jadual 9.11 : Piawaian Pembangunan Zon Akuakultur
Jadual 9.12 : Piawaian Pembangunan Bagi Pantai Pasir
Jadual 9.13 : Piawaian Pembangunan Bagi Pantai Lumpur
Jadual 9.14: Piawaian Pembangunan Untuk Pantai Berbatu SENARAI RAJAH Rajah 3.1 : Definisi Kawasan Pesisiran Pantai
(Note: JPBD is in the process of publishing a document entitled “Garispanduan Pemuliharaan dan Pembangunan Kawasan Sensitif Alam Sekitar (KSAS) dan Kawasan Sekitarnya” which includes development guidelines for sensitive areas in the coastal areas and on islands).

Chapter 1 INTRODUCTION
___________________________________________________________________________________________
___________________________________________________________________________________________1A-22 March 2009
APPENDIX 1-I
- Environmental Impact Assessment (EIA) : Procedure and Requirements
in Malaysia
- Environmental Impact Assessment (EIA) Guidance Document: For Coastal And Land Reclamation Activities
- Environmental Impact Assessment (EIA) Guidance Document: For Sand Mining / Dredging Activities
Department of Environment
The “Environmental Impact Assessment (EIA): Procedure and Requirements in Malaysia” summarizes the EIA procedure as an aid to environmental planning of new projects or
the expansion of the existing ones. It contains information on the EIA process which
requires proponents of particular projects, classified as “prescribed activities” to submit EIA to the Director General of Environment Department before the project is approved
by the relevant approval authority. Among the prescribed activities in coastal zone development are:
• coastal reclamation
• sand dredging
• construction of off-shore and onshore pipelines
• construction of ports
• drainage of wetland
• conversion of mangrove swamps for industrial
• housing or agriculture use
• clearing of mangrove swamps on islands adjacent to national marine parks
• shipyards
• construction of ports
• port expansion
• construction of coastal resort facilities or hotels and
• development of tourist or recreational facilities on islands in surrounding waters
which are gazetted as national marine parks.
Two further guidance documents published by the Department of Environment: one for
sand mining/dredging activities and the other for coastal and reclamation activities. These guidance documents are prepared to facilitate project proponents and
environmental consultants in preparing the EIA reports for any proposed sand mining/ dredging activities and any proposed coastal and land reclamation projects. These two
documents complement Garis Panduan JPS 1/97 and Guidelines for Preparation of Coastal Engineering Hydraulic study and Impact Evaluation, December 2001.
Copies of these three documents are available in the DID main library and DID Coastal Division library.

Chapter 2 FUNDAMENTALS OF COASTAL HYDRAULICS AND ENVIRONMENT
___________________________________________________________________________________________
____________________________________________________________________________________________
March 2009
CHAPTER 2
FUNDAMENTALS OF COASTAL HYDRAULICS AND ENVIRONMENT


Chapter 2 FUNDAMENTALS OF COASTAL HYDRAULICS AND ENVIRONMENT
___________________________________________________________________________________________
____________________________________________________________________________________________
March 2009 2-i
Table of Contents
Table of Contents ....................................................................................................................... 2-i
List of Tables ...........................................................................................................................2-iii
List of Figures ...........................................................................................................................2-iii
2.1 INTRODUCTION............................................................................................................... 2-1
2.2 WAVES ............................................................................................................................ 2-1
2.2.1 General About Types Of Waves ................................................................................ 2-1
2.2.2 Small Amplitude Wave Theory.................................................................................. 2-2
2.2.3 Wave Generation..................................................................................................... 2-2
2.2.4 Wave Transformation .............................................................................................. 2-4
2.2.4.1 Refraction ................................................................................................ 2-5
2.2.4.2 Diffraction................................................................................................ 2-6
2.2.4.3 Reflection................................................................................................. 2-6
2.2.4.4 Breaking .................................................................................................. 2-7
2.2.4.5 Wave Decay............................................................................................. 2-8
2.3 CURRENTS....................................................................................................................... 2-9
2.3.1 Tidal Wave Currents ................................................................................................ 2-9
2.3.2 Wave Driven Currents.............................................................................................. 2-9
2.3.3 Wind Generated Currents....................................................................................... 2-10
2.3.4 Storm Surge Currents ............................................................................................ 2-10
2.3.5 Oceanic Currents ................................................................................................... 2-10
2.4 TIDES AND OTHER WATER LEVEL FLUCTUATIONS .......................................................... 2-11
2.4.1 Tide...................................................................................................................... 2-11
2.4.2 Storm Surge.......................................................................................................... 2-12
2.4.3 Wind Setup ........................................................................................................... 2-13
2.4.4 Wave Setup .......................................................................................................... 2-13
2.4.5 Wave Runup ......................................................................................................... 2-13
2.4.6 Tsunami................................................................................................................ 2-14

Chapter 2 FUNDAMENTALS OF COASTAL HYDRAULICS AND ENVIRONMENT
___________________________________________________________________________________________
____________________________________________________________________________________________
2-ii March 2009
2.5 SEDIMENT TRANSPORT PROCESSES ............................................................................... 2-15
2.5.1 Introduction .......................................................................................................... 2-15
2.5.2 Sand Transport ..................................................................................................... 2-15
2.5.3 Mud Transport ...................................................................................................... 2-16
2.6 COASTAL CLASSIFICATION............................................................................................. 2-17
2.6.1 Classification of Coastlines ..................................................................................... 2-17
2.6.2 Coastal Features.................................................................................................... 2-17
2.6.2.1 Headlands and Bays ............................................................................... 2-17
2.6.2.2 Sand Spits.............................................................................................. 2-18
2.6.2.3 Barrier Islands........................................................................................ 2-19
2.6.2.4 Lagoons................................................................................................. 2-19
2.6.2.5 Delta ..................................................................................................... 2-20
2.6.2.6 River Mouth ........................................................................................... 2-20
2.6.2.7 Tidal Inlet .............................................................................................. 2-20
2.6.2.8 Reefs (Rocky and Coral Reefs) ................................................................ 2-21
2.7 CAUSES OF COASTAL EROSION ...................................................................................... 2-21
2.7.1 Natural Causes ...................................................................................................... 2-22
2.7.2 Man-Made Interventions ........................................................................................ 2-22
2.7.2.1 Trenches Or Navigation Channels ............................................................ 2-23
2.7.2.2 Ports and Harbours................................................................................. 2-23
2.7.2.3 Coastal Protection .................................................................................. 2-23
2.7.2.4 Reclamation ........................................................................................... 2-23
2.7.2.5 Artificial Islands...................................................................................... 2-23
2.7.2.6 Artificial Lagoons .................................................................................... 2-24
REFERENCE ............................................................................................................................ 2-25
APPENDIX 2-A : TSUNAMI ....................................................................................................... 2A-1

Chapter 2 FUNDAMENTALS OF COASTAL HYDRAULICS AND ENVIRONMENT
___________________________________________________________________________________________
____________________________________________________________________________________________
March 2009 2-iii
List of Tables
Table Description Page
2.1 Relationship of Wave Factors to Runup 2-13
List of Figures
Figure Description Page
2.1 Wave Features 2-1
2.2 Wave Hindcasting Nomograph 2-3
2.3(a) Wind Speed on the 28th ofSeptember 2008 2-4
2.3(b) Wave Height on the 28th of September 2008 2-4
2.4 Computer Model Of Waves Entering A Bay 2-5
2.5 Waves Refracting Into A Bay 2-5
2.6 Wave Diffraction Behind Breakwater 2-6
2.7 Waves Diffracting Around Artificial Island 2-6
2.8 Waves Reflected off Seawall 2-7
2.9 Waves Breaking On The Coast 2-7
2.10 Waves reducing in height from the eye of Hurricane Gustav 2-8
2.11 Tide Level w.r.t. Mean Sea Level 2-9
2.12 Waves Breaking Along The Coast Causing Littoral Currents 2-9
2.13 Surface Currents In South China Sea In January 2-10
2.14 South China Sea Ocean Currents (From US Army) 2-11
2.15 Cotidal Plots Of South China Sea 2-12
2.16 Flooding in Galverston caused by Hurricane Greg 2-12
2.17 Change in Water Level as Wave approaches the Shore 2-13
2.18 Water level fluctuations caused by the earthquake off Sumatra 2-14
2.19 Typical Beach Profile 2-16
2.20 Bay and Headland 2-18
2.21 Typical Sandspit 2-18
2.22 Barrier Island Formed At The Tip Of A Sandspit 2-19
2.23 Setiu Lagoon 2-19
2.24 Kuala Rompin 2-20
2.25 Tidal Inlet at Langkawi 2-21
2.26 Corals Around Sipadan, Sabah 2-21
2.27 Artificial Island, Sentosa, Singapore 2-24
2.28 Artificial Lagoon in Port Dickson 2-24

Chapter 2 FUNDAMENTALS OF COASTAL HYDRAULICS AND ENVIRONMENT
___________________________________________________________________________________________
____________________________________________________________________________________________
2-iv March 2009
(This page is deliberately left blank)

Chapter 2 FUNDAMENTALS OF COASTAL HYDRAULICS AND ENVIRONMENT
___________________________________________________________________________________________
____________________________________________________________________________________________
March 2009 2-1
2 FUNDAMENTALS OF COASTAL HYDRAULICS & ENVIRONMENT
2.1 INTRODUCTION
An understanding of the fundamentals of coastal hydraulics is required to assist in making the appropriate decisions in coastal management. Coastal hydraulics is the driver of the processes along
the coastline. Thus, understanding the fundamentals is essential in understanding the processes.
It is not the intention of this manual to go deeply into the derivation of the governing equations of
coastal hydraulics. The aim of this chapter is to provide an overview of the fundamentals to the coastal manager.
2.2 WAVES
2.2.1 General About Types Of Waves
Waves in the ocean are like all waves, i.e. energy moving through a media. In the case of water waves, the energy is moving through water. This transmission of energy is caused by the movement
of water particles in the water body. In actual fact the water body does not move although we may see the effect of the energy movement in the form of wave crests and troughs moving at the surface
of the water. It is only when the wave breaks onshore or on a structure do we see movement of the water body as the wave energy is transformed into the kinetic energy of the movement of the water
body.
A typical wave is shown in the figure below. The features of the wave are as defined in the figure.
Figure 2.1 Wave Features
Water waves are classified mainly by the wave period. The wave period can best be described as the time it takes for wave to move past a certain point. For an observer at sea, this will be the time it
takes for one wave, from crest to crest to pass a point. Depending on the period, waves can be ripples with very short period, or storm waves, which have periods of 2 to 5 seconds, or swells which
can have periods beyond 6 seconds. Tsunamis can have periods between 10 to 30 minutes, while astronomical tides are waves with periods of around 12 or 24 hours. The speed of the wave, or its
celerity,C, (as ocean engineers refer to it), is the distance traveled by a crest per unit time, or
C=L/T.............................................................................. (2.1)
Sea Bed
d = Depth
Trough
Still Water Level
Crest
a = Amplitude
H = Height
L = Length

Chapter 2 FUNDAMENTALS OF COASTAL HYDRAULICS AND ENVIRONMENT
___________________________________________________________________________________________
____________________________________________________________________________________________
2-2 March 2009
2.2.2 Small Amplitude Wave Theory
The small amplitude wave theory developed by Airy in 1845 is the simplest and most useful theory to
describe wave propagation in water. It provides equations for most of the kinematic and dynamic properties of surface gravity waves. It is also called the linear wave theory.
It is not within the scope of this manual to detail the derivation of the formula for the small amplitude wave theory. The small amplitude theory requires that both a/L and a/d be small. Using
this assumption and solving the equation of motion for small amplitude waves yields the following expression for the wave celerity:
C = ((gL/(2π))tanh(2πd/L))0.5............................................ (2.2) Where L is the wavelength, d is water depth and C is the wave celerity. Celerity is L/T, where T is
the wave period.
It can be seen from the above formulae that C is independent of wave height and is a function of
both the wave length(L) and water’s relative depth d/L.
It is important to note the following.
(a) Relative depth, i.e d/L is an important factor in wave transformation. (b) In deep water, i.e. d/L > 0.5, depth is not an important factor of the wavelength.
(c) In transitional and shallow waters, i.e. d/L < 0.5, depth is an important factor of the
wavelength. (d) As the wave approaches shallow waters, i.e. d/L < 0.05 the wavelength reduces rapidly.
Since the hyperbolic tangent function (tanh) has simple limiting forms for both small and large values
of its argument, it is useful to classify waves according to the relative depth as follows:
Relative Depth
d/L
Wave Type
Wave Celerity Wave length
d/L<0.5 Shallow water wave (gd)0.5
T(gd)0.5
.05<d/L<.50 Intermediate depth wave ((gL/(2π))tanh(2πd/L))0.5
(gT2/2π)tanh(2πd/L)
d/l>0.50 Deep water wave (gL/(2π))0.5
gT2/2π
In deep water the celerity is independent of water depth as the waves do not interact with the
bottom. However the celerity depends on the wave length. Shallow water surface waves, on the other hand, do feel the bottom, and slow down as the square root of the depth and their speed is
not a function of the wave length.
2.2.3 Wave Generation
There are various factors that cause wave generation. The most common factor is wind. Wind
generated waves accounts for most of the waves that occur in the sea. However, earthquakes can cause tsunamis, while the astronomical bodies generate the tides.
Since wind generated waves is most common of all the waves and is the main factor in coastal
processes, it is important to understand how these waves are generated. As wind blows over the
water surface, the friction between the air-sea interface allows some transfer of the kinetic energy of the wind into the water body. The wave height is relative to the amount of energy being
transferred. Therefore, the stronger the wind, the more energy will be transferred, resulting in higher wave heights. The longer the duration the wind blows, the more energy will be transferred,

Chapter 2 FUNDAMENTALS OF COASTAL HYDRAULICS AND ENVIRONMENT
___________________________________________________________________________________________
____________________________________________________________________________________________
March 2009 2-3
therefore the higher will be wave height. Similarly, the further the length over the surface of the sea
that the wind blows, i.e. the fetch length, the greater will be the amount of energy being transferred,
meaning larger wave heights.
There is a state of sea when the rate of energy transfer is constant for a certain wind speed. This state is called the Fully Arisen Sea. When the sea has reached this state, the wind may be blowing
for a longer duration or over a longer fetch length but the rate of energy transfer shall remain constant. At this constant rate of energy transfer, there will be certain wave significant wave height
and corresponding wave period for a certain wind speed.
A technique has been developed to determine the wave height and period based on the various wind
speed, duration and fetch length. This method is called wave hindcasting. This method has been summarised in a graphical form by the US Army Corps of Engineers (Figure 2.2). Although there are
now many computer programs that have been developed for hindcasting, this method still remains
popular for engineers working in the field.
Figure 2.2 Wind Hindcasting Nomograph (from US Army Corps of Engineers)
The figures 2.3 (a) and (b) below show the relationship between wind speed and wave height. The
figures show the wave heights and wind speeds for a typhoon event off South China Sea.
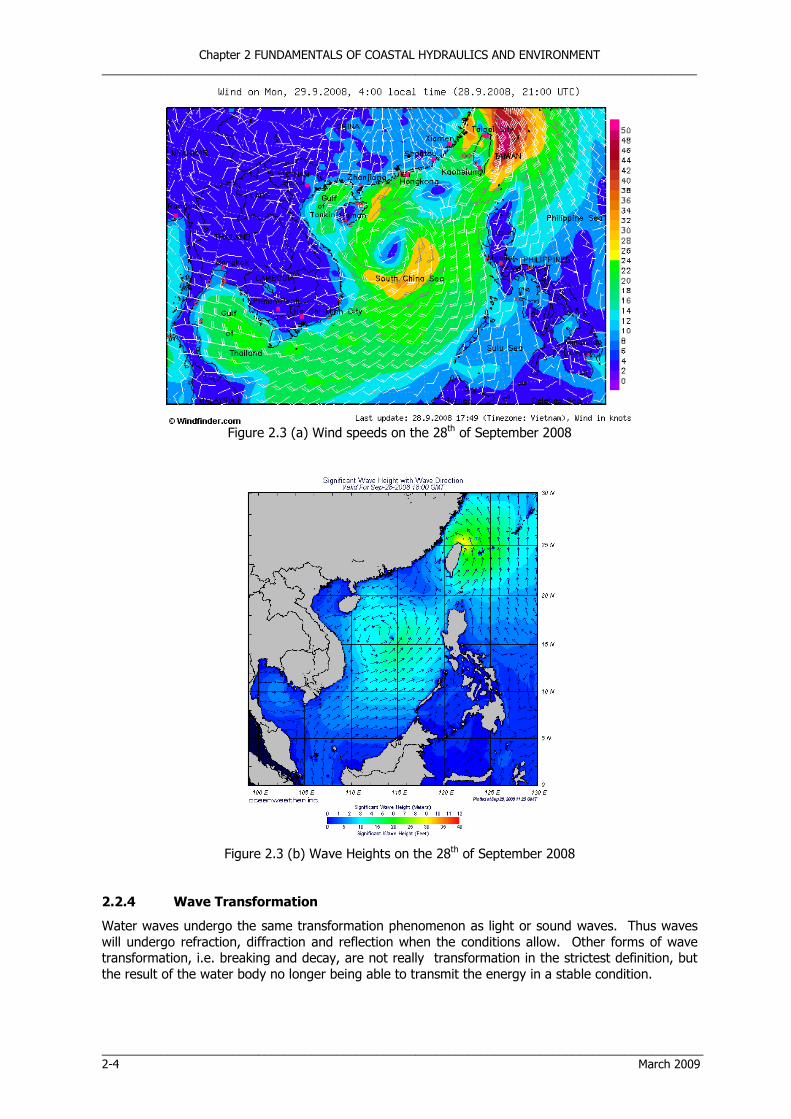
Chapter 2 FUNDAMENTALS OF COASTAL HYDRAULICS AND ENVIRONMENT
___________________________________________________________________________________________
____________________________________________________________________________________________
2-4 March 2009
Figure 2.3 (a) Wind speeds on the 28th of September 2008
Figure 2.3 (b) Wave Heights on the 28th of September 2008
2.2.4 Wave Transformation
Water waves undergo the same transformation phenomenon as light or sound waves. Thus waves
will undergo refraction, diffraction and reflection when the conditions allow. Other forms of wave transformation, i.e. breaking and decay, are not really transformation in the strictest definition, but
the result of the water body no longer being able to transmit the energy in a stable condition.
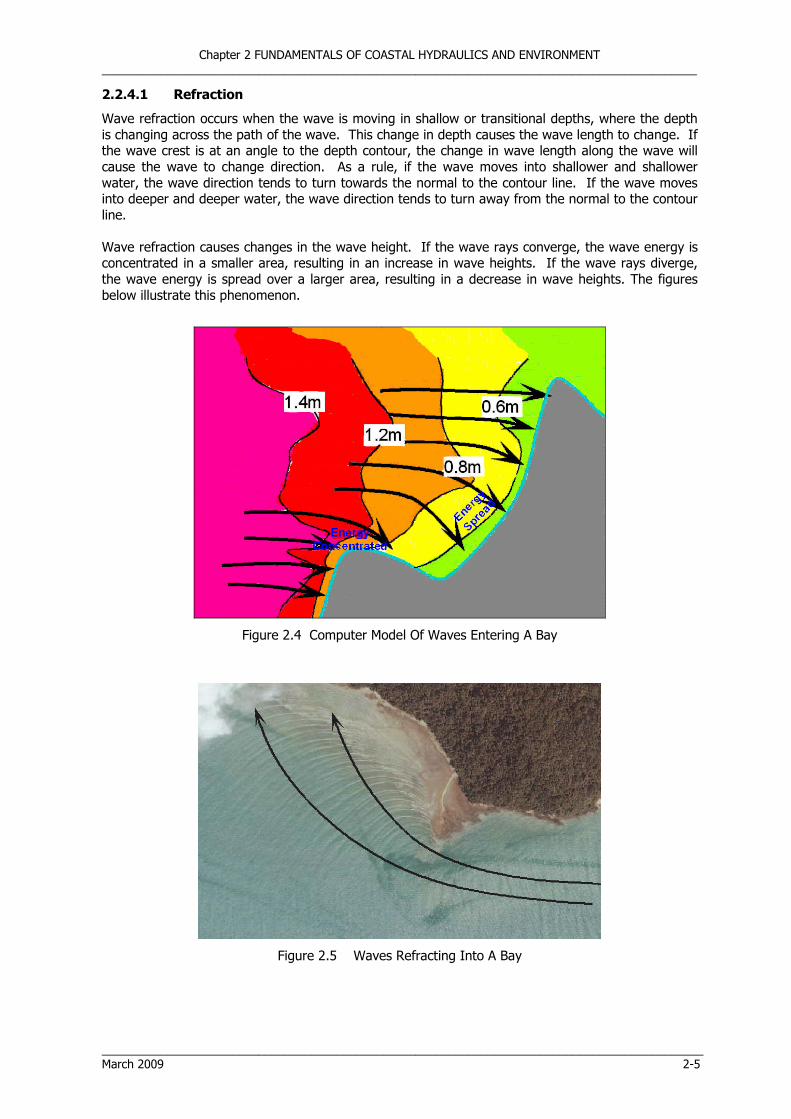
Chapter 2 FUNDAMENTALS OF COASTAL HYDRAULICS AND ENVIRONMENT
___________________________________________________________________________________________
____________________________________________________________________________________________
March 2009 2-5
2.2.4.1 Refraction
Wave refraction occurs when the wave is moving in shallow or transitional depths, where the depth
is changing across the path of the wave. This change in depth causes the wave length to change. If the wave crest is at an angle to the depth contour, the change in wave length along the wave will
cause the wave to change direction. As a rule, if the wave moves into shallower and shallower
water, the wave direction tends to turn towards the normal to the contour line. If the wave moves into deeper and deeper water, the wave direction tends to turn away from the normal to the contour
line.
Wave refraction causes changes in the wave height. If the wave rays converge, the wave energy is concentrated in a smaller area, resulting in an increase in wave heights. If the wave rays diverge,
the wave energy is spread over a larger area, resulting in a decrease in wave heights. The figures
below illustrate this phenomenon.
Figure 2.4 Computer Model Of Waves Entering A Bay
Figure 2.5 Waves Refracting Into A Bay
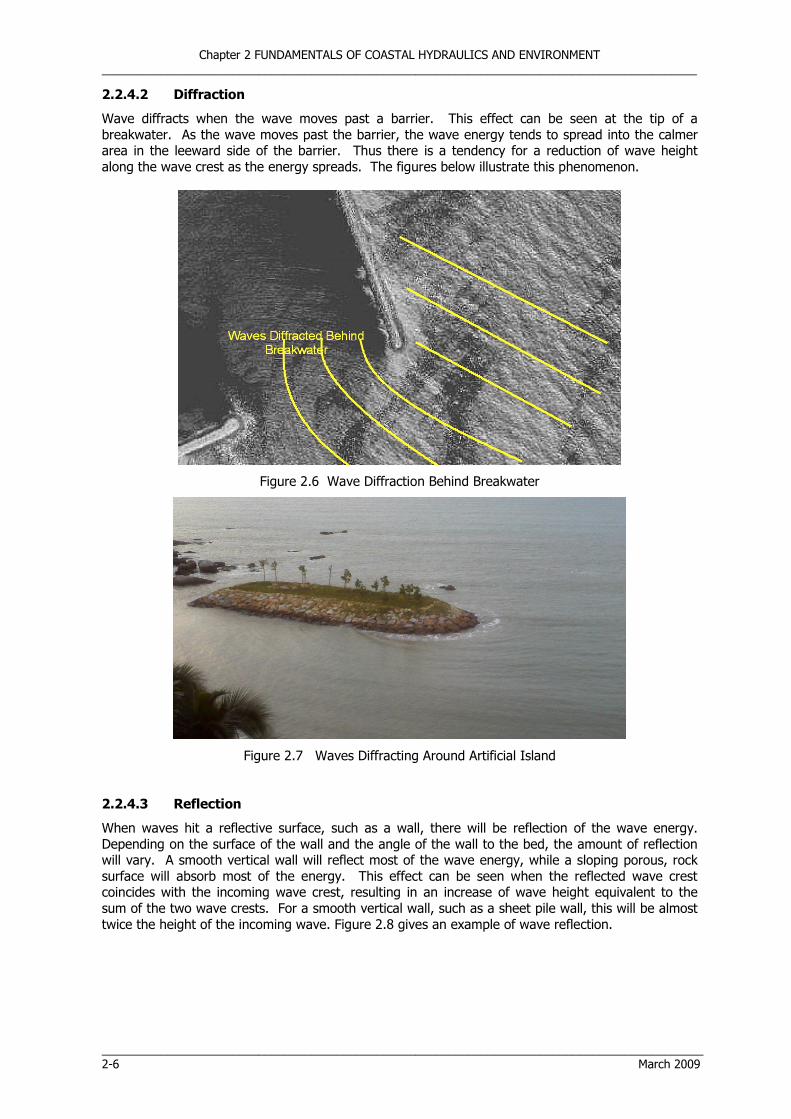
Chapter 2 FUNDAMENTALS OF COASTAL HYDRAULICS AND ENVIRONMENT
___________________________________________________________________________________________
____________________________________________________________________________________________
2-6 March 2009
2.2.4.2 Diffraction
Wave diffracts when the wave moves past a barrier. This effect can be seen at the tip of a
breakwater. As the wave moves past the barrier, the wave energy tends to spread into the calmer area in the leeward side of the barrier. Thus there is a tendency for a reduction of wave height
along the wave crest as the energy spreads. The figures below illustrate this phenomenon.
Figure 2.6 Wave Diffraction Behind Breakwater
Figure 2.7 Waves Diffracting Around Artificial Island
2.2.4.3 Reflection
When waves hit a reflective surface, such as a wall, there will be reflection of the wave energy.
Depending on the surface of the wall and the angle of the wall to the bed, the amount of reflection will vary. A smooth vertical wall will reflect most of the wave energy, while a sloping porous, rock
surface will absorb most of the energy. This effect can be seen when the reflected wave crest coincides with the incoming wave crest, resulting in an increase of wave height equivalent to the
sum of the two wave crests. For a smooth vertical wall, such as a sheet pile wall, this will be almost
twice the height of the incoming wave. Figure 2.8 gives an example of wave reflection.

Chapter 2 FUNDAMENTALS OF COASTAL HYDRAULICS AND ENVIRONMENT
___________________________________________________________________________________________
____________________________________________________________________________________________
March 2009 2-7
Figure 2.8 Waves Reflected off Seawall
2.2.4.4 Breaking
Waves break when the water body can no longer support the energy that is moving in it. There can
be two reasons for this. One is that the wave is too steep in relation to the wave length. The other
is that the depth of water is insufficient to transmit the energy.
The first phenomenon can be seen out in the sea in deep waters in the form of white caps. This condition is usually related to storm waves, where the wave period is short compared to the wave
height. The important relationship is the ratio of wave height, H, to wavelength, L. The higher the
value of H/L, the higher will be the wave steepness. The steeper the wave, the less stable it becomes. When it reaches its limit of steepness the wave will break. In deep water, this value is
1/7.
The second phenomenon can be observed along the coast. As the waves hit the coast, the water depth becomes too small to transmit the wave energy. The wave breaks and this can be seen as
breakers along the coastline. The breaking of the wave converts the wave energy into the kinetic
energy of the movement of the water particles in the form of uprush of the water, and the sound that can be heard as the wave breaks on the coast.
Figure 2.9 Waves Breaking On The Coast

Chapter 2 FUNDAMENTALS OF COASTAL HYDRAULICS AND ENVIRONMENT
___________________________________________________________________________________________
____________________________________________________________________________________________
2-8 March 2009
2.2.4.5 Wave Decay
Breaking is a mechanism of wave decay, but there are other forms of wave decay. The causes of
wave decay are;
(i) Bottom friction.
Although, the wave theory assumes that there is no friction between the water body and the bed, in actual fact there is. This effect resists the movement of water particles close to the bed. This action
reduces the energy in the waves and thereby reducing the wave height. However, this effect in relation to the other effects of such as breaking, is quite small.
(ii) Radiation.
Waves radiates from a source. If we are close to the source, we will see the wave crest as a straight
line. However, far away from the source, the wave crest is actually a curve or even circular, similar to the ripples one sees if a stone is thrown into a lake. The waves radiate from the source and while
the energy is not lost as the wave moves away from the source, the wave height is reduced as the energy is spread over a wider area. Eventually the energy is spread so wide that the wave height
cannot be seen any more.
Figure 2.10 Waves Reducing In Height From The Eye Of Hurricane Gustav
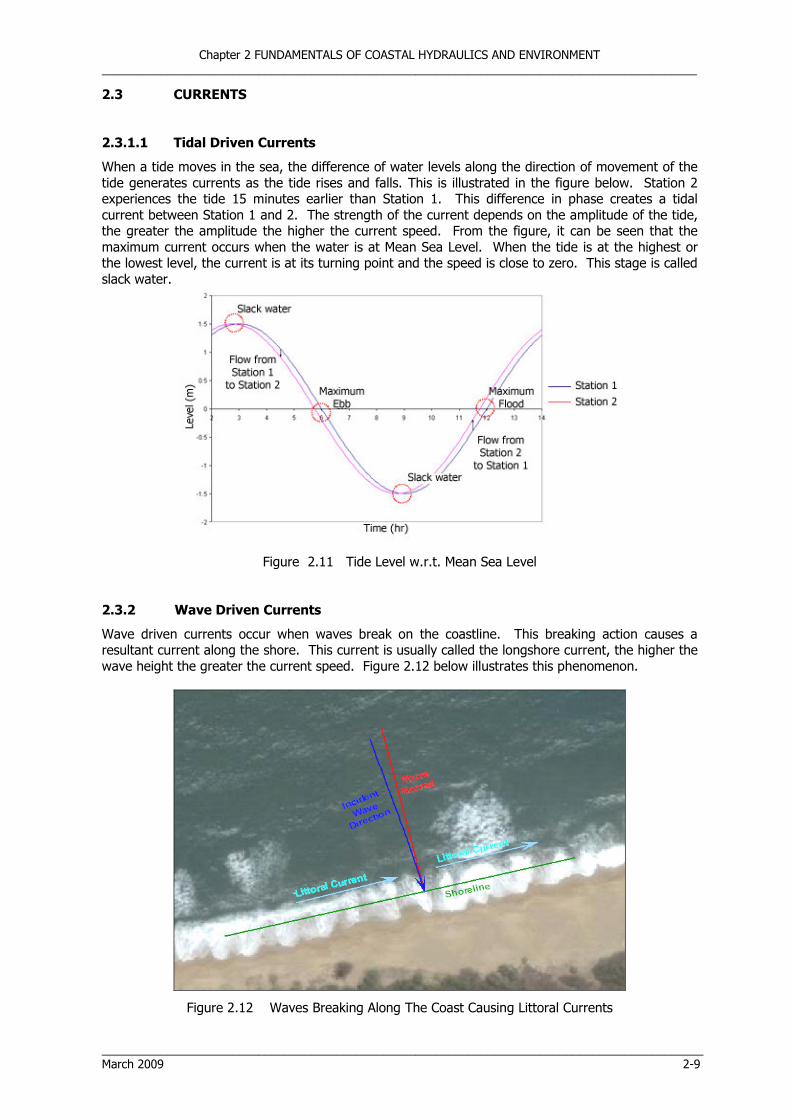
Chapter 2 FUNDAMENTALS OF COASTAL HYDRAULICS AND ENVIRONMENT
___________________________________________________________________________________________
____________________________________________________________________________________________
March 2009 2-9
2.3 CURRENTS
2.3.1.1 Tidal Driven Currents
When a tide moves in the sea, the difference of water levels along the direction of movement of the
tide generates currents as the tide rises and falls. This is illustrated in the figure below. Station 2 experiences the tide 15 minutes earlier than Station 1. This difference in phase creates a tidal
current between Station 1 and 2. The strength of the current depends on the amplitude of the tide, the greater the amplitude the higher the current speed. From the figure, it can be seen that the
maximum current occurs when the water is at Mean Sea Level. When the tide is at the highest or the lowest level, the current is at its turning point and the speed is close to zero. This stage is called
slack water.
Figure 2.11 Tide Level w.r.t. Mean Sea Level
2.3.2 Wave Driven Currents
Wave driven currents occur when waves break on the coastline. This breaking action causes a resultant current along the shore. This current is usually called the longshore current, the higher the
wave height the greater the current speed. Figure 2.12 below illustrates this phenomenon.
Figure 2.12 Waves Breaking Along The Coast Causing Littoral Currents

Chapter 2 FUNDAMENTALS OF COASTAL HYDRAULICS AND ENVIRONMENT
___________________________________________________________________________________________
____________________________________________________________________________________________
2-10 March 2009
In most cases, waves break at a slight angle to the shoreline. This causes a resultant current as
shown in Figure 2.12. The strength of the current increases as the wave height and the angle
between the incident wave direction and the shore normal increases.
2.3.3 Wind Generated Currents
Wind can generate currents in the ocean. However, this current is usually confined to the surface of the ocean although in shallow waters, the current may be generated throughout the water body. As
a rule of thumb, the wind will generate an ocean current with speeds of around 1/30th the speed of
the wind. The figure below shows the surface currents generated by winds in January in the South China Sea.
Figure 2.13 Surface Currents In South China Sea In January
(from China Sea Pilot, United Kingdom Hydrographic Office)
2.3.4 Storm Surge Currents
Pressure differences in a storm can cause a rise in the water level in the sea. This rise in water level results in a head difference in the sea, resulting in a flow away from the rise in water level. The rise
is due to a reduction in barometric pressure, emanating from the eye of the storm.
2.3.5 Oceanic Currents
Oceanic currents are the result of temperature differences in different parts of the ocean. In the
South China Sea, current goes in a clockwise motion (Fig. 2.14).

Chapter 2 FUNDAMENTALS OF COASTAL HYDRAULICS AND ENVIRONMENT
___________________________________________________________________________________________
____________________________________________________________________________________________
March 2009 2-11
Figure 2.14 World Ocean Currents. Inset: South China Sea Ocean Currents
2.4 TIDES AND OTHER WATER LEVEL FLUCTUATIONS
2.4.1 Tide
Tides are generated by the pull of gravity of the astronomical bodies. Two astronomical bodies that
have significant effect on the tides are the sun and the moon. Although the sun is a much larger
body than the moon, the proximity of the moon to the earth means that the moon has a greater
influence on the tides. The tides have primary periods around 12.4 and 24 hr.
The sun, the moon and the earth are rarely on the same plane. When the sun, the moon and the earth are aligned, the combined gravitational pull will create a larger than normal tidal amplitude,
normally called a spring tide. This occurs when the moon is in its new moon and full moon phase. When the moon is in its 2nd or 3rd quarter, the tidal amplitude is at its lowest, i.e. neap tide.
The celerity and thus the time of arrival of the tide at a given location are dependent upon the water depths, which also control the refraction of the tide wave. Converging and diverging shorelines
cause the amplitude of the tide to increase and decrease, respectively, due to the increase and decrease of energy per unit crest width. Decreasing water depths as the tide wave shoals will
increase the tidal amplitude. Bottom friction, which dissipates wave energy, will cause the amplitude to decrease. Thus in shallow nearshore regions, the tide will travel slower than it does at sea. It will
usually have a greater amplitude, and it will behave in a rather complex fashion, particularly in
irregular bays and estuaries. The figure below shows cotidal plots of South China Sea for one particular day.

Chapter 2 FUNDAMENTALS OF COASTAL HYDRAULICS AND ENVIRONMENT
___________________________________________________________________________________________
____________________________________________________________________________________________
2-12 March 2009
Figure 2.15 Cotidal Plots Of South China Sea
2.4.2 Storm Surge
A storm over nearshore waters can generate large water level fluctuations if the storm is sufficiently strong and the nearshore region is shallow over a large enough area. Pressure differences in a storm
can cause a rise in the water level in the sea. This phenomenon is called a storm surge. Storm
surges have been known to cause flooding such as the flooding in Sabah due to Typhoon Greg. In Galverston, USA, the storm surge by Hurricane Ike caused extensive flooding.
Figure 2.16 Flooding in Galverston caused by Hurricane Greg
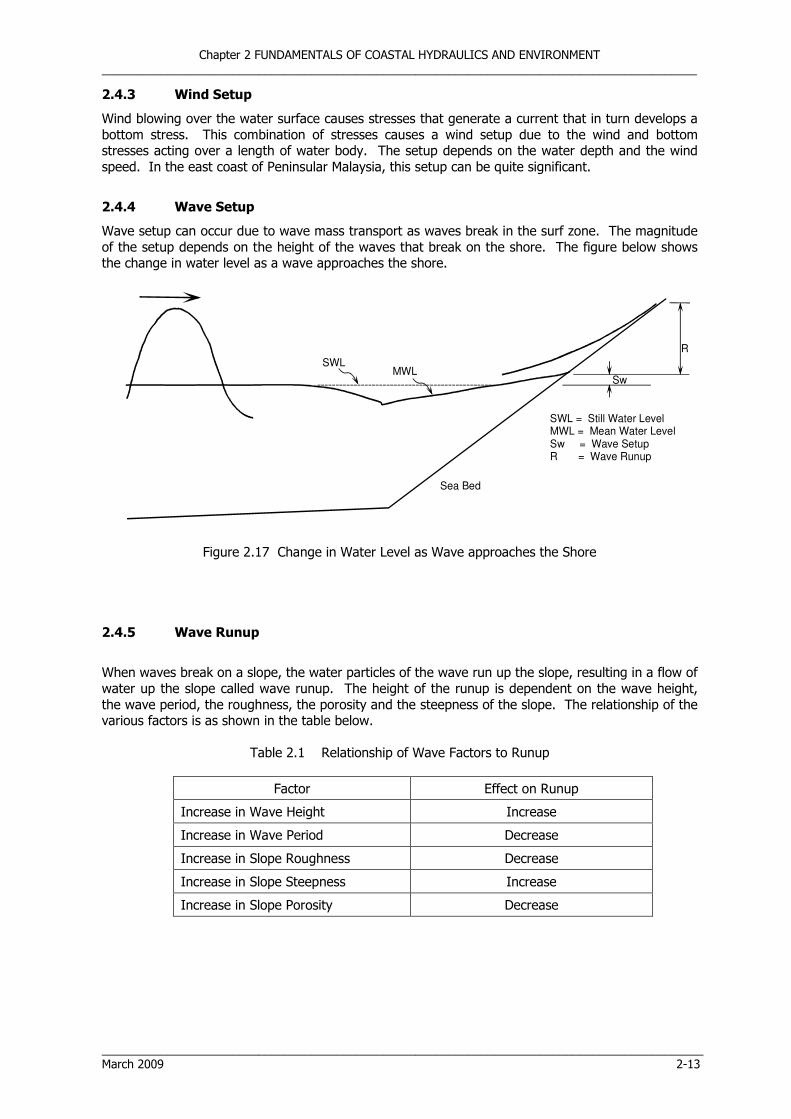
Chapter 2 FUNDAMENTALS OF COASTAL HYDRAULICS AND ENVIRONMENT
___________________________________________________________________________________________
____________________________________________________________________________________________
March 2009 2-13
2.4.3 Wind Setup
Wind blowing over the water surface causes stresses that generate a current that in turn develops a
bottom stress. This combination of stresses causes a wind setup due to the wind and bottom stresses acting over a length of water body. The setup depends on the water depth and the wind
speed. In the east coast of Peninsular Malaysia, this setup can be quite significant.
2.4.4 Wave Setup
Wave setup can occur due to wave mass transport as waves break in the surf zone. The magnitude
of the setup depends on the height of the waves that break on the shore. The figure below shows the change in water level as a wave approaches the shore.
Figure 2.17 Change in Water Level as Wave approaches the Shore
2.4.5 Wave Runup
When waves break on a slope, the water particles of the wave run up the slope, resulting in a flow of
water up the slope called wave runup. The height of the runup is dependent on the wave height,
the wave period, the roughness, the porosity and the steepness of the slope. The relationship of the various factors is as shown in the table below.
Table 2.1 Relationship of Wave Factors to Runup
Factor Effect on Runup
Increase in Wave Height Increase
Increase in Wave Period Decrease
Increase in Slope Roughness Decrease
Increase in Slope Steepness Increase
Increase in Slope Porosity Decrease
R
SWLMWL
Sw
Sea Bed
SWL = Still Water LevelMWL = Mean Water LevelSw = Wave SetupR = Wave Runup

Chapter 2 FUNDAMENTALS OF COASTAL HYDRAULICS AND ENVIRONMENT
___________________________________________________________________________________________
____________________________________________________________________________________________
2-14 March 2009
2.4.6 Tsunami
The term “tsunami” is used to denote relatively long period waves generated by coastal and
undersea seismic disturbances (earthquakes) and related landslides, bottom slumping, and volcanic eruptions. Although tsunami waves have a low amplitude at sea, shoaling, refraction and resonance
can greatly increase the nearshore amplitude and onshore runup of these waves. This has caused
several major catastrophes including the loss of many lives in coastal areas prone to tsunami attack.
Tsunamis are generated by a rapid large-scale disturbance of a mass of ocean water that results in a displacement of the ocean surface and the creation of waves. Tsunami generation usually requires
sea bed movement creation of waves. Tsunami generation usually requires sea bed movement having a significant vertical component in sufficiently shallow water. Most recorded tsunamis have
been generated by earthquakes having a focal depth of less than 60 km and a magnitude of 6.5 or
higher on the Richter scale.
A tsunami will typically consist of a group of waves having periods of 5-60 min and irregular amplitudes. Even a 5-min period wave traveling over the deeper ocean depths (about 6000 m)
behaves essentially as a shallow water wave. In the open ocean tsunami wave heights are of the
order of a meter or less. (Refer Appendix 2 A for details on tsunami)
Figure 2.18 Water level fluctuations caused by the earthquake off Sumatra.

Chapter 2 FUNDAMENTALS OF COASTAL HYDRAULICS AND ENVIRONMENT
___________________________________________________________________________________________
____________________________________________________________________________________________
March 2009 2-15
2.5 SEDIMENT TRANSPORT PROCESSES
2.5.1 Introduction
The main sources of sediment along the coastline are rivers and drainage outlets. These sources
discharge sediment into the sea, which eventually get transported along the coastline by the coastal processes. Depending on the size and type of sediment, the extent of the movement of the
sediments vary. Sand and silt being non-cohesive, tend to settle easier than clay. Clay undergoes a process of settling different from the non-cohesive material and tends to be transported further out
to sea than sand and silt.
The difference between the cohesive material, clay and the non-cohesive material such as sand and
silt is that, clay, being very much smaller has a smaller settling velocity than sand and silt. Therefore, clay takes a longer time to settle. However, when clay settles, the particles stick together
and the cohesive forces are quite strong, requiring a significant energy to separate the particles
again.
Apart from rivers, the shoreline itself can be a source of sediments. Eroding shorelines and deltas can provide sediments to the coastal process. Cliffs and bluffs can also be sources of sediments if
the materials are easily eroded.
2.5.2 Sand Transport
Sand is transported basically by currents along the coastline. These currents can be either wave
driven or tidal driven. These currents have been explained in the earlier sections in this chapter. The transport of sand has been well investigated by various researchers and many transport
formulas have been developed to describe the movement of the sand. Basically all researchers agree that transport for a certain sand grain size starts when the velocity of the water at the bed
reaches a threshold velocity. When the velocity of the water is above this critical velocity, the sand starts to move. The larger the velocity of the water, the larger will be the capacity of the water to
transport sand. When the velocity is reduced, the capacity of the water to transport the sand will be
reduced and the sand will start to come out of suspension.
The movement of the sand can be alongshore, i.e. due to littoral currents. This movement is called the littoral drift. The movement can also be onshore-offshore, i.e. perpendicular to the coastline.
This movement is called onshore-offshore transport.
For transport due to littoral drift, one formula that can be used to estimate the transport along sandy
beaches is the formula developed by the US Army Coastal Research Center. This formula is an empirical formula based on several sources of field data. The formula is as follows.
Qs = 7.5 X 10³Pl................................................................ (2.3)
Qs is in cubic yards of sand per year and Pl is in foot pounds per second per foot of beach.
Pl is calculated using the following formula.
Pl = (ρg/8)H2Cncosαbsinαb ................................................ (2.4)
Where; H = wave height at the breaker line,
C = wave celerity, n = ratio of wave group to phase celerity at the breaker line, αb = angle between wave crest and bottom contour at breaker line
However, this formula ignores factors such as beach slope, breaker type and sand characteristics. Thus there may be a significant difference between the estimated value and the actual littoral drift.
The formula must be used with a lot of engineering judgment and experience.

Chapter 2 FUNDAMENTALS OF COASTAL HYDRAULICS AND ENVIRONMENT
___________________________________________________________________________________________
____________________________________________________________________________________________
2-16 March 2009
For onshore-offshore transport, the important phenomenon is the movement of the beach profile.
Fig. 2.19 shows the beach profiles commonly developed by two wave climate extremes. (1) storm
waves of high amplitude and wave steepness, and (2) calm condition waves of lower amplitude and steepness. During calm wave conditions sand is slowly moved shoreward to build the beach face in
the foreshore zone and to extend the berm, thus causing a steeper beach face profile slope. During storm wave conditions, sand is moved offshore from the foreshore zone and a scarp is cut into the
berm.
Fig 2.19 Typical Beach Profile
2.5.3 Mud Transport
Since the currents that are working along the coastline are similar, whether the coastline is sandy or muddy, the forces that transport the mud, i.e. clay material along the coastline are similar.
However, the difference in mud and sand is in the way mud gets entrained into the flow and how it settles out of the flow. As explained earlier, the clay particles require a lot of energy to be entrained
once the particles have settled and the cohesive forces start to act on them. However, once
entrained, the clay particles due to its small size and low settling velocity will take a long time to settle.
In estuaries, the turbulent energy during the tide causes large variations in suspended sediment
concentration and this results in three basic forms of mud occurrence.
1. Mobile suspensions - Where the suspension is moving freely under the tidal forces or
downslope under the influence of gravity. 2. Stationary suspensions - The suspensions are not moving horizontally but gradually
settling. 3. Settled mud - Mud forming part of the sea bed, resisting erosion for long periods and
gradually consolidating.
MLWS
Breaker
Longshore Bar
Calm Wave Profile
Scarp
Storm Wave Profile
Coast Backshore Foreshore Nearshore
Surf zone
Storm Season Berm
Calm Season Berm
Dunes or Cliff

Chapter 2 FUNDAMENTALS OF COASTAL HYDRAULICS AND ENVIRONMENT
___________________________________________________________________________________________
____________________________________________________________________________________________
March 2009 2-17
2.6 COASTAL CLASSIFICATION
2.6.1 Classification of Coastlines
A. Beach Classification Terms for Geomorphology
The geomorphology of a coastal reach is used to describe the dominant physical
land forms in the reach. The following are the terms used to classify the beach geomorphology:
• Straight littoral shoreline
• Embayed shoreline
• Rocky headland
• Dunes
• Tombolo or other special morphological feature
• Littoral sand spit
• Artificially protected
• Riverine
B. Beach Classification Terms for Shoreline Materials
The shoreline materials parameter is a description of the type of material
encountered on the shore, which for the purposes of the present classification is taken as the area between MLLW and MHHW.
The following are the terms used to classify the beach shoreline materials:
• Rock
• Coarse sand
• Fine sand
• Sandy silt
• Silts or clay
C. Beach Classification Terms for Coastal Processes
The coastal process is the parameter which describes the movement of coastal sediments. The following are the terms used to classify the beach coastal processes:
• Littoral barrier
• Littoral movement (longshore and cross-shore) with net northerly movement
• Littoral movement (longshore and cross-shore) with net southerly movement
• Bar bypass mechanism present
• Pocket beach
• Aeolian sediment movements
• Riverine sediment supply
2.6.2 Coastal Features
2.6.2.1 Headlands and Bays
Headlands are usually rocky features that are very resistant to erosion. This features act as fixing
points that hold the shoreline in position. In between the headlands are bays usually in the shape of a crenulate. These bays are also sometimes called hooked shaped bays. In many cases, these bays
are dynamically stable. The combination of wave diffraction and refraction results in the predominant wave rays arriving almost perpendicular to the beach contour. This results in a low
littoral current. Thus the beach sediments stay mainly within the bay even though there is
reorientation of the beach according to the seasons.

Chapter 2 FUNDAMENTALS OF COASTAL HYDRAULICS AND ENVIRONMENT
___________________________________________________________________________________________
____________________________________________________________________________________________
2-18 March 2009
Figure 2.20 Headland and Bay
2.6.2.2 Sand spits
Sand spits occur along beaches where the littoral currents are significantly stronger than the currents
due to the discharge from the rivers and drains. The flow of the river or drain tends to be parallel to the shoreline until a sufficient tidal prism is created to allow the river or drain to discharge into the
sea. Sand spits can also occur when the littoral drift goes around the leeward side of a headland. In this case, the sediments get deposited in the calm waters resulting in a spit.
Figure 2.21 Typical Sandspit

Chapter 2 FUNDAMENTALS OF COASTAL HYDRAULICS AND ENVIRONMENT
___________________________________________________________________________________________
____________________________________________________________________________________________
March 2009 2-19
2.6.2.3 Barrier Islands
Barrier islands are similar to sand spits and are actually of the similar origins. Spits form along the
coastline and sometimes break to form barrier islands. The islands are rarely stable, breaking and reforming according to the changes in wave climate and the contribution of fresh water flow from
the hinterland.
Figure 2.22 Barrier Island Formed At The Tip Of A Sandspit
2.6.2.4 Lagoons
Lagoons are part of the system of barrier islands and sand spits. The lagoons occur when the spits and barrier islands cause a body of water to be created landward of the spits and islands. These
lagoons store sufficient tidal prisms to create a sufficient flow during low tide to maintain the
opening of the estuary. Figure 2.23 shows the Setiu Lagoon, the largest lagoon in Peninsular Malaysia.
Figure 2.23 Setiu Lagoon
Barrier island formed at the tip of sand spit

Chapter 2 FUNDAMENTALS OF COASTAL HYDRAULICS AND ENVIRONMENT
___________________________________________________________________________________________
____________________________________________________________________________________________
2-20 March 2009
2.6.2.5 Delta
Deltas occur when a river with a high freshwater and sediment discharge meets the sea. If the
littoral currents are not sufficiently strong to transport the sediments along the shore, the sediments get deposited around the river mouth, forming a delta. Deltas can be formed by deposition of both
cohesive and non-cohesive sediments. The Sg. Kelang and Sg. Pahang deltas are examples of such
deltas.
2.6.2.6 River Mouth
River mouths are important coastal features as they are the sources of freshwater and sediments from the hinterland. The river mouths are tidal and it is the tidal prism that keeps the river mouth
open. The opening of the river mouth is usually a function of the freshwater discharge and size of
the tidal prism. As mentioned earlier, the strength of the littoral drift also plays an important role. This complex interchange of freshwater discharge, tidal prism and littoral drift affects the shape and
size of the river mouth.
The figures below show the complex interaction of the various factors that affect the river mouth.
The Kelang River Mouth is affected by the large tidal variation at the location. The flows in the river can be quite high resulting in strong currents during spring tides. The low wave energy at the
location results in the deposition of the clay and silt just outside the river mouth, resulting in large
mangrove islands.
The Rompin River mouth is shaped as a result of the strong littoral drift that occurs due to the strong waves of the South China Sea. The distinct wet and dry season of the monsoons also results in the
channel at the river mouth changing directions during the seasons. The high contribution of sand
from the hinterland during monsoon flows also results in the changing shape of the river mouth.
Figure 2.24 Kuala Rompin
2.6.2.7 Tidal Inlet
Tidal inlets occur where the influence of littoral currents results in spits and barrier islands creating bodies of waters landward of the barriers. Another feature is that the freshwater contribution is
small, making the tidal prism the main factor influencing the shape of the inlet. One example of a tidal inlet is the lagoon at Tanjung Rhu, Langkawi.

Chapter 2 FUNDAMENTALS OF COASTAL HYDRAULICS AND ENVIRONMENT
___________________________________________________________________________________________
____________________________________________________________________________________________
March 2009 2-21
Figure 2.25 Tidal Inlet at Langkawi
2.6.2.8 Reefs (Rocky and Coral Reefs)
Reefs are underwater features usually occurring as a result of rock outcrops or ridges. In the warm
tropical waters around Malaysia, especially where there is very little pollution, living organisms easily
attach themselves to the reefs, creating what we call coral reefs. For the corals to survive there must be sunlight penetration. Therefore, where there is very little sediment movement in the water,
corals can establish themselves. This is the reason most of the islands around Malaysia have coral reefs. Perhaps the most famous of all is Sipadan, Sabah (Fig. 2.26).
Figure 2.26 Corals Around Sipadan, Sabah
2.7 CAUSES OF COASTAL EROSION
Before deciding on the choice of coastal protection measures, it is important to understand and
determine the causes of erosion so that the appropriate measures can be taken. The causes can be
man-made or natural. Depending on the cause, certain measures may or may not be applicable. Thus, those that are in-charge of managing the shoreline must determine these causes in order to
be able to tackle the problems effectively.

Chapter 2 FUNDAMENTALS OF COASTAL HYDRAULICS AND ENVIRONMENT
___________________________________________________________________________________________
____________________________________________________________________________________________
2-22 March 2009
2.7.1 Natural Causes
Erosion and accretion are part of the natural processes that shape the coastline. It is important to
note that the coastal area is a dynamic zone. In Malaysia, as much as 30% of the shoreline is under erosion. A lot of this erosion occurs naturally and not caused by man’s intervention. Thus it is
important in most cases to manage the movement of the shoreline.
In many cases, the erosion and accretion are cyclic. Observed over long periods, the shoreline is
actually stable. This is usually the case for crenulated bays. However, the fluctuations of the shoreline may be large and occur over very long periods that many will think that coastline is
constantly eroding.
In other cases, the coastline is eroding as part of a long term geologic process. Eroding cliffs and
bluffs are examples of this phenomenon. Overcoming this process can be quite a massive and expensive undertaking. It is wiser to take this process into account while planning development
along the coastline so that this problem can be avoided.
The natural processes primarily responsible for Malaysia coastal erosion are driven by wind waves.
Almost all of the wind waves are generated near to Malaysian coast. As the waves move near the shore and travel through increasing shallow waters, they steepen and increase height; and when the
water depth is about 1.3 times the wave height, the waves become unstable and collapse or break. As the incoming waves are in different heights, they break in various depths and the band of
breaking waves, known as the surf zone, changes as the wave height range changes. During the
North-east (NE) monsoon season, the surf zone can be several hundred metres wide. The surf zone is a violent arena as breaking waves dissipates their energy in turbulence, by generating intense
local currents, and in the final uprush on the beach. The turbulence causes sediments to be lifted from the sea bottom and the local currents transport them. Similarly the wave uprush mobilizes
sediments from the beach and the backrush transports them back into the surf zone. This process is normally called on-offshore sediment transport, which causes the sediments to be transported
offshore with temporary storage in a bar or shoal. Later, partial recovery of the beach may occur
through natural transport of these materials onshore by longer period and flatter waves; but in most cases, some materials are permanently lost into the greater offshore depth and erosion of the beach
results.
When breaking waves approach the shoreline at an angle other than 90 degree (perpendicular) with
the shoreline as they usually do, a component of the wave energy is directed parallel to the shoreline and the generated current is similarly directed. This current running parallel to the shoreline, called
longshore current, causes sediments lifted by the breaking waves to move along the shore, and hence a process called longshore sediment transport. When the longshore current sediment carrying
capacity exceeds the quantity of sediment supplied to the beach, erosion of the beach results.
Climate change and sea level rise can also cause erosion and flooding. A small rise in sea level along
the coastline of Malaysia can seriously affect the drainage systems along coastal towns and agricultural areas. Rise in sea level can also mean an increase in wave energy reaching the
shoreline. This increase in wave energy will cause erosion of the beaches. Climate change can also cause more severe storms which will mean an increase in wave energy along the shoreline. There
will also be retreat of the shoreline as the sea water advances landward due to the sea level rise.
2.7.2 Man made Interventions
Man made interventions tend to interrupt coastal processes. Sometimes this can cause undesirable effects such as erosion and accretion. The coast is a sensitive and dynamic environment, where the
slightest intervention has severe consequences. Below are some examples of man made interventions that can affect the coastline.

Chapter 2 FUNDAMENTALS OF COASTAL HYDRAULICS AND ENVIRONMENT
___________________________________________________________________________________________
____________________________________________________________________________________________
March 2009 2-23
2.7.2.1 Trenches or Navigation Channels
Trenches and navigation channels act as sinks for sediments moving along the coastline. The
trenches tend to fill up with sediments moving along the shoreline. As these trenches fill up, maintenance dredging needs to be carried out to maintain the required depth of the trench. In
navigation channels, this is particularly important so that the vessels can continue entering the
channel.
If the dredged material is dumped offshore, usually in water depths of more than 20 meters, the sediment is completely taken out of the system. This means that there will be a loss in the sediment
budget along the coastline. This loss needs to be replenished some how, usually at the expense of the downdrift coastline. This effect was noticed in the early days of Bintulu Port when maintenance
dredging of the channel into the port resulted in the erosion of the coastline of Bintulu.
2.7.2.2 Ports and Harbours
Ports and harbours can affect the coastline in many ways. The breakwaters built to shelter the harbours can interrupt the longshore drift, causing accretion along the shoreline on the updrift side
of the breakwaters while erosion will occur on the downdrift side of the breakwaters. Dredging of the entrance channel as explained earlier can cause erosion of the shoreline. In the early 1990s,
Bintulu Port, due to these factors, was affecting the Bintulu coastline.
2.7.2.3 Coastal Protection
Coastal protection, depending on the type used, can affect the coastline in different ways.
Revetment hardens the shoreline that it is designed to protect. However, in hardening the stretch of the shoreline, it can cause increased erosion along the shoreline downdrift to the erosion. This is
because the stretch of shoreline that is protected is no longer contributing sediment to littoral drift. This deficit needs to be made up by erosion of the adjacent shoreline. In bays where the shoreline
is actually dynamically stable, fixing one portion of the shoreline can result in increased erosion in
the adjacent shoreline. This has been observed in Miri where the hardening of the shoreline by revetment to the north of the Miri refinery has resulted in an increased rate of erosion along the
shoreline in front of the facility.
Groynes and breakwaters interrupt the littoral drift. This causes erosion on the downdrift of the
shoreline and accretion on the updrift. The application of this system of coastal protection must be done carefully as to avoid problems that can come with the system. With proper planning and
design these problems can be overcome.
Seawalls can cause erosion of the foreshore due to the incident waves that are reflected from the walls. The increase in wave heights due to the meeting of the crests of the incident and reflected
waves can cause erosion at the toe of the walls. Thus, where possible, this type of construction
should be avoided.
2.7.2.4 Reclamation
Reclamation also interrupts the movement of sediments along the coast. It can also cause a wave shadow area, promoting accretion in the area. Reclamation can affect the coastal currents and can
cause dead water areas, where euthrophication can occur. During reclamation, suspended sediments can be introduced into the coastal waters through the overflow pipes that are used to
drain the excess water used in pumping the sand onshore. These suspended sediments can affect
the water quality if the amount is excessive.
2.7.2.5 Artificial Islands
Artificial islands can interrupt the littoral drift due to the wave shadow effect that they cause. If the island is too close to the mainland, a tombolo can be formed causing the shoreline to be joined to
the island. This interruption of the littoral drift can also cause erosion on the downdrift coastline to compensate for the accretion of the coastline along the updrift side. However, if properly designed,
these artificial islands can be used to stabilize the coastline as was done in Sentosa, Singapore.

Chapter 2 FUNDAMENTALS OF COASTAL HYDRAULICS AND ENVIRONMENT
___________________________________________________________________________________________
____________________________________________________________________________________________
2-24 March 2009
Figure 2.27 Artificial Island, Sentosa, Singapore
2.7.2.6 Artificial lagoons
Artificial lagoons have been constructed for several reasons. The main reason is usually aesthetics. The developer or land owner requires some features in his property along the coastline. In this case
a lagoon may be created to provide this feature. A lagoon means constructing breakwaters that can
create the water body. The lagoon itself will not cause a problem, but the breakwaters may interrupt the littoral drift, causing erosion on the downdrift coastline and accretion on the updrift
side. As in all coastal features, proper design can mitigate the adverse impacts caused by the lagoon.
Figure 2.28 Artificial Lagoon in Port Dickson

Chapter 2 FUNDAMENTALS OF COASTAL HYDRAULICS AND ENVIRONMENT
___________________________________________________________________________________________
____________________________________________________________________________________________
March 2009 2-25
REFERENCES
[1] DID (1985). “National Coastal Erosion Study”, August 1985.
[2] DID “Compilation of Internal Documents Prepared by Coastal Engineering Division, DID Malaysia on Coastal Erosion Control Program, Coastal Zone management Policies and Guidelines”.
[3] Robert M. Sorensen, “Basic Wave Mechanics for Coastal and Ocean Engineers” (John Wiley & Sons, 1993.
[4] Dominic Reeve, Andrew Chadwick and Christopher Fleming, “Coastal Engineering – Processes,
Theory and Design Practice”, Spon Press 2004.

Chapter 2 FUNDAMENTALS OF COASTAL HYDRAULICS AND ENVIRONMENT
___________________________________________________________________________________________
____________________________________________________________________________________________
2-26 March 2009
(This page is deliberately left blank)

Chapter 2 FUNDAMENTALS OF COASTAL HYDRAULICS AND ENVIRONMENT
___________________________________________________________________________________________
____________________________________________________________________________________________
March 2009 2A-1
APPENDIX 2-A
TSUNAMI
1. Introduction
Tsunamis are often triggered by the simultaneous occurrence of a large earthquake, a volcanic
eruption, an earth landslide, or a submarine slump. States of Sabah and Sarawak in East Malaysia, being close to the ‘ring of fire’, may be considered to be highly vulnerable to any of these
phenomena. Should they occur, local tsunamis may occur and within minutes, not hours, the coastal areas bordering South China Sea, Sulu Sea and Sulawesi Sea will be impacted by the
disastrous effects of tsunami run-up and inundation. Similarly, the western coastline of Peninsular
Malaysia, that were previously thought to have little or no risks from tsunami wave propagation originating from the Sumatra waters, can now be considered to face a certain degree of risk. The
devastating megathrust earthquake southwest of Banda Aceh in Northern Sumatra triggered giant tsunami waves that propagated throughout the Indian Ocean and also penetrated through the
Straits of Melaka via Andaman Sea.
As a deep-water tsunami wave enters a coastal area, it undergoes several changes and processes
that are responsible for the consequential impacts. The scale of the impact is a challenge not only to government agencies responsible for the safety and security of the coastline, but to coastal
engineers to fully appreciate the science and physics of the tsunami process so that mitigating plans
and evacuation measures could be implemented in a more effective manner.
2. Tsunami Generation, Propagation and Amplification Process
Tsunamis, commonly known as “harbour waves” in Japanese, or “tidal waves” to the general public,
are however misleading terms to describe them, because they do not just occur in harbours nor are
they caused by tides. Alternatively, they may rightfully be called “seismic waves” although they can be caused by other forces such as landslides, asteroids or volcanic activities. The most common
cause of a tsunami however is triggered by a strike-slip earthquake which is often associated with devastating effects. Scientifically, a tsunami is defined as “a series of long-period waves generated
by an impulsive disturbance that vertically displaces the water column”.
Wave Characteristics in Deep Water The main characteristics of a wave are basically the wave height (H), wave length (L), wave period
(T) and its velocity or speed (v). Period (T) is defined as the time interval between the passage of two successive crests past a given point. A wind-generated wave usually has periods between 5 and
20 seconds whereas tsunami periods normally range from 5 to 60 minutes.
A wave’s velocity (v) is calculated by dividing the wavelength (L) by T, i.e. v = L/T. It also depends
on the depth of water (d). Velocity equals the square root of the product of the water depth times the acceleration of gravity, i.e.
V = √(gd) .............................................................................(2.5)
For instance, tsunamis could travel approximately 760 km/hr in a 4,500 m of water, but in a 30 m of
water, the velocity drops to about 64 km/hr. The distance between successive wave crests may be as much as 500 km. A single tsunami may comprise up to 12 large wave crests. As it travels, its
energy is spread out over the ocean and moves, often unnoticed, with great speed exceeding 500
miles per hour (speed of a commercial jet plane) which is equivalent to traveling from one side of the Pacific Ocean to the other in less than a day.
H

Chapter 2 FUNDAMENTALS OF COASTAL HYDRAULICS AND ENVIRONMENT
___________________________________________________________________________________________
____________________________________________________________________________________________
2A-2 March 2009
A tsunami is often imparted with a great deal of energy by the generating force (such as the
earthquake) that triggers it. The energy in a wave is proportional to its wavelength (the distance
between two crests of the wave) and to the square of the wave height (i.e. the distance between the wave trough and crest). This means that in deep oceans, a high-energy tsunami may have a wave
length up to 650 kilometers but a wave height of less than a meter. Hence, they are often unnoticed by ships plying the ocean due to their long period (time between crests).
Shoaling and Amplification
As a deep ocean tsunami wave travels over the continental slope, amplification and shortening of the wave will occur, i.e. the wave height starts to amplify while the wavelength decreases. Upon
reaching the near-shore region, tsunami run-up starts to occur which is the increase of the height of the water onshore observed above a reference sea level. Shoaling amplification depends on the
ratio of group velocity at the generation-site and the coast-site (ocean depth h and hs respectively).
Figure 2A.1 shows the effect of shoaling on a tsunami wave of 150s period. Initially, a unit height wave begins to come ashore from 4000m of water at the left. As the water shallows, the velocity of
the wave decreases and the wave grows in amplitude. By the time it reaches 125m depth it has slowed from 137m/s velocity to 35m/s and grows in vertical height by a factor of two. As the wave
comes closer to the beach it will continue to grow about a factor of more than two before it breaks. Contrary to many artistic images of tsunamis, most tsunamis do not result in giant breaking waves
(like normal surf waves at the beach that curl over as they approach shore). Rather, they come in
much like very strong and very fast tides (i.e., a rapid, local rise in sea level).
Figure 2A.1 Wave Height Shoaling and Amplification
Breaking Wind-generated waves usually break as they shoal and lose energy offshore (Figure 2A.2). Most
tsunami waves however, do not break as they hit land. They normally surge, and act more like a flooding wave where they often appear as a rapidly advancing or receding tide, flooding low-lying
areas and reflect off cliffs or hills which often cause as much damage as they recede back to the sea.
In some cases, a bore (wall of water) or series of breaking waves may form.

Chapter 2 FUNDAMENTALS OF COASTAL HYDRAULICS AND ENVIRONMENT
___________________________________________________________________________________________
____________________________________________________________________________________________
March 2009 2A-3
Figure 2A.2 Types of Wave Breaking
3 Tsunami Run-Up and Inundation
Tsunami run-up
Tsunami run-up is the highest level on land where sea water can be reached by a tsunami. The
vertical distance between the end point of the sea water and the still water level of the sea (without wave) is called run-up height. See Figure 2A.3 for an illustration of the run-up process and
definitions.
Figure 2A.3 The Illustration Of Tsunami Wave Height And Run-Up Elevation (Wiegel, 1970)
(a) Collapsing breaker (b) Surging breaker (c) Spilling breaker

Chapter 2 FUNDAMENTALS OF COASTAL HYDRAULICS AND ENVIRONMENT
___________________________________________________________________________________________
____________________________________________________________________________________________
2A-4 March 2009
Inundation Tsunami inundation is the flow of sea water in the coastal area. The horizontal distance between the
end point of the sea water reached and the shoreline is called inundation distance (Figure 2A.4).
4 Tsunami Wave Energy in Shallow Water
The energy in a wave determines the damage level that a tsunami can cause. A tsunami grows in
height as it approaches land. As the depth of water decreases, its wave length and speed also decrease, but the energy contained in the wave remains nearly constant. Because the energy is
proportional to the wave length and to the square of its height, the wave amplifies its height as the water depth becomes shallower. Thus, as a tsunami reaches the shallow waters of the coast, the
waves slow down and the water can pile up to 10 m or more in height. In extreme cases, the wave
can rise to more than 15 m and over 30 m if the coast is near the generating source. The first wave may not be the largest in the series of waves. There could be 4 or more destructive waves over a
period of 30 minutes or more.
Effect of Coastal Topography on Tsunami Characteristics
Offshore and coastal features can determine the size and impact of tsunami waves. One coastal
community may not see much damaging wave activity, yet another coastal community nearby experience violent and destructive waves. This is because the coastal topography (sea bed
features), reefs, bays, entrances to rivers, and slope of the beach all help to modify the tsunami as it attacks the coastline. The presence of harbours and headlands also cause the waves to reflect,
diffract and refract, changing their direction. In many instances, tsunamis are found to ‘bend’
around islands, eventually enclosing the coast on what was supposedly the protected side.
Variation in run-up observed along the coastline depends on the topography of the coastline, nearshore bathymetry, beach slope, coastline orientation, direction of the oncoming wave, etc.
Variations in the nearshore bathymetry and bottom topography have to be studied in detail to
understand the relationship with the amplification of the tsunami height. Presence of coral reefs and seagrass has also been observed to reduce the intensity of wave impact.
Effects of Vegetation Cover on Wave Energy Dissipation The United Nations Environment Programme (UNEP)’s Post-Tsunami Assessment Report (February
2005) highlighted that the nearshore impacts of a tsunami are greatly influenced by the vegetation
cover of the coastal areas. Expert reports and field observations after this catastrophic event singled out those coastal areas with healthy coral reefs and intact mangroves were found to be less badly
affected compared to those whose ecosystems have been damaged or replaced by physical development projects. In the Maldives, for example, coral reefs took the full force of the waves,
hence limiting the damage on land whereas in some areas of Indonesia, Thailand and Malaysia,
mangrove forests saved lives and properties by acting like a giant dampener (Fogharty, 2005). The relatively low death toll on the Indonesian island of Simeuleu, close to the earthquake’s epicenter,
has been attributed partly to the surrounding mangrove forests. These marine ecosystems acted as
Figure 2A.4 Definition Of Maximum Inundation
MSL
Max. inundation distance
Tsunami run-up

Chapter 2 FUNDAMENTALS OF COASTAL HYDRAULICS AND ENVIRONMENT
___________________________________________________________________________________________
____________________________________________________________________________________________
March 2009 2A-5
a natural barrier against strong wave attack. It is thus important to note that the nearshore impacts
of the tsunami are greatly influenced not only by the wave energy, but mainly also by the differences
in the natural cover or topography of the coastal areas.
Figure 2A.5 shows examples of common types of coastal and marine vegetation cover including casuarinas, mangroves, coral reefs and seagrass. It has been noted that mangrove roots have the
capability to absorb wave energy under its complicated root structures. Its roots follow streamline look-like shape and interconnected, making very porous complicated natural barrier. Physically, they
act as submerged or partially submerged porous breakwater system to reduce the transmitted wave
energy by reducing reflected waves and dissipating the incident wave energy by inciting wave breaking and increasing flow friction through the porous media. Previous studies also indicated that
wave energy is dissipated mostly due to drag forces induced on the mangrove trunks or roots.
Figure 2A.5 Types of vegetation cover as wave energy dissipater (clockwise: casuarinas, coral reefs, seagrass, mangroves)
It is also acknowledged that the protective effects of marine ecosystems against tsunamis mainly depend on the scale of the tsunami and the size or coverage of these areas. In the context of coral
reefs, they provide a first natural buffer between the ocean and the nearshore area. They are known to be capable of taking the forceful impact of the wave by breaking up the force of the wave,
creating friction and thus tone down the wave impact. By the time the waves reach the inner reef zone, the impact becomes less destructive.
Simon Cripps, Director of WWF’s Endangered Seas Programme, described coral reefs as a natural breakwater and mangroves are a natural shock absorber. Based on this concept of slowing a wave
to reduce its impact, several structures may be designed to “slow” a tsunami by emulating the natural ecosystems:
• Artificial reefs and underwater sculptures
• Artificial seagrasses
• Submerged berms or sand terraces

Chapter 2 FUNDAMENTALS OF COASTAL HYDRAULICS AND ENVIRONMENT
___________________________________________________________________________________________
____________________________________________________________________________________________
2A-6 March 2009
5 Tsunami Hazards and Impacts
Tsunamis may cause physical damage in several ways:
• Flooding and damage due to wave run-up, inundation and currents
• Destruction and damage to human life, man-made structures and infrastructure
• Shoreline alteration
• Inland and seaward transport of objects (ships, vehicles, houses, structures, etc)
• Sinking or rising sea-level in short term (hours) or long term (years)
• Uplifting or subsidence of the ground
• Earth landslides and/or submarine slumps
• Soil deformation and/or liquefaction
• Sediment: erosion-transport-deposition
• Vegetation: uprooting-destruction-immersion
• Exposure of the sub aqueous (below inter-tidal level) marine life
• Salt water penetration into the inland soil
Impacts of Tsunami Run-up, Inundation and Currents Much of the damage inflicted by tsunamis is caused by strong currents and floating debris. Post-
tsunami field assessments have shown that tsunami waves have penetrated inland with a greater
force in areas where coastal defense structures were absent. For example, in Langkawi, the Langkasuka offshore breakwater (Figure 2A.6) has indeed served its function in protecting the Langkawi Airport runway facilities and the coastal communities in the area (DID Post-Tsunami Assessment Report, 2005). However, in Kuala Muda, Kedah, the rock revetment managed to protect
the shoreline (Figure 2A.7) but failed to prevent flooding.
However, the worst affected areas are often the constricted river mouths and semi-enclosed
harbours or marinas in which the funneling effects forced the water levels to rise abruptly. This happened at Kuala Sg. Teriang and Sg. Melaka in Langkawi where flood waters reached as high as a
one-storey house. Maximum inundation distances recorded in the two rivers were 583m and 230m respectively with tidal bores penetrating 350m upstream and flooded the padi fields.
Figure 2A.6 The Langkasuka Breakwater Protecting Langkawi Airport From Tsunami Wave Attack

Chapter 2 FUNDAMENTALS OF COASTAL HYDRAULICS AND ENVIRONMENT
___________________________________________________________________________________________
____________________________________________________________________________________________
March 2009 2A-7
In Sumatra, the inundation distance was observed to be about 5 km and almost the same along the south and north coast of Meulaboh city. The wave propagated even more distance towards inland
along the river. Yalciner, et al (2005) reported that, according to eye witness interviews, tsunami waves exceeded the height of coconut trees along Meulaboh coasts, have inundated 5 kilometers
towards land, and have totally destroyed the Port of Meulaboh and its surrounding area. About 2/3
of the whole population in Meulaboh was killed by the tragic waves. It was also observed that:
i. The sea receded about 500 m in 10 minutes after the earthquake and advanced with the amplitude of 1-1.5 m within 30 minutes later. The second wave, which was more
destructive, arrived 50-60 minutes after the first one.
ii. The maximum elevation of the water level near the coastline exceeded 15m (in comparison
with the height of coconut trees) during either the first and second destructive waves. The inundation distance is clearly distinguished by the dried vegetation along the coastlines
because of the salt water inundation.
Impact on Coastal Structures and Infrastructures
The effects of tsunami waves on coastal structures are characterized by the maximum destructive force. Breakwaters and piers may collapse due to scouring actions that sweep away the foundation
material and sometimes also due to sheer impact of the high-energy wave. Post-tsunami assessment reports (Yalciner, 2005) indicated that tsunami waves were seen to completely damage
wooden structures where the flow depth exceeded 2.5 – 3.0 m in the inundation region. Most
concrete structures however, managed to stand against these waves. But their level of resistance and success for survival are fully dependent on (i) the percentage of open area (area of windows) on
the walls of ground floor for tsunami transmission and also (ii) the flow depth of tsunamis near the structure. The scour around the concrete structures are the common effect of flow velocities related
to tsunami wave action.
In Aceh, all flood control and coastal structures were severely damaged by the tsunami, including up
to 271 km upstream within 5 major rivers. The seawall off the west coast was completely damaged and major ports in Banda Aceh and Meulaboh became non-functional. About 1,078 km of road were
destroyed and 181 bridges collapsed (Sutardi, 2005). In south India, at Kerala, shore protection works made up of rock revetment and seawall were also destroyed and rocks were left scattered all over the coastal road after the tsunami event (Figure 2A.8).
Figure 2A.7 Rock Revetment Protecting The Shoreline At Kuala Muda, Kedah, But Failed To Prevent Run-Up And Flooding

Chapter 2 FUNDAMENTALS OF COASTAL HYDRAULICS AND ENVIRONMENT
___________________________________________________________________________________________
____________________________________________________________________________________________
2A-8 March 2009
Figure 2A.8 Damage on Structures and Infrastructures
Shoreline Alteration
Aerial images and satellite imageries of before- and after- conditions of tsunami-battered coastlines (e.g. Figure 2A.9) suggest that the impact is tremendously devastating and would change the world
map forever. Apparently, all the land fragmentation is likely due to temporary flooding although there are signs – yet to be verified – that a few isolated islands near the centre of the quake may
have changed. The images show that the effect of tsunami is by scouring out the low lying delta land and removing volumes of soil to the sea. There has also been removal of the sandy beaches
and deposition of silt or mud on the reef.
The destroyed and scattered seawall at South Kerala, west coast of India (source: Raseed, 2006).

Chapter 2 FUNDAMENTALS OF COASTAL HYDRAULICS AND ENVIRONMENT
___________________________________________________________________________________________
____________________________________________________________________________________________
March 2009 2A-9
Swash of high energy waves forms the main agent of sediment removal. This washover by waves of
translation generated by the tsunami erodes the beach sand and deposits on the backshore beds on
the rear face in standing water at abnormally high levels through storm set-up. In both, unidirectional currents produce sediments with certain resemblances to alongshore transport.
Saline Intrusion into Surface and Subsurface water
Coastal freshwater aquifers are the major sources of drinking water in most coastal areas. The tsunami waves may transport large volumes of seawater into inland water bodies and also create
large tidal pools of seawater which percolate into coastal freshwater aquifers and salinize them. Massive quantity of sea water that inundate the coastal lands may extend for 0.5 km to 2.0 km area
inland (in Meulaboh, 15km was reported). Due to reasons of poor drainage, the condition could remain for a few days affecting the quality of groundwater. The surface water resources meant for
irrigation and drinking could also be affected by the ingress of sea water.
In most of the affected areas the sea water intrusion changed the soil conditions and turned it to be
unfavourable for immediate crop cultivation. The primary effect of total salinity is a reduction of water availability to roots through osmotic effects. Yields of most crops are substantially reduced. In
some areas there is a unique impact of stagnation of sea sediments, debris and sea water. The thick
slushy black deposits on the soil surface cause heavy damage to the soil structure and standing crop. The relative rise of the sea level will cause a change in water balance between the fresh water layer
and the saline water layer (Figure 2A.10). Generally, saline water will push the fresh water lense further to the inland. This can affect a strip of several hundreds of meters. Especially in areas where
groundwater is pumped for irrigation this effect has to be carefully monitored to prevent saline water
intrusion and degradation of water quality.
Figure 2A.9 Before and After Aerial Images of Aceh, Sumatra

Chapter 2 FUNDAMENTALS OF COASTAL HYDRAULICS AND ENVIRONMENT
___________________________________________________________________________________________
____________________________________________________________________________________________
2A-10 March 2009
Figure 2A.10 Impact of sea level rise on saline intrusion and groundwater table
Tidal Bore Entry into River Mouth
The small number of tsunamis that do break often form vertical walls of turbulent water called bores. These waves travel much farther inland than normal waves. When waves enter a semi-enclosed
basin such as a harbour or a funnel-shaped river mouth, the amplitude of the waves will increase and its duration decreased to a point where it appears that there is a sudden increase in water level.
The funneling effect of the river will increase the travel speed of the bore against the direction of the
river current and thereby leading to a backwater flooding upstream. Post-tsunami assessment reports such an event occurring in Kuala Sg. Muda, Kedah and Sg. Melaka in Langkawi.
Figure 2A.11 Tidal bore incidents due to tsunami
Sea sediment deposition
In tsunami affected areas, sediments of fine grey layer to greyish brown layer of varying depths (5cm to 35 cm) were found to be deposited in the low-lying coastal areas. Residual high content of
salt was found in the layers of clay and silt left behind by the tsunami waves. These layers can be easily identified by cracks that spread across the surface of the soil. Other problems related to
lateral and vertical movement of the islands are slow changes in island morphology that may occur over time through processes of scouring and sedimentation. This could have various effects on
agricultural land. However, all these processes are slow and are not easily determined.
Saline water
Fresh water Sea level rise
Original
groundwater table
New groundwater
table
Tidal bore entry into a river mouth at Puthu-Vypeen, South Kerala, India (source: Rasheed, 2006)
Tidal bore propagating up the Qiantang River near Hangchow, China (source: Dr. Hubert Chanson’s Gallery)

Chapter 2 FUNDAMENTALS OF COASTAL HYDRAULICS AND ENVIRONMENT
___________________________________________________________________________________________
____________________________________________________________________________________________
March 2009 2A-11
Uplifting or Ground Subsidence
During the December 26 Tsunami, major uplift and subsidence, about 2 – 5 m, has been reported in the Andaman and Nicobar islands as well as the islands off the Aceh Coast and Aceh mainland. In
Aceh, where subsidence is visible, it is less than one meter. Inhabitable or arable lands that were close to the sea are now submerged, either permanently or with high tide. Coconut trees that were
close to the coast and were not uprooted by the tsunami are now standing in the sea. Jetties are deeper or submerged. Evidence of uplift is shown by the new occurrence of shallow corals or corals
being exposed above water. Mangroves are also observed to be standing dry in some places.
Subsidence and uplift could be permanent and land lost to the sea cannot be reclaimed. The immediate impact of subsidence is that farmers have to be relocated if they lost their land, and also
now that these areas are very close to sea, problems with lateral seawater intrusion will start.
Drainage systems can also be affected. In fact, field and channel drainage can be submerged
because of higher water level in estuaries and river mouths due to the influence of the higher sea water table (Figure 2A.12). Submersion reduces the drainage capacity and cause problems of water
logging and salinisation.
Figure 2A.12 Effect Of Sea Level Rise On Drainage Capacity
6 Tsunami Modelling And Risk Mapping
The Indian Ocean tsunami in December 2004 showed the potentially catastrophic consequences of
natural hazards of tsunami waves. Malaysia, with 4800km of coastline is surrounded by active seismic forces that may originate from the Indian Ocean, South China Sea, Sulu Sea and the
Sulawesi Sea. Practically the entire shoreline is at a certain degree of risk.
Computer modeling of tsunami propagation and amplification processes can be carried out to
produce a tsunami-proned vulnerability index map which would be able to identify parts of the Malaysian coastline that are vulnerable to tsunami. The map will be able to indicate the degree of
exposure and quantify the risk index of each area based on the tsunami height and inundation, the various levels of impact severity towards existing coastal population, property and land use, and will
also indicate the resources and human settlements within the study area. Most of all, it would help
planners to establish a zoning scheme for potential coastline development based on its sensitivity to tsunami. This will also assist the local authorities in developing evacuation plans in areas at risk of
potentially dangerous tsunamis.
Original water level in drainage system New water level
Relative
rise in sea
level

Chapter 2 FUNDAMENTALS OF COASTAL HYDRAULICS AND ENVIRONMENT
___________________________________________________________________________________________
____________________________________________________________________________________________
2A-12 March 2009
(This page is deliberately left blank)

Chapter 3 COASTAL EROSION CONTROL MEASURES
___________________________________________________________________________________________
___________________________________________________________________________________________
March 2009
CHAPTER 3
COASTAL EROSION CONTROL MEASURES


Chapter 3 COASTAL EROSION CONTROL MEASURES
___________________________________________________________________________________________
___________________________________________________________________________________________
March 2009 3-i
Table of Contents
Table Of Contents ...................................................................................................................... 3-i
List Of Figures............................................................................................................................3-ii
3.1 GENERAL OBJECTIVES AND GUIDELINES FOR COASTAL PROTECTION ............................... 3-1
3.2 HARD ENGINEERING SOLUTION ....................................................................................... 3-1
3.2.1 Revetment .............................................................................................................. 3-1
3.2.2 Seawalls ................................................................................................................. 3-3
3.2.3 Groynes .................................................................................................................. 3-4
3.2.4 Breakwaters............................................................................................................ 3-5
3.2.5 Headlands And Bays ................................................................................................ 3-7
3.2.6 Bunds And Dykes .................................................................................................... 3-8
3.3 ENVIRONMENT FRIENDLY SOLUTION ............................................................................... 3-9
3.3.1 Beach Nourishment ................................................................................................. 3-9
3.3.2 Beach Dewatering ................................................................................................. 3-11
3.3.3 Mangrove Replanting ............................................................................................. 3-11
3.3.4 Natural Defense .................................................................................................... 3-13
3.4 NON-STRUCTURAL MEASURES........................................................................................ 3-13
3.4.1 Set-Backs.............................................................................................................. 3-13
3.4.2 Retreat ................................................................................................................. 3-14
REFERENCES........................................................................................................................... 3-14
APPENDIX 3-A : EXAMPLE OF ROCK REVETMENT DESIGN CALCULATION................................... 3A-1
3-B : DESIGN SOLUTION FOR COASTAL EROSION PROBLEM, i-CED......................... 3A-10
3-C : BEACH DE-WATERING OR BEACH DRAIN ....................................................... 3A-11

Chapter 3 COASTAL EROSION CONTROL MEASURES
___________________________________________________________________________________________
___________________________________________________________________________________________
3-ii March 2009
List of Figures
Figure Description Page
3.1 Typical Revetment 3-2
3.2(a) Example of Typical Section of Seawall 3-3
3.2(b) Run-up Deflector Made To Blend As Part Of The Landscape At Gurney Drive 3-3
3.3 Groyne Field At Tak Bai, Thailand 3-4
3.4 Typical Rubble Mound Groyne 3-5
3.5 Breakwater At Kertih 3-6
3.6 Pengkalan Datu Breakwater 3-6
3.7 Breakwaters At Merang 3-7
3.8 Naturally Occurring Crenulated Bay 3-7
3.9 Crenulated Bays At Sentosa, Singapore 3-8
3.10 Breakwaters In Bintulu 3-8
3.11 Bund Protecting Agriculture Land At Sabak Bernam 3-9
3.12 Beach Nourishment at Port Dickson 3-10
3.13 Escarpment Protection In Front Of Mangroves At Sungai Burong, Selangor 3-12

Chapter 3 COASTAL EROSION CONTROL MEASURES
___________________________________________________________________________________________
___________________________________________________________________________________________
March 2009 3-1
3 COASTAL EROSION CONTROL MEASURES
3.1 GENERAL OBJECTIVES AND GUIDELINES FOR COASTAL PROTECTION
As mentioned in Chapter 2, coastal erosion can be due to natural processes of coastal sediment transport dynamics not in equilibrium and or man made intervention such as structures built along
the coastline which disturb the dynamic equilibrium of the coastal sediment transport. The
consequence is the loss or threat of damages of existing facilities, properties, valuable land and the natural habitats and vegetations.
The general objectives of coastal erosion control measures are to protect the existing facilities,
properties etc from the threat of coastal erosion and /or to avoid human activities which may result in triggering coastal erosion or subjecting the properties to the threat of erosion. Where it is of social
and/ or economic importance, construction focused and reactive erosion control measures are
normally instituted to check further loss of valuable land , facilities etc. However it is the aim of the Department to obviate the need for expensive protective works in future through the regulating and
controlling of the planning and implementation of projects in the coastal zone by giving due consideration to the potential coastal erosion that may arise.
The broadly defined objective of design is to achieve a stated objective of the coastal erosion control measure at minimum total cost, totaled over the life span of the structure. Another aspect in
considering the design objective is the increasing importance of the need to protect the environment from the adverse impact caused by the erosion control measure. The total financial cost of a design
over its life span is not always easy to evaluate. Furthermore due to budget consideration and urgency of implementation, the lower capital cost design is often being the preferred option even
though it means a higher maintenance or total renewal costs.
Broadly there are two types of solutions to mitigate coastal erosion problems, namely structural or
engineering solutions and non-structural solutions
3.2 HARD ENGINEERING SOLUTION
Commonly the structural solutions involving hard engineering solutions are revetments, seawalls, groynes , breakwaters and headlands. Usually structural solutions have immediate short term and
sometimes long lasting environmental impacts. A common example is the protection of one stretch
of coastline from the threat of erosion which often results in the down drift erosion of the adjacent stretch. Hence selection and application of a particular structural solution requires adequate
understanding of the consequences of its impacts on and adjacent to the area. Generally one or combination of two or more of the mentioned structures is suitable and effective in addressing the
erosion problem in sandy coast. However, the difficulty in assessing the effect of interaction between
waves and cohesive soils has made the effectiveness of some of these structural solutions doubtful. Nevertheless, basing on Department’s experience, rubble mount revetment has by far been proven
to be an effective solution in muddy coast.
3.2.1 Revetment
Revetments are structures built along the shoreline to prevent retreat of the shoreline and thus fix the shoreline. The structures are usually built where there is no longer any room for movement of
the shoreline without affecting valuable landed assets. It is generally the cheapest form of coastal
protection with the least impact on the adjacent coastline. However, it does not prevent erosion of the foreshore and is prone to erosion along the flanks. Figure 3.1 shows a typical revetment. The
Coastal Division has a well documented design file for the rock revetment (refer Appendix 3-A) and has later developed and issued design software together with a user manual. (Refer Appendix 3-B).

Chapter 3 COASTAL EROSION CONTROL MEASURES
___________________________________________________________________________________________
___________________________________________________________________________________________
3-2 March 2009
Figure 3.1 Example of Typical Revetment
The features of a revetment are as follows:
(i) Toe
The toe is usually massive. The aim of the toe, is to prevent rotational slip failure. Revetments are usually constructed in areas of soft ground, thus the toe must act as a counterweight against slip
failure.
Another purpose of the toe is to prevent undermining of the revetment as the foreshore erodes. The
toe is usually designed to be flexible so that the structure can adjust to the change in the level of the foreshore. In some cases, the toe is partially buried just below the expected level of erosion.
The toe is also usually where the strongest wave action occur. Thus the size of the rocks or armour
units at the toe must be large to prevent damage by wave action.
(ii) Slope The slope is usually where the wave breaks. The breaking of the waves can dislodge armour units
or rocks that are undersized. Thus the size of the rocks or armour units must be sufficient to prevent movement due to waves breaking on the structure. The stability of the armour units or
rocks depend of the size, shape and density of the units and the slope of the structure. The
Hudson’s formula is a popular formula used in determining the weight of the armour unit. The Hudson’s formula is as follows.
W = ρr g H3
___________ .......................................................... (3.1)
KD (Sr-1)3 cotα
Where; W = weight of the armour unit
ρr = density of the armour unit
g = acceleration due to gravity
H = design wave height KD = coefficient of the shape of the armour unit
Sr = specific gravity of the armour unit
α = angle of slope
It can be seen from the above formula that the steeper the slope, the bigger the armour unit will be.
The KD factor is also important factor in the size of the armour units. Rocks normally have a KD factor of between 2 to 3 while armour units such as Tetrapods can have a KD factor of around 7.
The slope also affects the wave run-up, i.e. the level of the water body that flows up the slope when
the wave breaks on the slope. The steeper the slope, the higher the wave run-up will be. Thus, at
near vertical slopes, such as on seawalls, the run-up can be so high that observers say that the wave reaches to the level coconut trees. In actual fact, what they are seeing is not the wave crest but the
wave run-up.
1800 2400 8000 5700 2700
EGL
EGL
0.90
2.90
-0.90
Geotextile Filter Layer Secondary
Rock Layer
Armour Rock Layer
Backfill with excavated
spoil
Backfill with excavated spoil
1:1:
1.5:
1.1 1.2m 0.6m
Toe
Crest
Slope

Chapter 3 COASTAL EROSION CONTROL MEASURES
___________________________________________________________________________________________
___________________________________________________________________________________________
March 2009 3-3
The roughness and porosity of the armour layers also affect the level of the wave run-up. The
rougher the armour layer and the more porous the slope is, the lower will be the run-up. Thus, a
smooth slope using artificial units such as Flexslab, will have a higher run-up compared to slopes using armour rocks.
(iii) Crest
The crest of the revetment must be high enough to prevent overtopping due to wave run-up or storm surges. Excessive overtopping can cause failure of the revetment due to erosion of the
backslope. Where it is not possible to make a high crest level, run-up deflectors may be used to
prevent overtopping. On the crest, the rocks or armour units are extended to certain distance landward to absorb the wave run-up.
(iv) Secondary Layer
Beneath the armour layer, a secondary layer must be placed to increase the porosity of the
revetment. The layer is also necessary to provide additional friction and stability to the armour units above. It also acts as a filter to prevent loss of material from the soil below.
(v) Filter Layer
Filter layer is usually made of the combination of gravel and geotextile. The filter layer is placed underneath the secondary layer to allow the flow of water through the revetment in and out of the
soil without causing loss of fines from the soil. The gravel is placed on the geotextile to prevent
puncture of the geotextile by the heavier and normally more angular rocks of the secondary layer. If the rocks of the secondary layer is small enough, the gravel for the filter layer may not be necessary.
In this case, only the geotextile is placed.
3.2.2 Seawalls
Seawalls are vertical structures built along the shoreline to prevent erosion of the shoreline. The
walls are usually made of sheet piles, concrete or rubble pitching and usually designed as retaining walls. However, as mentioned earlier, a vertical or near vertical wall can cause extremely high wave
run-ups. Vertical walls can also cause wave reflection, causing a nearly doubling of the wave height where the crest of the incident wave coincides with the reflected waves. This increase in the wave
height can cause agitation of the foreshore material, resulting in the erosion of the foreshore. This
will in turn cause undermining of the toe of the seawall, resulting in overturning of the wall. Many seawalls have failed this way. It is therefore important to provide toe scour protection in the design
of seawall.
Figure 3.2(a) Example of Typical Section of Seawall Figure 3.2(b) Run-up Deflector Made To Blend As Part Of The Landscape
At Gurney Drive
Armour Rock Toe Protection
Deflector

Chapter 3 COASTAL EROSION CONTROL MEASURES
___________________________________________________________________________________________
___________________________________________________________________________________________
3-4 March 2009
3.2.3 Groynes
Groynes are structures built perpendicular to the shoreline with the aim of interrupting the littoral drift. This creates accretion updrift of the groynes and erosion downdrift. Typically, the impact of
the groynes along the coast can extend between 3 to 5 times the length of the groynes. The impact is very much dependent on the magnitude of the littoral drift and the direction of the predominant
waves.
Groynes are usually constructed in a series. One way of construction will be to build the downdrift
groyne first and wait for the updrift coastline to accrete before constructing the next groyne on the updrift side. However, this is a slow method of coastal protection. Furthermore, while waiting for
the updrift fillet to build naturally, the downdrift coastline will be suffering erosion. Therefore most groynes in a field are constructed simultaneously and the section of the shoreline between the
groynes are filled artificially with sand. Figure 3.3 shows an example of a groyne field constructed at
Tak Bai, Thailand.
Figure 3.3 Groyne Field At Tak Bai, Thailand
The important features of a groyne are as follows:
(i) Tail
The tail of the groyne must be constructed beyond the level of the wave uprush. This is to prevent
groyne from being eroded from behind and eventually being detached from the shoreline.
(ii) Trunk The trunk should be sufficiently high from the existing beach level to trap the sand. However, the
trunk should not be too high or else it will obstruct the view and affect the aesthetics of the beach.
Normally the crest of the trunk should not be more than 1 to 2 meters above the existing beach level. The base of the trunk should be sufficiently deep to prevent loss of material from underneath
the groyne.
(iii) Head The head of the groyne should be massive and strong enough to withstand the impact of the waves
as most of the wave energy will be concentrated at this point. The structure must also be flexible as
there will be a lot of beach movement at this location.
Groynes can be made from various materials. Sheet piles, wood, geotubes and rocks have been used to build groynes. The most popular material is still rock as the material is flexible. There may
be some degree of voids among the rocks, and the practice is to put a center core to prevent
Sg. Golok breakwater

Chapter 3 COASTAL EROSION CONTROL MEASURES
___________________________________________________________________________________________
___________________________________________________________________________________________
March 2009 3-5
sediments from moving through the structure. However, there has been an observation on groynes
constructed in Selangor where sediments deposits inside the voids among the rocks effectively
sealing the voids.
Base of Groyne
Figure 3.4 Typical Rubble Mound Groyne
3.2.4 Breakwaters
Breakwaters are structures placed on the foreshore or offshore to create calm areas landward of the
structures. It has features similar to revetments, but being placed away from the shoreline, the wave heights that break on the structure will normally be bigger, resulting in much larger armour
sizes. The size of the armouring at the toe may be smaller if waves are not expected to break on
the toe. Some breakwaters may be designed to allow for wave overtopping, in which case, the backslopes of the breakwater will also be armoured to prevent damage due to the flow of the water
over the crest. If the waves are expected to break on the crest, the crest may be strengthened with large amour units. In some cases, the crest may also be widened to prevent armour units from
being dislodged.
The ends of the breakwater are particularly vulnerable to damage as the degree of the interlocking
of the armour units are not high as if the units are placed on the trunk of the structure. Furthermore, wave energy, due to the action of refraction and diffraction, tends to concentrate at
this point. Thus the armour units are usually larger at the ends of the breakwater or the slope of the breakwater at the ends are usually made more gentle.
Since breakwaters are used to create calm areas landward of the structures, they are mainly used to create harbour areas. However, by reducing the wave energy arriving on the shoreline, they can
also be used to protect the shoreline. The reduction in wave energy reduces the longshore drift and
Tail Trunk Head
Beach Level
Sand Geotextile
Armour Rocks
Typical Cross-section
Plan
Long Section
Beach Level

Chapter 3 COASTAL EROSION CONTROL MEASURES
___________________________________________________________________________________________
___________________________________________________________________________________________
3-6 March 2009
onshore-offshore sediment movement, resulting in deposition in the calm areas. This deposition is
called a tombolo.
Breakwaters can be either offshore or shore-connected. Figure 3.5 shows an example of offshore
breakwater at Kertih constructed to create a calm area for ships to anchor. Note the tombolo created along the shoreline. The effect of the creation of this tombolo is the erosion to the south of
the tombolo. In order to prevent this erosion, a series of groynes were constructed.
Figure 3.5 Breakwater At Kertih
At Pengkalan Datu, a pair of shore-connected breakwaters was built to keep the river mouth open
for navigation and flood mitigation. The effect of this construction was to create deposition to the south of the breakwater and erosion to the north. This is a classic example of the impact of a shore-
connected breakwater interrupting the littoral drift.
Figure 3.6 Pengkalan Datu Breakwater

Chapter 3 COASTAL EROSION CONTROL MEASURES
___________________________________________________________________________________________
___________________________________________________________________________________________
March 2009 3-7
Deposition in the calm areas landward of breakwaters can also cause problems. This situation
occurred at Merang, Terengganu. A pair of breakwaters was constructed to create a calm area for
ferries to berth. However, the calm area promoted deposition of sediments that was moving in the littoral drift.
Figure 3.7 Breakwaters At Merang
3.2.5 Headlands and Bays
Strategically placed artificial headlands can create stable bays called crenulated bays or hook shaped bays. These bays replicate the naturally occurring stable bays that can be observed along the
coastline of Malaysia (Figure 3.8). In fact, the theory of crenulated bays was developed through
observation of the coastline of Malaysia.
Figure 3.8 Naturally Occuring Crenulated Bay
Headland
Headland
Bay

Chapter 3 COASTAL EROSION CONTROL MEASURES
___________________________________________________________________________________________
___________________________________________________________________________________________
3-8 March 2009
The system works by creating a littoral cell where the sediment transport is confined mainly within
the cell. The action of diffraction and refraction shapes the shoreline eventually turning it into a
hook shaped bay. In a stable, independent littoral cell, the waves arrives perpendicular to the shoreline at all points along the shoreline. One example of the use of this system to protect the
coastline is the beach at Sentosa Island, Singapore (Figure 3.9). In Bintulu, Sarawak, the Department of Irrigation and Drainage had successfully constructed a series of breakwaters to create
stable pocket beaches (Figure 3.10).
Figure 3.9 Crenulated Bays At Sentosa, Singapore
Figure 3.10 Breakwaters in Bintulu
3.2.6 Bunds and Dykes
Bunds and dykes are not used to stabilize the shoreline. The main aim of these structures is to prevent inundation of low-lying areas by sea water. In much of the agricultural areas along the west
coast of Peninsular Malaysia, the land is below the high tide and will be inundated by sea water if not protected by bunds (Figure 3.11). In the past, the bunds are constructed sufficiently far from the
fringe of mangrove forest making protection of the bund from the wave impact unnecessary. The
rule then was that all bunds must have a 10 chains wide buffer of mangroves between the bunds and the sea.

Chapter 3 COASTAL EROSION CONTROL MEASURES
___________________________________________________________________________________________
___________________________________________________________________________________________
March 2009 3-9
Figure 3.11 Bund Protecting Agriculture Land at Sabak Bernam
However, development pressure and the erosion of the shoreline has in many cases created situations where the wide buffer of mangroves have disappeared and consequently the bunds are
directly subject to the impact of the waves. In these cases, the bunds need to be upgraded and
protection features be provided in front of the bunds to prevent erosion. The design of bunds now needs to incorporate the design of the revetment.
Bunds need constant monitoring and maintenance. The collapse of a bund can be catastrophic to an
agricultural area as inundation by sea water will cause the soil to become saline and the crops damaged. In some cases, it will be several years before the land can be planted again. (Refer
details in chapter 8)
3.3 ENVIRONMENT FRIENDLY SOLUTION
The other group of structural solutions involves environment friendly solutions which can be an engineering solution as well as natural defense solution. With the increasing awareness and
emphasis on the need to protect the environment, this option has become a preferred solution than the hard engineering solution.
3.3.1 Beach Nourishment
Beach nourishment is a popular method in rehabilitating sandy beaches. In areas where the littoral drift is causing loss of the beach material, replacing the lost material with sand is one option in
coastal protection. This method is preferred if the beach is to maintain its natural characteristics and
the movement of sediments along the shoreline is not to be interrupted. This method however does not stop the process of erosion. Thus beach nourishment must be carried out regularly, every 5
years or so.
Beach nourishment is usually more expensive than revetments. However, if access to the beach and
its aesthetic quality is more important and with the increasing commercial, residential, recreational and environmental values and investments along the shoreline, beach nourishment may become a
much preferred options. Important tourist beaches such as Port Dickson and Pantai Cahaya Bulan, Kota Baru, Kelantan have been protected using beach nourishment.

Chapter 3 COASTAL EROSION CONTROL MEASURES
___________________________________________________________________________________________
___________________________________________________________________________________________
3-10 March 2009
Since beach nourishment works by replacing the sand that has been lost to the system, the coastal
processes will eventually erode the nourished beach to the line before the nourishment exercise. In
some situations, this occurs at a rate faster than expected. The reasons for this can be several.
(i) The beach line is at a more seaward position than before the nourishment, resulting in stronger littoral drift and stronger onshore-offshore movement than expected.
(ii) The wave climate may vary from year to year and there may be certain years where the wave climate is stronger than normal, resulting in a faster rate of erosion.
(iii) The sand used as the nourishment material is finer than the original beach sand,
resulting in faster erosion rate.
Bagan Pinang Nourished Beach Magnolia Bay Nourished Beach
Figure 3.12 Beach Nourishment at Port Dickson
Since the nourished beach is expected to be eroded away, it is clear that periodic re-nourishment of
the beach is required.
Beach nourishment material is usually placed such that the beach is extended seaward and the initial underwater slope is substantially steeper than would be associated with an equilibrium beach profile.
Upon the completion of placement of beach nourishment, the profile will commence to spread out
laterally to the adjacent beaches. Since the waves are the mobilizing factor which cause the spreading out of the nourishment, the performance of beach nourishment is quite sensitive to the
wave energy level at the project site as well as the alongshore length of the project. The nourishment material grain size relative to the native is an important determinant in the performance
of beach nourishment as well. Specifically, because coarse sands are naturally associated with
steeper slopes than fine sands, if the nourishment sand is coarser than the native, the additional dry beach width after equilibration will be substantially greater than if the nourishment sands were finer
than the native.
The primary environmental considerations for beach nourishment are the nourishment sand characteristics relative to the native. The nourishment sand, if poorly sorted than the native sand ,
may thus contain a greater proportion of fine material which can cause two adverse affects to the
environment. The first is during placement when silt and clay size particles remain suspended and can reduce light penetration, interfere with respiration of fish, and benthic flora and fauna including

Chapter 3 COASTAL EROSION CONTROL MEASURES
___________________________________________________________________________________________
___________________________________________________________________________________________
March 2009 3-11
coral. Thus silt curtain, sand washing and close monitoring of the timing of placement with the tide
condition are some of the measures that can be considered to mitigate the adverse impact. The
second is through a partial weak cementation of sand grains together, resulting in a beach that is less suitable for sea turtle nesting. This can usually be improved by tilling the beach surface with
normal agricultural equipment.
3.3.2 Beach Dewatering
Beach dewatering is another method in coastal protection. Recently introduced, this method is still in
its experimental stage. The beach dewatering system works by locally lowering the groundwater table in the uprush zone of the sandy beach, making it more difficult for the down rush water to
dislodge the sand from the beach as a higher fraction of down rush water percolates into the beach. Furthermore the physical properties of the beach sand is strengthened due to decreasing in pore
water pressure by the lowering of water table thereby making the beach more resistant against
erosion. The extent of the effectiveness of this method is still uncertain, which depends on various factors such as beach sand properties, waves condition, tide, groundwater table, erosion rate etc.
Therefore, careful and detailed study is required before this method is employed.
Lowering of ground water table is achieved by pumping the water out of the beach through pipes laid in the beach. Pumps, usually powered by electricity, are used to achieve this. Hence is the
drawback of this system, whereby the pump requires regular maintenance and the electricity used
adds to the operation costs. ( A more detailed account of this method is in Appendix 3-C)
3.3.3 Mangrove Replanting
The Department of Irrigation and Drainage has made several attempts at replanting of mangroves
with varying degrees of success. In the seventies, at Jeram, Tanjung Karang and Sungai Besar in Selangor, bamboo poles were split lengthwise and stuck into the mudflat. It was hoped that these
bamboo poles would hold the mudflat while the mangroves established themselves. There was success in some places but in most places the attempt result in failure. This was because the
mangroves were planted at a very low mudflat level, making the daily inundation period by sea water too long and the wave action too strong.
In Sungai Burong, Selangor, DID had a pilot project to replant 10 hectares of mangroves. 16,000 seedlings of Rhizophora were planted upon advice from FRIM. Although during the early years, the
young mangroves suffer high mortality due to attacks by caterpillars, 20% of the trees survived and established themselves. Avicennia also colonised the area in time. The Avicennia seedlings were
brought into the area by littoral currents and deposited in the area when the tide recedes.
The Sungai Burong experience reveals that;
a) Avicennia species grow well in tidal mudflats where the tidal flushing is most efficient, i.e.
during low tide the mud is completely exposed, and there is no stagnant water. This
condition usually occurs at the fringe where the mangrove belt meets the sea.
b) Dunes of crushed shells and sand usually occur behind the Avicennia and prevent the water from draining completely. This make the area more suitable for Rhizophora species. The
long seedlings of the Rhizophora can penetrate the soil when they drop and establish themselves and are also long enough not to be completely covered by water. Avicennia
seedlings will remain afloat in this condition and will not be able to establish themselves.
Furthermore, the breathing roots of the Avicennia will always be covered by water and will not be able to take in air.
c) Planting a mono crop, ie one species of mangroves will make the crop susceptible to pests
and diseases. This is similar to a plantation problem where a certain pest can destroy large
areas of crop in one attack. The best way to avoid this problem is to diversify the species. There are over 50 species of mangroves to choose from and planting a mixture of species
will give a better chance for the regenerated forest to survive.

Chapter 3 COASTAL EROSION CONTROL MEASURES
___________________________________________________________________________________________
___________________________________________________________________________________________
3-12 March 2009
DID has experimented with a combination of artificial and natural method of coastal protection. The
concept here is to protect the mangroves so that the mangroves can in turn protect the valuable agricultural land behind it. This method is called the escarpment protection and was first employed
successfully at Sungai Burong, Sabak Bernam, Selangor to protect a stretch of 1.4 km of coastline.
Figure 3.13 Escarpment Protection In Front Of Mangroves At Sungai Burong, Selangor
The soil beneath the mangrove forest is usually stronger than that of the deposited clay on the mudflat. Thus, when erosion occurs and the mudflat lowers, the soil develops a vertical face
underneath the mangrove line. The vertical face ranges from 0.5 to 1.0 meter. This face is called
the escarpment.
Mangrove trees have always been regarded as a wave attenuator, reducing wave energy as the wave travels through the swamp. Due to this, many efforts to replant mangroves on eroding
mudflats have been tried in order to arrest the erosion. However, mangroves cannot establish
below Mean Sea Level (MSL). Since the levels of the eroded mudflats are generally below MSL, the efforts were not successful. Between MSL and Mean High Water Spring (MHWS), mangroves grow
well and can provide adequate protection to the bund. The key is therefore to protect the soil beneath the mangroves, so that the trees will be able to do the rest of the work of reducing the
wave energy. Thus, the escarpment protection concept was formulated.
The structure was constructed such that it will not have a detrimental effect on the mangrove
ecosystem. The ebb flow must be able to go over the structure freely so that there will be no stagnant pools developing behind the structure. This is because different mangrove species require
different salinity and disturbing the ebb flow could affect the salinity regime.
The structure will protect the escarpment from erosion due to wave attack. Since the structure is
low, wave will still penetrate during high tide. The mangrove trees will then act as a wave attenuator and prevent the wave energy from reaching the bund. This will therefore prevent the
bund from being eroded. A mangrove belt of about 100 meters was provided to act as a wave attenuator. This is considered sufficient to reduce the wave energy and protect the bund behind the
belt.
A low structure has the advantage of being easily constructed. Building the structure on the
escarpment will also avoid loading that would endanger the bund. Should there be any failure of
Inset: Height of mangrove trees 15 years after replanting
Chapter 3 COASTAL EROSION CONTROL MEASURES
___________________________________________________________________________________________
___________________________________________________________________________________________
March 2009 3-13
the structure due to localised weak soil, there would be no immediate danger to the bund and
flooding of agricultural land would not occur. The Drainage and Irrigation Department would have
ample time to react to the failure before the bund is threatened.
20 years after construction, this method has proven to be successful in Sungai Burong. The escarpment protection is preventing the soil underneath the mangroves from eroding and the
mangroves are reducing the wave energy before the waves reach the bund.
3.3.4 Natural Defense
Where possible, the natural defenses of the coastline should be employed. This means providing
sufficient set-back to ensure that the development is well landward of the active zone of the shoreline. If the rate of erosion is known, a set-back that will result in a buffer that will give a
sufficient time frame for reaction to the erosion may be desirable. In some cases, the economic life
of the proposed development may be the time frame to be considered. Thus if the economic life is considered to be 30 years and the rate of erosion is assumed to be 3m/year, the set-back should be
at least 90m.
For sandy beaches, the accepted set-back in Malaysia is 60m. However, this may not be sufficient in areas where the rate of erosion is severe. The Pantai Chahaya Bulan in Kelantan was known to
experience shoreline retreat of more than 60m within a few years. In areas where the rate of erosion
is very small or the beach is stable, this value may however be too high. It is hard however to determine this value unless long-term beach monitoring and hydraulic studies are carried out. The
Integrated Shoreline Management Plan (ISMP) Study for the state of Pahang has recommended the 60m setback for the shoreline in Pahang and the ISMP study for Negeri Sembilan has recommended
30m setback for the shoreline of Negeri Sembilan.
In crenulated bays, the shoreline actually changes according to the seasons and in cycles over
several years. Thus there may be a wide dynamic zone within which the shoreline retreats and accretes. Understanding the cycle and determining the dynamic zone is important to ensure that the
development is protected from erosion.
3.4 NON-STRUCTURAL MEASURES
Since in most cases, erosion and accretion are natural phenomena, it is important to understand how to cope with these problems. It is not possible and definitely not economical to protect every
kilometer of the eroding coastline of Malaysia. In some cases, this will only transfer the problem
further along the coastline. It is therefore important to understand how to manage the problem. Wherever possible, the aim should be to avoid the problem altogether. There are several non-
structural measures that can be put in place to avoid the problems associated with shoreline movement. The most employed measures are to provide set-backs and to retreat.
3.4.1 Set-Backs
Set-backs are recommended for new development along the coastline. The standard set-back recommended by the Department of Irrigation and Drainage is 60 meters from the high water mark
for sandy coast and 400 meter from the edge of mangrove forest for muddy coast. The rationale behind this was based on observation of the movement of coastline of Malaysia. During the early
90s, when this policy was developed, it was found that the average fluctuations of coastline of
Malaysia were of those magnitudes. However, it has been nearly 20 years since this policy was developed and it is due for a thorough review.
There have been complaints from some local authorities that the policy is too strict and it restricts
development along the coastline. However, in some very dynamic areas, the prescribed set-backs
may not be sufficient. Only detailed long-term studies of the shoreline can answer this question. However as mentioned in Section 3.3.4 where there is ISMP study being carried out, the set back
guidelines for the particular coastline of the study is being reviewed with latest recommendation. If

Chapter 3 COASTAL EROSION CONTROL MEASURES
___________________________________________________________________________________________
___________________________________________________________________________________________
3-14 March 2009
there is lack of quantitative knowledge of the movement of the shoreline along a certain stretch of
coast, it is wise to adopt the prescribed policy as a guide rather than not to provide set-backs at all.
The aim of the set-back is to provide sufficient buffer for the shoreline to move. The movement of the shoreline is part of the coastal processes of the area. Restricting this movement in one area can
cause problems elsewhere along the coastline. Another aim is to allow sufficient time for protection works to be planned and implemented should the coastline starts to erode towards the development
at an excessive rate. Further information /discussion on set-back is deliberated in Section 9.6.7 of this manual.
3.4.2 Retreat
Retreat of the development is an option that has been implemented, where the cost of the retreat is much cheaper than the cost of protection. In Pengkalan Datu, Kelantan, where a village was
experiencing erosion, the village was resettled to a safer area close to the former village. In Miri,
where a road was being threatened by erosion, the road was retreated a bit further inland so that the communication between Miri and Kuala Baram could still be maintained.
However, this option may not be possible where the land price is so high that it is cheaper to protect
the coastline. It will also not be possible if there is no State land available for resettlement. It used to be acceptable to allow agricultural land to be eroded as the cost of protection was too high and
could be economically justified. However, with the rise in food and commodity prices, even
agricultural land needs to be protected now.
REFERENCES
[1] DID, “Compilation of Internal Documents Prepared by Coastal Engineering Division, DID
Malaysia on Coastal Erosion Control program, Coastal Zone Management Policies and Guidelines”.
[2] Robert G. Dean University of Florida, Gainesville, USA, “Beach Nourishment: Theory and Application, course Notes”, IEM October 1999.
[3] Dominic Reeve, Andrew Chadwick and Christopher Fleming, “Coastal Engineering ; processes, theory and Design practice”, Spon Press 2004

Chapter 3 COASTAL EROSION CONTROL MEASURES
___________________________________________________________________________________________
___________________________________________________________________________________________
March 2009 3-15


Chapter 3 COASTAL EROSION CONTROL MEASURES
___________________________________________________________________________________________
___________________________________________________________________________________________
March 2009 3A-1
APPENDIX 3-A
EXAMPLE OF ROCK REVETMENT DESIGN CALCULATION

Chapter 3 COASTAL EROSION CONTROL MEASURES
___________________________________________________________________________________________
___________________________________________________________________________________________
3A-2 March 2009
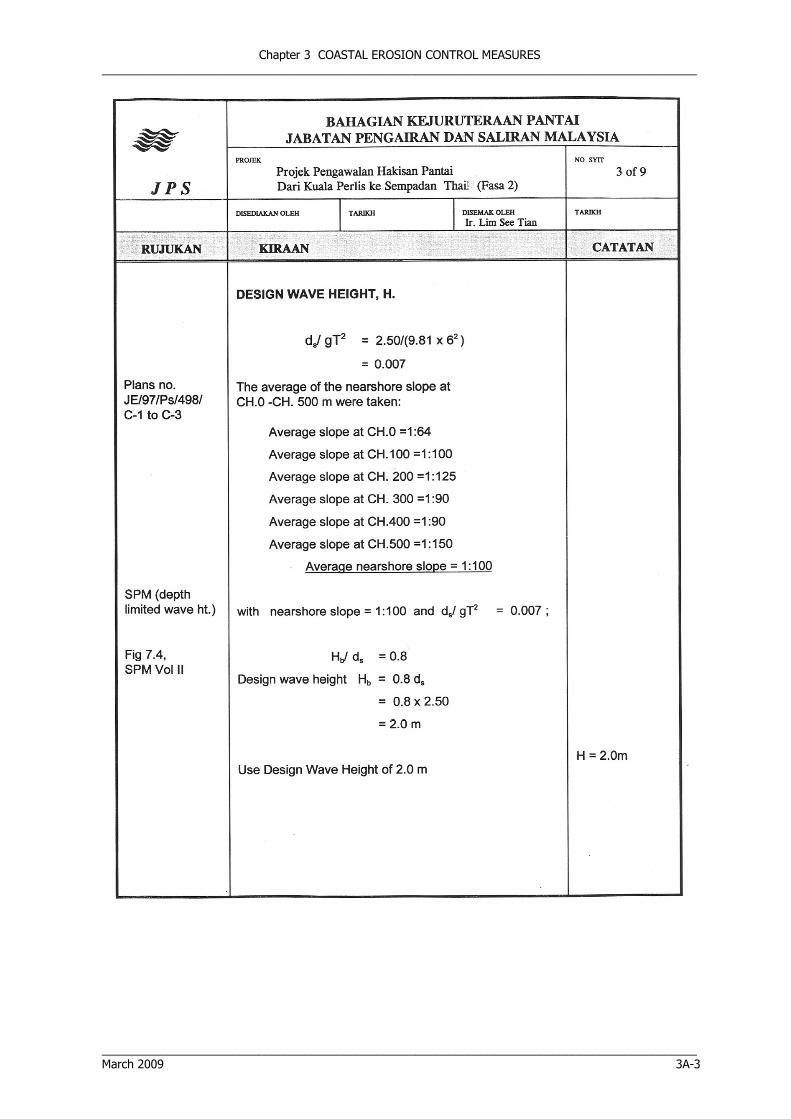
Chapter 3 COASTAL EROSION CONTROL MEASURES
___________________________________________________________________________________________
___________________________________________________________________________________________
March 2009 3A-3

Chapter 3 COASTAL EROSION CONTROL MEASURES
___________________________________________________________________________________________
___________________________________________________________________________________________
3A-4 March 2009

Chapter 3 COASTAL EROSION CONTROL MEASURES
___________________________________________________________________________________________
___________________________________________________________________________________________
March 2009 3A-5

Chapter 3 COASTAL EROSION CONTROL MEASURES
___________________________________________________________________________________________
___________________________________________________________________________________________
3A-6 March 2009

Chapter 3 COASTAL EROSION CONTROL MEASURES
___________________________________________________________________________________________
___________________________________________________________________________________________
March 2009 3A-7

Chapter 3 COASTAL EROSION CONTROL MEASURES
___________________________________________________________________________________________
___________________________________________________________________________________________
3A-8 March 2009
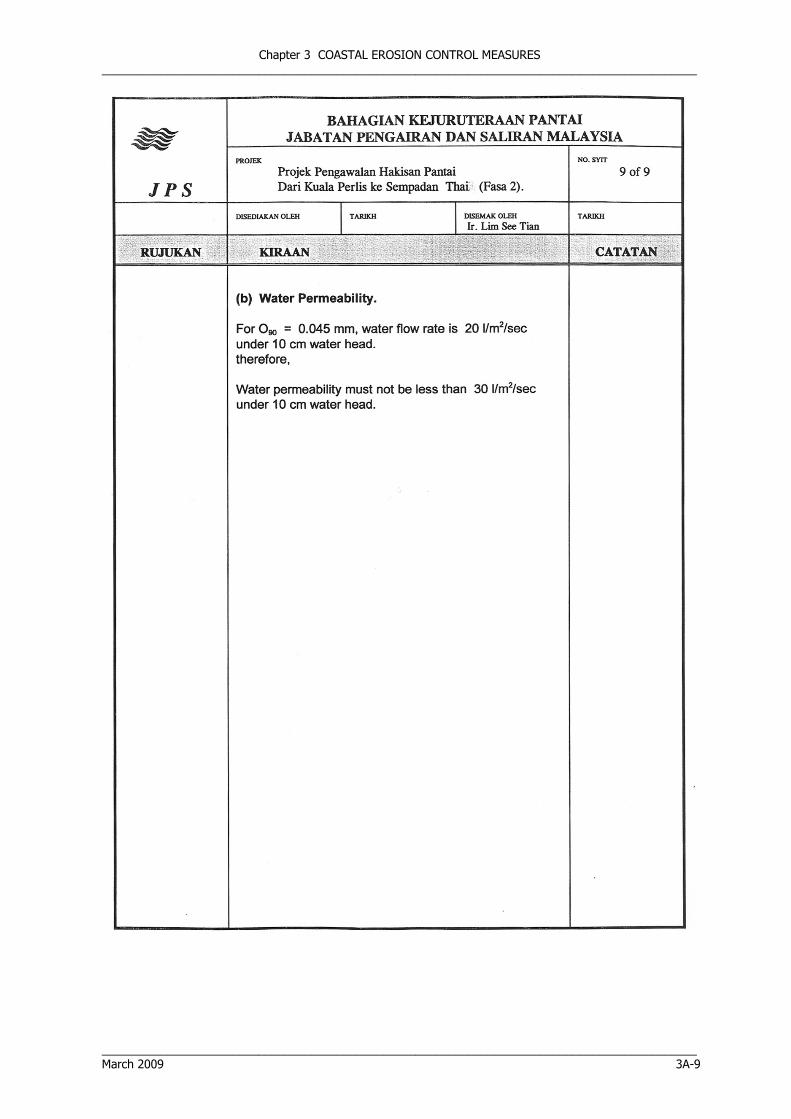
Chapter 3 COASTAL EROSION CONTROL MEASURES
___________________________________________________________________________________________
___________________________________________________________________________________________
March 2009 3A-9

Chapter 3 COASTAL EROSION CONTROL MEASURES
___________________________________________________________________________________________
___________________________________________________________________________________________
3A-10 March 2009
APPENDIX 3-B
DID Coastal Design 1 (i-CED Vers. 1.0)
DESIGN SOLUTION FOR COASTAL EROSION PROBLEM, i-CED
User’s Manual ( Year 2006)
i-CED Vers.1.0 is a design software for rock revetment. It carries out various analysis and
calculations in breaker Height analysis, rock size design, wave run-up and revetment crest level, toe apron etc.
The table of contents of the User’s manual is listed below
1. Preface 2. Software installation & System requirement
3. User Support 4. Getting Started – Disclaimer
5. Input Parameters & Output Results 6. Breaker Height Analysis
7. Rock Revetment Design
8. Rock Revetment Design Details 9. Bill of Quantity Calculations
10. Reference
It is to be noted that it does not perform slope stability to ensure structure stability.
Note: It is suggested that a rock revetment design manual be published by the Coastal Division which shall include design considerations, design criteria, slope stability analysis etc and this i-CED software forms part of the design tool for this suggested design manual

Chapter 3 COASTAL EROSION CONTROL MEASURES
___________________________________________________________________________________________
___________________________________________________________________________________________
March 2009 3A-11
APPENDIX 3-C
BEACH DE-WATERING OR BEACH DRAIN
Definition:
A beach de-watering system or beach drain, is a shore protection system working on the basis of a drain in the beach. The drain runs parallel to the shoreline in the wave
up-rush zone. The beach drain increases the level of the beach near the installation
line, thus also increasing the width of the beach. The beach drain method is patented world wide by GEO, Denmark.
Method:
The drain consists of a permeable plastic pipe installed 1.0 to 2.0 m below the beach surface in the wave up-rush zone. If there is a significant tide, the drain must be
installed close to the MHWS line, i.e. near the shoreline. The drain is connected to a pumping well from which the drain water is pumped, either into a lagoon or back
into the sea. The only visible part of the drain installation is the pumping well and a small control house.
Functional characteristics: The conditions influencing the function of the drain are summarised in the following:
- The site must have a sandy beach. The beach sediments must be sand, preferably with a mean grain diameter in the range of 0.1 mm < d50 < 1.0 mm
and preferably sorted to well sorted (Cu = d60/d10 < 3.5). These conditions give
the permeability that provides optimal functionality of the beach drain. - The beach drain works by locally lowering the groundwater table in the uprush
zone, which decreases the strength of the down-rush as a higher fraction of the water percolates into the beach. Furthermore, the physical strength properties of
the beach sand is increased remarkably by the lowering of the water table in the
wave up-rush zone thereby making the beach more resistant against erosion. The groundwater table in the beach is a function of several factors, the most
important of which are: a) the groundwater table conditions in the coast and the hinterland, b) the groundwater table caused by tide and storm surge, and c) the
groundwater table caused by waves.
- A high groundwater table in the coast and the hinterland influences beach stability and beach formation. The hinterland-based groundwater table saturates
a large portion of the beach, causing groundwater seepage through the foreshore. This seepage tends to destabilise (fluidise) the foreshore. The beach
drain locally lowers the groundwater table to the level of the drain and counteracts the destabilisation.

Chapter 3 COASTAL EROSION CONTROL MEASURES
___________________________________________________________________________________________
___________________________________________________________________________________________
3A-12 March 2009
- The beach drain works well at locations with relatively high tide because the tide
generates an elevated groundwater table in the beach, which can be lowered
considerably by the drain. It can therefore be stated that the presence of high tide at a location enhances the functionality of the drain.
- The presence of high storm surges will affect the functionality of the drain by moving the uprush zone landwards away from the drain. The function of the
drain during high surge conditions will mainly be indirect; the previously accumulated sand will act as a buffer for the erosion during the storm. When the
storm surge falls, the elevated groundwater-level in the beach will increase
beach erosion if there is no beach drain to prevent it. - Waves on a beach increase the height of the local groundwater table in the
beach, partly due to the wave run-up on the foreshore and partly due to the locally elevated water-level in the uprush zone called wave set-up. Once again,
the beach drain counteracts this.
- The beach drain requires some wave activity on the beach as the drain works by manipulating the downrush conditions on the foreshore. Too small and too high
waves make the beach drain inefficient. It works best on moderately exposed coasts.
- As the beach drain system functions only on the foreshore in the uprush zone, it does not directly protect the entire active profile against erosion. Consequently,
it is best suited at locations with seasonal beach fluctuations or where the
objective is a wider beach at an otherwise stable section of the shoreline. For locations that experience on-going recession of the entire active coastal profile,
the beach drain is probably only suitable combined with other measures. The long-term capability of the beach drain under such circumstances remains to be
tested.
Applicability:
The beach drain is best suited for the management of beaches with the following characteristics:
- Sandy beaches - Moderately exposed to waves
- Exposed to tide
- Suffering from high groundwater table on the coast and on the beach - Exposed to seasonal fluctuations of the shoreline
- Exposed to minor long-term beach erosion - Locations with a narrow beach, where a wider beach is desired
The beach drain is, however, not recommended as a primary shore or coastal protection at locations with the following characteristics:
- Severely exposed locations - Protected locations
- Locations exposed to severe long-term shore erosion and coast erosion
Source: Shoreline Management Guideline, October 2004, Karsten Mangor

Chapter 4 RIVERMOUTH/ TIDAL INLET MANAGEMENT AND PLANNING GUIDELINES ___________________________________________________________________________________________
____________________________________________________________________________________________ March 2009
CHAPTER 4
RIVERMOUTH/ TIDAL INLET MANAGEMENT AND PLANNING GUIDELINES


Chapter 4 RIVERMOUTH/ TIDAL INLET MANAGEMENT AND PLANNING GUIDELINES ___________________________________________________________________________________________
____________________________________________________________________________________________ March 2009 4-i
Table of Contents
Table of Contents ....................................................................................................................... 4-i
List of Tables ............................................................................................................................4-ii
List of Figures ............................................................................................................................4-ii
4.1 INTRODUCTION............................................................................................................... 4-1
4.2 RIVER MOUTH CHARACTERISTICS AND DYNAMICS ........................................................... 4-2
4.2.1 Dynamic Equilibrium And The Concept Of River Mouth Stability............................... 4-2
4.2.2 Catchment Characteristics ..................................................................................... 4-5
4.2.2.1 River and Catchment Size ......................................................................... 4-5
4.2.2.2 Discharge Characteristics .......................................................................... 4-7
4.2.2.3 Sediment Discharge.................................................................................. 4-8
4.2.3 Human Influences On Catchment Characteristics.................................................... 4-8
4.2.3.1 Landuse Change....................................................................................... 4-8
4.2.3.2 Climate Changes ...................................................................................... 4-9
4.2.3.3 Dams And Weirs....................................................................................... 4-9
4.2.3.4 Reclamation In Lower River System......................................................... 4-10
4.2.3.5 River Sand Mining................................................................................... 4-11
4.2.4 Coastal Characteristics And Morphology ............................................................... 4-11
4.2.4.1 Exposed (Sandy) Coastlines .................................................................... 4-12
4.2.4.2 Sheltered (Silty/Muddy) Coastlines .......................................................... 4-21
4.2.5 Challenges For River Mouth Intervention Schemes................................................ 4-24
4.3 CAUSES OF FLOODING................................................................................................... 4-24
4.3.1 Natural Causes of Flooding.................................................................................. 4-25
4.3.2 Causes Of Flooding Due To Human Activities ....................................................... 4-26
4.3.3 Sea Defence Design Considerations ..................................................................... 4-27
4.4 RIVERMOUTH IMPROVEMENT WORKS............................................................................. 4-28
4.4.1 Solution Strategy For Maintaining Entrances To Rivers, Streams And Other Outlets 4-28
4.4.2 Improvement Works For Streams And Low-Flow Drains ........................................ 4-29
4.4.3 Improvement Works For River Mouths ................................................................. 4-30

Chapter 4 RIVERMOUTH/ TIDAL INLET MANAGEMENT AND PLANNING GUIDELINES ___________________________________________________________________________________________
____________________________________________________________________________________________ 4-ii March 2009
4.4.3.1 Parallel Breakwaters Structures ............................................................... 4-32
4.4.3.2 Symmetrical Breakwaters........................................................................ 4-34
4.4.3.3 Single Main Breakwater Solution.............................................................. 4-36
4.4.3.4 Inlet and River Mouths Managed By Dredging Only .................................. 4-36
4.4.3.5 Inlet Managed Using Jetties And A Fixed Bypass Plant .............................. 4-37
4.4.4 Coastal Impact ................................................................................................... 4-38
4.4.5 Coastal Structures Interfering Actively With The Littoral Transport ........................ 4-38
4.4.5.1 Accumulation and Erosion For Coastlines With Oblique Wave Impact ......... 4-39
4.4.5.2 Accumulation and Erosion For Coastlines With Very Oblique Wave Impact . 4-40
4.4.5.3 Inlet Jetties At Tidal Inlets And River Mouths ........................................... 4-41
4.4.6 Maintenance Of River Mouths.............................................................................. 4-42
4.5 MANAGEMENT GUIDELINES............................................................................................ 4-43
REFERENCES........................................................................................................................... 4-45
APPENDIX 4-A : NAVIGATION CHANNEL DESIGN CONSIDERATION .......................................... 4A-1

Chapter 4 RIVERMOUTH/ TIDAL INLET MANAGEMENT AND PLANNING GUIDELINES ___________________________________________________________________________________________
____________________________________________________________________________________________ March 2009 4-iii
List of Tables
Table Description Page
4.1 The calculated risk, R, [in %] of failure of a sea defence structure with a lifetime, 4-27 L, [years] and design recurrence period, Td, [years].
List of Figures
Figure Description Page
4.1 Example Of Relatively Stable Tidal Inlet Dominated By Tidal Flushing And With 4-3 Limited Littoral Transport At Beaches Adjacent To The Inlet. Kuala Penyu, Sabah 4.2 Examples Of Small Stream/Drain Outlets Blocked By Beach Berm On West Coast 4-4 Of Labuan 4.3 Example Of Clogged Outlets At Pantai Sabak, Kelantan 4-5 4.4 Kuala Pahang River Mouth With Severely Restricted Outlets 4-6 4.5 Navigational Chart for Kuala Baram illustrating the protruding river mouth with 4-7 sand bar formations and extremely shallow conditions only slightly deeper than Chart Datum 4.6 Natural Delta Accretion (Left) And Coastal Erosion (Right) Of The Rosetta 4-10
Promontory Of The Nile Delta Caused Mainly By The Construction Of The High Aswan Dam In The 1960´S
4.7 Example Of Loss Of Intertidal Mangroves Which Has Significantly Reduced The 4-11 Tidal Prism Of The Lagoon, Which In Turn Reduces The Natural Depth Of The River Mouth
4.8 Crescent-Shaped Bays From The Southern Part Of The East Coast Of 4-13 Peninsular Malaysia 4.9 The Correlation Between The Shape Of A Crescent-Shaped Bay And The Transport 4-14
Supply To The Bay 4.10 Ebb And Flood Shoals At Tidal Channel, Cay Calker, Belize 4-15 4.11 Sediment Transport Associated With Both Updrift And Downdrift Portions Of 4-16
The Essex River Inlet, Massachusetts 4.12 Sedimentation Around Kuantan River Mouth 4-17 4.13 Historical development of coastline at Kuala Pahang, 1963 – 2006 4-18 4.14 Kuala Sg. Bebar In Pahang 4-19 4.15 Simulated Combined Tidal And Wave Driven Currents For Peak Flood Tide And 4-20
Peak Ebb Tide For A Rough North-East Monsoon Wave Condition
4.16 Chart Demonstrating The Shallow Tidal Channels And Extensive Mud Flats 4-21 Developed Around The Complex River System At Sepetang, Perak

Chapter 4 RIVERMOUTH/ TIDAL INLET MANAGEMENT AND PLANNING GUIDELINES ___________________________________________________________________________________________
____________________________________________________________________________________________ 4-iv March 2009
4.17 Tidal River Outlets On Muddy Coastline With Large Tidal Range – Sungai Sarawak 4-22 4.18 Aerial Photo With Surface Sediment Classification 4-23 4.19 Kuala Muda North Of Penang 4-24 4.20 Example of extreme water level analysis, flooding levels vs. recurrence interval 4-26
in years for the Danish West Coast. 4.21 Coastal Structures To Maintain Open Drains And Streams, Labuan West Coast 4-30 4.22 Sketch Of Main Breakwater Configurations Applied In Malaysia 4-30 4.23 Parallel Breakwater At Miri, Sarawak 4-33 4.24 Kuala Belait Breakwaters In Brunei 4-33 4.25 Marang Breakwaters 4-35 4.26 Ebb Tide Flow Before And After Construction Of Breakwaters At Kuala Terengganu 4-35 4.27 Single Main Breakwaters Along Terengganu Coastline 4-36 4.28 Top: Present bathymetry (1992). Bottom: Four stages of Grådyb tidal inlet, 4-37 which acts as the access channel to the port of Esbjerg, Denmark 4.29 Semi-Fixed Bypass Jet-Pump Plant At Oceanside Harbour, California 4-38 4.30 Schematic Shoreline Development, Morphological Development And Net Littoral 4-39
Drift Budgets For A Port At A Coast With A Slightly Oblique Resulting Wave Attack 4.31 Relation Between Transport And Angle Of Incidence & Schematic Shoreline 4-41
Development And Morphological Development For A Port At A Coastline With Very Oblique Wave Attack

Chapter 4 RIVERMOUTH/ TIDAL INLET MANAGEMENT AND PLANNING GUIDELINES ___________________________________________________________________________________________
____________________________________________________________________________________________ March 2009 4-1
4 RIVERMOUTH/ TIDAL INLET MANAGEMENT AND PLANNING GUIDELINES
4.1 INTRODUCTION
The history of Malaysia cannot be told without making frequent references to the significant role that the river and river mouth environment have played. Ancient river mouth settlements are numerous including that of the 5th-6th century trading communities in Bujang valley in south of Kedah to the 10th century iron production centre of the Santunbong settlement in the Sarawak river delta. For many reasons, present as well as ancient settlements have evolved around the river mouths and being a common setting in Malaysia’s natural environment throughout both Sarawak/Sabah and the Peninsula Malaysia the river mouths have come to play an important part of the livelihood of the Malaysian people and the development of the country. The apparent benefits of living by the rivers and in the river plains are ample but have always come with certain risks. For instance, there are historical evidence that certain settlements were severely affected by changes in climate during the last glacial period (i.e. approximately 40,000 years ago) and the abandonment of the Pulau Kelumpang in the Kuala Selingsing estuary, Perak settlement is discussed in “Early History of Malaysia” publication where the following chain of reasoning can be found: “The increasing siltation of the river banks and river mouth (..) probably hindered the inhabitants access to the river and the sea. As the main trade routes were along rivers and waterways this environmental change would have been sufficient justification for abandoning the settlement sites”. The siltation problems faced then are indeed still very relevant not just in Malaysia but throughout the colonised world as it affects both river mouth navigation and creates small and large scale flooding of e.g the river plains. In Malaysia, settlements are often situated just inside the river mouths to protect the fishing or trading fleets from the rough sea while providing quick access to the sea. Disadvantages of this practice are mainly a vulnerability to flooding, often a significant risk associated with navigating across the river mouth delta to gain access between the sea and the safe harbour as navigation can be very dangerous even for experienced sailors in this area in adverse conditions, and finally the morphological mobility of the river mouth should also be mentioned. Today, serious navigational and flooding problems are being mitigated by various river mouth improvement schemes which involve anything from simple periodic maintenance dredging operations to major structural interventions. The complexity of any of these river mouth interventions is large as such interventions are associated with changes in the existing conditions and may thus entail impacts on e.g. saline intrusion, river bank erosion, wave disturbance, water quality and coastal stability. Enhancing navigability, reducing flooding problems or limiting morphological changes often leads to a moderation of the existing sediment budget which may impact the conditions of adjacent coastlines. In many cases, the optimal solution is achieved by a compromise between many environmental, social and economical aspects. In the following, the main practices adopted internationally and in Malaysia are discussed with several examples of river mouth improvement schemes applied in Malaysian waters. Prior to this section an attempt is made to describe the physical characteristics of a river mouth which is defined by the local wave, hydrodynamics, river discharge and morphological settings. Any given river delta is in a state of dynamic equilibrium as a result of predominating wave, river flow and tidal forces as well as sedimentological conditions. River mouth interventions may however change conditions and the morphological response towards a new equilibrium can be drastic. Insight into the physical aspects of the river mouth dynamics is a pre-requisite to selecting an appropriate intervention strategy and adopting an engineering solution for a given site. A wide array of technical literature is available on river mouths and in particular tidal inlets. A detailed account of the theoretical works is beyond the present manual, which primarily focuses on the physical processes. The main reference book for the present description is the “Shoreline

Chapter 4 RIVERMOUTH/ TIDAL INLET MANAGEMENT AND PLANNING GUIDELINES ___________________________________________________________________________________________
____________________________________________________________________________________________ 4-2 March 2009
Management Gudelines”. The US Army Corps of Engineers “Coastal Engineering Manual” contains valuable information on international practices, while the “National River Mouth Study” contains valuable information for the river mouths in Malaysia.
4.2 RIVER MOUTH CHARACTERISTICS AND DYNAMICS
River mouths and tidal inlets were briefly described together with other coastal features in Section 2.7.3.6 of this manual. Whereas there are differences in characteristics of a tidal inlet, where the tidal flushing dominates over the net discharge of water, whereas a river mouth, which has a significant net discharge of water, the basic processes are similar. All tidal inlets in Malaysia have some net water discharge, and most rivers a degree of tidal flushing. There is thus no clear distinction, and the term river mouth will hereafter be used as a common term for all outlets, whereas the term tidal inlet will be used for cases with negligible net river discharge. Drainage outlets can be defined as small rivers. However, a distinction between drains and rivers outlets is made in the following to differentiate between outlets catering a larger catchment area and drains which discharge water from a very small area and thus often has severe flushing problems. The present Section describes the dominant factors controlling river mouth morphology to provide the physical background for understanding and addressing the challenges encountered in designing and implementing river mouth improvement works. River mouths are the links between river catchment and coastal dynamics, and reference to these phenomena are therefore included in the description with some overlap to other Chapters of the manual.
4.2.1 Dynamic Equilibrium And The Concept Of River Mouth Stability
The configuration of a river mouth entrance, mainly expressed through the cross-sectional area and minimum depth in the entrance, is governed by a delicate balance between opposing mechanisms. In a river mouth or a tidal inlet located on a sandy coastline a continuous battle takes place between mechanisms that tend to fill-in the entrance and mechanisms that struggle to remove the material from the entrance. The mechanisms that tend to clog up the entrance are related to the forces that bring sediment towards the entrance. The littoral drift induced by wave breaking along adjacent shorelines is often accountable for a significant fraction of in-fill material. Sediment brought to the river mouth entrances from the river itself acts as another infilling mechanism. In Malaysia it is often experienced that significant changes occur at the tail-end of the NE monsoon where the river plain has been supplied with fresh deposits over a couple of months. Mechanisms that tend to remove sediment from the entrance are related to the flushing from tidal, wind-induced and/or river flows scouring the entrance and delta channels. Also the waves have an effect through the stirring enhancement on the sediment and the transport capacity but these are often secondary effects. The delicate balance between the opposing mechanisms is often expressed through the concept of dynamic equilibrium. Often the river mouth morphology taken to be in a state of dynamic equilibrium is changing slowly or changes periodically on a certain limited time-scale. A river mouth in dynamic equilibrium is a river mouth that returns to an original shape at some point as the climate is periodic in nature. The concept of a dynamic equilibrium is expressing that:
• An equilibrium condition exists which is related to the flushing capacity of the river and the annual infilling volumes.
• A certain degree of variability is expected around the equilibrium. As the instantaneous strength between these mechanisms varies in time the entrance dimensions and its location is somewhat dynamic around the equilibrium.
A given river mouth is therefore characterised by its equilibrium as well as the degree of variability. The variability is particularly pronounced in regions with a monsoon climate where periods of rough wave and river discharge conditions succeed periods with dry and calm weather and so forth.
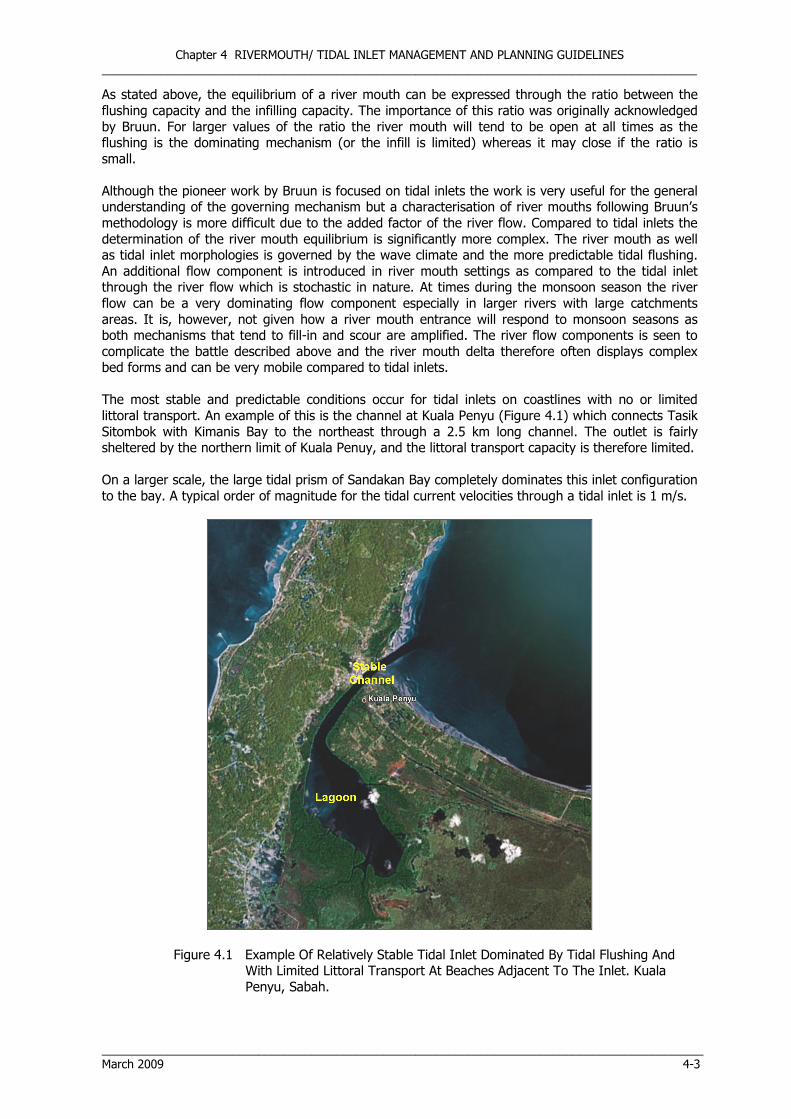
Chapter 4 RIVERMOUTH/ TIDAL INLET MANAGEMENT AND PLANNING GUIDELINES ___________________________________________________________________________________________
____________________________________________________________________________________________ March 2009 4-3
As stated above, the equilibrium of a river mouth can be expressed through the ratio between the flushing capacity and the infilling capacity. The importance of this ratio was originally acknowledged by Bruun. For larger values of the ratio the river mouth will tend to be open at all times as the flushing is the dominating mechanism (or the infill is limited) whereas it may close if the ratio is small. Although the pioneer work by Bruun is focused on tidal inlets the work is very useful for the general understanding of the governing mechanism but a characterisation of river mouths following Bruun’s methodology is more difficult due to the added factor of the river flow. Compared to tidal inlets the determination of the river mouth equilibrium is significantly more complex. The river mouth as well as tidal inlet morphologies is governed by the wave climate and the more predictable tidal flushing. An additional flow component is introduced in river mouth settings as compared to the tidal inlet through the river flow which is stochastic in nature. At times during the monsoon season the river flow can be a very dominating flow component especially in larger rivers with large catchments areas. It is, however, not given how a river mouth entrance will respond to monsoon seasons as both mechanisms that tend to fill-in and scour are amplified. The river flow components is seen to complicate the battle described above and the river mouth delta therefore often displays complex bed forms and can be very mobile compared to tidal inlets. The most stable and predictable conditions occur for tidal inlets on coastlines with no or limited littoral transport. An example of this is the channel at Kuala Penyu (Figure 4.1) which connects Tasik Sitombok with Kimanis Bay to the northeast through a 2.5 km long channel. The outlet is fairly sheltered by the northern limit of Kuala Penuy, and the littoral transport capacity is therefore limited. On a larger scale, the large tidal prism of Sandakan Bay completely dominates this inlet configuration to the bay. A typical order of magnitude for the tidal current velocities through a tidal inlet is 1 m/s.
Figure 4.1 Example Of Relatively Stable Tidal Inlet Dominated By Tidal Flushing And With Limited Littoral Transport At Beaches Adjacent To The Inlet. Kuala Penyu, Sabah.

Chapter 4 RIVERMOUTH/ TIDAL INLET MANAGEMENT AND PLANNING GUIDELINES ___________________________________________________________________________________________
____________________________________________________________________________________________ 4-4 March 2009
In contrast, river mouths with limited tidal prism and large variations in discharge rates on active littoral coastlines are notoriously unstable. Such river mouths may completely close for a period of time until a larger discharge event breaches the barrier deposited by the littoral transport. This is a very common problem for small streams and drain outlets - See e.g. example from the West Coast of Labuan in Figure 4.2.
Figure 4.2 Examples Of Small Stream/Drain Outlets Blocked By Beach Berm On West Coast Of Labuan. More notable streams/tidal inlets on the active East Coast of Peninsular Malaysia which are subject to relatively high littoral sediment transport are subject to similar conditions, see example from Pantai Sabak in Kelantan in Figure 4.3. It is noted that this type of blockage, whereas predominantly found for small rivers/drains and tidal outlets, is a cause of significant nuisance throughout Malaysia as the

Chapter 4 RIVERMOUTH/ TIDAL INLET MANAGEMENT AND PLANNING GUIDELINES ___________________________________________________________________________________________
____________________________________________________________________________________________ March 2009 4-5
blockage can lead to ponding of polluted water with resulting odour problems as well as small-scale flooding impacts during heavy rainfall prior to breaching of the barrier.
Figure 4.3 Example Of Clogged Outlets At Pantai Sabak, Kelantan. Since the stability of the entrance is related to the supply of sediment to the entrance, it can be significantly impacted by human interventions as well. Interventions on adjacent coastlines or inside the rivers may have severe impacts on the river mouth stability. Coastal structures may block the littoral drift whereas sand mining, deepening for navigation, construction of dams or drainage and irrigation schemes inside the river may change the flushing capacity (tidal prism) as well as the sediment supply. Other types of interventions such as construction of river dikes, logging of forested areas and discharge of silty spill water from sand and gravel mining may have the opposite effect, namely to increase the flow and the supply of surplus material to the sea. The impact of this can be an accumulation along sandy shorelines and the formation of muddy shoals. It is difficult to mitigate the impact of dikes at the dike location, as dikes are very critical structures for the safety of the low land adjacent to the protected section of the river. The stability, scale of problems and potential impacts from interventions in the natural balance vary greatly from river to river. A thorough understanding of the flushing and infilling mechanisms and their variations in time is a prerequisite to understanding a given river mouth configuration as well as choosing and optimising an intervention scheme for given objectives. Important parameters controlling the balance are described in the following Sections together with human influences that impact the overall balance.
4.2.2 Catchment Characteristics
Natural river systems are the drainage systems evolved by nature. The river system characteristics are the result of the catchment characteristics and the hydrology which determine the discharge of water as well as sediment through the river mouth. These two parameters are crucial components of the flushing and sediment balance, and an understanding of the catchment is therefore required.
4.2.2.1 River And Catchment Size
A broad classification of river mouths ranges from the outlets of small streams and drains which only discharge into the sea intermittently to the largest rivers and tidal inlets that dominate the regional

Chapter 4 RIVERMOUTH/ TIDAL INLET MANAGEMENT AND PLANNING GUIDELINES ___________________________________________________________________________________________
____________________________________________________________________________________________ 4-6 March 2009
coastal features. Whereas the size of the river and catchment is clearly an important parameter for the river mouth dynamics, the type and scale of issues are not directly correlated to the size of the river. Similar dynamics and issues may exist for a small stream outlet and a larger river mouth. The particular concerns of channel closure resulting in water quality problems and local flooding for small rivers and drains was outlined previously. Larger rivers and catchments will have a higher baseflow, which will often tend to keep a channel at the river mouth open at all times. The larger rivers often carry high loads of sediment which leads to delta formations. This, together with high littoral transport rates can lead to severe clogging of even the largest river mouths. A good example of this in Malaysia is Kuala Pahang (Figure 4.4) which has two outlets that are often severely clogged. The shallow delta formation and the shifting and clogged entrance channel leads to challenging navigational conditions, and the clogged entrance regularly leads to flooding impacts during high discharge events.
Figure 4.4 Kuala Pahang River Mouth With Severely Restricted Outlets Large rivers are often important inland transport routes. This may, but does not necessarily involve transport between the river and the sea, i.e. through the river mouth. Batang Rajang in Sarawak is an example of a river system with inland navigation covering several hundred kilometres. Difficult navigation conditions at the river mouth as well as differences in river and ocean navigation often leads to partial separation between the river navigation and the navigation through the river mouth to the ocean. Kuala Baram in Sarawak is an example of a major river mouth which due to the very high sediment load is so shallow that it severely inhibits access to Miri Port, which is situated a short distance inland from the river mouth. Figure 4.5 illustrates the very shallow river delta area separating the deeper inland channel from the deeper sea. The shallow depths, shifting sand bars and channel configuration combined with exposure to complex wave and current patterns in the delta area leads to potentially hazardous navigation conditions. For Kuala Baram, this is illustrated by the presence of several wrecks in the river mouth and delta area.

Chapter 4 RIVERMOUTH/ TIDAL INLET MANAGEMENT AND PLANNING GUIDELINES ___________________________________________________________________________________________
____________________________________________________________________________________________ March 2009 4-7
Figure 4.5 Navigational Chart for Kuala Baram illustrating the protruding river mouth with sand bar
formations and extremely shallow conditions only slightly deeper than Chart Datum. Several wrecks in the river mouth area signify the difficult navigation.
Both Kuala Pahang and Kuala Baram are examples of river mouths that via their large supply of sediment to the coastline influence the coastal morphology up to 10s or even 100s of kilometres away from the river mouth itself.
4.2.2.2 Discharge Characteristics
The discharge characteristics expressed by e.g. the peak river discharge relative to the average discharge together with the balance between river discharge and tidally driven water exchange through the river mouth are important factors for the “equilibrium” profile of the river mouth as well as the risk of flooding impacts from any intervention at the river mouth. The net river discharge compared to the tidal exchange of water through the river mouth is important for the flushing dynamics of the river mouth. For tidal inlets, the net discharge of both water and sediment is generally small. The flushing through the tidal inlet is determined by the tidal prism, which is the volume of water discharged through the inlet on an ebb tide (barring any net discharge). The tidal prism is approximately the average surface area of the lagoon multiplied with the tidal range. If the net river discharge is small compared to the tidally generated flows, and the tidal exchange is sufficient to keep a channel open to the sea, the risk of flooding due to the river mouth acting as a bottleneck under extreme run-off conditions is low. Rivers with steep, mountainous catchments will often have very high peak discharges compared to the base flow. If the river mouth depends on the river flow for flushing, the risk of severe clogging of the river mouth and upstream flood impacts due to backwater effects are significantly higher for rivers with a large ratio between peak and average discharge than for rivers with smaller variations in flow. Human activities have large impacts on the discharge characteristics as outlined in Section 4.2.3.

Chapter 4 RIVERMOUTH/ TIDAL INLET MANAGEMENT AND PLANNING GUIDELINES ___________________________________________________________________________________________
____________________________________________________________________________________________ 4-8 March 2009
4.2.2.3 Sediment Discharge
The sediment load from the catchment and transport to the river mouth has a large bearing upon the stability of the river mouth. Rivers with a high sediment load has a higher risk of clogging up, potentially creating problems related to navigation and flooding. Sungai Pahang and Batang Baram mentioned in previous section are examples of (large) rivers with high loads of sediment that create problems at the river mouths. Both the sediment load and type of sediment is important for the potential clogging of the river mouth. If the load from the catchment is as high as or higher than the river transport capacity, the river will be fully loaded with sediment which will tend to settle out at any flow expansion such as occurring at the river mouth. For smaller sediment loads from the catchment, unsaturated flows in the river will tend to scour the river till natural armouring occurs or the transport capacity due to the scouring drops to be in equilibrium with the sediment load. The composition of the sediment discharged by the river is equally important for the morphology of the river mouth. The finest fractions with a very low settling velocity will generally be washed out to sea and not impact the river mouth morphology, whereas the coarser fractions will become part of the coastal sediment transport that determines the morphology at the river mouth and surrounding area. For the exposed river mouth of Kuala Pahang, it is estimated that the annual discharge of sediment that feeds into the littoral sediment transport is in the order of ½ million m3/year, whereas the total discharge of sediment from the river is estimated at several million m3/year. The fraction of discharged sediment that feeds into the coastal morphology is not only determined by the sediment composition, but also by the exposure of the river mouth. For river mouths and coastlines with high exposure to waves, it will primarily be the sand fractions of sediment that feed into the coastal morphology, whereas finer silt and mud fractions also are important for sheltered river mouths and coastlines. It is noted that human activities have a large impact on sediment loading from the catchment. This is described in the following section. 4.2.3 Human Influences On Catchment Characteristics
Human activities affect almost all catchments and thereby also the dynamics of almost all river mouths and adjacent coastlines. Some of the common human influences on the catchment characteristics and resulting changes to the river mouth dynamics are outlined below.
4.2.3.1 Landuse Change
Deforestation and landuse change alter the run-off characteristics as well as the sediment load in the river system. In Malaysia the widespread conversion of forests to agriculture, mainly oil palm plantations, has led to large changes to flow and sediment load in a high percentage of the rivers. Natural forests, in particular rain forests, have a large capacity to collect, store and release rainfall gradually. The canopy prevents the direct impact of heavy rainfall on the ground, and rather than through surface runoff, much of the water will infiltrate into the ground to recharge the groundwater and be released gradually through streams. Deforestation and landuse change will, in particular in steep terrain, increase the surface runoff and the soil erosion. This will lead to a change in discharge characteristics of the river which typically will have a lower baseflow and higher peak discharges, often leading to so-called flash-floods which are short but intense and potentially severe floods during high rainfall events. The soil erosion and sediment runoff from the catchment will also increase significantly. For the river mouth, the lower baseflow in the river means lower flushing at times and together with the increased sediment load, this will potentially shift the dynamic equilibrium towards shallower conditions at the river mouth. The higher peak discharges combined with the shallower river mouth significantly increase the risk of flash floods and the river mouth becoming a “bottle-neck” for the river discharge leading to upstream flooding.

Chapter 4 RIVERMOUTH/ TIDAL INLET MANAGEMENT AND PLANNING GUIDELINES ___________________________________________________________________________________________
____________________________________________________________________________________________ March 2009 4-9
To minimise the negative impacts of landuse changes, appropriate catchment management and mitigation measures are required. Catchment management is a separate discipline and it is beyond the present manual to discuss catchment policies and practices in detail, but some of the important management and mitigation measures available include:
• Maintaining riparian buffer zones along all streams and water ways.
• Maintaining forest cover on the steepest slopes in hilly terrain
• Appropriate drainage layout with storage and sedimentation basins prior to discharge into the river systems
4.2.3.2 Climate Changes
The climate changes have potentially a significant impact on the river mouths. The climate changes affect both wave patterns and water levels and perhaps more importantly the rainfall intensity and amounts. See Chapter 9 for further discussion on climate change.
4.2.3.3 Dams and Weirs
Dams and weirs constructed for e.g. hydropower or extraction of water for irrigation or domestic water use can drastically change the runoff characteristics as well as the sediment supply to the river mouth. Major dams with reservoirs are usually constructed in the upper catchment, well upstream of the tidal influenced river section. The two main impacts by a hydro power dam and associated reservoir that affect the river mouth are a reduction in peak river flows as well as sediment discharge in the river at the dam site. Although the reduction in peak flows may reduce the flushing of sediment through the river mouth, the overall effect will usually be a stabilisation of the river mouth and a reduction of the risk of flooding. The level of impact on the river mouth will depend on a number of parameters including overall storage of the reservoir compared to the catchment yield as well as the operational procedures of the dam (i.e. provision of base flow and release through spill ways). Significant extraction of water from a river system for e.g. irrigation or domestic use will reduce the net discharge through the river mouth. If the net discharge is a significant contributor to the flushing of the river mouth, the water extraction will lead to a reduction in the equilibrium profile through the river mouth. If weirs are placed in the tidal zone to e.g. reduce the saline intrusion into a river system for water intake purposes, the resulting reduction in tidal prism can have a major impact on the flushing of the river mouth and the equilibrium channel configuration. This also counts for tidal gates and any other structures that reduce the tidal prism, see also next section. Perhaps the best-known example of river mouth impacts by the trapping of sediments by structures and water extraction is that of the Nile River by the construction of the High Aswan Dam in the 1960´s, see Figure 4.6. The promontory propagated until 1909 and then began to erode. The reasons for the erosion of 42 m/year during the period 1909-1971 were mainly a reduction in the river discharge and the construction of the Low Aswan Dam, whereas the drastically increased erosion rate of 129 m/year after 1971 was caused by the construction of the High Aswan Dam.
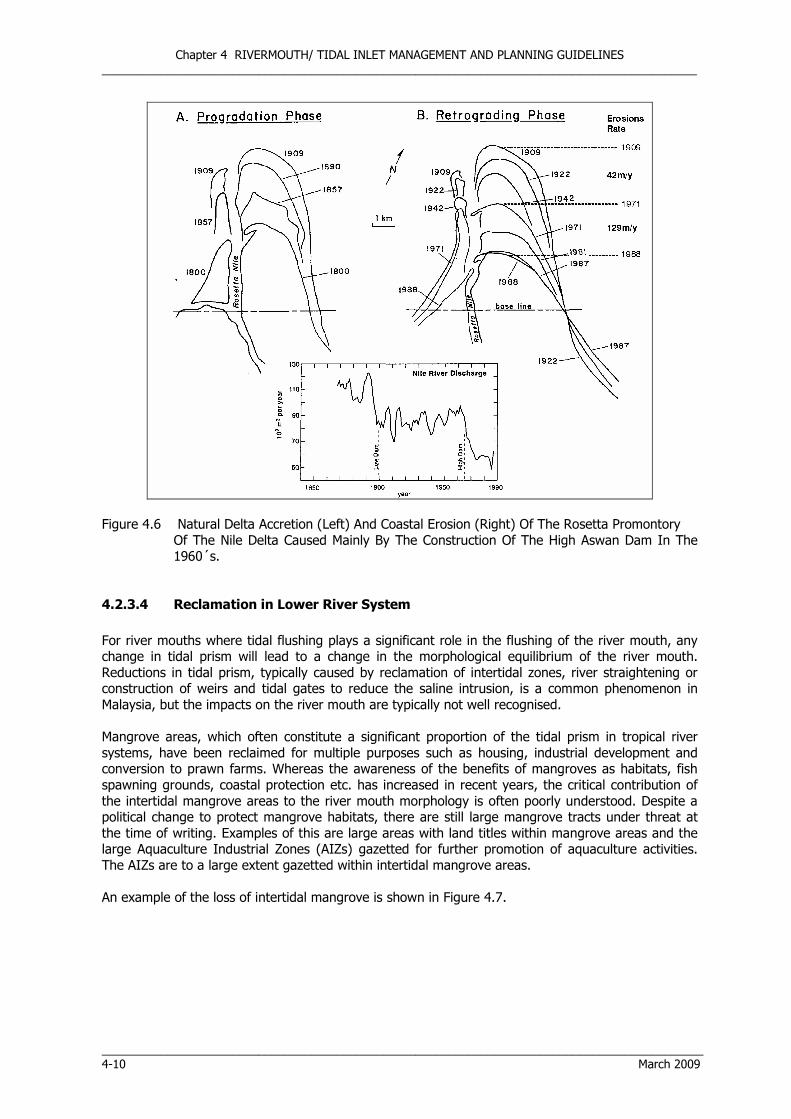
Chapter 4 RIVERMOUTH/ TIDAL INLET MANAGEMENT AND PLANNING GUIDELINES ___________________________________________________________________________________________
____________________________________________________________________________________________ 4-10 March 2009
Figure 4.6 Natural Delta Accretion (Left) And Coastal Erosion (Right) Of The Rosetta Promontory Of The Nile Delta Caused Mainly By The Construction Of The High Aswan Dam In The
1960´s.
4.2.3.4 Reclamation in Lower River System
For river mouths where tidal flushing plays a significant role in the flushing of the river mouth, any change in tidal prism will lead to a change in the morphological equilibrium of the river mouth. Reductions in tidal prism, typically caused by reclamation of intertidal zones, river straightening or construction of weirs and tidal gates to reduce the saline intrusion, is a common phenomenon in Malaysia, but the impacts on the river mouth are typically not well recognised. Mangrove areas, which often constitute a significant proportion of the tidal prism in tropical river systems, have been reclaimed for multiple purposes such as housing, industrial development and conversion to prawn farms. Whereas the awareness of the benefits of mangroves as habitats, fish spawning grounds, coastal protection etc. has increased in recent years, the critical contribution of the intertidal mangrove areas to the river mouth morphology is often poorly understood. Despite a political change to protect mangrove habitats, there are still large mangrove tracts under threat at the time of writing. Examples of this are large areas with land titles within mangrove areas and the large Aquaculture Industrial Zones (AIZs) gazetted for further promotion of aquaculture activities. The AIZs are to a large extent gazetted within intertidal mangrove areas. An example of the loss of intertidal mangrove is shown in Figure 4.7.

Chapter 4 RIVERMOUTH/ TIDAL INLET MANAGEMENT AND PLANNING GUIDELINES ___________________________________________________________________________________________
____________________________________________________________________________________________ March 2009 4-11
Figure 4.7 Example Of Loss Of Intertidal Mangroves Which Has Significantly Reduced The Tidal Prism Of The Lagoon, Which In Turn Reduces The Natural Depth Of The River Mouth.
4.2.3.5 River Sand Mining
Sand mining is common in rivers throughout Malaysia. Whereas it is generally recognised that the sand mining may impact the local water quality and potentially lead to river bank erosion, it is not widely recognised that the sand mining also impacts the river mouth and adjacent coastlines. Sand mining is likely to eventually lead to reduced sediment supply to the river mouth. It is typically the coarser sand fractions that are mined, which will reduce the transport of coarse sediment to the river mouth area on a time scale depending on the location of sand mining within the river system and the volume compared to the sediment transport capacity in the river. River sand mining may assist in reducing the supply of sediments to the river mouth and increase the equilibrium depth, but it must be noted that a reduction of sediment supply to the littoral zone can negatively impact the littoral sediment balance and lead to coastal erosion. An example of this is the Papar river mouth in Sabah. The upper Papar river catchment lies in steep terrain in the Crocker Range, and the river has historically supplied sufficient coarse sediment to the coastline to form a protruding delta on the coastline. Extensive river sand mining over recent decades has, however, reversed the delta build-up, and the once popular Pantai Manis on the downdrift side of the river mouth has suffered serious erosion.
4.2.4 Coastal Characteristics And Morphology The coastal characteristics at the river mouth determine the infilling by littoral sediment transport of the entrance channel as well as the morphological stability of the river mouth location on the coastline. Coastal characteristics and morphology is a topic in its own right, and it is beyond the present Chapter to describe this in detail. A good overview is e.g. found in Mangor, Shoreline Management Guideline. The present section will only briefly describe aspects of particular importance to river mouths. The wave exposure and related littoral sediment transport is a dominant factor for the morphological development. Exposed coastlines will generally be sandy as the fine sediments are washed out by

Chapter 4 RIVERMOUTH/ TIDAL INLET MANAGEMENT AND PLANNING GUIDELINES ___________________________________________________________________________________________
____________________________________________________________________________________________ 4-12 March 2009
the waves and unable to settle on the beach, while sheltered coastlines are often muddy or silty, depending on the type of sediment supply, tidal range, etc. Delta Formation Deltas are often formed at river mouths and can be challenging to navigation through the river mouth both due to the shallow water depths and the complex and severe wave and current conditions encountered on the delta. It is noted that “delta” in the present context is used in a broad term representing a sediment deposit seaward of the river mouth (or within the lagoon for a flood tide delta for a tidal inlet) caused by the river flow. The supply of sediments to the coast by a river will result in the formation of a delta if sediments are delivered faster than they are dispersed by waves, tides and the associated currents. Deltas can, however, also form at the river mouth for rivers with no sediment supply through the re-circulation of sediments from the littoral zone. The existence of a delta therefore does not necessarily imply a large sediment supply by the river. Deltas can be classified according to Galloway's classification which obviously has some linkage to the stability number described above:
• Fluvial-dominated deltas are characterised by large catchment rivers discharging into relatively protected seas with limited nearshore wave energy and a relatively small tidal range. (Example: Mississippi)
• Wave-dominated deltas are characterised by relatively high exposure to waves and/or swell, so that the wave generated transport is larger than the transports generated by river discharge and tidal exchange. (Examples: Kelantan and San Francisco)
• Tide-dominated deltas are characterised by tidal environments, where the transport of material by the tidal exchange dominates over the transport generated by waves and river discharge. (Example: Ganges-Brahmaputra)
There are many intermediate types in between the three main types. The coastal type within a delta often changes depending on its proximity to the river mouth, for which reason the coastal classification above refers to specific sections of the delta. 4.2.4.1 Exposed (Sandy) Coastlines Coastlines exposed to a monsoon climate such as the East Coast of Peninsular Malaysia will typically develop relatively steep, narrow sandy beaches with coarse sediments on the beach and fine sediments a few hundred meters offshore beyond a relatively narrow surf zone. Precipitation, wave exposure and littoral transport is seasonal, which leads to unstable river mouth conditions – i.e. seasonal changes in the dynamic equilibrium between flushing and infilling of the river mouth. When the sand is transported to the coastal area as sediment load from the rivers, its transport mode will change from current-dominated to wave action-dominated. The most important overall factor for the resulting coastal features in the transition zone between the river and the sea is the ratio between the amount of material supplied by the river and the “excess” littoral transport capacity in the area. The excess transport capacity denotes the difference between the transport capacity and the supply from updrift along the coast. If the supply of material from the river is larger than the littoral transport capacity, the material will build up a delta. Delta coastlines will, in principle, accrete; however, if the position of outlet channels shifts, which is very often the case, very large fluctuations in the local coastlines can be the result. This is for instance the case at Pantai Sabak situated between Pengkalan Datu and Kuala Besar of the Kelantan River in Kelantan. Pengkalan Datu no longer supplies sediment to the coastline, and this part of the delta is subject to natural erosion. The erosion at Pantai Sabak has been aggravated by river mouth training works and has exceeded 300 m just downdrift of the river mouth training works. Other examples of river regulation works diminishing the sediment supply were previously mentioned: river sand mining, dredging works for navigation channels, dams and weirs, etc. The

Chapter 4 RIVERMOUTH/ TIDAL INLET MANAGEMENT AND PLANNING GUIDELINES ___________________________________________________________________________________________
____________________________________________________________________________________________ March 2009 4-13
Kuala Kemaman
Kuala Pahang
relationship between the river supply and the stability of the adjacent coastlines is the cause of numerous coastal problems and must be carefully considered in designing any river regulation works. If the supply of material from the river is smaller than the excess littoral transport capacity the material supplied to the coastal area will be transported along the shoreline at the rate supplied, and no delta will be formed. This will often result in the formation of stable crescent or spiral-shaped beaches in connection with rocky headlands as commonly seen along the East Coast of Peninsular Malaysia (Figure 4.8). These otherwise stable beaches will also become unstable if the supply of sand suddenly decreases.
Figure 4.8 Crescent-Shaped Bays From The Southern Part Of The East Coast Of Peninsular Malaysia. The overall transport mechanism in a crescent-shaped or spiral-shaped bay is outlined in Figure 4.9. The supply of sand from the upstream bay QB will pass the headland and cross the bay via a bar. The river discharge QR contributes to the littoral budget, this material will be transported downdrift into the bay, partly along the shoreline and partly onto the bar. These transport processes are fairly complicated and 2-dimentional in nature, but they result in the supply of QB + QR to the straight downdrift section of the crescent-shaped shoreline of the bay. The direction of this straight section is given by the wave climate and the actual sum QS1 = QB + QR according to the transport correlation between incident wave direction α1 and the transport QS1, which is also shown in the figure.

Chapter 4 RIVERMOUTH/ TIDAL INLET MANAGEMENT AND PLANNING GUIDELINES ___________________________________________________________________________________________
____________________________________________________________________________________________ 4-14 March 2009
Figure 4.9 The Correlation Between The Shape Of A Crescent-Shaped Bay And The Transport Supply To The Bay.
The shape of the crescent-shaped bay is generally stable, apart from seasonal variations, as long as the supply of material to the bay QS1 = QB + QR is not changed. However, if the supply of material to the bay is reduced, typically by changes to the upstream bay or changes to the river, the overall shape of the bay will also change, as the direction of the straight section will adjust to the new sum Q2, where Q2 < Q1, leading to erosion in the entire bay, as sketched in the figure. This means that changes in one bay will gradually penetrate into the downstream bays, so crescent-shaped bays, although they appear fairly stable, are actually very sensitive to changes in the supply of sand, which has to be taken into account in any river mouth dredging or training schemes. Tidal inlets are channels connecting a body of water to the sea for which the tidal prism and resulting tidal flushing is the main factor maintaining the channel open. The “classical” tidal inlet is a short channel between barrier islands connecting the lagoon formed landward of the barrier islands with the sea. During flood tide, the rising water level in the sea leads to water flowing through the tidal inlet from the sea to the lagoon. This reverses on ebb tide when the falling water level in the sea leads to water flowing from the lagoon through the inlet to the sea. For such systems, where the ebb and flood flow are of similar magnitude, the tidal inlet flushes sediment between the lagoon and the sea, often with an ebb delta forming on the seaward side of the channel and a flood delta forming on the lagoon side. The currents are concentrated through the gorge section of the mouth, but seawards and landwards of the confined river mouth channel, the current pattern expands and the current speeds decrease. This leads to a reduction in sediment transport capacity, and the sediment is deposited in the ebb and flood shoals. An example of flood and ebb shoals from a low-exposure coastline in Belize is shown in Figure 4.10. Malaysia has few “true” tidal inlets, and most outlets are mixed with varying degree of tidal influence.

Chapter 4 RIVERMOUTH/ TIDAL INLET MANAGEMENT AND PLANNING GUIDELINES ___________________________________________________________________________________________
____________________________________________________________________________________________ March 2009 4-15
Figure 4.10 Ebb And Flood Shoals At Tidal Channel, Cay Calker, Belize. This Area Is Mainly
Exposed To The Tidal Currents, Whereas The Wave Climate Is Very Mild And Littoral Transport Small.
The sediment in the shoals (deltas in broad terms) in this case originates from the littoral transport on the coastline. On coastlines with significant littoral transport, the ebb shoal tends to form a dome-shaped bar on which the littoral transport bypasses the mouth/inlet, often through a complex pattern where the sediment is partly circulated between the beach and the outer bar through the tidal flushing of the river mouth. The natural geometry of an entrance bar results from the integrated effects of tidal currents, wave action, and associated sediment transport and deposition. In the entrance area the flow converges and expands again, creating shallow areas that extend into the lagoon and seaward from the entrance. The shape depends on the inlet hydraulics, wave conditions, and general geomorphology. All these interact to determine flow patterns in and around the inlet and locations where flow channels occur. The sediment transport process is schematically illustrated in the example Figure 4.11 from the Coastal Engineering Manual.

Chapter 4 RIVERMOUTH/ TIDAL INLET MANAGEMENT AND PLANNING GUIDELINES ___________________________________________________________________________________________
____________________________________________________________________________________________ 4-16 March 2009
Figure 4.11 Sediment Transport Associated With Both Updrift And Downdrift Portions Of The Essex
River Inlet, Massachusetts (From Coastal Engineering Manual, Chapter 6) This general circulation pattern leads to currents generally flowing towards the inlet near the shoreline (in the flood channels), even on ebb tide. This is the effect of wave driven currents. On the downdrift side of the inlet, breaking waves are turned toward the inlet due to refraction over the outer bar and on breaking, create currents toward the inlet. Further downdrift, currents are directed away from the inlet and the effect of the jet convecting or entraining ocean water as it exits the inlet creates an alongshore current at the base of the ebb jet. This pattern leads to a high circulation of sediment between the adjacent coastlines and the ebb delta, which again leads to a high risk of sedimentation in a dredged channel across the bar system. A navigation channel will be deeper than the dynamic equilibrium depth, which will immediately lead to sedimentation in the channel. Sediment will be carried to the channel both by the ebb flow that will naturally follow the channel, and by wave and tidal driven cross-currents over the ebb delta.
Examples from Pahang Illustrative examples of the differences in morphological development for different ratios between river sediment supply and littoral transport capacity as well as the influence of net littoral transport and tidal flushing are found along the Pahang Coastline.

Chapter 4 RIVERMOUTH/ TIDAL INLET MANAGEMENT AND PLANNING GUIDELINES ___________________________________________________________________________________________
____________________________________________________________________________________________ March 2009 4-17
The Kuantan river mouth, see Figure 4.12, is an example where the sediment supply from the river is absorbed by the littoral transport. The river mouth is located just downdrift of a prominent headland (Tanjung Tembeling), which is a classical feature for rivers with limited sediment supply on coastlines suspended between headlands. The river mouth tends to establish itself at the location of least tendency to migration due to the littoral transport, which is immediately downdrift in the area sheltered by the headland. Although the bay where Kuantan river discharges appears to be a typical crescent shaped bay, it is not entirely typical as the southern straight coastline does not lead towards a headland to feed sediment bypass to the south, but rather towards the delta formed by Kuala Pahang. The left plate of Figure 4.12 shows estimates of the littoral sediment budget with very limited discharge of coarse sediment from Kuantan river. It is noted that there is a net transport of sediment to the south from the river mouth area, but at the same time, there is an unspecified transport towards the north from Kuala Pahang. With the gradual change of coastline orientation, the littoral transport is expected to accumulate over a long section of coastline, and with the limited transport rates, the accretion rates are relatively small. The right plate demonstrates the sediment transport capacity past the headland and the river mouth from the northern bay to the coastline to the south. The effects of a dredged navigation channel on the sediment transport patterns is clearly seen, which demonstrates both that the navigation channel will backfill and that it partly blocks the bypass of sediment, which if the channel is maintained in the longer terms will impact the coastline to the south of the river mouth.
Figure 4.12 Sedimentation Around Kuantan River Mouth
Left: Estimated Sediment Budget In 1000s M3/Year Around Kuantan River Mouth. Right: Modelled 2D Sediment Transport Patterns Averaged Over A Tidal Cycle For Rough NE
Monsoon Conditions At Kuantan River Mouth. Results Show Clear Effect Of Dredged Navigation Channel On Transport Patterns, Which Indicate Backfilling And Migration Of The Channel.

Chapter 4 RIVERMOUTH/ TIDAL INLET MANAGEMENT AND PLANNING GUIDELINES ___________________________________________________________________________________________
____________________________________________________________________________________________ 4-18 March 2009
Kuala Pahang, see Figure 4.12 and Figure 4.13, is one of the main sediment suppliers to the East Coast of Peninsular Malaysia which maintains a basic sediment balance for more than 150 km of coastline from Kuantan to headlands to the south of Kuala Endau. The total sediment discharge from Kuala Pahang is estimated to be several million m3/year, of which in the order of 0.5 million m3/year is coarse material that deposits in the delta and is transported to the adjacent coastlines. The delta has historically accreted, which is illustrated in the accretion lines clearly seen to the north of the river mouth in Figure 4.13. This has led to a reversal of the net sediment transport direction to the north of the river mouth. This is a classical picture for very large suppliers of sediment to the coastline. As the delta grows, the regional sediment transport patterns are affected by the changes in coastline orientation and wave exposure. As demonstrated in Figure 4.13, the northern river mouth location has been more or less maintained over the past four decades, while significant retreat of the coastline has taken place around the southern outlet. It appears that the southern channel in 1963 carried a larger percentage of the water (and sediment) than present. The sediment discharged from the river over the 4 decades has partly deposited in a large sandspit to the south of the river mouth. The large mobility, potential impacts and backfilling rates associated with river mouths that supply large amounts of sediments to the coast constitute a major challenge to any intervention for this type of river mouth.
Figure 4.13 Historical development of coastline at Kuala Pahang, 1963 – 2006. Background satellite image is from 1963.
Legend:
QB 23-07-2006
Spy 02-04-1963
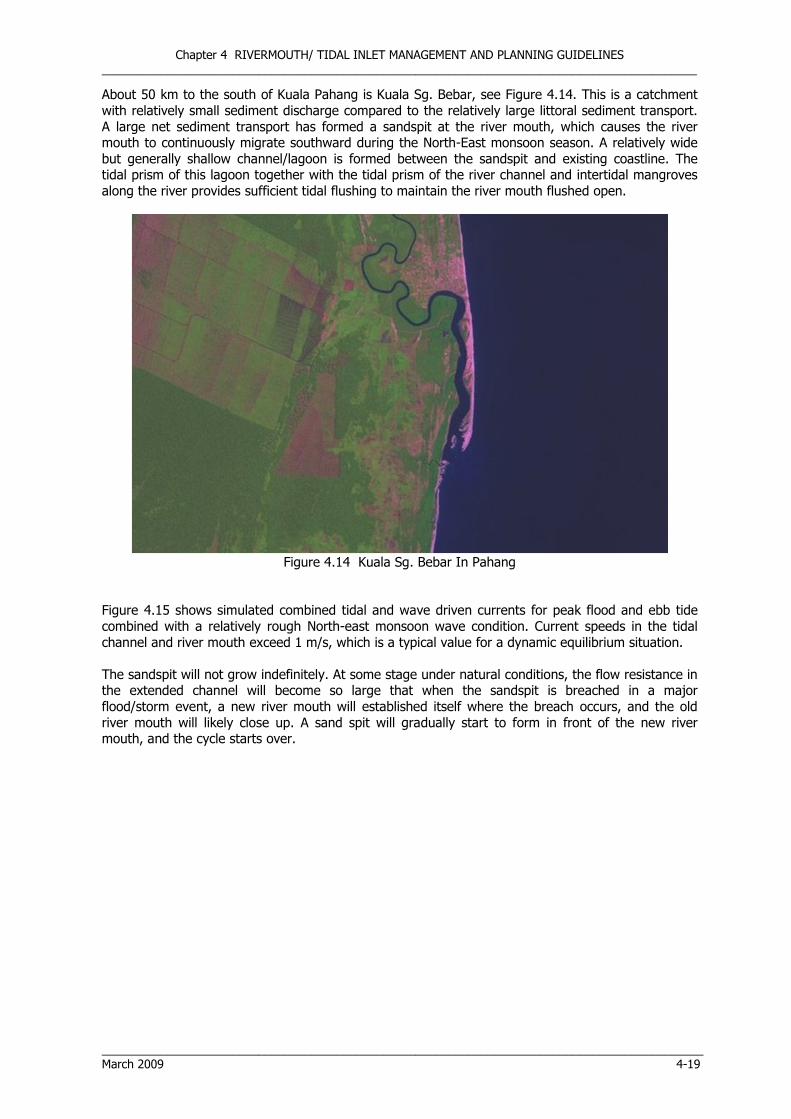
Chapter 4 RIVERMOUTH/ TIDAL INLET MANAGEMENT AND PLANNING GUIDELINES ___________________________________________________________________________________________
____________________________________________________________________________________________ March 2009 4-19
About 50 km to the south of Kuala Pahang is Kuala Sg. Bebar, see Figure 4.14. This is a catchment with relatively small sediment discharge compared to the relatively large littoral sediment transport. A large net sediment transport has formed a sandspit at the river mouth, which causes the river mouth to continuously migrate southward during the North-East monsoon season. A relatively wide but generally shallow channel/lagoon is formed between the sandspit and existing coastline. The tidal prism of this lagoon together with the tidal prism of the river channel and intertidal mangroves along the river provides sufficient tidal flushing to maintain the river mouth flushed open.
Figure 4.14 Kuala Sg. Bebar In Pahang
Figure 4.15 shows simulated combined tidal and wave driven currents for peak flood and ebb tide combined with a relatively rough North-east monsoon wave condition. Current speeds in the tidal channel and river mouth exceed 1 m/s, which is a typical value for a dynamic equilibrium situation. The sandspit will not grow indefinitely. At some stage under natural conditions, the flow resistance in the extended channel will become so large that when the sandspit is breached in a major flood/storm event, a new river mouth will established itself where the breach occurs, and the old river mouth will likely close up. A sand spit will gradually start to form in front of the new river mouth, and the cycle starts over.

Chapter 4 RIVERMOUTH/ TIDAL INLET MANAGEMENT AND PLANNING GUIDELINES ___________________________________________________________________________________________
____________________________________________________________________________________________ 4-20 March 2009
Figure 4.15 Simulated Combined Tidal And Wave Driven Currents For Peak Flood Tide (Left) And
Peak Ebb Tide (Right) For A Rough North-East Monsoon Wave Condition.

Chapter 4 RIVERMOUTH/ TIDAL INLET MANAGEMENT AND PLANNING GUIDELINES ___________________________________________________________________________________________
____________________________________________________________________________________________ March 2009 4-21
4.2.4.2 Sheltered (Silty/Muddy) Coastlines
River mouths on coastlines with limited wave exposure and limited littoral transport develop differently from exposed sites. Fine materials, such as clay and silt, also referred to as mud, do not normally constitute a stable coastal profile if exposed to even moderate wave action. Consequently, such materials are normally kept in suspension by the waves until they settle in deep water. Flocculation influences the siltation process in the mixing zone between freshwater and seawater, where stratification also occurs, and this can lead to increased siltation of fines. Sheltered coastlines with supply of fine sediments will typically have a very flat shoreface consisting of mud flats and the coast is normally very low. There will be no beaches, but the coastline will typically be bordered by mangrove or marsh vegetation. Mangrove coastlines are most common in the tropical rainforest climate belt with much precipitation and mild winds and wave climate. Marshy coastlines are most frequent in temperate climates and are often seen in estuaries and lagoons. Mixed cases with a supply of both cohesive and non-cohesive sediments are often seen. The sand fraction of the supplied sediments will form sandy beaches adjacent to the river mouth, whereas the fine sediments will be transported beyond the littoral zone, where they will settle on the seabed. The beaches appear sandy, but it is important to be aware of the presence of the muddy seabed as this has important implications, e.g. in connection with port construction and sedimentation in ports. The West Coast of Peninsular Malaysia has low to medium exposure to waves, and significant discharges of fine sediments. Muddy, mangrove coastlines are common in this area. River mouths are typically maintained open through tidal flushing. Wide mud flats which are progressively colonised by mangroves extend out adjacent to many river channels, see e.g. example from the Sepetang area west of Taiping, Perak, Figure 4.16.
Figure 4.16 Chart Demonstrating The Shallow Tidal Channels And Extensive Mud Flats Developed
Around The Complex River System At Sepetang, West Of Taiping, Perak. Confined river channels in (undisturbed) mangrove areas are usually deep enough to support small vessel navigation. At the river mouth area, the flow expands and the channel extending seaward decreases in depth, often with a minimum depth only slightly below the lowest tide level for river systems with limited flushing or high sediment loads. Even large river systems can have very low natural channel depths seaward of the river mouth. There are numerous examples of this along the coast of Sarawak, which is a moderately exposed coastline but the very high sediment loads from the catchments has led to wide shallow areas.

Chapter 4 RIVERMOUTH/ TIDAL INLET MANAGEMENT AND PLANNING GUIDELINES ___________________________________________________________________________________________
____________________________________________________________________________________________ 4-22 March 2009
An example from the Kuching area is shown in Figure 4.17, illustrating channels from large and small river mouth extending across the tidal flats up to several kilometres from land. Sediment is accumulated along the channels. This area is somewhat special in Malaysia as the tidal range is high (in the order of 5 meters).
Figure 4.17 Tidal River Outlets On Muddy Coastline With Large Tidal Range – Sungai Sarawak. A good example of the influence of the sediment discharge from a river on the adjacent beaches is found at Kuala Muda on the border between Kedah and Penang state. The catchment for the river includes steep, mountainous terrain in the interior of Kedah state towards Thailand, and historically, the river has been a source of significant supply of mixed sediments. Although the coastline is only moderately exposed to waves, the net littoral sediment transport is towards the south. Rivers to the north predominantly discharge fine sediments. This has resulted in the coastline a short distance to the north of Kuala Muda being muddy, while there are beaches with coarse sand to the south of the river mouth, see Figure 4.18.

Chapter 4 RIVERMOUTH/ TIDAL INLET MANAGEMENT AND PLANNING GUIDELINES ___________________________________________________________________________________________
____________________________________________________________________________________________ March 2009 4-23
Figure 4.18 Aerial Photo With Surface Sediment Classification (Left), Mudflats Along Coastline To The North Of The River Mouth (Upper Right) And Coarse Sandy Beach To The South Of River Mouth (Lower Left).
The Muda river is further an example of changes in the catchment having seriously impacted the river mouth and adjacent coastline. The construction of dams and a tidal barrage combined with extensive river sand mining has all but eliminated the supply of coarse sediment from the river. This has led to erosion along the coastline to the south of the river mouth, impacting the coastline down to Butterworth about 20 km to the south. Construction of the barrage and bunds along the lower river has further reduced the tidal prism in the river system, which has reduced the tidal flushing of the river mouth. The littoral transport has narrowed the river mouth, which in turn has scoured a gorge, see Figure 4.19. The river mouth and area immediately seaward is flushed sufficiently deep for navigation by the fishing fleet using the river mouth for safe harbouring, whereas a shallow area only slightly below Chart Datum is found at a distance of about 700 m from the river mouth. This is a typical problem found for river mouths with limited flushing on low exposure coastlines with significant supply of fine sediments. Due to the high concentrations of suspended sediments over the shallow areas, a dredged channel will rapidly backfill.

Chapter 4 RIVERMOUTH/ TIDAL INLET MANAGEMENT AND PLANNING GUIDELINES ___________________________________________________________________________________________
____________________________________________________________________________________________ 4-24 March 2009
Figure 4.19 Kuala Muda North Of Penang. The River Mouth Itself Is Flushed Open By The Tidal
Exchange, And The Shallowest And Critical Area For Navigation Is About 700 M Off-Shore From The River Mouth.
4.2.5 Challenges For River Mouth Intervention Schemes
On exposed coastlines with significant littoral transport, the problems for navigation are typically related to:
• Shallow deltas due to the bypass bar system often formed at river mouth;
• Rapidly shifting channel conditions due to the significant littoral transport rates;
• Potentially hazardous navigation conditions at the river mouth due to the combined effects of waves and currents;
• Potential for choking of the river mouth leading to backwater effects and upstream flooding.
Particular challenges for any intervention schemes often include:
• Rapid infilling of any dredged channel due to the significant littoral transport rates;
• Potential significant coastal impacts for schemes blocking the littoral transport.
For sheltered coastlines with high concentrations of fine sediments, the problems are typically related to a shallow entrance channel. The shallowest area causing the main problems for navigation are often far from the coastline – up to kilometres, which is a major challenge for any structural interventions. Dredging a navigation channel is often not a viable solution due to rapid backfilling caused by the high concentrations of suspended sediments.
4.3 CAUSES OF FLOODING
Flooding can be a more severe phenomenon along low-lying coasts compared to coast erosion and shore erosion. Flooding is catastrophic as it comes very quickly and often covers huge areas. Inland flooding and flooding along open coasts, estuaries and delta areas is very important, for example in Bangladesh but Malaysia experiences severe flooding during the monsoon seasons as well. The definition of the coastal area is often related to the extent of flooding as the flooding is often the result of coastal processes. The coastal area may extend 5-10km inland (in Bangladesh even more) in low laying areas but this again depends on the severity of the flood e.g. in areas with small tidal range the coastal zone is more narrow then in areas of large tidal range and flooding is more serious in areas with large river discharges. The recent flooding of Myanmar was an example of a rare event

Chapter 4 RIVERMOUTH/ TIDAL INLET MANAGEMENT AND PLANNING GUIDELINES ___________________________________________________________________________________________
____________________________________________________________________________________________ March 2009 4-25
that impacted an area far beyond what is usually considered coastal. The zone between pure river engineering areas and pure coastal/marine engineering areas can be very wide and it is crucial that the management of these areas encompasses the joint expertise from both fields. It is very difficult to draw the line of demarcation of responsibility between coastal and river management. What causes coastal erosion often also causes flooding, but flooding only occurs in areas where the coast and the coastal hinterland are low relative to extreme water levels. Extreme water levels can be divided into two types:
• Recurring events: The combined effect of river flow, tide and storm surge together with the action of waves, which is important, for example when dikes are breached during a tidal wave. Tsunamis can also cause flooding.
• Long-term trends: Sea level rise and subsidence may give an increased risk of flooding combined with recurring events.
4.3.1 Natural Causes Of Flooding
Inland and coastal flooding can be caused by the following natural causes.
4.3.1.1 Recurring Events
Flooding of coastal areas will normally occur as the result of combinations of the following components:
• Extreme tides, i.e. High Water Spring or Highest Astronomical Tide.
• Seasonal variations.
• Meteorologically generated storm surge. Storm surges generated by cyclones, hurricanes and typhoons are especially dangerous, but also severe storm depressions during the monsoon season or at the higher latitudes can cause severe storm surge. Areas especially prone to high storm surge are wide shallow sea areas, e.g. the North Sea, and large coastal lagoons.
• Flood waves caused by under-water earthquakes, so-called tsunami, can cause very severe flooding and the destruction of coastal areas.
• Extreme river flows.
The methods used for analysing various types of events are different, as they follow different statistical distributions. Depending on the analyses for a given site, the flooding conditions will normally be described in the form of recurrence periods (in years) versus extreme water levels.
4.3.1.2 Long-Term Trends
The long-term trends will normally not cause flooding by themselves, but they will increase the flood level, or in other words, they will decrease the recurrence interval of the recurring events, see Figure below. It is seen that an increase in the sea level of 50 cm decreases the recurrence period from 100 years to 20 years for flooding of a dike, which is designed for a water level of 3.40 m.

Chapter 4 RIVERMOUTH/ TIDAL INLET MANAGEMENT AND PLANNING GUIDELINES ___________________________________________________________________________________________
____________________________________________________________________________________________ 4-26 March 2009
Figure 4.20 Example of extreme water level analysis, flooding levels vs. recurrence interval in
years for the Danish West Coast. The influence of the sea level rise of 0.50 m is shown.
A summary of the natural causes of changes in long-term trends of flooding is given in the following.
• Natural subsidence in coastal areas. This is often seen in delta areas, where the present sandy delta coast covers earlier deposits of finer sediments.
• Tectonic activity and different kinds of rebound processes can also cause subsidence.
• Sea level rise has both natural causes and human causes, and it is a world-wide phenomenon, which has to be taken into account in low-lying areas when designing sea defences and planning land utilisation.
4.3.2 Causes Of Flooding Due To Human Activities
Flooding can be caused, or the risk of flooding can be increased, by the following human activities.
4.3.2.1 Recurring Events
Human activities can influence the risk of flooding in areas prone to naturally recurring flooding events. Examples are given in the following:
• Regulation works in a tidal inlet or river mouth can change the flood levels in the lagoon/river
• Reclamation works in a river/lagoon can change the flood levels in the lagoon • The construction of dikes can decrease the storage capacity in certain areas, which can
increase the flood levels • The felling of extensive mangrove areas can change the flood conditions in the
hinterland • Climate changes changing the rainfall pattern and thus the river peak discharge
characteristics

Chapter 4 RIVERMOUTH/ TIDAL INLET MANAGEMENT AND PLANNING GUIDELINES ___________________________________________________________________________________________
____________________________________________________________________________________________ March 2009 4-27
4.3.2.2 Long-Term Trends
Human activities can influence the long-term trends in sea level and subsidence, and this will increase the flooding risk in areas prone to naturally recurring flood events. Examples are given in the following:
• Subsidence in coastal areas can be caused by the extraction of groundwater, oil or gas. Subsidence can have very different time developments depending on the cause of the subsidence. A famous example of subsidence caused by groundwater extraction is Venice, where high groundwater extraction in the industrial area caused considerable subsidence of the entire town. However, the extraction was stopped when the interaction was realised in 1969, after which date the subsidence stopped and even a minor rebound occurred. The subsidence/sea level rise of most of the town since the beginning of the century was approximately 0.23 m in 1980, approximately half of which was due to groundwater extraction. The result is that today Venice suffers from very frequent flooding.
• Sea level rise has both natural and human causes, which are difficult to distinguish. Sea level rise is under all circumstances a world-wide phenomenon, which has to be taken into account in low-laying areas when designing sea defences and planning land utilisation. It is internationally believed that the Greenhouse effect will cause a sea level rise through general warming and ice cap melting. The central forecast for the global sea level rise for this century has been estimated at 0.20/0.50 m by the middle/end of the century, respectively, according to the International Panel on Climate Change, IPCC.
4.3.3 Sea Defence Design Considerations
Many low-lying areas, which by nature are flooded regularly, have been developed for agriculture, infrastructure and habitation. Since they are flooded regularly, sea river defence works are required. A design philosophy for sea defence works is discussed in the following:
The following parameters are used in the design method:
• The acceptable risk, R, that the sea defence fails within the considered lifetime L • Lifetime, L, of the structure • The design recurrence period, Td, for the design flood level
If the area exposed to flooding is small or medium sized, and if it is only developed to a small degree, e.g. as rural or farming areas, etc., then a relatively high risk of flooding can be accepted, say a lifetime risk of 65 %. If the lifetime of the sea defence structure is 50 years, a recurrence period of 50 years can be used in this case, see Table below. This presents a correlation between the lifetime, L, the recurrence period, Td, and the acceptable risk, R, of failure during the lifetime of the sea defence. However, if the potential flooded area is large and intensively used for habitation and infrastructure, the acceptable risk of flooding will be very low, say R = 1 %. If we select the lifetime of the dike to be 100 years, the required design recurrence period will be approximately 10,000 years. More comprehensive procedures are available for detailed design of sea defences.
Table 4.1 The calculated risk, R, [in %] of failure of a sea defence structure with a lifetime, L, [years] and design recurrence period, Td, [years].
Recurrence Period (Td) in years Life Time (L) in years 5 10 30 50 100 500 1000 10,000
1 20 10 3 2 1 0 0 0 5 67 41 16 10 5 1 0 0 10 89 65 29 18 10 2 1 0 30 100 96 64 45 26 6 3 0 50 100 99 82 64 39 10 5 0 100 100 100 97 87 63 18 10 1 200 100 100 100 98 87 33 18 2 500 100 100 100 100 99 63 39 5

Chapter 4 RIVERMOUTH/ TIDAL INLET MANAGEMENT AND PLANNING GUIDELINES ___________________________________________________________________________________________
____________________________________________________________________________________________ 4-28 March 2009
4.4 RIVER MOUTH IMPROVEMENT WORKS
River mouth deltas and tidal inlet morphologies are known to be dynamic systems. Shoals are often shallow and natural channels scoured by the action of tidal and riverine flows are constantly migrating and adjusting to the immediate environment and its complex forces induced by waves, wind, tide and fresh-water discharges. The morphological mobility of these systems is pronounced and has historically been a challenge to e.g. navigation as outlined previously. In modern time river mouth improvement works has become a key discipline within coastal and river engineering. River mouth improvement works denotes human intervention in the dynamic balance at a river mouth to improve certain conditions to obtain given objectives. In accordance with the typical problems encountered at river mouths, the objectives are typically related to navigation and flood release but may include other objectives such as flushing and coastal stability. A successful solution will create the benefits defined through the project objectives but it will also be the cause of certain impacts. Impacts may be either acceptable or unacceptable; other impacts can be mitigated but the bottom line is that impacts need to be assessed individually and its severity weighted. The preferred improvement scheme for a given river mouth often ends up as being a compromise between fulfilling objectives and minimising impacts. This comprise is not only a result of weighing impacts but also a consequence of often contradicting objectives. River mouth improvement works is a challenging engineering discipline both from a technical and a management point of view. Due to the complexity involved, river mouth improvement works are seldom carried out using pre-cast off-the-shelf solutions. The solutions are often tailored and based on a thorough understanding of the local physical conditions and well-defined, prioritised objectives and a set of realistic criteria. The requirements for small downtimes, large drafts and safe navigation increases constantly: a demand reflected in the vast number of river mouth improvement studies carried out both currently and over the past decade. In the following the most common intervention schemes are presented.
4.4.1 Solution Strategy For Maintaining Entrances To Rivers, Streams And Other Outlets
Often successful designs are achieved by practising the “work-with-nature” concept (see also Mangor, Shoreline Management Manual) that involve minimal and typically streamlined intervention schemes that seeks to control the mechanisms involved. By understanding the behaviour of a particular river mouth one may succeed in not only shifting the equilibrium condition by enhancing and impeding certain mechanisms but also controlling the river mouth variability to a tolerable level. Being able to predict and quantify the variability of the trained river mouth is often a criteria of success in dynamic river mouth systems as such design basis will often be extensive and worst case scenarios used to test the functionality of the training scheme are critical and demanding. In Malaysia, the main objective of river mouth improvement works is often twofold: (1) To reduce upstream flooding and/or (2) Enhance navigability to provide the opportunity for fishing fleets etc to access the sea through the river mouth frequently. Classic regulation schemes applied to improve navigational conditions are achieved through two main solution strategies:
• Dredging of a deeper navigation channel
• Construction of breakwaters and training structures in combination with deepening of a channel
Chapter 4 RIVERMOUTH/ TIDAL INLET MANAGEMENT AND PLANNING GUIDELINES ___________________________________________________________________________________________
____________________________________________________________________________________________ March 2009 4-29
Although there are many natural causes of coastal erosion, most of the causes affecting coastal communities are due to human intervention in the sediment transport processes along the coastlines and/or reductions in the supply of sand to the shorelines. Deepening of a channel is thus a standard component in regulation works for navigation of rivers as it provides a coherent waterway with sufficient navigation depth. Flooding of the upstream river plains are often related to the high resistance at the river entrance from the relatively shallow depths over the river delta. Although, the training walls will lengthen the river system the overall resistance to the river flow will reduce as the effect of deepening outweighs the effects of lengthening. Dredging will therefore often alleviate both flooding and navigation problems at the same time. In smaller rivers such as streams and drain outlets navigation is obviously not of concern, however these outlets often have limited flushing ability and are therefore particularly susceptible to stability problems and associated small-scale flooding problems. During periods with dominating alongshore sediment transport the entrance can easily clog up and pools of water will be trapped on the beach/backshore. If water is trapped for a considerable length of time or the exchange of water between the pool and the sea is critically low then the enclosed pool of water becomes a potential habitat for mosquito breeding and in combination with problems related to poor water quality an intervention scheme can be required. Solution strategies involve one or more of the following interventions:
• Small structures that cut through the beach berm
• Merging of drains and streams to form larger discharges and thus strengthen the flushing.
• Redirecting the drains/streams to areas where the entrance is more stationary, the beach more narrow and the profile more steep i.e. at existing groynes, natural headland etc.
• Using piping or pumping systems
Constant maintenance of outlets and streams are however the most common strategy and in many cases the obvious solution, but may not be adequate if the entrance clogs up frequently or if the pool of water is close to residential areas and subject to severe pollution or breeding.
4.4.2 Improvement Works For Streams And Low-Flow Drains Siltation of streams and drain outlets are common throughout Malaysia. The problem is often noticeable on the shores of larger islands due to limited catchments in combination with significant wave exposure. Along the west coast of Labuan and the north coast of Pulau Pinang the problems are well-known. On Labuan groynes have been constructed using both rocks and Labuan blocks to minimise the infill of littoral sediments to keep the outlets open – see Figure 4.21.

Chapter 4 RIVERMOUTH/ TIDAL INLET MANAGEMENT AND PLANNING GUIDELINES ___________________________________________________________________________________________
____________________________________________________________________________________________ 4-30 March 2009
Figure 4.21 Coastal Structures To Maintain Open Drains And Streams, Labuan West Coast.
4.4.3 Improvement Works For River Mouths The pure dredging option is often used in Malaysia’s less busy river mouths or in river mouths too large to adopt structural solutions (e.g. Klang, Batang Rajang in Sarawak) as it is a cheaper solution in terms of capital expenditure (but may not be cost-efficient in the long term). The most commonly adopted structural solutions in Malaysia include symmetrical breakwaters, parallel breakwaters and the single main breakwater option, see Figure 4.22 for sketch.

Chapter 4 RIVERMOUTH/ TIDAL INLET MANAGEMENT AND PLANNING GUIDELINES ___________________________________________________________________________________________
____________________________________________________________________________________________ March 2009 4-31
Figure 4.22 Sketch Of Main Breakwater Configurations Applied In Malaysia
The basic principle behind the structural solutions is:
• To improve flushing of the river mouth area by fixing the outlet position and confining the flow to a well-defined (trained) and narrow channel.
• To increase bypass or to block the littoral transport and thereby impede backfilling of the navigation channel.
Each option has potential benefits but also potential impacts, and all benefits and impacts should be carefully assessed when designing a given river mouth improvement scheme, taking account of the specific conditions of the individual river mouth. The benefits of the improvement works are primarily expressed in terms of the achievable navigation depth and navigation safety. Potential added benefits are related to the fixation of the river mouth and potential improved flood release (through a deeper river channel) and related reduction in flood risks and elevation, although added flooding risk is also a potential impact caused by backwater effects from structural schemes. Physical, social and economical aspects all influence the selection of an “optimal” solution and each intervention scheme must therefore be treated using a holistic approach that embraces all aspects identified. It is crucial that the scheme is designed to fulfill the project objectives and to deal with the environmental conditions that define the river mouth – as previously outlined, conditions are highly variable, and an optimal solution for one site may not be appropriate for the neighbouring river mouth even if the project objectives are similar. Some of the main potential impacts are briefly outlined below:
1. Flooding: Dredging is generally expected to improve conveyance and flood release through the channel and river mouth, while structural solutions under extreme flow conditions may lead to backwater effects that can increase upstream flooding
2. Coastal Impacts: Coastal structures will obstruct littoral transport and an accumulation of sediments on the updrift side of the structure is often seen. In addition, some sediments will be trapped by the navigation channel. Improvement works will therefore most often lead to

Chapter 4 RIVERMOUTH/ TIDAL INLET MANAGEMENT AND PLANNING GUIDELINES ___________________________________________________________________________________________
____________________________________________________________________________________________ 4-32 March 2009
significant changes in the sediment budget which may materialise as erosion of the downdrift coastline.
3. Saline intrusion: Both dredging and structural solutions can potentially lead to saline intrusion further into the river system, which may affect any water intakes on the lower river stretch within the tidal reach.
Regulation works may also entail impacts on water quality, river bank erosion, wave disturbance as well as on flushing which influences an array of environmental receptors. 4.4.3.1 Parallel Breakwater Structures:
Many tidal inlets have been protected and managed by the construction of inlet jetties or parallel breakwaters, which are considerably longer than the width of the littoral zone. This has often been done in an attempt to obtain a fixed tidal inlet with sufficient depth for navigation and to avoid sedimentation in the new channel. If the cross-sectional area of the new channel is of the same order of magnitude as the original stable natural inlet opening, it will be possible to obtain a practically maintenance-free stable, fixed, deep and narrow channel. The parallel breakwaters are however often associated with significant coastal impacts as the configuration is not promoting bypass of littoral transport. The severity of this impact will depend on the type of coast and the actual length and shape of the inlet jetties. In addition to the normal lee side erosion there will be additional impact due to the local accumulation of material in the sheltered areas adjacent to the structures. The duration of the period, when no bypass takes place, also depends on the above parameters. If the net littoral drift is not zero, natural bypass of the upstream jetty is sure to occur some time in the future. When this happens it will cause sedimentation in the inlet, but there will be no bypass to the downstream shoreline as the bypassed material will either be trapped in the channel or “lost” off the littoral zone. Parallel breakwaters are often used when the longshore transport is limited or if the coastal profile is very flat, requiring the breakwaters to reach far seaward for efficient channel flushing. In particular, these conditions are found along muddy coastline and along the Sarawak coastline and also on the west coast of Peninsula Malaysia. An example of long (nearly) parallel structures is found at the Lido Inlet connecting Venice Lagoon to the Adriatic Sea, Italy. The 2-3 km long jetties were constructed at the beginning of the 20th century. They caused a complete blockage of the littoral transport for 80 to 90 years. The upstream jetty caused an enormous accumulation of sand along the upstream beach with a length of about 6 km and a width at the jetty of about 1.5 km, this is the present Cavallino Beach. Bypassing has now started, which has resulted in sedimentation in the channel in the order of magnitude of the littoral drift. At the downstream side a huge lee accumulation occurred along the lee-breakwater, in the northeastern end of the Lido Beach as well as a huge lee-side erosion of Lido Beach further south. This example shows that navigation conditions were solved for many years at the expense of large upstream sand accumulation and a huge lee side erosion, but after about 90 years the sedimentation is now as great as the littoral drift. The impact to the coast has been huge and it is questionable whether the large jetties have at all been feasible. Major remedial measures to re-establish the lost beaches have now been implemented in the form of a program combining nourishment and supporting structures. Parallel breakwaters have been used at Miri, Sarawak as well as at Kuala Belait, Brunei – see Figure 4.23 and Figure 4.24.

Chapter 4 RIVERMOUTH/ TIDAL INLET MANAGEMENT AND PLANNING GUIDELINES ___________________________________________________________________________________________
____________________________________________________________________________________________ March 2009 4-33
Figure 4.23 Parallel Breakwater At Miri, Sarawak.
Figure 4.24 Kuala Belait Breakwaters In Brunei. Lower: Comparison Of Sediment Transport Patterns With And Without Western Breakwater And Dredged Channel.

Chapter 4 RIVERMOUTH/ TIDAL INLET MANAGEMENT AND PLANNING GUIDELINES ___________________________________________________________________________________________
____________________________________________________________________________________________ 4-34 March 2009
4.4.3.2 Symmetrical Breakwaters
Symmetric breakwaters are commonly used for river mouth protection works on exposed coastlines where coastal impacts are to be minimised. The basic requirement for minimising coastal impacts on adjacent coastlines is strongly connected to the sedimentation aspects at the entrance, for which reason these two aspects will be discussed in parallel in the following. The sedimentation and impact requirements are, to some extent, contradictory. Hence, a small impact on the coastline requires structures, which block the active littoral zone as little as possible, whereas minimum sedimentation requires structures, which extend well beyond the active littoral zone. Therefore a compromise has to be made. Important parameters for the optimal layout and management of the entrance with respect minimising sedimentation and shoreline impact are discussed in the following:
• Provision of a smooth alignment of the breakwaters. This guides the current past the entrance with a minimum of eddy formation. The reduction of eddy formations greatly minimises the risk of sedimentation and at the same time accommodates natural bypass, whereby the coastal impact is minimised, but not eliminated. This calls for an alignment of the breakwater heads to be parallel to the coastline and the angle between the outer breakwater sections to be approximately 40o. This angle secures optimal smooth current pattern and an optimal wave reflection away from the entrance route.
• Provision of a narrow entrance. The sedimentation caused by the entrainment of sediments due to eddy formation is proportional to the width of the entrance. Minimum sedimentation also means minimum coastal impact. Too narrow entrance however will entail impacts on flooding.
• Connection of the breakwater structures to the coastline. This should be as smooth as possible, thereby avoiding sheltered corners, which act as sediment traps. The trapping of sediments in such corners will deprive the adjoining shorelines of the trapped sand and will consequently enhance coastal erosion.
Maintaining navigation depth (minimising sedimentation in front of the entrance) and optimised bypass can be achieved by exposing the entrance area to waves and currents. Furthermore, it may be considered using vertical reflecting breakwaters in order to maintain the sediments in suspension and thereby enhance bypass and avoid sedimentation. These objectives are best obtained with a double breakwater type of port. The streamlined breakwaters are often combined with internal training walls used to control the tidal and riverine flows. The resulting basin behind the breakwaters is sheltered and therefore allows for easy navigation where gradual exposure to waves with maneuvering room in outer basin to turn around. Ships can pass the entrance at an angle as opposed to the parallel breakwater solution. In Malaysia the most outstanding curved breakwaters are found at Kuala Terengganu and Marang. The two curved breakwaters solutions are shown in Figure 4.25 and Figure 4.26. The Marang fishing village used to suffer from hazardous navigation conditions in the river mouth, which is very morphologically active with shifting channels traversing shallow shoals. The gross littoral transport at the location is moderate, but the net littoral transport is small. This situation makes it possible to regulate the inlet with fixed structures with only marginal shoreline impact. A combination of curved outer inlet jetties and internal straight parallel inlet jetties marking the channel was proposed in order to obtain a balanced solution between requirements regarding:
• Coastal impact • Navigation safety • Sedimentation and wave disturbance • Accommodation of tidal currents and river discharge

Chapter 4 RIVERMOUTH/ TIDAL INLET MANAGEMENT AND PLANNING GUIDELINES ___________________________________________________________________________________________
____________________________________________________________________________________________ March 2009 4-35
Figure 4.25 Marang Breakwaters
The use of curved training walls for river mouth improvement works does however pose a problem when they become very large as large structures enclose a significant volume of water. If the volume contained by large structures is comparable with the tidal prism of the existing river system, then flood tide currents will become significantly influenced by the additional volume of the enclosed basin. At any given time during flood tide, the flow capacity through the training walls or existing river mouth will be smaller than the flow capacity through the breakwater entrance simply due to the difference in tidal prism. As a consequence of the deficit in flow capacity water entering the breakwater entrance will not fully penetrate into the river rather it will be used to fill up the basin. If the deficit in flow capacity is large the storage of water inside the basin will have drastic impacts on the flow pattern. During flood tide, the flow pattern within the basin will be characterised by meandering of the currents and part of the currents will be deflected and trapped inside the basin forming large scale eddies which can complicate navigation through the training walls. The location of eddies can to some extent be controlled by the length of the training walls however often the flow pattern will be instationary and unorganized.
Figure 4.26 Ebb Tide Flow Before And After Construction Of Breakwaters At Kuala Terengganu

Chapter 4 RIVERMOUTH/ TIDAL INLET MANAGEMENT AND PLANNING GUIDELINES ___________________________________________________________________________________________
____________________________________________________________________________________________ 4-36 March 2009
4.4.3.3 Single Main Breakwater Solution
Single main breakwater solutions are characterised by one main breakwater protecting against the prevailing waves and a secondary breakwater protecting against other waves, etc. The main philosophy behind this type of port is the provision of sheltered mooring and entrance conditions. The entrance in this type of breakwater solution is directed away from the prevailing waves. The main breakwater thus provides a semi-protected area along the downstream coastline. Such structure may offer certain benefits but will also involve significant weaknesses. The structure often induces a circulating flow in the lee-zone area which affects navigation and tends to push sediment towards the entrance where it settles in calmer waters. Moreover, the structure is known to induce surf-beats and harbour resonance, which again may lead to problems with regard to navigation, sedimentation and coastal impact. The solution has been adopted at several locations at Kuala Besut along the Terengganu coastline - see Figure 4.27.
Figure 4.27 Single Main Breakwaters Along Terengganu Coastline
4.4.3.4 Inlet and River Mouths Managed by Dredging Only
A large number of tidal inlets and river mouths used for navigation are currently managed by maintenance dredging only. In Malaysia the pure dredging option is practiced in all states and for a large variety of river mouths and tidal inlets. In some cases the solution is preferred either as the river mouth siltation is limited and maintenance frequency small, the navigation depth requirement moderate or simply because structural intervention is very expensive and impacts unacceptable. However since the dredging option requires a continuous dredging effort it is not always a viable solution. An example of a tidal inlet which is successfully managed with dredging only is Grådyb, which is one of the connections between the Danish part of the Wadden Sea and the North Sea. By nature this inlet was curved, fluctuating and shallow with a natural depth of approximately 4 m. Over the last century it has gradually been straightened and deepened to its present depth of about 10 m. The maintenance of the inlet has always been carried out solely by dredging apart from a few groynes on the northern barrier formation Skallingen, which have now been cancelled. The present dredging operations are in the order of magnitude of 1 million m3/year; the dredging is carried out using a trailing suction hopper dredger, which bypasses most of the material to the downstream part of the ebb shoal. The dredging has caused some erosion of the upstream part of the ebb shoal as well as some erosion of the upstream tip of Skallingen. There have been no negative downstream impacts. The construction of major inlet structures has been considered. However, it has been evaluated that the mitigating measures required in order to compensate for the downstream morphological impacts will be as large as the present maintenance requirements. For this reason and also to be able to preserve the “natural” environment, such structures have been found neither feasible nor environmentally acceptable.

Chapter 4 RIVERMOUTH/ TIDAL INLET MANAGEMENT AND PLANNING GUIDELINES ___________________________________________________________________________________________
____________________________________________________________________________________________ March 2009 4-37
Numerical modelling investigations have been carried out in order to investigate if alternative layouts of the dredged channel would provide less dredging. It was concluded that the practised dredging and bypass management was equally good as any of the tested alternative layouts and that the present practise has been environmentally successful and economically feasible – see Figure 4.28 below.
Figure 4.28 Top: Present bathymetry (1992). Bottom: Four stages of Grådyb tidal inlet,
which acts as the access channel to the port of Esbjerg, Denmark.
4.4.3.5 Inlet Managed Using Jetties And A Fixed Bypass Plant
A fixed bypass plant can consist of a piled jetty constructed upstream of the upstream jetty and equipped with a series of jet-pumps, or a movable pumping arrangement. The pumps are connected to a discharge point on the downstream shoreline via a pipeline crossing the tidal channel. Such arrangements have been constructed at several locations, e.g. at Oceanside Harbour, California and at Gold Coast Seaways, Australia, partly as test arrangements. They work, but they are expensive to construct and are not flexible. In order to function properly the fixed arrangement should cover most

Chapter 4 RIVERMOUTH/ TIDAL INLET MANAGEMENT AND PLANNING GUIDELINES ___________________________________________________________________________________________
____________________________________________________________________________________________ 4-38 March 2009
of the littoral zone, otherwise sand will pass seawards and sedimentation will occur anyway. This means that it will be best suited for locations with relatively coarse sand which are exposed to monsoon or swell climates, as such conditions result in a narrow littoral zone, combined with inlet jetties covering the entire littoral zone. Furthermore, sedimentation may also occur for situations with waves from the secondary direction. This is actually the case for the Oceanside location, for which reason they have installed all the pumps on a hoist barge, which can be moved from one side of the inlet to the other. When in position it is jacked up on a pile cluster arrangement for the season, see Figure 4.29.
Figure 4.29 Semi-Fixed Bypass Jet-Pump Plant At Oceanside Harbour, California.
The Oceanside jet-pumping arrangement was designed to work continuously, in order to avoid clogging the pumps. However, as its capacity is higher than the supply rate to the relatively narrow crater created by the jet-pumps, fluidisers have been added to widen the effective width of the craters. This further adds to the complexity of the system. To conclude, a fixed bypass arrangement can help bypassing sand to the downstream side of an inlet, which is protected by jetties. In most cases it will be necessary to supplement this arrangement with normal maintenance dredging and bypass. It is not suited for coasts exposed to storm climates, as the littoral zones at such locations are too wide. Furthermore, the cost of the initial installation is very high compared to traditional measures, and the system is not flexible.
4.4.4 Coastal Impact
Although there are many natural causes of coastal erosion, most of the causes affecting coastal communities are due to human intervention in the transport processes along the coastlines and/or reductions in the supply of sand to the shorelines.
4.4.5 Coastal Structures Interfering Actively With The Littoral Transport
Coastal structures built on the coastline interfere with the littoral transport and are the most common cause of coastal erosion. The presence of the structure has a series of effects:
• Trapping of sand on the upstream side of the structure takes sand out of the sediment budget, thus causing shore erosion along adjacent shorelines. Mostly, of course, on the lee side, but large structures may also cause (initial) erosion on the upstream side.
• Loss of sand to deep water • Trapping of sand in entrance channels and outer harbours.
The accumulation and erosion patterns adjacent to coastal structures depend among other things on:
• The type of coastline, i.e. the wave climate and the orientation of the shoreline • The extent of the structure relative to the width of the surf-zone • The detailed shape of the coastal structure
The typical impact on the coastal processes and related shore erosion problems for different types of structures will be discussed briefly in the following.

Chapter 4 RIVERMOUTH/ TIDAL INLET MANAGEMENT AND PLANNING GUIDELINES ___________________________________________________________________________________________
____________________________________________________________________________________________ March 2009 4-39
Like a groyne, the port acts as a blockage of the littoral transport, as it causes trapping of sand on the upstream side in the form of an accumulating sand filet, and the possible bypass causes sedimentation at the entrance. The sedimentation requires maintenance dredging and deposition of the dredged sand. The result is a deficit in the littoral drift budget, which causes lee side erosion along the adjacent shoreline. A port must, consequently, minimise sedimentation and coastal impact. Attention has not always been paid to these requirements. The result is that many ports trap large amounts of sand and suffer from severe sedimentation. The principal shoreline development on littoral transport coasts with slightly oblique wave approach and very oblique wave approach, coastal types will be discussed.
4.4.5.1 Accumulation And Erosion For Coastlines With Oblique Wave Impact:
The coastal structure in this example is a large port with an extension greater than the width of the surf-zone, but the structure could also be a set of tidal inlet jetties or a long groyne. We consider an E-W directed shoreline, with a net eastward littoral drift rate (LDR) of 5, which is composed by an eastward LDR of 10 and a westward LDR of 5 (the LDR is presented here without any unit, specific numbers are used to illustrate the principles only). Prevailing waves from the NW and secondary waves from NE, as shown in Figure 4.30, generate this transport climate. Initially, there will be an eastward LDR of 10 close to the port on the upstream west side of the port, as this area is sheltered from the easterly waves by the structure. There will be no westward LDR-component in this sheltered area. Outside the lee zone westward of the structure, there will be a net eastward LDR of 5. This means that the transition section between these two areas will receive 5, but 10 will leave this section, which means a deficit of 5 in supply to this local area. The transition area will therefore initially be exposed to a sediment deficit of 5, whereas the area close to the structure will receive 10. This will cause initial erosion as well as sand accumulation on the upstream side of the structure. However, considering the entire upstream side as one unit, this unit will receive a surplus of 5 until bypass of sediment starts.
Figure 4.30 Schematic Shoreline Development, Morphological Development And Net Littoral
Drift Budgets For A Port At A Coast With A Slightly Oblique Resulting Wave Attack.

Chapter 4 RIVERMOUTH/ TIDAL INLET MANAGEMENT AND PLANNING GUIDELINES ___________________________________________________________________________________________
____________________________________________________________________________________________ 4-40 March 2009
Close to the structure on the lee east side, there will be a westward LDR of 5, as this area is sheltered from the westerly waves by the structure. This will result in a short accumulation of sand immediately east of the port. Outside the lee zone east of the port, there will be a net eastward LDR of 5. Initially no sediment will bypass the port. The area east of the port will consequently, considered as one unit, have a deficit of 5. This is the so-called lee side erosion. However, there will be an area in the transition zone close to the port which will have a deficit of 10, but this is only temporary, as the local reversed transport towards the structure will cease when the local coastline has adjusted to the conditions. The above sediment budget is applicable for the “initial” situation immediately after the construction of the port. Initial is a relative concept. The duration of the initial period depends on the magnitude of the port and on the area and volume of the sheltered areas compared to the littoral drift rates. The sediment budgets for the initial situation, as well as for a situation when the bypass of sediments has started, are both presented in Figure 4.30. The development of accumulation and erosion on the upstream and downstream sides of the port is sketched in Figure 4.30. As long as the transport is completely blocked by the port, the accumulation will take place as a seaward movement of the coastline adjacent to the breakwater parallel with the direction of the coastline of zero transport, i.e. perpendicular to the direction of the resulting waves. When the bypass starts, a bar will build up in front of the entrance, and the accreting coastline will gradually turn towards the original direction concurrently with a gradual increase in the bypass. This bypass causes a gradual increase in the sedimentation of the port entrance and/or the navigation channel. The part of the bypassing material, which is not trapped in the entrance, will be transported past the port, building a shoal at the lee side of the port. The downdrift shoreline will suffer from erosion until this shoal reaches the shore. Even then, the downdrift shore will not receive the same amount of material as it originally received from the updrift shore, as this would require that the accreting coastline attained an orientation parallel with the original coastline. This would require a sand filet of infinite length, which is not possible. Furthermore, it would require that there was no loss of sand in connection with the bypass of the port, which is also unrealistic. This explains why the downdrift shoreline will forever suffer from erosion as a result of the port construction, or another similar coastal structure, unless artificial nourishment/bypass is introduced. This situation is thus characterised by a long slowly developing sand filet at the upstream side of the port and the formation of a fairly short narrow shoal downdrift of the port, as well as shoreline erosion relatively close to the port along the downdrift shoreline. However, there will, in most cases, also be a very short accumulation zone immediately leeward of the port. Sedimentation in the entrance will develop slowly. It is worth noting that as soon as a coastal structure of an extension comparable to the width of the surf-zone has been built along such a shoreline, the downstream shoreline will forever suffer from erosion.
In addition to the phenomena described above, a non-optimal layout of the protective structures can result in additional trapping of sand. This typically happens in the sheltered area generated by port layouts, which consist of a main breakwater overlapping a secondary breakwater. This kind of layout will act as a sediment trap which is filled concurrently with the maintenance dredging. This will cause additional lee side erosion depending on where the sand is deposited.
4.4.5.2 Accumulation And Erosion For Coastlines With Very Oblique Wave Impact
When the angle of incidence of the resulting waves is larger than 50º, the shoreline development and corresponding morphological changes are quite different from the situation described above, see Figure 4.31.

Chapter 4 RIVERMOUTH/ TIDAL INLET MANAGEMENT AND PLANNING GUIDELINES ___________________________________________________________________________________________
____________________________________________________________________________________________ March 2009 4-41
Figure 4.31 Upper: Relation Between Transport And Angle Of Incidence. Lower: Schematic Shoreline Development And Morphological Development For A Port
At A Coastline With Very Oblique Wave Attack. The angle of incidence of the waves with the original shoreline is denoted as α2, which corresponds to the transport Q2, see Figure 4.31 upper part. There is, however, another smaller angle of incidence α1 which gives the same transport, Q2 = Q1. This means that the shoreline in the accumulation area upstream of the port will immediately switch to the position corresponding to the angle of incidence α1. This provides a very minor accumulation, which will very quickly develop into a situation with full bypass equal to Q2, and the corresponding build-up of a bar past the entrance. The bypassing sand will, due to the very oblique wave attack, develop into a bypass shoal nearly parallel with the coastline, i.e. a very long shoal. This situation is thus characterised by a short and quickly developing accretion zone and a fairly long, slowly developing bypass shoal downdrift of the port. Another effect is a gentle shoreline erosion over a fairly long distance from the port along the downdrift shoreline. Sedimentation in the entrance will develop quickly. 4.4.5.3 Inlet Jetties At Tidal Inlets And River Mouths
Tidal inlets and river mouths are often by nature shallow and variable in location, which makes them unsuitable for navigation. In order to improve navigation conditions and, to some extent, flushing conditions, many tidal inlets and river inlets have regulated mouths. The regulation may consist of jetties, possibly combined with maintenance dredging programmes. If the tidal inlets and the river mouths are located on littoral transport shorelines, they are often in a natural equilibrium with respect to bypassing of the littoral drift, which normally occurs on a shallow bar across the inlet. If the inlet/mouth is upgraded to accommodate navigation, this bar is normally cut off by the jetties or dredged. For the above reasons, regulated inlets are normally obstructions to the littoral transport which means upstream sand accumulation along the upstream jetty, loss of sand due to sedimentation in the deepened channel and the associated maintenance dredging. All in all, regulated inlets will very often cause lee side erosion problems. Mitigation measures such as artificial sand bypass does not always work ideally. At many such locations the mitigation measures have never been introduced or severely delayed. In conclusion, past and present regulations of tidal inlets and river mouths are responsible for major erosion along many coastlines throughout the world.

Chapter 4 RIVERMOUTH/ TIDAL INLET MANAGEMENT AND PLANNING GUIDELINES ___________________________________________________________________________________________
____________________________________________________________________________________________ 4-42 March 2009
4.4.6 Maintenance Of River Mouths
Fully maintenance-free river mouth intervention schemes do not exist. An intervention scheme is viable if the functionality of the river mouth is retained with a low-frequency periodic maintenance effort. Unfortunately poorly designed schemes that do not comply with the original objectives are not uncommon. High frequency maintenance can be impractical and the level of impacts on environment during maintenance dredging and dumping activities can be unacceptable and the only way out is a re-design of the structure. The most environmentally friendly improvement works are often those that require infrequent dredging works. Some schemes may work well for hundreds of years without a significant maintenance efforts (such as the long groynes at Venice) but the solution is time-limited and will fail without a re-design. Moreover impacts can be severe (and in this case practically irreversible) which is often not acceptable or too expensive to mitigate. River mouth maintenance often implies dredging. The siltation of a river mouth is seasonal but due to the complexity of forces involved it is also very variable and often unpredictable. Dredging operations can therefore not be pre-scheduled rather monitoring of the siltation is carried out and a continuous assessment of the needs are required. This is often done by monitoring water depth at crucial locations and calling in dredgers in due time. Capital and maintenance dredging works is often associated with dredging of finer materials. The dredged material is furthermore often disposed at dedicated dumping grounds. In both cases the seabed is disturbed and material released into the water. Some of the released sediment fractions will not settle instantaneously as the settling velocity of the finer fractions is small. In non-stagnant waters the settling will furthermore be impeded by the action of currents and/or waves that will tend to keep sediment in suspension. As a result of the sediment being detained in the water for a certain amount of time, it will be transported (advected) away from the point of spillage by the main currents which in turn will form a plume of suspended sediments. While the sediment is being advected, the concentration of the plume will dilute as a consequence of the water turbulence which is created partly by currents and partly by the wave-induced motion. The levels of concentration in the adjacent waters and the net sedimentation rates outside the immediate dredging/dumping area may potentially have a negative impact. Negative impacts include:
• Coral communities as a result of impacts on light attenuation, respiration and colonization.
• Seagrass, primarily as a result of light attenuation and sedimentation.
• Mangroves primarily as a result of sedimentation.
• Fish as a knock-on effect from impacts on their main habitats and from direct effects on visibility and respiration, so called turbidity barriers.
• Aesthetics due to increase turbidity levels, which will have a direct impact upon tourism.
• Muddy Shores from the dumping of fine material
The management of dredged material and the spoil disposal needs to follow relevant guidelines and make use of best available methods (retention ponds, silt screens etc) to minimize the sediment plume impacts and the dumping must take place within approved areas to ensure that impacts are minimized. In all cases an environmental monitoring program (EMP) must be established and in certain cases supplemented by an EIA study. Malaysian guidelines include DOE documents such as “Scope of work for Preparation of Environmental Assessment for Disposal of Dredged Material from Marine Dredging Works” and “Environmental Impact Assessment Guidance Document for Sand Mining and Dredging Activities”.

Chapter 4 RIVERMOUTH/ TIDAL INLET MANAGEMENT AND PLANNING GUIDELINES ___________________________________________________________________________________________
____________________________________________________________________________________________ March 2009 4-43
4.5 MANAGEMENT GUIDELINES
Management of river mouths is directly tied together with catchment and coastal management as the river mouth forms the link between the two environments. Besides the management policies and strategies applied for direct interventions such as dredging and structural measures at the river mouth itself, the river mouth should be duly considered in the catchment and coastal management. Some of the human interventions within the catchment that can have large impacts on the river mouth (and coastal zone) were briefly discussed in Section 4.2.3, while coastal development with potential implications on the river mouths was outlined in Section 4.3. A few catchment and coastal management guidelines are outlined below: Catchment Management - Some of the catchment developments impacting the river mouth were outlined in Section 4.2.3. It is beyond the present manual to go into any details of catchment management, which is a large topic in its own right where the impact on river mouths is only a small component. From a river mouth management point of view in terms of the provision of a navigation channel and reducing the risk of flooding, the following generally applies:
1. The sediment load should be controlled, e.g. through provision of riparian buffer zones along streams, maintaining forest cover on steep slopes, etc.
2. The intertidal zone should be maintained to maintain the tidal prism high to aid flushing.
3. Effects on the river mouth and coastal zone of structural interventions should be carefully considered.
Coastlines close to river mouths and tidal inlets - Such locations are very morphologically active formations as they are formed by the interaction between several hydrodynamic processes such as littoral processes, river discharge and tidal currents. Furthermore, river mouths and tidal inlets are often used for navigation and they are natural locations for towns and cities. There will often be a port of some kind, and the channels are often regulated by dredging and inlet structures. Furthermore, there can be stratification and associated additional sedimentation. Consequently, these types of coastal areas are often suffering from a series of interrelated problems, such as coastal erosion, flooding, sedimentation and navigation constraints. New coastal development should not be allowed close to natural river mouths and tidal inlets; the solution of specific problems requires thorough investigation. The stability of delta coastlines is highly dependent on the supply of material from the river. Regulation work or sand mining in the rivers will often cause a deficit in the supply of material to the coastline, for which reason delta coastlines are often exposed to severe erosion. This means the development along delta coastlines shall only be performed after careful investigations of the stability of the coastline. Such investigations shall also cover all activities in the associated river, such as dam and reservoir construction, irrigation schemes, sand mining and river mouth improvement works, as all such works tend to decrease the supply of sand to the coast. To this comes the normal influence of coastal works on the stability on adjacent coastlines. River Mouth Management - The problems, potential solutions and related risks associated with river mouths have been described in the previous Sections. This has emphasized that whereas there are common features for various classes of river mouths, an individual assessment of each river mouth leading to a good understanding of the processes is a prerequisite for a successful management strategy. Important components in this respect include:
• Thorough understanding of processes
• Clear identification of objectives
• Thorough identification of all potential impacts from various management options, both in the short, medium and long term (including dredge spoil management)
• Optimisation of scheme (if any) to maximise the benefits and minimise the impacts.

Chapter 4 RIVERMOUTH/ TIDAL INLET MANAGEMENT AND PLANNING GUIDELINES ___________________________________________________________________________________________
____________________________________________________________________________________________ 4-44 March 2009
It is recommended that the following steps be taken, in due consideration of the environmental factors that may consequentially occur as a result of the potential modifications to the river mouth regime.
(i) Characterise existing conditions at project site
(ii) Identify any other construction activities in and around 3km radius of the project site
(iii) Evaluate project effects on circulation patterns and stage variations
(iv) Evaluate project effects on water quality
(v) Analysis of dredging and disposal alternatives (dredge plant, timing, etc.)
(vi) Evaluate project effects on sedimentation rate
(vii) Evaluate aesthetic, cultural and recreational effects
(viii) Coordinate with other agencies, the public and private groups
(ix) Plan and design the monitoring program
Any modification to the river mouth may also lead to short-term and long-term impacts on the environment either at the site of the control work or at both upstream and downstream of the control work. Hence, prior to any construction of a river mouth improvement work, there are usually six factors that need to be addressed during the preliminary design stage:
– General sedimentation – Sedimentation in the river mouth – Navigation safety – Flooding – Water quality – salinity
General Sedimentation
If a river mouth is sited in a sensitive ecosystem such as presence of fireflies colonies could be threatened, the general sedimentation pattern can be a controlling design factor since the project could increase sedimentation or erosion in the bottom area of the estuary.
Sedimentation in River Mouth
Most river mouths are heavily silted, as a result fishing boats cannot navigate during low tide. Changing the river mouth alignment or installing structures inefficiently may significantly increase maintenance dredging costs.
Navigation Safety
Structures constructed adjacent or along the waterway can cause changes to the currents in the channel. These altered current patterns can adversely affect vessel navigability. The designer is advised to evaluate proposed designs by applying numerical ship/tow simulators to predict and solve existing and/or future navigation safety problems.(Further deliberation on navigational channel design consideration is in Appendix 4-A).
Flooding
Apart from sedimentation, inundation by river floods is another serious problem at river mouths due to poor flow capacity of the river. Control structures such as breakwaters may function as barriers during peak hydrographs and thus could create or increase localized flooding.

Chapter 4 RIVERMOUTH/ TIDAL INLET MANAGEMENT AND PLANNING GUIDELINES ___________________________________________________________________________________________
____________________________________________________________________________________________ March 2009 4-45
Water Quality
Rivermouth training works have the potential of changing circulation patterns and flushing rates. Reduced flushing rates may result in concentrations of dissolved or suspended materials to be outside acceptable or safe limits at certain locations of the estuary. Dredging and sand bypassing operations during construction and maintenance may also affect the mobility of contaminants within the adjacent water bodies. Hence, the potential for water quality problems should be identified and documented in the early project stages.
Salinity
Increased salinity intrusion can be a controlling factor in designing a river improvement project. Estuarine ecological life such as shrimp nurseries, oyster beds or fish can be significantly harmed by changes in the local salinity regime.
These are very generic guidelines but considered vital for river mouth as the potential impacts are high, and what may seem like a good solution to an immediate problem in the short term may have irreversible impacts with a much higher overall cost in the long term. To provide a comprehensive solution to mitigate various problems related to coastal processes in the vicinity of rivermouth area, the rivermouth improvement and coastal protection works carried out by the Coastal Division generally covers coastal area within 5 km landward of shoreline and /or 10 km stretch of river along its meanders. However beyond these limits, the technical input or advice from Coastal Division is necessary until where the tidal influence ends. REFERENCES
[1] National River Mouth Study, JICA (1994) [2] Coastal Engineering Manual (2003). Erdc, US Army Corps Of Engineers (Chapter On Inlets) [3] Karsten Mangor, Shoreline Management Guideline (2004) [4] Dato Dr Nik Hassan Shuhaimi Nik Abdul Rahman et al. Early History Of Malaysia (1999) [5] Stability Of Tidal Inlets. Per Bruun. Elsevier Scientific Publishing Company (1978)

Chapter 4 RIVERMOUTH/ TIDAL INLET MANAGEMENT AND PLANNING GUIDELINES ___________________________________________________________________________________________
____________________________________________________________________________________________ 4-46 March 2009
(This page is deliberately left blank)

Chapter 4 RIVERMOUTH/ TIDAL INLET MANAGEMENT AND PLANNING GUIDELINES ___________________________________________________________________________________________
____________________________________________________________________________________________ March 2009 4A-1
APPENDIX 4-A
NAVIGATION CHANNEL DESIGN CONSIDERATION
1. Manuals and Guidelines
There are several internationally accepted guidelines and manuals for design of navigational channel as listed below:
(i) Coastal Engineering Manual, US Army Corps of Engineers
Manual No. Title
Part V Chap 1 – Planning in Design Process Chap 2 – Site Characterisation Chap 5 – Navigation Chap 6 – Sediment Management at Inlets
ER 1110-2-1404 Deep-Draft Navigation Project Design ER 1110-2-1457 Hydraulic Design of Small Boat Harbours ER 1110-2-1458 Hydraulic Design of Shallow Draft Navigation Projects EM 1110-2-1412 Storm Surge Analysis and Design Water Level EM 1110-2-1414 Water Levels and Wave Heights for Coastal Engineering Design EM 1110-2-1611 Layout and Design of Shallow Draft Waterways EM 1110-2-1607 Tidal Hydraulics EM 1110-2-1613 Hydraulic Design of Deep-Draft Navigation Projects EM 1110-2-5025 Dredging and Dredged Material Disposal
(ii) European Manuals and Guidelines
1. Codes, Standards and Practice for Coastal Engineering in the UK (Fowler and Allsop,
1999) 2. BS6349 (1991). Maritime Structures – 1. General Criteria. British Standards. 3. BS6349 (1991). Maritime Structures – 7. Guide to the Design and Construction of
Breakwaters. British Standards. 4. Manual on the use of Rock in Coastal and Shoreline Engineering. CIRIA Special
Publication 83 (CIRIA/CUR, 1991).
(iii) Permanent International Association of Navigation Congress (PIANC) Technical Reports and Guidelines
1. Standardisation of Ships and Inland Waterway for Rivers/Sea Navigation, PTC1 Report of WG16-May1996.
2. Automatic Management of Canalized Waterways and its Hydraulic Problems, PTC1 Report of WG 8 -1990.
3. Standardisation of Inland Waterways Dimensions, PTC1 Report Of WG9 - 1990. 4. Minimising Harbour Siltation, Marcom Report – October 2008 5. Joint PIANC-IAPH Report on Approach Channels – Preliminaries Guidelines (Volume 1),
PTC2 Report of WG30 – First Report – April 1995. 6. Joint PIANC-IAPH Report on Approach Channels – A Guide for Design (Volume 2), PTC2
Report of WG30 – Final Report – June 1997. 7. Navigation in Muddy Areas, PTC2 Report of WG 03 – 1983. 8. Standards for the use of Inland Waterways by Recreational Craft, SRN Report Of WG 08
- February 2000. 9. Environmental Risk Assessment of Dredging and Disposal Operations, Envicom Report of
WG 10 – October 2006. 10. Guidelines for Sustainable Inland Waterways and Navigation, Envicom Report of WG 6 -
2003. 11. Dredged Material Management Guide, PEC Special Report – October 1997.

Chapter 4 RIVERMOUTH/ TIDAL INLET MANAGEMENT AND PLANNING GUIDELINES ___________________________________________________________________________________________
____________________________________________________________________________________________ 4A-2 March 2009
2. Factors Affecting Channel Design
Five main factors to be considered in the channel design are;
• Design of Ship - the parameters to be considered in the design of ship are length(L),
beam(B), draft (T), speed and maneuverability, hazardous cargo and windage (important for channel width).
• Traffic flow
- 1 way traffic or 2 way traffic
• Channel alignment and cross-section - straight section is preferred - minimize number of bends - bends to be smooth and gentle - minimize waves - minimize cross-current
• Channel width - factors to be considered are ship’s speed & maneuverability, winds,
waves (wave height and wave length), currents (longitudinal and cross-currents), channel depth, bottom surface (smooth & soft or rough &hard, bank clearance (cross-section , wave exposure), traffic flow, bends, aids to navigation (shore traffic control and visibility), and cargo hazard (high or low)
• Channel depth
- factors to be considered are ship’s draft (T), underkeel clearance (taking into considerations of squat, wave induced motions (heave, pitch, roll, yaw), height of tide, bottom conditions (solid or mud), water density (if brackishwater), and safety clearance (dredging tolerance and advance maintenance)

Chapter 5 MALAYSIAN COASTAL INVENTORY
March 2009
CHAPTER 5
MALAYSIAN COASTAL INVENTORY


Chapter 5 MALAYSIAN COASTAL INVENTORY
March 2009
5-i
Table of Contents Table of Contents ....................................................................................................................... 5-i
List of Tables ........................................................................................................................5-ii
List of Figures ........................................................................................................................5-ii
5.1 INTRODUCTION................................................................................................................ 5-1
5.1.1 East Coast of Peninsular Malaysia ............................................................................. 5-2
5.1.2 West Coast of Peninsular Malaysia............................................................................ 5-2
5.1.3 Sabah ..................................................................................................................... 5-2
5.1.4 Sarawak.................................................................................................................. 5-3
5.2 EROSION CATEGORIES...................................................................................................... 5-4
5.3 TIDES ALONG THE MALAYSIAN COASTLINE ....................................................................... 5-5
5.4 WAVES ALONG THE MALAYSIAN COASTLINE ...................................................................... 5-8
5.5 STORM SURGE AND TSUNAMI ......................................................................................... 5-13
5.6 COASTAL CHARACTERISTICS INVENTORY........................................................................ 5-13
5.6.1 West Malaysia ....................................................................................................... 5-13
5.6.2 East Malaysia ........................................................................................................ 5-13
5.7 RIVER MOUTHS INVENTORY............................................................................................ 5-14
5.8 FUTURE AND RECENT PROJECTS ..................................................................................... 5-15
REFERENCES ..................................................................................................................... 5-29
APPENDIX 5-A : MAPS OF MALAYSIAN SHORELINE WITH CLASSIFICATION OF EROSION CATEGORIES .............................................................................. 5A-1

Chapter 5 MALAYSIAN COASTAL INVENTORY
5-ii March 2009
List of Tables
Table Description Page
5.1 Coastline Length 5-1
5.2 Coastal Erosion Control Protection Works carried out in Peninsular Malaysia 5-22
5.3 Coastal Erosion Control Protection Works carried out in East Malaysia 5-24
5.4 (a) Physical Aspects 5-25
5.4 (b) Economic Aspects 5-25
5.4 (c) Social Aspects 5-25
5.5 (a) List of River Mouths By Category – (Category 1: Critical) 5-26
5.5 (b) List of River Mouths By Category – (Category 2: Significant) 5-27
5.5 (c) List of River Mouths By Category – (Category 3: Acceptable) 5-28
List of Figures
Figure Description Page
5.1 Location Map, Malaysia 5-1
5.2 East Coast of Peninsular Malaysia – Kelantan, near the Thailand Border 5-3
5.3 West Coast of Peninsular Malaysia – Selinsing, Perak 5-3
5.4 East Malaysia – Pulau Bum Bum, Sabah 5-4
5.5 East Malaysia – Miri, Sarawak 5-4
5.6a Tides – Peninsular Malaysia 5-6
5.6b Tides – Sabah and Sarawak 5-7
5.7a Wave Roses – Peninsular Malaysia, November to April 5-9
5.7b Wave Roses – Peninsular Malaysia, May to October 5-10
5.7c Wave Roses – East Malaysia, November to April 5-11
5.7d Wave Roses – East Malaysia, May to October 5-12
5.8a Tidal Analysis in Langkawi (23-29 December 2004) 5-16
5.8b Tidal Analysis in Pulau Pinang (23-30 December 2004) 5-17
5.9 Fishermen’s Village at Sungai Betong River Mouth; Experienced Funneling Phenomena due to the Narrow River Mouth which Increased The Water Level more than 2 meters 5-18
5.10 Overtopped Tsunami Wave Carrying Mud at Persiaran Gurney, Penang 5-18
5.11 Fishermen’s Boats Drifted away By Tsunami Wave about 200 meters Landward at Tg. Tokong, Penang 5-18
5.12 Coastal Reaches of Peninsular Malaysia 5-19
5.13 Coastal Reaches of Sabah and Sarawak 5-20
5.14 Reclamation Works at Pulau Layang Layang 5-21
5.15 Reclamation Works at Klebang, Melaka (adjacent to Pulau Melaka) 5-21
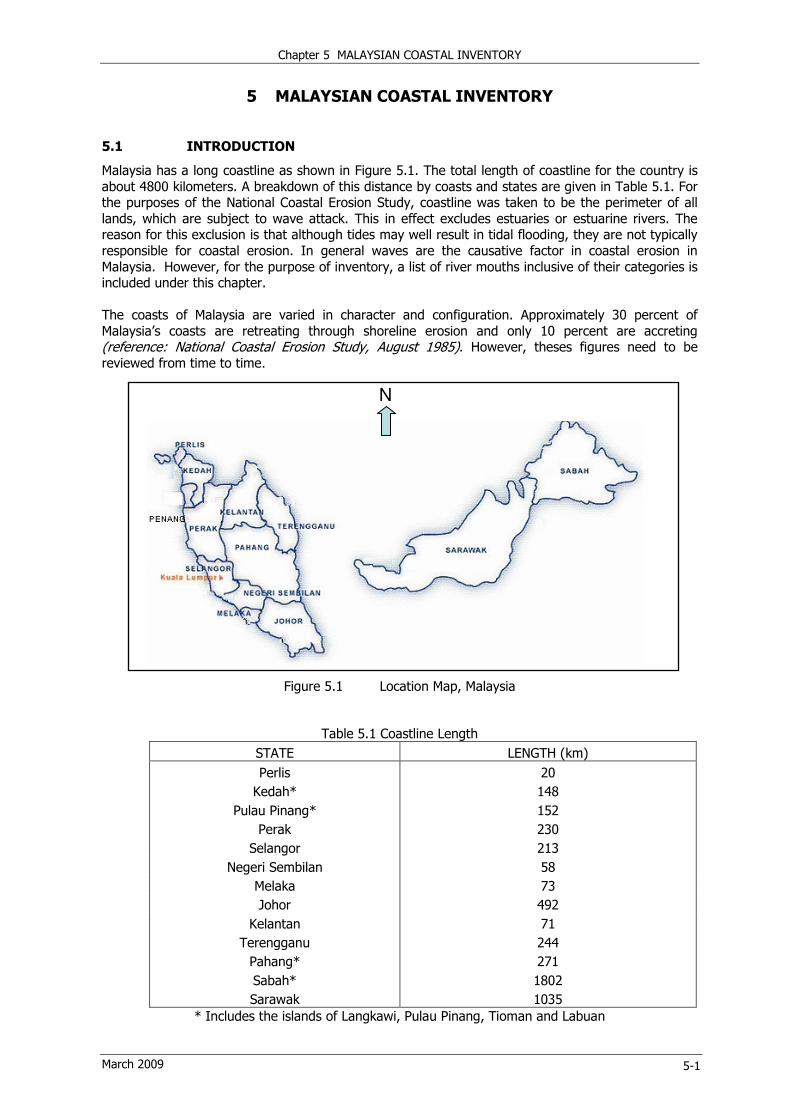
Chapter 5 MALAYSIAN COASTAL INVENTORY
March 2009 5-1
5 MALAYSIAN COASTAL INVENTORY
5.1 INTRODUCTION
Malaysia has a long coastline as shown in Figure 5.1. The total length of coastline for the country is about 4800 kilometers. A breakdown of this distance by coasts and states are given in Table 5.1. For the purposes of the National Coastal Erosion Study, coastline was taken to be the perimeter of all lands, which are subject to wave attack. This in effect excludes estuaries or estuarine rivers. The reason for this exclusion is that although tides may well result in tidal flooding, they are not typically responsible for coastal erosion. In general waves are the causative factor in coastal erosion in Malaysia. However, for the purpose of inventory, a list of river mouths inclusive of their categories is included under this chapter. The coasts of Malaysia are varied in character and configuration. Approximately 30 percent of Malaysia’s coasts are retreating through shoreline erosion and only 10 percent are accreting (reference: National Coastal Erosion Study, August 1985). However, theses figures need to be reviewed from time to time.
Figure 5.1 Location Map, Malaysia
Table 5.1 Coastline Length
STATE LENGTH (km)
Perlis 20
Kedah* 148
Pulau Pinang* 152
Perak 230
Selangor 213
Negeri Sembilan 58
Melaka 73
Johor 492
Kelantan 71
Terengganu 244
Pahang* 271
Sabah* 1802
Sarawak 1035 * Includes the islands of Langkawi, Pulau Pinang, Tioman and Labuan
N

Chapter 5 MALAYSIAN COASTAL INVENTORY
5-2 March 2009
5.1.1 East Coast Of Peninsular Malaysia
The east coast of Peninsular Malaysia is 860 kilometers long and is less irregular than the west coast. Much of the coast is a series of large and small hook-shaped bays. Almost the entire length of coastline is fully exposed to direct wave attack from the South China Sea. Exceptions of this condition are the stretch of coastline located at the south-eastern tip of Peninsular Malaysia (between Tanjung Penyusop and Tanjung Pengelih) and the coasts which are sheltered by offshore islands (Pulau Perhentian group of islands, Pulau Redang, Pulau Kapas and Pulau Tioman). Photograph in Figure 5.2 shows an image of part of the coastline along the east coast of Peninsular Malaysia. The coastal landscape is dominated by low elevation coastal plains, interrupted by numerous upland spurs and river outlets. The major rivers are the Sungai Kelantan, Sungai Besut, Sungai Terengganu, Sungai Kuantan and Sungai Pahang. Along the entire stretch of coastline, sandy beaches dominate. The notable exceptions are the two stretches of coast between Sungai Pahang rivermouth and Sungai Miang rivermouth and between Sungai Bebar rivermouth and Sungai Mercong rivermouth, where mangrove and nipah palms grow profusely. In other areas, the coastline is commonly fronted by rows of coconut palms and casuarinas trees.
5.1.2 West Coast of Peninsular Malaysia The west coast of Peninsular Malaysia is 1110 kilometers long and irregular. A majority of the coast is open to the waters of the Straits of Melaka. Exceptions to this condition are the island sheltering affects of Pulau Langkawi and Pulau Pinang, and to a lesser extent Pulau Pangkor and Pulau Kukup. A majority of the coast is comprised of low elevation coastal plains. The plains are formed from a deep marine clay stratum. Overall the relatively calm seas in the Straits of Melaka reflect the presence of this clay material. In the Perak area, the plain has been dissected by the numerous rivers and estuaries that cut the coast. Saltwater inundation of coastal lands between low and high tide is possible for up to two kilometers from the shoreline. These conditions, combined with the tropical climate, provide an ideal environment for the propagation and growth of broad mangrove forests (as shown in Figure 5.3). However, today typical mangrove exists only as a narrow fringe seaward of the outermost agricultural bund due to erosion. The exception to this condition is the central area of the state of Perak where large expanses of mangrove have been dedicated to forestry purposes. Very few areas of sand beach can be found on the west coast. The areas where sandy beaches do exist include Pulau Langkawi, the north and south coasts of Pulau Pinang, south of Sungai Muda rivermouth to Butterworth, north and south of Lumut, Port Dickson to Tanjung Tuan area and in Tanjung Keling area north of Melaka. Sand can also be found at the mouths of some rivers such as Sungai Merbok. In general, the sand beaches are formed as pocket beaches between prominent rocky headlands. 5.1.3 Sabah Sabah has the longest shoreline of all the coastal states in Malaysia measuring about 1802 kilometers in length and accounting for almost 40 percent of the total length of coastline in Malaysia. The coastline is rugged and faces the South China Sea to the northwest, the Sulu Sea to the northeast and the Celebes Sea to the southeast. Numerous offshore islands shelter the coastline from the open sea at its western tip (Pulau Labuan), the northern coast (Pulau Banggi and Pulau Balambangan) and the southeastern coasts (Pulau Timbun Mata and Pulau Bum Bum). Coral reefs abound in the waters off the southeastern coast affording protection against wave attack (Photograph in Figure 5.4). Sandy beaches dominate the northeastern coastline whereas clay material is more commonly encountered on the northeastern and southeastern coasts. The irregular coastline is pierced by many streams and rivers contributing large quantities of sand and fine grained sediments. The coastline is also characterised by bays of various shapes and sizes; the notable ones being Kimanis Bay, Marudu Bay, Labuk Bay, Lahad Datu Bay and Tawau Bay. There is erosion along the southeast coast with evidence of mangrove retreat and along the northwest coast affecting sandy beaches. The entire northeast coast is generally either stable or accreting.

Chapter 5 MALAYSIAN COASTAL INVENTORY
March 2009 5-3
5.1.4 Sarawak
The Sarawak coastline is 1035 kilometers long and is characterised by long, straight sandy beaches on the east half (Photograph in Figure 5.5) and mangrove fringed shoreline on the west half. The mangrove shore is punctured by wide estuaries at fairly regular intervals and by pocket beaches bounded between rock outcrops and headlands. The entire coastline is open to wave attack from the South China Sea during the Northeast monsoon except for a short stretch between Brunei and Sabah which is sheltered by the Pulau Labuan. Most of the deltaic and estuarine areas are fringed by mangrove forests. Sand buildup is evident at most of the estuarine areas due to the sediments brought down by the many rivers. West of Muara Tebas, there are many rocky headlands such as Tanjung Po and Tanjung Sipang, and rocky cliffs which rise immediately landward of the narrow sandy beaches. The major portion of the east half of the coastline is relatively undeveloped except for the towns of Miri and Bintulu and isolated villages, which spaced along the coastline.
Figure 5.2 East Coast of Peninsular Malaysia – Kelantan, near the Thailand Border
Figure 5.3 West Coast of Peninsular Malaysia – Selinsing, Perak

Chapter 5 MALAYSIAN COASTAL INVENTORY
5-4 March 2009
Figure 5.4 East Malaysia – Pulau Bum Bum, Sabah
Figure 5.5 East Malaysia – Miri, Sarawak 5.2 EROSION CATEGORIES
Based on the NCES (1985), the eroding areas, shown in Appendix A (Figure A-1 to A-34) are classified and grouped in three (3) categories:
Category 1, Critical Erosion, are areas where the rates of erosion considered in conjunction with economic, agricultural, transportation, recreational, demographic values and with structures intended to protect such values, indicate that action to halt erosion may be justified.
For these areas, immediate action is required to protect the established facilities and monitor to
ensure that added or expanded facilities of the areas are properly planned. The types of erosion control measure will very much depend on the nature of infrastructure being protected. For example, erosion can be controlled by either holding back or extending the beach. Holding up the beach against coastal erosion can be carried out by seawall or revetment whilst extending the beach to protect it can be in the form of beach nourishment with or without groyne

Chapter 5 MALAYSIAN COASTAL INVENTORY
March 2009 5-5
field. For options of erosion measures, please refer to other relevant sections within this manual. However, detail study has to be carried out to determine the feasibility of the option considered prior to project implementation.
Category 2, Significant Erosion, are areas where erosion is not critical but where the rates of erosion considered in conjunction with economic, agricultural, transportation, recreational, demographic values and with structures intended to protect such values, indicate that the assessment of criticality should be reviewed periodically.
The action plan for these areas is to carry out regular inspections and reviews to detect any future
need for protection. Category 3, Acceptable Erosion, are areas where the rates of erosion are such that no significant danger to economic, agricultural, transportation, recreational, demographic values and to structures intended to protect such values, is likely within the foreseeable future (say 10 – 15 years). For these areas, the action requires overview of planning for future coastal development to prevent oversights that would lead to future need for protection. The locations and extend of shorelines under the different types of categories has been examined and identified in NCES, 1985. However, periodical review of the status of these sites must be carried out. 5.3 TIDES ALONG THE MALAYSIAN COASTLINE
Water level fluctuations along the coast of Malaysia are mainly influenced by astronomical tides. The types of tides common in Malaysia are diurnal, semi-diurnal and mixed. Diurnal tides have one high water and one low water in a tidal day. Semi-diurnal tides have two high waters and two low waters in a tidal day with comparatively little diurnal inequality. Mixed tides have two high waters and two low waters in a tidal day with a large inequality in either the high or low water heights. The type of tide and tidal information of major ports along the coast of Malaysia are shown in Figures 5.6(a) and 5.6(b). The highest tidal fluctuation along the coast is found at Pulau Lakei in Sarawak. The tidal fluctuation is 6.32 m. Data used in Malaysia are Admiralty Chart Datum (ACD) and Land Survey Datum (LSD). Typically, all published nautical chart and tide tables reference ACD while all topographic and other land-based surveys use LSD. In some standard ports, correlation between ACD and LSD has already been established as shown in Figure 5.6(a).

Chapter 5 MALAYSIAN COASTAL INVENTORY
5-6 March 2009
LEGEND :
+ + + + + INTERNATIONAL BOUNDARY - ++ - ++- STATE BOUNDARY
HAT - HIGHEST ASTRONOMICAL TIDE MHHW - MEAN HIGHER HIGH WATER MLHW - MEAN LOWER HIGH WATER MHWS - MEAN HIGH WATER SPRINGS MHWN - MEAN HIGH WATER NEAPS MSL - MEAN SEA LEVEL MLWN - MEAN LOW WATER NEAPS MLWS - MEAN LOW WATER SPRINGS MHLW - MEAN HIGHER LOW WATER MLLW - MEAN LOWER LOW WATER LAT - LOWEST ASTRONOMICAL TIDE LSD - LAND SURVEY DATUM ACD - ADMIRALTY CHART DATUM
JOHOR
PAHANG
KELANTAN
TERENGGANU
SELANGOR
NEGERI SEMBILAN
MELAKA
PERAK
THAILAND
KEDAH
PERLIS
PULAU PINANG
KUALA TERENGGANU
+ 3.02 m A.C.D HAT + 2.47 m A.C.D MHHW + 1.93 m A.C.D MLHW + 1.45 m A.C.D MSL + 0.97 m A.C.D MHLW + 0.43 m A.C.D MLLW + 0.00 m A.C.D LAT * A.C.D is 0.92 m below L.S.D
TANJUNG GELANG
+ 3.84 m A.C.D HAT + 3.34 m A.C.D MHHW + 2.28 m A.C.D MLHW + 1.92 m A.C.D MSL + 1.57 m A.C.D MHLW + 0.50 m A.C.D MLLW + 0.00 m A.C.D LAT * A.C.D is 1.62 m below L.S.D
•
KEDAH PIER, PULAU PINANG
+ 3.09 m A.C.D HAT + 2.69 m A.C.D MHWS + 1.96 m A.C.D MHWN + 1.71 m A.C.D MSL + 1.45 m A.C.D MLWN + 0.72 m A.C.D MLWS + 0.00 m A.C.D LAT * A.C.D is 1.42 m below L.S.D
BAGAN DATUK
+ 3.46 m A.C.D HAT + 2.98 m A.C.D MHWS + 2.24 m A.C.D MHWN + 1.78 m A.C.D MSL + 1.33 m A.C.D MLWN + 0.59 m A.C.D MLWS + 0.00 m A.C.D LAT * A.C.D is 1.70 m below L.S.D
PELABUHAN KELANG
+ 5.82 m A.C.D HAT + 5.09 m A.C.D MHWS + 3.72 m A.C.D MHWN + 3.03 m A.C.D MSL + 2.35 m A.C.D MLWN + 0.98 m A.C.D MLWS +0.00 m A.C.D LAT * A.C.D is 2.74 m below L.S.D
PORT DICKSON
+ 3.51 m A.C.D HAT + 2.79 m A.C.D MHWS + 1.96 m A.C.D MHWN + 1.55 m A.C.D MSL + 1.14 m A.C.D MLWN + 0.31 m A.C.D MLWS + 0.00 m A.C.D LAT * A.C.D is 1.45 m below L.S.D
KUALA BATU PAHAT
+ 3.37 m A.C.D HAT + 2.75 m A.C.D MHWS + 2.03 m A.C.D MHWN + 1.59 m A.C.D MSL + 1.15 m A.C.D MLWN + 0.43 m A.C.D MLWS + 0.00 m A.C.D LAT
HORSBURGH LT. HOUSE
+ 3.00 m A.C.D HAT + 2.82 m A.C.D MHHW + 1.73 m A.C.D MLHW + 1.71 m A.C.D MSL + 1.69 m A.C.D MHLW + 0.60 m A.C.D MLLW + 0.00 m A.C.D LAT
SOURCE : TIDE TABLES MALAYSIA 2008 AND NCES 1985
Figure 5.6a Tides – Peninsular Malaysia
DIURNAL TIDE
MIXED TIDE
SINGAPORE SEMIDIURNAL TIDE

Chapter 5 MALAYSIAN COASTAL INVENTORY
March 2009 5-7

Chapter 5 MALAYSIAN COASTAL INVENTORY
5-8 March 2009
5.4 WAVES ALONG THE MALAYSIAN COASTLINE
The wave climate along the Malaysian coasts was developed using visual observation of wave characteristics reported by ships at sea. East Coast of Peninsular Malaysia is exposed to severe wave especially during the North East Monsoon. On the other hand, the coastlines of west coast of Peninsular Malaysia, Sabah and Sarawak experienced mild wave condition. Wave roses at salient points along the Malaysian coastline are as shown in the following figures. The wave heights shown in the Wave Roses are served as a guide. However, for site specific project other than shown at the salient points, detailed wave analysis shall be carried out.

Chapter 5
MALAYSIAN COASTAL IN
VENTORY
March
2009
5-9
Figure 5.7a Wave Roses, Peninsular Malaysia – November to April (Source: National Coastal Erosion Study, 1985)

Chapter 5
MALAYSIAN COASTAL IN
VENTORY
5-10
March
2009
`
Figure 5.7b Wave Roses, Peninsular Malaysia – May to October (Source: National Coastal Erosion Study, 1985)

Chapter 5
MALAYSIAN COASTAL IN
VENTORY
March
2009
5-11
Figure 5.7c Wave Roses, East Malaysia – November to April (Source: National Coastal Erosion Study, 1985)

Chapter 5
MALAYSIAN COASTAL IN
VENTORY
5-12
March
2009
Figure 5.7d Wave Roses, East Malaysia - May to October ( Source : National Coastal Erosion Study, 1985 )

Chapter 5 MALAYSIAN COASTAL INVENTORY
March 2009 5-13
5.5 STORM SURGE AND TSUNAMI
Storm surge is a variation in water level due to the passage of atmospheric weather system across the surface of the sea. It can be effectively predicted with numerical model. During storms or monsoon periods, strong winds generate high and steep waves. In addition, these winds often create storm surge which raises the water level and exposes backshore to wave attack not normally vulnerable to waves. Due to these wave attacks, erosion may occur along the coast. Tsunamis are waves associated primarily with sub-sea seismic disturbances. These include land slides, volcanic eruptions, earth quakes and nuclear explosions. The waves created can travel long distance across ocean with speeds sometimes in excess of 800 km/hr. The wave periods are in the order of 5 minutes to 1 hour, with common range of about 20-30 minutes. Tsunamis are long gravity waves generated in deep oceans and have initial small wave height. The waves may travel through long distances without significant dissipation of energy. However, as it reaches the coast, the wave height can amplify dramatically due to the shoaling and refraction effects. In Malaysia, Tsunamis are uncommon. But the most recent Tsunami incident happened on 26th December 2004. The Tsunami was caused by earth quake located at an epicenter of 3.32° North and 95.85° East, i.e off the east coast of Northern Sumatra. The earth quake occurred at 06:58:53 GMT (Greenwich Time) correspondence to 07:08:53 local time. By noon, the impact of the Tsunami was felt along the coastlines of the northern states of Peninsular Malaysia. Water level recordings of standard ports in Langkawi and Pulau Pinang have shown sudden fluctuation of water levels within short duration during this time (Figures 5.8 (a) and 5.8 (b).)
The tsunami incident has caused fluctuation of water levels above the coastal bunds along the exposed coastlines of Perlis, Kedah, Penang, Perak and northern Selangor resulting in damages to properties (Photographs in Figure 5.9, 5.10 and 5.11). The reported death toll was 68 persons. 5.6 COASTAL CHARACTERISTICS INVENTORY
5.6.1 West Malaysia
The coasts of Malaysia are divided into reaches. Eleven reaches have been designated for the east coast of Peninsular Malaysia which starts from Thailand border to Sg. Johor. Meanwhile, nine reaches have been designated for the west coast of Peninsular Malaysia which starts at the Thailand border and ends at Selat Johor. The locations for each reach are shown in Figure 5.12. The characteristics of each reach such as the extent of each reach, type of coast, shoreline behavior, coastal processes, sand sources and sinks can be obtained from National Coastal Erosion Study 1985. However, for latest information please refer to Integrated Shoreline Management Plan (ISMP) of individual states. At present, states which have completed their ISMP are Negeri Sembilan and Pahang. 5.6.2 East Malaysia
Twenty one reaches have been designated for the coast of Sabah which starts at Kuala Menggalong and ends at Sabah-Indonesia border. Meanwhile, nine reaches have been designated for the coast of Sarawak which starts at Tg. Datuk (Indonesian border) and ends at Kuala Menggalong. The locations for each reach are shown in Figure 5.13. Again, the characteristics of each reach such as the extent of each reach, type of coast, shoreline behavior, coastal processes, sand sources and sinks can be found from National Coastal Erosion Study 1985 and the latest ISMP of individual states. At present, State of Sabah has completed its ISMP for the east coast.
Chapter 5 MALAYSIAN COASTAL INVENTORY
5-14 March 2009
5.7 RIVER MOUTHS INVENTORY
Under the National River Mouth Study in Malaysia (NRMS, 1994), the river mouths are classified into three (3) categories depending on the combination of the seriousness of physical, economic and social aspects affecting the fishing communities. The primary concern is the siltation of the river mouth. The description of the degree of seriousness of each aspect is given in Tables 5.4(a), 5.4(b) and 5.4(c). The three (3) categories of river mouths are as follows:-
(1) Category 1 (Critical) River mouths that fulfill the following combinations are included in Category 1:
Combination 1: The river mouth condition is very serious in both the physical and economic aspects.
Combination 2: The river mouth condition is very serious in both the physical and social
aspects, but it is serious in the economic aspect. Combination 3: The river mouth condition is serious in the physical aspect, but it is very
serious in the economic aspect and very serious or serious in the social aspect.
(2) Category 2 (Significant)
Except the river mouths in Category 1, those which fulfill the following combinations fall under Category 2:
Combination 1: The river mouth condition is more than serious in both the physical and economic aspects.
Combination 2: The river mouth condition is very serious in the physical aspect, but it is fair
in the economic aspect and very serious or serious in the social aspect. Combination 3: The river mouth condition is fair in the physical aspect, but it is very serious
in the economic aspect and very serious or serious in the social aspect.
(3) Category 3 (Acceptable) The remaining river mouths not categorized under either Category 1 or Category 2 belong to Category 3. Out of 100 river mouths studied under NRMS, 75 are under Categories 1 and 2, while the remaining is in Category 3. For Categories 1 and 2, counter measures were considered to mitigate the siltation problem. The counter measures were in the form of breakwater, jetty, training wall, groin, dredging and reservoir for extension of tidal prism. A list of river mouths under the three (3) categories is given in Table 5.5(a), 5.5(b) and 5.5(c).

Chapter 5 MALAYSIAN COASTAL INVENTORY
March 2009 5-15
5.8 RECENT AND FUTURE PROJECTS
Since the inception of Coastal Engineering Division in DID in early 1980’s, numerous coastal protection works have been implemented. Some parts of Malaysian coastline have been reclaimed as part of an extension of the mainland, whilst others as artificial islands. The aims of the reclamation works are for mixed development, airports, ports and power plant. Under the coastal protection works, coastlines under erosion threats were either controlled by holding back the beach with hard structures or protection by soft approach. The former are in the form of revetment and seawall, while the later are beach nourishment and replanting of mangroves along mud coasts. Replanting of mangrove plants along the coasts of Selangor and Johor have been undertaken in the past, whilst beach nourishment has been carried at Robina Park (Butterworth), Pantai Chenang (Langkawi), Kuala Terengganu and Morib. Artificial islands were also constructed as part of reclamation works. Some of these islands are Pulau Layang-layang (Sabah) (Photograph in Figure 5.14), Pulau Melaka (Photograph in Figure 5.15), and an island off the coast of Lekir, Perak. At the present moment, land reclamation works for mixed developments are active along the coast of Melaka. For list of reclamation works in Malaysia, reference shall be made to Coastal Division of DID. A list of coastal erosion control works carried out along Malaysian coastline in the past is given in Tables 5.2 and 5.3. Most of the works undertaken are in the form of quarrystone revetment. In view of concerns to the environment, coastal protection works will be more inclined in the future to the environmentally friendly approach such as beach nourishment, sand by passing and mangrove trees replanting along the mud coast.

Chapter 5 MALAYSIAN COASTAL INVENTORY
5-16 March 2009
Figure 5.8a
Tidal Analysis in Langkawi (23-29 December 2004)

Chapter 5 MALAYSIAN COASTAL INVENTORY
March 2009 5-17
Figure 5.8b
Tidal Analysis in Pulau Pinang (23-30 December 2004)

Chapter 5 MALAYSIAN COASTAL INVENTORY
5-18 March 2009
Figure 5.9 Fishermen’s Village at Sungai Betong River Mouth ; Experienced Funneling
Phenomena due to the Narrow River Mouth which Increased the Water Level more than 2 meters. (Ref. Tsunami Report 2004)
Figure 5.10 Overtopped Tsunami Wave Carrying Mud at Persiaran Gurney, Penang. (Ref. Tsunami Report 2004)
Figure 5.11 Fishermen’s Boats Drifted Away by Tsunami Wave about 200 meters Landward at Tg. Tokong, Penang. (Ref. Tsunami Report 2004)

Chapter 5 MALAYSIAN COASTAL INVENTORY
March 2009 5-19
Source: National Coastal Erosion Study, 1985
Figure 5.12 Coastal Reaches of Peninsular Malaysia
Reach 10 E
Reach 11 E
LEGEND :
+ + + + + INTERNATIONAL BOUNDARY
- ++ - ++- STATE BOUNDARY
KELANTAN
PERAK
TERENGGANU
PAHANG
NEGERI SEMBILAN
JOHOR
SINGAPORE
MELAKA
SELANGORR
KEDAH
THAILAND
Reach 1 W
Pulau
Langkawi
Reach 2 W
Kuala
Muda
PULAU PINANG
Reach 3 W
P.Gedong
Reach 4 W
Reach 5 W K. Beruas
P. Katak
Reach 6 W
Reach 7 W S. Kapar Besar
K. Selat Lumut
Reach 8 W
Tk. Mas
Reach 9 W
Selat Johor
Tg. Pengelih
Tg. Sedili Kecil
Reach 9 E
S. Endau
Pulau Tioman
Reach 8 E Reach 7 E
Kg. Leban Condong
K. Pahang
Reach 6 E
Reach 4 E Reach 3 E
Reach 2 E
Reach 1 E
Bt. Merang Kecil
K. Marang Bt.
Tg.
Reach 5 E
K.S. Pengkalan Datu
PERLIS
Km 50 0 50
FOR LATEST DESCRIPTION OF COASTAL INVENTORY, INCLUDING THE REACHES, SHALL REFER TO INTEGRATED SHORE MANAGEMENT PLAN (ISMP) OF INDIVIDUAL STATE
MELAKA STRAITS
SOUTH CHINA SEA

Chapter 5 MALAYSIAN COASTAL INVENTORY
5-20 March 2009

Chapter 5 MALAYSIAN COASTAL INVENTORY
March 2009 5-21
Figure 5.14 Reclamation Works at Pulau Layang Layang
Figure 5.15 Reclamation Works at Klebang, Melaka (adjacent to Pulau Melaka)

Chapter 5 MALAYSIAN COASTAL INVENTORY
5-22 March 2009
Table 5.2 Coastal Erosion Control Protection Works carried out in Peninsular Malaysia
No. Location of the Project Type of Protection Works PERLIS 1 North of Sungai Perlis Rock revetment 2 Kuala Perlis Rock revetment 3 North of Sungai Perlis (Phase 2) Rock revetment 4 Sg. Padang & Parit Tok Pandak, Sanglang Rock revetment 5 Perlindungan Ban Sungai Baru Rock revetment 6 Kurung Tengar Rock revetment & labuan blocks
KEDAH 1 Pantai Murni Toe protection for existing seawall 2 Pantai Merdeka Flex-slab revetment and sand
nourishment 3 Tanjung Dawai (Phase 1) Rock groynes + sand nourishment 4 Tanjung Dawai (Phase 2) Rock revetment 5 Kg. Tepi Sungai Kuala Muda Rock revetment 6 Kg. Jeruju – Kuala Jerlun, Kubang Pasu Rock revetment 7 Kuala Sungai Limau, Yan Rock revetment 8 Sungai Raga – Sungai Ruat, Yan Rock revetment 9 Kg. Singkir Laut Rock revetment 10 Kg. Huma Rock revetment 11 Kuala Sala Kecil dan Kuala Kangkong Rock revetment 12 Kg. Kelantan, Mukim Dulang, Yan Rock revetment
PULAU PINANG 1 Sungai Burung, Balik Pulau Rock revetment 2 Kg. Sekolah Kuala Muda. SPU Rock revetment 3 Bagan Tambang-Padang Benggali, SPU Rock groynes + sand nourishment 4 Butterworth (Phase 1) Beach nourishment + rock revetment 5 Kg. Sekolah Kuala Muda (Extension 1), SPU Rock revetment 6 Kg. Sekolah Kuala Muda (Extension 2), SPU Rock revetment 7 Butterworth (Phase 2) Rock revetment 8 Permatang Bakar Kapor Terminal groyne + rock revetment 9 Sungai Burung, Balik Pulau (Extension) Rock revetment 10 Kg. Kuala Sg. Muda, Seberang Prai Utara Rock revetment + mini breakwater 11 Pantai Robina, Butterworth Rock revetment
PERAK 1 Bagan Lipas, Hilir Perak Rock revetment 2 Bagan Lipas (Extension), Hilir Perak Rock revetment 3 Sungai Tiang Selatan, Bagan Datoh Rock revetment 4 Sungai Belukang, Bagan Datoh Rock revetment 5 Sungai Belukang (Extension), Bagan Datoh Rock revetment + retreat bund 6 Retreat Bund, Sg. Belukang Strengthening of retreat bund 7 Tebuk Semani, Bagan Datoh Rock revetment 8 Sungai Burung, Kerian Rock revetment 9 Sungai Burung, Kerian (Extension) Rock revetment 10 Kg. Nelayan Tanjung Piandang Rock revetment 11 Kg. Nelayan Tanjung Piandang (Extension) Rock revetment 12 Sg. Baru – Parit Tok Hin, Kerian Rock revetment 13 Sg. Tiang Selatan (naik taraf ban) Rock revetment & bund improvement 14 Parit C ke Sg. Batang Padang Bagan Sg.
Belukang Bund construction & revetment

Chapter 5 MALAYSIAN COASTAL INVENTORY
March 2009 5-23
SELANGOR 1 Sungai Haji Sirat (Phase 1) SAUH revetment 2 Sungai Haji Sirat (Phase 2) SAUH revetment 3 Sungai Haji Sirat (Phase 3) Rock revetment 4 Sungai Haji Sirat (Phase 3A) Rock revetment 5 Sekendi, Sungai Besar SAUH revetment 6 Sungai Limau, Sungai Besar SAUH revetment 7 Sungai Burung (Extension), Sabak Bernam Rock revetment 8 Sungai Pulai-Sungai Banting, Sabak Bernam Rock revetment 9 Tg. Sauh Beting Kepah, Sabak Bernam Rock revetment 10 Bagan Pasir, Tanjung Karang Rock revetment 11 Kg. Batu Laut, Kuala Langat Rock revetment 12 Tg. Sauh-Sg. Lang, Sabak Bernam SAUH revetment & rock revetment 13 Bagan Pasir. Tanjung Karang II SAUH revetment & rock revetment 14 Kg. Batu Laut, Kuala Langat Block
NEGERI SEMBILAN 1 Port Dickson Batu 4 Headland + beach nourishment 2 Baitul Hilal Cliff base protection and slope stability 3 Bagan Pinang – Tg. Lembah, Port Dickson Beach nourishment
MELAKA 1 Pantai Kundor (now Pantai Puteri) Flex-slab revetment + beach nourishment 2 Pantai Klebang & Tanjung Dahan Flex-slab revetment at Klebang & rock
revetment at Tg. Dahan 3 Pantai IMM, Pulau Besar Basalton revetment + beach nourishment 4 Padang Kemunting, Alor Gajah Labuan blocks JOHOR 1 Kuala Sg. Senggarang, Batu Pahat Rock revetment 2 Rimba Terjun, Pontian Rock revetment 3 Tg. Piai, Pontian Geotextile breakwaters 4 Kuala Sg. Pontian Besar Rock revetment 5 Parit Rabu-Tg. Tohor, Sri Menanti, Muar Rock revetment PAHANG 1 Jalan TLDM-Pelabuhan Kuantan Rock revetment 2 Kg. Tekek, Tioman Flex-slab revetment 3 Kg. Tanjung Pahang, Rompin Rock revetment 4 Taman Gelora Labuan blocks & rock toe protection 5 Teluk Cempedak, Kuantan Beach nourishment & PEM design & build
6 Kg. Genting, Tioman Labuan blocks 7 Kg. Tekek, Tioman Total solution-PEM, beach nourishment,
Labuan blocks, rivermouth improvement; design and build

Chapter 5 MALAYSIAN COASTAL INVENTORY
5-24 March 2009
Table 5.3 Coastal Erosion Control Protection Works carried out in East Malaysia
SARAWAK 1 Serpan, Asajaya Block II Rock revetment 2 Sungai Bilis, Asajaya Block IV Rock revetment 3 Bintulu (Phase 1) Groynes + sand nourishment 4 Bintulu (Phase 2) Groynes + sand nourishment 5 Taman Seaview, Bintulu Rock revetment 6 Kg. Buntal, Kuching Rock revetment 7 Jalan Miri-Kuala Baram (Package 1) Rock revetment 8 Jalan Miri-Kuala Baram at Lutong (Package 2) Rock revetment 9 Jalan Miri-Kuala Baram KM 20 (Package 3) Rock revetment 10 Tanjung Batu, Bintulu Rock revetment 11 Pasir Pandak Rock revetment 12 Kg. Rejang, Bahagian Mukah Rock revetment 13 Kg. Santubong, Kuching Rock revetment 14 Sg. Serpan, Samarahan Rock revetment 15 Jalan Miri-Kuala Baram Rock revetment 16 Kg. Punang, Lawas Rock revetment 17 Miri (Marriott Resort) Rock revetment & Labuan blocks 18 Kuching (Damai Golf Course) Rock revetment 19 Kuching (Holiday Inn Damai Lagoon Resort) Rock Revetment & stepped revetment 20 Kuala Baram, Miri (Marine Dept. Lighthouse) Rock revetment
SABAH 1 Pantai Manis, Papar Labuan Blocks WILAYAH PERSEKUTUAN LABUAN 1 Pantai Layang-layangan Beach nourishment 2 Tanjung Aru Rock revetment
TERENGGANU 1 Seberang Takir Beach nourishment 2 Kuala Sg. Terengganu-Kuala Sg. Ibai Beach nourishment 3 Teluk Puchong, Kemaman Flex-slab revetment 4 Kuala Kemaman Beach nourishment, part of dredging
contract by Lembaga Pelabuhan Kemaman 5 Kuala Kemaman Breakwater, rock revetment 6 Dungun Package A Groynes + beach nourishment 7 Dungun Package B Rock revetment KELANTAN 1 Pengkalan Datu-Kg. Teritam Beach nourishment 2 Pantai Cahaya Bulan, Kota Bharu Beach management system 3 Pantai Cahaya Bulan, Kota Bharu Rock revetment 4 Pantai Sabak Fasa 1 Rock revetment 5 Pantai Sabak Fasa 2 Rock revetment 6 Pantai Sabak Fasa 3 Rock revetment 7 Pantai Irama, Bachok, Kelantan Labuan blocks

Chapter 5 MALAYSIAN COASTAL INVENTORY
March 2009 5-25
Table 5.4 (a) – Physical Aspects
(a)
Very Serious The assumed minimum depth in the river mouth is shallower than the draft of the largest boat.
(b)
Serious The assumed minimum depth in the river mouth is in the range between the draft of the largest boat and the clearance plus draft of the largest boat.
(c)
Fair The assumed minimum depth in the river mouth is deeper than the draft of the largest boat plus clearance.
Table 5.4 (b) – Economic Aspects
Seriousness
Number of Fishermen
Very Serious
More than 200
Serious
200 – 50
Fair
Less than 50
Table 5.4 (c) – Social Aspects
Seriousness
Condition
Very Serious
Existence of very strong complaint
Serious
Existence of fairly strong complaint
Fair
No complaint

Chapter 5 MALAYSIAN COASTAL INVENTORY
5-26 March 2009
Table 5.5 (a) LIST OF RIVER MOUTHS BY CATEGORY (Category-1 : Critical)
=============================================== Serial
Name
Physical Condition
*2
Economic Condition
*2
Social Condition
*2 ===============================================
1 Perlis*1 VS VS SE
2 Baru VS VS VS
3 Sanglang VS VS FA
4 Jerlun VS VS FA
5 Kedah*1 VS VS SE
6 Yan VS VS VS
8 Cenang VS SE VS
9 Muda*1 VS SE VS
11 Kerian VS VS VS
12 Pinang VS VS VS
14 Tg. Piandang VS VS VS
15 Gula VS VS SE
19 Beruas*1 VS VS VS
23 Selangor VS VS VS
31 Baru VS SE VS
32 Melaka VS VS VS
43 Pontian Kecil VS VS SE
44 Sedeli Be. VS VS FA
45 Mersing*1 VS VS SE
46 Endau VS VS FA
48 Rompin VS VS FA
50 Nenasi VS VS FA
51 Pahang VS VS FA
53 Kuantan VS VS SE
55 Kemaman VS VS FA
58 Paka VS VS FA
59 Dungun* VS VS FA
61 Marang*1 VS VS VS
62 Terengganu*1 SE VS SE
67 Kelantan*1 VS VS FA
78 Sadong VS VS FA
80 Oya VS VS FA
81 Mukah VS VS FA
89 Padas VS VS FA
98 Tawau VS VS FA =============================================== Note: *1 Dredging has been conducted *2 VS: Very Serious SE: Serious FA: Fair

Chapter 5 MALAYSIAN COASTAL INVENTORY
March 2009 5-27
Table 5.5 (b) LIST OF RIVER MOUTHS BY CATEGORY (Category-2 : Significant) ===============================================
Serial
Name
Physical Condition
*2
Economic Condition
*2
Social Condition
*2 ===============================================
13 Bayan Lepas VS FA SE
16 Sangga VS SE SE
17 Larut VS SE SE
18 Terong SE SE FA
20 Batu VS FA VS
22 Lekir VS SE FA
24 Kapar Besar VS SE FA
25 Langkat SE SE VS
26 Sepan Ke. SE FA VS
27 Sepang SE SE FA
28 Lukut VS SE SE
33 Duyong VS SE SE
34 Umbai VS SE SE
35 Merlimau VS SE SE
36 Muar SE VS FA
37 Parit Jawa VS SE FA
38 Sarang Buaya VS SE FA
39 Batu Pahat VS SE FA
40 Senggarang VS SE SE
41 Renggit VS SE SE
42 Benut VS SE FA
52 Terus VS SE FA
56 Kemasik VS SE SE
57 Kerteh VS SE SE
60 Mercang VS FA SE
63 Merang VS SE FA
66 Pak Amat VS FA VS
69 Sematan VS SE FA
70 Kayan VS SE FA
76 Buntal VS SE FA
77 Bako SE SE FA
82 Balingian VS SE FA
84 Tatau VS SE FA
87 Sibuti VS SE FA
88 Lawas VS SE FA
90 Papar VS FA SE
92 Tuaran VS SE FA
95 Sugut SE VS FA
99 Umas-umas VS SE FA
100 Kalabakan SE SE FA =============================================== Note: *1 Dredging has been conducted *2 VS: Very Serious SE: Serious FA: Fair

Chapter 5 MALAYSIAN COASTAL INVENTORY
5-28 March 2009
Table 5.5 (c) LIST OF RIVER MOUTHS BY CATEGORY (Category-3 : Acceptable)
===============================================
Serial
Name
Physical Condition
*2
Economic Condition
*2
Social Condition
*2 ===============================================
7 Melaka VS FA FA
10 Perai SE FA FA
21 Dingding*1 FA SE FA
29 Raya VS FA FA
30 Linggi VS FA FA
47 Pontian VS FA FA
49 Merchong VS FA FA
54 Beserah VS FA FA
64 Keluang VS FA FA
65 Gali VS FA FA
68 Rulah VS FA FA
71 Sempadi VS FA FA
72 Rambungun FA FA FA
73 Sibu Laut FA FA FA
74 Salak FA SE FA
75 Santubong SE FA FA
79 Kabong FA VS FA
83 Serupadi VS FA FA
85 Suai SE FA FA
86 Niah VS FA FA
91 Inanam VS FA FA
93 Bandau FA SE FA
94 Bongan VS FA FA
96 Segama FA FA FA
97 Kalumpang FA SE FA =============================================== Note: *1 Dredging has been conducted *2 VS: Very Serious SE: Serious FA: Fair

Chapter 5 MALAYSIAN COASTAL INVENTORY
March 2009 5-29
REFERENCES
[1] DID (1985). “National Coastal Erosion Study”, August 1985. [2] Department of Irrigation and Drainage, DID Malaysia (2005). “Laporan Penyiasatan Pasca-Tsunami, 26 December 2004”, Coastal Division. [3] Jurutera Konsultant (Semenanjung) Sdn. Bhd. (2002). “The Shoreline Management Plan of the Coastline from Kuala Sg. Pahang to the State Boundary of Pahang/Terengganu”, August 2002. [4] DID Malaysia. “Guidelines on Erosion Control for Development Projects in the Coastal Zones” [5] DID in Association with JICA (1994), “The National River Mouths Study in Malaysia”

Chapter 5 MALAYSIAN COASTAL INVENTORY
5-30 March 2009
(This page is deliberately left blank)

Chapter 5 MALAYSIAN COASTAL INVENTORY
__________________________________________________________________________________________
March 2009 5A-1
APPENDIX 5-A
MAPS OF MALAYSIAN SHORELINE WITH CLASSIFICATION
OF EROSION CATEGORIES
FIGURE 5A – 1

Chapter 5 MALAYSIAN COASTAL INVENTORY
__________________________________________________________________________________________
5A-2 March 2009
FIGURE 5A – 2

Chapter 5 MALAYSIAN COASTAL INVENTORY
__________________________________________________________________________________________
March 2009 5A-3
FIGURE 5A – 3

Chapter 5 MALAYSIAN COASTAL INVENTORY
__________________________________________________________________________________________
5A-4 March 2009
FIGURE 5A – 4

Chapter 5 MALAYSIAN COASTAL INVENTORY
__________________________________________________________________________________________
March 2009 5A-5
FIGURE 5A – 5
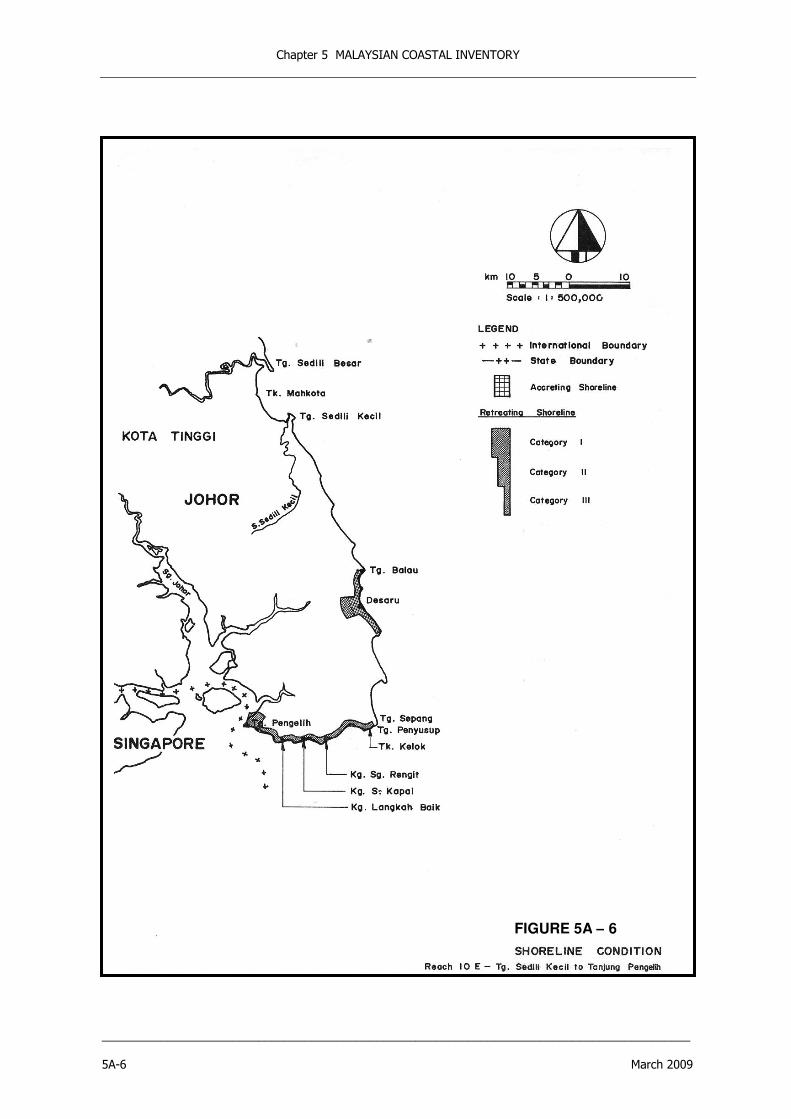
Chapter 5 MALAYSIAN COASTAL INVENTORY
__________________________________________________________________________________________
5A-6 March 2009
FIGURE 5A – 6

Chapter 5 MALAYSIAN COASTAL INVENTORY
__________________________________________________________________________________________
March 2009 5A-7
FIGURE 5A – 7

Chapter 5 MALAYSIAN COASTAL INVENTORY
__________________________________________________________________________________________
5A-8 March 2009
FIGURE 5A – 8
International Boundary
State Boundary

Chapter 5 MALAYSIAN COASTAL INVENTORY
__________________________________________________________________________________________
March 2009 5A-9
FIGURE 5A – 9

Chapter 5 MALAYSIAN COASTAL INVENTORY
__________________________________________________________________________________________
5A-10 March 2009
FIGURE 5A – 10

Chapter 5 MALAYSIAN COASTAL INVENTORY
__________________________________________________________________________________________
March 2009 5A-11
FIGURE 5A – 11
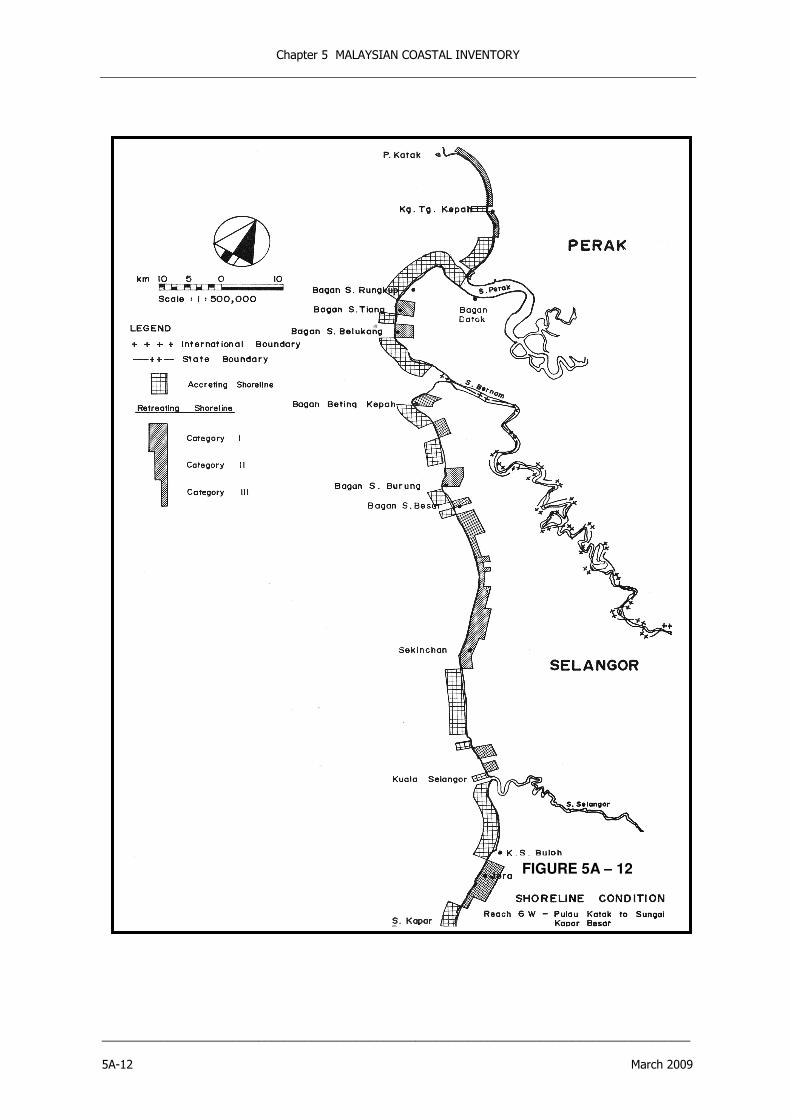
Chapter 5 MALAYSIAN COASTAL INVENTORY
__________________________________________________________________________________________
5A-12 March 2009
FIGURE 5A – 12

Chapter 5 MALAYSIAN COASTAL INVENTORY
__________________________________________________________________________________________
March 2009 5A-13
FIGURE 5A – 13

Chapter 5 MALAYSIAN COASTAL INVENTORY
__________________________________________________________________________________________
5A-14 March 2009
FIGURE 5A – 14

Chapter 5 MALAYSIAN COASTAL INVENTORY
__________________________________________________________________________________________
March 2009 5A-15
FIGURE 5A – 15

Chapter 5 MALAYSIAN COASTAL INVENTORY
__________________________________________________________________________________________
5A-16 March 2009
SHORELINE CONDITION Reach 9 W – Teluk Mas to Selat Johor
FIGURE 5A – 15 ( Cont.)

Chapter 5 MALAYSIAN COASTAL INVENTORY
__________________________________________________________________________________________
March 2009 5A-17
FIGURE 5A – 16

Chapter 5 MALAYSIAN COASTAL INVENTORY
__________________________________________________________________________________________
5A-18 March 2009
FIGURE 5A – 17
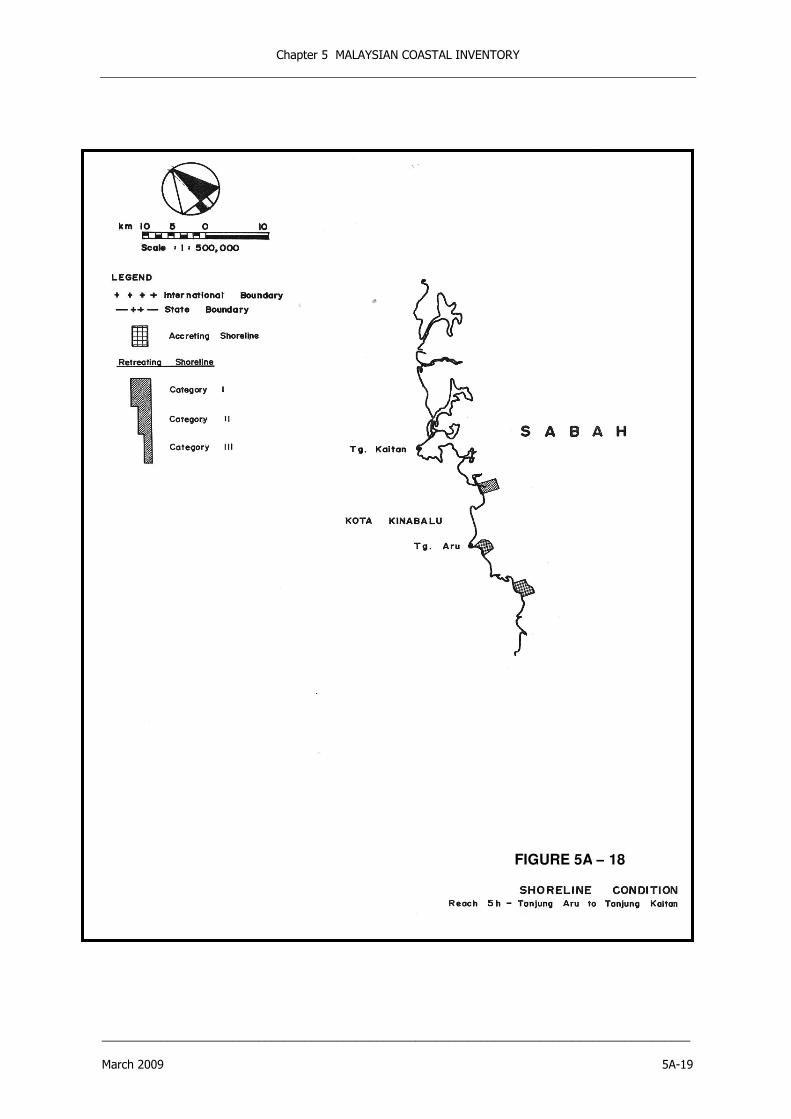
Chapter 5 MALAYSIAN COASTAL INVENTORY
__________________________________________________________________________________________
March 2009 5A-19
FIGURE 5A – 18

Chapter 5 MALAYSIAN COASTAL INVENTORY
__________________________________________________________________________________________
5A-20 March 2009
FIGURE 5A – 19

Chapter 5 MALAYSIAN COASTAL INVENTORY
__________________________________________________________________________________________
March 2009 5A-21
FIGURE 5A – 20

Chapter 5 MALAYSIAN COASTAL INVENTORY
__________________________________________________________________________________________
5A-22 March 2009
FIGURE 5A – 21

Chapter 5 MALAYSIAN COASTAL INVENTORY
__________________________________________________________________________________________
March 2009 5A-23
FIGURE 5A – 22

Chapter 5 MALAYSIAN COASTAL INVENTORY
__________________________________________________________________________________________
5A-24 March 2009
FIGURE 5A – 23

Chapter 5 MALAYSIAN COASTAL INVENTORY
__________________________________________________________________________________________
March 2009 5A-25
FIGURE 5A – 24
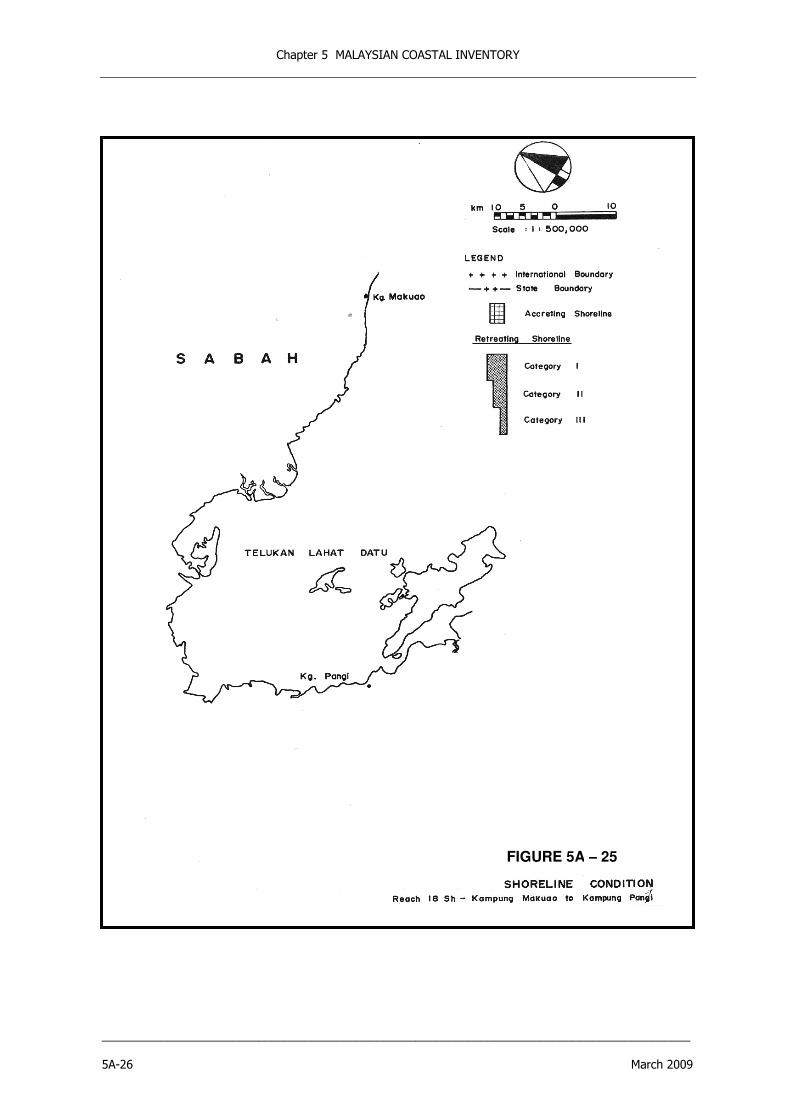
Chapter 5 MALAYSIAN COASTAL INVENTORY
__________________________________________________________________________________________
5A-26 March 2009
FIGURE 5A – 25
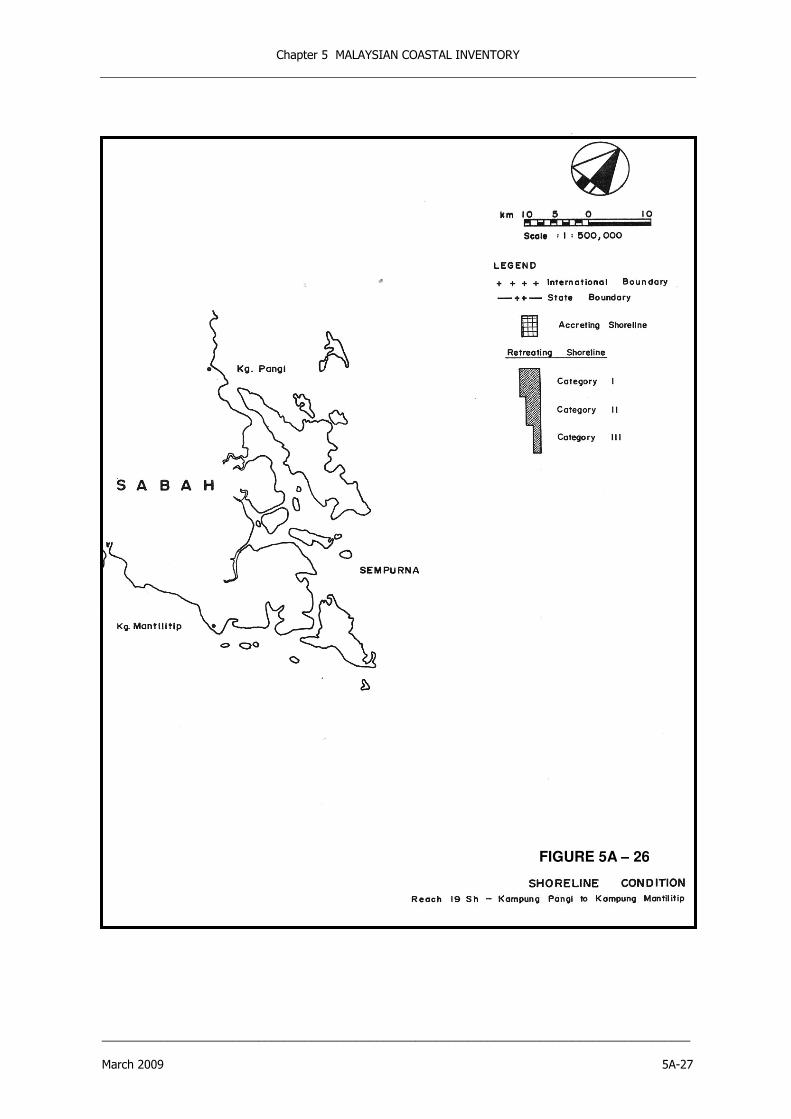
Chapter 5 MALAYSIAN COASTAL INVENTORY
__________________________________________________________________________________________
March 2009 5A-27
FIGURE 5A – 26

Chapter 5 MALAYSIAN COASTAL INVENTORY
__________________________________________________________________________________________
5A-28 March 2009
FIGURE 5A – 27

Chapter 5 MALAYSIAN COASTAL INVENTORY
__________________________________________________________________________________________
March 2009 5A-29
FIGURE 5A – 28

Chapter 5 MALAYSIAN COASTAL INVENTORY
__________________________________________________________________________________________
5A-30 March 2009
FIGURE 5A – 29

Chapter 5 MALAYSIAN COASTAL INVENTORY
__________________________________________________________________________________________
March 2009 5A-31
FIGURE 5A – 30

Chapter 5 MALAYSIAN COASTAL INVENTORY
__________________________________________________________________________________________
5A-32 March 2009
FIGURE 5A – 31

Chapter 5 MALAYSIAN COASTAL INVENTORY
__________________________________________________________________________________________
March 2009 5A-33
FIGURE 5A–31(cont.) Cont.)

Chapter 5 MALAYSIAN COASTAL INVENTORY
__________________________________________________________________________________________
5A-34 March 2009
FIGURE 5A – 32

Chapter 5 MALAYSIAN COASTAL INVENTORY
__________________________________________________________________________________________
March 2009 5A-35
FIGURE 5A – 33

Chapter 5 MALAYSIAN COASTAL INVENTORY
__________________________________________________________________________________________
5A-36 March 2009
FIGURE 5A – 34

Chapter 6 HYDRAULIC STUDY METHODOLOGY IN COASTAL ENGINEERING ___________________________________________________________________________________________
________________________________________________________________________________________ March 2009
CHAPTER 6
HYDRAULIC STUDY METHODOLOGY IN COASTAL ENGINEERING
A. PHYSICAL MODELING B. NUMERICAL MODELING


Chapter 6 HYDRAULIC STUDY METHODOLOGY IN COASTAL ENGINEERING ___________________________________________________________________________________________
___________________________________________________________________________________________ March 2009 6-i
Table of Contents
Table of Contents ................................................................................................................... 6-i
List of Tables .......................................................................................................................6-iv
List of Figures .......................................................................................................................6-iv
6.1 INTRODUCTION........................................................................................................... 6-1
6.2 HYDRAULIC STUDY AND THE DEVELOPMENT PROCESS ................................................ 6-1
6.2.1 Planning The Hydraulic Study............................................................................ 6-2
6.2.2 Study Components ........................................................................................... 6-2
6.2.3 Measurements In The Field ............................................................................... 6-3
6.3 OVERVIEW OF MODELING IN COASTAL ENGINEERING .................................................. 6-3
PART A : PHYSICAL MODELING
6.4 PHYSICAL MODELING IN COASTAL ENGINEERING ......................................................... 6-4
6.4.1 Physical Modeling in General ............................................................................. 6-4
6.4.2 Physical Model Benefits And Shortcomings ......................................................... 6-5
6.4.3 Physical vs Numerical Models ............................................................................ 6-6
6.5 FIXED AN MOVEABLE BED MODELS............................................................................... 6-6
6.5.1 Fixed Bed Models ............................................................................................. 6-7
6.5.2 Moveable Bed Models ..................................................................................... 6-10
6.5.3 Fixed Bed Model With Tracer Sediments .......................................................... 6-11
6.6 EXAMPLE OF 2D AND 3D BREAKWATER STABILITY TEST ............................................. 6-12
6.6.1 2D Model Tests .............................................................................................. 6-13
6.6.2 3D Model Test................................................................................................ 6-14
6.7 SELECTION OF WAVE CHARACTERISTICS FOR PHYSICAL MODEL TESTS ...................... 6-16
6.7.1 Model Scale Ratios.......................................................................................... 6-16
6.7.2 Selection of Representative Sea States ............................................................ 6-16
6.7.3 Duration of Time Series .................................................................................. 6-17
6.7.4 “Free” and “Bound” Long Waves ..................................................................... 6-18

Chapter 6 HYDRAULIC STUDY METHODOLOGY IN COASTAL ENGINEERING ___________________________________________________________________________________________
___________________________________________________________________________________________ 6-ii March 2009
6.7.5 2D/3D Waves ................................................................................................. 6-19
6.7.6 Problems in 3D Wave Modeling ....................................................................... 6-20
6.7.7 Wave Generators and Wave Generation........................................................... 6-20
6.8 PLANNING AND EXECUTION OF TESTS ....................................................................... 6-21
6.8.1 Bathymetric Model Construction ...................................................................... 6-21
6.8.2 Wave Reflection in Laboratory......................................................................... 6-21
6.8.3 Test Programme............................................................................................. 6-22
6.9 MEASUREMENT AND ANALYSIS OF LABORATORY WAVES ............................................ 6-23
6.9.1 Measurement ................................................................................................. 6-23
6.9.2 Measurements of Multi-directional Waves......................................................... 6-24
6.9.3 Data Management .......................................................................................... 6-25
REFERENCES....................................................................................................................... 6-26
PART B : NUMERICAL MODELING
6.10 NUMERICAL MODELING IN COASTAL ENGINEERING .................................................... 6-31
6.10.1 Evolution of Numerical Modeling ..................................................................... 6-31
6.10.2 Types of Numerical Modeling Techniques......................................................... 6-31
6.10.3 The Modeling Cycle ........................................................................................ 6-33
6.11 BUILDING THE NUMERICAL MODEL ............................................................................ 6-34
6.11.1 Coastal Environment In The Project Area ........................................................ 6-34
6.11.2 Input Data and Field Measurement for Numerical Modeling............................... 6-35
6.11.3 Selection Of Appropriate Numerical Model........................................................ 6-35
6.11.4 Coastal Modeling Protocol .............................................................................. 6-36
6.11.5 Typical Coastal Modeling Modules ................................................................... 6-37
6.11.5.1 Wave ............................................................................................. 6-37
6.11.5.2 Hydrodynamics ............................................................................... 6-38
6.11.5.3 Sediment Transport......................................................................... 6-39
6.11.5.4 Water Quality.................................................................................. 6-39
6.11.5.5 Morphology..................................................................................... 6-39

Chapter 6 HYDRAULIC STUDY METHODOLOGY IN COASTAL ENGINEERING ___________________________________________________________________________________________
___________________________________________________________________________________________ March 2009 6-iii
6.11.6 The Hydrodynamic Modeling Cycle ...................................................................6-40
6.11.7 Model Setup....................................................................................................6-40
6.11.8 Sensitivity Studies ...........................................................................................6-41
6.11.9 Model Calibration ............................................................................................6-42
6.11.10 Model Verification............................................................................................6-43
6.11.11 Study Scenarios...............................................................................................6-43
6.12 USING NUMERICAL MODEL RESULTS IN IMPACT ANALYSIS ..........................................6-43
6.12.1 Types of Impact ..............................................................................................6-43
6.12.2 Coastal Erosion ...............................................................................................6-44
6.12.3 Coastal Flooding..............................................................................................6-45
6.12.4 Rivermouth Impacts ........................................................................................6-45
6.12.5 Water Quality..................................................................................................6-45
6.12.6 Destruction of Coastal Habitats ........................................................................6-46
6.13 HYDRAULIC STUDY AND NUMERICAL MODELING REPORT CONTENT.............................6-47
6.13.1 Report Structure and Content...........................................................................6-47
6.13.2 Quality of Reporting.........................................................................................6-47
REFERENCES........................................................................................................................6-48

Chapter 6 HYDRAULIC STUDY METHODOLOGY IN COASTAL ENGINEERING ___________________________________________________________________________________________
___________________________________________________________________________________________ 6-iv March 2009
List of Tables
Table Description Page
6.1 Typical Dimensions of Physical Models 6-5
6.2 Types of Fixed Bed Models and Classification by Purpose and Their Typical Application in Coastal Engineering 6-8
6.3 Evolution of Numerical Modeling 6-31
6.4 Environments and Their Circulation Patterns 6-34
6.5 Selection of Mathematical Equations And Models 6-35
6.6 Quality of Hydraulic Study Report 6-47
List of Figures
Figure Description Page
6.1 Typical Examples on Physical Model Application in Coastal Engineering 6-9
6.2 Moveable Bed Model Used To Study The Shape Of The Salient Behind A Coastal Breakwater 6-11
6.3 Fixed Bed Model With Fine Sand Used To Illustrate Areas Of Erosion And 6-12 Deposition 6.4 Sg. Terengganu River Mouth Improvement Project 6-12
6.5 Bathymetry (Prototype values) 6-13
6.6 Definition of Breakwater Elements (Profile Used as Example) 6-13
6.7 Sketch of Overtopping Measurements 6-14
6.8 Model Breakwater, Before Testing 6-14
6.9 Model Bathymetry, Wave Gauge and Wave Generator Positions 6-15
6.10 Breakwater Test Section, Tetrapods as Armour 6-15
6.11 Physical Modeling Of Wave Impact Forces And Run-Up On A Monopole Widely Used In Offshore Wind Farms 6-18
6.12 Finite Element Model Grid 6-32
6.13 Finite Difference Model Grid For A Study Coastline 6-32
6.14 The Modeling Cycle 6-33
6.15 Coastal Modeling Task Flow-Chart 6-36
6.16 Wave Penetration into A Harbor – Wave Heights Are Presented As Contours 6-37
6.17 Current Vectors in a Model Grid 6-38
6.18 Hydrodynamic Modeling Flow-Chart 6-40
6.19 Model Set-Up Depicting Bathymetry Surrounding Pulau Pinang 6-41
6.20 Model Calibration Using Water Levels 6-42
6.21 Comparison of Field Measured Flow Velocity against Model Results 6-43

Chapter 6 HYDRAULIC STUDY METHODOLOGY IN COASTAL ENGINEERING ___________________________________________________________________________________________
___________________________________________________________________________________________ March 2009 6-v
6.22 Converging Wave Vector Arrows Indicate a Concentration of Wave Energy at 6-44 a Point on the Coastline 6.23 Wave Vectors and Shaded Contours 6-45
6.24 Plume Dispersion Modeled by Advection and Dispersion Model 6-46

Chapter 6 HYDRAULIC STUDY METHODOLOGY IN COASTAL ENGINEERING ___________________________________________________________________________________________
___________________________________________________________________________________________ 6-vi March 2009
(This page is deliberately left blank)

Chapter 6 HYDRAULIC STUDY METHODOLOGY IN COASTAL ENGINEERING ___________________________________________________________________________________________
___________________________________________________________________________________________ March 2009 6-1
6 HYDRAULIC STUDY METHODOLOGY IN COASTAL ENGINEERING
6.1 INTRODUCTION
Construction works situated at the shoreline bear the possibility of being affected by or having an effect on natural coastal processes. Examples include maritime structures such as ports, wharfs, marinas, jetties and erosion control structures such as breakwaters and groynes. Hydraulic studies are conducted to develop an understanding of the prevalent coastal processes in and around the project area and to determine the impact of the proposed development on the coast. When a structure is situated in the nearshore area, it most likely will have some effect on the natural coastal processes particularly, sediment transport and shoreline morphology. These projects could disrupt the natural equilibrium of the shoreline resulting in erosion and sedimentation problems that would require engineering intervention to resolve. Optimization of a scheme and mitigating the potential adverse effects of the scheme requires knowledge of the prevalent oceanographic and meteorological forcings that establish the naturally occurring processes within the study area. A hydraulic study can be carried out for the following purposes : i) Analysis of coastal problems;
ii) Analysis of suitability of conceptual proposal for coastal erosion control works and river mouth improvement works;
iii) Regional planning of shoreline development e.g. ISMP;
iv) Providing support for decision making in settling dispute between parties.
Physical and numerical modeling are often required in hydraulic studies to support the layout and design of the structures and to predict the effect of structures on the shoreline. Physical models have been traditionally used to simulate the impact of waves on coastal structures for phenomena occurring over short periods. Rapid advances in computer technology and numerical modeling techniques have facilitated the growth and popularity of numerical modeling making it an essential tool in hydraulic studies. Numerical models enable the simulation of complex phenomena such as hydrodynamics, waves, sediment transport, erosion, sedimentation, shoreline evolution and sediment plume dispersion etc. Fast computers now allow long term analysis of the simulated conditions amounting to months in real-time. 6.2 HYDRAULIC STUDY AND THE DEVELOPMENT PROCESS
The Guidelines on Erosion Control for Coastal Development (JPS 1/1997) stipulates that a proposed coastal development would require a hydraulic study and modeling if the project:
• can potentially cause changes to wave, current and sediment transport patterns • changes nearshore bathymetry • causes erosion to adjacent beaches
Under the Environmental Impact Assessment (EIA) Order 1974 (revised 1987), it is mandatory for certain development activities (commonly known as ‘prescribed’ activities) to undergo an EIA. If these projects lie on the coast, a coastal hydraulic study would be stipulated as part of the EIA. These projects include backshore, shorefront as well as offshore projects which risk interfering with the natural coastal processes and harming the environment. Developers must therefore engage coastal engineers to study the impacts of their project proposal on the coastline and recommend mitigative measures which the developer is obliged to implement. To facilitate the study, DID has produced Guidelines for Preparation of Coastal Hydraulic Study and Impact Evaluation (for Hydraulic Studies using Numerical Models).

Chapter 6 HYDRAULIC STUDY METHODOLOGY IN COASTAL ENGINEERING ___________________________________________________________________________________________
___________________________________________________________________________________________ 6-2 March 2009
6.2.1 Planning the Hydraulic Study
A hydraulic study may be a desk-top exercise whereby analysis and assessments are based on secondary information and published findings. Desk-top studies are invariably dependent on the quantity and quality of the earlier works. Desk top studies are carried out for small scale project of a few acres or for preliminary conceptual design. Secondary information from previous study such as National Coastal Erosion Study (NCES), Integrated Shoreline Management Plan (ISMP) and available hydraulic studies of other projects in the vicinity of the areas concerned can be used to analyse the coastal processes for the desk top studies. Most major developments should however be guided by a hydraulic study of its own and founded on the most recent investigations and measurements. All hydraulic studies should begin with a review of relevant literature specific to the study area, consultation with an experienced coastal engineer and an assessment of the quality of information available and the gaps in understanding if any. This leads to a determination of what analysis would be needed for the design, optimization and assessment of the impact of the project and subsequently the types of long-term data and field measurements and/or numerical modeling to establish design data by hindcast techniques required to facilitate the analysis. 6.2.2 Study Components The components of a hydraulic study vary according to the project objectives. Most coastal erosion control projects include the study of waves, currents and sediment transport. A typical hydraulic study may comprise all or a combination of the following:
� Environmental forcing data o Study of wind and wave patterns involving the statistical analysis of archived data
and field measurements o Determination of tidal patterns in the study area based on predicted tides and
supplemented by field measurement
� Hydrodynamics by numerical modeling o Analysis of wave propagation, refraction and diffraction patterns o Analysis of tidal heights and storm surges o Analysis of current patterns over various tidal cycles
� Sediment transport analysis due to currents, waves or both and interaction with the planned
scheme o Establish a baseline description of the sediment transport pattern in the area
including potential shoreline evolution o Design the layout of the scheme to fit with transport conditions o Analysis of the effects of sediment transport which creates erosion and
sedimentation patterns o Study of coastal evolution in the short and long term
� Analysis of plume dispersion from river mouths or pollution source
o Perform plume simulation of suspended sediments and pollutants o Analysis of changes to water quality due to project activities o Analysis of the contribution of rivers as a source of sediment or pollution
� Impact analysis
o Identifying existing or baseline physical and environmental condition as well as socio-economic activities
o Determining the Impact of change in wave regime and sediment transport on coastal erosion and sediment patterns
o Ascertaining the direct and residual impacts of project on existing � flora and fauna � economic or recreational activities

Chapter 6 HYDRAULIC STUDY METHODOLOGY IN COASTAL ENGINEERING ___________________________________________________________________________________________
___________________________________________________________________________________________ March 2009 6-3
� Mitigative measures o Optimize the scheme in order to minimize the possible impacts o Quantifying possible erosion sites and recommending erosion control measures o Introduction of specific development setbacks and monitoring programme
6.2.3 Measurements In The Field
Field measurements or surveys provide the investigator with the necessary data to assess the processes occurring in the study area, however often supported by results of numerical modeling. Examples on typical measurements are listed below. The field recording programme should be designed carefully as field programmes are time consuming and expensive:
� Current velocity is measured using directional current meters. Since numerical models are usually depth averaged, the current meter is typically placed at about mid-depth in the water column. For more elaborate analysis, a current profile can be established by using Acoustic Doppler Current Profilers (ADCP) which enables measurement at fixed intervals in the water column; use few recorders and optimize the coverage of the recording locations by combining with numerical modeling
� Waves can be measured using wave buoys and ADCP. Nowadays more sophisticated methods such as satellite observations and radar techniques have been developed to measure waves over a large area;
� Conductivity, Temperature, Depth (CTD) measurements are taken using CTD meters that capture all three parameters simultaneously;
� Turbidity is measured in the field using turbidity meters that actually record the amount of light detected at the depth of measurement;
� Bathymetric measurement or more commonly known as hydrographic survey is done using either single-beam or multi-beam echo-sounders. These echo-sounders record depth readings which are synchronized with positional readings from a Differential Global Positioning Systems (DGPS);
� Sediment characteristics are obtained by collection and analysis of bed samples
� Bed-forms mapping is obtained through a side scan sonar which is attached at the bottom of the survey boat;
� Sub-bed profiles can be captured using a sub-bottom profiler or boomer whose signals detect the difference in strata densities.
Comments to the measurements:
o Most quantities are standard o Difficulties with sediment transport measurement – especially bed load,
sediment transport measurements are not recommended, use e.g. simulation of historical shoreline evolution for indirect calibration of the littoral drift budget at the site
o Non-intrusive measurement o Wide spatial and temporal coverage, however optimize the coverage by
combining with 2D numerical modeling o Increase in accuracy
6.3 OVERVIEW OF MODELING IN COASTAL ENGINEERING Modeling helps affirm observed physical phenomena and/or casting light on phenomena, which have not been observed. Properly developed modeling supplies reliable qualitative predictions. Physical and numerical modeling are common tools in coastal and port engineering design. Hydraulic scale models have been widely used to determine the optimum layout of breakwaters, to select the optimum size of armour rocks, and to some extent to investigate the effect of coastal structures on

Chapter 6 HYDRAULIC STUDY METHODOLOGY IN COASTAL ENGINEERING ___________________________________________________________________________________________
___________________________________________________________________________________________ 6-4 March 2009
shorelines. Physical models are scaled down representations of the study area built in a laboratory equipped with wave generators and instrumentation for the measurement of waves, flow and depths. Numerical modeling relies on computers which rapidly and sequentially solve the mathematical equations that approximate physical phenomena such as tidal flow, storm surge, and wave generation and propagation, sediment transport and shoreline evolution etc. The advantage of numerical models over physical models is its capacity to simulate the hydrodynamics over a large area and over long time periods. Physical models remain an important tool in studying near-field phenomena particularly wave-structure interaction. It is very important to realize that modeling is a tool which provides the engineer with an insight on the actual phenomena being studied. Users of numerical modeling tools should have sufficient knowledge of coastal hydraulics and an understanding of computers and model behaviour. In a hydraulic study, the results of a modeling exercise should not be the only basis of judgement. PART A : PHYSICAL MODELING
6.4 PHYSICAL MODELING IN COASTAL ENGINEERING
A physical model is a physical system reproduced at reduced size so that major dominant forces governing the system and the important processes are represented in the model in correct proportion to the actual physical system.
There are two main types of physical models: The first type is the experimental model which is used to verify predictions of other models (e.g. numerical models). The experimental model does not necessarily reflect a prototype as it is designed to isolate selected physical processes and study the phenomena individually. These models are often also referred to as process models. It may also be used as verification basis for a numerical model, where the experimental model is considered the "prototype". The second type is the reduced scale model, which is used to predict prototype behaviour. This is the more difficult model due to the pronounced problems of scaling. These models are often known as design models. The present chapter on physical modeling deals with the second type, the physical scale model, or in short, the physical model. 6.4.1 Physical Modeling In General
Physical models are normally covering only fairly small areas as they are limited in size by the dimensions of the model facility, which is typically of the order of size: 20 - 40m times 30 - 60m and by the size of the wave-maker. Overcoming scaling effects is therefore typically the main concern when establishing a physical model as will be demonstrated latter. Here the scaling technique is introduced: The scale N of a model in relation to a parameter X is defined as the ratio of the parameter in the model to the value of the same parameter in prototype: Scale = NX = Xm/Xp = Value of X in model/Value of X in prototype ..................(6.1)
When talking about model scales in coastal engineering the reference parameter used is normally the length, L. For example, if a model is scaled so that 1m in the model corresponds to 30m in the prototype, the length scale, NL , will be: Length Scale = NL = 1/30 ............................................................................ (6.2)

Chapter 6 HYDRAULIC STUDY METHODOLOGY IN COASTAL ENGINEERING ___________________________________________________________________________________________
___________________________________________________________________________________________ March 2009 6-5
Increasing the scale means increasing the size of the model. As an example, a scale 1/20 is larger than scale 1/30. Considering a typical scale for 2D and 3D modeling (flume and basin modeling, respectively) of between 1:20 and 1:80, this gives the limitations for the area, which can be modeled as presented in Table 6.1.
Table 6.1 Typical Dimensions of Physical Models
Type of 2D/3D model Scale of model NL
Dimension of model flume/basin
in m
Prototype dimension of modeled area in m
Breakwater cross section 1:30 1 x 35 30 x 1050
Breakwater head 1:20 25 x 35 500 x 700
Small Port, Marina 1:40 25 x 35 1,000 x 1,400
Coastal structure 1:50 40 x 60 2,000 x 3,000
Major Port 1:80 40 x 60 3,200 x 4,800
It is seen that a typical physical model only covers areas of dimensions of one to five kilometers. This puts a natural limit to the use of physical models. For the same reason physical modeling is seldom used in connection with coastal management planning as such plans normally cover long stretches. Engineering design manuals and empirical formulas are available for a number of common coastal structures including certain types of breakwaters and groynes on open straight coastlines. The stability of these common structures can often be obtained without having to build a physical model. The configuration of the structure will however often deviate from the simple shapes provided in design manuals and assumptions in empirical formulas do not apply. This is often the case with complex ports and harbors or complex coastal protection works using streamlined structures. In this case physical modeling is required for verification of the structural design and test during construction phase. 6.4.2 Physical Model Benefits And Shortcomings
The main advantages of physical models are:
• The physical model incorporates all the governing processes without simplifying assumptions that have to be made for numerical models, i.e. physical models are useful if processes are so complicated that a numerical model cannot be developed, or rather has not yet been developed – or is computationally too heavy to use. This includes examples like stability of coastal structures, wave overtopping and impact/motions of complex vessels and structures and in complicated layout such as diffraction and refraction occurred in ports area.
• The small size of the model permits easier data collection than in the field. The conditions in the model can be controlled and simultaneous measurements can be achieved, which is not the case in the field.
• Physical contact with the water in the model remains the best guide for intuitive discovery and understanding. Watching a physical model in operation often gives the experimenter an immediate qualitative impression of the physical process and provides inspiration for arriving at the optimum solutions.
Chapter 6 HYDRAULIC STUDY METHODOLOGY IN COASTAL ENGINEERING ___________________________________________________________________________________________
___________________________________________________________________________________________ 6-6 March 2009
However, there are also disadvantages of physical models, notably:
• Scale effects occur in models as it may not always be possible to simulate all governing or relevant variables in correct relationship to one another.
• Laboratory effects, which are typically related to difficulty to create realistic boundary conditions, for example use of unidirectional model waves as approximation to directional waves that occur in nature etc.
• Lack of boundary condition in the model, for example lack of wind in the model.
• Physical models are normally more expensive to set up. However, once the physical model is established it will often be much faster and cheaper to do one extra test there than in a numerical model.
6.4.3 Physical vs Numerical Models
In physical models the observer can study how water and sand is moving around inside a confined physical environment. The fact that the observer is studying nature’s ways unfiltered often leads to a blind trust in the model. This is in direct contrast to numerical modeling, which raises skepticism among some people. However, advanced numerical modeling has many advantages compared to physical modeling, such as:
• Numerical modeling can cover large areas
• Numerical models are less expensive than physical models
• A numerical model produces a huge amount of information in each grid point in the model area, which makes it possible to analyze the various parameters over entire areas and to present the data in a very informative and illustrative way, for example in the form of 3-D plots and animations etc.
• A numerical model can be run for a large number of situations and results can be integrated easily
• A numerical model can be stored after use so that it can be revived if required
The application and characteristics of the different types of physical models are further described in the following sections. 6.5 FIXED AND MOVEABLE BED MODELS
A very important aspect of coastal studies is to understand, and to quantify sediment transport and coastal processes, including the responses in the coastal morphology to various interventions such as construction of ports and protective coastal structures etc. This raises the need for a modeling tool capable of reproducing sediment transport and morphological development etc. quantitatively. Such modeling tools already exist in the form of advanced numerical models. However, before these numerical models were developed to their present state of complexity, which has mainly taken place over the last two decades, these processes could only be studied in simple physical models with movable bed. This means that there is a long tradition for movable bed modeling.
There are in principal two key types of physical models used in coastal engineering studies:
• Fixed bed models, which have solid boundaries (the seabed) that cannot be modified by the hydrodynamic processes going on in the model.
• Movable bed models, which is a model that have a bed composed of material that can react to the applied hydrodynamic forces.

Chapter 6 HYDRAULIC STUDY METHODOLOGY IN COASTAL ENGINEERING ___________________________________________________________________________________________
___________________________________________________________________________________________ March 2009 6-7
A fixed bed model deals mainly with hydraulic design problems and studies of hydraulics processes, whereas the most important physical aspect in coastal and shoreline management, namely sediment transport and the associated coastal processes, cannot be studied quantitatively in fixed bed models. In general, problems suitable for physical model testing are the following:
Fixed bed models:
• Stability of structures • Wave conditions in a coastal area • Wave generated currents in a complicated coastal area of limited extent, for example in an
area behind a submerged reef etc. Movable bed models:
• Littoral transport • Scour conditions • Design optimisation of small beach compartment with relatively coarse bed material
Modeling of littoral transport (quantitatively) in a movable bed model is associated with great difficulty due to major scale effects. The best method for minimising such scale effects is to increase the scale. Models with vary large scales, such as scale 1/5, requires very large facilities. Few such facilities have been constructed in the form of large flumes, which e.g. are used for testing the stability of nourishment. 6.5.1 Fixed Bed Models The most important forces in fixed bed modeling of coastal engineering problems are inertia forces (~ ρL2V2) and gravitational forces (~ ρL3g). In that case the ratio of these two forces must be the same in the physical model as in prototype. This can be expressed as follows:
Inertia forces/gravity force = ρL2V2/ ρL3g = V2/gL ................................. (6.3)
The square root of this ratio is referred to as the Froude Number, ie:
F = V/(gL)½ ........................................................................................(6.4)
Consequently, the majority of physical models in coastal engineering are scaled according to the Froude model law, which expresses that the Froude Number in the prototype and in the model shall be identical:
NF = NV/(Ng NL)½ = 1........................................................................... (6.5)
Scales of other parameters than length can be derived from the length scale and from the model law as shown in the following examples:
Scale for area: NA = NL
2 .............................................................................. (6.6) Scale for volume: NVol = NL
3............................................................................. (6.7)
Gravity: Ng = 1 as the gravity is identical in prototype and model......... (6.8) Velocity: NV = (Ng NL)
½ = (1 NL)½ = NL
½ ............................................. (6.9) Time: NT = NL/ NV = NL/NL
½ = NL½ ................................................ (6.10)
Weight: NW = Nρ NVol = Nρ NL3 (Nρ scale for density) ........................ (6.11)
Chapter 6 HYDRAULIC STUDY METHODOLOGY IN COASTAL ENGINEERING ___________________________________________________________________________________________
___________________________________________________________________________________________ 6-8 March 2009
Fixed bed models are used to study the interaction of waves and currents under controlled circumstances as well as the interaction of hydrodynamic forces with solid bodies, such as armour elements on breakwaters etc. Scale effects associated with such models can normally be kept sufficiently small in which case such models will be very reliable. Fixed bed models can be divided into two-dimensional models (wave flume models) and three-dimensional models (wave basin models). Typical coastal engineering applications of fixed bed models are presented in Table 6.2. The above typical scales (determined by the size of the laboratory facilities) imply that everything measured in meters (including the waves and sediments) is downscaled by a factor of 20 to 100. If a wave is 1m in the field then the wave height in the laboratory is 1-5cm depending on the type of model. In cases where sediment is used, the downscaling may pose a significant problem as forces other then those used in the Froude model law comes into play - this is further discussed in the following sections. Pictures from fixed bed models are presented in Figure 6.1.
Table 6.2 Types of Fixed Bed Models and Classification by Purpose and Their Typical Application in Coastal Engineering
Type of model
Classification by purpose
Examples of subject to be studied Typical scale
Stability and wave overtopping properties of breakwater and revetment sections
Design model
Hydrodynamic forces on structure
Wave Flume tests Process model Run-up of waves on a dike
1:20 -1:50
Stability of breakwater head and trunk sections 1:20 -1:60 Design model
Wave pattern in semi protected coastal area, e.g. a port basin or a swimming lagoon Hydrodynamic loads on/and response of structures
1:30 - 1:100
Wave generated currents in a complicated coastal area, e.g. in an area behind a submerged reef etc.
Wave Basin tests
Process model Qualitative study of sediment transport pattern
(erosion/deposition areas) by tracers in a fixed bed model
1:30 -1:40

Chapter 6 HYDRAULIC STUDY METHODOLOGY IN COASTAL ENGINEERING ___________________________________________________________________________________________
___________________________________________________________________________________________ March 2009 6-9
Design model Process model Flume tests
Wave Basin tests
Figure 6.1 Typical Examples on Physical Model Application in Coastal Engineering
Fixed bed models are sometimes made as distorted models, which means that the vertical scale is different from (normally larger than) the horizontal scale, as this gives certain possibilities to utilise a model basin, which would otherwise be too small for the planned tests. Distorted models should normally be avoided for modeling of waves for which reason distorted wave modeling is not further discussed here. Scale effects in relation to correct reproduction of the following phenomena may occur if the scale for a fixed bed model is too small:
• Wave propagation: Wave refraction, diffraction and breaking are modeled correctly in undistorted models provided that the scale is not so small, that the surface tension becomes important.
• Wave generated currents: The radiation stress is the driving force for the wave generated current, which is balanced by the bottom shear stress. The wave boundary layer may be laminar in the model instead of turbulent as in the prototype if the scale is too small. This introduces a scale effect in the reproduction of the wave generated currents. Similarly, the correct reproduction of the circulation currents in the vertical plane depends on correct reproduction of the wave boundary layer at the bottom.
From the above it is evident that:
• It is possible to reproduce the wave pattern correctly in models without distortion, if the scale is "reasonable"
• A small modeling scale in an undistorted model introduces scale effects in the reproduction of wave generated currents due to laminar effects in the wave boundary layer
This leads to the conclusion, that the best method for minimising scale effects in fixed bed models is to apply the largest possible scale (and to avoid distorted models.)

Chapter 6 HYDRAULIC STUDY METHODOLOGY IN COASTAL ENGINEERING ___________________________________________________________________________________________
___________________________________________________________________________________________ 6-10 March 2009
6.5.2 Moveable Bed Models
A movable bed model is mainly used to study sediment processes, including studying cross shore stability of nourishment. However, scaling of the prototype sand grain according to the Froude model law introduces major scale problems. If, for example, prototype sand with d50,p = 0.2mm shall be scaled for use in a model with a scale of 1:40, this will result in model sediment with d50,m = 0.005mm. This is in the silt fraction. When the model sediment becomes so fine, it will behave completely differently from sand, as viscous forces and chemical inter-particle forces is introduced. This means that sand cannot be scaled correctly if sand material is used as model sediment. Lightweight model sediment can be applied to compensate for this, however this causes problems with liquefaction and distorted slopes, which means that this is also associated with major difficulties in the model performance and interpretation. It is time consuming and complicated to perform movable bed modeling. As an example, surveying of the bed changes requires emptying the model basin for water and a comprehensive surveying procedures etc. Performance of movable bed tests requires a well equipped laboratory, considerable understanding of scale effects and not least experience. J. William Kamphuis has characterised operation of movable bed models in the following way: "Owing to the variety and magnitude of scale effects, which can only be fully understood by an experimenter with experience, modeling coastal areas will continue to appear an art." Compared to fixed bed modeling there are further complications related with movable bed modeling, namely the requirement that the transport in all points of the model shall be scaled correctly in order to arrive at the correct erosion and deposition pattern. It is in principle impossible to fulfill this, as the transport processes are nonlinear. The main problem in relation to movable bed modeling is that the cross shore transport is a delicate balance between opposing processes. A reasonable scaling of the cross shore transport, as well as the longshore transport, can be obtained by securing that the following three criteria are fulfilled: 1. The wave boundary layer shall be turbulent, which means that the bed in the model will be
without ripples 2. The parameter: wT/H shall be the same in model and prototype (w = fall velocity, T = wave
period and H = wave height) 3. The dimensionless shear stress, Shields parameter θ, shall be identical in the model and in the
prototype: θ = τb/ρg(s-1)d (τb = bed shear stress, ρ = density of water and s = relative density of sediment)
It will normally not be possible to fulfill criteria 2 and 3 simultaneously if sand is used as sediment in the model, as fulfilling of these criteria requires the use of light weight model sediment. It can be concluded that it is normally not possible to simulate the correct quantitative sediment transport conditions in a model. The quantification of the sediment transport can be established by the use of a numerical sediment transport model based on the modeling results from the physical model. However, it will normally be possible to simulate morphological features reasonably well in the model provided that the model scale is so large that the wave boundary layer in the model is turbulent, which means that the bed will be without ripples or other coherent bed features. An example of a movable bed model, which was used to study the form of sand beach adjacent to a port expansion, is presented in Figure 6.2
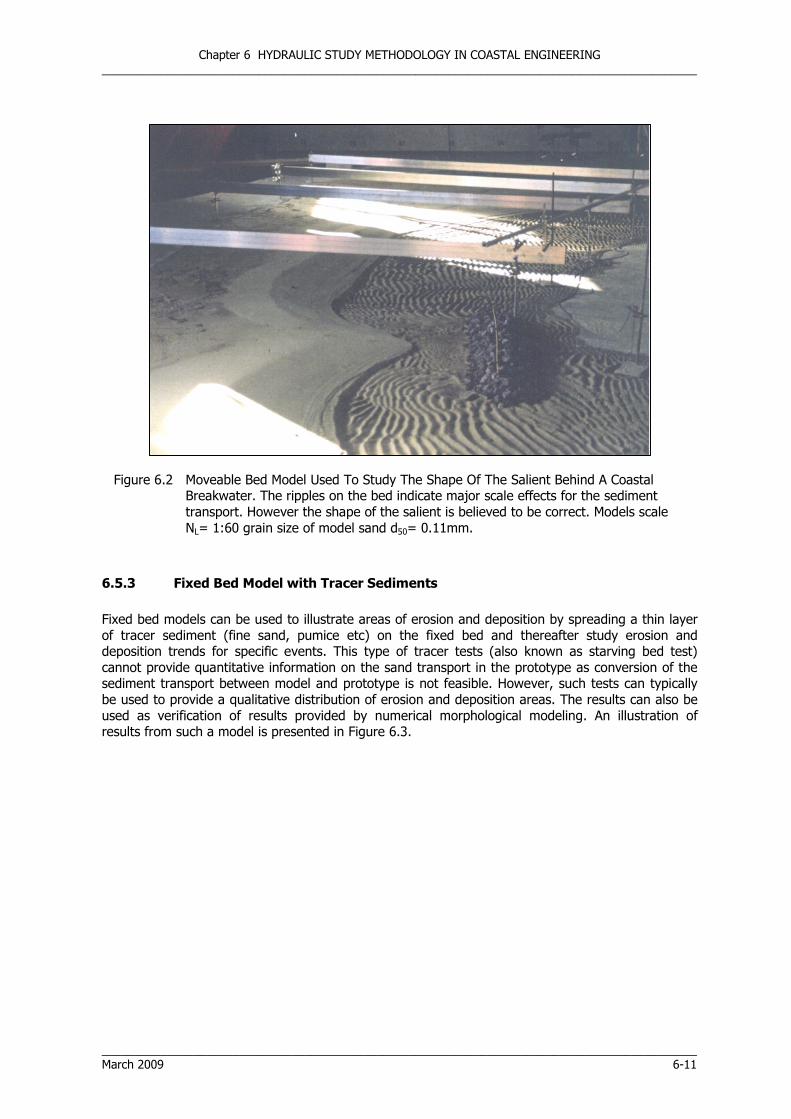
Chapter 6 HYDRAULIC STUDY METHODOLOGY IN COASTAL ENGINEERING ___________________________________________________________________________________________
___________________________________________________________________________________________ March 2009 6-11
Figure 6.2 Moveable Bed Model Used To Study The Shape Of The Salient Behind A Coastal Breakwater. The ripples on the bed indicate major scale effects for the sediment transport. However the shape of the salient is believed to be correct. Models scale NL= 1:60 grain size of model sand d50= 0.11mm.
6.5.3 Fixed Bed Model with Tracer Sediments
Fixed bed models can be used to illustrate areas of erosion and deposition by spreading a thin layer of tracer sediment (fine sand, pumice etc) on the fixed bed and thereafter study erosion and deposition trends for specific events. This type of tracer tests (also known as starving bed test) cannot provide quantitative information on the sand transport in the prototype as conversion of the sediment transport between model and prototype is not feasible. However, such tests can typically be used to provide a qualitative distribution of erosion and deposition areas. The results can also be used as verification of results provided by numerical morphological modeling. An illustration of results from such a model is presented in Figure 6.3.

Chapter 6 HYDRAULIC STUDY METHODOLOGY IN COASTAL ENGINEERING ___________________________________________________________________________________________
___________________________________________________________________________________________ 6-12 March 2009
Figure 6.3 Fixed Bed Model With Fine Sand Used to Illustrate Areas of Erosion and Deposition. The picture shows that sand has been moved offshore around the head of a coastal breakwater. Model scale NL= 1:43, grain size of model sand d50= 0.12mm.
6.6 EXAMPLE OF 2D AND 3D BREAKWATER STABILITY TEST
– Sg Terengganu, Malaysia
Comprehensive physical model tests have been done in connection with the design of the breakwaters for Sg Terengganu River Mouth Improvement Project, Malaysia. The overall objective of the investigations was to study and optimise the breakwater design.
Figure 6.4 Sg Terengganu River Improvement Project. The location of Terengganu (left panel) and optimized breakwater layout (right panel)

Chapter 6 HYDRAULIC STUDY METHODOLOGY IN COASTAL ENGINEERING ___________________________________________________________________________________________
___________________________________________________________________________________________ March 2009 6-13
6.6.1 2D Model Tests
The stability tests were conducted at a linear scale of 1:46.65 (undistorted model). Gravity and inertia forces are the essential forces acting in a model as the present. Therefore, the Froude scaling law was applied for conversion between model and full size values. The model bathymetry is shown in Figure 6.5.
Figure 6.5 Bathymetry (Prototype values). Note that the scale in the figure is distorted
In order to obtain sufficient depth for the wave generation and to allow for the wave generation and transformation (shoaling and wave breaking), steeper slopes (1:170 and 1:70) were introduced away from the breakwater test section from –8.5m to –16m in front of the wavemaker.
The damage to the following structural elements was observed in the model, see Figure 6.6:
• Scour protection
• Front toe
• Front slope (Tetrapod armour) • Concrete superstructure
• Upper rear side armour/corner (above SWL)
Figure 6.6 Definitions Of Breakwater Elements (Profile Used As Example)
For selected test scenarios, overtopping was measured. For the overtopping tests, the overtopping was measured as the water passing the seawall, see Figure 6.7.

Chapter 6 HYDRAULIC STUDY METHODOLOGY IN COASTAL ENGINEERING ___________________________________________________________________________________________
___________________________________________________________________________________________ 6-14 March 2009
Figure 6.7 Sketch Of Overtopping Measurements
Photos of the seaward and leeward side of the model breakwater before testing are shown in Figure 6.8.
Figure 6.8 Model Breakwater. Before Testing.
6.6.2 3D Model Tests
The objective of the 3D physical model tests was to verify the stability of the breakwater head and the adjacent trunk sections. Tests were made for armour of Tetrapods and Accropodes, respectively.
Model of the bathymetry and armoured breakwater was constructed to a length scale of 1:46. Figure 6.9 shows the entire model area and the wave gauge positions. The wave measurements were made by means of resistance type wave gauges. For both wave directions, the positions of wave gauges 1 and 2 were in front of the wave generators and wave gauges 3 to 7 at a water depth corresponding to approximately –10mCD. Wave gauges 3 to 7 were positioned at mutual distances, which allowed for calculating the direct incident and the reflected wave conditions. Wave gauges 8, 9 and 10 were positioned close to the breakwater.
A photo of the breakwater model (Tetrapods) is shown Figure 6.10.

Chapter 6 HYDRAULIC STUDY METHODOLOGY IN COASTAL ENGINEERING ___________________________________________________________________________________________
___________________________________________________________________________________________ March 2009 6-15
Figure 6.9 Model Bathymetry, Wave Gauge And Wave Generator Positions
Figure 6.10 Breakwater Test Section, Tetrapods as Armour

Chapter 6 HYDRAULIC STUDY METHODOLOGY IN COASTAL ENGINEERING ___________________________________________________________________________________________
___________________________________________________________________________________________ 6-16 March 2009
6.7 SELECTION OF WAVE CHARACTERISTICS FOR PHYSICAL MODEL TESTS
Wave modeling and the reproduction of waves in the laboratory can involve waves of various complexities; including the following:
• Regular waves (mono-chromatic waves, sinusoidal waves) • Irregular waves (random waves, natural sea waves) • Multi-directional waves • Others (transient waves, bi-chromatic waves, etc)
The selection of appropriate wave conditions in a physical model experiment must be carefully considered in relation to the actual problem that needs a solution. In the following sections, the important considerations for selection of relevant waves will be described
• Representative wave time series • Uni-directional or multi-directional waves • Importance of long waves
6.7.1 Model Scale Ratios Generally, the largest possible scale is selected for the available test facility. Thus, the size of the laboratory basin or flume is a primary parameter. There are many reasons for this such as:
• Consideration of other model laws (Reynolds, Weber) • Measuring accuracy • Scale selection related to problem under study
Other limitations besides physical dimensions may play an important role in scale ratio selection, e.g. wavemaker capacity, towing speed, etc.
Although this suggests that there is a wide range of possibilities when modeling according to Froude scaling, one has to accept that the scale selection should assure that the dominant forces are well represented. For wave reproduction, this means that capillary forces should play an insignificant role. Consequently, the wave lengths must not be too short. A practical lower limit is 0.3m corresponding to a wave period of 0.4s. No essential part of the wave spectrum should be below this value. Very small scales also affect the repeatability by which the small-scale waves can be reproduced in the laboratory. Standard wave gauges for wave and surface elevation measurements (eg. based on the principle of measuring the conductivity between two parallel electrodes partly immersed in water) has accuracy better than 1 mm (i.e. 10 cm prototype for a 1:100 scale model and 3 cm for a 1:30 scale model). In tests where viscous forces are important, due attention has to be paid to the Reynolds number. This is primarily related to the structure being tested rather than to the ability to reproduce the waves.
6.7.2 Selection of Representative Sea States
Wave characteristics from the actual project location shall be the basis for selection of representative sea states for a model test programme. Often, e.g. in offshore engineering, the specification is determined by the project owner based on statistical analysis of metocean conditions at the site. But the experience and traditions of the actual laboratory must be considered for selecting the realistic laboratory wave conditions.

Chapter 6 HYDRAULIC STUDY METHODOLOGY IN COASTAL ENGINEERING ___________________________________________________________________________________________
___________________________________________________________________________________________ March 2009 6-17
There are a number of problems related to the selection in practice:
• Wave recordings, if available, have often been made over relatively short time span. Thus, they may not be sufficient to establish credible statistics
• Field wave recording is often not directional, which means that directions at best must be determined based on meteorological conditions
• The individual time series are short, which is a problem particularly to determine the possible long wave parts of the spectrum
• Some wave recorders cannot describe long waves due to systematic electronic filtering (accelerometer buoys) or they are unable to describe the high frequency part of the spectrum (pressure sensors in deep water)
• Wave recordings with double peaked spectra – often with different directions – are by some analysis procedures described simplistically by mean characteristics
• Direction spread calculations often poor as only three signals are used in computation
• The spectral shape of sea states is variable and often not documented for extreme sea states
Some of these problems must be handled by use of numerical wave models. It is now possible to obtain long series of wave data (typically 15-20 years) – at least for deep water locations – generated on basis of historical meteorological data. This information can then be transferred to nearshore locations by numerical models and compared with measured data for shorter time span. By this method, it may be possible to derive parametric expressions for extreme wave conditions. It is important, however, to use estimated extreme waves with great care. It is thus advisable to use sensitivity tests with variations of spectral parameters. The final selection of representative wave conditions should be made with due consideration of the test objective. The selection depends on the application (e.g. wave impact on caisson structures versus rubble mound breakwaters). Experience and skills of the study team are important factors when classifying the problems. If time and budgets are available, it is recommended to do sensitivity tests.
6.7.3 Duration of Time Series Many projects – especially those involving dynamic structures – require very long testing time to obtain enough information to derive design values, i.e. values with a well-defined probability. Examples of such projects are:
• Motions of moored ships and platforms due to long natural oscillation periods • Stability of rubble mound structures • Wave forces on elevated decks
The expected value of the maximum wave height in a wave time series is a function of duration which conditions the length of the synthetically generated time series, since the expected value of the maximum must be generated by the paddle. Traditionally, 1-3-hour sea states (with the design (Hs, Tp) values) have been reproduced and either the maximum value or a value from a statistical analysis of all extremes has been used as the design load/response. The shorter durations may be acceptable when the tidal exposure is short. However, it has often been realised that either a much longer simulation (6 hours, 12 hours etc.) or repeated simulations with different wave time series (but identical (Hs, Tp) values) may be required to provide reliable estimates of the load/response. This is both time consuming and expensive.

Chapter 6 HYDRAULIC STUDY METHODOLOGY IN COASTAL ENGINEERING ___________________________________________________________________________________________
___________________________________________________________________________________________ 6-18 March 2009
Figure 6.11 Physical Modeling Of Wave Impact Forces And Run-Up On A Monopile Widely Used In Offshore Wind Farms
In relation to duration of tests series, it is important also to consider the actual variation of sea states during a storm which may influence the response of a beach or a breakwater section. The possible appearance of exceptional waves may also be of potential interest for testing particularly sensitive structures. Such waves may require artificial stimulation. It is emphasized that the topic of exceptional waves is still in a research stage, particularly in shallow water. As an example, the duration of 2D/3D physical model stability tests (design conditions) is often around 3-5 hours (nature time) and 1 hour (nature time) for overtopping tests.
6.7.4 “Free” and “Bound” Long Waves
Any structure or coastline is highly reflective when exposed to long waves. While long waves can often escape to deep water under natural conditions, they are inevitably entrapped in traditional laboratory experiments. Active absorption systems (absorbing wavemakers) can help offshore boundaries to be much more transparent to long waves. Although much of the long-wave activity is typically generated locally, some conditions call for a non-linear wave-generation procedure at the incident-wave boundary. Even with a view to second-order wave generation and active absorption for multi-directional waves, the limited knowledge on long waves will still limit our ability to faithfully reproduce natural long-wave conditions in the laboratory. Long waves in nature (periods of the order 0.5-5 minutes) result from several generating mechanisms including second-order interactions between primary waves and low-frequency breakpoint oscillations. Although the consequence of these generating mechanisms may nowadays be quantified when focusing on small coastal regions, there is no way to assess the presence of long waves generated at neighbouring or remote stretches of coastline. Numerical models cannot cover sufficiently large areas to answer this fundamental uncertainty. The long-period waves are particularly important for study of the behaviour of floating structures in shallow water such as moored large tankers and container vessels. These moored systems have natural frequencies in the same range as the long waves and are therefore susceptible to resonant motions with potential overload of mooring lines and/or impact on cargo transfer. Long waves are

Chapter 6 HYDRAULIC STUDY METHODOLOGY IN COASTAL ENGINEERING ___________________________________________________________________________________________
___________________________________________________________________________________________ March 2009 6-19
less prominent in deeper water because the bound long waves there are smaller relative to the height of the storm waves and swell. Long wave problems are appreciated by laboratories working with shallow water hydraulics as important and there is generally a desire to take long wave problems into account in model test planning, design and execution. Several laboratories have developed wave generator control and active absorption by which they are able to take these effects into account (to a certain degree). Several research papers on the subject have been published over the last 25 years (See References quoted). Although solved in principle, there are serious practical problems in handling of long waves by the wave generator. In shallow water, the wave generator requires a very large stroke, may therefore restrict reproduction of extreme sea states at a satisfactory model scale. Numerical models can be used to analyse trapping and possible undesirable trapping of long wave energy in scale models.
6.7.5 2D/3D Waves
Multi-directional wave testing facilities have been available for several years now and experience has been gained on the benefits resulting from these more natural waves relative to traditional long-crested waves. Whereas the benefits of using irregular waves instead of regular waves were quickly accepted by the laboratories and users, a similar acceptance is still lacking for 3D waves. This is most likely due to a general experience that 2D testing is sufficient (or gives a conservative solution) for a long range of problems. The research in wave basins may be classified into the three main research fields – coastal engineering, offshore engineering and naval architecture. In the field of coastal engineering, physical modeling in wave basins is used to account for the problem of wave disturbances in harbours, scour protection, wave transmission over submerged breakwaters, wave load on and diffraction behind breakwaters, overtopping at vertical and sloped structures as well as wave run-up at dikes. The effect of 3D waves compared to 2D waves was so far analysed in depth for the process of oblique wave run-up and wave overtopping at sea dikes (Oumeraci et al, 2001) in the wave basins of Franzius-Institute, Germany, and NRC, Canada, revealing no significant influence of multi-directionality (Möller et al, 2001, Ohle et al, 2002, Ohle et al, 2003). However, large effects of 3D waves are to be expected when analysing problems of diffraction (Daemrich, 1996) and combined diffraction and transmission (Eggert et al, 1982) as well as wave loads on structures (Hiraishi, 1997, Franco et al, 1996). In the field of offshore engineering, investigations in physical modeling in wave basins are related to questions on wave load. Comparative studies with 2D and 3D waves were e.g. carried out for moored semi-submersibles in a wave basin, (Stansberg, 1997, 1999). These tests revealed that while linear in-line wave forces on semi-submersibles are reduced only by approximately 10-15% in multi-directional waves, the corresponding in-line slow-drift forces are overestimated up to 40% when using unidirectional waves instead of multi-directional waves. This stresses the need for further investigations to avoid too conservative design of offshore structures. Transversal loads are, as expected, clearly increased in multi-directional waves. In the field of naval architecture, physical wave modeling focuses on ship stability and seakeeping. Both 2D and 3D waves are used within the standard “ship design by analysis” (Hirayama, 1997).

Chapter 6 HYDRAULIC STUDY METHODOLOGY IN COASTAL ENGINEERING ___________________________________________________________________________________________
___________________________________________________________________________________________ 6-20 March 2009
6.7.6 Problems in 3D Wave Modeling
The dominance of 2D wave modeling results from several complications and unsolved problems of 3D wave modeling summarised in the following: Description of representative sea state at model boundaries In 3D modeling, there is a need for more accurate sets of boundary conditions in order to bring out the advantages compared to 2D models. Absorption control of reflected waves In 3D wave basins, the treatment of boundary effects, e.g. wave reflection or damping at the boundaries of the wave basin, requires larger efforts than in 2D modeling. Although a lot of research has been carried out on this subject (e.g. Schäffer et al, 2000), more research is needed in order to get better ratios of utilisable area of the basin and total surface area of the basin. Monitoring of 3D wave field within the basin In 3D basins, wave conditions are more inhomogeneous in space than in 2D basins. Therefore, wave conditions in the 3D basins require higher resolution monitoring of wave parameters. Standard techniques, e.g. resistance wave gauge, cannot provide an overall view of the wave field. Improved measuring techniques are therefore needed for use in physical wave modeling.
6.7.7 Wave Generators and Wave Generation Since the start of wave modeling, many different wave generator systems have been developed. In 1951, Biésel and Suquet published their fundamental report on analytical solutions to wave generation principles, for a number of different wavemaker types. The paper presented the transfer functions for the wavemaker paddle displacements to wave amplitude. The Biésel transfer functions are fundamental for wave generation. Wave Generator Types
Today the most common wave generator types are:
• Piston (vertical paddle covering the full water depth or elevated above the bottom) • Flap (hinged at or above bottom of tank) • Wedge type (vertical paddle moving up and down a slope and suited for deep, intermediate
and shallow water waves) • Double-articulated, hinged • Snake type (2D/3D wavemaker), which may consist of one of the above types of wavemakers
placed side by side.
Both piston and hinged types are used for unidirectional and multi-directional wave generators. Actuators
No matter which type of paddle is used, it is driven by one or more actuators. Hydraulic rams with a servo valve were the most commonly used before the 90es. Due to their excellent performance, they remain in use in a large number of laboratories. Recently, however, linear electric drives have been adopted in most new wave generators. Control Signals
The actuators work according to a control time series from a signal generator. The principles used in signal generators depend on the type of wave to be generated as listed below:
• Regular waves by sine generator • Synthesis based on specified standard or custom spectrum • Direct reproduction of measured wave time series • Directional distribution functions • First-order, second-order, cnoidal, solitary

Chapter 6 HYDRAULIC STUDY METHODOLOGY IN COASTAL ENGINEERING ___________________________________________________________________________________________
___________________________________________________________________________________________ March 2009 6-21
• Active control of wave groups • Active control of low frequency input
The duration of signals was earlier dependent on the capacity of the control computers, but with present days PC’s there are no practical limitations of the duration. The probable maximum wave height increases with duration for a given mean energy of the wave signal. This shall be considered carefully when selecting test duration for structures sensitive to high individual waves. The wavemaker requires a gradual increase and decrease of the control signal before and after the test. The ramping up and down period depends on the laboratory size and is typically in the order of five seconds (for a 80m long basin, 20s is adequate). When using active wave absorption control, the wave signal generator can be a separate computer-controlled system or it can be linked to the data acquisition system which is very convenient for subsequent analysis of test results. A system with active absorption control needs very high speed of communication to perform an efficient and accurate compensation of the incoming wave series.
6.8 PLANNING AND EXECUTION OF TESTS
6.8.1 Bathymetric Model Construction
The main issues relating to construction of wave models are: • Reproduction of the bathymetry • Permeability and porosity of structures (refer to breakwater testing) Correct reproduction of waves in a model is governed by the wave generator and by the bathymetry in the model. The most important issue is that the waves generated by the wavemaker and the water depth in front of the wavemaker are compatible. Large waves generated in too shallow water will break on the paddle and will not create realistic model waves. In many cases, the horizontal dimensions of the wave basin or flume are such that waves cannot be generated in the correct water depth if the entire model is constructed to scale. The model therefore has to be ‘truncated’ and a steeper artificial slope must be constructed down to the basin floor. In such case, there is a risk that waves are forced to break on the slope which may not be in agreement with the natural conditions. To avoid this, the modeller must use a combination of experience and analytical tools to find the optimal compromise between the model scale and the basin/flume dimensions. The permeability and reflection characteristics of the model (typically for harbour and coastal models) must be reproduced in order to obtain realistic transmission of waves into the model. This aspect is treated in the HYDRALAB guidelines for physical testing of breakwaters (HYDRALAB 2007). 6.8.2 Wave Reflection in Laboratory Wave basin and flumes are confined water bodies and as such, there is a risk that the wave energy introduced through the wave generators is trapped and amplified in an unrealistic manner. The modeller thus needs to consider carefully how to measure and analyse the reflection and how to avoid unrealistic effects. The calculated reflection coefficients are sensitive to the technique used and to the available time series recorded. In effect, depending on the number and type of series recorded and the technique used to split incident and reflected waves, this coefficient may show variations of a factor 10. Like in nature, waves are reflected from coastlines and structures. Ideally, a model area should be controlled actively on all boundaries. However, this is unrealistic for a number of reasons but
Chapter 6 HYDRAULIC STUDY METHODOLOGY IN COASTAL ENGINEERING ___________________________________________________________________________________________
___________________________________________________________________________________________ 6-22 March 2009
primarily due to the complexity and costs. The practice is instead to absorb the energy that reaches the basin boundaries by passive absorbers and to minimise the wave energy displaced outside the area of interest. The total basin area is also an important factor: The larger the area the lower the reflection problem. The minimisation of wave reflection is done by careful design of guide walls and passive absorbers: • Guide walls must be placed in such a way that a minimal amount of energy is diffracted
outside the area of interest, but without impacting on the wave field in the area of interest, e.g. a port entrance
• Passive absorbers should be designed to effectively reduce the wave energy. Gentle crushed stone absorbers or parabolic shaped ‘beaches’ are usual passive absorbers in the laboratory. Mesh baskets, multi-screen arrays & expanded foam are also used.
Some wave energy is reflected back – directly or indirectly from guide walls – towards the wave generator paddle. Absorption on the wave paddle is now in regular use in wave flumes. The advantage here is that the wave direction is well defined – opposite the original wave. In wave basins, it is much more complex to absorb the reflected wave on the wave board. With a unidirectional wavemaker, the absorption can only relate to an average compensation along the wave board, but the reflected wave reaching the wave generator will often not be constant (in phase and amplitude) along the wave generator. It requires a multi-directional wave generator to cope with this problem. In the absence of active absorption by the wave generator, the modeller has to compensate the specified control signal for the re-reflected wave energy so that the total wave energy generated and reflected by the paddle is in accordance with the required wave field. This may only be possible to a limited extent. The principles described above relate to both short waves (sea and swell) and long waves. Long waves, which typically in models have a period of ten times the wind waves, are much more difficult to absorb. They require very wide – and in most cases unrealistic wide absorbers – and the active absorption can only be accomplished with large stroke wave generators. In many cases, the only realistic option to minimise the unrealistic effect of long waves is to place the wave generator such that long wave energy is not trapped between the wave generator and the model. In some cases, it is practical to use a numerical model to determine the optimal wave generator position for the long wave frequencies found in the selected wave series. 6.8.3 Test Programme
Proper planning of the test programme is of paramount importance. The involvement of the user of the results is important, but the experience of the laboratory is essential to render credibility to the test results. It can be demonstrated that inadequate planning of a model study can result in systematic errors whereby essential questions are not answered. This will be the case no matter how much attention has been spent on selecting the optimal scale ratios. Such errors will be beyond scale and laboratory effects and may have equally important consequences. In order to create an effective test programme it is recommended to:
• Include verification tests comparing wave input for conditions identical to the natural conditions
• Include sensitivity tests, e.g. related to direction • Include a simple check on “trivial” effects, e.g. heave transfer functions vs. theory (quality
control)

Chapter 6 HYDRAULIC STUDY METHODOLOGY IN COASTAL ENGINEERING ___________________________________________________________________________________________
___________________________________________________________________________________________ March 2009 6-23
• Use 3D waves if the results are very dependent on direction (approach channels to harbours, offshore moorings)
• For strongly non-linear phenomena such as green water and negative air-gap, a large number of sample spectrum realisations may be required to reveal a robust information on extreme statistics
• Use hybrid modeling to expand the results of experiments Often, this may be regarded as an unnecessary expense; however, questions about the validity of the results will often be asked at a later stage – typically after the model does not exist anymore. 6.9 MEASUREMENT AND ANALYSIS OF LABORATORY WAVES
6.9.1 Measurement
Waves in the laboratory must be documented in order to verify their agreement with sea states specified for the tests. The documentation comprises:
• wave conditions in front of wave generator • wave conditions at reference points for verification and impact analysis
The set-up of wave gauges shall be planned such that false information, e.g. from reflections and trapped energy, may be identified. The information required in its simplest form is the variation of water elevations at the point(s) of interest. Direction measurements (multi-directional waves or reflected waves) require either an array of position gauges or measurements of orbital velocity measurements in the water column. For analysis and interpretation of test results, it is often required to separate the measurements in short and long waves. This is particularly important when wave agitation of floating bodies are under study, as these systems often have a range of different eigen-frequencies. The separation can be either related to a fixed frequency or by detailed analysis of the wave spectrum. For practical reasons, it may be considered to separate at about 20sec wave period; however, in some cases other values may be more relevant. This will depend on the field location and on the actual type of marine structure. Reflected waves are unavoidable in wave models. The preferred strategy is to plan the model with a minimum of harmful reflection, but in any case it is necessary to document them. This may be done by an array of wave gauges, e.g. consisting of five gauges (linear for 2D or quasi 3D only). The most common methods for resolving 2D spectra into incident and reflected components include the two probe, one phase angle method of Goda and Suzuki (1976) the three probe, two phase angle method of Mansard and Funke (1980), the three probe method of Isaacson (1991), the vertical array of probe plus velocity method of Guza et al (1984) or Hughes (1993a), the co-located velocities method of Hughes (1993b), and Zelt and Skjelbreia’s (1992) extension of the 3-probe method to an arbitrary number of wave gauges, which introduced weighting functions to try to minimise the effect of having probe spacings close to a multiple of half a wavelength. All the methods rely on the linear superposition of many wave components; no non-linear interactions are represented. Frigaard and Brorsen (1995) introduced a method to separate incident and reflected wave fields in real time using theoretical phase shifts and digital filtering – see also Baldock and Simmonds (1999). Mansard, Sand and Funke (1985) use a least-squares fit of sine-waves to estimate reflection coefficients of first and second order components of regular waves. Maoxiang and Zhenquan (1988) extended Goda and Suzuki's method to three gauges to get set-down and long waves using low-pass filtering. The classic paper on bi-spectra is that of Hasselmann et al (1963) and on tri-spectra that of Elgar and Chandran (1993): For an overview see Elgar et al (1995). However, only the use of filters to examine low frequency, long waves has become established in the analysis of laboratory experiments.

Chapter 6 HYDRAULIC STUDY METHODOLOGY IN COASTAL ENGINEERING ___________________________________________________________________________________________
___________________________________________________________________________________________ 6-24 March 2009
In wave flumes, it is preferred to suppress the impact of reflecting waves on the specified wave time series by active absorption. This requires wave measurements either very near to the wavemaker or wave gauges built into the wave paddle. Wave measurements in basins and flumes are made to obtain information about the position of the fluid boundary and the particle velocity inside the fluid domain. The part of the fluid boundary relevant for wave measurements is the free surface elevation. Wave measurements may be categorised in various ways. The present approach is to look at the physical quantity and the dimensions in which it is measured. As all measurement techniques can now provide results in discrete or continuous time, the categorisation does not consider the temporal variation. Nevertheless, possible sampling rates are of interest. The surface elevation is generally a 2D surface that may usually be described as a function of horizontal space and time, ( , , )x y tη . The simple point measurement of surface elevation (0D) thus
provides 0 0
( , , )x y tη . Here, 0 0
( , )x y is typically a fixed point, but it could also be moving e.g. with a
towing carriage. Profile measurements (1D) provide e.g.0
( , , )x y tη for some interval of x, while full
surface measurements (2D) provide ( , , )x y tη over an area.
The velocity is generally a 3D vector function, where each of the three components varies in 3D space, ( , , , ) ( ( , , , ), ( , , , ), ( , , , ))x y z t u x y z t v x y z t w x y z t=u . Measurements may be uni-axial, bi-axial or
tri-axial to provide one, two or three of the vector components. Furthermore, they may be point measurements (0D), profile measurements (1D), plane measurements (2D) or in principle also measurements over 3D space. The most basic velocity measurement is a uni-axial single point 1. 6.9.2 Measurements of Multi-Directional Waves
Along with the growing use of multi-directional waves (3D waves) in physical model tests, the requirement for measurements and analysis procedures increases. A well-established measure of 3D waves is their directional spectrum. However, most techniques for directional spectral analysis suffer from limited resolution. As an example, it is probable that incident bi-modal wave conditions (two primary wave directions in the same frequency range) as generated by a 3D wavemaker may in reality be closer to the target than estimated by the 3D spectral analysis. Increased resolution of the 3D spectral estimate can be obtained by measuring wave data within a larger area. This, however, has the disadvantage that the result represents average conditions over the footprint of the measurements. This is a problem for wave conditions with a large spatial change as would often be found in areas with significant refraction, diffraction and reflection as typical for coastal problems. The problem of estimating directional wave spectra is usually simplified by the assumption that the 3D sea state may be represented by a 2D energy spectrum multiplied by a spreading function. The papers by Benoit (1993), Benoit and Teisson (1995) and Benoit, Frigaard and Schaffer (1997) review the main methods for estimating directional spectra. Teisson and Benoit (1994) compare the performance of many of these methods in dealing with an extensive set of experiments on the reflection of irregular oblique waves off a rubble mound breakwater (with similar tests being used for rubble mound breakwater stability; Galland 1994). The methods include:
• Direct Fourier Transforms, where the cross-spectra from two or more pairs of gauges are used. This method is reviewed by Goda (1985) and includes truncated and weighted Fourier decomposition as in Borgman (1969). A limited number of components can be resolved so directional spreading can only be crudely determined
• Parametric models, which assume a specific formula for the directional spreading (e.g.cos2θ) which may be more useful in the lab where there is more control over the input spectrum than in the real sea
• Variational Inverse Techniques, Long and Hasselmann (1979)

Chapter 6 HYDRAULIC STUDY METHODOLOGY IN COASTAL ENGINEERING ___________________________________________________________________________________________
___________________________________________________________________________________________ March 2009 6-25
• Eigenvector Method, Marsden and Juszko, BA (1987)
• Fourier Vector Method, which computes amplitudes, phases and directions from measurements of sea surface elevations and waves orbital velocities (Sand, 1979, and Sand and Lundgren, 1979)
• Maximum Likelihood Method (MLM) which seeks to minimise the variance of the difference between the estimated and true spectra (Lundgren and Klinting (1987), Krogstad, (1988), Isobe et al (1984), and Isobe (1990)), gives better directional resolution than methods 1 and 2 listed above. Yokoki et al (1994) use it with a reflected wave component in a similar way to Hughes (1994). A known angular spreading function is used but this should not be a problem in the laboratory where the spreading function may be chosen. Isobe and Kondoh (1984) developed the Modified Maximum Likelihood Method (MMLM), which was the first method to evaluate the directional wave spectrum accurately in the presence of reflections, although this requires reflection line to be input. Davidson et al (1998) developed an extension to the MMLM that calculated the position of the reflection line using a process of iteration. Both these methods break down and start to produce spurious peaks in the spectra when the measurement array is further away from the reflecting structure. The spurious peaks are caused by uncorrelated noise at frequency / direction pairs that have partial nodes at the location of the measurement gauges.
• Maximum Entropy Method (MEM), which is an iterative method that maximises the entropy at each frequency. It is reviewed by Nwogu et al (1987) and is supposed to give even better directional resolution than the MLM. Derived by Hashimoto and Kobune (1986) and Lygre and Krogstad (1986) using different definitions of entropy. Hashimoto et al (1994) extended the MEM so that it can be used with arbitrary arrays of measuring instruments. It gives the same result as the MEM for 3-quantity measurements and similar results to the Bayesian method when used with more than three quantities and is a robust method as it allows for errors in the cross-power spectra
• Bayesian Directional Method, as derived by Hashimoto and Kobune (1988). This takes into consideration errors in the cross-spectra and is computationally expensive, but is capable of evaluating the directional spectra of waves close to reflective structures by optimising a hyperparameter
Benoit et al (1997) concluded that the stochastic methods such as the MEM, MLM and BDM (and their variations) offer superior resolving power to the other methods. Ilic et al (2001) and Chadwick et al (2001) evaluated the MLM and BDM against numerical and field data including partial reflections and concluded that both methods could be used to determine incident and reflected wave fields when L/S > 0.5, where L = the time for the wave to travel to the reflector and back and S = length of time series used. Overall, the BDM was considered to be the more accurate method. Use of stochastic methods such as the MEM, MLM and (particularly) the BDM is recommended for the analysis of directional waves in a physical model, in situations that are more complicated than quasi-2D.
6.9.3 Data Management
The current data management practice at the different laboratories depends on the actual control and data acquisition systems, which are mostly locally developed and thus not easily transferable from one lab to the other. It is beyond the scope of the present guideline to develop a common practice.

Chapter 6 HYDRAULIC STUDY METHODOLOGY IN COASTAL ENGINEERING ___________________________________________________________________________________________
___________________________________________________________________________________________ 6-26 March 2009
REFERENCES
General on Laboratory Modeling
[1] Kamphuis, J. W., 1991. Physical Modeling, in "Handbook of Coastal and Ocean Engineering", J. B. Herbich, Ed., Vol 2, Gulf Publishing Company, Houston , Texas
[2] Martins, Rui, 1998. Recent Advances in Hydraulic Physical Modeling, NATO ASI Series, Serie E: Applied Sciences - Volume165
[3] Biésel F (1951): ‘Les appareils générateurs de houle en laboratoire’, La Houille Blanche, Vol 6, Nos 2, 4 et 5
[4] British Standards Institution (1991): BS 6349 part 7: Maritime structures – Guide to the design and construction of breakwaters
[5] DNV Recommended Procedure, DNV-RP-C205, Environmental Conditons and Environmental Loads, Ch. 10 Hydrodynamic Model Testing, Draft 19 February 2007
[6] Hughes, Steven A. (1993): Physical Models and Laboratory Techniques in Coastal Engineering, World Scientific Publishing, Singapore – ISBN 981-02-1540-1
[7] HYDRALAB (2004): Standardisation and Good Laboratory Practice, Status Report
[8] HYDRALAB (2007): Guideline document, Rubble mound breakwaters, Task group NA 3.1, Ed. G Wolters, EC Contract No 022441 (RII3)
[9] IAHR (1987): List of Sea State Parameters. IAHR Seminar on wave generation and analysis in basins, Lausanne 1987 / Supplement to PIANC Bulletin No 52, 1986
[10] IAHR (1987): IAHR Seminar: Wave Analysis and Generation in Laboratory Basins. 22nd IAHR Congress, Lausanne, 1-4 September 1987, The National Research Council of Canada, 1987. - ISBN: 0-660-53811-3
[11] IAHR (1997): IAHR Seminar: Multi-directional Waves and their Interaction with Structures: 27th IAHR Congress, San Francisco, 10-15 August 1997 Mansard, Etienne (ed). – Ottawa: The National Research Council of Canada, 1997. - ISBN: 0660170930
[12] ITTC – Recommended Procedures and Guidelines :
[13] Procedure 7.5-02-07-01.1, Laboratory Modeling of Multidirectional Irregular Wave Spectra, Rev. 00, 2005
[14] Procedure 7.5-02-07-03.1, Floating Offshore Platform Experiments, Rev.01, 2005
[15] ITTC – The Ocean Engineering Committee, Final Recommendations to the 24th ITTC, 2005
[16] Mangor, Karsten (2004): Shoreline Management Guidelines, Published by DHI.
[17] DHI, Sg Terengganu River Improvement Project - 2D and 3D hydraulic model tests for the design of a river mouth protecting breakwaters, Malaysia, 2002-03.
Scale Effects
[1] Aage, Christian (1999): “Model Testing – Bringing the Ocean into the Laboratory”, Proceedings of the 2nd HYDRALAB Workshop, Rungsted Kyst, Denmark.
[2] Moxnes, S & Larsen, K (1998): "Ultra Small Scale Model Testing of a FPSO Ship", Proceedings of the 17th Int. Offshore Mechanics and Arctic Engineering Conference, OMAE'98, Lisbon, OMAE 98-0381, 12 pp. (Describes a series of comparative model tests on an FPSO in model scales 1:55 and 1:170).
[3] Stansberg, CT, Øritsland, O & Kleiven, G (2000): "VERIDEEP: Reliable Methods for Laboratory Verification of Mooring and Stationkeeping in Deep Water", Proceedings of the 2000 Offshore Technology Conference, Houston, Texas, OTC 12087, 11 pp. (Describes a series of comparative model tests on a semisubmersible in model scales 1:55, 1:100 and 1:150).

Chapter 6 HYDRAULIC STUDY METHODOLOGY IN COASTAL ENGINEERING ___________________________________________________________________________________________
___________________________________________________________________________________________ March 2009 6-27
Long Waves
[1] Gierlevsen, Thomas: Hebsgaard, Mogens, Kirkegaard, Jens (2001): Wave disturbance modeling in the Port of Sines, Portugal - with special emphasis on long-period oscillations, Proc. Int. Conference on port and maritime R&D and technology (ICPMRDT), Singapore, 29-31 Oct. 2001. Vol 1, pp 337-344
[2] Kofoed-Hansen, H, P Sloth, OR Sørensen and JU Fuchs (2000): Combined numerical and physical modeling of seiching in exposed new marina. Proc ICCE 2000. 27th Coastal Eng. Conf., Sydney, Australia
[3] Madsen, PA; Sørensen, O; and Schäffer, HA (1997): Surf zone dynamics simulated by a Boussinesq type model. Part 2: Surf beat and swash oscillations for wave groups and irregular waves. Coastal Engineering 32 (4), pp 289-319
[4] Schäffer, HA; and Steenberg, CM (2003): Second-order wavemaker theory for multi-directional waves. Ocean Engineering 30, pp 1203-1231
[5] Van Dongeren, AR, HAH Petit, G Klopman, AJHM Reniers (2001). "High-Quality Laboratory Wave Generation for Flumes and Basins". Proc. Waves 2001, San Francisco, CA, U.S.A, pp 1190-1199
2D/3D Waves
[1] Daemrich, K-F: Overtopping at Vertical Structures. Second German-Chinese Joint Seminar on Recent Developments in Coastal Engineering, Tainan, Taiwan, Republic of China, September 13th to 15th 1999, Coastal Ocean Monitoring Center (COMC), 1999
[2] Daemrich, K-F, Kohlhase, S: Wave Diffraction at Harbour Entrances with Overlapping or Displaced Breakwaters. Proc. Intern. Conf. on Water Resources Development, Bangkok, 1978
[3] Daemrich, K-F, Kohlhase, S: Influence of Breakwater-Reflection on Diffraction, Intern. Conf. on Coastal Engineering, Hamburg, 1978
[4] Daemrich, K-F, Kohlhase, S: Diffraction and Reflection at Rubble-Mound Breakwaters. Proc. Intern. Conf. on Water Resources Development, Taipei, 1980
[5] Daemrich, K-F, Kohlhase, S, Partenscky, H-W: Investigations of MACH-Reflection Including Breaking and Irregular Waves. Proc. Intern. Conf. on Coastal and Port Engineering in Developing Countries, Colombo, 1983
[6] Daemrich, K-F: Diffraktion und Reflexion von Richtungsspektren mit linearen Überlagerungs-modellen. Report of Franzius-Institute for Hydraulic, Waterways and Coastal Engineering, Hannover, Germany, 1996, unpublished
[7] Daemrich, K-F, Mathias, H-J: Overtopping at Vertical Walls with Oblique Wave Approach. Fifth Intern. Conference on Coastal & Port Engineering in Developing Countries (COPEDEC V), Cape Town, South Africa, 1999
[8] Daemrich, K-F, Mathias, H-J: Overtopping at Vertical Walls with Oblique Wave Approach. Proc. of the HYDRALAB-Workshop on Experimental Research and Synergy Effects with Mathematical Models, Hannover, Germany, 17-19.2.1999, Forschungszentrum Küste (FZK), 1999
[9] Eggert, W, Daemrich, K-F, Kohlhase, S: Two and Three-Dimensional Investigations on Permeable Breakwaters Including Irregular Waves. Proc. 3. Intern. Conf. on Water Resources Development, Bandung, 1982
[10] Franco, C, Van der Meer, JW, Franco, L: Multi-directional Wave Loads on Vertical Breakwaters. Coastal Engineering 1996, Conference Proceedings, American Society of Civil Engineers, Orlando, USA, pp 2008-2021, 1996
[11] Hiraishi, T: Wave Directionality to wave action on coastal structures. In: IAHR Seminar – Multi-directional Waves and their Interaction with Structures. Ed. E. Mansard, XXVII IAHR Congress, San Francisco, 1997
[12] Hirayama, T: Modeling of Multi-directional Waves in Naval Architectural Field. In: IAHR Seminar – Multi-directional Waves and their Interaction with Structures. Ed. E. Mansard, XXVII IAHR Congress, San Francisco, 1997

Chapter 6 HYDRAULIC STUDY METHODOLOGY IN COASTAL ENGINEERING ___________________________________________________________________________________________
___________________________________________________________________________________________ 6-28 March 2009
[13] Möller, J, Ohle, N, Daemrich, K-F, Zimmermann, C, Schüttrumpf, H, Oumeraci, H: Einfluss der Wellenangriffsrichtung auf Wellenauflauf und Wellenüberlauf, 3. FZK-Kolloquium, Planung und Auslegung von Anlagen im Küstenraum, Hannover , 29. März 2001
[14] Ohle, N, Daemrich, K-F, Zimmermann, C, Möller, J, Schüttrumpf, H, Oumeraci, H: The Influence of Refraction and Shoaling on Wave Run-Up under Oblique Waves. Proc. of the 28th Inter. Conf. on Coastal Engineering, Solving Coastal Conundrums, Cardiff, Wales, 08 July 2002
[15] Ohle, N, Daemrich, K-F, Zimmermann, C, Möller, J, Schüttrumpf, H, Oumeraci, H: Wellenauf-lauf an Seedeichen, 4. FZK-Kolloquium, Hannover, 20. März 2003
[16] Oumeraci, H, Zimmermann, C, Schüttrumpf, H, Daemrich, K-F, Möller, J, Ohle, N: Influence of Oblique Wave Attack on Wave Run-up and Wave Overtopping – 3D Model Tests at NRC/ Canada with long and short crested Waves. Report LWI No 881/FI No643/V, Forschungs-zentrum Küste (FZK), Hannover, 2001
[17] Schäffer, HA, Fuchs, JU, Hyllested, P, Mathiesen, N, Wollesen, B: An Absorbing Multi-directional Wavemaker for Coastal Applications Coastal Engineering 2000, Conference Proceedings, American Society of Civil Engineers, Sydney, Australia, pp 981-993, 2000
[18] Stansberg, CT, Krokstad, JR, Nielsen, FG: Model Testing of the Slow-Drift Motion of a Moored Semisubmersible in Multidirectional Waves. In: IAHR Seminar – Multi-directional Waves and their Interaction with Structures. Ed. E. Mansard, XXVII IAHR Congress, San Francisco, 1997
[19] Zimmermann, C, Schulz, N: Morphological effects from waves and tides on artificially stabilized forelands in the Wadden Sea, Proceedings International Symposium on Habitat Hydraulics, Trondheim, 1994
[20] Zimmermann, C, v Lieberman, N: Morphological Effects from Waves and Tides on Artificially Stabilized Forelands in the Wadden Sea (Konferenzbeitrag) Proceedings of the 1st International Symposium on Habitat Hydraulics, The Norwegian Institute of Technology, Trondheim, Norway, pp 625-637, 1996
Wave Measurements
[1] Valembois J (1951) “Methods used at the National Hydraulic Laboratory of Chatou (France) for measuring and recording gravity waves in models”, Gravity Waves. Proceedings of the NBS Semicentennial Symposium on Gravity Waves held at the National Bureau of Standards on June 18-20, 1951, US Government Printing Office, Washington DC. [Starry Sky method]
[2] Wanek, J.M., Wu, C.H., 2006. Automated trinocular stereo imaging system for three-dimensional surface wave measurements. Ocean Engineering 33 (5–6), 723–747.
Wave Analysis
[1] Baldock, TE, Simminds, JM, 1999. Separation of incident and reflected waves over sloping bathymetry. Coastal Engineering 38, 167–176.
[2] Benoit, M and Teisson, C. "Laboratory Comparison of Directional Waves Measurement Systems and Analysis Techniques." Proc 24th ICCE, ASCE, Japan, paper 255, 1994.
[3] Benoit, M, 1993. Practical comparative performance survey of methods used for estimating directional wave spectra from heave-pitch-roll data. Proc. 23rd ICCE Vol 1, ASCE, pp 62-75.
[4] Benoit, M. "Extensive Comparison of Directional Wave Analysis Methods from Gauge Array Data." Proc. 2nd Int. Symp. on Ocean Wave Measurement and Analysis, ASCE, 1994.
[5] Benoit, M, Frigaard, P, and Schäffer, HA, 1997. Analysing multidirectional wave spectra: A tentative classification of available methods. Proc. IAHR Seminar Multi-directional Waves and their Interaction with Structures. 27th IAHR Congress, San Francisco, Aug 10-15, 1997. 28 pages.
[6] Borgman, LE. "Directional Spectra Models for Design." OTC, Houston, 1969.
[7] Chadwick, A, Ilic, S and Helm-Petersen, J, 2000. An evaluation of directional analysis techniques for multidirectional, partially reflected waves, Part 2: application to field data. J of Hydraulic Research, 38(4): 253-258.

Chapter 6 HYDRAULIC STUDY METHODOLOGY IN COASTAL ENGINEERING ___________________________________________________________________________________________
___________________________________________________________________________________________ March 2009 6-29
[8] Davidson, MA, Kingston, KS, and Huntley, DA, 2000, New Solution for Directional Wave Analysis in Reflective Wave Fields, Journal of Waterway, Port, Coastal and Ocean Engineering, 126(4), 173-181.
[9] Elgar, S and Chandran, V. "Higher-order Spectral Analysis to Detect Nonlinear Interactions in Measured Time Series and an Application to Chua's Circuit." Int. J. Bifurcation and Chaos 3:19-34, 1993.
[10] Elgar, S, Herbers, THC, Chandran, V and Guza, RT. "Higher-order Spectral Analysis of Non-linear Ocean Surface Gravity Waves." JGR 100(C3):4977-4983, March 1995.
[11] Frigaard, P, Brorsen, M, 1995. A time domain method for separating incident and reflected irregular waves. Coastal Engineering 24, 205–215.
[12] Galland, JC. "Rubble-mound Breakwaters stability under Oblique Waves: an Experimental Study." Proc 24th ICCE ASCE, 1994, paper 156.
[13] Goda, Y. "Random Seas and Design of Maritime Structures." Uni. Tokyo Press, 1985.
[14] Goda, Y and Suzuki, Y. "Estimation of Incident and Reflected Waves in Random Wave Experiments", Proc. 15th ICCE, ASCE 1976, pp 828-845.
[15] Guza, RT, Thornton, EB and Holman, RA. "Swash on Steep and Shallow Beaches" Proc 19th ICCE, ASCE 1984, pp 708-723.
[16] Hashimoto, N and Kobune, K. "Directional Spectrum Estimation from a Baysian Approach." Proc. 21st ICCE, ASCE, 1988, pp 62-76.
[17] Hashimoto, N, Nagai, T and Asai, T, 1993. Modification of the extended maximum entropy principle for estimating directional spectrum in incident and reflected wave field. Rept. Of P.H.R.I. 32(4) 25-47.
[18] Hasselmann, K, Munk, W and MacDonald, G. "Bispectra of Ocean Waves." Time Series Analysis, M. Rosenblatt (ed), John Wiley, NY pp 125-139, 1963.
[19] Hughes, SA. "Laboratory Wave Reflections Using Co-located Gages" Coastal Eng. 20(3-4):223-247, 1993a.
[20] Ilic, S, Chadwick, A and Helm-Petersen, J, 2000. An evaluation of directional analysis techniques for multidirectional, partially reflected waves, Part 1: numerical investigations. J of Hydraulic Research, 38(4): 243-251.
[21] Isaacson, M. "Measurement of Regular Wave Reflection" JWPCOE, ASCE 117(6): 553-569, 1991.
[22] Isobe, M. "Estimation of Directional Spectrum Expressed in Standard Form." Proc 22nd ICCE, ASCE 1990, pp 647-660.
[23] Isobe, M and Kondo, K. "Method for Estimating Directional Wave Spectrum in Incident and Reflected Wave Field." Proc. 19th ICCE, pp 467-483, 1984.
[24] Isobe, M, Kondo, K and Horikawa, K. "Extension of MLM for Estimating Directional Wave Spectrum." Proc. Symp. on Modeling of Directional Seas, paper A-6, 15 pages, 1984.
[25] Krogstad, HE. "Max Likelihood Estimation of Ocean Wave Spectra from General Arrays of Wave Gauges." Modeling, Identification and Control, 9:81-97, 1988.
[26] Long, RB and Hasselmann, K. "A Variational Technique for Extracting Directional Spectra from Multicomponent Wave Data." J. Phys. Oceanography, 9:373-381, 1979.
[27] Lundgren, H and Klinting, P. "Rigorous Analysis of Directional Waves." Proc. of Wave Analysis and Generation in Lab Basins, 22nd Congress IAHR, pp 351-363, 1987.
[28] Lyrge, A and Krogstad, HE. "Maximum Entropy Estimation of the Directional Distribution in Ocean Wave Spectra." J. Phys. Oceanography, 16:2052-2060, 1986.
[29] Mansard, EPD and Funke, ER. "The Measurement of Incident and Reflected Spectra sing a Least Squares Method", Proc 17th ICCE, Sydney, Australia, ASCE 1980, pp 154-172.
[30] Mansard, EP, Sand, SE and Funke, ER. "Reflection Analysis if Non-linear Regular Waves." Hydraulics Lab Tech Rep TR-HY-01, Nat Res Council of Canada, Ottawa, 1985.

Chapter 6 HYDRAULIC STUDY METHODOLOGY IN COASTAL ENGINEERING ___________________________________________________________________________________________
___________________________________________________________________________________________ 6-30 March 2009
[31] Maoxiang, G and Zhenquan, K. "An analysis of Second Order Waves in a Wave Tank by 3-probe Correlation Analysis and by Square-Low Operation." Ocean Eng., 15(4):319-343, 1988.
[32] Marsden, RF and Juszko, BA. "An Eigenvector Method for the Calculation of Directional Spectra from Heave, Pitch and Roll Buoy Data." J. Phys. Oceanography 17: 2157-2167, 1987.
[33] Nwogu, OU, Mansard, EP, Miles, MD and Isaacson, M. "Estimation of Directional Wave Spectra by the Maximum Entropy Method." Proc. of Wave Analysis and Generation in Lab Basins, 22nd Congress IAHR, pp 363-376, 1987.
[34] Sand, SE. "Three-dimensional Deterministic Structure of Ocean Waves." Series Paper 24, ISVA, DTH, 1979.
[35] Sand, SE and Lundgren, H. "Three-dimensional Structure of Ocean Waves." Proc. 2nd Int Conf on the Behaviour of Offshore Structures, BOSS '79, Vol 1, pp 117-120, 1979.
[36] Teisson, C and Benoit, M. "Laboratory Measurement of Oblique Irregular Wave Reflection on Rubble Mound Breakwaters." Proc 24th ICCE ASCE, 1994, paper 257.
[37] Yokoki, H, Isobe, M and Watanabe, A. "On a Method for Estimating Reflection Coefficient in Short-crested Random Seas." Proc 24th ICCE, ASCE 1994, paper 168, pp 384-385 abstracts.
[38] Zelt, JA and Skelbreia, JE. Estimating incident and reflected wave fields using an arbitrary number of wave gauges. Proc 23rd ICCE, Venice, Italy, pp 777-788, 1992.

Chapter 6 HYDRAULIC STUDY METHODOLOGY IN COASTAL ENGINEERING ___________________________________________________________________________________________
___________________________________________________________________________________________ March 2009 6-31
PART B : NUMERICAL MODELING
6.10 NUMERICAL MODELING IN COASTAL ENGINEERING
6.10.1 Evolution of Numerical Modeling Numerical models have evolved rapidly with the advances in computing technology and numerical modeling techniques. Beginning with one dimensional (1D) or single line models that capture the changes in a single variable over a frame of reference, nowadays 3D modeling is available for research into complex phenomena such as scouring and thermal convection. With numerical models, a profile or map of the study area is first captured in a computer graphic environment. Subsequently, the computer runs the programs that solve the partial differential equations that describe hydrodynamic processes to produce a time-series of flow, wave and associated parameters. Table 6.3 presents how models have progressed over the years.
Table 6.3 Evolution of Numerical Modeling
1950s 1970s 1990s • 1D steady state • Regular geometric • Flow only
• 1D-unsteady state • Real geometry • Flow and transport
• 1D, 2DH, 2DV and 3D – hydrostatic pressure assumption
• Unsteady • Real world conditions • Flow, waves, transport,
morphology and water quality etc.
Every model is based on assumptions and approximations (or simplifications) and should therefore be used within their respective limits. It is not possible to model every aspect of the real world. Numerical models are simply computer programs that compile and calculate equations of physical laws that describe natural processes, however nowadays the “state of the art” numerical simulation programmes are extremely advanced and integrated developments and are therefore capable of producing very reliable results within the limits of the equations, of course dependent on the accuracy of the input data. One dimensional (1D) models solve one dimensional phenomena such as shoreline evolution. The graphic presentation of 1D models are either in profile or plan view within which the result can be plotted as a single line. Two dimensional (2D) models are designed for coastal hydraulics, sediment transport, environmental hydraulics and harbour design. 2D models appear in plan view with each point in the model representing the geographical coordinates and a parameter value. Three dimensional (3D) models address more complex situations relating to flow, stratification and sediment transport throughout the water column. 6.10.2 Types of Numerical Modeling Techniques
Numerical modeling is essentially the solving of partial differential equations that describe the physical processes. The solution schemes can be divided into two distinct methods (i) finite element and (ii) finite difference. Using the finite element method (FEM), the study area is discretised into a 2D mesh of irregular grids comprising triangular or quadrangular elements each with a unique identity number or code. The FEM mesh is flexible whereby the size of each grid element is not fixed but could be varied to the requirements of the study. In summary, FEM allowed for the elements to be intensified in parts of the study area where detailed observations are required. This was one of the advantages the FEM had over earlier FDM models. Finite difference method (FDM) on the other hand is built upon regular rectangular grids which are similar to the geographical grids we find on the world atlas. In earlier versions using FDM, a regional model is first created using a coarse grid. Results from the coarse grid model are then transferred to

Chapter 6 HYDRAULIC STUDY METHODOLOGY IN COASTAL ENGINEERING ___________________________________________________________________________________________
___________________________________________________________________________________________ 6-32 March 2009
the boundary of a fine grid model representing the study area and subsequently ran. At times, due to restrictions in transferring of the boundary results, an intermediate or medium scale grid would be necessary before the fine grid modeling can be performed. In the 1990s, scientists developed the ‘nested-grid’ method that permitted grid intensification in the FDM and allowed coarse grid and fine grid model results to be produced in a single contiguous run.
Figure 6.12 Finite Element Model Grid
Figure 6.13 Finite Difference Model Grid For A Study Coastline

Chapter 6 HYDRAULIC STUDY METHODOLOGY IN COASTAL ENGINEERING ___________________________________________________________________________________________
___________________________________________________________________________________________ March 2009 6-33
6.10.3 The Modeling Cycle
For project managers or engineers who need to involve modeling in their projects, it is especially important to understand the modeling cycle as shown in Figure 6.14. The modeling cycle typically begins with the acquisition or selection of the appropriate modeling tool to simulate the processes in the field. This and the acquisition of the input parameters are critical upstream activities that set the basis of the model tasks ahead. The model boundaries are then established and the input data is reviewed to ensure the suitability and sufficiency. The model grid is then generated and appears as a 2D map of the study area.
Figure 6.14 The Modeling Cycle
With the model grid fully set-up, the model is run to produce the required parameter values for the study area. Prior to any meaningful use, the model must first be validated. Model validation comprises calibration and verification which are different exercises. In calibration, the model is run for the period of simulation consistent with a set of actual field measurements. The results of the model are then compared against that of the measured data for similarity. The model is considered calibrated when the model outputs match very closely the field measurements. The second part of validation is the model verification. At this stage the calibrated model is run for a totally different temporal period and the results compared against field measurements at different locations from those used for calibration. The model is considered validated when the model output matches the field data for the verification runs. The above is an ideal situation used for major projects where a comprehensive field campaign has provided suitable data for calibration and verification. However for many small projects this will not be the case. This does not mean that numerical models cannot be applied. In many cases models which are verified for similar sites are used for such smaller projects. With a validated model, production runs can now be configured to cover the scenarios required by the project design.
Model Production Runs
Model Output
Model Acquisition
Data Input and Assembly
Model Verification
Model Generation
Model Calibration

Chapter 6 HYDRAULIC STUDY METHODOLOGY IN COASTAL ENGINEERING ___________________________________________________________________________________________
___________________________________________________________________________________________ 6-34 March 2009
The validated model is the outcome of what is sometimes called the ‘diagnostic’ stage whereby the coastal processes that are present in the study area have been successfully simulated. The ‘prognostic’ part of modeling is when the project scenarios are digitized into the validated model and subsequently tested to determine what changes take place. It is important that the project design team has a profound knowledge of coastal hydraulics so that appropriate and adequate scenarios are run to fulfill the objectives of the project owner and so that adverse impacts are avoided. Application of an advanced model on a poorly designed scheme will not make the scheme working but will only demonstrate the lack of functionality of the scheme. The numerical modeling is suitable for proving that the proposed design works and for optimization of a scheme. Most commercial coastal modeling software comes in ‘suites’ that cater for all the processes above. A list of software and their respective developers is provided below: o Delft3D – Delft Hydraulics o Mike21 and Mike3 – Danish Hydraulics Institute (DHI) o TELEMAC – Electricite de France o RMA – Army Corps of Engineers o POM – Princeton Ocean Model, USA Modern software suites come complete with pre and post-processing tools that automate most of the routine work required in setting-up and running numerical models and results presentation. These include tools for harmonic analysis, creation of time series data, interpolation, graphics and animation. 6.11 BUILDING THE NUMERICAL MODEL
6.11.1 Coastal Environment in the Project Area
In order to model the project area, it is important to first understand the dominant environment forces that shape the study area. Currents, the main agent of sediment transport can be generated by gravity, wind, wave and density. The prevalent forces vary with the different coastal environments and consequentially, create different current circulation patterns (see Table 6.4).
Table 6.4 Environments And Their Circulation Patterns
Horizontal circulation patterns refer to current movements along the horizontal plane which transports sediments/substances from one location to another. Gravity driven forces are essentially the tidal currents that are generated with the flood and ebb cycles. In river deltas, there is a meeting and mixing of fresh and saltwater where their different densities create flow stratification. At the rivermouth, tidal currents combine with wave driven currents to disperse sediments in the along shore and the cross shore direction.
Environment River Delta
Lagoon Well Mixed Estuary
Salt Wedge Estuary
Shoreface Tidal Basin
Driving Forces
Gravity Density
Gravity Wind
Gravity Density
Gravity Density
Gravity Waves Wind
Gravity Waves Wind
Circulation Patterns
Horizontal offshore and
onshore
Horizontal
Horizontal; offshore and
onshore
Horizontal and vertical; offshore and onshore
Horizontal and vertical; longshore and cross-shore
Horizontal; Offshore and onshore
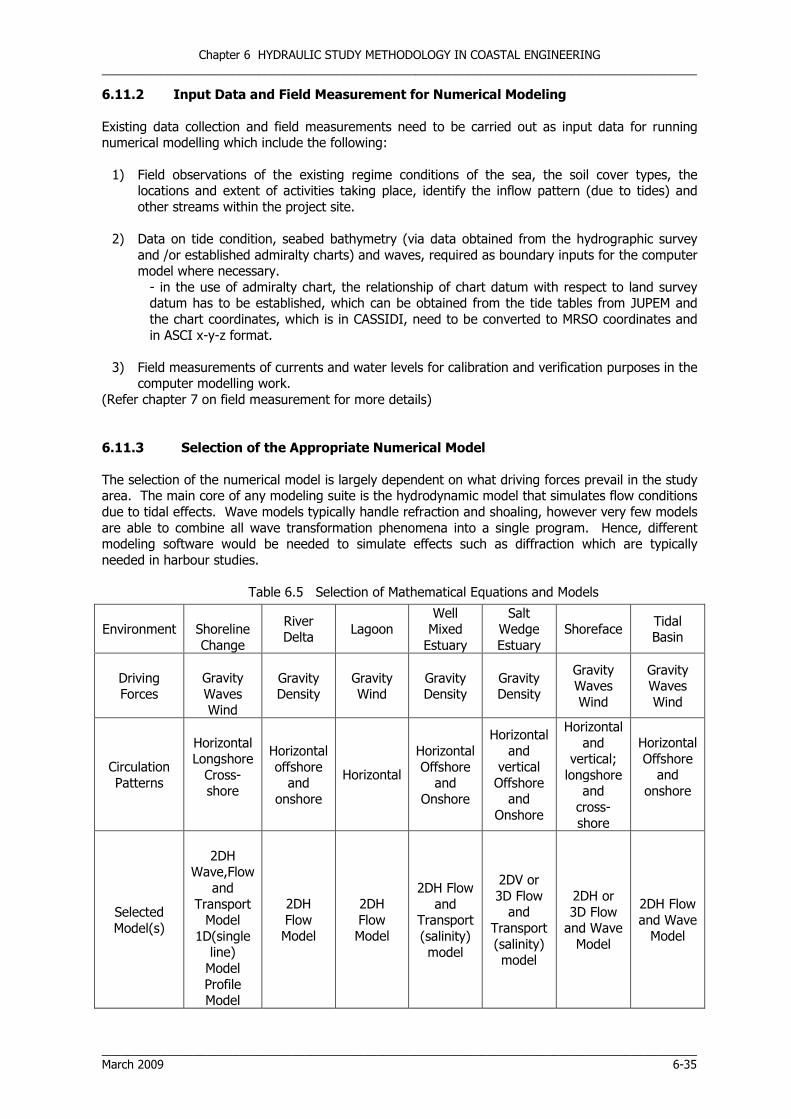
Chapter 6 HYDRAULIC STUDY METHODOLOGY IN COASTAL ENGINEERING ___________________________________________________________________________________________
___________________________________________________________________________________________ March 2009 6-35
6.11.2 Input Data and Field Measurement for Numerical Modeling
Existing data collection and field measurements need to be carried out as input data for running numerical modelling which include the following:
1) Field observations of the existing regime conditions of the sea, the soil cover types, the locations and extent of activities taking place, identify the inflow pattern (due to tides) and other streams within the project site.
2) Data on tide condition, seabed bathymetry (via data obtained from the hydrographic survey
and /or established admiralty charts) and waves, required as boundary inputs for the computer model where necessary. - in the use of admiralty chart, the relationship of chart datum with respect to land survey datum has to be established, which can be obtained from the tide tables from JUPEM and the chart coordinates, which is in CASSIDI, need to be converted to MRSO coordinates and in ASCI x-y-z format.
3) Field measurements of currents and water levels for calibration and verification purposes in the
computer modelling work. (Refer chapter 7 on field measurement for more details)
6.11.3 Selection of the Appropriate Numerical Model The selection of the numerical model is largely dependent on what driving forces prevail in the study area. The main core of any modeling suite is the hydrodynamic model that simulates flow conditions due to tidal effects. Wave models typically handle refraction and shoaling, however very few models are able to combine all wave transformation phenomena into a single program. Hence, different modeling software would be needed to simulate effects such as diffraction which are typically needed in harbour studies.
Table 6.5 Selection of Mathematical Equations and Models
Environment
Shoreline Change
River Delta
Lagoon Well Mixed Estuary
Salt Wedge Estuary
Shoreface Tidal Basin
Driving Forces
Gravity Waves Wind
Gravity Density
Gravity Wind
Gravity Density
Gravity Density
Gravity Waves Wind
Gravity Waves Wind
Circulation Patterns
Horizontal Longshore Cross-shore
Horizontal offshore and
onshore
Horizontal
Horizontal Offshore and
Onshore
Horizontal and
vertical Offshore and
Onshore
Horizontal and
vertical; longshore
and cross-shore
Horizontal Offshore and
onshore
Selected Model(s)
2DH
Wave,Flow and
Transport Model
1D(single line) Model Profile Model
2DH Flow Model
2DH Flow Model
2DH Flow and
Transport (salinity) model
2DV or 3D Flow and
Transport (salinity) model
2DH or 3D Flow and Wave Model
2DH Flow and Wave Model

Chapter 6 HYDRAULIC STUDY METHODOLOGY IN COASTAL ENGINEERING ___________________________________________________________________________________________
___________________________________________________________________________________________ 6-36 March 2009
It is very important to understand that a 2D model cannot be used to solve a 3D problem. For example, the effect of scour at jetty piers is a 3D problem which cannot be fully appreciated by merely studying the current and sediment transport pattern in a 2D hydrodynamic model. The 2D model would only predict the effect due to horizontal flow and completely ignore the vertical component of flow which is an important factor in scouring. Shoreline change can be modeled using a one-line (also known as single contour) model which predicts the changes of a baseline under the predominant wave height and direction. Based on the wave characteristics and sediment size, the model calculates the sediment transport rates. Obstructions or structures can be digitised into the model and the effect of these on the baseline can be observed. One line concepts are also used to predict how a shore profile varies under a particular wave condition. This is especially useful for predicting the evolution of nourished beaches. 6.11.4 Coastal Modeling Protocol Coastal modeling follows a simple protocol which begins with the identification of the environmental forcing factors and subsequently the process that these factors initiate. When numerical modeling is deemed necessary, a data collection campaign is carried out to obtain the necessary data. It could be either a field survey campaign or collection of existing data from various data sources, such as climatic data, data provided by global hydrodynamic models or data collected by satellites. Being a spatial model, all 2D coastal models require bathymetric data which is processed so that water and land points are clearly differentiated. The modeling tasks are then executed beginning with wave and hydrodynamic modeling which produce the wave and tidal current regime in the area. The hydrodynamic model results then serve as the driving agents for sediment transport, effluent dispersion and morphological models. Figure 6.15 illustrates the coastal modeling task sequence.
Figure 6.15 Coastal Modeling Task Flow-Chart
Survey and Data Collection
Water Quality
Hydrographic & Topographic Survey
Current Tide Wind Wave Sediment Barometric Pressure
Modeling
Hydrodynamic Model
Wave Model
Advection & Dispersion
Sediment Transport
Current & Waves
Tides & Storm Surge
Morphology
Input
Para
mete
rs
Module
s

Chapter 6 HYDRAULIC STUDY METHODOLOGY IN COASTAL ENGINEERING ___________________________________________________________________________________________
___________________________________________________________________________________________ March 2009 6-37
6.11.5 Typical Coastal Modeling Modules
6.11.5.1 Wave A typical wave module is able to transform deepwater waves as they propagate into the nearshore areas by simulating the shoaling, refraction and breaking processes. Wave refraction models often include, bottom dissipation and wave breaking parameters. Using offshore wave height, period and direction as the main input parameters at the model boundary, the wave refraction model calculates the new wave height and direction at all water points inside the wave model area. For large areas the wind over the modeling area shall be applied also. Some wave models plot the path of the wave orthogonal or wave rays which are useful when trying to determine the focus of wave energy along a shoreline. Wave diffraction phenomena and short-crested waves are often handled separately from wave refraction and major software producers create specific modules for this purpose. The output of wave models are wave height, period and direction at each point in the model grid and wave heights can also be represented by contours (see Figure 6.16). The wave propagation model can also produce radiation stress fields as forcing to a hydrodynamic model, which can then produce wave driven currents which are important in the analysis of sediment transport. Wave models can be run at various water level conditions depending on the scenario to be tested. A wave model can also produce nearshore wave statistics (wave roses) if the model is run for a series of offshore conditions with known frequency of occurrence. These nearshore wave conditions are subsequently used as input to littoral transport models and for design of coastal schemes. The wave model is widely used in studying wave patterns in the nearshore area or the study of wave impacts inside harbours and bays. It is also useful in determining if offshore structures influence wave propagation and energy distribution along the coast.
Figure 6.16 Wave Penetration Into A Harbor – Wave Heights Are Presented As Contours
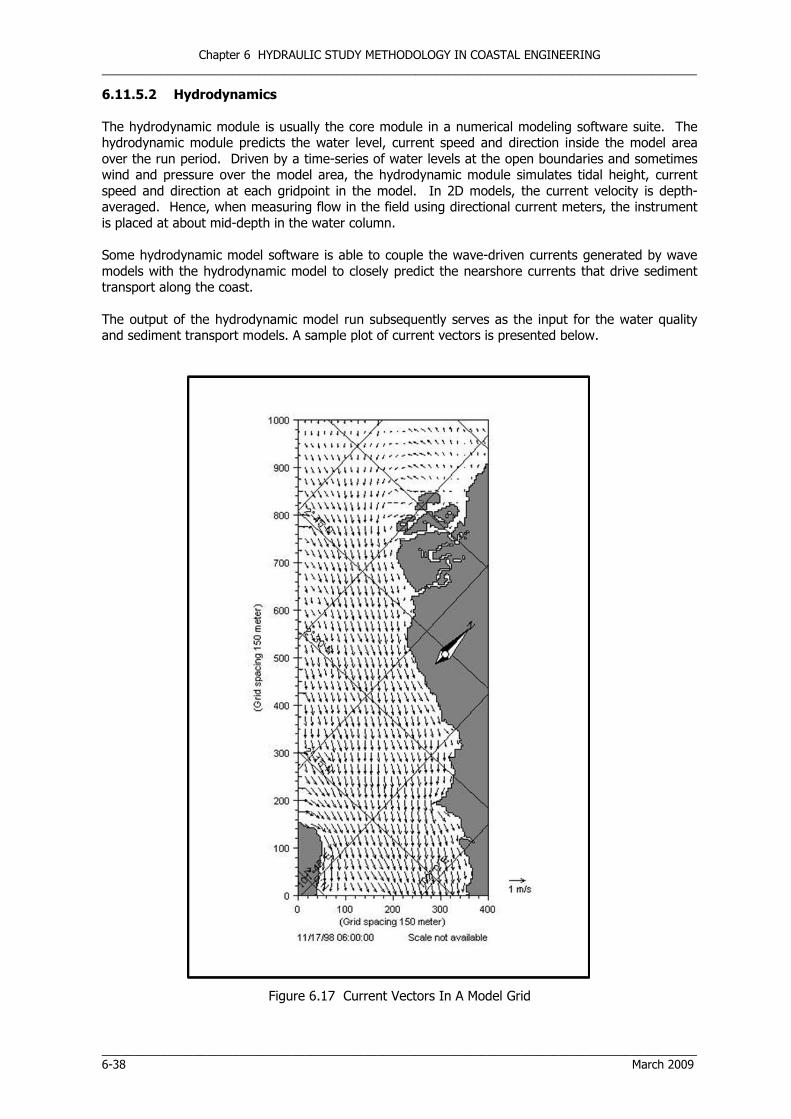
Chapter 6 HYDRAULIC STUDY METHODOLOGY IN COASTAL ENGINEERING ___________________________________________________________________________________________
___________________________________________________________________________________________ 6-38 March 2009
6.11.5.2 Hydrodynamics
The hydrodynamic module is usually the core module in a numerical modeling software suite. The hydrodynamic module predicts the water level, current speed and direction inside the model area over the run period. Driven by a time-series of water levels at the open boundaries and sometimes wind and pressure over the model area, the hydrodynamic module simulates tidal height, current speed and direction at each gridpoint in the model. In 2D models, the current velocity is depth-averaged. Hence, when measuring flow in the field using directional current meters, the instrument is placed at about mid-depth in the water column. Some hydrodynamic model software is able to couple the wave-driven currents generated by wave models with the hydrodynamic model to closely predict the nearshore currents that drive sediment transport along the coast. The output of the hydrodynamic model run subsequently serves as the input for the water quality and sediment transport models. A sample plot of current vectors is presented below.
Figure 6.17 Current Vectors In A Model Grid

Chapter 6 HYDRAULIC STUDY METHODOLOGY IN COASTAL ENGINEERING ___________________________________________________________________________________________
___________________________________________________________________________________________ March 2009 6-39
6.11.5.3 Sediment Transport
Sediment transport is ultimately the focal coastal process in any coastal study as it provides the engineer with insight into the morphological trend of the coastline due to the effects of the predominant hydraulic forces. Sediment transport modeling is however, among the most difficult phenomena to model. Due to the difference in the physical behavior of cohesive and non-cohesive sediments, the normal practice is to simulate cohesive and non-cohesive processes separately. However, state of the art models capable of simulating both processes simultaneously have recently been developed. For sand and similar granular material, sediment transport is modeled based on the shear stress created by the flow velocities and the critical shear stress of the bed material. Hence, the larger the grain size of the bed material, the more resistant it is to entrainment and transport. Sediment transport models therefore require the engineering properties of the bed material particularly, grain size. Due to the difference in the physical properties of granular and cohesive sediments, cohesive sediment or mud transport is modeled separately. The input parameters to the cohesive sediment transport model include the engineering properties of the bed sediment and the thickness of the layer. It can be seen that due to the differences in the two models, approximations will be needed when modeling areas with mixed-type sediments. 6.11.5.4 Water Quality Development projects involving the coast and marine environment are often required to follow environment management best practice which invariably includes preserving water quality. The water quality model is also used when modeling pollutant-dispersal in a water body. In dredging works, for example, it is important to know to what extent the turbidity caused by the activity is able to spread. Water quality models help to determine this as well as the spread of other effluent-types inside a water medium. Water quality models are running as add on modules to a validated hydrodynamic model with the effluent parameters and possible decay/biological processes included. The key parameter in water quality models include the rate at which the effluent disperses in water, the concentration of the effluent at the source and, in the case of suspended solids, the ambient concentration. The model then calculates the concentration of the effluent at each point in the grid. 6.11.5.5 Morphology
Coastal morphological changes are primarily due to sediment transport. Hence, the prediction of shoreline changes can only be as good as the sediment transport predictions. One-dimensional models are often good enough for predicting shoreline evolution and profile change. The shoreline evolution is calculated based on gradients in the littoral transport as derived from the littoral transport model, and then developed in the time domain. Shoreline evolution models are suitable for computing shoreline development for many years. 2D morphological models are also available and they are based on a coupled complex of wave, HD and sediment transport models, which provide gradients in the transport field over an area, which is used for updating the model bathymetry. Once this is done, the entire model complex is run again and a new step in the morphological development of the seabed is established. This is a very complicated and time consuming model complex which however, has been developed to an operational level over the last decade. This is mainly used to simulate the morphological changes in a limited project area, e.g. around a port entrance, for characteristic storm events.

Chapter 6 HYDRAULIC STUDY METHODOLOGY IN COASTAL ENGINEERING ___________________________________________________________________________________________
___________________________________________________________________________________________ 6-40 March 2009
6.11.6 The Hydrodynamic Modeling Cycle
Figure 6.18 Hydrodynamic Modeling Flow-Chart
Due to the importance of the hydrodynamic modeling in coastal studies, the setting-up of a typical model for a coastal environment is described below. Figure 6.18 above illustrates the steps in a setting-up and validating a hydrodynamic model. 6.11.7 Model Set-up Setting up the model is simply transforming real phenomenon into a digital format understood by the modeling software. The real world data is transformed and resolved into discretized spatial and temporal model grids. Key components of model set-up include determining the boundaries of the regional and the study area. In modeling terminology, boundaries are either open or closed. Closed boundaries are usually land boundaries where flow does not transcend. The open boundaries are where boundary conditions are set. In a hydrodynamic model, the boundary condition at open boundaries is represented by a time-series of tidal heights. On top of that there can be driving forces by wind and atmospheric pressure over the entire model area, and this is especially applicable for regional modeling of major areas.

Chapter 6 HYDRAULIC STUDY METHODOLOGY IN COASTAL ENGINEERING ___________________________________________________________________________________________
___________________________________________________________________________________________ March 2009 6-41
Proper selection of boundary conditions and accurate discretization of water depths are imperative to the modeling exercise. Errors at this stage of the model could be the reason for difficulties at the calibration stage.
Figure 6.19 Model Set-Up Depicting Bathymetry Surrounding Pulau Pinang
The model grid as shown in Figure 6.19 is a digital representation of the study area. Coarse grid spacings are used when modeling around the general area of interest. For the specific area of study, fine grid spacings should be used and these are usually less than 50 m. Among the common errors in hydrodynamic modeling is the poor placement of the model boundary which leads to instability and ‘blow-up’. Modeling of intertidal areas – areas that experience wetting and drying – is also relatively more difficult than modeling a coastal area that is always below water. Study areas should also be placed at least 50 grid points away from the model boundary to prevent the influence of the boundary on results at the area of interest. 6.11.8 Sensitivity Studies In extensive modeling studies, a sensitivity test is done on the parameters that characterise the model behaviour to determine which parameter influences the model results most. The most sensitive parameter is the one that is changed in order to calibrate the model. In general, the roughness coefficient has been widely used as the calibration parameter for hydrodynamic models. Other parameters such as eddy viscosity and wind speeds can also be used to calibrate.
0 100 200 400 300
100
50
150
200
250
300
350
400
450
(Grid spacing 200 meter)
(Grid spacing 200 meter)
Scale not available

Chapter 6 HYDRAULIC STUDY METHODOLOGY IN COASTAL ENGINEERING ___________________________________________________________________________________________
___________________________________________________________________________________________ 6-42 March 2009
6.11.9 Model Calibration
Model calibration and model verification, both can be considered essential tasks under the model validation exercise. Calibration is basically the ‘tuning’ of a model to reproduce or simulate a known set of field conditions. The time series of results produced by the model is compared against a field dataset of the exact time period. The model results and the field measurements must agree within an accepted degree of tolerance. For the hydrodynamic model, calibration is done by adjusting the calibration parameter until the measured and predicted results for water levels and currents match. The Guidelines for Preparation of Coastal Engineering Hydraulic Study and Impact Evaluation (for hydraulic studies using numerical models) stipulates the following tolerances between model results and measured data for model calibration and verification:
� Tidal elevations – 10% � Current speed – 30% � Current direction – 45 degrees
Similarly, calibrating a wave model would require field wave data. Measured wave data in Malaysian coastal waters is still scarce hence most wave models are not calibrated. Local engineers have sometimes resorted to published datasets derived from global models to calibrate local wave models. Nevertheless, most commercial wave refraction models are fairly accurate in simulating wave refraction and shoaling. A sample of a ‘calibrated’ condition for water levels and flow velocity is shown in Figure 6.20 and 6.21.
Figure 6.20 Model Calibration Using Water Levels
Model predicted water level (m) Measured water level (m)

Chapter 6 HYDRAULIC STUDY METHODOLOGY IN COASTAL ENGINEERING ___________________________________________________________________________________________
___________________________________________________________________________________________ March 2009 6-43
Figure 6.21 Comparison Of Field Measured Flow Velocity Against Model Results
Among the main concerns prior to the modeling exercise is obtaining the necessary field measurements to facilitate calibration and verification. Current measurements are usually carried out over both the spring and neap tides so that the model can be calibrated for both conditions. A model calibrated for the spring tide alone may not necessarily produce accurate simulation of a neap tide condition hence the need for tide and current measurements over the full tidal cycle. 6.11.10 Model Verification
Model verification is an exercise that tests the robustness of a calibrated model for application over long time periods. The measurements required for model verification are captured at different locations in the study area and time periods from that used for calibration. It is important that the selection of the verification points in the study area be some distance away from the calibration points to prevent bias. A verified model can be considered as a confirmation of the earlier calibration work and that the model was correctly set-up. A validated model lends greater confidence to the usage of the model as a scenario-projection tool. Assuming that the calibration standards have been achieved, the quality of the validated model is entirely dependent on how well it has been verified. 6.11.11 Study Scenarios
Once a model is validated, it can then be used to conduct the prognostic or predictive studies. The study scenario is then digitized into the model grid and this model is run without making any changes to the parameters. While the exercise is geared at predicting how coastal processes in the study area change with physical presence of the project, it is important that the modeler has the knowledge of how the introduction of the new scenario affects the coastal processes in order to detect any unrealistic or unacceptable output of the model. In major coastal and maritime infrastructure projects, it is advisable to test several possible lay-outs using numerical models and subsequently prepare a functionality and impact matrix for decision-making. 6.12 USING NUMERICAL MODEL RESULTS IN IMPACT ANALYSIS
6.12.1 Types of Impact
Although numerical modeling is able to simulate natural and developed environmental scenarios, the measure of its value is in how well the results contribute to the decision-making process. In order to achieve this, results must be carefully interpreted and if necessary, cross-examined against other information such as maps and images. In impact analysis, baseline studies must first be conducted to establish the pre-project conditions against which the model-predicted ‘with-project’ conditions are compared. The impacts that one looks for from the modeling exercise are both direct and residual as well as affecting both the physical, environmental and socio-economic sectors.
00:00 12:00 00:00 12:00 00:00 12:00 2000-02-11 02-12 02-13
1.00
0.80
0.60
0.40
0.20
0.00
Velocity – simulation
Velocity – measured Velocity Comparison At CM2
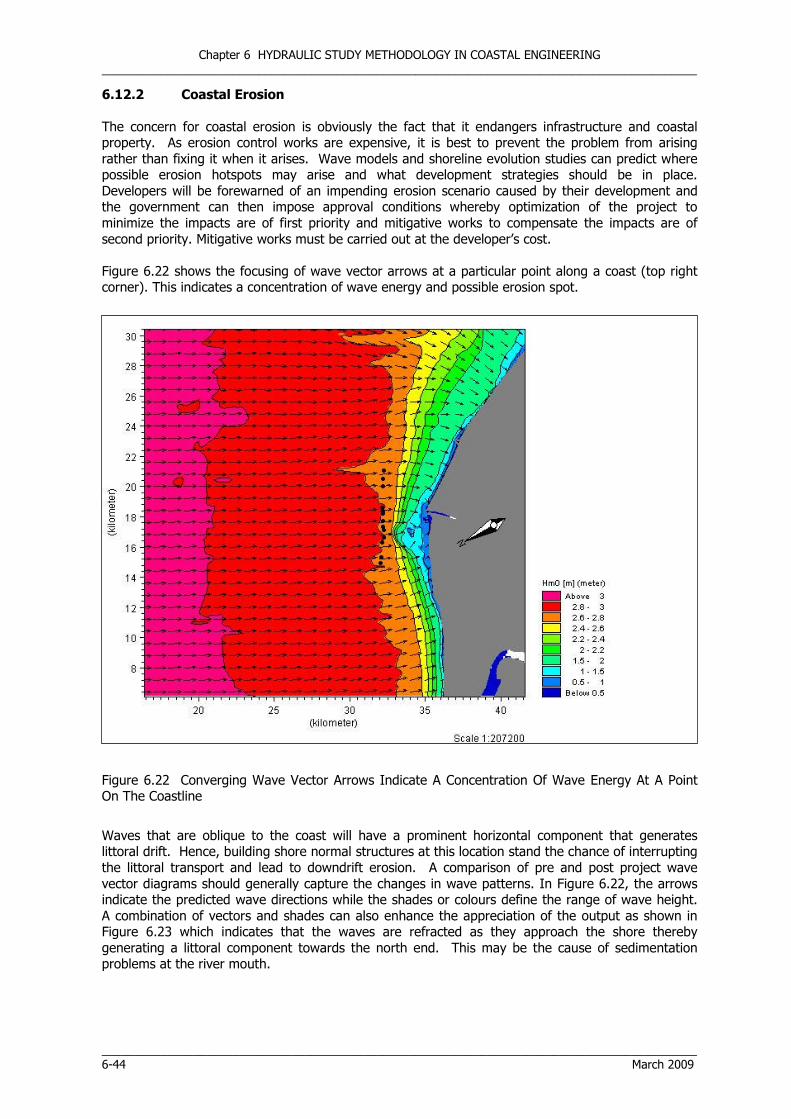
Chapter 6 HYDRAULIC STUDY METHODOLOGY IN COASTAL ENGINEERING ___________________________________________________________________________________________
___________________________________________________________________________________________ 6-44 March 2009
6.12.2 Coastal Erosion
The concern for coastal erosion is obviously the fact that it endangers infrastructure and coastal property. As erosion control works are expensive, it is best to prevent the problem from arising rather than fixing it when it arises. Wave models and shoreline evolution studies can predict where possible erosion hotspots may arise and what development strategies should be in place. Developers will be forewarned of an impending erosion scenario caused by their development and the government can then impose approval conditions whereby optimization of the project to minimize the impacts are of first priority and mitigative works to compensate the impacts are of second priority. Mitigative works must be carried out at the developer’s cost. Figure 6.22 shows the focusing of wave vector arrows at a particular point along a coast (top right corner). This indicates a concentration of wave energy and possible erosion spot.
Figure 6.22 Converging Wave Vector Arrows Indicate A Concentration Of Wave Energy At A Point On The Coastline
Waves that are oblique to the coast will have a prominent horizontal component that generates littoral drift. Hence, building shore normal structures at this location stand the chance of interrupting the littoral transport and lead to downdrift erosion. A comparison of pre and post project wave vector diagrams should generally capture the changes in wave patterns. In Figure 6.22, the arrows indicate the predicted wave directions while the shades or colours define the range of wave height. A combination of vectors and shades can also enhance the appreciation of the output as shown in Figure 6.23 which indicates that the waves are refracted as they approach the shore thereby generating a littoral component towards the north end. This may be the cause of sedimentation problems at the river mouth.

Chapter 6 HYDRAULIC STUDY METHODOLOGY IN COASTAL ENGINEERING ___________________________________________________________________________________________
___________________________________________________________________________________________ March 2009 6-45
Figure 6.23 Wave Vectors And Shaded Contours
6.12.3 Coastal Flooding
Coastal projects such as those that involve reclamation of shorelines and rivermouth as well as the realignment of rivers affect tidal heights and drainage. Reduced velocities at rivermouths lead to siltation thereby reducing the flow capacity. Any lengthening of the hydraulic gradient or increasing of tidal heights at rivermouths can lead to upstream flooding. 6.12.4 Rivermouth Impacts Sedimentation or siltation at rivermouths may pose a hazard to navigation. Hence, whenever ‘with-project’ results indicate a significant reduction in flow velocities at a river mouth, sedimentation could possibly occur and affect navigation safety as a result of the shallowing of drafts or the narrowing of channels. With good field data, sediment transport models can be used to predict siltation rates and from which dredging maintenance requirements can be estimated. Coastal projects should not interfere with the tidal prism and salinity concentrations in the river estuary as they can affect the health of marine ecosystems. Any reduction in the flushing capacity i.e. reduction in flow, causes a decrease in the exchange between fresh and saltwater. This natural flushing is necessary for the removal and dilution of effluents that originate from the hinterland.
6.12.5 Water Quality Coastal water quality plays a major role in ensuring the wellness of aquatic flora and fauna as well as in sustaining the recreational value of beaches. For this reason, the siting of outfalls should be guided by numerical models. Also diffuse seepage of e.g. nutrients from fertilizing of farmland should be simulated by numerical modeling. Dredging works increase the concentration of total suspended sediments in the water column resulting in higher turbidity. DID guidelines recommend that when dredging and disposal works are close to each other, both activities must be modelled as ‘sources’ in the numerical model.
800
700
600
500
400
300
200
100
0
(Grid spacing 10 m
eters)

Chapter 6 HYDRAULIC STUDY METHODOLOGY IN COASTAL ENGINEERING ___________________________________________________________________________________________
___________________________________________________________________________________________ 6-46 March 2009
6.12.6 Destruction of Coastal Habitats
Dredging and reclamation are considered the greatest threat to coastal habitats due to the large scale and irreversible impacts it can cause. Extended periods of high turbidity pose a threat to coral reefs and seagrass. For coral reefs and seagrass, an average daytime increase of suspended solid concentration (SSC) of 10mg/l or more is considered dangerous. Mangrove habitats depend on the constant exchange between tidal and riverine waters and any change to the natural ‘flushing’ by tidal currents may cause them to degrade. Coral reefs are sensitive to sedimentation and easily die if they lack sunlight. Dispersion models (sometimes also known as advection models) are able to predict the spread of SSC and by overlaying the results on a coastal habitat map, impact analysis can be readily conducted. Figure 6.24 illustrates an output from a water quality model. The plume created by dredging activity spreads following the tidal currents. This is not necessarily a problem unless the concentration increases very rapidly to alarming levels in areas with sensitive marine habitats.
Figure 6.24 Plume Dispersion Modeled By Advection And Dispersion Model

Chapter 6 HYDRAULIC STUDY METHODOLOGY IN COASTAL ENGINEERING ___________________________________________________________________________________________
___________________________________________________________________________________________ March 2009 6-47
6.13 HYDRAULIC STUDY AND NUMERICAL MODELING REPORT CONTENT
6.13.1 Report Structure and Content
The content of a hydraulic study follows the components as presented in 6.2.2. They include:
• Project proposal: what is being proposed and the methodology • Description of the existing environmental and development conditions at the study site; • Anticipated impacts and model selection: what to study and what modules will be used
for the study • Data: what needs to be collected and analysed • Numerical modeling – what phenomena and impacts need to be investigated • Potential impacts due to project • Functionality of the project • Proposed optimization/mitigative measures • Monitoring program • Conclusion and recommendations
Numerical studies are often a stand alone chapter in the report and comprise:
• Details of field datasets used as parameters for the model • Regional and study area bathymetry plots • Pre-project model grid • Calibration and verification plots • ‘With-project’ model grid for all project scenarios covering all relevant coastal
phenomena (wave, currents etc.) • ‘With-project’ output plots
6.13.2 Quality of Reporting
A hydraulic study report is the final product of the hydraulic study. As in all studies, regardless of how well the study components are executed, it is ultimately what is captured by the report that matters. It is for this reason that much emphasis has been given to graphics in the technical reports of today. The better reports are those that provide the clearest description of the processes being studied and offer clear options and recommendations founded on strong arguments. For best effect, the following table has been prepared as a general guide to good reporting.
Table 6.6 Quality of Hydraulic Study Report
Component Good Bad/Weak
Project and area description
• Appropriately scaled maps to describe existing and future layout, existing natural resources/economic activities.
• Secondary & primary data
• Maps in large scale • Heavy dependence on
secondary data • Limited primary data
Impacts projected • Comprehensive description of expected impacts
• Elaborate description of problems and scenarios
• Clear understanding of modeling tools to use
• Focus on annual impacts • Poor problem description • Elimination of test
scenarios without due process or analysis

Chapter 6 HYDRAULIC STUDY METHODOLOGY IN COASTAL ENGINEERING ___________________________________________________________________________________________
___________________________________________________________________________________________ 6-48 March 2009
Flow of study
Unambiguous • due processes given and
links are clear • Model scenarios as per
guidelines • Unambiguous data
presentation; correct scales and units
• Supported conclusions
Disjointed • Linkage between study
components not clear • Modeling guidelines not
followed/partially complied
• Scenarios not fully explored
• Limited data presentation • Conclusions unsupported
Commitment to mitigative measures
• Explicit listing of mitigative measures to be undertaken
• Monitoring programme proposed
• Generalisation of measures and undertaking
• No monitoring programme
REFERENCES
[1] DID (2001). Guidelines for Preparation of Coastal Hydraulic Study and Impact Evaluation (For Hydraulic Studies using Numerical Models).
[2] Mike21 User Manual, DHI [3] Delft3D User Manual [4] Coastal Engineering Manual, USACE

Chapter 7 HYDRAULIC DESIGN IN COASTAL ENGINEERING
___________________________________________________________________________________________
____________________________________________________________________________________________
March 2009
CHAPTER 7
HYDRAULIC DESIGN IN COASTAL ENGINEERING


Chapter 7 HYDRAULIC DESIGN IN COASTAL ENGINEERING
___________________________________________________________________________________________
___________________________________________________________________________________________
March 2009 7-i
Table of Contents Table of Contents ......................................................................................................................7-i
List of Tables ......................................................................................................................... 7-iii
List of Figures ......................................................................................................................... 7-iii
7.1 INTRODUCTION................................................................................................................7-1
7.2 COASTAL PROTECTION PROJECT – APPROACHES AND OPTIOS...........................................7-1
7.2.1 Alternative Methods for Coastal Protection ................................................................7-1
7.2.2 Coastal Protection Structures .....................................................................................7-3
7.3 HYDRAULIC DESIGN CONSIDERATIONS AND RATIONALE ...................................................7-5
7.3.1. Principal Factors Affecting Hydraulic Design...............................................................7-5
7.3.2 Design Considerations...............................................................................................7-7
7.3.3 Design Rationale......................................................................................................7-8
7.4 COASTAL PROJECT PLANNING AND DESIGN.......................................................................7-9
7.4.1 Hydraulic Design Process..........................................................................................7-9
7.4.2 Planning Stage ......................................................................................................7-10
7.4.2.1 System Analysis and Pre-Feasibility Studies ................................................7-11
7.4.2.2 Feasibility Study........................................................................................7-12
7.4.2.3 Hydraulic Study ........................................................................................7-13
7.5 HYDRAULIC BOUNDARY CONDITIONS..............................................................................7-18
7.5.1 Estimation of Design Water Levels ..........................................................................7-20
7.5.2 Determination of Design Wave Parameters..............................................................7-22
7.6 DATA REQUIREMENTS AND FIELD INVESTIGATIONS........................................................7-23
7.6.1 Data Requirements ................................................................................................7-23
7.6.2 Field Investigations ................................................................................................7-27
7.7 MANUALS AND DESIGN GUIDELINES ...............................................................................7-28
7.7.1 USACE Manuals and Technical Reports....................................................................7-28
7.7.2 European Manuals and Guidelines...........................................................................7-28

Chapter 7 HYDRAULIC DESIGN IN COASTAL ENGINEERING
___________________________________________________________________________________________
___________________________________________________________________________________________
7-ii March 2009
7.8 RIVERMOUTH IMPROVEMENT......................................................................................... 7-29
7.8.1 Types and Functions of Rivermouth Improvement Works ....................................... 7-29
7.8.2 Physical Factors Affecting Hydraulic Design ........................................................... 7-30
Chapter 7 HYDRAULIC DESIGN IN COASTAL ENGINEERING
___________________________________________________________________________________________
___________________________________________________________________________________________
March 2009 7-iii
List of Tables
Table Description Page
7.1 Summary Of Coastal Protection 7-3
7.2 Types and Functions of Coastal Protection 7-4
7.3 Principal Hydraulic Functions Of Coastal Protection Structures 7-8
7.4 A Guide to Applications of Coastal Protection Methods 7-15
7.5 Data Requirements for a Simple Coastal Structure Design 7-24
7.6 Types of Measuring Instruments for Field Investigations 7-27
7.7 Types and Functions of Rivermouth Improvement Works 7-29
7.8 Effect of Tidal Prism on Rivermouth Entrance Conditions 7-31
List of Figures
Figure Description Page
7.1 Alternative Methods for Storm Damage Mitigation 7-2
7.2 Design Considerations 7-7
7.3 Design Process Flowchart 7-9
7.4 Typical Process Flow In the Planning & Design of Coastal Shore Protection Projects 7-10
7.5 Land-Sea Interactions in the Coastal Zone 7-11
7.6 Some Examples of Coastal Protection Works In Malaysia 7-14
7.7 Hydraulic Boundary Conditions 7-19
7.8 Flow Diagram for Determination of Design Water Level 7-20
7.9 Effects of Water Level on Wave Heights 7-20
7.10 Definition Sketch of a Storm Surge 7-21
7.11 Wave Set-up and Set-down 7-22
7.12 Design Wave Height Determination Process 7-23
7.13 Data Requirements and Synthesisation 7-25
7.14 Data Flow in Design Process 7-26
7.15 Types of Data Relevant To Studies Undertaken 7-26
7.16 River Mouth Shoaling 7-29
7.17 Examples of River Improvement Works 7-30

Chapter 7 HYDRAULIC DESIGN IN COASTAL ENGINEERING
___________________________________________________________________________________________
___________________________________________________________________________________________
7-iv March 2009
(This page is deliberately left blank)

Chapter 7 HYDRAULIC DESIGN IN COASTAL ENGINEERING
___________________________________________________________________________________________
___________________________________________________________________________________________
March 2009 7-1
7 HYDRAULIC DESIGN IN COASTAL ENGINEERING
7.1 INTRODUCTION
Coastal engineering is a dynamic field that is complex and multidisciplinary which applies heavily on
the sciences of oceanography, meteorology, geology, fluid mechanics, mathematics, statistics, soil mechanics, computer science and others. It is not an exact science and therefore coastal engineers
rely on empirical formulae and several procedures or guidelines to design coastal structures. As a
rule of thumb, there is no code of practice, limited proven design techniques and manuals and no general systems of computer-based design programs to assist the engineer in designing coastal
structures. Although some standard procedures exist, any such application is limited because solutions are generally site-specific (so much so that solutions successful at one point may not work
at another).
In the pursuit of seeking solutions to problems (such as coastal erosion, siltation in river mouths,
marine pollution, etc), the coastal engineer is actually dealing with nature and her ‘tantrums’. Thus design solutions are not straight forward and no single solution to a specific problem can be
resolved. It is also important that design solutions are within the bounds of acceptable impacts to the coastal environment.
Most coastal engineering projects become unique challenges that need application of ingenuity, common sense and professional judgment. The latter, of course, relies heavily on experience and
knowledge in the subject matter. It is therefore essential for experienced specialist engineers to be consulted for the relevant studies, field work and execution of detailed design. For reference and
guide on the detailed analysis and design of shore protection structures, a list of references is
provided.
This chapter provides a basic understanding of the procedures necessary to ensure that coastal protection projects are adequately designed. It is assumed that the project design engineer has an
academic background or subsequent continuing education in coastal engineering training modules such as wave mechanics, sediment transport and sediment budget estimates, coastal structure
design, and familiar with some coastal engineering application softwares.
7.2 COASTAL PROTECTION PROJECT- APPROACHES AND OPTIONS Coastal protection projects are projects that serve to reduce the damaging effects of coastal
flooding, storm surges, or erosion due to wave impacts, tidal fluctuations, or sediment deficits
resulting from natural or human causes. The approach and option to mitigate the problem depends on the project objective and design objective.
7.2.1 Alternative Methods For Coastal Protection
Five alternative methods to mitigate the damage of coastal storms and forces are namely accommodation, protection, beach nourishment, retreat and do-nothing (Figure 7.1). For design,
the following six (6) types of alternatives are commonly considered: (i) armouring, (ii) beach stabilization structures, (iii) beach restoration, (iv) adaptation and retreat, (v) combinations
(including new technologies), and (vi) do-nothing option. Table 7.1 provides a summary of the various alternatives, types and their respective methods of approach.

Chapter 7 HYDRAULIC DESIGN IN COASTAL ENGINEERING
___________________________________________________________________________________________
___________________________________________________________________________________________
7-2 March 2009
Figure 7.1 Alternative Methods For Storm Damage Mitigation
(Storm Surge, Sea Level Rise, Coastal Erosion)
(after Gilbert and Vellinga, 1990).

Chapter 7 HYDRAULIC DESIGN IN COASTAL ENGINEERING
___________________________________________________________________________________________
___________________________________________________________________________________________
March 2009 7-3
Table 7.1 Summary of Coastal Protection Alternatives
Alternative Type Materials of
construction Approach
1) Armouring structures
• Seawall
• Bulkhead
• Revetment
• Dike
Concrete, rock
Sheetpile (steel,
timber, concrete) Rock, earth,
geotextile bags, gabions)
Changes to
natural, physical
system
2) Beach stabilization structures and
Facilities
• Detached
breakwaters
• Groynes
• Sills
• Vegetation
• Groundwater
drainage
Rock, precast
concrete units, sheetpiles,
geotextile bags
Mangroves
Submerged aquatic vegetation
Wetlands
Beach drainage
Bluff dewatering
Changes to
natural, physical system
3) Beach restoration
• Beach
nourishment • Sand bypassing
Offshore sand
Dredged material
Moderate changes
to natural, physical system
4) Adaptation and Accommodation
• Flood proofing
• Zoning
• Retreat
Changes to Man’s system
5) Combinations Structural and Restoration
Structural,
Restoration and Adaptation
Any combination of Alternative 1, 2
and 3
Any combination
of all alternatives except retreat
Changes in Both
6) Do Nothing Let nature take its
course No change
7.2.2 Coastal Protection Structures
Where structural option is chosen for a coastal protection project, various types of coastal protection structures or a combination of them are available for consideration. The final choice of
the type of structures lies with the project objective determined. Various types of coastal protection structures and their functions are listed in Table 7.2

Chapter 7 HYDRAULIC DESIGN IN COASTAL ENGINEERING
___________________________________________________________________________________________
___________________________________________________________________________________________
7-4 March 2009
Table 7.2 Types and Functions of Coastal Protection Structures
(Table VI-2-1 of the USACE Coastal Engineering Manual)
Type of structure Objective Principal Function
Sea dike
Prevent or alleviate flooding by the sea of low –lying land areas
Separation of shoreline from hinterland by a high impermeable structure that can resist flooding and moderate waves
Seawall Protect land and structures from flooding and overtopping and erosion
Reinforcement of some part of beach profile with an impermeable structure that can resist flooding, erosion and waves
Revetment Protect the shoreline against erosion
Reinforcement of some part of beach profile with a structure that can resist erosion and waves
Bulkhead Retain soil and prevent sliding of the land behind
Reinforcement of the soil bank
Groyne
Prevent beach erosion
Trap sediments at a littoral transport coast
Detached breakwater
Prevent beach erosion
Reduction of wave heights in the lee of the structure and reduction of alongshore transport of sediments
Reef breakwater Prevent beach erosion Reduction of wave heights at the shore
Submerged sill Prevent beach erosion Retain sand fill and retard offshore movement of sediment
Beach drain Prevent beach erosion Accumulation of beach material on the drained portion of beach
Beach nourishment Prevent beach erosion and protect against flooding
Artificial infill of beach to compensate for a deficit in the littoral budget, will be eroded by waves and currents
Dune construction Prevent beach erosion and protect against flooding
Artificial infill dune material to reinforce the dune against erosion and flooding
Breakwater
i) Shelter harbour basins, harbour entrances, and water intakes against waves and currents
Dissipation of wave energy and/or reflection of wave energy back into the sea
ii) Stabilize navigation channels at river mouths and tidal inlets
Confine streams and tidal flow. Protect against storm water and cross currents
Floating breakwater
Shelter harbour basins and mooring basins against short period waves
Reduction of wave heights by reflection and attenuation
Training walls
Prevent unwanted sedimentation or erosion and protect moorings against currents
Direct natural or man-made current flow by forcing water movement along the structure
Storm surge barrier
Protect estuaries against storm surges
Separation of estuary from the sea by an embankment with movable locks or gates
Scour protection Protect coastal structures against instability caused by seabed scour
Provide resistance to scour caused by waves and current

Chapter 7 HYDRAULIC DESIGN IN COASTAL ENGINEERING
___________________________________________________________________________________________
___________________________________________________________________________________________
March 2009 7-5
7.3 HYDRAULIC DESIGN CONSIDERATIONS AND RATIONALE
7.3.1 Principal Factors Affecting Hydraulic Design
There are numerous factors or parameters affecting hydraulic design of coastal protection works, namely:
– physical (topographic, bathymetric, geologic, sediment characteristics, sources and sinks) – climatic (wind, precipitation, temperature, pressure field)
– hydraulic/hydrologic (waves, tides, currents, river discharges, storms, sediment transport).
The principal factors or parameters are highlighted as below :
Winds
Wind data provides information on wind direction which can reasonably be related to wave direction. Wind data is often available over longer periods of time than wave data. It can be used as a a basis
on which to predict wave conditions when measured wave data is not available or to calibrate wave data if the latter is only available for a short period.
Care is required in the selection of location of wind records for the use in solving coastal engineering
problems. Inland location such as airport will not adequately represent wind conditions over the
ocean.
Where there is no or limited wave data, it is acceptable in design to use a time series of wind speed and directions, extending over several years if necessary, to hindcast wave heights, periods and
directions in deeper water off a coastline. Fore-casting or hindcasting curves of the form as in the
CEM form the basis of these calculations, relating wave properties to wind speed, fetch and duration. If some wave data is available, it can be used to calibrate the hindcast model. This process produces
a wave climate which can then be treated in the same way as the measured data and has the added advantage of containing directional information about the waves.
Waves
Waves records can be analysed and the results are presented in the form of the significant wave height, Hs (or H1/3 = average of highest one-third of all waves) and the zero-up-crossing period, Tz. Statistical analysis of the wave data can also be carried out to predict extreme values required in the design of structures. Design waves can also be obtained by wave hind casting technique from wind
data.
Due considerations have to be given to wave transformation and attenuation processes on the
deepwater waves such as wave refraction, shoaling, reflection, diffraction etc. which is then adopted for coastal engineering project planning and design. Waves often breaks well before reaching the
shoreline, thus creating a design wave based on depth-limited criteria, i.e. the highest waves ever to
be imparted on the shoreline or structure will depend on the ratio of wave height and available water depth (H/d) fronting the shoreline or the protective structure.
Tide Levels
Tide levels for Standard Ports can be calculated on the basis of the tidal harmonic data and are
available in published tide tables. They are used to derive the design water levels. High tide level
(MHWS or MHHW) are often used as the design stillwater level (SWL) to determine crest level of a structure and the low water levels are frequently used to determine the toe elevation of a structure.
During construction, the predicted tidal levels are important to enable proper planning for execution of the works.

Chapter 7 HYDRAULIC DESIGN IN COASTAL ENGINEERING
___________________________________________________________________________________________
___________________________________________________________________________________________
7-6 March 2009
Storm Surge
Storm surges are caused by high winds blowing over the ocean which create shear stress on the water surface, resulting in a change in the mean water surface slope. At the coastline, this normally
gives an increase in the local mean water level, to which there will be an additional rise of water level. The magnitude of the storm surge depends on the wind speed and direction.
Design Water Level
The design water level for coastal protection structures are generally derived from tidal levels plus storm surge, wave set-up, wave runup , and / or sea level rise due to climate change. Generally
MHWS/MHHW or HAT could be used as the design SWL, depending on the importance of the structure and/ or the acceptable tolerance or the facilities protected by the structures against wave
over-topping.
Combination of Extreme Events
The three dominant environmental design criteria are waves, tide level and storm surge but a key
consideration is the combined occurrence of these events. There is little fundamental physics available as yet on which to base a solution to the problem although clearly storm surge and wave
action are linked to general meteorological conditions. However, the combined probability of the
extreme events, say wave of 50-year return period, storm surge of 50-year return period and the HAT occurring at the same time is fairly remote. If data is available, it is quite feasible to analyse
wind/wave/storm surge/tide level combinations to produce an empirical relationship which at least clarifies the chance of total combination occurring and could indicate that a design criterion of 50
year-year wave plus 50- year surge plus HAT is unrealistically conservative.
An important factor in all of this is the margin of safety which a specific design has. One could test
all designs to a state of failure in an attempt to obtain an idea of a safety margin, which is possible in physical models.
Bathymetry & Topography
Topographic survey is a survey of land levels inland from the beach. Very often it is carried out to determine the profile of sea-bed at the nearshore area, except those areas where the water are too
deep for accurate topographic survey to be carried out.
The principal purpose of hydrographic survey is to secure information concerning the profile and
other physical features of water areas. Such information is essential for the planning and design of coastal engineering works, construction and determination of the quantities of the dredged
materials. The product of a hydrographic survey is a plan (or a chart) showing depths, heights, contours and irregularities, both below and above water level. This information is used for hydraulic
studies or model studies such as in the performance of the necessary wave transformation analysis.
Where time series information is available, it can be used to assess the causes and effects of coastal erosion/accretion.
The commonly used equipment in hydrographic survey is the echo-sounder. In sounding work,
parameters to determine the location of the vessel and depth are collected. However, water level varies continuously subject to the tide when sounding is in operation, hence it is important that the
vertical movement of the water level is recorded throughout the period of sounding.
An echo-sounder works by creating a sound-pulse and measuring the time that elapses from the
transmission of the pulse until it is reflected from the bottom and received back again. Hence the most important factor in echo-sounding is that the sound velocity is properly applied, which means
that it is necessary to measure the sound velocity accurately. For this purpose, a calibration check
has to be executed, preferably prior to and after survey each day. A common verification method used is the bar-check test, which is done by measuring the depth to a bar, that is held under the
survey vessel with wires, on known depths.

Chapter 7 HYDRAULIC DESIGN IN COASTAL ENGINEERING
___________________________________________________________________________________________
___________________________________________________________________________________________
March 2009 7-7
For topographic surveys, there is no doubt as to the datum to be used. In Malaysia, topographic
surveys are normally related to the Land Survey Datum. In hydrographic survey, it is usual practice
to reduce the soundings to a reference level called the Chart Datum. Chart Datum adopted by Malaysia is the Lowest Astronomical Tide. The main reason for such choice is that which concerns
practicality and safety of navigation. However, it is important to note that unlike Land Survey Datum, Chart Datum is not a uniform level plane and it varies along the coast.
For coastal protection works, the various design levels are normally related to Land and Survey
Datum. The main reason is that execution of most construction works is land-based, so are the
vertical control stations. However, tide levels in published tide tables are normally stated in Chart Datum. Hence it is important to obtain the relationship between the Land Survey Datum and the
Chart Datum of the project site, so that the design water level can be correctly established 7.3.2 Design Considerations The USACE Engineer Manual EM 1110 – 2 – 1414 draws out three main types of criteria related to a
functional design: 1. structural integrity – i.e. the structure’s ability to withstand the effects of extreme storms
without itself suffering significant damages;
2. functional performance – deals with the effectiveness of the structure at its intended function
3. constructability – relates to means, methods, materials, etc involved in the construction.
Other known criteria include environmental impact and life-cycle cost, which are sometimes
conflicting and add constraints (yet a challenge) to the designer.
(i) Structural Integrity
This criterion often constitutes the most important requirement to satisfy, in which the structure must be designed for it to be able to survive under extreme conditions without
sustaining significant damage. It determines the structure’s life-cycle costs to the extent that a certain level of investment is necessary to prevent damages from an extreme event.
This criterion also determines the expected repair costs during the project life. The conditions usually include wave conditions of high return period, say 50 or 100 years, or may
Structural integrity
Functional Performance
Constructability
Effectiveness of the structure
Means, methods, materials of construction
Ability to withstand extreme storms
Environmental Impact
Life-Cycle Cost
Figure 7.2 Design Considerations
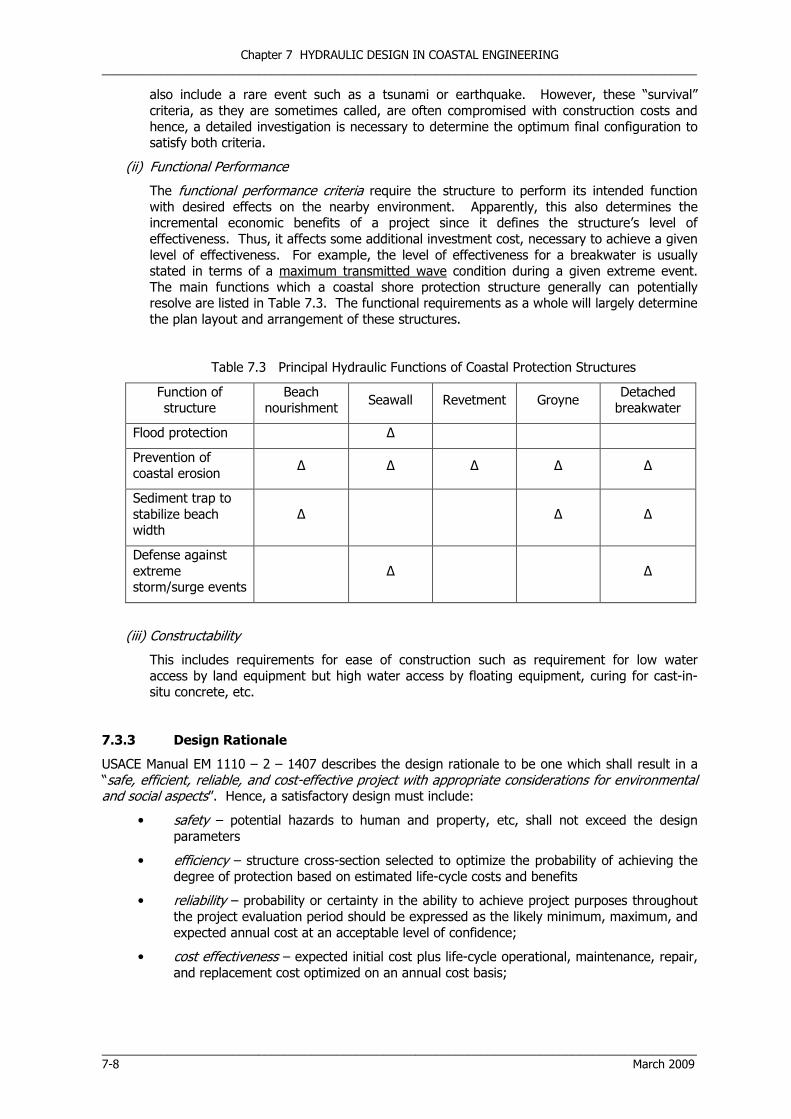
Chapter 7 HYDRAULIC DESIGN IN COASTAL ENGINEERING
___________________________________________________________________________________________
___________________________________________________________________________________________
7-8 March 2009
also include a rare event such as a tsunami or earthquake. However, these “survival”
criteria, as they are sometimes called, are often compromised with construction costs and
hence, a detailed investigation is necessary to determine the optimum final configuration to satisfy both criteria.
(ii) Functional Performance
The functional performance criteria require the structure to perform its intended function
with desired effects on the nearby environment. Apparently, this also determines the incremental economic benefits of a project since it defines the structure’s level of
effectiveness. Thus, it affects some additional investment cost, necessary to achieve a given
level of effectiveness. For example, the level of effectiveness for a breakwater is usually stated in terms of a maximum transmitted wave condition during a given extreme event.
The main functions which a coastal shore protection structure generally can potentially resolve are listed in Table 7.3. The functional requirements as a whole will largely determine
the plan layout and arrangement of these structures.
Table 7.3 Principal Hydraulic Functions of Coastal Protection Structures
Function of structure
Beach nourishment
Seawall Revetment Groyne Detached breakwater
Flood protection ∆
Prevention of coastal erosion
∆ ∆ ∆ ∆ ∆
Sediment trap to
stabilize beach width
∆
∆ ∆
Defense against
extreme storm/surge events
∆
∆
(iii) Constructability
This includes requirements for ease of construction such as requirement for low water
access by land equipment but high water access by floating equipment, curing for cast-in-situ concrete, etc.
7.3.3 Design Rationale
USACE Manual EM 1110 – 2 – 1407 describes the design rationale to be one which shall result in a
“safe, efficient, reliable, and cost-effective project with appropriate considerations for environmental and social aspects”. Hence, a satisfactory design must include:
• safety – potential hazards to human and property, etc, shall not exceed the design
parameters
• efficiency – structure cross-section selected to optimize the probability of achieving the
degree of protection based on estimated life-cycle costs and benefits
• reliability – probability or certainty in the ability to achieve project purposes throughout the project evaluation period should be expressed as the likely minimum, maximum, and
expected annual cost at an acceptable level of confidence;
• cost effectiveness – expected initial cost plus life-cycle operational, maintenance, repair,
and replacement cost optimized on an annual cost basis;

Chapter 7 HYDRAULIC DESIGN IN COASTAL ENGINEERING
___________________________________________________________________________________________
___________________________________________________________________________________________
March 2009 7-9
• environmental aspects – environmental enhancement opportunities, minimize adverse
ecological impacts, provide initial beautification efforts, and mitigate significant adverse
impacts.
• social aspects – reduce risk to life and property, enhance recreational opportunities, maintain community cohesion, preserve historic sites, and improve aesthetics.
7.4 COASTAL PROJECT PLANNING AND DESIGN
7.4.1 Hydraulic Design Process
Figure 7.3 shows a flowchart of a typical design process which is an iterative process covering eight
stages. Starting with the identification of the problem (e.g. inundation or shoreline erosion), the subsequent stages are determined by a series of decisions and actions at the preliminary design
stage before resulting in the creation of a structure/intervention at the final design stage to resolve the problem. Construction and maintenance (including monitoring and repair) of the structure need
to be considered during the design stage. Finally, rehabilitation, removal or replacement of the
structure, are also included in the design process.
Problem Identification (causes, type and scale of
problem)
Final Design
Generation of Alternative Solutions
Evaluation and Selection
Evaluation Criteria
- environment
- safety - economy
- social & recreation
Boundary Conditions
- topographic data
- bathymetric data - sediment data
- sea conditions (waves, tides, surges, currents)
Maintenance
Construction
Abandonment/Removal
Hydraulic & Coastal Morphological Study
Functional Analysis (functional requirements –
flooding/erosion)
Beachfill Breakwater Revetment/ Seawall
No-Project Groyne
Boundary Conditions
- Wind
- Water levels - Waves - Currents
Figure 7.3 Design Process Flowchart

Chapter 7 HYDRAULIC DESIGN IN COASTAL ENGINEERING
___________________________________________________________________________________________
___________________________________________________________________________________________
7-10 March 2009
7.4.2 Planning Stage
Once a coastal problem has been identified (e.g. inundation or shoreline erosion), a number of stages can be distinguished in the planning stage. A diagrammatical sketch of a typical flow process
in coastal project planning is illustrated in Figure 7.4. At this stage, initial studies comprising of a system analysis during the pre-feasibility studies is necessary. The outcome of the pre-feasibility
study will be a layout of the various alternatives before a preliminary design is proposed. Upon approval of the conceptual design, a detailed evaluation of the design shall be conducted at the
feasibility level. This may include a hydraulic study, incorporating numerical and/or physical models,
to establish the existing coastal processes as well as to make near-accurate predictions for environmental impact assessments. Results of the Hydraulic Study may be used to derive design
parameters and also serve as baseline information for monitoring during the Operations and Maintenance stage.
Throughout the planning stage, the design engineer is responsible for developing the design rationale and sufficient alternative plans in order to achieve an optimum economic plan and where
environmental consequences are understood. The following list summarizes the steps necessary to
achieve this plan:
• Review appropriate manuals, technical reports and guidelines
• Collect and analyze environmental data
• Conduct baseline studies
• Analyze the no-project option
FUNCTIONAL REQUIREMENTS
OBJECTIVES
•Shoreline Stabilisation •Backshore Protection
PLANNING Stage
DESIGN Stage
CONSTRUCTION Stage
OPERATION & MAINTENANCE
Stage
FEASIBILITY
Study
Pre-Feasibility Study/System
Analysis
Hydraulic Study
Numerical Model
Physical Model
DETAILED DESIGN
PRELIMINARY DESIGN
EIA
Monitoring
Figure 7.4 Typical Process Flow in the Planning and Design of Coastal Shore Protection Projects

Chapter 7 HYDRAULIC DESIGN IN COASTAL ENGINEERING
___________________________________________________________________________________________
___________________________________________________________________________________________
March 2009 7-11
• Assess environmental impacts
• Optimize project and/or impose mitigation measures
• Develop O & M and periodic monitoring plans
• Select and develop the recommended plan.
7.4.2.1 System Analysis and Pre-Feasibility Studies
Analysis of coastal dynamics is difficult due to the complex interactions that result in shoreline
responses of varying nature. There is also inter-dependence between various physical features that make up the natural system, such that the changes of one particular element of the coast are
influenced by the changes in adjacent areas. Boundaries need to be determined so that all existing physical features can be identified before a solution is proposed for the area. Figure 7.5 illustrates
schematically the inter-relationship between land-sea system interactions so that a good
understanding of the whole ecosystem affecting and being affected by the project can be further appreciated.
Figure 7.5 Land-Sea Interactions in the Coastal Zone
A ‘system analysis’ involves identifying the different elements that make up the coastal physical system and developing an understanding of how these elements interact. To arrive at a technically
and environmentally satisfactory design, the designer must understand each element and its
interactions, and how they affect the system and its surrounding systems. The region of interest should not be localized at the problem site only. It should include a large context within which to
interpret results on larger spatial scales and over longer periods. The boundaries are chosen so that all existing physical features be identified before a solution is proposed for the area. For example, a
beach drainage system may not work well if there are sediment trap structures in the updrift such as
a training jetty or groynes or maybe, a submarine canyon offshore the project area.
Preliminary to a pre-feasibility study, a site evaluation (reconnaissance survey) is essentially the first step to determine what type of shore protection measure is most appropriate for the problem area.
Ideally, an entire section of shoreline should be evaluated for determining the natural processes as
Note:
Fresh Water System
Land System
Coastal Water System
Shoreline System
Water, Sediment, Pollutants
Hydraulic Condition
Sediment Flows
Water Quality And Hydraulic
Conditions Flooding Level /
Frequency
Flooding Level /
Frequency Sediments Pollutants
NATURAL SYSTEM
SOCIO-ECONOMIC SYSTEM
Levels and Spatial Pattern of Activities/Facilities, Industry,
Agriculture, Mining, Recreation, Residential, Flood Protection, etc
IMPACTS
Economic
Social
Institutional
Physical
Environmental
AGENTS OF CHANGE
Demand Driven
Natural Processes
Climate Change Factors

Chapter 7 HYDRAULIC DESIGN IN COASTAL ENGINEERING
___________________________________________________________________________________________
___________________________________________________________________________________________
7-12 March 2009
well as identifying presence of human interventions in the system. The key elements of the site
evaluation will include (though not limited to) the following:
(i) Determine soil characteristics
(ii) Estimate slope angle and height of berm (iii) Observe drainage patterns
(iv) Identify existing vegetation (v) Describe existing coastal structures
(vi) Characterise shoreline erosion
(vii) Describe waves and surges
The following list provides a general guide to creating a simple workplan before the pre-feasibility stage:
Shore type □ High erodible bluff (> 10m high) □ Low erodible bluff (3m – 10m high)
□ Low erodible plain (< 3m high) □ Wetlands/mangrove area
Shore Profile □ Avg. shore/beach width ______________ □ Avg. beach slope ________________
□ Avg distance of properties/structures from HW ___________
Soil characteristics □ Sand
□ Sand and gravel □ Mixed layers of sand, silt and clay
□ Gravel and rock □ Others (specify) ___________________________________
Wave/ Human action
□ Are waves eroding the beach? ( Y / N ) □ Are waves eroding the base of the berm/bluff during storms? (Y / N )
□ Any presence of beach scarps? ( Y / N)
□ Any shore protection structure present within the locality? (Y / N ) □ Any shore protection structure present within the neighbourhood? (Y / N )
Drainage patterns □ Does stormwater flow out of the face of the bluff? ( Y / N) □ Are the effects of the following visible on the beach?
- Stream meanders ( Y / N ) - Outfall discharges ( Y / N )
□ Presence of a river mouth ? ( Y / N)
Vegetation type What vegetation types are (or were) found on the top, face or toe of the
berm? □ trees or woods
□ shrubs
□ grass □ Others (specify) ___________________________________
7.4.2.2 Feasibility Study
The objective of the feasibility study is to determine the various feasible methods of coastal
protection works. It is also the objective of the Study to develop a plan in an effort to provide a conceptual design of the most suitable shore protection work inclusive of drawings and preliminary
cost estimates. The study will indicate the time, manpower, cost and scheduled completion of the
various design studies to be performed throughout the stages of project development. Coordination
with other disciplines such as ecologists, planners, architects, etc, may be necessary to ensure that the various technical information are sufficient and the outputs from the studies are essential.

Chapter 7 HYDRAULIC DESIGN IN COASTAL ENGINEERING
___________________________________________________________________________________________
___________________________________________________________________________________________
March 2009 7-13
Where there is a need for physical and numerical model studies, these should be provided early in
the study plan. The analysis and presentation will then include a shore protection plan comparison
on the basis of the following elements: • Estimate of most likely future conditions with no-project option (i.e. amount of shoreline
retreat, the depth and extent of flooding, the extent of damaging wave action, and
frequency of damaging events should that happen over the project evaluation period); • Significant environmental degradation predicted;
• Economic and environmental values of mitigating such events.
At the feasibility stage, a full range of alternatives need to be considered. Figure 7.6 shows some of
the common types of coastal shore protection works installed along our shoreline. Table 7.4 indicates some of the more common alternative measures for shore protection, their applications
(where it works and where it doesn’t), probable neighbouring impacts and the degree of construction (including costs) anticipated. At this stage, explicit trade-offs between initial investment cost and
maintenance, repair, replacement, and major rehabilitation costs should be considered before the
final option is recommended.
7.4.2.3 Hydraulic Study
Physical processes responsible for coastal erosion and flooding are complex, difficult to measure and
complicated by the interaction of several environmental forces. Hence, understanding the fundamental nearshore processes is first and foremost important before implementing any form of
mitigating measure. The study shall attempt to identify causes of the problem by analyzing the role of nearshore physical processes, inlet-beach interaction, regional geology, and shoreline geometry.
Results from this study will provide managers, engineers, and policy makers with scientific information to make wise decisions necessary to produce an effective design.
The scope of study will usually comprise the following: 1) Inspect the site and infer from field observations the existing regime conditions of the sea, the
soil cover types, the locations and extent of activities taking place, identify the inflow pattern (due to tides) and other streams within the project site.
2) Collect and compile existing data on tide condition, seabed bathymetry (via data obtained from the hydrographic survey and established charts) and waves, required as boundary inputs for
the computer model where necessary.
3) Conduct field measurements of currents and water levels for calibration and verification purposes in the computer modeling work.
4) Assess, via a wave simulation model, the wave refraction and wave height distribution pattern for the proposed beach layout under normal and extreme wave conditions.
5) Assess, through computer modeling techniques, and recommend the most acceptable criteria
for the design of the beach nourishment, shore protection structures, etc.
For a more accurate and efficient design, the following tools should be made available in a hydraulic
study: - Field measurements
- Knowledge (theory and experience)
- Models (physical and numerical)
Field measurements will be carried out to establish the baseline information on the physical characteristics of the project site. These shall include:
(i) Bathymetric Survey Data
Prior to making any hydraulic assessment, a detailed survey of the beach profile along the
proposed project site shall be required. The survey shall be conducted at 50m section intervals within the boundary limit of at least 1 km to the right and left of the proposed site.

Chapter 7 HYDRAULIC DESIGN IN COASTAL ENGINEERING
___________________________________________________________________________________________
___________________________________________________________________________________________
7-14 March 2009
Closer intervals are required where there is presence of obvious physical features e.g. bank
erosion, sewerage outfalls, etc. Along each section interval, depth measurements close to
the High Water Line are required at intervals of 50m or less for a distance of at least 1 km to the sea. All survey data must be in MRSO coordinates and in ASCI x-y-z format. The survey
shall be conducted by a licensed surveyor where data from the survey shall then be used as input into the computer model as well as in the appraisal of the beach profile changes.(Note:
when bathymetric data from admiralty chart is used as input in the computer modeling, the chart coordinates have to be converted to MRSO coordinates.)
Figure 7.6 Some Examples of Coastal Protection Works in Malaysia
Shore Protection Works at Kg. Padang Garam (the rivermouth in the background)Rock revetment at Kuala Kedah Precast concrete revetment at Tg. Kling, Melaka
Stone block seawall at Port Dickson Gabion seawall at Port Dickson
Detached offshore breakwater at Langkawi Groynes

Chapter 7 HYDRAULIC DESIGN IN COASTAL ENGINEERING
___________________________________________________________________________________________
___________________________________________________________________________________________
March 2009 7-15
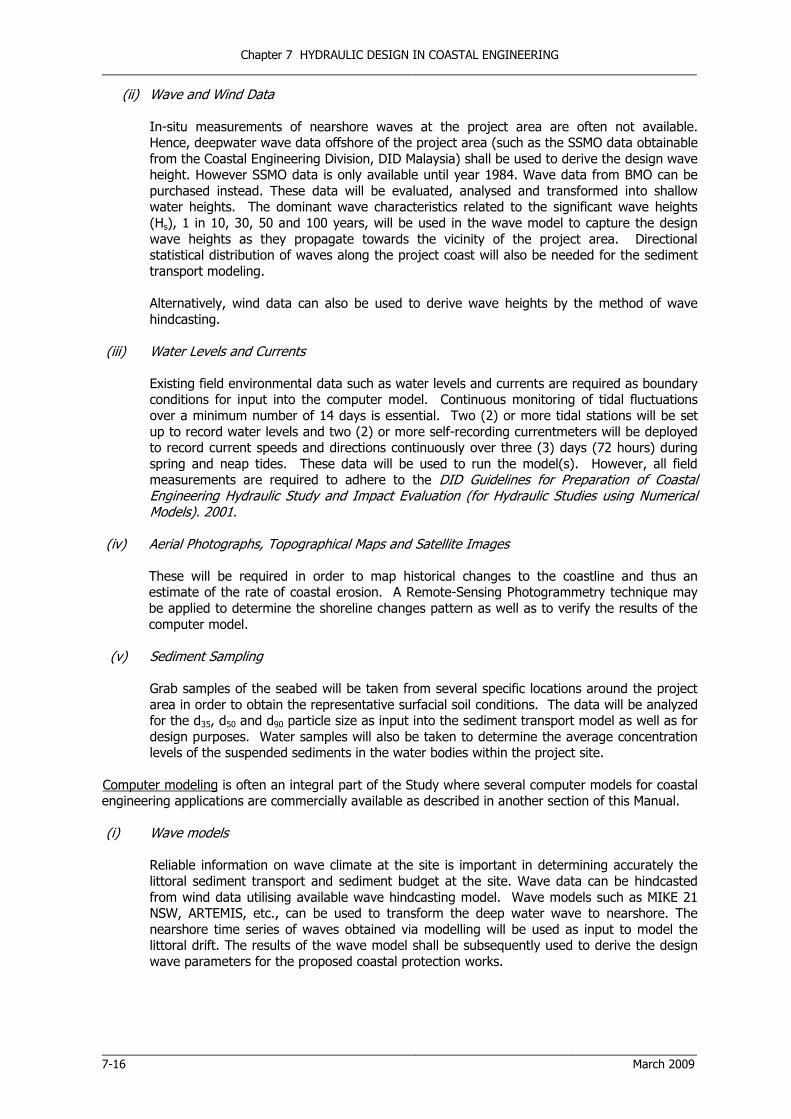
Chapter 7 HYDRAULIC DESIGN IN COASTAL ENGINEERING
___________________________________________________________________________________________
___________________________________________________________________________________________
7-16 March 2009
(ii) Wave and Wind Data
In-situ measurements of nearshore waves at the project area are often not available. Hence, deepwater wave data offshore of the project area (such as the SSMO data obtainable
from the Coastal Engineering Division, DID Malaysia) shall be used to derive the design wave height. However SSMO data is only available until year 1984. Wave data from BMO can be
purchased instead. These data will be evaluated, analysed and transformed into shallow water heights. The dominant wave characteristics related to the significant wave heights
(Hs), 1 in 10, 30, 50 and 100 years, will be used in the wave model to capture the design
wave heights as they propagate towards the vicinity of the project area. Directional statistical distribution of waves along the project coast will also be needed for the sediment
transport modeling.
Alternatively, wind data can also be used to derive wave heights by the method of wave
hindcasting.
(iii) Water Levels and Currents
Existing field environmental data such as water levels and currents are required as boundary conditions for input into the computer model. Continuous monitoring of tidal fluctuations
over a minimum number of 14 days is essential. Two (2) or more tidal stations will be set
up to record water levels and two (2) or more self-recording currentmeters will be deployed to record current speeds and directions continuously over three (3) days (72 hours) during
spring and neap tides. These data will be used to run the model(s). However, all field measurements are required to adhere to the DID Guidelines for Preparation of Coastal Engineering Hydraulic Study and Impact Evaluation (for Hydraulic Studies using Numerical Models). 2001.
(iv) Aerial Photographs, Topographical Maps and Satellite Images
These will be required in order to map historical changes to the coastline and thus an estimate of the rate of coastal erosion. A Remote-Sensing Photogrammetry technique may
be applied to determine the shoreline changes pattern as well as to verify the results of the
computer model.
(v) Sediment Sampling
Grab samples of the seabed will be taken from several specific locations around the project
area in order to obtain the representative surfacial soil conditions. The data will be analyzed for the d35, d50 and d90 particle size as input into the sediment transport model as well as for
design purposes. Water samples will also be taken to determine the average concentration levels of the suspended sediments in the water bodies within the project site.
Computer modeling is often an integral part of the Study where several computer models for coastal engineering applications are commercially available as described in another section of this Manual.
(i) Wave models
Reliable information on wave climate at the site is important in determining accurately the
littoral sediment transport and sediment budget at the site. Wave data can be hindcasted
from wind data utilising available wave hindcasting model. Wave models such as MIKE 21 NSW, ARTEMIS, etc., can be used to transform the deep water wave to nearshore. The
nearshore time series of waves obtained via modelling will be used as input to model the littoral drift. The results of the wave model shall be subsequently used to derive the design
wave parameters for the proposed coastal protection works.

Chapter 7 HYDRAULIC DESIGN IN COASTAL ENGINEERING
___________________________________________________________________________________________
___________________________________________________________________________________________
March 2009 7-17
Two-dimensional wave propagation models are also used to provide the wave refraction
pattern as well as to generate the nearshore wave propagation pattern at the project site(s),
i.e. to simulate the wave orbital velocities leading to wave-induced cross-shore sediment transport in the area. Results of the wave refraction analysis will be used to determine the
wave energy distribution and thus areas of high energy potential could be identified. Where necessary, waves may be modeled at the local grid level so that effects of wave diffraction
and refraction are taken into consideration. Wave diffraction contributes to the sediment transport capacity in the leeward zones of the protection schemes. As such, the design of an
offshore breakwater or a beach nourishment scheme could be optimized and proper
mitigating measures could be recommended to reduce losses.
(ii) Hydrodynamic models
2D hydrodynamic modeling is important to account for current flows. A coarse grid model is
to be set up to transfer tidal information to the local area i.e. area of interest. Detailed current modeling for the local grid model with a probable grid spacing of 10 m is deemed to
be sufficiently fine to resolve the foreshore bathymetry and wave driven currents. The output of the model shall be detailed combined wave driven and tidal current fields.
Modelling shall be done for both monsoon and off-monsoon conditions. All computer modeling work are required to refer to the DID Guidelines for Preparation of Coastal Engineering Hydraulic Study and Impact Evaluation (for Hydraulic Studies using Numerical Models) 2001.
(iii) Sediment transport models
A sediment budget for the study area needs to be determined to create baseline conditions
for the area. Sediment budget within a littoral cell can be analyzed using a one-dimensional sediment transport model. Using the wave climate derived from the wave study, the
sediment transport model may be set up to study the littoral transport along the shoreline. The results may not only be used to determine the coastal sediment budget but shall also
provide information on the cross-shore distribution for the alongshore transport as well as variations in transport e.g. during monsoons and annual transport changes. The cross shore
distribution of alongshore sediment transport has a great influence on the dimensioning of
coastal protection structures such as groynes and offshore breakwaters. The modeling results shall also be used to make a preliminary assessment of suitable coastal protection
options.
The various coastal protection options can be tested in the model set-up to assess the
efficiency of each option as well as potential impact on the adjacent shoreline. Coastline evolution models can be used to simulate the shoreline evolution for the various options to
ascertain erosion areas which may require localized mitigation measures such as revetment or beach nourishment. The cross-shore sediment loss of any beach nourishment works can
also be investigated.
Hydraulic Appraisal and Recommendations
The Hydraulic Study will also provide an appraisal of the existing physical site conditions and make recommendations on the most appropriate shore protection works based on the hydraulic
assessment carried out. The appraisal will include:
a) Description of the Existing Coastal and Hydraulic Environment
• Coastal Topography
• Offshore and Nearshore Bathymetry
• Soil Conditions
• Oceanography
• Coastal Processes and Morphology

Chapter 7 HYDRAULIC DESIGN IN COASTAL ENGINEERING
___________________________________________________________________________________________
___________________________________________________________________________________________
7-18 March 2009
b) Determination of the maximum velocity of currents and wave parameters for design
purposes.
c) Quantification of littoral transport, direction, etc. and the effect of littoral currents on
the proposed project in terms of accretion and erosion, sediment budget, and geomorphologic changes.
e) Recommendations for shore protection work design:
• Determination of design platform level based on hydraulic considerations.
• Determination of design wave parameters.
• Determination of the most optimum sediment grain size required for the beach fill
materials (for beach nourishment works).
• Shore protection measures required for the critical erosion and sand losses
projected. • System performance monitoring and management programmed.
7.5 HYDRAULIC BOUNDARY CONDITIONS
It is imperative that for the structure to serve its functional objective, all information related to the hydraulic boundary conditions must be obtained (see Figure 7.7). These represent the critical
threshold combinations of tide levels, surge levels, wave conditions, etc, which, if overlooked, may endanger the project and thus cause the structure to be non-functional during its design life.
Variations in water levels are due to meteorological (storm surge, wind set-up, seiches), astronomical (tide) and seismic (tsunami) influences. Tides are a long wave phenomenon and can lead to a
considerable amplification of tidal levels in shallow seas and estuaries. Tsunamis, however, are only
important design consideration in and around tsunami high risk areas.
It is noted that in the hydraulic design of a coastal shore protection project, the most important element in the process flow is the determination of the design water level and wave parameters. In
this context, it is helpful to use the flow chart in Figure 7.8 as a guide in understanding the flow of
the computation. This figure indicates the possible combinations of two or more parameters that together may determine the design hydraulic loading of a structure. For example, water level and
wave run-up will determine the required crest level of a seawall or revetment.
Generally, water levels and waves cannot be considered independent of each other. Water levels control flooding and stability of the structure due to wave exposure. When water level rises, the
structure will be exposed to larger waves and it also determines where waves break and lose most of
their energy (Figure 7.9). In shallow water, water levels have a direct impact on wave conditions, particularly when waves are near the point of depth-limited breaking. On the other hand, waves can
also have an impact on water level, such as in the surf zone where wave-induced set-up can raise the local water level by significant amounts. These often result in increased forces on the structure
and consequently overtopping may damage the structure including areas behind it.

Chapter 7 HYDRAULIC DESIGN IN COASTAL ENGINEERING
___________________________________________________________________________________________
___________________________________________________________________________________________
March 2009 7-19
(*) Note: Incorporating tsunami effect may lead to an uneconomical design, hence this should be considered only in high tsunami risk areas.
Figure 7.7 Hydraulic Boundary Conditions
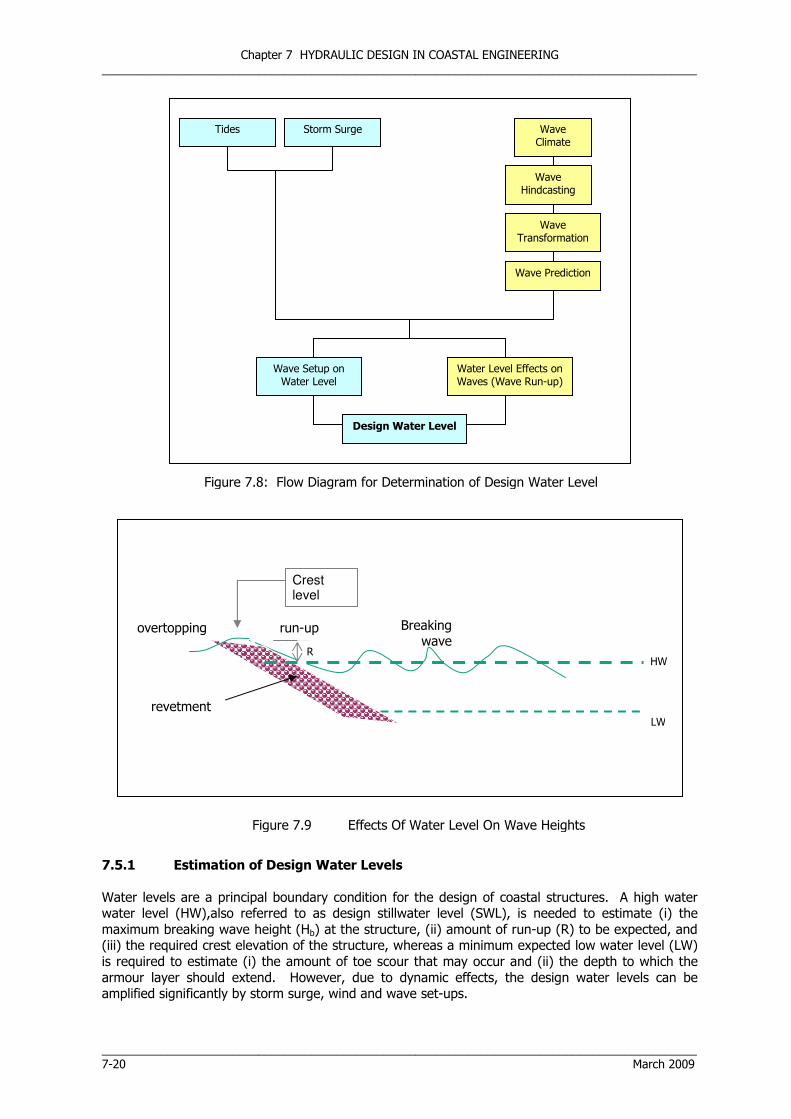
Chapter 7 HYDRAULIC DESIGN IN COASTAL ENGINEERING
___________________________________________________________________________________________
___________________________________________________________________________________________
7-20 March 2009
LW
HW
revetment
overtopping run-up Breaking wave
Crest level
LW
R
7.5.1 Estimation of Design Water Levels Water levels are a principal boundary condition for the design of coastal structures. A high water water level (HW),also referred to as design stillwater level (SWL), is needed to estimate (i) the
maximum breaking wave height (Hb) at the structure, (ii) amount of run-up (R) to be expected, and (iii) the required crest elevation of the structure, whereas a minimum expected low water level (LW)
is required to estimate (i) the amount of toe scour that may occur and (ii) the depth to which the
armour layer should extend. However, due to dynamic effects, the design water levels can be amplified significantly by storm surge, wind and wave set-ups.
Figure 7.8: Flow Diagram for Determination of Design Water Level
Figure 7.9 Effects Of Water Level On Wave Heights
Tides Storm Surge
Wave Climate
Wave Transformation
Wave Hindcasting
Wave Prediction
Wave Setup on Water Level
Water Level Effects on Waves (Wave Run-up)
Design Water Level

Chapter 7 HYDRAULIC DESIGN IN COASTAL ENGINEERING
___________________________________________________________________________________________
___________________________________________________________________________________________
March 2009 7-21
(a) Storm surge
Storm surge is of greatest concern in design and is the cause of one of the world’s disastrous flooding and coastal damages. The recent events in the New Orleans, USA, caused by the
hurricanes of Katrina were due to storm surge generated by passing cyclones in the Gulf of Mexico. Similar but of lesser magnitude was that of the Greg Storm which passed by the northern coastline
of Sabah in 1998.
(b) Wind set-up During storm surge, the water level at the shore will be raised by the wind (Figure 7.10), and may be represented by a simple equation:
d S = ζ (U cos φ )2 ......................................(7.1)
d x g D
where
(c) Wave Setup
Wave setup is defined as the super-elevation of the mean water level caused by wave action alone. When waves break on a slope, there is a decrease in the mean water level just prior to breaking,
with a maximum depression or set-down at about the breaking point. From the breaking point shoreward, the mean water level slopes upward to the point of intersection with the shore, that is
known as wave setup. Figure 7.11 provides a definition sketch of a wave setup.
The net wave setup, Sw, at the shore is
Sw= ∆S - Sb ..................................................................(7.2) Laboratory experiments have shown that
∆S= 0.15 db (approximately).............................................(7.3) and Sb = - ...................................................(7.4)
D S U
d
SWL
Figure 7.10 Definition Sketch Of A Storm Surge
g1/2 Ho’2 T
64 π db3/2
S = storm surge (the setup of the water level by the wind)
X = distance over which the storm surge is calculated
ζ = constant ( = 3.2 x 10⁻⁶)
U = wind speed
φ = angle between wind direction and the x-axis D = new depth of water ( = d + S)

Chapter 7 HYDRAULIC DESIGN IN COASTAL ENGINEERING
___________________________________________________________________________________________
___________________________________________________________________________________________
7-22 March 2009
db, Hb, Ho’ and T are related to the beach slope, m, where db and Hb may be obtained from Figures 2-72 and 2-73 of the Shore Protection Manual (1984). Figure 3-50 of SPM is then used to read off the value of Sw/Hb for various values of m.
Referring to the wave conditions at the breaker line, a first approximation of the maximum set-up
can also be derived as follows:
Sb = 0.3 γb Hb ........................................................... (7.5)
where:
γb = breaker index or maximum H/d ratio
Hb = wave height at the breaker line
7.5.2 Determination of Design Wave Parameters
In designing a shore protection structure, wave height is the most important factor. An overly
conservative design wave height will greatly increase the cost of the project and making it uneconomical, whereas underestimating it could result in catastrophic failure. Hence, it is necessary
to apply the long-term statistical analysis to determine the long-term wave height, normally
expressed as Hs. Extreme value distributions such as the Gumbel or Weibull distributions may be used to fit the measured data to obtain wave heights for return periods greater than the record
length by extrapolation. On the other hand, short-term wave statistics may also be used to
Figure 7.11 Wave Set-up and Set-down

Chapter 7 HYDRAULIC DESIGN IN COASTAL ENGINEERING
___________________________________________________________________________________________
___________________________________________________________________________________________
March 2009 7-23
determine Hs which is commonly described by the Rayleigh distribution. Alternatively, where long
series of measured wave data are scarce, wave hindcasts may be used instead in which waves are
derived from measured wind data.
Figure 7.12 shows the process flow to determine the design wave height. Before the selection of the design wave height, the various wave heights need to be determined:
• Wave Height in shallow water through the Transformation Process (Hi)
• Duration vs Fetch-Limited Wave Height
• Depth-limited Wave Height
• Maximum Wave Height (Hmax)
Engineers are advised to refer to several guidelines and manuals as listed in Section 7.7 for further
reading and a better understanding of the various wave theories and the wave transformation
principles.
````````````````````````````````````````````````````````````
7.6 DATA REQUIREMENTS AND FIELD INVESTIGATIONS
7.6.1 Data Requirements
In the planning and design of coastal shore protection projects, it is important to know the environmental forces (wind, wave, tides, currents, etc) in order to be able to describe the various
coastal processes in the nearshore area, and then proceed to design coastal or marine structures or
perform management plans that are both functionally and structurally successful and practical.
Significant Wave Heights
Hs, H1/3, H10 Wind Data U, t, F
Wave Data (deepwater) Ho, To, αo
Hindcasting
Wave Heights at various return periods
H30, H50, H100
Incident Wave Heights, Hi
Design Wave Heights
Hmax , Hdes
Statistical Analysis
Prediction
Transformation
Structure-Hydraulic Response
Water level (local) d
Structure, Beach slope, structure slope,
permeability Shoaling Refraction Diffraction Ks, Kr, Kd
Breaking Reflection
Runup/Rundown Overtopping
Figure 7.12 Design Wave Height Determination Process

Chapter 7 HYDRAULIC DESIGN IN COASTAL ENGINEERING
___________________________________________________________________________________________
___________________________________________________________________________________________
7-24 March 2009
Each coastal project at different location has its own unique characteristics, and this implies the
variability of the environmental variables – wind, waves, currents and tides. Apart from these, other factors are:
- the local topography and bathymetry - the design depth
- the type of waves, its magnitude and variations. - the pattern of local wind, and its seasonal variations and
- the magnitude of the prevailing ocean and nearshore current patterns and its
directional characteristics.
Type of data, parameters and analysis required for coastal project design are listed out in Table 7.5 and diagrammatically shown in Figure 7.13 to describe the type of data that need to be synthesized
for the design parameters.
Table 7.5 Data Requirements for a Simple Coastal Structure Design (from Kamphuis, 2000)
1. Wave data - Short-term wave spectra (measured or hindcast) - Long-term distributions of wave height, period and direction
(usually hindcast)
- data for major storms 2. Meteorological data
- Wind (speed, direction and frequency of occurrence) - Barometric pressure
- Storms (tracks, frequencies)
- Extreme values 3. Water level data
- Tides and storm surges - Seasonal and annual fluctuations
- Water level fluctuations due to climate change (sea level rise) 4. Current data
- Tidal, wind-driven and wave-driven currents
5. Hydrographic data - Sufficient resolution in time and space
- Above water, through the breaker zone and in deeper water 6. Sediment transport and Morphology data
- Rates, directions
- Erosion - Accretion 7. Environmental data
- Water quality - Habitat
8. Sociological data - Land use - Economic impact
9. Historical data - Extreme water levels (high and low)
- Major erosion and accretion events - Old charts and paintings, maps, photographs and air photos
10. Materials data - Availability, quality and cost
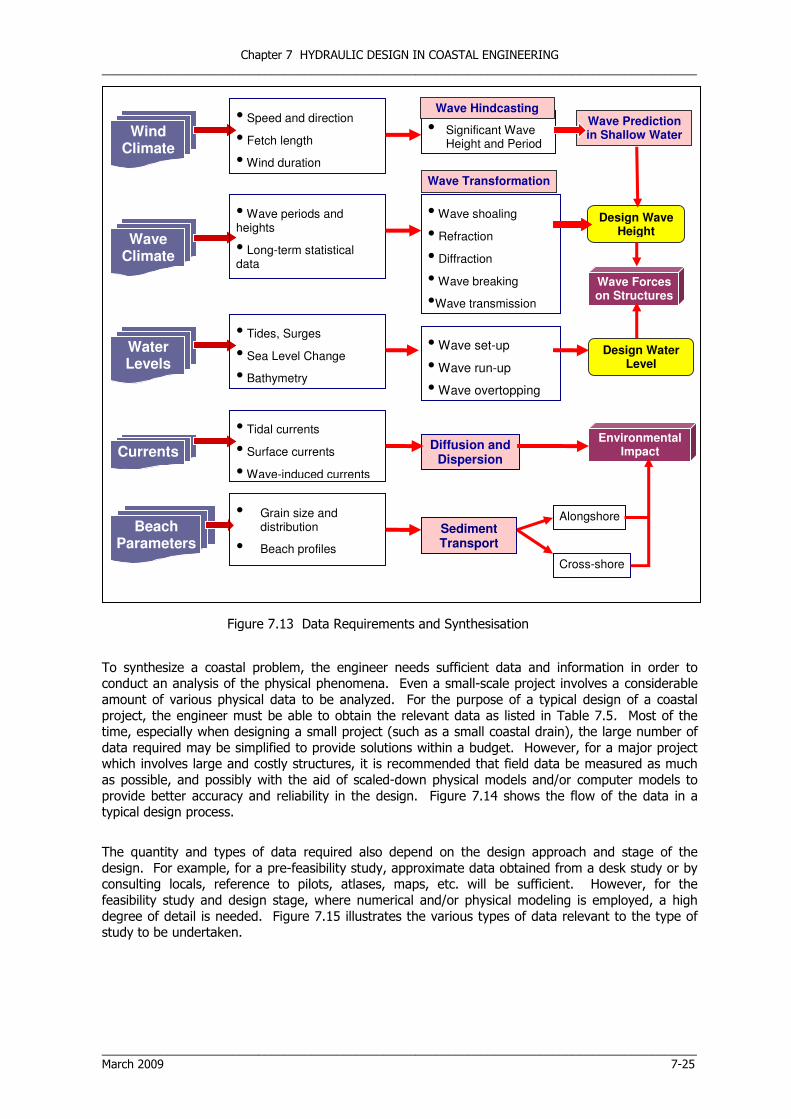
Chapter 7 HYDRAULIC DESIGN IN COASTAL ENGINEERING
___________________________________________________________________________________________
___________________________________________________________________________________________
March 2009 7-25
To synthesize a coastal problem, the engineer needs sufficient data and information in order to conduct an analysis of the physical phenomena. Even a small-scale project involves a considerable
amount of various physical data to be analyzed. For the purpose of a typical design of a coastal
project, the engineer must be able to obtain the relevant data as listed in Table 7.5. Most of the time, especially when designing a small project (such as a small coastal drain), the large number of
data required may be simplified to provide solutions within a budget. However, for a major project which involves large and costly structures, it is recommended that field data be measured as much
as possible, and possibly with the aid of scaled-down physical models and/or computer models to
provide better accuracy and reliability in the design. Figure 7.14 shows the flow of the data in a typical design process.
The quantity and types of data required also depend on the design approach and stage of the
design. For example, for a pre-feasibility study, approximate data obtained from a desk study or by consulting locals, reference to pilots, atlases, maps, etc. will be sufficient. However, for the
feasibility study and design stage, where numerical and/or physical modeling is employed, a high
degree of detail is needed. Figure 7.15 illustrates the various types of data relevant to the type of study to be undertaken.
Wind Climate
Wave Climate
Water Levels
Beach Parameters
Currents
Sediment Transport
Wave Forces on Structures
Design Wave Height
Design Water Level
Diffusion and Dispersion
Environmental Impact
Alongshore
Cross-shore
• Tides, Surges
• Sea Level Change
• Bathymetry
• Speed and direction
• Fetch length
• Wind duration
• Wave periods and heights
• Long-term statistical data
•
• Grain size and distribution
• Beach profiles
• Tidal currents
• Surface currents
• Wave-induced currents
• Wave shoaling
• Refraction
• Diffraction
• Wave breaking
•Wave transmission
Wave Transformation
• Wave set-up
• Wave run-up
• Wave overtopping
• Significant Wave Height and Period
Wave Prediction in Shallow Water
Wave Hindcasting
Figure 7.13 Data Requirements and Synthesisation

Chapter 7 HYDRAULIC DESIGN IN COASTAL ENGINEERING
___________________________________________________________________________________________
___________________________________________________________________________________________
7-26 March 2009
Figure 7.15 Types of Data Relevant To Studies Undertaken
KNOWLEDGE (Theory and practice)
PROTOTYPE DATA (Field
measurement)
Surveys (Bathymetric,
topographic, remote-sensing, aerial photos)
SECONDARY DATA (Official reports,
published data, etc)
DESK STUDY
PRELIMINARY DESIGN
FEASIBILITY STUDY
MODELS (Numerical/ Physical)
Physical
Numerical
DETAILED DESIGN
PLANNING
MONITORING
DESIGN
Prediction of: Waves; Water levels; Currents; Sediment transport Shoreline
changes
Numerical/ Analytical Model
Physical Model
Derivation of:
•Design Wave Height
•Design Water levels
•Design Cross-section
Hydraulic Boundary Conditions
Optimisation and Selection of Final
Solution
Detailed Design
Data Required:
•Waves
•Water levels
•Currents •Wind
•Bathymetry
Hydraulic Study
Preliminary Design
EIA Study
Feasibility Study Supervision of
Works
CONSTRUCTION
Environmental Assessment
Figure 7.14 Data Flow in Design Process

Chapter 7 HYDRAULIC DESIGN IN COASTAL ENGINEERING
___________________________________________________________________________________________
___________________________________________________________________________________________
March 2009 7-27
7.6.2 Field Investigations
Physical data of the site (bathymetric, topographic, meteorological, hydraulic and geotechnical) is required to define the existing boundary conditions for design. Various types of instrumentation for
data collection are available and are described in several technical manuals. However, these descriptions are in general form, thus for technical specifications of specific equipment, the engineer
should consult the manufacturer’s brochures and manuals. The types of instruments available for field data collection are briefly described in Table 7.6.
(a) Water Level Measurements (b) Current Measurements
(c) Wave Measurements
Table 7.6 Types of Measuring Instruments for Field Investigations
Instrument Name Application Brief Description
1) Pressure Transducer • For measuring total pressure
• Analysis of instantaneous
pressures gives measure of
wave height/period
• Analysis of time-averaged
pressure gives measure of water depth.
Need to be mounted on a
suitable platform, e.g.
structure, frame, tethered buoy, etc. Not suitable for use
at depths > 20m. Transducers on free-standing
frames may not represent the
water depth accurately if the frame settles into the seabed
due to scour action. Accuracy for depth is 1 – 2%. Accuracy
for wave height is 10 – 15% for waves of period 6s in depth of
5m.
2) Current meter (Propeller-type)
To measure current strength and direction in the nearshore and
offshore areas.
The currentmeter and sinker weights (or anchor) need to be
deployed by boat.
3) Acoustic Doppler Current Profiler (ADCP)
To measure horizontal velocities along the vertical profile of the
water column, based on the
Doppler shift frequency of an acoustic signal due to the moving
water.
Current speeds can be measured at vertical intervals of
0.5m, within a range of 2m at
the top and 1.5m from the bottom
4) Float tracking To observe tidal flow patterns over
an area. Analysis of float positions
at given times enables near-surface tidal velocity and direction to be
determined.
Floating objects (ping pong
balls, polystyrene panels may
be deployed. GPS and stop-watch are used to measure the
surface velocities.
5) Directional wave buoy To measure offshore wave conditions – wave height, period
and direction
Typically deployed for a period of at least 12 months, with
measurements every 3 hrs. Need min. water depth of about
8 m in order to operate. Not
accurate for wave periods < 2 s or > 30 s.

Chapter 7 HYDRAULIC DESIGN IN COASTAL ENGINEERING
___________________________________________________________________________________________
___________________________________________________________________________________________
7-28 March 2009
7.7 MANUALS AND DESIGN GUIDELINES
7.7.1 USACE Manuals and Technical Reports
Manual No. Title
Coastal Eng. Manual
Part V
Chap 1 – Planning in Design Process
Chap 2 – Site Characterisation Chap 3 – Shore Protection
Chap 4 – Beach Fill Design
ER 1110-2-2902 Prescribed Procedures for the Maintenance and Operation of Shore Protection Works
ER 1110-2-1407 Hydraulic Design for Coastal Shore Protection Projects
ER 1105-2-100 Planning Principles
EM 1110-2-1100 Shore Protection Projects
EM 1110-2-1204 Environmental Engineering for Coastal Shore Protection
EM 1110-2-1412 Storm Surge Analysis and Design Water Level
EM 1110-2-1414 Water levels and Wave Heights for Coastal Engineering Design
EM 1110-2-1614 Design of Coastal Revetments, Seawalls and Bulkheads
EM 1110-2-1617 Coastal Groins and Nearshore Breakwaters
EM 1110-2-1913 Design and Construction of Levees
EM 1110-2-2904 Design of Breakwaters and Jetties
EM 1110–2-2301 Design of Beach Fills
7.7.2 European Manuals and Guidelines
1. Codes, standards and practice for coastal engineering in the UK (Fowler and Allsop, 1999)
2. Revetment systems against wave attack (McConnell, 1998) 3. Overtopping of seawalls – Design and assessment Manual (Besley, 1999) 4. ICE Design and Practice Guides. Coastal Defenses (ed. Brampton, 2002)
5. Guidelines for the Design and Construction of Flexible Revetments Incorporating
Geotextiles in Marine Environment (PIANC, 1992) 6. Beach Management Manual (Sim et al., CIRIA 1996) 7. BS6349 (1991). Maritime Structures – 1. General Criteria. British Standards. 8. BS6349 (1991). Maritime Structures – 7. Guide to the design and construction of
breakwaters. British Standards. 9. Guide to the use of groynes in coastal engineering (Fleming, CIRIA 1990) 10. Manual on the use of Rock in Coastal and Shoreline Engineering. CIRIA Special
Publication 83 (CIRIA/CUR, 1991). 11. Manual on Artificial Beach Nourishment (CUR Report 130, 1987)

Chapter 7 HYDRAULIC DESIGN IN COASTAL ENGINEERING
___________________________________________________________________________________________
___________________________________________________________________________________________
March 2009 7-29
7.8 RIVERMOUTH IMPROVEMENT The presence of shoals and sand spits at river
mouths is a common problem faced by coastal communities (Figure 7.16). Sediment deposition
at river mouths are generally derived from the upper stretches of the river coupled with
alongshore drift from the sea. This results in the
reduction of flow area for river discharge during flood time and also causes obstruction to smooth
navigation of boats and fishing vessels. Efforts to alleviate this problem often resort to dredging and
constructing breakwaters.
This section provides a basic understanding of the
fundamental procedures necessary for the hydraulic design of sedimentation and flood
control projects at river mouths and/or estuaries. The topics to be presented here only include the
hydraulic aspects of the design.
7.8.1 Types and Functions of Rivermouth Improvement Works Rivermouth improvement works are projects that serve to confine rivers or channels to definite
alignments, reduce or relocate sedimentation problems, reduce wave action, improve navigation conditions, prevent or reduce flooding and/or salinity intrusion. Typical types and functions of such
projects are listed in Table 7.7 with examples illustrated in Figure 7.17.
Table 7.7 Types and Functions of Rivermouth Improvement Works
Type of structure Function
Breakwaters Constructed at entrance to rivers for the purpose of providing shelter from waves and mitigating siltation for navigation purpose
Training walls Longitudinal structures extending along the course of the rivermouth
to guide or direct the currents out to the open sea
Diversion works Intercept freshwater discharges from upland areas and discharge
them to sea using an adjacent waterway
Revetment Constructed along the banks of the waterway to prevent erosion by
currents and waves
River groynes (or spur dikes)
Extend from river bank and perpendicular to river flow; to train the river along a desired course
Coastal groynes Barrier-type structures that extend from the shore to the wave breaking zone; to interrupt alongshore movement
Dredging Removal of excess sediments from the bed for the purpose of channel deepening and increasing the draught
Sand Bypassing Removal of excess materials from the river mouth by pumping it
downcast
Figure 7.16 River Mouth Shoaling
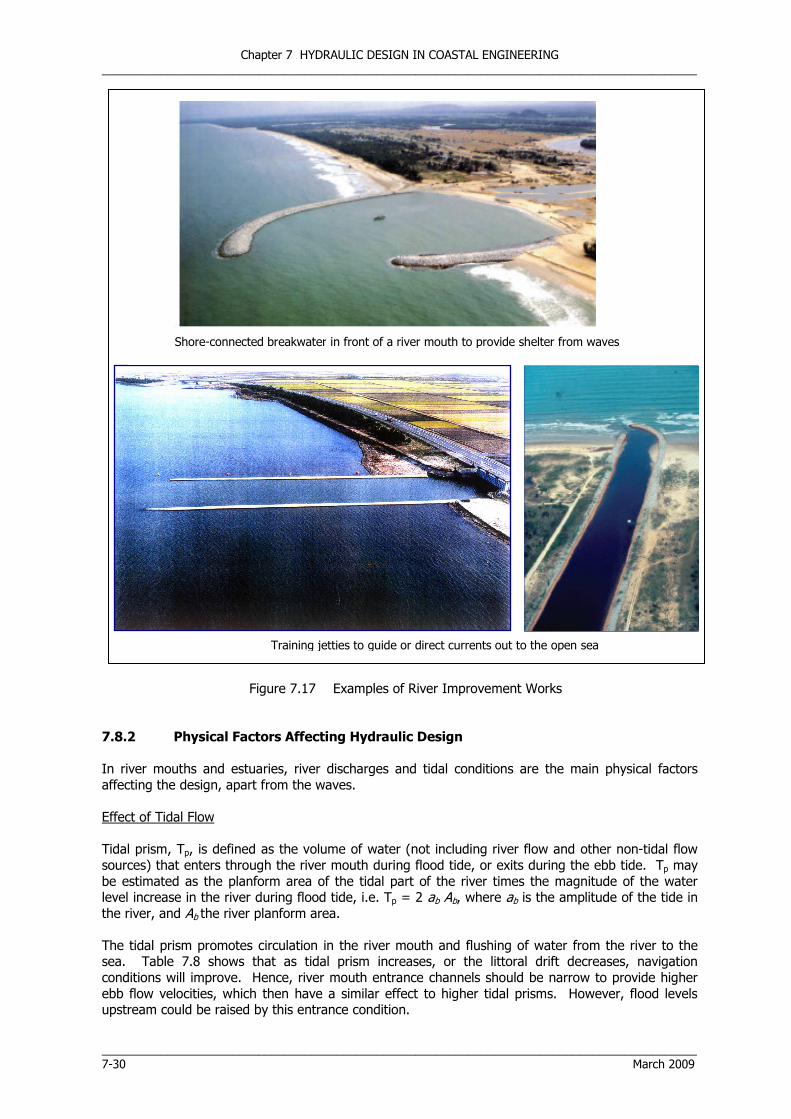
Chapter 7 HYDRAULIC DESIGN IN COASTAL ENGINEERING
___________________________________________________________________________________________
___________________________________________________________________________________________
7-30 March 2009
Figure 7.17 Examples of River Improvement Works
7.8.2 Physical Factors Affecting Hydraulic Design
In river mouths and estuaries, river discharges and tidal conditions are the main physical factors
affecting the design, apart from the waves.
Effect of Tidal Flow
Tidal prism, Tp, is defined as the volume of water (not including river flow and other non-tidal flow
sources) that enters through the river mouth during flood tide, or exits during the ebb tide. Tp may
be estimated as the planform area of the tidal part of the river times the magnitude of the water level increase in the river during flood tide, i.e. Tp = 2 ab Ab, where ab is the amplitude of the tide in
the river, and Ab the river planform area.
The tidal prism promotes circulation in the river mouth and flushing of water from the river to the sea. Table 7.8 shows that as tidal prism increases, or the littoral drift decreases, navigation
conditions will improve. Hence, river mouth entrance channels should be narrow to provide higher
ebb flow velocities, which then have a similar effect to higher tidal prisms. However, flood levels upstream could be raised by this entrance condition.
Shore-connected breakwater in front of a river mouth to provide shelter from waves
Training jetties to guide or direct currents out to the open sea

Chapter 7 HYDRAULIC DESIGN IN COASTAL ENGINEERING
___________________________________________________________________________________________
___________________________________________________________________________________________
March 2009 7-31
Table 7.8: Effect of Tidal Prism on Rivermouth Entrance Conditions
Tp/Mt Entrance conditions
> 300 No bar but shoals seaward
150 - 300 Small bar
100 - 150 Low bar, no navigation problem
50 - 100 Wider and shallower bar,
navigation difficult
20 - 50 Wider and shallower bar,
navigation difficult
< 20 Very shallow bar, navigation very difficult
(Note: Tp = tidal prism based on a spring tide; Mt = total amount of material carried to the river mouth per year).
Effect of River Discharges
River discharge is one of the major factors influencing the configuration of a river mouth. The hydraulic conditions (water level and velocity) in a river are related to the discharge. Also included in
river discharge are fresh water flows from the drainage basin of the river, ground water, discharge
from dams and reservoirs, and rainfall.
A hydrological analysis to determine the probable flood discharges is often carried out to examine flood inundation problems caused by river mouth siltation. The cause of the flooding is often related
to the insufficient flow capacity of the river and the expanding sand spit at the river mouth. Functions for probability distribution, F (Q), and density f (Q) are applicable to river discharges.
Gumbel-type distributions may be applied to high discharges (since they have no upper limits),
whereas Weibull or Log-normal distributions are preferred for low discharges (since they have a physical limit).
Effect of Tide and Wind-Generated Waves
Tides may enter the river mouth and progress up the estuary by the forward movement of a waveform. Areas of constriction increase the wave amplitude and energy dissipation is by means of
boundary friction. As the wave reaches the end of the estuary, it may be reflected. At some point in time, a standing wave may occur as the forward-advancing wave interacts with the returning
reflected wave. At the same time, the water surface also absorbs energy from the wind and from
smaller waves to form higher, longer waves. The resultant waves are the summation of all waves passing through a given location that make it an unsteady environment, thus the concept of
wavelength and period no longer applies. Instead, waves in this location are best described by the method of energy spectra.
Wind can cause setup or setdown. When the wind blows landward, water will be set up against the
land and when superimposed on the normal tide elevation, this setup causes higher than normal
tides, thus produces flooding during storm events. On the contrary, a seaward wind will push water towards the sea and away from the land, causing a lower than normal water level. A “storm tide” or
surge caused by wind and wave setup can also cause the sea surface to rise, causing disastrous effects on structures and flooding of the coastal and river mouth areas. Hence, in the design of river
improvement works, the maximum and minimum water levels will include the combined effect of all
these parameters.

Chapter 7 HYDRAULIC DESIGN IN COASTAL ENGINEERING
___________________________________________________________________________________________
___________________________________________________________________________________________
7-32 March 2009
Effect of River Geometry
The geometry of the river or estuary may influence the amplitude of a tidal wave progressing up an
estuary in the following manner: • For a convergent estuary, the amplitude will tend to increase
• Wave reflection will reduce the incident wave amplitude
• Energy dissipation by boundary friction will reduce the amplitude of the incident wave
However, for a long estuary without any physical obstruction, the tidal amplitude may gradually diminish to zero. In such a case, the incident wave is characterized by a single progressive wave
and at the river entrance, the amplitude is equal to that which would be observed by a tide gauge at
that point.

Chapter 8 TIDAL WAVE INUNDATION AND COASTAL DRAINAGE
___________________________________________________________________________________________
March 2009
CHAPTER 8
TIDAL WAVE INUNDATION AND COASTAL DRAINAGE


Chapter 8 TIDAL WAVE INUNDATION AND COASTAL DRAINAGE
___________________________________________________________________________________________
___________________________________________________________________________________________
March 2009 8-i
Table of Contents
Table Of Contents .....................................................................................................................8-i
List Of Figures..........................................................................................................................8-ii
8.1 INTRODUCTION..............................................................................................................8-1
8.2 COASTAL BUND...............................................................................................................8-1
8.2.1 Design ................................................................................................................8-1
8.2.2 Construction........................................................................................................8-3
8.2.3 Monitoring ..........................................................................................................8-3
8.2.4 Maintenance .......................................................................................................8-5
8.3 COASTAL OUTLET ...........................................................................................................8-8
8.3.1 Design ................................................................................................................8-8
8.3.2 Construction......................................................................................................8-10
8.3.3 Monitoring ........................................................................................................8-11
8.3.4 Operation and Maintenance ...............................................................................8-11
8.4 COASTAL DRAINAGE .....................................................................................................8-12
8.4.1 Design ..............................................................................................................8-12
8.4.2 Construction......................................................................................................8-13
8.4.3 Monitoring ........................................................................................................8-13
8.4.4 Maintenance .....................................................................................................8-13
APPENDIX 8-A : SUPERVISION AND CONSTRUCTION OF CREEK CLOSURE................................8A-1

Chapter 8 TIDAL WAVE INUNDATION AND COASTAL DRAINAGE
___________________________________________________________________________________________
___________________________________________________________________________________________
8-ii March 2009
List of Figures
Figure Description Page
8.1 Typical Design of a DID Coastal Bund 8-1
8.2 Mangrove Cover Around 500 meters at Tanjung Karang 8-2
8.3 Overtopping During Storms Occurring at High Tide 8-4
8.4 Erosion of Mud Coasts 8-4
8.5 Signs of Overtopping - Seashells on the Bund Crest 8-5
8.6 Bund Overgrown With Bushes 8-5
8.7 Typical Creek Closure 8-6
8.8 The Mud Lobster or Jabut 8-7
8.9 Mud Mounds Created By Mud Lobsters 8-7
8.10 Guillotine Gate 8-8
8.11 Close Up Of Guillotine 8-8
8.12 Water Levels Upstream and Downstream of Tidal Gate 8-9
8.13 Duckbill Orifice 8-9
8.14 Effect of Siltation on Tidal Gate Discharge 8-11
8.15 Progressive Wave Occurring During Opening of Tidal Gate 8-12

Chapter 8 TIDAL WAVE INUNDATION AND COASTAL DRAINAGE
___________________________________________________________________________________________
___________________________________________________________________________________________
March 2009 8-1
8 TIDAL WAVE INUNDATION AND COASTAL DRAINAGE
8.1 INTRODUCTION
Early settlements in Malaysia started in the coastal areas and many of these settlements had
eventually developed into towns and cities. From the early thirties to seventies of the twentieth century, large tracts of coastal lowlying areas had been reclaimed for agricultural land development.
Coastal bund, tidal gates, borrowpits and drains are the common features to protect these coastal areas from the coastal flooding due to high tide and storm surge. The design, construction, operation
and maintenance of these systems are important to the economy of the nation as these systems
protect thousands of hectares of agricultural, industrial, commercial and residential areas from flooding. We are thankful that disasters such as what had befallen New Orleans when the dykes
were breached by the storm surge caused by Hurricane Katrina have not occurred. However, if we are lax in with our coastal drainage systems, such disasters can occur.
8.2 COASTAL BUND
In constructing these bunds, the areas are protected from tidal inundation and the area can be used for agriculture and other development.
8.2.1 Design
The DID coastal bund is designed to a standard 1:3 slope with a crest width of 4 m. Nowadays most bund slopes are found to vary between 1:2 to 1:3 with crests widths ranging from 3 m to 4 m. A
typical bund is presented in Figure 8.1 below.
Figure 8.1 Typical Design of a DID Coastal Bund
Bund crests are designed to be at least 60 cm above the mean high water line after shrinkage and
settlement. The effectiveness of coastal bunds is based on their capacity to prevent overtopping and water-tightness. Effectiveness of the bund can be compromised by two major factors (i) erosion of
the bund as the result of exposure to direct wave and tidal action and (ii) seepage through cavity in
the bund due to crustacean activity.
In the design of the coastal bund, several factors must be taken into account. These are: (i) mangrove cover;
(ii) soil strength;
(iii) tide levels; (iv) available material.
Borrow-pit
Berm
Bund 1:3 1:3
1:3 1:3
varies > 12 m > 9 m seawards
4 m

Chapter 8 TIDAL WAVE INUNDATION AND COASTAL DRAINAGE
___________________________________________________________________________________________
___________________________________________________________________________________________
8-2 March 2009
(i) Mangrove cover
Mangrove cover is necessary to protect the bunds from being eroded by waves. In the early days of DID, the recommended mangrove cover for the new bunds was 10 chains or approximately 200
meters. This was found to be sufficient cover to dissipate the wave energy for waves with heights below 1.5 meter and periods of less than 6 seconds. However, since 1987, the Coastal Division of
DID recommends that the mangrove cover should be more than 400 meters. This is because it was found that the rate of retreat of the mangrove line can be very high. So, in order to provide
sufficient cover for the design life of the bund and allow sufficient response time in case of erosion,
the recommended cover was increased from 200 to 400 meters.
For the purpose of mangrove cover, the best is to use available naturally occurring mangrove species indigenous to the area. Api-Api (Avicennia sp.), if they occur in the area, are the best as they
usually grow closely spaced and therefore are best are dissipating wave energy. Bakau (Rhizophora
sp.) occur not so closely spaced, thus the wave penetration can be greater compared to Api-Api.
Figure 8.2 Mangrove Cover Around 500 meters at Tanjung Karang
(ii) Soil Strength
The undrained shear strength of the soil for the foundation of the bund should be more than 10 kPa.
Bunds have been build on soils of around 7 kPa. However, the berm of the bund should be wide and slope of the bund need to gentle. In any case, the slope stability of the bund needs to be
determined, using methods such as the Bishop’s slip circle analysis. In the past, when knowledge of the soil strength was not available to the engineer in the field, the guide was to allow for the 200
meters cover of mangrove and build the bund landwards of this cover. By coincidence, this zone is
usually where the Rhizophora species of mangroves are established. These species, having stilt roots, require stronger soils to establish themselves as compared to the pioneer species such as
Avicennia. That is why it was possible, even without knowledge of the soil strength, to construct the bunds.
Where the soil strength is just too low to allow bund construction on the existing foundation, soil
replacement method may have to be employed. In such situations, soil investigation and proper
foundation design need to be carried out.
(iii) Tide Levels
Crest of the bund should be above the highest sea level that can occur in the area. The level should
take into account all the phenomena as described in Chapter 2. Along the west coast of Peninsular
500m

Chapter 8 TIDAL WAVE INUNDATION AND COASTAL DRAINAGE
___________________________________________________________________________________________
___________________________________________________________________________________________
March 2009 8-3
Malaysia, DID has recommended that the crest level of the bund should be at least 1 meter above
Highest Astronomical Tide. However, due to the soil strength, this may not be possible in some
cases. In any case, a minimum freeboard of 0.5 meters above Highest Astronomical Tide should be provided to allow for extreme weather and settlement of the bund.
Sea level rise due to climate change is of great concern to many. However, the annual rate of
increase in the sea level is still much open to debate. More detail discussion on sea level rise can be found in chapter 9.
(iv) Available Material
Where possible, the material used to construct the bund should be local material from the surrounding area which is usually coastal or marine clays which have excellent water retention
properties. The method of construction is to excavate a borrowpit and use the spoil from the
borrowpit to construct the bund. The fill is then topped-up with laterite and crusher run, and compacted to the desired level.
It is important to ensure that the bund is made up of impervious material such as clay or laterite.
This will ensure that there will be no problem of seepage during high tides. It is also important to ensure that the material has very little organic content. Rotting branches or tree trunks in a bund
have been known to cause collapse of bunds.
8.2.2 Construction
DID Guidelines 1/97 stipulates that the coastal bunds are required to be constructed at least 400 m
landwards from the first row of the existing vegetation line which acts as a natural wave attenuator.
It is essential to preserve the vegetative buffer since it reduces the wave energy substantially before it reaches the bund.
Bund construction must be closely monitored as errors in the construction can cause catastrophic
damages should the bund fail and land gets inundated by sea water. Failures in bund due to poor construction are usually due to the following factors:
(i) Compaction
Poor compaction of the bund can result in the bund being porous. As water seeps into the bund, the material loses its strength and the bund can settle and collapse.
In the traditional method of construction, the bund is at first constructed by a large dragline excavator to excavate spoil from the borrowpit and dumping the material along the alignment of the
bund. The material is left to dry for a month, after which a smaller dragline excavator will follow along the alignment of the bund to trim the material and build the bund to its required shape and
level. The weight of this excavator is usually sufficient to compact the bund.
(ii) Unsuitable Material
Many causes of collapse of bunds can be attributed to unsuitable material being left in the bund
during construction. These are usually logs or tree branches that are left in the bund during construction. As these materials rot, they create pathways for sea water to seep through the bund
during high tide. This seepage eventually will cause the bund to collapse.
8.2.3 Monitoring
A programme of monitoring is important to ensure that bunds do not suddenly fail and seawater
inundates the land. Regular inspection of the bund will identify signs of potential failure and preventive steps can be taken to avoid catastrophic failure. The signs to look for are (i) Seepage and
(ii) Settlement.

Chapter 8 TIDAL WAVE INUNDATION AND COASTAL DRAINAGE
___________________________________________________________________________________________
___________________________________________________________________________________________
8-4 March 2009
(i) Seepage
During spring tides, the bund should be inspected to check for seepage. Tell-tale signs such as discolouration of the water in the borrowpit usually mean that there is seepage in the bund. The
location of this seepage must be identified and the bund repaired immediately.
(ii) Settlement
Settlement of the bund is inevitable as the soil underneath the bund consolidates. Over time and as
a result of traffic, long-term settlement also occurs thereby reducing the height of the crest and increasing the risk of overtopping. This settlement must be monitored at least every 6 months to
identify areas where settlement has occurred and it is not uncommon for excessive settlement to occur at localised spots. An indication of this is when overtopping such as that shown in Figure 8.3
frequently appears along the bund.
Figure 8.3 Overtopping During Storms Occurring At High Tide
Overtopping hotspots often coincide with areas where the fronting mangrove forest (or other coastal
vegetation) has thinned or is completely absent. Overtopping waves cause material at the crest to be
washed over and create erosion at the leeward side
of the crest. With each overtopping incident, the bund progressively becomes lower and narrower.
In areas, where there is a general recession and thinning of the mangrove belt, the narrowing of the
bund crest is usually swift. The vulnerability of bunds
to failure by tide and wave action is therefore associated with the density and width of the
vegetative belt fronting it.
Coastal bunds become threatened following the erosion of the inter-tidal surface which forms a
vertical scarp. The mangrove treeline recedes as the
scarp height increases (see Figure 8.4).
Figure 8.4 Erosion Of Mud Coasts (Source: NCES 1986)

Chapter 8 TIDAL WAVE INUNDATION AND COASTAL DRAINAGE
___________________________________________________________________________________________
___________________________________________________________________________________________
March 2009 8-5
During the spring tides, the bund must be inspected to ensure that the required freeboard still exists
between the highest water level and the crest of the bund. Tell-tale signs of bunds overtopping are
evidence of debris on the bund in the form of vegetative materials and seashells that may have come in with the tides. Grass on the backslope that had been swept down by the water can also be
evidence that the overtopping is severe.
Figure 8.5 Signs of Overtopping - Seashells on the Bund Crest.
Sudden settlement occurs when there is a hole in the bund. This hole can be caused by seepage,
probably due to rotting vegetative material left in the bund that caused a pathway for seawater to
flow through the bund. It can also be caused by mud lobster nests that weaken the bund. Action must be taken immediately to prevent a collapse that can cause sea water to flood the land.
8.2.4 Maintenance
It is important that bunds are maintained properly to ensure constant inspection can be carried out.
It is important that the bunds should be accessible by vehicles. Bunds that are inaccessible or overgrown with bushes are impossible to be inspected. Many bund failures occur due to lack of
regular inspection.
The crest of the bund must be free of bushes or trees. The grass on the crest must be kept short so
that vehicles can drive safely on the bund. Preferably laterite should be laid on the crest to make a path for the vehicles. Grass may be used as a protective cover for the bund. The slopes of the bund
should also be kept clear of trees and bushes. This will make it easier to inspect the bund for mud lobster holes and signs of bund overtopping and seepages.
Figure 8.6 Bund Overgrown With Bushes

Chapter 8 TIDAL WAVE INUNDATION AND COASTAL DRAINAGE
___________________________________________________________________________________________
___________________________________________________________________________________________
8-6 March 2009
Bund Overtopping
A direct response to reduce or eliminate overtopping is to raise the bund crest back to its design
level. Depending on the degree of settlement, this can be done by laying and compacting imported laterite over the ‘hotspot’ area. Topping up should be done using imported spoil, preferably laterite.
Taking spoil from the borrowpit is not recommended as this may cause instability of the bund.
To secure the damaged section, place bakau pile along the length of the damaged section. The
inside of the bakau barrier is then lined with goetextile cloth. The section is then filled with spoil and laterite to the original design and compacted.
When overtopping becomes frequent and widespread throughout the bund-line, a new bund may
need to be reconstructed at the present location or at a retreated position. The latter choice may be
preferred as it will be sitting on stronger soil.
On a preventive note, DID personnel must discourage vehicles other than DID maintenance vehicles from using the bund. The frequent passage of motor vehicles increases the rate of bund settlement
which would subsequently require more frequent maintenance. DID engineers must not permit
other agencies to upgrade the surface of coastal bunds, particularly those directly facing the sea, to asphalt. Tar-sealed surfaces will encourage heavier usage which enhances settlement but the bunds
then cannot be further raised by a simple topping-up exercise. In order to increase the bund crest level, the asphalt surface will first need to be removed.
Seepage
Any evidence of seepage must be inspected closely. If the seepage is excessive, i.e. the bund
material is being lost in the flow and the suspended sediments can be seen in the borrowpit, the
seepage must be stopped. The only way to stop the seepage is to excavate the section of the bund during low tide and quickly fill the hole with compacted clay or laterite. All this work must be done
before the high tide as the tide can enter the area through the hole in the bund and inundate the land. Thus sufficient material for repairing the bund must be at available before carrying out the
work.
Bund Breach
Bund breaches can sometimes occur. This must be dealt with quickly or valuable land can be ruined
and properties damaged. Closing breach means constructing a creek closure. (Refer Appendix 8A – Construction and Supervision of Creek Closure)
Figure 8.7 Typical Creek Closure
SEA
LAND
CREST
SLOPE
SLOPE
Bakau piles
Wire rope
Side ElevationCross-section
Plan

Chapter 8 TIDAL WAVE INUNDATION AND COASTAL DRAINAGE
___________________________________________________________________________________________
___________________________________________________________________________________________
March 2009 8-7
Crustacean Tunneling Activity
Another major threat to coastal bunds is the activity of crustaceans particularly;
� the mud-lobster (sp. Thalassina anamala); also known by its local name jabut (see Figure 8.8); � fiddler crab (sp. Uca manii or Metaplax elegans)
Tunneling activity, particularly by the mud-lobster is detected through the tell-tale sign of mud mounds or mountains as shown in Figure 8.9. These tunnels penetrate the bund core thereby
weakening its internal structure and allowing sea water to penetrate and flush out material over time. Extensive tunneling by these creatures can create leaks through the bunds. Bund design
incorporating wide berms of up to 12 meters are intrinsic to reduce the effect of crustacean tunneling. From an ecological aspect, mud-lobster activity contributes to the growth of mangrove
seedlings as their burrows allow oxygen to penetrate the typically oxygen-poor mud substrate.
Hence, the measures chosen to counter them must be inhibitive rather than destructive in nature.
Figure 8.8 The Mud-Lobster Or Jabut (Sp. Thalassina Anamala)
In 2003, DID Pontian introduced the use of polystyrene sheets to combat crustacean tunneling. The
measure involves the insertion of a polystyrene sheet through the bund creating a lightweight
barrier. Field tests at the coastal bunds in Pontian disctrict have revealed that crustacean activity can be inhibited by the polystyrene barrier although the possibility of their working their way around
or underneath the barrier cannot be discounted. The sheets are placed in the vertical but there is a tendency for the mud-lobster to burrow downwards to bypass the obstruction.
Figure 8.9 Mud Mounds Created By Mud-Lobsters

Chapter 8 TIDAL WAVE INUNDATION AND COASTAL DRAINAGE
___________________________________________________________________________________________
___________________________________________________________________________________________
8-8 March 2009
8.3 COASTAL OUTLET
Integral to the coastal bunding and drainage system is the coastal drainage outlets. These are
usually gated outlets that prevent sea water from entering the system, but allows fresh water from the hinterland to be drained. The proper functioning of these outlets is important to the operation of
the drainage system.
8.3.1 Design
There are basically two types of traditional DID tidal gates, namely:
(i) Guillotine gate (ii) Flap gate
The guillotine gate is so called because the gate operates like a guillotine. A system of pulleys and
counter weights allows the gate to be lifted and lowered. When the gate is lifted, water flows
underneath the gate. When the gate is lowered, water is prevented from flowing through the gates. The guillotine gate is suitable for large freshwater discharges.
The gate is now standardised into measurements of 3.7m x 4.3m (12’ x 14’). The gates are made of
aluminium to prevent damage due to seawater. The rule of thumb is that one gated bay can discharge around 30 cumecs. Thus, if more discharge capacity is required, more bays are added to
the outlet structure.
Figure 8.10 Guillotine Gate
Figure 8.11 Close Up Of Guillotine Gate

Chapter 8 TIDAL WAVE INUNDATION AND COASTAL DRAINAGE
___________________________________________________________________________________________
___________________________________________________________________________________________
March 2009 8-9
The operation of the tidal gate is as follows. When the downstream water level is lower than the
upstream water level and the tide is falling, the gate is opened and the water from the drains is
released. When the tide is rising and seawater starts to enter the drainage system, the tidal gate is closed. The figure below shows the water levels during a typical tidal cycle.
Figure 8.12 Water Levels Upstream and Downstream of Tidal Gate
In the past, the weakness of the guillotine gates is that the gates need to have an operator. The
operator must open and close the gates at the right time or there will be problems of flooding or tidal inundation. The gates are now in the process of being automated. Sensors are provided
upstream and downstream of the tidal gates to control the operation of the gates.
Flap gates now come in various sizes and forms. When the water level upstream is higher than the
level downstream, the flap opens. When the sea water starts to enter the gate, flap closes. In the past, flap gates are aluminium gates with counterweights. However, now there are various types,
made of steel or aluminium. The operating principle however remains the same. The advantage of flap gates is that they operate automatically. However, they are prone to jamming due to debris.
Thus routine checks are necessary to avoid this. Flap gates need to be fitted to culvert pipes to
create a proper seal from the sea water. This makes flap gates unsuitable for large flows.
One variation of the flap gate is the duckbill valve outlet recently installed in many urban areas. This type of outlet is suitable in areas where the flows are not high. They are also prone to jamming due
to debris, however because of the elastic material used, the leakage is much less than that in the
case of flap gate. Thus installing a system to capture debris before it gets to the gate may be considered.
Figure 8.13 Duckbill Orifice
Chapter 8 TIDAL WAVE INUNDATION AND COASTAL DRAINAGE
___________________________________________________________________________________________
___________________________________________________________________________________________
8-10 March 2009
Locating the tidal gate is quite an art. Ideally, the tidal gate must be located along a major river to
prevent sedimentation closing the outlet channel. Sometimes it is unavoidable to locate a tidal gate
along the shoreline such that the outlet channel discharge directly to the sea. In this case, the tidal gate must be serving a sufficiently large drainage area so that there will be sufficient freshwater
discharge to keep the outlet channel open. A study of the problem of siltation of tidal gate outlets along the western Johore coastline shows, that among the reasons for the siltation, is the small
discharge from some of the outlets not able to keep the outlets open.
Sizing of tidal gates in the past have been very much a trial and error exercise. The process is to
assess the runoff from the catchment and use the rule of thumb of 30 cumecs per bay to size and locate the gates. However, this is not quite correct as the inter-relation between the tides, the
storage in the drains and the runoff plays an important role in the sizing and operation of the tidal gates. With the availability of computer programs that are capable of simulating the unsteady flows
in the system, sizing and siting of the tidal gates can be done more accurately.
At the outlet of the tidal gate, a stilling basin must be provided. This is because the flow from the
tidal gate can be quite strong and the energy must be properly dissipated to prevent erosion of the banks of the outlet channel.
Another important feature of the tidal gate is the cut-off sheet piles. The aim of providing these
sheet piles is to prevent seepage flow under the structure that can cause the structure to collapse.
In areas where the tidal variation is high, this can be a major problem. The sheet piles create a longer path for the water to flow thereby reducing the rate of seepage.
An outlet channel that is located along the shoreline is prone to siltation. The longshore drift that is
prevalent in along the shoreline will have a tendency to close the outlet channel. Since the aim of
drainage and bunding system, is to prevent flooding of the hinterland, it is normally sufficient to provide drainage that will maintain the water level just below the hinterland ground level. In most
cases, the hinterland ground level is just above Mean Sea Level. Therefore if the bed level of the outlet channel is located just below Mean Low Water Neap Level, the water from the drainage
system can still be discharged through the outlet. Trying to maintain an outlet level that is lower than this will mean a higher cost of maintenance as the maintenance dredging frequency will be
greater and at a larger volume.
If the invert level of the outlet channel needs to be maintained and the longshore drift is posing a
major problem, then several solutions can be employed. One solution will be to build training breakwaters or groynes to prevent sediments from entering the channel. However, these structures,
as mentioned earlier in the manual, can cause accretion updrift, and erosion downdrift of the
structures due to the interruption of the littoral drift. In this case, some form of artificial sand by-passing system must be provided to maintain the littoral drift. Sometimes one may be lucky and
natural sand by-passing occurs without causing too much problem of siltation of the outlet. Monitoring of the coastline is important to determine whether the interruption of the littoral drift will
be a major problem.
As an alternative to the training breakwaters, a pipe outfall can be provided. This outfall needs to be
built below the beach profile so that the pipe will not interrupt the littoral drift. The invert level of downstream end of the pipe outfall, where the pipe emerges from the sea bed, must be sufficiently
low to allow water to flow from the gate to the sea. It is necessary to place the mouth of the outfall slightly above the sea bed to prevent suspended sediments from entering and depositing in the pipe.
8.3.2 Construction
Construction of tidal gates can be quite challenging as these gates are usually built on soft soil. Apart from the normal geotechnical problems of foundation that needs to be overcome, constructing the
structure means creating a ring bund that prevents sea water from inundating the site while the structure is being constructed. This ring bund needs to be sufficiently far from the pit where the
structure is being constructed as the soft soil can easily slip and cover the pit. In some cases, the tidal gate is built in the dry area inland of the existing bund. When the structure is completed, a

Chapter 8 TIDAL WAVE INUNDATION AND COASTAL DRAINAGE
___________________________________________________________________________________________
___________________________________________________________________________________________
March 2009 8-11
Tide Level
-2
-1.5
-1
-0.5
0
0.5
1
1.5
2
0 5 10 15 20 25 30 35 40
Time (hrs)
Leve
l (m
)
Tide Level (downstream of tidal gate)
Ground Level
Water levelin drain
(upstream of gate)
Water level in drain (without siltation)
Water level in drain (without siltation)
Gate opens
Gate closure without siltation
Effect of siltation
Gate closure due to siltation
Volume dischargeddue to siltation
Volume dischargedwithout siltation
return bund is built to connect to the tidal gate and the existing bund will be excavated and the area
be made into the outlet basin.
8.3.3 Monitoring
Monitoring of the outlet channels is necessary to ensure that siltation does not reduce the discharge
capacity of the gates. The effect of siltation is to reduce the total volume of water that can be discharged through the tidal gate. This is because it reduces the capacity of the outlet channel.
Early detection of the siltation can help avoid problems of flooding that can occur due to the reduction in capacity.
As can be seen in Figure 8.14 below, if the outlet is not silted up, the water level downstream of the
tidal gate will be close to the actual tide level in the sea. Thus the difference in water levels
upstream and downstream of the gate will be high and a lot of water will pass through the gate. However, if the outlet is silted up, the water difference in water level upstream and downstream of
the gate is much less. Thus the amount of water that can flow through the gate will be much reduced.
Figure 8.14 Effect Of Siltation On Tidal Gate Discharge
8.3.4 Operation and Maintenance
The correct opening and closing times are important for the proper operation of the tidal gate
system. In the past, the system relies on operators stationed at the gate to operate the gates at the correct times. However, this is changing as DID is moving from manual to automated systems of
operations. Nevertheless, several rules of operation must be adhered to.
Firstly, during the opening of the tidal gate, the difference in water level upstream and downstream
should not be too great. The ideal difference should be less than 0.15m. This is to avoid a progressive wave that can occur due to this water level difference. This progressive wave can
damage the banks of the outlet channel and also affect boats that may be moored along the outlet channel (Figure 8.15). Furthermore, when the water level difference is high, the pressure on the
gate is also high, which can affect the lifting mechanism and lifespan of the gate.

Chapter 8 TIDAL WAVE INUNDATION AND COASTAL DRAINAGE
___________________________________________________________________________________________
___________________________________________________________________________________________
8-12 March 2009
Figure 8.15 Progressive Wave Occurring During Opening of Tidal Gate.
The lack of people operating the tidal gates daily can be a drawback in the proper operation and
maintenance of the tidal gates. The lifting mechanism is made up of system of ropes and pulleys that require regular maintenance. Due to harsh environment along the coastline, the ropes need to
be greased to prevent rusting and jamming. It is therefore important that a weekly inspection and
maintenance routine be implemented to ensure that the tidal gates are operating properly.
The tidal gate should be operated at least once a day to allow water to drain through the outlet channel. This is to prevent clay particles that deposit in the outlet channel to consolidate. If the
particles consolidate, and the shear strength within the deposited material increase, it will be more
difficult to flush the sediments later.
8.4 COASTAL DRAINAGE
Bunded coastal drainage system is quite complicated because the simple method of calculation using
steady flow does not hold true. The system is unsteady because of the tides and the opening and closing of the tidal gates. Many mistakes in design have occurred due to treating the system as
steady state system.
8.4.1 Design
In designing the coastal drainage system it is important to understand the role that storage plays in
the operation of the system. When rain falls and the runoff collects in the drains, this runoff must be stored in the drains while waiting for the tidal gate to open. When the gates open, the gates must
have sufficient capacity to drain the water in storage so that the storage will be free for the next rainfall event. Thus the whole system must be balanced so that there are sufficient storage and
discharge capacities. Many drainage systems have failed because of the lack of one or the other or
both.
With the advent of computer programs that can model unsteady drainage systems, it is wise to use these programs to assist in designing the systems. These programs will be able to assist in
determining the storage and discharge capacities required for in the systems. The figure below shows the results of an analysis carried out using MIKE11 on the flood flow through a tidal gate in
Western Johor.
In designing coastal drainage systems, especially in marine alluvial soil the problem of acid sulphate
must be taken into account. Much of the area along the coastline of Malaysia is potentially acid sulphate soil. Acid sulphate occurs when the soil is drained. In this case the sulphite in the soil is
oxidised becoming sulphate and the soil becomes acidic. This affects the fertility of the soil and
crops cannot grow well in acid sulphate areas. This accounts for the low productivity of the coastal agriculture lands.

Chapter 8 TIDAL WAVE INUNDATION AND COASTAL DRAINAGE
___________________________________________________________________________________________
___________________________________________________________________________________________
March 2009 8-13
It is therefore important when designing a coastal drainage system, that the system do not overdrain
the area. The groundwater level must be kept not more than 1 meter below the ground level to
prevent the occurrence of acid sulphate. Drainage checks should be provided to control the water level in the drains so that the groundwater level can be maintained. When drainage checks were
introduced in drains in Kuala Selangor, it was found that the yield of the crops in the area improved as the ground becomes less acidic. The other adverse consequence of lowering of groundwater level
in the peat soil area is the land subsidence which may result in settlement of structures in the area.
8.4.2 Construction
Construction of coastal drainage systems are like construction of other drainage systems, except that the challenge is in working in soft soil. Thus the engineer should be prepared for slopes collapsing in
areas of soft soil. It is normal for this to happen as unless very extensive soil investigation is carried
out, it is not possible to identify all the areas of soft soil in the system. This is the reason why the reserves for drainage systems in coastal areas are wide so that should any slope failure occurs, the
failure would not affect adjoining properties.
8.4.3 Monitoring
The nature of the drainage system in coastal areas affected by tide levels is that there will be stagnation twice a day. Due to this, the drainage system is prone to sedimentation as the sediments
settle when the speeds reduce. Thus the system must be monitored for reduction in capacity due to
sedimentation.
The groundwater level should be monitored to ensure that overdrainage is not occurring. If the groundwater level is too low, i.e. more than 1 meter below the ground level, drainage checks must
be provided.
8.4.4 Maintenance
A lot of flooding in coastal areas can be attributed to poor maintenance of the drainage systems.
Most drainage systems are grass-lined and need regular maintenance. The grass must be kept short and clearing should be carried out at least 4 times a year. Clearing using weedicides should not be
allowed as this can pollute the water and affect the ecosystem.
The drainage system should also be desilted regularly. A desilting program of at least once every 5
years must be provided to maintain the capacity of the system. In some areas, this desilting program can be as often as once every 2 years.

Chapter 8 TIDAL WAVE INUNDATION AND COASTAL DRAINAGE
___________________________________________________________________________________________
___________________________________________________________________________________________
8-14 March 2009
(This page is deliberately left blank)

Chapter 8 TIDAL WAVE INUNDATION AND COASTAL DRAINAGE
___________________________________________________________________________________________
___________________________________________________________________________________________
March 2009 8A-1
APPENDIX 8-A
SUPERVISION AND CONSTRUCTION OF CREEK CLOSURE
1.0 Introduction
1.1 The closing of creeks can be an expensive operation and in certain cases it may be
extremely difficult; as such alignment of the coastal bund needs to be surveyed and walked through at least by an experienced officer or an Engineer.
2.0 Principles/ Procedures Of Closing The Creek
2.1 Irrespective of the sizes of the creeks, the following principles/ procedures apply for the closing operation:-
(i) Select a low tide cycle period;
(ii) Have an adequate stockpile of spoil; if necessary on both banks;
(iii) Have sufficient excavators at the site; if necessary on both banks; (iv) Carry out the necessary piling works at both the upstream and downstream portions of
the closure; (v) Commence filling (preferably from both banks) two hours before low tide;
(vi) Complete a full width section to a level above maximum tide level at the site for that
day; (vii) Continue dumping, night and day, until the closure is satisfactorily completed and to a
level of at least two feet above the final consolidated bund level to allow for settlement and shrinkage.
3.0 Preparatory Works And Stockpiling
3.1 Before the works commence, the supervising staff should go through the construction drawings and specifications thoroughly and check the soil condition (of both the borrow pit
and the bed of the creek), the width and the invert level of the creek in order to avoid or minimize construction problems and to ensure the satisfactory performance of the
proposed creek closure.
3.2 It is very important to stockpile the fill material in sufficient quantity, at least 150% of the
net quantity of fill. The quantity would be much more if large amount of bed settlement and washed-off are expected. Under normal cases, the type of fill material should
preferably be clayey type of soil unless otherwise specified in the drawings/ specifications.
3.3 The fill material should be stockpiled on one or preferably both banks of the creek obtained
from borrowpits on the seaward side some weeks before the closure is due to commence. These borrowpits should not be nearer than thirty feet from the edge of the creek or
twenty feet from the edge of the spoil dump.
3.4 Prepare a proper work programme taking into consideration the weather and tidal
conditions and ensure that sufficient numbers of excavator and bulldozer (if necessary) are available to be stationed on both banks of the creek.
4.0 Piling Works
4.1 Generally, piling may be required for cases where the creeks are more than twenty feet wide and with an invert level lower than R.L. -0.3m. However, the requirement of piling
shall be at the discretion of the Engineer.

Chapter 8 TIDAL WAVE INUNDATION AND COASTAL DRAINAGE
___________________________________________________________________________________________
___________________________________________________________________________________________
8A-2 March 2009
4.2 In normal circumstances, two rows of piles ten feet apart are driven, five feet on either side
of the proposed centre line of the bund, and extended in height to the designed top bund
level. These piles must be braced with suitable walings (such as pinang trunks and bakau poles) and the rows tied together with wire ropes (old excavator ropes are also suitable).
Two further rows of piles are driven fifty feet upstream and fifty feet downstream of the first piles and extended to a height of six feet below top bund level. These piles should be
braced and tied in a similar manner to the first rows, and the downstream and upstream piles tied together. Additional rows of piles may be necessary further upstream and
downstream.
5.0 Dumping Of Spoil
5.1 Before dumping commences, the inside of the pile lines is lined with attap or nipah leaves
to reduce the flow and loss of spoil.
5.2 Dumping between the centre two rows of piles should be carried out first and continued
until the fill has reached two feet above the anticipated high tide level for that day. Sufficient spoil must also be dumped at the same time in the upstream and downstream
compartments to support the centre rows of piles. The level of spoil in the centre compartment should not be more than five feet higher than the spoil in the adjacent
supporting compartments.
5.3 Dumping continues without stop until the whole operation of closure is completed. Topping
up of the bud will be necessary a few months later and spoil for this purpose should preferably be stockpiled as for the initial operation.
5.4 In situation where a tidal control structure is located and constructed on dry ground beside the creek, flow should first be diverted through it before dumping of the spoil into the creek
commences.
Note: The construction materials mentioned here such as bakau piles, pinang trunk and nipah
leaves are easily available and cheap local materials. They are practical choice in situation of emergency and budget constraint. Timber piles and geotextile could be used where
there is no constraint in time and fund.
Source: Paper “Supervision and Construction of Creek Closure”
by Ir Lim Chow Hock, Pejabat Jurutera Projek, Projek Pembangunan Pertanian Johor Barat,
JPS Batu Pahat. Sept 1984.

Chapter 8 TIDAL WAVE INUNDATION AND COASTAL DRAINAGE
___________________________________________________________________________________________
___________________________________________________________________________________________
March 2009 8A-3

Chapter 8 TIDAL WAVE INUNDATION AND COASTAL DRAINAGE
___________________________________________________________________________________________
___________________________________________________________________________________________
8A-4 March 2009
(This page is deliberately left blank)

Chapter 9 MANAGEMENT OF THE COASTAL ZONE
___________________________________________________________________________________________
___________________________________________________________________________________________
March 2009
CHAPTER 9
MANAGEMENT OF THE COASTAL ZONE

Chapter 9 MANAGEMENT OF THE COASTAL ZONE
___________________________________________________________________________________________
____________________________________________________________________________________________
March 2009 9-i
Table of Contents
Table of Contents ........................................................................................................................9-i
List of Tables ............................................................................................................................ 9-iii
List of Figures ........................................................................................................................... 9-iii
9.1 INTRODUCTION.............................................................................................................9-1
9.2 ADVANCING EFFORTS TOWARDS INTEGRATED SHORELINE MANAGEMENT ......................9-1
9.2.1 The National Coastal Erosion Study (NCES), 1985 ...................................................9-1
9.2.2 General Administrative Circular 5/87 ......................................................................9-3
9.2.3 National River Mouths Study, 1994 ........................................................................9-3
9.2.4 Department of Irrigation and Drainage Guidelines...................................................9-3
9.2.5 Department of Environment Guidelines ..................................................................9-4
9.2.6 Department of Town and Country Planning Guidelines ............................................9-4
9.2.7 Malaysian National Conservation Strategy...............................................................9-5 - Towards Sustainable Development (1993)
9.2.8 National Coastal Resources Management Policy (Draft, 1993)..................................9-5
9.2.9 Malaysia Integrated Coastal Zone Management Policy (Draft, 2004).........................9-5
9.2.10 Integrated Shoreline Management Plans................................................................9-6
9.2.11 Law on Coastal Development Control ....................................................................9-6
9.3 THE COASTAL ENVIRONMENT AND HUMAN INTERVENTION ............................................9-6
9.3.1 The Coastal Environment.......................................................................................9-6
9.3.2 Development And Exploitation of The Coastal Area .................................................9-6
9.4 FACTORS AND ISSUES RELATED TO THE COASTAL ENVIRONMENT ..................................9-7
9.4.1 Erosion And Accretion ...........................................................................................9-7
9.4.2 Land Reclamation .................................................................................................9-8
9.4.3 Offshore Sand Mining............................................................................................9-8
9.4.4 Maintenance Dredging in Ports, River Entrances and Navigation Channels ................9-8
9.4.5 River Mouth Sedimentation....................................................................................9-8
9.4.6 Marine Water Quality ............................................................................................9-9
9.4.7 Coastal Habitat and Wildlife .................................................................................9-10
9.4.8 Marine Habitat ....................................................................................................9-10
9.4.9 Fishing and Fisheries...........................................................................................9-11
9.4.10 Climate Change .................................................................................................9-11
9.4.10.1 Coastal Vulnerability Assessment .......................................................9-12
9.4.10.2 Sea Level Rise...................................................................................9-13
9.4.11 Tsunami ..........................................................................................................9-15
9.4.12 Social, Cultural and Economic ............................................................................9-17
9.4.13 Planning and Control ..........................................................................................9-18
9.5 INTEGRATED COASTAL ZONE MANAGEMENT (ICZM) .....................................................9-19

Chapter 9 MANAGEMENT OF THE COASTAL ZONE
___________________________________________________________________________________________
____________________________________________________________________________________________
9-ii March 2009
9.6 INTEGRATED SHORELINE MANAGEMENT PLAN (ISMP) ................................................. 9-19
9.6.1 Shoreline, Sedimentation Cells And Management Unit .......................................... 9-19
9.6.2 Shoreline Management Planning ......................................................................... 9-20
9.6.3 ISMP Studies ..................................................................................................... 9-21
9.6.4 Baseline Study ................................................................................................... 9-21
9.6.5 Management Objectives ..................................................................................... 9-22
9.6.6 Development Strategies ..................................................................................... 9-25
9.6.7 Coastal Construction Setback.............................................................................. 9-27
9.6.8 ISMP And Local Plans......................................................................................... 9-28
9.6.9 Application of the ISMP ...................................................................................... 9-30
9.7 GIS Application in Shoreline Management ..................................................................... 9-32
REFERENCES .......................................................................................................................... 9-35
APPENDIX 9-A : WATER QUALITY ...........................................................................................9A-1

Chapter 9 MANAGEMENT OF THE COASTAL ZONE
___________________________________________________________________________________________
____________________________________________________________________________________________
March 2009 9-iii
List Of Tables
Table Description Page
9.1 Coastline Erosion Areas in Peninsular Malaysia, Sabah and Sarawak 9-2
9.2 River Mouth Conditions in Peninsular Malaysia, Sabah and Sarawak 9-3
9.3 Distribution of Coastal Erosion Areas in Malaysia (1996) 9-7
9.4 Hard Structural Options for Sea Level Rise 9-15
9.5 Soft Structural Options for Sea Level Rise 9-15
9.6 Land Use Classification 9-29
List of Figures
Figure Description Page
9.1 Effects Of Climate Change On The Coastal Environment 9-12
9.2 Orientation of Management Units 9-20
9.3 Foreshore and Reserve and Setback Limits 9-28
9.4 GIS Function Model 9-32

Chapter 9 MANAGEMENT OF THE COASTAL ZONE
___________________________________________________________________________________________
____________________________________________________________________________________________
9-iv March 2009
(This page is deliberately left blank)
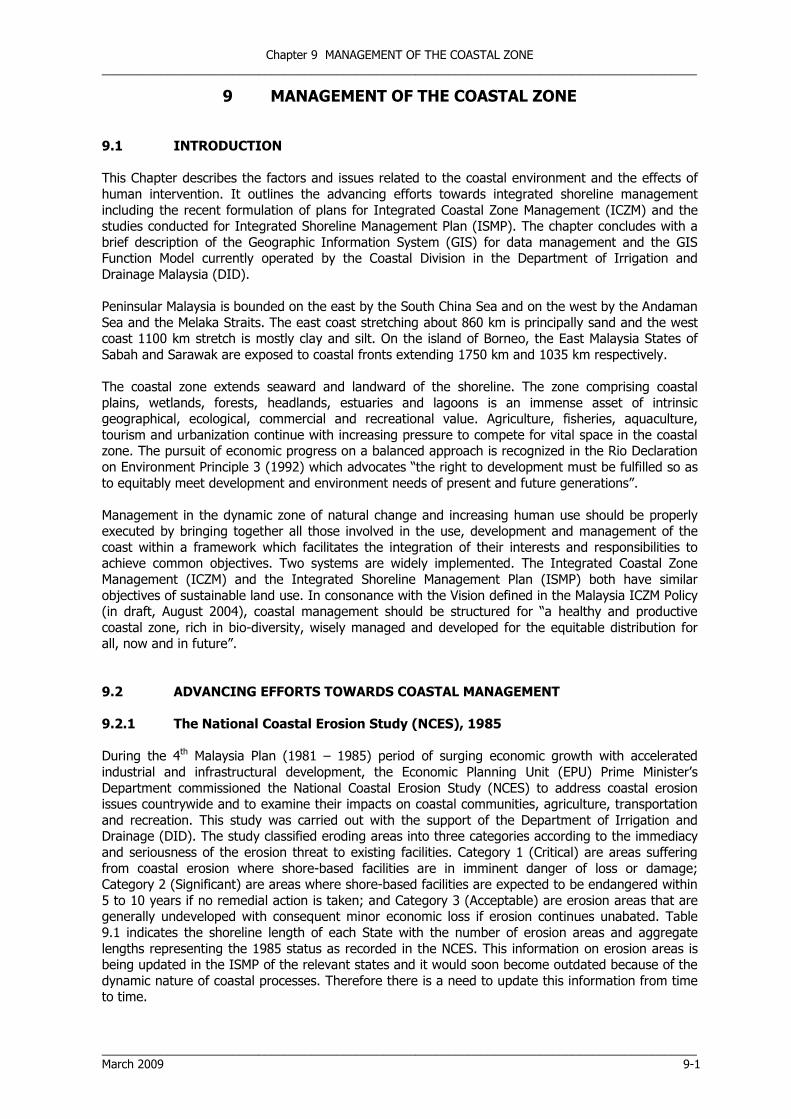
Chapter 9 MANAGEMENT OF THE COASTAL ZONE
___________________________________________________________________________________________
___________________________________________________________________________________________
March 2009 9-1
9 MANAGEMENT OF THE COASTAL ZONE
9.1 INTRODUCTION
This Chapter describes the factors and issues related to the coastal environment and the effects of
human intervention. It outlines the advancing efforts towards integrated shoreline management
including the recent formulation of plans for Integrated Coastal Zone Management (ICZM) and the studies conducted for Integrated Shoreline Management Plan (ISMP). The chapter concludes with a
brief description of the Geographic Information System (GIS) for data management and the GIS Function Model currently operated by the Coastal Division in the Department of Irrigation and
Drainage Malaysia (DID).
Peninsular Malaysia is bounded on the east by the South China Sea and on the west by the Andaman
Sea and the Melaka Straits. The east coast stretching about 860 km is principally sand and the west coast 1100 km stretch is mostly clay and silt. On the island of Borneo, the East Malaysia States of
Sabah and Sarawak are exposed to coastal fronts extending 1750 km and 1035 km respectively.
The coastal zone extends seaward and landward of the shoreline. The zone comprising coastal
plains, wetlands, forests, headlands, estuaries and lagoons is an immense asset of intrinsic geographical, ecological, commercial and recreational value. Agriculture, fisheries, aquaculture,
tourism and urbanization continue with increasing pressure to compete for vital space in the coastal zone. The pursuit of economic progress on a balanced approach is recognized in the Rio Declaration
on Environment Principle 3 (1992) which advocates “the right to development must be fulfilled so as
to equitably meet development and environment needs of present and future generations”.
Management in the dynamic zone of natural change and increasing human use should be properly executed by bringing together all those involved in the use, development and management of the
coast within a framework which facilitates the integration of their interests and responsibilities to achieve common objectives. Two systems are widely implemented. The Integrated Coastal Zone
Management (ICZM) and the Integrated Shoreline Management Plan (ISMP) both have similar
objectives of sustainable land use. In consonance with the Vision defined in the Malaysia ICZM Policy (in draft, August 2004), coastal management should be structured for “a healthy and productive
coastal zone, rich in bio-diversity, wisely managed and developed for the equitable distribution for all, now and in future”.
9.2 ADVANCING EFFORTS TOWARDS COASTAL MANAGEMENT
9.2.1 The National Coastal Erosion Study (NCES), 1985
During the 4th Malaysia Plan (1981 – 1985) period of surging economic growth with accelerated
industrial and infrastructural development, the Economic Planning Unit (EPU) Prime Minister’s
Department commissioned the National Coastal Erosion Study (NCES) to address coastal erosion issues countrywide and to examine their impacts on coastal communities, agriculture, transportation
and recreation. This study was carried out with the support of the Department of Irrigation and Drainage (DID). The study classified eroding areas into three categories according to the immediacy
and seriousness of the erosion threat to existing facilities. Category 1 (Critical) are areas suffering
from coastal erosion where shore-based facilities are in imminent danger of loss or damage; Category 2 (Significant) are areas where shore-based facilities are expected to be endangered within
5 to 10 years if no remedial action is taken; and Category 3 (Acceptable) are erosion areas that are generally undeveloped with consequent minor economic loss if erosion continues unabated. Table
9.1 indicates the shoreline length of each State with the number of erosion areas and aggregate
lengths representing the 1985 status as recorded in the NCES. This information on erosion areas is being updated in the ISMP of the relevant states and it would soon become outdated because of the
dynamic nature of coastal processes. Therefore there is a need to update this information from time to time.

Chapter 9 MANAGEMENT OF THE COASTAL ZONE
___________________________________________________________________________________________
____________________________________________________________________________________________
9-2 March 2009
The NCES ground surveys examined the effectiveness and suitability of 82 numbers of existing
protection works including revetments, seawalls, groynes and others. The high incidence of
ineffectiveness (51 nos.) and unsuitability (49 nos.) indicated a lack of adequate understanding of the causes and consequences of erosion. The most common deficiencies were inappropriate
construction material, lack of toe protection and end anchorage, insufficient crest elevation, and too small armour rock sizes.
Table 9.1 : Coastline and Erosion Areas in Peninsular Malaysia, Sabah and Sarawak
States
State Shoreline
km
Category 1 Critical erosion
No of Aggregate
Areas Length km
Category 2 Significant Erosion
No of Aggregate
Areas Length km
Category 3 Acceptable Erosion
No of Aggregate
Areas Length km
Perlis 20 3 4.4 1 3.5 4 6.4
Kedah * 148 7 7.5 3 2.8 7 14.8
Pulau Pinang * 152 8 4.7 6 22.9 1 1.1
Perak 230 3 16.6 2 26.5 3 92.5
Selangor 213 11 54.1 8 32.9 4 69.1
Negeri Sembilan 58 1 1.1 5 9.6 1 12.9
Melaka 73 - - 3 28.6 1 3.0
Johor 492 6 9.0 10 76.2 14 165.7
Pahang * 271 1 0.4 4 5.5 9 111.6
Terengganu 244 3 10.9 7 12 10 95.7
Kelantan 71 1 2.0 8 11.9 5 7.6
1972 44 150.7 57 232.4 59 610.4
Sabah * 1802 3 5.7 7 9.7 14 310.2
Sarawak 1035
3 8.0 11 22.8 7 3.7
TOTAL 4809 50 164.4 75 264.9 80 934.3
* Include the islands of Langkawi, Penang, Tioman and Labuan.
Source: National Coastal Erosion Study (NCES Report 1985)
The NCES Report recommended continuing action to effect control of coastal erosion in the
endangered areas which would have detrimental consequences to economic and social needs. While the short term strategy was directed towards implementation of coastal defence measures to protect
valuable lands and facilities, the long term strategy was focussed on management and regulation related to proper planning and control of land use and development in the coastal zone.
The NCES stressed the urgent need for assignment of responsibility to a high level agency
(preferably in the Prime Minister’s Department) for general direction and co-ordination of all coastal
erosion control actions together with preparation of annual report of accomplishments and problems. Simultaneously a council on coastal erosion control should be established to recommend legislations,
policies and institutional arrangements to increase the effectiveness of the Federal Government in coastal erosion control. Importantly, a technical centre should be established within a Federal agency
(preferably Department of Irrigation and Drainage, DID) to collect, analyse, disseminate and manage
data, conduct feasibility studies and reconnaissance surveys, review plans proposed in critical erosion areas, perform and manage research for advancing state of art in coastal erosion control and
maintain technical liaison with related organisations to strengthen awareness of control erosion consequences and control measures.

Chapter 9 MANAGEMENT OF THE COASTAL ZONE
___________________________________________________________________________________________
___________________________________________________________________________________________
March 2009 9-3
9.2.2 General Administrative Circular 5/87
Following the NCES recommendations, General Administrative Circular 5/87 was issued by the Prime Minister’s Department which directed attention to coastal erosion and proposed mitigating measures
with short term and long term strategies. The Circular further required all developments in the coastal zone to be referred to the Coastal Division in the Department of Irrigation and Drainage
which will have the following responsibilities:
• To implement coastal erosion works for critical erosion areas. This includes planning,
feasibility studies, detailed design, construction supervision and monitoring the performance
of completed works • To provide technical support to the National Coastal Erosion Control Council (NCECC)
• To provide technical advisory services to other government departments and agencies in
processing of development applications in the coastal zone
• To maintain a coastal engineering database to support the planning and design of coastal
engineering works in the country.
9.2.3 National River Mouths Study, 1994
Many river mouths entering the coasts encounter siltation problems due to heavy sediment
deposition carried down from catchments together with coastal longshore drift. Reduced flow area for river discharge caused flooding and obstruction to smooth navigation of fishing boats and other
vessels.
The National River Mouth Study (Report 1994) was conducted by Japan International Corporation
Agency (JICA) with support from DID. The study identified 100 river mouths in Peninsular Malaysia, Sabah and Sarawak.
Assessment of the river conditions, access navigability and social and economic impacts on fishermen
communities were made to classify the river mouths under the categories of critical, significant and
acceptable. The study established 35 rivers under Category 1, 40 rivers under Category 2 and 25 rivers under Category 3 as shown in Table 9.2.
A Master Plan was formulated for the improvement of selected river mouths for flood mitigation and
navigation. 75 river mouths belonging to Category 1 and Category 2 were selected as the objective river mouths to the Master Plan Study. In addition a feasibility study for two river mouths was
conducted as an urgent pilot project to improvement.
Table 9.2 : River Mouth Conditions in Peninsular Malaysia, Sabah and Sarawak
Location Selected Category 1 Category 2 Category 3
River Mouths Critical Significant Acceptable
Peninsular Malaysia 68 30 27 11
Sabah 12 2 5 5
Sarawak 20 3 8 9
100 35 40 25
Source: National River Mouth Study (Report 1994) 9.2.4 Department of Irrigation and Drainage Guidelines
“Guidelines for Development Projects in The Coastal Zone” cover four broad classifications under
(i) Shore front development,
(ii) Back shore development, (iii) Land reclamation and
(iv) Sand dredging and river mouth dredging.
The guidelines list the data required for processing all development applications in the coastal zone
and other additional information specific to the type of development.

Chapter 9 MANAGEMENT OF THE COASTAL ZONE
___________________________________________________________________________________________
____________________________________________________________________________________________
9-4 March 2009
“Guidelines for Preparation of Coastal Engineering Hydraulic Study and Impact Evaluation (for
Hydraulic Studies using Numerical Models) – 5th Edition 2001” provide directions to streamline the
coastal hydraulic studies to be undertaken by consultants and to enhance clarity on the requirements of DID and its evaluation and approval process.
9.2.5 Department of Environment Guidelines
The “National Policy on the Environment” prepared by Ministry of Science, Technology and the
Environment (MOSTE), now called Ministry of Science, Technology and Innovation (MOSTI) was adopted in 2002. The policy formulated advocates that “ Seas, coastal zones, lakes, rivers,
mangroves and other wetlands, sea grass and coral reefs shall be managed in an environmentally sound manner, including the prevention of ecologically unsustainable harvesting of living marine and
aquatic resources”; and “In areas where intensive and extensive use of resources such as land,
water and the marine environment is proposed, development planning shall be on a regional basis rather than on a project basis, taking into consideration both economic development and
environmental protection objectives”
Guidelines regulated by the Department of Environment (DOE) for development in coastal areas include:
• EIA Guidelines for Coastal Resort Development Projects
• EIA Guidelines for Fishing Harbours and/or Land Based Aquaculture Projects
• EIA Guidelines for Development of Tourist and Recreational Facilities on Islands in Marine
Parks. • EIA Guidelines for Coastal and Land Reclamation
• Panduan Kawasan Sensitif Alam Sekitar Malaysia
(Guidelines for Environmentally Sensitive Areas, Malaysia)
Lists of other guidelines/pamphlets/booklets/magazines can be accessed on the DOE web page.
9.2.6 Department of Town and Country Planning Guidelines
The relevant guidelines prepared by the Department of Town and Country Planning (Jabatan Perancang Bandar dan Desa, JPBD) are:
• Piawaian Perancangan JPBD 1/96 – Pembangunan – Fizikal Pulau-Pulau : Pulau Pembangunan/Pulau Peranginan/Pulau Taman Laut (Planning Standards: Physical Planning for Islands)
• Piawaian Perancangan JPBD 6/97 - Garis Panduan Perancangan Pembangunan di Kawasan
Persisiran Pantai (Planning Standards: Guidelines for Development Planning in Coastal Area)
• Piawaian Perancangan JPBD 6/2000 : Garis Panduan dan Piawaian Perancangan Kawasan Pantai (Coastal Area Planning Guidelines and Standards)
JPBD 1/96 covers the required standards for development in the marine environment. JPBD 6/2000 has been published to complement the earlier document JPBD 6/97. These comprehensive
documents address required standards for development in the zones covering recreational coastal forest, mangrove forest, turtle sanctuary, river and river mouth, recreation at the river, shoreline and
open coast, eco-tourism, housing, industrial, aquaculture, sandy beach, muddy beach, and rocky
beach.

Chapter 9 MANAGEMENT OF THE COASTAL ZONE
___________________________________________________________________________________________
___________________________________________________________________________________________
March 2009 9-5
9.2.7 Malaysian National Conservation Strategy – Towards Sustainable
Development (1993)
The Malaysian National Conservation Strategy (NCS) was prepared by the Economic Planning Unit
and was intended to set out plans and suggestions that can be used to integrate more fully the many existing efforts towards natural resource management for conservation and development, to build on
the strengths of existing institutions and mechanisms, and to incorporate additional future efforts into the process of conservation as a key to successful and sustainable development.
Emphasis was made on the planning of resources management and use to be an integral part of the mainstream planning process, education, awareness and training to achieve the development of
human resources and enforcement to ensure full effectiveness of the framework of law and management for resources and the environment. The system of protected and managed critical
areas should be strengthened. Environmental performance should be measured and monitored by
natural resource accounting and environmental auditing.
9.2.8 National Coastal Resources Management Policy (Draft, 1993)
The Coastal Resources Management Plan for South Johor (1992) was prepared as a pilot project to be used as a model to help frame and guide the development of plans for the State. As a
consequence to the Report, the National Coastal Resources Management Policy (1993) was drafted.
Mangrove was recognised as one of the most productive ecosystems functioning as spawning, nursery and habitat areas for economically important species of fish and prawns. The Management
Policy made recommendations for management guidelines for mangrove and other coastal forests, islands and coral reefs, coastal water resources, fisheries resources, tourism development and
coastal land use. It articulated the national policy that "development of coastal resources and land
use in the coastal zone will be planned and managed in a manner to preserve and enhance the coastal environment and coastal resources for sustainable use and development now and for future
generations. Critical coastal ecosystems and unique areas in the coastal zone will be identified and protected”
9.2.9 Malaysia Integrated Coastal Zone Management Policy (Draft, 2004)
The 7th Malaysia Plan (1995-2000) had outlined the initiative “to formulate a national coastal zone management policy to provide clear principles and guidelines for resolving the conflicting interests
among different types of development in coastal areas as well as to take into account environment considerations to ensure sustainability of coastal resources such as mangrove and peat swamp
forests. Under the policy, integrated coastal zone management plans will be drawn up to co-ordinate
and rationalise the activities and efforts of the various Federal, State and Local Authorities responsible for planning and managing resources found in the coastal zone. In addition, the legal
provisions that govern the management of coastal resources and related development activities, especially with regard to aquaculture, sand-mining and groundwater will be reviewed to ensure
better co-ordination and implementation. A National Islands Development Board will be set up to
issue policy guidelines on island and coastal development in order to reduce the detrimental impact of development activities on island ecosystems. Additional protection will be accorded by including
tourism and recreational activities in the list of EIA prescribed activities.”
The first Integrated Coastal Zone Management (ICZM) project was spearheaded by EPU and comprised four component projects, three developments in Penang, Sarawak and Sabah and one
Federal component to provide additional inputs to formulate a national integrated coastal zone
management policy. The project started in 1996 and was completed in 2000. This project was motivated to achieve common understanding and consensus with collaborative efforts to secure
cross-sectoral views on issues not limited by governmental outlook and priorities. Its success has generated confidence in the operational practicability and structure flexibility as a model for other
ICZM projects.
Based on the recommendations of the ICZM project, a Draft Report on the Malaysia Integrated
Coastal Zone Management Policy (2004) was commissioned by EPU. Issues were identified from an

Chapter 9 MANAGEMENT OF THE COASTAL ZONE
___________________________________________________________________________________________
____________________________________________________________________________________________
9-6 March 2009
overview of the current status of the coastal environment. Sectoral review covered environment,
legal, institutional, management and strategies. Guidelines and action plans were formulated to
address critical coastal zone issues.
9.2.10 Integrated Shoreline Management Plans
The Regional Environmental Impact Assessment and Shoreline Management Plan for West Coast of Sabah (1998) were prepared for the Ministry of Culture, Environment and Tourism.
The study for the Integrated Shoreline Management Plan (ISMP) for North Pahang was commissioned by DID in 2002 and was followed in 2004 with the study for ISMP South Pahang and
Pulau Tioman. These ISMP studies since completed have provided a multi-sectoral Management Plan for the control and optimisation of development potential for the Pahang coast. Similar ISMP studies
for Negeri Sembilan, Pulau Pinang, Melaka and Labuan are currently in progress and will ultimately
include all other States. These ISMPs will provide strategies for sustainable use of the shoreline through preservation, rehabilitation and development.
9.2.11 Law On Coastal Development Control
A Draft of the Policy Statement for Shoreline Management Act for Peninsular Malaysia was completed
in 2006 pursuant to a Cabinet decision for DID to formulate a suitable law or by-law to regulate
future development in the coastal zone. The draft policy statement recognised that current legislations do not address sufficiently or provide adequate regulations on the management of
coastal development and activities. Recommendations were made for action plans for effective control, management, and regulation of development and conservation which are crucial to
sustainable land use in the coastal zone. The Draft Policy Statement and the provisions of the
Shoreline Management Act are still in draft term. At the moment the Coastal Division is reviewing this document to come out with an Act that would focus on enforcing the Department guidelines
stipulated in the Guidelines JPS 1/97 and the ISMPs of the relevant states.
9.3 THE COASTAL ENVIRONMENT AND HUMAN INTERVENTION
9.3.1 The Coastal Environment
The coast is endowed with natural features, landscapes and sensitive bio-systems which include:
• Natural land forms e.g. Headlands, bays, sandy beaches, rocky shores, tidal flats, estuaries
etc.
• Coastal habitats e.g. Mangrove swamps, coastal forests, sand dunes, coral reefs and sea
grass beds . • Wildlife.
• Fisheries and aquaculture.
• Turtle nesting habitat.
• Conservation areas such as marine parks, bird sanctuaries and forest reserves.
9.3.2 Development and Exploitation of the Coastal Area
Development is targeted on the coast when a coastal location is essential or potentially favorable for economic returns. Such activities include:
• Agriculture (paddy cultivation, fresh market produce, fruit plantations, coconut, rubber and
oil palm estates, etc). • Fisheries and aquaculture.
• Housing (residential estates, condominiums, etc).
• Industries (ports, power stations, oil and gas exploration and exploitation, etc).
• Commercial centres and facilities to support the economic activities.
• Infrastructures (roads, water supply, sewage, etc) to serve the developments.

Chapter 9 MANAGEMENT OF THE COASTAL ZONE
___________________________________________________________________________________________
___________________________________________________________________________________________
March 2009 9-7
• Tourism (hotels, marinas, theme parks, etc).
• Waterfront developments, (including land reclamation, artificial beaches and artificial
lagoons).
9.4 FACTORS AND ISSUES RELATED TO THE COASTAL ENVIRONMENT
Coastal erosion results in the loss of land and habitats of high conservation and biodiversity interests
and of cultural heritage. The natural process is often exacerbated by human activities. The many issues related to the coastal environment may be distinguished under physical, chemical, biological,
ecological, socio-cultural and economical sectors.
9.4.1 Erosion and Accretion
Coastal erosion is due to natural causes as a result of shoreline response to natural shoreline
conditions driven by met-ocean conditions of wind, waves, tides and currents. Coastal erosion is
pronounced in morphological active areas and areas immediately adjacent to river mouths which are subject to considerable short-term morphological changes.
Inappropriate planning of infrastructure in the coastal zone have often intervened the dynamic
system with aggravating results. Ad-hoc construction of seawalls has counter effect on erosion control. Drainage pipes exposed or partly exposed on the beach are hazards to beach users and
where located within the littoral zone will interfere with littoral sediment transfer.
Headlands with unique outcrops provide good seascape forms and serve supporting structure for
sandy beach sectioning. Human interventions often result in loss of natural areas diminishing the natural appeal and protection of the coast.
Erosion threatened areas in all the States are monitored and recorded by DID. The year 1996 situation is summarized in Table 9.3. Coastal erosion control programmes are implemented by DID to
protect properties and public facilities in critical areas.
Table 9.3 Distribution of Coastal Erosion Areas in Malaysia (1996)
State Length of
Coastline (km)
Category 1
Critical (km)
Category 2
Significant (km)
Category 3
Acceptable (km)
Total Length of
Eroding Coastline
(km) (%)
Perlis Kedah
Pulau Pinang Perak
Selangor
N. Sembilan Melaka
Johor Pahang
Terengganu Kelantan
W.P. Labuan
Sarawak Sabah
20 148
152 230
213
58 73
492 271
244 71
59
1,035 1,743
4.4 22.6
36.7 20.8
55.3
2.0 9.2
18.8 9.6
20.0 5.0
9.0 12.8
(3) (13)
(8) (3)
(9)
(1) (3)
(7) (8)
(6) (3)
(0)
(3) (5)
3.5 2.6
19.1 26.3
32.9
9.6 22.1
53.2 2.8
12.8 10.9
5.5
22.8 3.5
(1) (2)
(5) (2)
(8)
(5) (3)
(9) (2)
(5) (6)
(4)
(11) (2)
6.4 12.4
1.1 93.1
66.1
12.9 3.0
165.7 107.8
122.4 37.6
25.1
13.7 279.2
(4) (6)
(1) (4)
(3)
(1) (1)
(13) (8)
(10) (5)
(2)
(7) (12)
14.3 37.6
56.9 140.2
154.3
24.5 34.3
237.7 120.2
155.2 53.5
30.6
45.5 295.5
(8) (21)
(14) (9)
(20)
(7) (7)
(29) (18)
(21) (14)
(6)
(21) (19)
71.5 25.4
37.4 61.0
72.4
42.2 47.0
48.3 44.4
63.6 75.4
51.9
4.4 17.0
TOTAL 4,809 226.2 (72) 227.6 (65) 956.5 (77) 1,400.3 (214) 29.1
Source: DID Coastal Division Figures in ( ) represent the number of erosion sites.

Chapter 9 MANAGEMENT OF THE COASTAL ZONE
___________________________________________________________________________________________
____________________________________________________________________________________________
9-8 March 2009
Dunes are natural features on moderately exposed or exposed coast when a ridge is formed parallel
to the shoreline at the back of the beach, often on a berm or beach terrace where sand accumulates
in colonising vegetation. The dunes act as a flexible buffer zone which protects the hinterland from erosion and flooding. The foot of the dunes can be eroded during storm surge events and the eroded
materials supply sediments to the littoral budget along the entire shoreline section. Grazing, trampling, excessive traffic and fire damage, degrade or destroy the dune vegetation resulting in loss
of protection provided by the natural dunes. Deprived of the vegetation, sand blowing inland causes various adverse impacts.
9.4.2 Land Reclamation
Land reclamation includes foreshore filling in coastal areas and estuaries for urbanisation, infrastructure, ports, marinas, agriculture and aquaculture. Land reclamation is a land creation
activity through filling up of water areas in the nearshore areas using sand sourced either from land
or offshore. More recently the sand has been sourced primarily from offshore due to a moratorium imposed on river sand mining and quarrying for such purposes.
Poor planning of land reclamation will result in negative impacts on coastal processes and sediment transport contributing to aggravated erosion or accretion, increased pollution of marine waters and
reduced biodiversity of coastal habitats.
9.4.3 Offshore Sand Mining
Fill materials required for potential land reclamation projects to be obtained through sand extraction
in the offshore areas will undoubtedly change the sea bed bathymetry. The resultant effects of sand depletion, bigger waves, and greater wave energy towards altered positions may increase potential
erosion of the coast if the sand is dredged too close to the coast.
Offshore sand mining invariably involves dredging, which is the mechanical removal of seabed sand
deposits using a variety of dredgers. Depending on the type of dredger used, dredging operation can engender a range of changes to the seabed and the water column, and hence influence the
associated habitats and ecosystems.
9.4.4 Maintenance Dredging in Ports, River Entrances and Navigation Channels
Loss of sand from the littoral zone occurs due to maintenance dredging with subsequent dumping
offshore for ports, river entrance and navigation channels. The dredged material should preferable by deployed at the coast downstream of the dredging area, whereby downstream erosion can be
minimized, this is referred to as artificial bypass.
9.4.5 River Mouth Sedimentation
The interaction of freshwater flow, most of the time sediment-laden, through a river mouth which in
turn is mediated by tidal action with nearshore circulation and littoral sediment transport results in a
highly complex flow and sediment pathways. Often at times, both the flood and ebb channels are highly variable spatially, which adversely affects navigation through the river mouth.
Sometimes the river flow is highly seasonal, resulting in closure of the river mouth or as often the
case, the elongation of a shore-attached sand spit in the downdrift direction. The sand spit may be breached at its distal end during the succeeding flood flow in the river and a new river mouth is
formed. Or the upstream of the river may be regulated by dam construction and the subsequent
reduced river flow is unable to breach the sand spit and is forced to follow a lengthened path to the sea. River mouths and sand spits are highly active morphologically.
Siltation at river mouths due to heavy sediment deposition from the catchments, coupled with
longshore drift result in reduction of flow area during flood discharge, causing inundation and
obstruction to smooth navigation of ships and fishing boats.

Chapter 9 MANAGEMENT OF THE COASTAL ZONE
___________________________________________________________________________________________
___________________________________________________________________________________________
March 2009 9-9
9.4.6 Marine Water Quality
Marine water pollution is caused by land based contaminants as well as discharge and disposal from ships. Various water quality pollutants affect the coastal and marine environment in different ways.
Nutrients from agricultural runoff (fertilisers) and domestic waste can cause algae blooms which create toxic plumes and deplete oxygen levels. A possible outcome of this is a “red tide” with threat
of death to marine life. In extreme cases, polluted water becomes completely anaerobic, where essentially no marine life can exist. Changes in water quality conditions affect different species and
can alter marine habitats. Heavy metals can accumulate in filter feeders (oysters, shellfish), which
can be harmful when consumed. Faecal coliforms (from sewage) are a major health risk to humans when found in high concentrations. Pollution sources include:
• Rivers carry varying levels of pollution loads that can affect the water quality of the coastline
Depending on the ocean current direction, the pollution plume generated by the river source
can exhibit a strong net drift resulting in variation in nearshore water quality between the
monsoon and dry seasons.
• Waste water generated from households, recreational facilities and industrial activities are
main point sources for faecal coliform pollution. Nutrients originating from urban waste
water and agriculture land use will impact on biological oxygen demand. Depletion of
dissolved oxygen affects healthy sustainability of marine life.
• Aquaculture farms sited in close proximity to open sea contribute to overall discharge of
effluent into the coastal area which will have an adverse effect on the coastal system. The size of the aquaculture activity, species farmed, stock density, management practices and
environment characteristics will vary the extent of potential effects.
• The accumulated volume of fertilizers, pesticides, insecticides used by plantations and farms
and from golf course maintenance may lead to adverse chemical discharge or leakage that flow ultimately to the sea. Effluents discharge from processing plants (eg. oil palm mills)
cause similar concern.
• Plantations and farms located on the coast sometimes extend their fields close to high water
mark without shore front protection. The loose soil devoid of vegetation to stabilize the nearshore area is easily attacked by wave action.
• Thermal power stations and heat releasing industries discharging hot water directly to rivers
or coastal waters can generate thermal pollution which threatens aquatic organism by
interfering with their physiological requirement.
• Cleanliness in a water body is particularly important for coastal tourism to reflect the
hygienic standard of the environment and water quality. “Floatables” comprising floating rubbish, garbage and non-degradable plastics are produced from indiscriminate disposal by
riverine and coastal communities.
• Rubbish often left behind by beach visitors spoils the aesthetic appearance of the coastal
environment. Discarded food containers generate unpleasant odour and contaminate beach areas besides attracting flies and scavenging animals. Plastics washed into the sea at high
tide are capable of entangling with boat propellers.
• Discharge of oil waste from offshore ships form lumps of dark coloured tar on the beach.
The tar balls soil skin, footwear and clothing and give the sandy beach a sullied appearance.
Good marine water quality is a prime factor in promoting coastal tourism. Water quality monitoring enables detection of changes that may occur and allow early response to prevent further damage
and remedy adverse conditions.
Refer Appendix 9-A on water quality parameters and Interim National Water Quality Standards for
Malaysia.
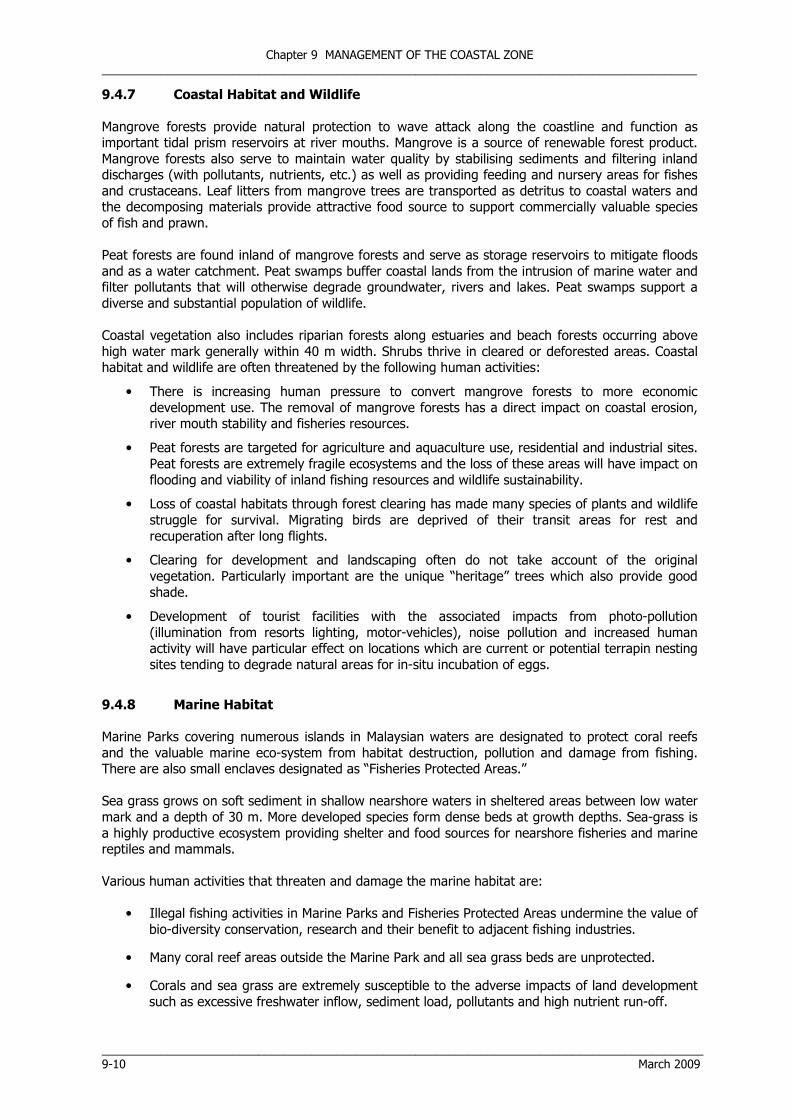
Chapter 9 MANAGEMENT OF THE COASTAL ZONE
___________________________________________________________________________________________
____________________________________________________________________________________________
9-10 March 2009
9.4.7 Coastal Habitat and Wildlife
Mangrove forests provide natural protection to wave attack along the coastline and function as important tidal prism reservoirs at river mouths. Mangrove is a source of renewable forest product.
Mangrove forests also serve to maintain water quality by stabilising sediments and filtering inland discharges (with pollutants, nutrients, etc.) as well as providing feeding and nursery areas for fishes
and crustaceans. Leaf litters from mangrove trees are transported as detritus to coastal waters and the decomposing materials provide attractive food source to support commercially valuable species
of fish and prawn.
Peat forests are found inland of mangrove forests and serve as storage reservoirs to mitigate floods
and as a water catchment. Peat swamps buffer coastal lands from the intrusion of marine water and filter pollutants that will otherwise degrade groundwater, rivers and lakes. Peat swamps support a
diverse and substantial population of wildlife.
Coastal vegetation also includes riparian forests along estuaries and beach forests occurring above
high water mark generally within 40 m width. Shrubs thrive in cleared or deforested areas. Coastal habitat and wildlife are often threatened by the following human activities:
• There is increasing human pressure to convert mangrove forests to more economic
development use. The removal of mangrove forests has a direct impact on coastal erosion, river mouth stability and fisheries resources.
• Peat forests are targeted for agriculture and aquaculture use, residential and industrial sites.
Peat forests are extremely fragile ecosystems and the loss of these areas will have impact on
flooding and viability of inland fishing resources and wildlife sustainability.
• Loss of coastal habitats through forest clearing has made many species of plants and wildlife
struggle for survival. Migrating birds are deprived of their transit areas for rest and
recuperation after long flights.
• Clearing for development and landscaping often do not take account of the original
vegetation. Particularly important are the unique “heritage” trees which also provide good
shade.
• Development of tourist facilities with the associated impacts from photo-pollution
(illumination from resorts lighting, motor-vehicles), noise pollution and increased human activity will have particular effect on locations which are current or potential terrapin nesting
sites tending to degrade natural areas for in-situ incubation of eggs.
9.4.8 Marine Habitat
Marine Parks covering numerous islands in Malaysian waters are designated to protect coral reefs
and the valuable marine eco-system from habitat destruction, pollution and damage from fishing. There are also small enclaves designated as “Fisheries Protected Areas.”
Sea grass grows on soft sediment in shallow nearshore waters in sheltered areas between low water
mark and a depth of 30 m. More developed species form dense beds at growth depths. Sea-grass is
a highly productive ecosystem providing shelter and food sources for nearshore fisheries and marine reptiles and mammals.
Various human activities that threaten and damage the marine habitat are:
• Illegal fishing activities in Marine Parks and Fisheries Protected Areas undermine the value of
bio-diversity conservation, research and their benefit to adjacent fishing industries.
• Many coral reef areas outside the Marine Park and all sea grass beds are unprotected.
• Corals and sea grass are extremely susceptible to the adverse impacts of land development
such as excessive freshwater inflow, sediment load, pollutants and high nutrient run-off.

Chapter 9 MANAGEMENT OF THE COASTAL ZONE
___________________________________________________________________________________________
___________________________________________________________________________________________
March 2009 9-11
• Trawling, dredging and shipping activities continually threatened sea grass beds.
• Accidental body and equipment contact made by snorkellers and divers on the fragile tips of
the coral reefs cause different degrees of damage including impendence to coral
recuperation and re-growth.
• Coral bleaching is a natural biological phenomenon which occurs when corals are under
stress often resulting from anthropogenic (human) sources of pollution tending to elevate
the rates of bleaching. Extensive coral bleaching around Tg. Gemuk is believed to have been
caused by the thermal effluent produced by the power station in Port Dickson coast. 30% of the coral at Pulau Gaya and Lahad Datu in Sabah are recorded to be bleached.
• Local boatmen often dredged access channels to the shore to suit their convenience. These
channels often cut into corals and coral substrate.
• There are insufficient mooring buoys at coral reef areas, particularly outside of Marine Park
areas. Visiting boats that are not able to use these buoys will often drop anchors onto or
near the reef causing damage to the reefs.
• Boats drop anchors while seeking refuge in shallows outside of coral reef areas. The
dragging of the anchors and the scraping by the anchor chains cause damage to the corals and coral substrates.
• Corals are being taken commercially or privately for aquarium trade, fabrication of costume
jewelry, traditional medicine and as souvenirs.
9.4.9 Fishing and Fisheries
The fisheries sector plays a significant role in the national economy. It is also an important source of
income to the coastal population, providing employment to workers in the captured fisheries, aquaculture and fishing related processing and ancillary industries.
Issues that the fisheries sector is facing are :
• Sedimentation around river estuaries results in shallow river mouths causing navigation
difficulties for fishing boats.
• Encroachment by trawlers and foreign fishing boats in nearshore fishing grounds compete
with local fish capture activities.
• Trawler nets tend to capture an abundance of commercially important juvenile fish leading
to reduced stock replacement. Species of conservation and bio-diversity importance (e.g.
turtles) are also caught accidentally.
• Increased capture by-catch fish species represent loss of forage base for larger predators,
which is crucial for the marine food-web.
• Use of illegal harmful gears and practices can seriously deplete fisheries stock. Use of
explosives kill all types of fishes in the vicinity of the blast and destroy coral reefs if used in such locations. Cyanide use for capture of live, usually large coral fishes leads to poisoning of
other smaller organisms including the corals.
• Mangrove clearing and effluent discharge associated with shrimp farming aquaculture have
negative environmental impact.
9.4.10 Climate Change
There is increasing recognition that climate change is a serious environmental problem in which one
of the most certain consequences of global warming is a rise in mean sea level. In addition to the threat of sea level rise, other climate change impacts include possible increases to sea surface
temperatures, greater variability in the patterns of rainfall and runoff, possible changes to wave

Chapter 9 MANAGEMENT OF THE COASTAL ZONE
___________________________________________________________________________________________
____________________________________________________________________________________________
9-12 March 2009
climate, changes to the frequency, intensity and duration of storms, and changes to ocean
chemistry, as depicted in Figure 9.1. There is also particular concern about extreme weather events
(floods, droughts and cyclones) that cause additional threats to human settlements and infrastructure. The Intergovernmental Panel on Climate Change (IPCC) Report in 2001, projected
increased CO2 concentrations and associated rises in global temperatures which in turn lead to further deterioration of the coastal zone. The Report also indicates that global warming is already
having an effect on coral reefs and wetlands. Low-lying coasts are expected to experience increased levels of inundation, accelerated coastal erosion, and saline intrusion into coastal waterways and
water tables.
Figure 9.1 Effects of Climate Change on the Coastal Environment
9.4.10.1 Coastal Vulnerability Assessment
Present knowledge of the vulnerability of coastal areas to sea level rise and other climate change
impacts unfortunately still remain incomplete. Whereas sea level rise has been a prime focus of
several coastal vulnerability studies, the ocean-atmospheric phenomena known as El Nino and the pressure difference termed the Southern Oscillation (both combined and known as ENSO), are now
recognized to have a profound effect on the climate and sea levels across the Pacific. Their influence on the Malaysian coastline is still the subject of much research.
Vulnerability assessment is defined as “any assessment of how projected changes in the Earth’s climate could influence natural and human systems or activities, with the aim of assisting policy
makers to adequately respond to the challenge of climate change”. Extensive research on potential and observed impacts of climate change on all kinds of natural and social systems have been carried
out in the past two decades. Vulnerability assessment techniques have been used to determine the vulnerability of coastal infrastructures, individual structures, and the economic, environmental and
societal factors to the impact of natural hazards. Several approaches for assessing coastal
vulnerability have been developed by various international institutions to assist a coastal planner or engineer in evaluating different coastal management strategies. These include:
1) IPCC’s Common Methodology 2) USGS Methodology
3) SURVAS (Synthesis and Upscaling of Sea Level Rise Vulnerability Assessment Studies)
4) Dynamic Interactive Vulnerability Assessment (DIVA)
The majority of vulnerability assessments are focused on sea level rise, with little assessment on other climate change drivers such as changes in sea surface temperatures, precipitation and runoff,
wave climate, storm intensity and frequency, and ocean acidification.

Chapter 9 MANAGEMENT OF THE COASTAL ZONE
___________________________________________________________________________________________
___________________________________________________________________________________________
March 2009 9-13
9.4.10.2 Sea Level Rise
Global sea-level rise (SLR) has been estimated to be approximately 18 cm in the past century and was estimated to rise to about 48 cm in this century. This works out to an accelerated SLR from
about 2 mm/year to about 5 mm/year which is more than double than that which occurred in the last century. The International Panel for Climate Change concluded from recent analyses of sea level
records that the mean sea level of the world has risen 10 – 25 cm over the last 100 years (IPCC, 1995). Sea level data measured at several tide stations in Peninsular Malaysia have been analysed.
It is discovered that a rise of about 2.0 - 2.5 cm over the last 20 years occurred along the west coast
of Peninsular Malaysia, giving a rate of sea level rise being approximately 1.0 - 1.25 mm/yr.
Global climate change and accelerated sea level rise will have profound implications to the coastal
area such as shoreline erosion, salt water intrusion, inundation of wetlands and estuaries, and threats to cultural and historic resources as well as infrastructure. According to the United Nations
Framework Convention on Climate Change (UNFCCC), the six most important bio-geophysical effects are:
1. Increasing flood-frequency probabilities and enhancement of extreme flood-level risks; 2. Erosion and sediment deficits;
3. Gradual inundation of low-lying areas and wetlands;
4. Rising water tables; 5. Saltwater intrusion;
6. Biological effects.
The MINC Report (MOSTE, 2000) predicts that, based on the highest rate of sea level rise of 0.9
cm/year, a sizeable portion of the coastal polder land of about 1,200 km2 in Peninsular Malaysia alone, will be submerged in the year 2100, subsequent to bund failure, if the bunds are not shored
up. On the other hand, the efficiency of tidal gates to control downstream level imposed by sea level rise will be reduced and this will impede drainage, hence leading to increased flooding of the
hinterland. Shoreline erosion is also projected to increase by another 30% of the present rate. As for increased wave action due to increased water depth in the surrounding seas, the structural
integrity of coastal facilities (such as highways, power plants, etc) will be at stake. These structures
which usually have a designed service life of about 50 years will require upgrading or outright replacement through the annual operating budgets earlier than its anticipated service life. The
threat of saline intrusion as a result of tidal intrusion further up the river may lead to potential threat of water contamination at water abstraction points. However, with a shift in water sourcing
development towards reservoirs, as well as a small volume of groundwater utilization (with the
exception of Kelantan), the concern is considerably reduced.
Other sea level rise related-impacts discussed in the MINC Report (MOSTE, 2000) include: • the nation-wide loss of about 80,000 ha of land planted with rubber due to flooding as a
result of the combination of increased rainfall and sea level rise of 1 m;
• abandonment of about 100,000 ha of land planted with oil palm in the event of a 1 m rise in
sea level;
• a loss of between 15% and 20% of mangrove forests located along the coastline; • possible relocation of shore-based power stations; and
• additional cathodic protection of offshore facilities due to vertical ascent of the splash zone.
Even though sea level rise is predicted to be a relatively gradual phenomenon, adaptive strategies
may require lead times in the order of 50 to 100 years. The selection and timing of adaptive measures in response to sea level rise depend on the physical, social, economic and environmental
characteristics of the affected areas. The adaptation strategies fall into three categories:
1. Retreat: abandonment of land and structures in vulnerable areas and resettlement of
inhabitants
2. Accommodation: continued occupancy and use of vulnerable areas 3. Protection: defence of vulnerable areas, especially population centres, economic activities
and natural resources.

Chapter 9 MANAGEMENT OF THE COASTAL ZONE
___________________________________________________________________________________________
____________________________________________________________________________________________
9-14 March 2009
Options for Retreat will include:
1) Preventing development in areas near the coast (more stringent setback limits, land
acquisition, land use restrictions, prohibit reconstruction of property damaged by storms, reduction of subsidies and incentives for development in vulnerable areas).
2) Allowing development to take place on the condition that it will be abandoned if necessary (planned phase out);
3) No direct government role other than through withdrawal of subsidies and provision of information about associated risks.
4) Enabling wetlands to migrate inland.
Accommodation option constitutes a compromise between retreat and protection. The approach can
be implemented through:
1) Regulations that prohibit private construction of protection structures
2) Conversion of land ownership to long-term or conditional leases which expire when the sea
reaches a particular level
3) Natural resources, such as mangroves and coral reefs, to be left to their natural processes as
sea level rises
4) Modifications to drainage systems; building codes to specify minimum floor elevations and
piling depths, as well as structural bracing. And cutting mangroves must be prohibited.
5) Changes in landuse, such as conversion of some agricultural lands to aquacultural uses.
6) Prohibit filling wetlands, damming rivers, mining coral and beach sands.
7) Allow natural reestablishment of wetlands and mangroves on undeveloped land with sufficient elevation and slope.
Protection Options are engineering responses which involve defensive measures to protect areas
against inundation, tidal flooding, effects of waves on infrastructure, shore erosion and loss of
natural resources (mangroves, etc). Measures may be selected from several “hard” and “soft” structural solutions. They can be applied alone or in combination, depending on the specific
conditions of the site. However, there is no single “best solution” as each solution must be evaluated and treated on its particular merits. A list of “hard” and “soft” structural options is provided in Tables
9.4 and 9.5 respectively.
For long-term measures, comprehensive management plans for areas at risk from sea level rise
should be incorporated as part of the ISMP so as to reduce future vulnerability of populations and coastal developments and ecosystems. Other measures for further assessment are also
recommended:
i) Need for monitoring
Despite the scientific enthusiasm and technological breakthroughs, there are still
considerable uncertainties regarding sea level rise and other impacts of global climate change. This is made more difficult, in the context of the local scenario where absence of
long-term tidal records makes the assessment and prediction of potential impacts a challenging task. Hence a system to monitor, detect and predict sea level rise and the
potential impacts is necessary to assist in determining the need for protection structures or
otherwise.
ii) Other information
Site-specific data and assessment is needed to make decisions on adaptive options. There is
also a need for information on other impacts, such as changes in storm pattern, frequency of storm events, etc, in predicting the future sea level rise scenario.

Chapter 9 MANAGEMENT OF THE COASTAL ZONE
___________________________________________________________________________________________
___________________________________________________________________________________________
March 2009 9-15
Table 9.4 Hard Structural Options For SLR
Structure Functions
Dikes, levees and floodwalls Raised embankments or walls for flood protection;
Internal drainage may by gravity flow, tide gates, or pumping systems
Seawalls, revetments and bulkheads
Protect inland properties from the direct effects of waves and storm tides;
Groynes Placed perpendicularly to the shoreline into the nearshore
zone; trap longshore sediments to widen the beach or prevent it from eroding.
Detached breakwaters Massive structures placed offshore parallel to the shoreline
for dissipating wave energy to reduce erosion and storm damage.
Raising existing defensive
structures
To incorporate in the initial design, the possibility of raising
and strengthening structures in the event of sea level rise
Infrastructure modifications Modifications to drainage systems; relocations of various facilities; elevation of piers, wharves, bridges, roads or rail
beds.
Floodgates or tidal barriers Adjustable dam like structures, placed across estuaries to
prevent upstream flooding from storm tides.
Table 9.5 Soft Structural Options for SLR
Structure Functions
Beach filling and subsequent
renourishment
The placement of sandy material along the shore to establish
and maintain the desired beach width, particularly for
recreational and aesthetic purposes
Wetland/mangrove creation Placement of fill material to appropriate elevations with
subsequent planting
Other possible solutions Use of artificial seaweeds/seagrasses; artificial reefs;
rehabilitation of natural coral reefs; planting of seagrass; promoting the protection of corals from pollution in order to
enhance growth; instituting pollution controls and preventing mangrove harvesting.
9.4.11 Tsunami
Tsunamis are often triggered by the simultaneous occurrence of a large earthquake, a volcanic
eruption, an earth landslide, or a submarine slump. States of Sabah and Sarawak in East Malaysia, being close to the ‘ring of fire’, may be considered to be highly vulnerable to any of these
phenomena. Should they occur, local tsunamis may occur and within minutes, not hours, the coastal areas bordering South China Sea, Sulu Sea and Sulawesi Sea will be impacted by the
disastrous effects of tsunami run-up and inundation. Similarly, the western coastline of Peninsular Malaysia, that were previously thought to have little or no risks from tsunami wave propagation
originating from the Sumatra waters, can now be considered to face a certain degree of risk. The
devastating megathrust earthquake southwest of Banda Aceh in Northern Sumatra triggered giant tsunami waves that propagated throughout the Indian Ocean and also penetrated through the
Straits of Melaka via Andaman Sea.

Chapter 9 MANAGEMENT OF THE COASTAL ZONE
___________________________________________________________________________________________
____________________________________________________________________________________________
9-16 March 2009
As a deep-water tsunami wave enters a coastal area, it undergoes several changes and processes
that are responsible for the consequential impacts. The scale of the impact is a challenge not only to
government agencies responsible for the safety and security of the coastline, but to coastal engineers to fully appreciate the science and physics of the tsunami process so that mitigating plans
and evacuation measures could be implemented in a more effective manner.
Tsunamis, commonly known as “harbour waves” in Japanese, or “tidal waves” to the general public, are however misleading terms to describe them, because they do not just occur in harbours nor are
they caused by tides. Alternatively, they may rightfully be called “seismic waves” although they can
be caused by other forces such as landslides, asteroids or volcanic activities. The most common cause of a tsunami however is triggered by a strike-slip earthquake which is often associated with
devastating effects. Scientifically, a tsunami is defined as “a series of long-period waves generated by an impulsive disturbance that vertically displaces the water column”.
Tsunamis may cause physical damage in several ways: • Flooding and damage due to wave run-up, inundation and currents
• Destruction and damage to human life, man-made structures and infrastructure
• Shoreline alteration
• Inland and seaward transport of objects (ships, vehicles, houses, structures, etc)
• Sinking or rising sea-level in short term (hours) or long term (years)
• Uplifting or subsidence of the ground
• Earth landslides and/or submarine slumps
• Soil deformation and/or liquefaction
• Sediment: erosion-transport-deposition
• Vegetation: uprooting-destruction-immersion
• Exposure of the sub-aqueous (below inter-tidal level) marine life
• Salt water penetration into the inland soil
Much of the damage inflicted by tsunamis is caused by strong currents and floating debris. Post-tsunami field assessments have shown that tsunami waves have penetrated inland with a greater
force in areas where coastal defence structures were absent. For example, in Langkawi, the Langkasuka offshore breakwater has indeed served its function in protecting the Langkawi Airport
runway facilities and the coastal communities in the area (JPS Post-Tsunami Assessment Report,
2005). However, in Kuala Muda, Kedah, the rock revetment managed to protect the shoreline but failed to prevent flooding.
However, the worst affected areas are often the constricted river mouths and semi-enclosed
harbours or marinas in which the funneling effects forced the water levels to rise abruptly. This happened at Kuala Sg. Teriang and Sg. Melaka in Langkawi where flood waters reached as high as a
one-storey house. Maximum inundation distances recorded in the two rivers were 583m and 230m
respectively with tidal bores penetrating 350m upstream and flooded the padi fields.
The effects of tsunami waves on coastal structures are characterized by the maximum destructive force. Breakwaters and piers may collapse due to scouring actions that sweep away the foundation
material and sometimes also due to sheer impact of the high-energy wave. Post-tsunami
assessment reports (Yalciner, 2005) indicated that tsunami waves were seen to completely damage wooden structures where the flow depth exceeded 2.5 – 3.0 m in the inundation region. Most
concrete structures however, managed to stand against these waves. But their level of resistance and success for survival are fully dependent on (i) the percentage of open area (area of windows) on
the walls of ground floor for tsunami transmission and also (ii) the flow depth of tsunamis near the
structure. The scour around the concrete structures are the common effect of flow velocities related to tsunami wave action.
Coastal freshwater aquifers are the major sources of drinking water in most coastal areas. The
tsunami waves may transport large volumes of seawater into inland water bodies and also create large tidal pools of seawater which percolate into coastal freshwater aquifers and salinize them.
Massive quantity of sea water that inundate the coastal lands may extend for 0.5 km to 2.0 km area
inland (in Meulaboh, 15km was reported). Due to reasons of poor drainage, the condition could

Chapter 9 MANAGEMENT OF THE COASTAL ZONE
___________________________________________________________________________________________
___________________________________________________________________________________________
March 2009 9-17
remain for a few days affecting the quality of groundwater. The surface water resources meant for
irrigation and drinking could also be affected by the ingress of sea water.
In most of the affected areas the sea water intrusion changed the soil conditions and turned it to be
unfavorable for immediate crop cultivation. The primary effect of total salinity is a reduction of water availability to roots through osmotic effects. Yields of most crops are substantially reduced. In some
areas there is a unique impact of stagnation of sea sediments, debris and sea water. The thick slushy black deposits on the soil surface cause heavy damage to the soil structure and standing crop. The
relative rise of the sea level will cause a change in water balance between the fresh water layer and
the saline water layer. Generally, saline water will push the fresh water lense further to the inland. This can affect a strip of several hundreds of meters. Especially in areas where groundwater is
pumped for irrigation this effect has to be carefully monitored to prevent saline water intrusion and degradation of water quality.
The small number of tsunamis that do break often form vertical walls of turbulent water called bores. These waves travel much farther inland than normal waves. When waves enter a semi-enclosed
basin such as a harbour or a funnel-shaped river mouth, the amplitude of the waves will increase and its duration decreased to a point where it appears that there is a sudden increase in water level.
The funneling effect of the river will increase the travel speed of the bore against the direction of the river current and thereby leading to a backwater flooding upstream. Post-tsunami assessment
reports such an event occurring in Kuala Sg. Muda, Kedah and Sg. Melaka in Langkawi.
In tsunami affected areas, sediments of fine grey layer to grayish brown layer of varying depths
(5cm to 35 cm) were found to be deposited in the low-lying coastal areas. Residual high content of salt was found in the layers of clay and silt left behind by the tsunami waves. These layers can be
easily identified by cracks that spread across the surface of the soil. Other problems related to
lateral and vertical movement of the islands are slow changes in island morphology that may occur over time through processes of scouring and sedimentation. This could have various effects on
agricultural land. However, all these processes are slow and are not easily determined.
During the December 26 Tsunami, major uplift and subsidence, about 2 – 5 m, has been reported in the Andaman and Nicobar islands as well as the islands off the Aceh Coast and Aceh mainland. In
Aceh, where subsidence is visible, it is less than one meter. Inhabitable or arable lands that were
close to the sea are now submerged, either permanently or with high tide. Coconut trees that were close to the coast and were not uprooted by the tsunami are now standing in the sea. Jetties are
deeper or submerged. Evidence of uplift is shown by the new occurrence of shallow corals or corals being exposed above water. Mangroves are also observed to be standing dry in some places.
Subsidence and uplift could be permanent and land lost to the sea cannot be reclaimed. The
immediate impact of subsidence is that farmers have to be relocated if they lost their land, and also now that these areas are very close to sea, problems with lateral seawater intrusion will start.
Drainage systems can also be affected. In fact, field and channel drainage can be submerged
because of higher water level in estuaries and river mouths due to the influence of the higher sea
water table. Submersion reduces the drainage capacity and cause problems of water logging and salinisation. (Refer Appendix 2A of Chapter 2 for more detailed account of tsunami)
9.4.12 Social, Cultural and Economic
Human settlements have long been established on the coasts. With the dynamic changing shoreline
compounded by development activities (including the important tourism sector), facilities are
frequently threatened by coastal erosion.
• Coastal erosion threatens buildings, roads and grave yards sited too close to the sea.
• Declining catches, lack of capital, unstable fish prices and unstable catches leading to
unstable income for fishermen.

Chapter 9 MANAGEMENT OF THE COASTAL ZONE
___________________________________________________________________________________________
____________________________________________________________________________________________
9-18 March 2009
• New development may result in relocation, change of trade and employment for coastal
dwellers putting stress on the income and social well being of the coastal community.
• Tourism activities bring external influence to the local coastal community, some of which
may have cultural conflicts.
9.4.13 Planning and Control
There is lack of emphasis in planning provision for beach access. Differing control guidelines
regulated by different government agencies, inadequate staff capacity and funding hamper effective management of the coastal zone and its resources.
• Private resorts have fenced up sections of beaches depriving access to the public.
Reclamation projects also pose problems for public accessibility.
• Public accessibility is not strongly imposed as a condition for approval of Development
Plans by Local Authorities. Structure Plans or Local Plans do not reflect a firm
government policy on public access to foreshore.
• Existing DID guideline prohibits sand mining activities in nearshore areas less than
1.5km from the Mean Low Water Line or 10 metre water depth (from Lowest
Astronomical Tide), whichever is further from the shore. The management of sand
resources up to 3 nautical miles comes under State jurisdiction. Beyond this limit, the Federal Land and Mines Department exercise full power. This has led to dissimilar
standards in sand mining operation and royalty rates.
• Water quality sampling and monitoring are undertaken by various departments, e.g.
Department of Environment, Department of Fisheries, Department of Irrigation and
Drainage, etc using different analytical procedures. There is no structured basis for collation, coordination and exchange of records between agencies. Dissimilar
methodologies render comparison and establishing reliability and usefulness of results
difficult.
• Small individual resort development less than 50 ha do not require EIA. A mushrooming
of several small establishments could generate a cumulative impact to the environment,
particularly for development in small islands.
• In the competition for development space along the shoreline, under-utilised tourism
facilities such as marinas and hotels represent a waste of resources that deprive benefits
to other users and stakeholders. The viability of tourism facilities must be evaluated
before construction.
• State Government has jurisdiction over land based activities such as resort development.
The Marine Park administration has no control of the sediment loads generated from
land based sources. This is further compounded by limited manpower resource to patrol the Parks comprehensively.
• Many coral reef areas outside the Marine Parks are yet to be protected. These areas
come under the State or Federal Directorate of Lands and Mines depending whether the reefs are in or outside of State waters or within territorial waters. The Directorates have
neither the mandate nor resource to manage and control damage and exploitation of
coral reefs.
• At present sea grass beds are not protected. Even if protection similar to that for coral
reefs is accorded, sea grass beds will encounter the same weakness in management as
experienced for coral reefs.
• There is absence of studies on the capacity of the coral reefs to sustain a given visitor
volume. Hence there is no assurance that the corals reefs are not degraded by excessive
traffic and even so in Marine Parks where ‘protection’ status is given.

Chapter 9 MANAGEMENT OF THE COASTAL ZONE
___________________________________________________________________________________________
___________________________________________________________________________________________
March 2009 9-19
9.5 INTEGRATED COASTAL ZONE MANAGEMENT (ICZM)
Different countries have applied various forms and levels of Integrated Coastal Zone Management (ICZM) since 1970. The principle of sustainable development was brought to world-wide focus at the
United Nation Conference on the Environment and Development ( UNCED ), Rio De Janeiro, 1982 (Earth Summit) with the pronouncement of Agenda 21. As a signatory to the Rio Conference,
Malaysia accepted all obligations to implement ICZM within its territories. This intent was reinforced with signatory to the Convention on Biological Diversity 1992 and the RAMSAR (Wetlands)
Convention 1994 which contain issues and matters relating to the coastal zone.
ICZM has been defined as “a process of governance that consists of the legal and institutional
framework necessary to ensure that development and management plans for coastal zones are integrated with environment (including social) goals and are made with the participation of those
affected. The purpose of ICZM is to maximise the benefits provided by the coastal zone and to
minimise the conflicts and harmful effects of activities upon each other, on resources and on the environment ” (World Bank Guideline, 1996)
A Coastal Zone Management Plan (CZMP) must contain the following elements :
• Assign the responsibility for the plan to particular agencies, including division of
responsibilities between national and regional agencies
• Present the definition of the Coastal Zone
• Authorize the funding necessary for development of the plan
• Define the objective of the CZMP
• Specify a method of collaboration among the various agencies and stakeholders
• Give a time schedule for the formulation of the plan
A CZMP thus provides a national framework for a balanced development of the following main issues that normally expose the coastal zone to competing pressures : 1/
• Coast protection and shore protection
• Agriculture, fisheries
• Habitation, infrastructure, industrial development, public utilities and navigation
• Tourism and recreation
• Coastal resources (landscape-and marine habitat) preservation
• Raw material utilisation
The Integrated Coastal Zone Management Policy, 2004 is still in draft term. The definition of the coastal zone under the ICZM Policy is the area where coastal waters and the adjacent shore meet in
which the seaward area of the coastal zone extends from the low-water line to a distance of 24
nautical miles or to the extent of Malaysian jurisdiction as determined by maritime boundary treaties. The landward area of the coastal zone includes the inter-tidal zone along with an area that extends
from the high-water line to a distance of 5 km and including the full extent of any gazetted reserve or other sensitive areas defined by the relevant State Government, and may extend further inland
beyond the 5 km limit. This definition also applies to all offshore islands and territories under
Malaysian jurisdiction.
9.6 INTEGRATED SHORELINE MANAGEMENT PLAN (ISMP)
9.6.1 Shoreline, Sedimentation Cells and Management Units
The shoreline zone is the interface between the land and sea. DID Terms of Reference for ISMP
studies have specified the study area to cover 1 km landward of the shoreline and 12 km seaward of the shoreline.
Sediment Cell is a length of coastline and its associated nearshore area within which the movement
of coarse sediment (sand and shingle) is largely self contained. Interruption to movement of sand
and shingle within one cell should not affect the beaches in an adjacent sediment cell.

Chapter 9 MANAGEMENT OF THE COASTAL ZONE
___________________________________________________________________________________________
____________________________________________________________________________________________
9-20 March 2009
Sediment Sub-Cell is a sub-set of a sediment cell within which the movement of coarse sediment
(sand and shingle) is relatively self contained.
A Management Unit (MU) is a length of shoreline with coherent characteristics in terms of natural coastal processes and land use. Each unit is likely to have its own characteristics based upon the
nature, risks and demands on that part of the coast. An illustration of the relationship between management units, sediment cells and sub cells is shown in Figure 9.2.
Source : DID Terms of Reference for ISMP Studies
9.6.2 Shoreline Management Planning
The purpose of Shoreline Management Planning is to identify the resources and assets in the coastal area now and in the future and through that minimise negative consequences from the interaction
between the various interests, i.e. tourist and economical development, coastal protection, natural dynamics etc.
Shoreline Management Planning is the part of the Integrated Coastal Zone Management that deals
with the interaction between the actual and potential coastal evolution and the existing planned
activities in the coastal area.
The aim of a Shoreline Management Plan (SMP) is to provide the basis for the implementation of overall sustainable shoreline management policies and strategies – a management strategy – for a
well defined region and to set the framework for the future management of conflicts in the coastal
area.
A Shoreline Management Plan is a strategy document that delivers a broad-brush assessment of the coastal resources, conflicts, opportunities and constraints. The plan must therefore contain reference
to the adopted policies and to the adopted regulatory system as well as to the Coastal Zone
Management Plan.
The SMP shall address, in broad terms, whether to defend, or continue to defend assets with coastal defenses or manage the risks through other means. The plan shall be based on a strategic
assessment of conditions within the plan area rather than detailed studies of individual sites.
Figure 9.2 Orientation of Management Units
Land
Sea

Chapter 9 MANAGEMENT OF THE COASTAL ZONE
___________________________________________________________________________________________
___________________________________________________________________________________________
March 2009 9-21
9.6.3 ISMP Studies
The coastal area comprises a diversity of resources and interests. Management and planning of the coastal area should be addressed in an integrated manner not limited only to engineering related
topics such as protection against coastal erosion and flooding but also to consider other important related factors such as land use, natural environment, socio-economics, etc. An ISMP should provide
the framework for decisions on the planning and management for a specified length of coast, taking into account the natural coastal processes, current and future land use, coastal features and
habitats, environmental considerations, planning issues and associated conflicts, opportunities and
constraints. Planning for coastal development should be examined for the entire extent of a sediment cell rather than for a localised stretch of coast. The ISMP will address selected coastal defense
options for erosion control for the coastline. The aim is to produce clear strategic guidelines for the future management of the complete stretches of the Malaysian coastline reflecting wide coastal
issues.
The ISMP in a State represents a development plan for the shoreline that is sensitive to the particular
conditions of the coast whilst optimizing its overall development potential and is consistent with the general development policies of the State. The ISMP will take into account the general policies of
sustainable development including:
• Integrated management of coastal resources
• Optimization of development potential
• Provision for the socio-economic welfare of the existing and future population
• Environmental conservation and preservation
The procedure for developing an ISMP is undertaken through three phases. Phase 1, Data Collection and Analysis is essential to provide the knowledge of the study area in order to formulate the
Management Objectives in Phase 2 which leads to the final development of the ISMP in Phase 3.
Due to the rapid development and dynamic morphology of the shoreline zone, the time horizon for
the ISMP is considered to be 10 years, such that demand and carrying capacity are assessed over this time frame.
9.6.4 Baseline Study
The documentation of the Baseline Reports comprising the collated reports of the studies, field
surveys and analyses provide the database for the formulation of proposals for objectives and
management strategies which will set the recommendations for the ISMP.
• Primary and secondary data collection
• Analysis of coastal processes
• Pollution loading assessment
• Environmental assessment
• Fisheries and aquaculture assessment
• Recreational and tourism assessment
• Archaeological and historical assessment
• Social Economic assessment
• Land use assessment
• Legal and institutional assessment
• Contact and feedback from key interest group (Kumpulan Kerja Pengurusan Garis Panduan KKPG)
The coastal engineering aspects include coastal hydrodynamics, nearshore wave characteristics, coastal sediment budget, coastline classification, shorelineline evolution, suspended sediment plumes
dispersion and tidal flushing and water quality. The result of the numerical modeling and analysis of
sediment budget would establish the shoreline evolution, which is decisive for the erosion and accretion of the natural coast and for understanding impacts from man-made structures, existing or

Chapter 9 MANAGEMENT OF THE COASTAL ZONE
___________________________________________________________________________________________
____________________________________________________________________________________________
9-22 March 2009
planned. Sections of shoreline sensitive to erosion and accretion are identified based on the sediment
budget/ shoreline evolution.
Environmental assessment covers coastal and marine habitats and wildlife. Fisheries, aquaculture,
recreation and tourism are important economic activities of the coast. The historical legacy of past and more recent periods along the coastline add value to the character of the environment.
9.6.5 Management Objectives
The objectives include general shoreline development objectives based on sound technical and ecological considerations and particular objectives relating to the management of more specific
characteristics of the coastal environment. These are presented under four main generic environment sectors namely (i) Physical / Chemical, (ii) Biological/Ecological, (iii) Socio-Cultural and
(iv) Economic.
(i) Physical / Chemical
Morphology
• Eroding coastline where there is no significant development should be left to erode
naturally (sacrificial erosion buffer) in order to maintain the sediment budget balance
and avoid potential down-drift impact.
• Eroding coastline where there is significant development should be protected either by
revetment or beach nourishment or other types as relevant. • Development in areas immediately adjacent to river mouths, which are subjected to
considerable short term morphological changes, should be prohibited.
• Setback requirement for building structures on the coast should be enforced to avoid
economic loss from erosion. The 60 m setback guideline should be varied related to location whether in highly morphological active areas or in protected areas.
• Development seaward of the 1 : 25 year coastal storm surge line including potential sea
level rise line should be avoided.
• Other than at major fishing centres, the cost of river mouth improvement works to
mitigate sedimentation problem cannot be reconciled against the potential benefits, particularly given the possible problem of down-drift erosion.
• Setback in coastal dune areas should be located behind the dunes, which assist shoreline
stability. • Small offshore reefs should be protected as they provide a natural defense of the
coastline.
Construction/Dredging/ Reclamation
• Construction of coastal structures which can significantly interfere with sediment bypass
mechanism should not be permitted. • Coastal protection should have regard for valuable natural habitats. Construction must
adopt technical consideration of coastal processes.
• Vertical seawall structures which reflect wave energy are not encouraged for coastal
defense. In situations where public access to the beach is important, staggered seawalls which partially disperse rather than reflect wave energy are preferred to vertical
seawalls.
• Rubble mound revetment structures should be used for coastal defense where public
access to the beach is not critical and hence not hampered seriously. • Shore perpendicular structures on an open coast for coastal defense are not encouraged
due to their potential down-drift erosion problem. In certain circumstances, in the
vicinity of river mouths and in association with other forms of protection, shore perpendicular structures may be used discretely with proper design.
• Shoreline engineering works related to infrastructures, facilities and housing should be
subject to EIA.

Chapter 9 MANAGEMENT OF THE COASTAL ZONE
___________________________________________________________________________________________
___________________________________________________________________________________________
March 2009 9-23
• Prohibit hill development along the coast in areas exceeding permissible gradient in
accordance to the Town and Country Planning Act.
• River sand mining should be controlled with a river sand mining master plan and subject
to EIA approval. Sand mining from the shoreline and sand dunes should be prohibited. • Sand mining in foreshore areas should be prohibited.
• Offshore sand mining should be prohibited in morphologically active areas and be
restricted seaward of a pre-determined CD contour and subject to DID guidelines and
EIA approval.
• Cutting of random individual boat access channels through mud-flats or reef flats should
be discouraged. A common approach in mild wave activity area should be designated. • Mangrove areas are important tidal prism resources. Reclamation of mangrove areas will
reduce tidal prism with direct impact on river mouth stability and should be prohibited.
• Coastal sand dunes and sand dune forests are important buffers to coastal erosion and
coastal flooding. Dunes serve as natural habitats and reservoirs of sand to pacify natural erosion and combat the negative impacts of sea-level rise. Existing sand dune areas
should therefore be protected.
Water Quality
• Maintain or re-establish good coastal water quality by controlling discharge of pollutants
and nutrients. Hygienic water quality and beach cleanliness should be maintained to
sustain tourism development and domestic recreation. • Tourism development and activities as well as domestic recreational activities should
avoid areas of major sources of pollution.
• Enforce existing regulations and discharges, operation of treatment facilities and IWK
guidelines as immediate approach. Improvement of water quality standards and
treatment facilities are recognized as a long term solution. • Adopt National Interim Marine Water Quality Standards for classification of permissible
and/or desirable usage of marine waters (Refer Appendix 9-A). The following regime is
recommended :
Type 1 – For ecologically sensitive areas (including for fisheries/aquaculture)
Type 2 – For all tourism and recreational water use Type 3 – Developed and industrial areas area
(ii) Biological/Ecological
Terrestrial
• Coastal headlands are visually attractive natural features representing some of the
remaining areas of ecological significance in the coastal belt. Consequently, these areas should be conserved as far as possible or restricted to development of low density
tourism/ recreational related projects to maintain their ecological and visual significance. • Protect coastal peat swamp forests as natural habitat buffer to coastal flooding.
• Protect gazetted terrestrial forest and wildlife reserves with inclusion of sufficient buffer
zones.
• Shorelines with documented turtle landings should be protected with additional setback
provided for any new structures.
Inter-Tidal
• Mangroves support important fisheries resources, which have declined in recent years
predominantly due to human pressure. Remaining mangrove areas should be preserved
for the benefit of the fishing and tourism industries. • Development should be discouraged near critical sub-tidal nursery areas for fish and
other aquatic resources. • Degraded mangrove resources should be rehabilitated.

Chapter 9 MANAGEMENT OF THE COASTAL ZONE
___________________________________________________________________________________________
____________________________________________________________________________________________
9-24 March 2009
Marine
• The preservation and rehabilitation of coral reef patches should be given a high priority due to the benefits to the nearshore fisheries resource and tourism potential represented
by these habitats.
• Development in the proximity of coral reefs and seagrass beds should be subjected to
EIA requirements. • Protect gazetted marine park and conservation areas with inclusion of adequate buffer
zones. Control of land use on islands within gazetted marine parks should be defined.
(iii) Socio-Cultural
Planning
• The unique cultural setting of community and local manufacture along the coast should
be maintained in selective strategic areas as an attraction to support coastal tourism. • Tourist development along the shoreline is recommended to be broken into clusters
separated by various natural buffers provided by morphology and existing landuse, such
as headlands, public recreational areas and river mouth areas.
• Strategic kampung areas should be developed in such a manner as to maintain their architectural integrity in order to preserve the cultural heritage of the coast and promote
Rural Tourism in line with the government’s initiatives.
Tourism
• Tourism development that benefits the local community should be encouraged.
• Public access to the shoreline is vital for the local population and visitors alike. This
should be enhanced though the provision of sufficient land zoned for public recreational
purposes.
Cultural Heritage
• The high level of rural-urban migration is seen as a threat to the sustainability of the
coastal villages. Initiatives are required to develop kampung industries that are
consistent with the development of Rural Tourism along the coast, for example, arts and
crafts. • Historical and educational sites along coastline that are presently degraded and/or
under-utilized should be promoted as the important tourism resource they represent.
• To combat social and economic problems arising from the decline in the nearshore
fishing sector, targeted re-direction of the nearshore fishing fleet towards sport and recreational fishing should be made to maintain and develop the human resources within
the fisheries sector.
(iv) Economic
General
• Priority in development along the coast should be only accorded to uses that are water
dependent such as ports, fisheries and coastal tourism.
• Protect, enhance and maintain the high biodiversity of natural resources of undeveloped
coast. Any proposed new development on undeveloped coastal area must have strong
justification. • Increase the quality of existing recreational and urban areas as an alternative to
expansion to new undeveloped areas. Solutions to coastal problems should always be in
line with the economic value of the resource in question. • Coastal fisheries are important to the local coastal community. Declining fish stock is a
threat to the economy and can be expected to give rise to social and economic problems
if the decline continues.

Chapter 9 MANAGEMENT OF THE COASTAL ZONE
___________________________________________________________________________________________
___________________________________________________________________________________________
March 2009 9-25
Tourism • Large-scale international resorts should take priority for locating in areas of the coastline
with high beach and water quality consistent with the general desires of their intended
market.
• Where, there is a prevailing low occupancy rate for major resorts in a particular location,
the viability of further development of such facilities should be assessed or otherwise deferred until such time as existing facilities achieve high occupancy levels.
• Aesthetic beach quality is important to coastal tourism and beach cleanliness should be
rigidly maintained. • Tourism depends upon the preservation of the attractive nature of the coastline.
Consequently, development should be planned in a manner that conserves the coastline
for the tourism industry and prevent the encroachment of industrial activities.
• Small-scale Rural Tourism based upon the village lifestyle will increasingly become a
tourism resource and is the most secured method for ensuring distribution of revenue derived from tourism to the local population.
Fishery
• For inshore fishery, the maximum sustainable yield has been continually exceeded as indicated by declining fish catch. Protect, conserve and rehabilitate coastal and marine
habitats to enhance recovery of fishery resources.
• Illegal trawling is a threat to nearshore fishery resources, particularly from the point of
view of wastage through juvenile catch. This further causes stress on the spawning and feeding grounds. All forms of destructive fishing such as dynamite, cyanide are threats
to the marine ecosystem. Illegal trawling and destructive fishing should be prohibited by education of the fishermen and surveyance by the authorities.
• Due to the present level of stress on coastal fishery resource, the deployment of artificial
reefs should be viewed as an attractive method of facilitating recovery of fish stock.
• Promote development of aquaculture industry on an environmentally sustainable basis.
• Location and facilities for fish landing centres should be carefully selected to optimize
use by the fishing community. • Dumping of spoils at sea and marine dredging must take into account the prevailing
currents in order to avoid impacting already stressed coastal fishing areas.
Industry
• Industrial development in the shoreline zone should be restricted to a limited number of
areas away from tourism locations. Sufficient buffer should be provided to prevent the
degradation of tourism resources.
• Effluents from industrial areas should be rigorously treated and directed away from
tourism/ recreational areas and important biological resources.
9.6.6 Development Strategies
The ISMP will best be implemented through the Local Plan. Hence, the management strategies are expressed as development control guidelines for various categories of land use along the shoreline.
By expressing the findings and recommendations of the ISMP as land control guidelines will make it possible for the ISMP to be readily incorporated into and absorbed by the Local Plan. For the
purpose of making land use recommendations, the strip of coastal land is sub-divided into
Management Units (MUs), each unit being an area of the homogeneous physical, ecological and socio-economic conditions.
Basically there are two categories of control, either development permitted or development
prohibited. However sub-categories are introduced to reflect the differences that are distinguished in the exactitude and particular purpose of control within the two categories.

Chapter 9 MANAGEMENT OF THE COASTAL ZONE
___________________________________________________________________________________________
____________________________________________________________________________________________
9-26 March 2009
Category 1 Development Permitted
1 A Development Permitted with Standard Conditions
Land where no constraints are presented by the ISMP findings and development may proceed in accordance with normal procedures.
Under this category, development is permitted subject to normal State and Local Authority
regulations. The conditions and requirements include, but are not necessarily limited to:
• Local Plan land use zoning
• Other Local Plan stipulations such as density, plot ratio, plinth coverage, height control,
etc. (if applicable)
• Local Authority Planning Standards
• Local Authority Building bye-Laws
• Department of Town and Country Planning Guidelines on development on slopes, flood
prone areas, etc. as adopted by the Local Authority • Environment Quality Act (EQA) requirements on pollution control.
1B Development Permitted with Restrictions
Land where the ISMP findings indicate that development would have detrimental effect on
the shoreline or terrestrial or marine habitats or the development itself may encounter potential risks requiring conditions or mitigating measures to be imposed.
The suggested restrictions emanated from the ISMP studies are separate and additional to
the conditions imposed under the Town and Country Planning Act and normal town planning
practice. Restrictions are either in the types of development that may be permitted or in the form of conditions placed upon development applied for. The reasons for restrictions arise
from one or more of the following factors:
• Morphology: these are areas subject to moderate risks of erosion or flooding, or where
infrastructure requires special protection, or which possess morphological features that
require special consideration. These areas include morphologically active areas along eroding river mouths.
• Natural Habitat and Ecology: these are areas of natural beauty and ecological or
biodiversity value where development has a potential deleterious impact and mitigating
measures should be taken. They include pocket areas of mangrove forests.
• Water Quality Degradation and Pollution: these are areas where the marine water quality
has suffered serious degradation. Restriction may be imposed as a temporary measure
until such time when the water pollution problem is resolved.
• Social and Cultural Compatibility: these are areas where the traditional settlement
pattern and lifestyle of the people are still vigorous and sustainable. Development should be of a type and scale that could benefit the local population and blend with the cultural
and heritage setting and not be disruptive.
Category 2 Development Prohibited
2A Protected Areas
Land which is presently protected against development such as forest reserve, natural
reserve, bird sanctuary and for military use. The ISMP strongly supports this protection.
A Protected Area is an area protected under a Federal or State law and where unauthorised
usage or private development are prohibited. Such an area generally has ecological or

Chapter 9 MANAGEMENT OF THE COASTAL ZONE
___________________________________________________________________________________________
___________________________________________________________________________________________
March 2009 9-27
heritage values or of national security importance with management responsibilities placed
under a “protector” agency such as the Forestry Department, Department of Wildlife and
National Parks, Ministry of Defense, Local Authority, etc. Protected Areas may include National or State Parks, Public Open Spaces, recreational forests, etc. In the context of the
ISMP, a Protected Area differs from a Prohibited Area in that it is an area where not only is development prohibited but the status quo of the area should be constantly monitored, its
ecological health sustained and the public’s interest in it for recreational purposes, scientific studies, national security and other purposes actively promoted.
2B Prohibited Areas
Land where active morphological conditions prevail or the conservation of the particular coastal site is integral to its ecological function or tourism viability. The ISMP findings
strongly advise against development.
Prohibited areas include areas that exhibit characteristics in active morphology similar to 1B
Areas of Permitted Development with Restrictions but to exceedingly more severe degree such that risks involved with shoreline development are high. Also included are areas that
provide natural protection to the coast such as sizable tracts of healthy mangrove forests and areas which are within the impact zone of off-shore ecologically sensitive areas such as
coral reefs, sea-grass beds, etc. Other areas are features of outstanding natural beauty,
scientific interest and high cultural/ heritage values.
9.6.7 Coastal Construction Setback
The National Land Code defines the shoreline as the high-water mark of ordinary spring tides and
the foreshore as all the land lying between the shoreline and the low-water mark of ordinary spring tides. In the case of advancing shoreline, land that has been alienated but thereafter becomes part
of the foreshore reverts to the State.
Foreshore setbacks or exclusion zones are useful strategies in coastal development control and coastal management as guidelines to avoid problems with short term coastal response and flooding
problems during stormy weather and to protect ecological functions. A permanent structure is one
which cannot be economically relocated in the event of pending damage from shoreline erosion. No permanent structures including building structures, swimming pool, roads, etc. should be permitted
within the setback zone. Structures allowable in the setback zone include buried or above ground utilities, fencing, walkways, parks, landscaping, simple wooden construction like gazebos, cabanas.
Erosion backstop (a concrete or rubble mound berm buried a minimum 20 m behind the existing
MHHW line) may be constructed to prevent extreme event erosion from damaging temporary structures and landscaping. It is recommended that all allowable structures are setback a minimum
20 m from the existing shoreline. (Figure 9.3).

Chapter 9 MANAGEMENT OF THE COASTAL ZONE
___________________________________________________________________________________________
____________________________________________________________________________________________
9-28 March 2009
Figure 9.3 : Foreshore and Reserve and Setback Limits
The definition of setback limit for a given site must consider short term erosion. Larger setback limits
should be imposed for extremely exposed sites with changing shoreline morphology while the limits can be relaxed for mildly exposed sites. DID Guideline 1/97 provides for a setback zone width of 60m
on the open coast. A 60m setback is generally appropriate for the more exposed sections of the coast but is not sufficient for highly morphological active areas of certain river mouths. Similarly,
some relaxation of the setback limits can be allowed in rocky and sheltered coastal areas.
As setbacks are only guidelines, enforcement is problematic, particularly with the interpretation of a
permanent structure. The concept of foreshore reserve is utilised to strengthen setback guidelines in some States. The Sabah Land Ordinance includes a provision of a 20m foreshore reserve (in the
same context of a riparian reserve for rivers) in which no development is permitted. The foreshore reserve is additional to the foreshore and is measured from the shoreline or land line of the
shoreline. The foreshore reserve may be used for aquaculture or any other purpose not involving the
clearing of existing mangrove or construction of structures.
Construction within the mangrove fringes should, in principle be avoided due to the impacts on tidal prisms and fisheries resources. However this is not always practical and the following guidelines
currently exist:
• Department of Irrigation and Drainage - 400 m from outer edge of mangrove forest; for
riverine setback, the river management requirement would generally suffice and where
ISMP is available, the requirement stated in the ISMP shall prevail.
• Department of Town and Country Planning (JPBD 6/2000 Jadual 9.3: Piawaian Pembangunan Zon Hutan Bakau) - 30m from vegetation line. Recent developments in intertidal mangrove areas generally follow the guideline. It is recommended that the
submission of formal EIA should address tidal prism, salinity and fish stock issues.
9.6.8 ISMP and Local Plans
The Town and Country Planning Act designates the Local Plan as a statutory “Development Plan” which is enforceable by law upon private developments. The Local Plan divides the specified district
into Planning Blocks (Blok Perancang BP), each BP coinciding with a mukim. The Planning Blocks are
further sub-divided into Sub-Planning Blocks (Blok Perancang Kecil BPK) with separate land use applicable to each individual BPK. The Local Plan adopts the standard land use classification as
shown in Table 9.6.
STATE LAND OUT TO BOUNDARIES OF
TERRITORIAL WATERS
INTERTIDAL LAND
FORESHORE RESERVE
60m setback
MHHW
Mean Sea Level
MLLW
Landward limit of foreshore defined by land ordinance
Seaward limit of foreshore defined by land ordinance
20m

Chapter 9 MANAGEMENT OF THE COASTAL ZONE
___________________________________________________________________________________________
___________________________________________________________________________________________
March 2009 9-29
Table 9.6 : Land Use Classification
Source : Town and Country Planning Department
The ISMP is aimed at protection, conservation and beneficial utilisation of the coast and its resources
and recommends development strategies for the shoreline. The recommendations are derived from the baseline study of oceanographic processes, morphological processes, existing land use and
sensitivity of the existing environment and ecological systems. The development strategies
promulgated in the ISMP are not a reaction to the permissible land use presented in the Local Plans. In some cases, the use categories advocated in the ISMP are further elaboration of the Local Plans.
In other cases, the ISMP recommendations result in an alternative land use. For development control purpose, the permissible uses of the Local Plans prevail until such time as the Local Plans are
amended.
Boundaries of Management Units (MUs) in the ISMP are not derived from the Local Plan and are
determined independently from the baseline study. Nevertheless to provide ease of comparison with the Local Plan, mukim boundaries are taken into account in the delineation of MUs. The use of
property lines as one of the parameters for determining MU boundaries helps to establish a correlation of the MUs to the land lots and facilitates a computerized database indexed upon lot
numbers to be readily created for reference use in evaluating planning applications.
The procedures for local planning are prescribed by law, and subject to public scrutiny as well as
opened to public participation. The Local Plan represents a “social contract” between the Local Planning Authority as the one party and the land owners and the public as the other party. Though
stakeholders’ involvement is essential for the ISMP, the process of preparation of the ISMP does not
require stakeholders’ participation to be conducted in the exact mandatory manner.
Class Land Use Activities No. of Land Use
Sub Categories
I I (a) Housing Perumahan 8
I (b) Villages Perkampungan 2
II II (a) Institutions Institusi 19
II (b) Religious Keagamaan 8 II (c) Education Pendidikan 4
II (d) Cemeteries Perkuburan 2
III III (a) Open Areas Kawasan Lapang 12
IV IV (a)
IV (b)
Commercial
Restricted
Commercial
Perdangangan Kegunaan Perdangangan Terhad
102
41
V V (a) Service Industries
Industri Perkhidmatan
27
V (b) Light Industries Industri Ringan 25
V (c) General Industries Class
‘A’
General
Industries Class ‘B’
Industri Am Kelas ‘A’ Industri Am Kelas ‘B’
16
28
V (d) Special Industries
Industri Khas 70
VI Agriculture Pertanian 4
VII Tourism Pelancongan 8
VIII Natural Areas Kawasan Semulajadi
3

Chapter 9 MANAGEMENT OF THE COASTAL ZONE
___________________________________________________________________________________________
____________________________________________________________________________________________
9-30 March 2009
The ISMP provides specialised information and development recommendations on specific sections of
the shoreline but are not statutory requirements. In order for the ISMP recommendations to be
implemented, there is a necessity to incorporate these into the relevant Local Plan in accordance to the due process of amendments provided by the Town and Country Act. The process is elaborate
and time-consuming, including public reviews and comments. There is no statutory requirement of a specific time interval for review of Local Plans at which point the ISMP recommendations may be
introduced as amendments. In the meantime, the ISMP could be adopted as a supplement document to the Local Plans to be used for providing additional conditions and advice for processing
development applications. Adoption for such temporary purpose can either be by an administrative
act of the relevant Local Authority Council or an instruction from the State Planning Committee. The ISMP cannot override the Local Plans and the ISMP recommendations on use permissibility may be
disputed by any level of stakeholders. Under such circumstances, the Local Planning Authority having decided to follow the recommendations of the ISMP, will be responsible for justifying that decision, if
required.
9.6.9 Application of the ISMP
The experience of the ISMP studies completed for North Pahang, South Pahang (including Pulau
Tioman) and Negeri Sembilan has provided an in-depth perspective of the challenges in coastal management for both an east coast and a west coast Malaysian context. Many of the factors and
issues related to the coastal environment are standard and common to different locations. Similarly
general management objectives are applicable to address these situations. Extensive lists covering these matters which are outputs from the studies are included in this Section of the Manual to serve
as comprehensive inventory check-lists for fuller appreciation and understanding of the readers and to assist prompt identification, accounting and performance of other ISMP studies.
Precise mapping and positioning details of the shoreline are fundamental information necessary for preparation of an ISMP. The availability of relevant topographic maps, cadastral plans and remote
sensing (satellite) images will accelerate early progress in the inception stage of an ISMP study. Aerial oblique photographs taken along the study coastline are of immense value to provide a broad
perspective of the land use and natural and man-made features. The aerial photographs taken during the NCES 1985 and stored in DID archives give an insight to changes in the coastal
environment and where possible, should be made accessible for future ISMP studies. Field surveys
and primary data collection should be properly planned and performed using latest techniques and equipment (e.g. DGPS).
The planning objective of coastal management is to ensure that land use changes and activities
associated with new developments are carried out in a sustainable manner. The State Economic
Planning Unit, State Economic Development Corporation, Land Office and Town and Country Planning Department usually have information on applications for land alienation, land conversion
and development planning permission. The Department of Environment will receive submissions of EIA reports for proposed development projects from the project proponents. Relevant information for
review and consideration of the ISMP studies should be sourced from these government agencies.
The 5th Malaysia Plan (1985 – 1990) had expressly projected tourism to arrest the deficit in the
service account and act as a new catalyst of growth to the national economy. Every State has since embarked on tourism development as an integral part of the State’s development strategy. The
planning of the coastal zone for tourism must balance development against the associated impacts on the environment to ensure that the value of the natural assets that created the demand are not
diminished by degradation but properly maintained and preserved for the long term. ISMP studies
should direct greater prominence on tourism development planning to identify resources suitable for tourism and their utilization possibilities and protection requirements. An assessment of strength,
weakness, opportunities and threats would help differentiate areas to be protected and areas that have potential for development and the type and level of utilisation.

Chapter 9 MANAGEMENT OF THE COASTAL ZONE
___________________________________________________________________________________________
___________________________________________________________________________________________
March 2009 9-31
Sea level rise is one of the outcomes of a global warming trend due to the Greenhouse Effect. The
pattern of long-term variation in sea level around Malaysia has been constructed using
radiometrically dated shoreline indicators in the form of interpreted sea level fluctuations. However, long-term measurement of sea level using automated instruments arranged in a network of
observations throughout Malaysia only started in 1984 under the auspices of Department of Survey and National Mapping. These recording stations have observed little or no change in measured sea-
level due mainly to the short record period. The ISMP for Pahang has however recommended a 25 year contribution from sea level rise in design water level of between 2 cm and 2.4 cm for the State’s
Coast.
The Intergovernmental Panel on Climate Change (IPCC) estimated global average sea level rose
between 10 cm and 25 cm in the past century. Furthermore IPCC projected sea level will rise 20 cm to 86 cm by the year 2100. Sea level rise is modulated by local changes due to land subsidence/
uplift and bathymetric response giving rise to relative sea level rise specific to a coastal region. ISMP
studies should make reference to IPCC forecasts for sea level rise and keep pace with their latest findings. It is relevant to include the influence of sea level rise in the design of coastal structures
particularly sensitive to flooding.
The Town and Country Act (Amendment) 2001 Act 1229 has made mandatory the production of State Structure Plans which replace the former State Development Plans prepared by the State
Economic Planning Unit which were not statutory plans. State Structure Plans also render Structure
Plans prepared for individual Local Planning Authority areas obsolete. The State Structure Plan system with legally enforceable plans will strengthen State planning. The State Structure Plans will
also be prepared within the National Physical Plan (NPP) system and reviewed every five years as a guide for State development. The NPP will further be integrated with the National 5-Year Plan. The
planning process review provides a regular opportunity for the plans at different levels to be made
congruent to one another.
Upon adoption of the ISMP by the State Government, direction could be given to the Town and Country Planning Department to incorporate the recommendations in the State Structure Plan at the
time of review. Incorporation and adoption of the ISMP into the statutory Local Plans is even more crucial as these are prepared and applied at a level of detail and scale that can utilise the
requirements provided by the ISMP to a fuller extent. To achieve optimum credibility and function,
the ISMP would best be absorbed as integral components of the Structure Plan or Local Plan to act as mainstream guideline for development control. The elements of concurrence and appropriate
timing need to be coordinated with the State Economic Planning Unit and the Town and Country Planning Department to facilitate the adoption of the changes at the review period. The
implementation of the ISMP then becomes definable and direct through local authority officers
responsible for land use and development control.
The need for sustainable development has been recognised and promoted for almost two decades. Yet examples of poor planning of development projects without regard to sustainability are still
prevalent. A strong legal and institutional framework is seen as a crucial force for effective
administration, control, regulation, enforcement and management.
The conduct of the ISMP studies will in the process engage stakeholders in an exchange of information on coastal events and activities. The Procedural Guidance for Production of Shoreline
Management Plans (Interim Guidance May 2003) prepared by Department of Environment Food and Rural Affairs, United Kingdom has outlined distinct objectives for stakeholders’ engagement as
reproduced below. The ISMP studies should set the strategy for public participation and promotion of
environmental awareness along the lines of these objectives.
• Improve the information base by accessing information held by other stakeholders, including
local planning authorities. • Improve decision making, validate approaches, and enable scrutiny and testing.
• Develop consensus by identifying and acknowledging shared views and objectives.
Acknowledged agreement to an SMP (Shoreline Management Plan) increases its legitimacy.

Chapter 9 MANAGEMENT OF THE COASTAL ZONE
___________________________________________________________________________________________
____________________________________________________________________________________________
9-32 March 2009
• Resolve differences of views through early and open discussion and through clear,
transparent procedures.
• Extend stakeholder understanding of SMPs, physical processes and the changing nature of
risk. • Establish links and networks useful in SMP implementation.
The application of the ISMP as a management tool is correctly actuated. Significantly, the ISMP must
be recognised by the government agencies, public and stakeholders as a management plan that is based on technical and scientific findings combined with socio-economic valuation to give discrete,
rational and professional recommendations. Interaction with the key interest government agencies, private groups and stakeholders should be carefully exploited to achieve a valid, relevant and useful
ISMP.
9.7 GIS APPLICATION IN SHORELINE MANAGEMENT
Geographic Information System (GIS) is a computerised information system that can input, store,
edit, manipulate, display and output data from a geographic foundation base for data management and analytical tasks involved in spatial planning. The Coastal Division has incorporated major
functions/activities including coastal engineering, river mouth dredging, coastal project implementation and monitoring and numerical modeling in a GIS framework. The system is under
progressive development.
The application of GIS technology and data management systems in shoreline management as
featured in the GIS Function Model (Figure 9.4) currently operated by Coastal Division is presented as a specific example. Hardware and software configurations are designed to meet requirements of
the data collection programmes, shoreline management, GIS and numerical modeling. The following essential data are identified for inclusion/incorporation in the GIS databases.
Figure 9.4 GIS Function Model
Hard Copies Topographic Maps Hydrographic Maps Bathymetric Maps Engineering Drawings
Time Series Data Meta Data/ Observations /Statistical Data
Digital Data Digital Maps/ Drawings/ Satelite Images
Photography/ Maps Aerial Photography Maps
A/D Digitizing
Filtering
Filtering
A/D Scanning
Geographical Information System (GIS)
Shoreline Erosion Monitoring
Coastal Engineering Management
Coastal Data Inventory
- Digital Maps of shoreline erosion conditions
- Digital shoreline material distribution
- Critical erosion sites
- Shoreline change detection
- Structure design
- Coastal zone management
- Coastal project monitoring
- Rivermouth and dredging
- Numerical modelling
- Location of existing erosion control structures
- Data input
- Base map display
- Query by location
- Query by data types
- Query of existing data
- Editing
Output
Reports Digital Maps Graphic Display Databases

Chapter 9 MANAGEMENT OF THE COASTAL ZONE
___________________________________________________________________________________________
___________________________________________________________________________________________
March 2009 9-33
Photographic Data (for shoreline changes) : Aerial photographs of the entire national shoreline
should be taken every 5 years in order to accumulate data for monitoring long term shoreline
changes (NCES, 1985). Larger scale aerial photographs should be taken more frequently for severely eroded shoreline segments, for example every 1 – 3 years and these photographs may be used also
for other purposes such as coastal zone topographic mapping, beach profiling, and erosion interpretation. For very small sites, total stations and GPS receivers may be used to capture the
shoreline periodically and compare the shoreline changes. Bathymetric Data: Hardcopy nautical charts of scales 1: 15,000 and 1: 200,000 and bathymetric
data in digital format are available. Bathymetric data are maintained by Royal Malaysian Navy and
some oil and gas companies. Hydrographic survey of small areas are also conducted or contracted out by Coastal Division. Bathymetric data are crucial to structure design, numerical data, the water
level and other factors.
Topographic data: Topographic maps of scale 1: 50,000 covering features on the landward side of
the shoreline are maintained by Department of Survey and Mapping. Digital Terrain Models (DTM) describe the land terrain relief which determines the shoreline shape along with the bathymetric
data, water level and other factors.
Attribute Data: GIS attributes such as demography, land use, geology, soil types, environment quality etc. should be included. These data are sometimes necessary in decision making, for example
for setback planning, protection of residential areas, limiting or avoiding environmental impacts and
other purposes. Once the shoreline geometry is built as routes in the network system of ArcInfo, dynamic segmentation can be used to model the change of the attributes of shoreline. However,
changes of the attributes do not require the re-segmentation of the shoreline.
Multimedia data: Terrestrial and aerial photographs are available for shoreline sections of different
periods. Hardcopy photos are scanned into the system. The scanned images are then related to the desired features and can be displayed by clicking the corresponding features using a hot link. Design
drawings can also associated with features so that features and corresponding drawings can be examined at the same time. Video clips, audio sound effect of approaching waves against structures,
and results of simulation and animation may also be included in the future.
Time series data: Data of wave, wind, current, wave surface elevations (tides) and river (daily
discharge), and other time series data describe the processes affecting the shoreline and other coastal phenomena. Currently, the time series data included in this system are:
• Littoral Environment Observation (LEO) data contain wave, beach slope, current, and
water level information. 18 LEO sites are distributed in the country and provide data
every month to Coastal Division since 1987.
• Wave data: WaveriderTM are results of statistical analysis of wave data based on 20
minutes records sampled at 2.56Hz every 3 hours (Willis 1995). Pressure gauge data of two locations and water level data from two other sites also available.
• Surface Ship Meteorological Observations (SSMO) data from National Climatic Data
Centre of USA from 1949 onward which cover the Malaysian waters. The SSMO data in dBASE format include both general information such as a Marsden square number, data
and time of the data acquisition, and data fields containing information about wave,
swell, wind, meteorological conditions, and ship speed and direction (Kjerfve 1995).
In the future other types of time series data may be included in the system, such as satellite derived wave data and wave data from global/regional wave forecast models.
Data sets input to the system could be meta data of time series, digitized/scanned hard copy maps,
existing digital maps, coastal engineering drawings and scanned aerial photographs. These data are
all in certain digital formats. If the digital format does not match the native format of GIS, a data format conversion (filtering) becomes necessary. If the data source is of an analog form, an analog
to digital (A/D) conversion such as digitizing or scanning has to be performed before the information can be used in GIS.
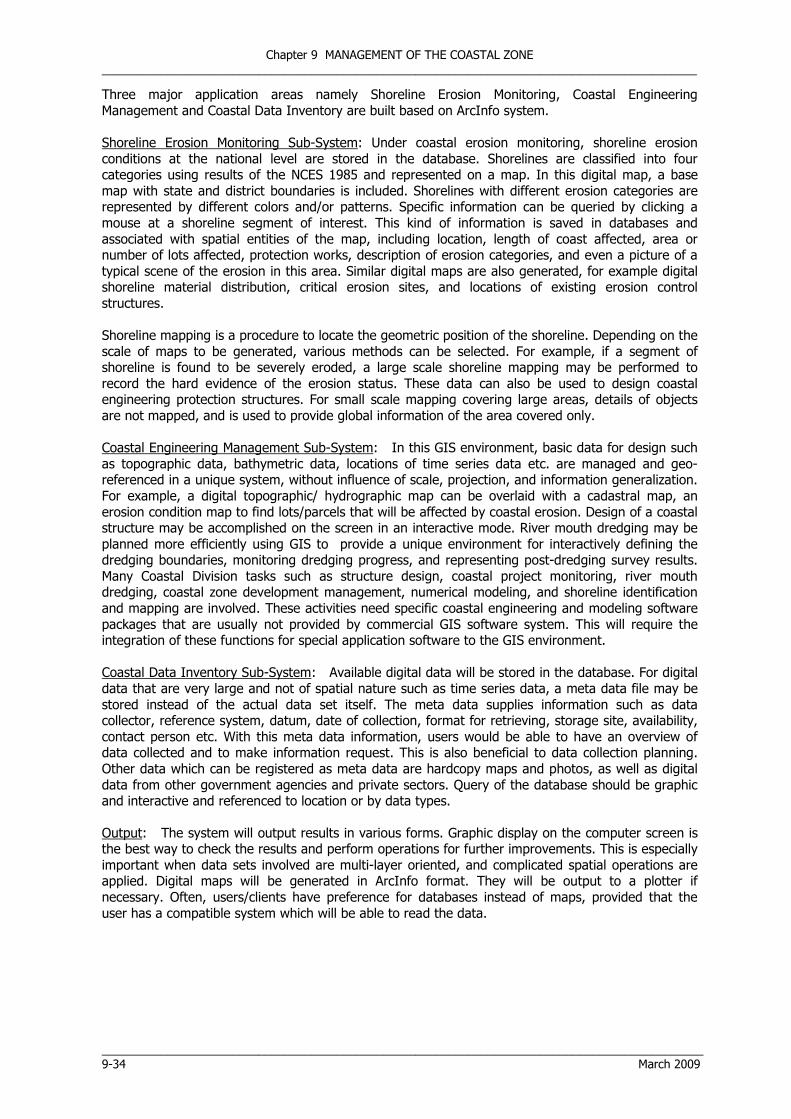
Chapter 9 MANAGEMENT OF THE COASTAL ZONE
___________________________________________________________________________________________
____________________________________________________________________________________________
9-34 March 2009
Three major application areas namely Shoreline Erosion Monitoring, Coastal Engineering
Management and Coastal Data Inventory are built based on ArcInfo system.
Shoreline Erosion Monitoring Sub-System: Under coastal erosion monitoring, shoreline erosion
conditions at the national level are stored in the database. Shorelines are classified into four categories using results of the NCES 1985 and represented on a map. In this digital map, a base
map with state and district boundaries is included. Shorelines with different erosion categories are represented by different colors and/or patterns. Specific information can be queried by clicking a
mouse at a shoreline segment of interest. This kind of information is saved in databases and
associated with spatial entities of the map, including location, length of coast affected, area or number of lots affected, protection works, description of erosion categories, and even a picture of a
typical scene of the erosion in this area. Similar digital maps are also generated, for example digital shoreline material distribution, critical erosion sites, and locations of existing erosion control
structures.
Shoreline mapping is a procedure to locate the geometric position of the shoreline. Depending on the
scale of maps to be generated, various methods can be selected. For example, if a segment of shoreline is found to be severely eroded, a large scale shoreline mapping may be performed to
record the hard evidence of the erosion status. These data can also be used to design coastal engineering protection structures. For small scale mapping covering large areas, details of objects
are not mapped, and is used to provide global information of the area covered only.
Coastal Engineering Management Sub-System: In this GIS environment, basic data for design such
as topographic data, bathymetric data, locations of time series data etc. are managed and geo-referenced in a unique system, without influence of scale, projection, and information generalization.
For example, a digital topographic/ hydrographic map can be overlaid with a cadastral map, an
erosion condition map to find lots/parcels that will be affected by coastal erosion. Design of a coastal structure may be accomplished on the screen in an interactive mode. River mouth dredging may be
planned more efficiently using GIS to provide a unique environment for interactively defining the dredging boundaries, monitoring dredging progress, and representing post-dredging survey results.
Many Coastal Division tasks such as structure design, coastal project monitoring, river mouth dredging, coastal zone development management, numerical modeling, and shoreline identification
and mapping are involved. These activities need specific coastal engineering and modeling software
packages that are usually not provided by commercial GIS software system. This will require the integration of these functions for special application software to the GIS environment.
Coastal Data Inventory Sub-System: Available digital data will be stored in the database. For digital
data that are very large and not of spatial nature such as time series data, a meta data file may be
stored instead of the actual data set itself. The meta data supplies information such as data collector, reference system, datum, date of collection, format for retrieving, storage site, availability,
contact person etc. With this meta data information, users would be able to have an overview of data collected and to make information request. This is also beneficial to data collection planning.
Other data which can be registered as meta data are hardcopy maps and photos, as well as digital
data from other government agencies and private sectors. Query of the database should be graphic and interactive and referenced to location or by data types.
Output: The system will output results in various forms. Graphic display on the computer screen is the best way to check the results and perform operations for further improvements. This is especially
important when data sets involved are multi-layer oriented, and complicated spatial operations are applied. Digital maps will be generated in ArcInfo format. They will be output to a plotter if
necessary. Often, users/clients have preference for databases instead of maps, provided that the
user has a compatible system which will be able to read the data.

Chapter 9 MANAGEMENT OF THE COASTAL ZONE
___________________________________________________________________________________________
___________________________________________________________________________________________
March 2009 9-35
REFERENCES
[1] Shoreline Management Guidelines (December 2004) - prepared by Karsten Mangor DHI Water & Environment.
[2] Procedural Guidance for Production of Shoreline Management Plans (Interim Guidance May 2003) – prepared for Department of Environment Food and Rural Affairs, United Kingdom.
[3] Integrated Shoreline Management Plan (ISMP) for the Coastline from Kuala Sg. Pahang to the State Boundary of Pahang/ Terengganu (Report 2002) prepared by Jurutera Konsultant
(Semenanjung) Sdn. Bhd.).
[4] Integrated Shoreline Management Plan (ISMP) for South Pahang and Pulau Tioman (Report 2006) prepared by J.K. Bersatu Sdn. Bhd.
[5] Development of Decision Support System (ISM-DSS) for the Integrated Management of the Northern Pahang Coastline: Phase 1 Feasibility Study (Preliminary Evaluation and Assessment Report
2004) prepared by J.K. Bersatu Sdn Bhd.
[6] Integrated Shoreline Management Plan (ISMP) for Negeri Sembilan (Draft Final Report 2008) prepared by National Institute of Hydraulic Research Malaysia NAHRIM.
[7] National Integrated Coastal Zone Management (Malaysia NICZM Report 2004) prepared for Economic Planning Unit, Prime Minister’s Department, Malaysia by Universiti Putra Malaysia.
[8] Drafting of Policy Statement for Shoreline Management Act for Peninsular Malaysia (Draft Report 2006) prepared for Economic Planning Unit, Prime Minister’s Department, Malaysia by United
Consult Sdn. Bhd.
[9] National Coastal Erosion Study (NCES Report 1985) prepared by Stanley Consultants, Inc in association with Moffat and Nichol, Engineers and Jurutera Konsultant (S.E.A.) Sdn. Bhd.
[10] The National River Mouths Study in Malaysia (Report 1994) prepared by Japan International Corporation Agency JICA
[11] National Water Resources Study, Malaysia (Report 1982) prepared by Japan International
Corporation Agency JICA
[12] National Register of River Basins (Report 2003) prepared by KTA Tenaga Sdn. Bhd.
[13] Information Systems Strategy for IRBM in DID Malaysia – prepared for Economic Planning Unit –DID-LUAS-Kedah UPEN
[14] Garis Panduan Permuliharaan dan Pembangunan Kawasan Sensitif Alam Sekitar (KSAS) dan Kawasan Sekitarnya (Draft Report 2005) prepared by PAG Consult Sdn. Bhd.
[15] Malaysian Natural Conservation Strategy Toward Sustainable Development (1993) - prepared
for Economic Planning Unit, Prime Minister’s Department, Malaysia
[16] National Coastal Resources Management Policy (Draft, March 1993) - prepared for Economic
Planning Unit, Prime Minister’s Department, Malaysia.
[17] Integrated Coastal Management for Sustainable Development (July 2002) - prepared by Dato
Ir. Hj. Keizrul bin Abdullah, Director General DID for presentation at the International Conference on
Environmental Issues and Sustainable Development.
[18] GIS Application for Shoreline Management prepared by Ir. Cho Weng Keong, Coastal
Engineering Division DID.
[19] Geographical Information System for Shoreline Management – A Malaysian Experience
prepared by Dr. Rongxing Xi, Department of Geomatics Engineering, The University of Calgary,
Canada and Ir. Cho Weng Keong, Coastal Engineering Division DID.
[20] Shoreline Management in Malaysia-Program and Update prepared by Ir. Saw Hin Seang and
Ir. Tan Teow Soon.
[21] Technical Seminar on Shoreline Management (Technical Papers September 2000) -
organised by Coastal & Offshore Engineering Institute, Universiti Teknologi Malaysia.

Chapter 9 MANAGEMENT OF THE COASTAL ZONE
___________________________________________________________________________________________
____________________________________________________________________________________________
9-36 March 2009
[22] Forum on Infrastructure Development in the Next Millennium (Technical Papers April 1999)
- organised by the Institution of Engineers Malaysia.
[23] Beach Management – Eric C.F. Bird
[24] Coastal Management Manual (September 1999) - ISBN 0730575063 New South Wales
Government
[25] Coastal Engineering Guidelines (for working with the Australian Coast in an ecologically
sustainable way) – Draft March 1998 prepared by the National Committee in Coastal and Ocean Engineering and the Institution of Engineering, Australia.
[26] Coastal Zone Management – Towards Best Practice (1996) - prepared for the Department of
the Environment, UK.
[27] The Commonwealth Coastal Policy (to promote ecologically sustainable use of Australia’s
coastal Zone) : May 1995
[28] Shoreline Management Plans (A guide for coastal defense authorities) - prepared by the
Ministry of Agriculture, Fisheries and Food and the Welsh Office and others.

Chapter 9 MANAGEMENT OF THE COASTAL ZONE
___________________________________________________________________________________________
___________________________________________________________________________________________
March 2009 9A-1
APPENDIX 9-A
WATER QUALITY
Water pollution is the contamination of water bodies such as lakes, rivers, oceans, and groundwater
caused by human activities, which can be harmful to organisms and plants which live in these water bodies. Although natural phenomena such as volcanoes, algae blooms, storms, and earthquakes
also cause major changes in water quality and the ecological status of water, water is typically referred to as polluted when it is impaired by anthropogenic contaminants, which either does not
support a human use (like serving as drinking water) or undergoes a marked shift in its ability to support its constituent biotic communities.
Types of Pollutants
The types of pollutants that can be present in marine water are many. The Interim Water Quality Standards developed by the Department of Environment Malaysia lists over 40 parameters that can
be significant. However, for the purpose of this manual, the pollutants listed below are the most
commonly found pollutants in the marine water.
Water Quality Parameters and Standards
Chemical Oxygen Demand (COD)
The concentration of Chemical Oxygen Demand (COD) in the water represents the amount of oxygen
required to convert all oxidisable matter to carbon dioxide and water. Such oxidisable loads compete with aquatic life for oxygen and this affects the dissolved oxygen (DO). Neither the INMWQS nor
published literature set standards for COD (See Table 1 and 2 below).
Biological Oxygen Demand (BOD)
Biochemical Oxygen Demand or Biological Oxygen Demand (BOD) is a chemical procedure for
determining how fast biological organisms use up oxygen in a body of water. It is used in water quality management and assessment, ecology and environmental science. BOD is not an accurate
quantitative test, although it could be considered as an indication of the quality of a water source. The BOD concentrations are related to levels of organic matter in the water. As with COD, the
INMWQS does not specify standards.
Total Suspended Solids (TSS) Total suspended solids is a water quality measurement usually abbreviated TSS. Heavy siltation and
high sediment loads have a number of effects on aquatic life. Certain fish species are susceptible to
high levels of silt in the water, which can abrade and clog their gills causing severe haemorrhaging, osmotic imbalance and respiratory difficulties (Redding and Midlen, 1991). It also can lead to
reduction in dissolved oxygen levels and thereby adversely affect fish life.
Heavy Metals
A heavy metal is a member of an ill-defined subset of elements that exhibit metallic properties, which
would mainly include the transition metals, some metalloids, lanthanides, and actinides. Many different definitions have been proposed—some based on density, some on atomic number or atomic
weight, and some on chemical properties or toxicity. These metals are a cause of environmental pollution (heavy-metal pollution) from a number of sources, including lead in petrol, industrial
effluents, and leaching of metal ions from the soil into lakes and rivers by acid rain.

Chapter 9 MANAGEMENT OF THE COASTAL ZONE
___________________________________________________________________________________________
___________________________________________________________________________________________
9A-2 March 2009
Living organisms require varying amounts of "heavy metals." However, excessive levels can be
detrimental to the organism. Heavy metals such as mercury, plutonium, and lead are toxic metals
that have no known vital or beneficial effect on organisms, and their accumulation over time in the bodies of animals can cause serious illness.
Heavy metal pollution can arise from many sources but most commonly arises from the purification
of metals such as the smelting of ores. Electroplating is the primary source of chromium and cadmium. Through precipitation of their compounds or by ion exchange into soils and muds, heavy
metal pollutants can localize and lay dormant. Unlike organic pollutants, heavy metals do not decay
and thus pose a different kind of challenge for remediation.
Oil and Grease
Generally, oil and grease is not detected in natural waters. Therefore, their presence to certain
extent would have negative effects on the survival and growth of aquatic fauna. An oil spill is the release of a liquid petroleum hydrocarbon into the environment due to human activity, and is a form
of pollution. The term often refers to marine oil spills, where oil is released into the ocean or coastal waters. The oil may be a variety of materials, including crude oil, refined petroleum products (such
as gasoline or diesel fuel) or by-products, ships' bunkers, oily refuse or oil mixed in waste. Spills take months or even years to clean up.
Oil is also released into the environment from natural geologic seeps on the sea floor. Most human-made oil pollution comes from land-based activity, but public attention and regulation has tended to
focus most sharply on seagoing oil tankers.

Chapter 9 MANAGEMENT OF THE COASTAL ZONE
___________________________________________________________________________________________
___________________________________________________________________________________________
March 2009 9A-3
Table 1: Interim National Water Quality Standards for Malaysia (INWQS)
PARAMETERS CLASSES
Unit I IIA IIB III IV V
Hg mg/l N 0.001 NR 0.0001 0.002 +
-0.004
Ni mg/l N 0.05 NR - 0.2 +
(0.9*)
Se mg/l N 0.01 NR 0.037 0.02 +
-0.25
Ag mg/l N 0.05 NR - - +
(0.0002)
Sn mg/l N NR NR 0.05 - +
U mg/l N NR NR - - +
Zn mg/l N 5 NR - 2 +
(0.35)
B mg/l N 1 NR 3.4 0.75 +
Cl mg/l N 200 NR - 79 +
Cl2 mg/l N - NR 0.022 - +
CN mg/l N 0.2 NR 0.0023 - +
(0.058)
F mg/l N 1 NR - 1 +
(11)
NO3/NO2 mg/l N 7/3 NR 0.028 5 +
(0.37)
P mg/l N 0.1 NR 0.1 - +
Silica mg/l N 50 NR - - +
S mg/l N 0.05 NR 0.001 - +
CO2 mg/l N - NR - - +
MBAS/BAS mg/l N 500 NR 200 NR +
O & G (Mineral) mg/l N 40;NF NR NL NR +
O & G (Emulsified edible)
mg/l N 7000;NF NR NL NR +
PCB mg/l N 0.1 NR 0.044 NR +
(6.1)
- NR NR
Phenol mg/l A 10 NR (9900)
Aldrin/ mg/l A 0.02 NR 0.08 NR NR
Dieldrin mg/l A NR (0.2) NR NR

Chapter 9 MANAGEMENT OF THE COASTAL ZONE
___________________________________________________________________________________________
___________________________________________________________________________________________
9A-4 March 2009
NOTES:
CLASS I Conservation of natural environment water supply I - practically no
treatment necessary
Fishery I - very sensitive aquatic species
CLASS IIA Water supply II - conventional treatment required
Fishery II - sensitive aquatic species
CLASS IIB Recreational use with body contact
CLASS III Water supply III - extensive treatment required
Fishery III - common, of economic value, and tolerant species livestock
drinking
CLASS IV Irrigation
CLASS V None of the above
NV No visible floatable materials or debris
NOO No objectionable odour
NOT No objectionable taste
** Related parameters, only one recommended for use
@ Maximum not to be exceeded
NR No recommendation
* At hardness 50mg/l CaCO3
# 24-hr average and maximum (bracketed) concentrations are shown
NF Free from visible film, sheen, discoloration and deposits
NL Free from visible layer, discoloration and deposits
N Natural levels
+ Levels above Class IV
A Absent
Source: Malaysia Environment Quality Report 1998, Department of Environment (Table 5.6.3 )

Chapter 9 MANAGEMENT OF THE COASTAL ZONE
___________________________________________________________________________________________
___________________________________________________________________________________________
March 2009 9A-5
Table 2: WQ Parameter and Standards
Water Quality Standards for Fisheries and Aquaculture Purposes
Parameter Standards
pH 7.5 – 8.51
BOD (5 days @ 20°C) < 3 ppm2
Dissolved Oxygen > 4 ppm1
Salinity 12-25 ppt6
Unionised ammonia < 0.01 ppm1
Suspended Solids < 80 ppm2
Mercury (as Hg) 0.0025 ppm3
Cadmium (as Cd) 0.15 ppm3
Hexa-Chromium (Cr6+) 0.1 ppm4
Lead as Pb 0.1 ppm4
Copper as Cu 0.01 ppm3
Manganese as Mn 0.2 ppm5
Zinc as Zn 0.25 ppm3
Iron as Fe 1.0 ppm5
Source: Malaysia Environment Quality Report 1998, DOE (Table 5.6.4)
1 = Liong and Subramaniam, 1990 4 = Boyd, 1989
2 = Liong, 1984 5 = SCSDCP, 1982
3 = Chen, 1985 6 = Rosly, 1990
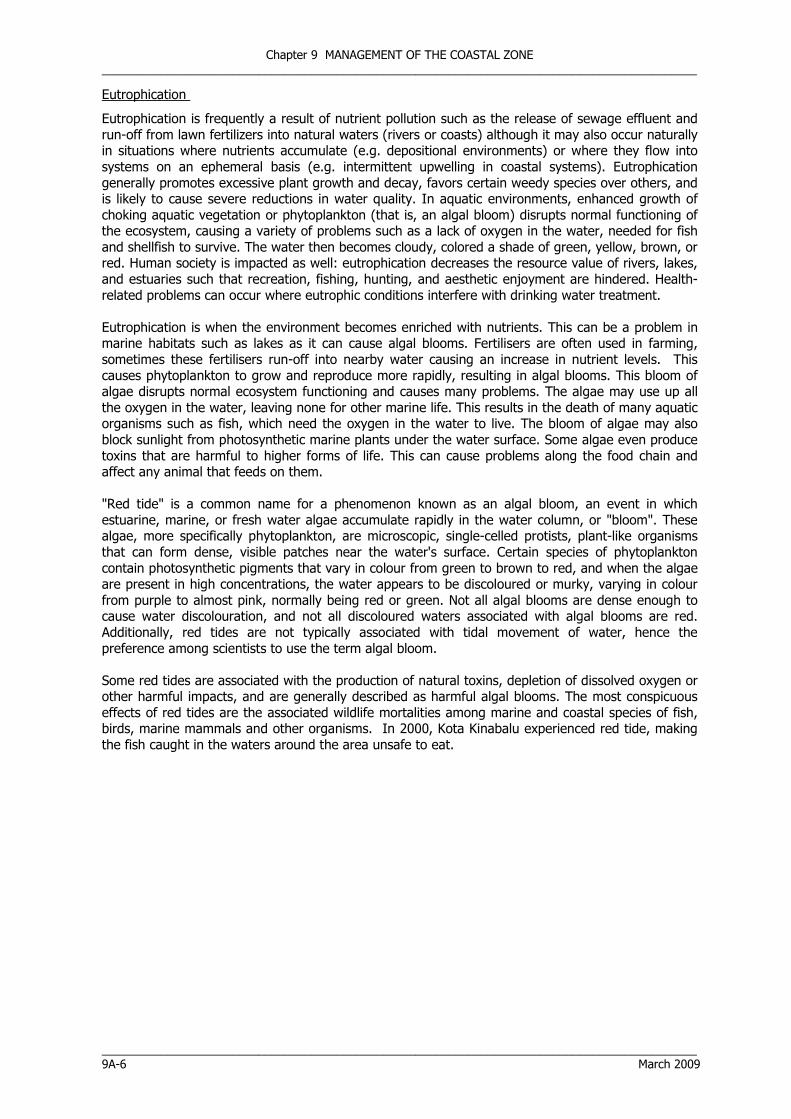
Chapter 9 MANAGEMENT OF THE COASTAL ZONE
___________________________________________________________________________________________
___________________________________________________________________________________________
9A-6 March 2009
Eutrophication
Eutrophication is frequently a result of nutrient pollution such as the release of sewage effluent and
run-off from lawn fertilizers into natural waters (rivers or coasts) although it may also occur naturally in situations where nutrients accumulate (e.g. depositional environments) or where they flow into
systems on an ephemeral basis (e.g. intermittent upwelling in coastal systems). Eutrophication
generally promotes excessive plant growth and decay, favors certain weedy species over others, and is likely to cause severe reductions in water quality. In aquatic environments, enhanced growth of
choking aquatic vegetation or phytoplankton (that is, an algal bloom) disrupts normal functioning of the ecosystem, causing a variety of problems such as a lack of oxygen in the water, needed for fish
and shellfish to survive. The water then becomes cloudy, colored a shade of green, yellow, brown, or red. Human society is impacted as well: eutrophication decreases the resource value of rivers, lakes,
and estuaries such that recreation, fishing, hunting, and aesthetic enjoyment are hindered. Health-
related problems can occur where eutrophic conditions interfere with drinking water treatment.
Eutrophication is when the environment becomes enriched with nutrients. This can be a problem in marine habitats such as lakes as it can cause algal blooms. Fertilisers are often used in farming,
sometimes these fertilisers run-off into nearby water causing an increase in nutrient levels. This
causes phytoplankton to grow and reproduce more rapidly, resulting in algal blooms. This bloom of algae disrupts normal ecosystem functioning and causes many problems. The algae may use up all
the oxygen in the water, leaving none for other marine life. This results in the death of many aquatic organisms such as fish, which need the oxygen in the water to live. The bloom of algae may also
block sunlight from photosynthetic marine plants under the water surface. Some algae even produce
toxins that are harmful to higher forms of life. This can cause problems along the food chain and affect any animal that feeds on them.
"Red tide" is a common name for a phenomenon known as an algal bloom, an event in which
estuarine, marine, or fresh water algae accumulate rapidly in the water column, or "bloom". These algae, more specifically phytoplankton, are microscopic, single-celled protists, plant-like organisms
that can form dense, visible patches near the water's surface. Certain species of phytoplankton
contain photosynthetic pigments that vary in colour from green to brown to red, and when the algae are present in high concentrations, the water appears to be discoloured or murky, varying in colour
from purple to almost pink, normally being red or green. Not all algal blooms are dense enough to cause water discolouration, and not all discoloured waters associated with algal blooms are red.
Additionally, red tides are not typically associated with tidal movement of water, hence the
preference among scientists to use the term algal bloom.
Some red tides are associated with the production of natural toxins, depletion of dissolved oxygen or other harmful impacts, and are generally described as harmful algal blooms. The most conspicuous
effects of red tides are the associated wildlife mortalities among marine and coastal species of fish, birds, marine mammals and other organisms. In 2000, Kota Kinabalu experienced red tide, making
the fish caught in the waters around the area unsafe to eat.

Chapter 10 LEGAL AND INSTITUTIONAL FRAMEWORK ___________________________________________________________________________________________
___________________________________________________________________________________________ March 2009
CHAPTER 10
LEGAL AND INSTITUTIONAL FRAMEWORK


Chapter 10 LEGAL AND INSTITUTIONAL FRAMEWORK ___________________________________________________________________________________________
___________________________________________________________________________________________ March 2009 10-i
Table of Contents
Table of Contents .................................................................................................................... 10-i
List of Figures ........................................................................................................................10-iii
10.1 INTRODUCTION ............................................................................................................ 10-1
LEGAL FRAMEWORK
10.2 LAWS ......................................................................................................................... 10-1
10.2.1 National Land Code 1965, Act 625...................................................................... 10-2 National Land Code (Validation) Act 2003
10.2.2 Town and Country Planning Act 1976 – Act 172 .................................................. 10-2
10.2.3 Local Government Act 1976 – Act 171 ................................................................ 10-2
10.2.4 Environment Quality Act 1974 – Act 127 ............................................................. 10-3
10.2.5 Land Conservation Act 1960 – Act 385................................................................ 10-5
10.2.6 Street, Drainage and Building Act 1974 – Act 133................................................ 10-5
10.2.7 Fisheries Act 1985 – Act 317 .............................................................................. 10-6
10.2.8 National Forestry Act 1984 – Act 313 .................................................................. 10-6
10.2.9 Protection of Wildlife Act 1972 – Act 76 .............................................................. 10-7
10.2.10 The Merchant Shipping Ordinance 1952, Act 70 .................................................. 10-7
10.2.11 Federation Port Rules 1953 ................................................................................ 10-7 Port Authorities Act 1963 – Act 488 Port Privatisation Act 1990 – Act 422
10.2.12 Continental Shelf Act 1972 – Act 83.................................................................... 10-8
10.2.13 Exclusive Economic Zone Act 1984 – Act 311 ...................................................... 10-8
10.2.14 Other Related Laws ........................................................................................... 10-8
10.3 GOVERNMENT CIRCULARS AND TECHNICAL GUIDELINES ............................................... 10-9
10.4 INTERNATIONAL CONVENTION INITIATIVES................................................................ 10-10
10.4.1 UN Conference on Environment and Development (UNCED)................................ 10-10
10.4.2 UN Convention on the Law of the Sea, 1982 (UNCLOS) ...................................... 10-10
10.4.3 International Maritime Conventions ................................................................... 10-12

Chapter 10 LEGAL AND INSTITUTIONAL FRAMEWORK ___________________________________________________________________________________________
___________________________________________________________________________________________ 10-ii March 2009
INSTITUTIONAL FRAMEWORK
10.5 LAND ADMINISTRATION.............................................................................................. 10-13
10.6 TOWN PLANNING........................................................................................................ 10-14
10.7 NATIONAL PHYSICAL PLAN (NPP) 2005 ........................................................................ 10-14
10.8 GOVERNMENT ADMINSTRATION SYSTEM..................................................................... 10-15
10.9 INSTITUTIONS AND UNIVERSITIES.............................................................................. 10-18
10.10 COMMUNITY PARTICIPATION ...................................................................................... 10-19
10.11 NATIONAL COASTAL EROSION CONTROL COUNCIL ...................................................... 10-19
REFERENCES ....................................................................................................................... 10-21

Chapter 10 LEGAL AND INSTITUTIONAL FRAMEWORK ___________________________________________________________________________________________
___________________________________________________________________________________________ March 2009 10-iii
List of Figures
Figure Description
Page
10.1 Organisation Chart for Implementation of the National Coastal Erosion Control Sector Project (ADB Loan)
10-20

Chapter 10 LEGAL AND INSTITUTIONAL FRAMEWORK ___________________________________________________________________________________________
___________________________________________________________________________________________ 10-iv March 2009
(This page is deliberately left blank)

Chapter 10 LEGAL AND INSTITUTIONAL FRAMEWORK ___________________________________________________________________________________________
___________________________________________________________________________________________ March 2009 10-1
10 LEGAL AND INSTITUTIONAL FRAMEWORK
10.1 INTRODUCTION
This Chapter describes the legal and institutional aspects related to shoreline management. The traditional role of the DID engineers has been centered on river hydraulics, irrigation, rural and urban drainage, river flooding, coastal inundation and coastal erosion protection. Following the National Coastal Erosion Study (NCES) 1985, the General Administrative Circular No. 5 of 1987 places DID in the key role for evaluation of all coastal developments proposals. The DID’s Coastal Engineering Technical Centre is responsible for implementing coastal erosion control, providing technical advisory services to other government agencies and technical support to the National Coastal Erosion Control Council (NCECC). It later evolved to become Coastal Division with the expanded functions to include river mouth improvement, coastal flooding and coastal management. A range of existing enactments in the country are applicable for land administration, town planning and development but they do not regulate fully the activities of the shoreline. A draft policy statement for Shoreline Management Act for Peninsular Malaysia was completed in 2006 with the intent to lead to an Act to provide for the protection and management of the shoreline in West Malaysia and matters connected therewith. The draft policy statement still remains in draft term and to be further reviewed. Malaysia is a signatory to the United Nations Conference on Environment and Development (UNCED) and the United Nations Convention on the Law of the Sea (UNCLOS). The country has also ratified several international maritime conventions related to navigation and pollution from vessels. Importantly, the provisions of these conventions form important basis in the consideration of disputes arising between States and render avenues for claims, mediation, arbitration and peaceful settlement. Good governance for the coastal zone is very much dependent on efficient communication, coordination and collaboration. Hence, the consultative process and the transparency of information must be clearly recognised and practiced between different levels of government, government agencies, stakeholders and coastal community. LEGAL FRAMEWORK
10.2 LAWS
The Constitution sets out the rights and responsibilities between the Federal Government and the State Government and enshrines land as a State matter. Hence use and control of the coast come under State jurisdiction. The National Land Code 1965 further places jurisdiction in the State Authority over un-alienated land in the State. Constitutionally coastal water and seabed up to three nautical miles limit remain within State jurisdiction. Federal government has jurisdiction from this extent to the limit of the Exclusive Economic Zone (EEZ).
Though many laws on various subjects are applicable to the administration and management of the Malaysian coast, there is no specific legislation devoted solely to coastal management. Where the laws are applicable to Malaysia coastlines, there is no provision in these laws to specifically address the development and management issues in the coastal area. Nevertheless the main enactments particularly pertinent to coastal management are highlighted with brief discussion on their function and jurisdiction in this section. Land being a State matter, the different States in Malaysia including Sabah and Sarawak have enacted laws, rules and regulations for development which pertain to the requirements of the particular State. In conformity to the provision of the Manual, this Chapter does not attempt to elaborate on State laws. Selangor Enactment No 2 of 1999 established the Selangor Water Authority (LUAS) and matters connected therewith and provide for the management and protection of river basins, water bodies, ground water, coastal waters and wetlands and for matters incidental thereto.

Chapter 10 LEGAL AND INSTITUTIONAL FRAMEWORK ___________________________________________________________________________________________
___________________________________________________________________________________________ 10-2 March 2009
Similarly, Sabah Enactment No. 6 of 1998 (Sabah Water Resources) provides for the sustainable management of water resources of the State which also covers coastal water. These State enactments and others that may be relevant to coastal management are available on the website of the specific State. 10.2.1 National Land Code 1965, Act 625
National Land Code (Validation) Act 2003
The National Land Code provides for a uniform system for land administration in Peninsular Malaysia and vests sovereignty over land with the States. The State Authority exercises control of the use of land, including permission for a change of use or conversion. The Act provides for the delegation of approval powers for conversion and subdivision from the State Authority to the Collector at the district level but all State Authorities have retained this power. The State Authority has jurisdiction over unalienated land within the State including all minerals, waters and forests.
The National Land Code allows for setting up reserves for public purposes. The State Authority may designate a Department to take control over the reserve land and the Department will have approval powers over land use activities (e.g. sand mining and dredging in the case of beach) within the reserve.
Constitutionally, State jurisdiction covers coastal waters and seabed up to three nautical miles offshore. Federal jurisdiction covers coastal waters and seabed from the three nautical mile limit beyond to the limit of the Exclusive Economic Zone (EEZ). The National Land Code interprets shoreline as the high-water mark of ordinary spring tides and defines the status of the alienated land where shoreline retreats. 10.2.2 Town and Country Planning Act 1976 - Act 172 The Town and Country Planning Act provides for a system of mandatory Development Plans. The Development Plan for an area is prepared under a prescribed process of public scrutiny and public consultations and serves as the basis for all development approval. Where a Local Plan has been prepared, the Local Plan constitutes the Development Plan. Where a Local Plan has not been prepared, the Structure Plan serves for the time being as the Development Plan.
The Planning Act vests the powers of granting planning permission (kebenaran merancang) with the Local Planning Authority. An element of rigidity prevents flexible variations in the treatment of applications for approval. A system of State Appeal Boards is available to provide a recourse for the rationalisation and rectification of decisions made by the Local Planning Authority related to the granting or refusal of planning permissions.
Any change to the Development Plan will require a formal amendment which ensures that the public is informed of any proposed changes to the Plan, the rationale for the changes, their representations heard and their objections, if any, to be considered. The Act itself calls for periodic review of the Development Plan (Part III, Section 16), without stipulating the minimum interval for such review.
The Town and Country Planning (Amendment) Act 1995 adds an important procedural requirement of a Development Report (Laporan Cadangan Pemajuan LCP) in the submission of planning applications. The LCP which is to be submitted together with the Layout Plan by the Project Proponent will not only describe his proposal but also state the environmental, traffic and other impacts of his proposal on surrounding areas and propose mitigating works where necessary or appropriate. The LCP fills a gap in the EIA process where non-scheduled activities are not required to be accompanied by an EIA Report. Unlike the EIA, the LCP is, however, not open to public perusal and reaction. Only in the case where there is no Development Plan and, in such a case, only for adjoining landowners, is there an opportunity for objection.
The 1995 Amendment introduces the Tree Preservation Order, which requires the conservation of vegetation, particularly of large girth trees, on development sites. It also empowers the Local Authorities to designate particular trees or particular groups of trees for conservation.

Chapter 10 LEGAL AND INSTITUTIONAL FRAMEWORK ___________________________________________________________________________________________
___________________________________________________________________________________________ March 2009 10-3
10.2.3 Local Government Act 1976 - Act 171
The Local Government Act 1976 governs the operations of local government in Peninsular Malaysia and provides for the creation of two categories of Local Authorities, namely:
• Municipal Council (Majlis Perbandaran) • District Council (Majlis Daerah)
The Act empowers a State Authority, in consultation with the Minister of Housing and Local Government and the Secretary of the Elections Commission, to declare any area in the State a Local Authority Area, assign a name to it, define its boundaries, and determine its status. The State Authority is empowered to appoint the members of the Local Authority Council, including its President. A Municipal Council may be elevated to the status of a City Council, with the title of the President changed to that of Mayor. The structure of the Council and its functions and responsibilities remain, however, unchanged.
The difference between a Municipal Council and a District Council lies largely in the number of councilors, the degree of financial autonomy and the staffing capacity. A Municipal Council employs its own technical staff. A District Council generally depends on State technical departments for technical advice. A Local Authority is responsible to provide public places, public health and sanitary services in its area of jurisdiction with the powers to collect and raise revenue from rates, licensing fees, various charges, etc. Part VIII of the Act gives control of discharges into streams to the Local Authority but does not make provisions for determining the standard of discharge. This must, therefore, be supplemented by the Environmental Quality Act. The Local Government Act 1976 is silent on the powers of the Local Authority over planning and land use. It is the Town and Country Planning Act 1976 which provides the Local Authority with these powers. 10.2.4 Environment Quality Act 1974 - Act 127
The Environment Quality Act (EQA) was enacted to prevent, abate and control pollution and has specific provisions to prohibit pollution of the soil, inland waters, and the discharge of oil and waste into Malaysian waters. The Environmental Quality (Prescribed Activities) Environmental Impact Assessment Order 1987, made under the powers provided by the EQA and implemented from 1988, introduces another process in assessing development applications. The Order imposes upon the Project Proponent the onus to assess the environmental impact of his proposal and to carry out mitigating measures to overcome any environmental problem that may be introduced by the project. Section 34A of the Order lists 19 prescribed categories of activities for which EIAs are required to be submitted before a project may be approved for commencement. Coastal activities and developments are included in the following listing:
Activity 4 Coastal reclamation involving an area of 50 hectares or more.
Activity 5(a) Construction of fishing harbours.
Activity 5(b) Harbour expansion involving an increase of 50% or more in fish landing capacity per annum.
Activity 5(c) Land-based aquaculture projects accompanied by clearing of mangrove
swamp forests covering an area of 50 hectares or more.
Activity 6(d) Conversion of mangrove swamps for industrial, housing or agricultural use covering an area of 50 hectares or more.

Chapter 10 LEGAL AND INSTITUTIONAL FRAMEWORK ___________________________________________________________________________________________
___________________________________________________________________________________________ 10-4 March 2009
Activity 6(e) Clearing of mangrove swamps on islands adjacent to national marine parks.
Activity 7 Housing development covering an area of 50 hectares or more.
Activity 8(f) Construction of shipyard with dead weight tonnage greater than 5000 tonnes.
Activity 10(a) Construction of ports and port expansion involving an increase of 50% or
more on handling capacity per annum.
Activity 12(d) Construction of petroleum related activities such as construction of oil refineries.
Activity 12(b) Onshore pipelines in excess of 50km in length.
Activity 17(a) Resort and recreational development such as construction of coastal resort
facilities or hotel with more than 80 rooms.
Activity 18(c)(ii) Construction of marine outfall. Section 34A of the EQA was amended in 1996 with a levy of heavier fines and longer period of imprisonment for defaulters on EIA regulations. The definition of inland waters under Section 2 was also amended to include any part of the sea above the low water line along the coast or any other body of natural or artificial surface or subsurface water. This gives the provisions under Section 25 of the EQA a wider coverage for any activity detrimental to the environment of inland waters and prohibits any person to emit, discharge or deposit any environmentally hazardous substances, pollutants or wastes into any inland waters unless licensed by the Director General, Department of Environment (DOE). Section 29 of the EQA was also amended to include the prohibition of discharges of environmentally hazardous substances, pollutants or wastes into Malaysian waters together with an increase in penalties. The EQA regulatory mechanism is limited to type, size or scale of a proposed project where a smaller project could escape planning control under this process. This exclusion is partially mitigated by the Town and Country Planning (Amendment) Act 1995 through the requirement of a Development Report (Laporan Cadangan Pemajuan LCP) to be submitted for all projects regardless of size. The EIA process, by assessing projects on a case-by-case basis may overlook the cumulative effect of several similar projects in the same area, resulting possibly in more serious impacts along the same coast. There has been some discussion of “Plan EIAs”, that is, pre-determination in the Development Plan of its carrying capacity for any particular type of development. Presently via the town planning system, carrying capacity may nonetheless be applied as a planning tool to control development ceilings (such as determining the number of hotels or rooms permissible along a particular stretch of beach). There is often contention between the exercise of State sovereignty over land in State approvals for development and the exercise of Federal responsibility over the environment by DOE in ensuring that Project Proponents prepare and submit EIA to DOE. Whilst State Authority may view certain development project as warranting priority, it must also accept and comply with EIA approval requirement as a necessary development control process for the common good. Environment Impact Assessment
The Environment Quality (Prescribed Activities) Environmental Impact Assessment Order requires the submission of an environment impact assessment (EIA) for DOE approval before carrying out of any development involving a prescribed activity. The EIA is a report containing an assessment of the impacts on both the natural environment as well as the social environment, arising from the carrying out of the activity. However, it is the understanding that State Authorities shall have the final decision on development approvals and the EIA serves to assist the States in their decision-making process on land use.

Chapter 10 LEGAL AND INSTITUTIONAL FRAMEWORK ___________________________________________________________________________________________
___________________________________________________________________________________________ March 2009 10-5
The EIA procedure consists of three major steps namely:
(i) Preliminary Assessment : An initial assessment of the impacts due to the proposed activity or activities should be undertaken at the pre-feasibility or feasibility study stage by the Project Proponent. Project options are identified and any significant environmental impacts are to be made known.
(ii) Detailed Assessment : This is undertaken by the Project Proponent for those
projects for which significant environmental impacts have been predicted in the preliminary assessment. The assessment should ideally continue during project feasibility study. Detailed assessment is carried out based on specific terms of reference issued by an Ad-Hoc Review Panel appointed by the Director General DOE.
(iii) Review : The review of the Preliminary Assessment (EIA) report is undertaken by
the State DOE office while the review of the Detailed Environment Assessment Report is undertaken by the Ad-Hoc Review Panel at DOE Headquarters.
Public participation is allowed under the EIA procedure via two avenues. At the location of the EIA study, public opinion is solicited through surveys, meetings or other means of communication. At the review stage, written public comments may be submitted within a stipulated time period following the public display of the EIA Report.
In the guidelines for preparing EIA Reports, an Environmental Management Plan (EMP) is required to be included in the Report. Upon approval of the EIA Report the Project Proponent is required to implement the EMP and report the monitoring results to DOE, as and when required.
A DOE approval for an EIA may attach conditions of approval, generally comprising various mitigating measures that may need to be carried out by the Project Proponent. Enforcement and monitoring of development activities are then carried out by the State DOE offices.
10.2.5 Land Conservation Act 1960 - Act 385 The Land Conservation Act consolidates the laws relating to the conservation of hill lands and the prevention of soil erosion with its concomitant problem of siltation of the river systems. The Act also provides the means to protect water catchment areas. The Act is pertinent to the shoreline in that silt and sand through the river systems are finally deposited in the estuarine areas or along the shoreline.
The Act provides powers to State Authorities to acquire hill lands and convert them to public lands as a measure to implement the intent of the Act. Section III of the Act specifically deals with the control of sediment and erosion.
Section 6 (1) stipulates that no person may clear any hill land or interfere with, destroy or remove any tree, plant, undergrowth, weeds, grass or vegetation from any hill without prior permission. Any land with a slope may technically be declared as hill land and land clearing in cliffed coast or back-shore hill slopes will come under this scrutiny. 10.2.6 Street, Drainage and Building Act 1974 - Act 133
The Act gives powers to Local Authorities to construct, maintain and repair drains and water courses related to streets, drainage and buildings. Related to shoreline management are the following provisions.

Chapter 10 LEGAL AND INSTITUTIONAL FRAMEWORK ___________________________________________________________________________________________
___________________________________________________________________________________________ 10-6 March 2009
Section 55 (2) – No form of trade effluent may be discharged into or permitted to enter any river, channel, stream, pond, lake, sea or any drain or public sewerage without written permission from a Local or State Authority.
Section 83 (1) – Requirement is made for open spaces within and outside buildings under construction to be protected from soil erosion. 10.2.7 Fisheries Act 1985 - Act 317
The Fisheries Act 1985 covers the conservation, management and development of marine, estuarine and riverine fishing and fisheries. Part IX provides for the establishment of marine parks or reserves. The Act also extends protection to aquatic flora and fauna of coastal waters to allow for the natural regeneration of these aquatic resources. By regulating harvesting, recreational and other activities the Act seeks to preserve and enhance the productivity of coastal waters and avoid irreversible damage to the coastal environment. The Act specifically prohibits certain methods such as explosives, poisons or pollutants to be used in fishing.
However, the Act fails to address the issues of marine pollution from land actuation and the threat to natural fisheries from aquaculture, particularly where located in the breeding grounds of wild fish. These issues will have to be addressed from the angle of development planning and such concerns will need to be incorporated into development plans.
Part VII of the Act vests powers in the State Authorities to enact laws on inland fishing and the conservation of turtles. This sometimes leads to dissimilar levels of legislation and dissimilar regulations and licensing conditions between the Authorities. There also exists a lack of uniformity among the States on the licensing systems for the commercial exploitation of marine turtles and terrapin eggs and on the protection of their nesting areas. 10.2.8 National Forestry Act 1984 - Act 313
The National Forestry Act 1984 provides for the administration, management and conservation of forests and forestry development within the States of Malaysia. Section 7 (1) provides for the State Authority in each State to gazette land as permanent forest, including mangrove and coastal hill forests, reserves categorised under the following classes. Any forest is deemed to be classified as a timber production forest unless otherwise determined by the relevant State Authority and gazetted as such.
• timber production forest under sustained yield • soil protection forest • soil reclamation forests • flood control forests • forest sanctuary for wildlife • virgin jungle reserved forests • amenity forest • education forest • research forest • forest for federal purposes
A “use permit” is required to occupy or carry out any activity within a permanent reserve forest or State Land. A license is required for removal of forest produce within a permanent reserve forest or State land or from any alienated land, TOL, mining or reserve land.
The Act whilst providing for the conservation of forests has its main focus on the commercial development of the forest resources, particularly timber extraction. In tandem with economic development, forest areas are being converted to agricultural, urban and associated uses, recreational uses and large-scale aquaculture. Of concern to shoreline management is a need for the careful husbandry of mangrove forests which is vital to the protection of the integrity of estuarine areas and to fisheries resources. These forests are often subject to development pressure from aquaculture and infrastructure development. The 2004 tsunami experience has accentuated the

Chapter 10 LEGAL AND INSTITUTIONAL FRAMEWORK ___________________________________________________________________________________________
___________________________________________________________________________________________ March 2009 10-7
crucial function of mangrove fringes along the coast as a buffer against destructive storm surges and wave actions. 10.2.9 Protection of Wildlife Act 1972 - Act 76
This Act provides for protection of wildlife species listed in the schedule in the Act and prohibits any hunting, trapping, keeping and killing of any protected wildlife without a license. The Act empowers the Minister on the recommendation of the State Government, to declare any State land as a wildlife reserve or wildlife sanctuary. Damage and destruction of the flora and fauna in a wildlife sanctuary is a punishable offence. 10.2.10 The Merchant Shipping Ordinance 1952- Act 70
The Merchant Shipping Ordinance 1952 regulates discharges from ships in Malaysian waters. Ships defined under the Ordinance include registered Malaysian ships as well as foreign ships and pleasure crafts while in Malaysian waters, fishing vessels and such vessels or class of vessels as the Minister (for the time being responsible for executing the Act) shall prescribe. A discharge of oil or harmful substance from a ship whether intentionally or otherwise is deemed in this Ordinance as an escape from the ship. Section 306, Part VA of the Ordinance makes extensive provisions for the prevention or reduction of the extent of pollution from ships and deals particularly with the discharge of oil and harmful substances liable to create a hazard to human health, living resources or marine life, or otherwise interfere with other legitimate uses of the sea. However, the application of this Section excludes such release of harmful substances or chemicals for the purpose of legitimate scientific research into pollution abatement or control, or dumping within the meaning of the Convention on the Prevention of Marine Pollution by Dumping of Wastes and Other Matters 1972, or dumping with the consent of the Government (Section 306C).
Under Section 306(f) the owner or master shall be guilty of an offence and liable on conviction to a fine. This Ordinance also provides for the Director General Marine Department to take prevention and mitigation measures in the event of a maritime accident.
The powers of the Director General Marine Department are limited to Malaysian waters, any part of the Malaysian coast and any Malaysian reef. Under the Ordinance the definition of Malaysian waters excludes internal waters. However, the 1996 amendment to the Environmental Quality Act 1974 rectifies this oversight by expanding the definition of Malaysian waters to include internal and inland waters. Thus, Section 27 and 29 of the EQA may be invoked to deal with pollution from ships and boats in inland waters.
In the context of shoreline management, the Ordinance serves as a deterrent against the careless or willful discharge of oil and harmful substances by local and passing marine vessels that may pollute beaches and other parts of the shoreline. 10.2.11 Federation Port Rules 1953
Port Authorities Act 1963 - Act 488 Port Privatisation Act 1990 - Act 422
The Federation Port Rules 1953 provides for regulation of activities in terms of safety in all ports. The Port Authorities Act 1963, Johor Port Authority (Scale of Rates, Dues and Charges), By –Law 1958 (Amended 1997) is directed at port handling activities, transshipment, goods, re-export goods, palletised or unitized goods, chargeable tonnage and payment of charges. The Port Privatization Act 1990 serves to facilitate privatization of the port undertaking of any port authority and for matters connected therewith. The Act covers requirements for transfer of port undertaking to a licensed operator, port privatization plan, liabilities in respect of port undertakings and licensing of port operators. None of the three Acts mention of rules relating to environmental control.

Chapter 10 LEGAL AND INSTITUTIONAL FRAMEWORK ___________________________________________________________________________________________
___________________________________________________________________________________________ 10-8 March 2009
10.2.12 Continental Shelf Act 1972 - Act 83
Act No 83 of 1972 was amended from the Continental Shelf Act No 57 of 1966. The Act defines the continental shelf as the sea-bed and subsoil of submarine areas adjacent to the coast of Malaysia but beyond the limits of the territorial waters of the States, the surface of which lies at a depth no greater than two hundred metres below the surface of the sea, or, where the depth of the superjacent waters admits of the exploitation of the natural resources of the said areas, at any greater depth. Natural resources is explained to cover the mineral and other natural non-living resources of the sea-bed and subsoil and including living organisms belonging to sedentary species, that is to say, organisms which at the harvestable stage, either are immobile on or under the sea-bed or are unable to move except in constant physical contact with the sea-bed or the subsoil. The Federal Government exercises all rights to the exploration of the continental shelf and the exploitation of its natural resources. The Petroleum Mining Act 1966 controls exploration, prospecting or boring for or undertaking of any operation for the abstraction of petroleum from the continental shelf. 10.2.13 Exclusive Economic Zone Act 1984 - Act 311
The Exclusive Economic Zone (EEZ) is an area beyond and adjacent to the territorial sea of Malaysia and extends to a distance of 200 nautical miles from the baselines from which the breadth of territorial sea is measured. However, where there is an existing agreement between Malaysia and a State with an opposite or adjacent coast, questions relating to delineation of the EEZ will be determined in accordance with the provision of the agreement. The limits of the EEZ may be altered having regards to international law, State practice or an agreement as aforesaid.
The provisions of this Act pertaining to the continental shelf are clearly to be in addition to and not in derogation of the provision of the Continental Shelf Act 1966. Malaysia has sovereign rights in the EEZ for the purpose of exploring, exploiting, conserving and managing the natural resources, whether living or non-living of the seabed and subsoil and the superjacent waters, and with regard to other activities for the economic exploitation and exploration of the zone, such as the production of energy from the water, currents, waves, tides and winds.
Malaysia has jurisdiction with regards to the establishment and use of artificial islands, installations and structures, marine scientific research and the protection and preservation of the marine environment in the EEZ. International laws also provide for such other rights and duties to Malaysia in the EEZ.
Parts (III) to (IX) of the Acts cover : (III) Fisheries (IV) Protection and preservation of the marine environment (V) Marine scientific research (VI) Artificial islands, installation and structures (VII) Submarine cables and pipelines (VIII) Enforcement and (IX) Offences, penalties, legal proceedings and compensation.
10.2.14 Other Related Laws In addition a number of other peripheral enactments provide the wider framework for the management of the shoreline. These include:
• Water Supply Act, 1999 • Merchant Shipping (Oil Pollution) Act, 1994 • Mineral Development Act, 1994 • Sewerage Services Act, 1993 • Irrigation Areas Ordinance, 1953. (Revised) 1989 • Road Transport Act, 1987. • Atomic Energy Licensing Act, 1984. • Malaysian Highway Authority Act, 1980.
Chapter 10 LEGAL AND INSTITUTIONAL FRAMEWORK ___________________________________________________________________________________________
___________________________________________________________________________________________ March 2009 10-9
• National Parks Act, 1980 • Pig Rearing Enactment, 1980. • Antiquities Act, 1976 • Municipal and Town Boards (Amendment) Act, 1975. • Destruction of Disease-Bearing Insects Act, 1975 • Aboriginal Peoples Act, 1954. (Revised) 1974. • Geological Survey Act 1974 • Factories and Machinery Act, 1967. (Revised) 1974 • Pesticides Act, 1974 • Housing Developers (Licensing and Control) Act, 1966. (Revised) 1973. • Petroleum Mining Act, 1966, (Revised) 1972 • Radioactive Substances Act, 1968. • Town Boards (Amendment) Act, 1961. • Road Traffic Ordinance, 1958 • Drainage Works Ordinance, 1954 • Town Boards Enactment of the Federated Malay States, 1952. • Natural Resources Ordinance, 1949 • Forest Enactment, 1935 • Mining Rules, 1934 • Mining Enactment 1929 • Water Enactment (Water Act) 1920
10.3 GOVERNMENT CIRCULARS AND TECHNICAL GUIDELINES
General Administrative Circulars are issued as directives to government officials to address specific
issues pertaining to effective control and management. For example, Circular No. 5 of 1987 gives specific attention to coastal erosion and proposes mitigation measures with short term and long term strategies in line with the NCES recommendations. The Circular further requires all proposed developments in the coastal zone to be referred to the Coastal Division of DID.
Several ministries and departments have formulated technical guidelines for application to a wide spectrum of development including: Department of Irrigation and Drainage (DID) Guidelines
• Garispanduan JPS 1/97 – Guidelines for Development Projects in Coastal Areas • DID Guidelines for Preparation of Coastal Engineering Hydraulic Study and Impact Evaluation
Department of Environment (DOE) Guidelines EIA Guidelines
• EIA Guidelines for Coastal Resort Development Projects • EIA Guidelines for Development of Tourist and Recreational Facilities on Islands in Marine
Parks • EIA Guidelines for Fishing Harbours and/or Land Based Aquaculture Projects • EIA Guidelines for Coastal and Land Reclamation • EIA Guidelines for Drainage and/or Irrigation Projects • EIA Guidelines for Dam and/or Reservoir Projects • EIA Guidelines for Development of Tourist and Recreational Facilities in National Park • Panduan Kawasan Sensitif Alam Sekitar Malaysia Marine Enforcement Activities
• Marine Pollution Enforcement Procedure

Chapter 10 LEGAL AND INSTITUTIONAL FRAMEWORK ___________________________________________________________________________________________
___________________________________________________________________________________________ 10-10 March 2009
Manual of Monitoring Procedure
• Manual of Marine Water Monitoring Procedure National Contingency Planning
• National Contingency Plan for Oil Spill Control Department of Town and Country Planning (DTCP) Guidelines
• Piawaian Perancangan JPBD 1/96 (Pembangunan Fizikal Pulau-Pulau)
• Piawaian Perancangan JPBD 6/97 (Garis Panduan Perancangan Pembangunan di Kawasan Pesisiran Pantai)
• Garis Panduan Piawaian Perancangan Kawasan Pantai JPBD 6/2000 The guidelines are used by the ministries and departments concerned in their response to development applications. These guidelines are generally limited to the area of responsibility and jurisdiction of the particular ministry or department concerned and are not integrated with one another. In the planning and design of development and depending on the type of development, developers and their professional designers may be required to refer to a range of technical guidelines.
Guidelines in general are of advisory character and are issued not pursuant to any power given by law. Hence guidelines lack legal strength, as they have no force of law. Non-compliance with the guidelines cannot be taken as an act opposed to public policy. 10.4 INTERNATIONAL CONVENTION INITIATIVES
10.4.1 United Nations Conference on Environment and Development (UNCED)
The United Nations Conference on Environment and Development (UNCED), also labeled as the Earth Summit 1992 held in Rio de Janeiro resulted in the Rio Declaration which promulgated 27 principles of environment and development, Agenda 21, and a statement of principles for the Sustainable Management of Forests. Agreement was concluded on the operating rules for the Global Environment Facility (GEF), United Nations Convention on Biological Diversity (CBD), and the establishment of the United Nations Commission on Sustainable Development (CSD) on the basis of an Agenda 21 recommendation. The United Nations Framework Convention on Climate Change (UNFCCC) was also initiated at UNCED. Agenda 21 outlines key policies for achieving sustainable development that meets the needs of the poor and recognizes the limits of development to meet global needs. Agenda 21 attempts to define a balance between production, consumption, population, development and the Earth’s life supporting capacity.
10.4.2 United Nations Convention on the Law of the Sea, 1982 (UNCLOS)
The UN Law of the Sea Convention 1982 defines the rights and responsibility of the coastal States in their use of the world’s ocean, sets the limits of various areas of jurisdiction, establishes guidelines related to navigation, exploration and exploitation of natural resources in deep seabed, protection of the marine environment, scientific research and settlement of disputes. Malaysia is a party to UNCLOS and has declared its zones of jurisdiction under several enabling Acts. UNCLOS has the following understanding of the baseline and the power of jurisdiction in the various sea areas: Baseline : A sea baseline normally follows the low-water line along the coast. Straight baselines may be used where coastline is deeply indented, has fringing islands or is highly unstable.

Chapter 10 LEGAL AND INSTITUTIONAL FRAMEWORK ___________________________________________________________________________________________
___________________________________________________________________________________________ March 2009 10-11
Internal Waters : Covers all waters and waterways on the landward side of the baseline. The coastal State exercises complete sovereignty. Foreign vessels have no right of passage within internal waters. Territorial Waters : From the baseline to 12 nautical miles. The coastal State exercises complete sovereignty. Foreign vessels have the right of “innocent” passage in an expeditious and continuous manner which is not “prejudicial to the peace, good order and security” of its coastal State. Suspension of innocent passage in specific areas of its territorial waters may be imposed by the State under special requirement of protection of its security. Contiguous zone : Covers a further 12 nautical miles beyond the territorial waters limit. The coastal State can exercise limited enforcement jurisdiction pertaining to customs, fiscal, immigration and sanitary matters. Exclusive Economic Zone: Between 12 nautical miles and 200 nautical miles, seaward of the territorial sea baselines. The coastal State exercises complete sovereign rights related to exploration and exploitation of living and non-living resources of the EEZ with the concomitant obligation to protect and conserve the marine environment. Foreign ships have freedom of navigation and other rights closely associated with that applicable for high seas. Continental Shelf : The continental shelf is defined as the natural prolongation of the land territory to the continental margin’s outer edge, or 200 nautical miles from the coastal state’s baseline, whichever is greater. State’s continental shelf may exceed 200 nautical miles until the natural prolongation ends, but it may never exceed 350 nautical miles, or 100 nautical miles beyond 2,500 meter isobath, which is a line connecting the depth of 2,500 meters. The coastal State has the exclusive rights to explore and exploit the living and non-living resources of its continental shelf. Navigation and other rights and freedom of other States as provided in the UNCLOS should not be interfered by the activities. High Seas : All parts of the seas outside the maritime zones of internal waters, territorial waters and the EEZ. All States have the rights of freedom of navigation over the high seas. No part of the high seas may be claimed under the sovereignty of any State. The Malaysian EEZ does not border high seas area because the East Asian seas have all been claimed by countries in the region pursuant to the UNCLOS 1982.
The contents of UNCLOS comprise 17 main Parts with 9 Annexes to the Convention.
Part I. Introduction Part II. Territorial Sea and Contiguous Zone Part III. Straits Used For International Navigation Part IV. Archipelagic States Part V. Exclusive Economic Zone Part VI. Continental Shelf Part VII. High Seas Part VIII. Regime of Islands Part IX. Enclosed or Semi-Enclosed Seas Part X. Right of Access of Land-Locked States to and from the Sea and Freedom of
Transit Part XI. The Area Part XII. Protection and Preservation of the Marine Environment Part XIII. Marine Scientific Research Part XIV. Development and Transfer of Marine Technology Part XV. Settlement of Disputes Part XVI. General Provisions Part XVII. Final Provisions

Chapter 10 LEGAL AND INSTITUTIONAL FRAMEWORK ___________________________________________________________________________________________
___________________________________________________________________________________________ 10-12 March 2009
Annexes to the Convention
ANNEX I. Highly Migratory Species ANNEX II. Commission on the Limits of the Continental Shelf ANNEX III. Basic Conditions of Prospecting, Exploration and Exploitation ANNEX IV. Statute of the Enterprise ANNEX VI. Statute of the International Tribunal for the Law of the Sea ANNEX VII. Arbitration ANNEX VIII. Special Arbitration ANNEX IX. Participation by International Organizations
10.4.3 International Maritime Conventions
International Maritime Conventions generally fall into four groups namely:
(i) Maritime safety (ii) Marine pollution (iii) Liability and compensation and (iv) Other subjects as listed below.
The International Convention for the Prevention of Pollution from Ships 1973/78 (MARPOL 73/78) regulates control of vessel based pollution. The Internal Convention on Civil Liability for Oil Pollution Damage (CCL) 1969 and the International Convention in the Establishment of and International Fund for Oil Pollution Damage (FUND), 1971 provide a compensatory regime in the event of an oil pollution incident. International Convention relating to Intervention of the High Seas in Cases of Oil Pollution Casualties (INTERVENTION) 1969 ensures that a contracting State will have sufficient powers to “prevent, mitigate or eliminate grave and imminent danger to the shoreline from pollution or threat of pollution by oil or the hazardous substances from a casualty”. The information regarding the signatory status of Malaysia to various International Conventions can be obtained from Ministry of Foreign Affairs. `
Maritime Safety
• International Convention for the Safety of Life at Sea (SOLAS), 1974 • International Convention on Load Lines (LL), 1966 • Special Trade Passenger Ships Agreement (STP), 1971 • Protocol on Space Requirements for Special Trade Passenger Ships, 1973 • Convention on the International Regulations for Preventing Collisions at Sea (COLREG), 1972 • International Convention for Safe containers (CSC), 1972 • Convention on the International Maritime Satellite Organization (INMARSAT), 1976 • The Torremolinos International Convention for the Safety of Fishing Vessels (SFV), 1977 • International Convention on Standards of Training, Certification and Watchkeeping for
Seafarers (STCW), 1978 • International Convention on Standards of Training, Certification and Watchkeeping for
Fishing Vessel Personnel (STCW-F), 1995 • International Convention on Maritime Search and Rescue (SAR), 1979
Marine Pollution
• International Convention for the Prevention of Pollution from ships, 1973, as modified by the Protocol of 1978 relating thereto (MARPOL 73/78)
• International Convention Relating to Intervention on the High Seas in Cases of Oil Pollution Casualties (INTERVENTION), 1969

Chapter 10 LEGAL AND INSTITUTIONAL FRAMEWORK ___________________________________________________________________________________________
___________________________________________________________________________________________ March 2009 10-13
• Convention on the Prevention of Marine Pollution by Dumping of Wastes and Other Matter (LDC), 1972
• International Convention on Oil Pollution Preparedness, Response and Co-operation (OPRC), 1990
• Protocol on Preparedness, Response and Co-operation to pollution Incidents by Hazardous and Noxious Substances, 2000 (HNS Protocol)
• International Convention on the Control of Harmful Anti-fouling Systems on Ships (AFS), 2001
• International Convention for the Control and Management of Ships’ Ballast Water and Sediments, 2004 Liability and Compensation
• International Convention on Civil Liability for Oil Pollution Damage (CLC), 1969 • International Convention on the Establishment of an International Fund for Compensation for
Oil Pollution Damage (FUND), 1971 • Convention relating to Civil Liability in the Field of Maritime Carriage of Nuclear Material
(NUCLEAR), 1971 • Athens Convention relating to the Carriage of Passengers and their Luggage by Sea (PAL),
1974 • Convention on Limitation of Liability for Maritime Claims (LLMC), 1976 • International Convention on Liability and Compensation for Damage in Connection with the
Carriage of Hazardous and Noxious Substances by Sea (HNS), 1996 • International Convention on Civil Liability for Bunker Oil Pollution Damage, 2001
Other Subjects
• Convention on Facilitation of International Maritime Traffic (FAL), 1965 • International Convention on Tonnage Measurement of Ships (TONNAGE), 1969 • Convention for the Suppression of Unlawful Acts Against the Safety of Maritime Navigation
(SUA), 1988 • International Convention on Salvage (SALVAGE), 1989
INSTITUTIONAL FRAMEWORK
10.5 LAND ADMINISTRATION
Various government departments, statutory bodies and other agencies are responsible for managing the diverse aspects of coastal matters in terms of land use and development. The objective of land use control is to ensure that land is well husbanded and not damaged or destroyed, utilised productively to generate national prosperity in a sustainable manner with minimum offence or nuisance to the neighborhood. The primary mechanism for controlling land use is provided under the National Land Code 1965 (Kanun Tanah Negara 1965) which classifies land use under the three categories of agriculture, building and industry. One or other of these three uses is specified in the land title and serves as a condition of alienation of land to the land owner by the State. A change of use or conversion is however permitted upon application to and approval by the State Authority. A change of land use often involves a concomitant fragmentation of the land into several lots with separate titles issued under the sub-division. An application for a land use change is submitted to the Collector of Land Revenue of the relevant district pertaining to the land location. The evaluation and recommendation of the Collector is forwarded to the State Director of Lands and Mines before being tabled at the State Executive Council (EXCO) for a decision.

Chapter 10 LEGAL AND INSTITUTIONAL FRAMEWORK ___________________________________________________________________________________________
___________________________________________________________________________________________ 10-14 March 2009
The District Land office is headed by the Collector of Land Revenue (Pemungut Hasil Tanah) who is generally the Assistant District Officer. The District Land Offices responsible for land administration come under the jurisdiction of the State Director of Lands and Mines. 10.6 TOWN PLANNING
The Town and Country Planning Act 1976 provides a system of development planning and development control of land use based on the following principles.
• No person may develop land without the approval of a Local Planning Authority (Pihak Berkuasa Perancang Tempatan)
• No approval is to be granted except in conformity with a Development Plan
• It is mandatory for a Local Planning Authority to prepare the Development Plan for its area
• The Development Plan is prepared with public participation and the right of the public to examine the draft plan and make representations and / or objections.
Where a Local Plan is in place, the Local Plan constitutes the Development Plan for the area of the Local Planning Authority. A constituted Local Authority in an area will assume the powers and responsibilities of a Local Planning Council. The Amendment to the Town and Country Planning Act 2001 provides for the State Director of Town and Country Planning to assume the powers of the Local Planning Authority in an area where there is no Local Authority. Such delegated powers are confined to the preparation of development plans and the approval of development. A Local Planning Authority has no powers to impose or collect rates and no statutory responsibility to provide sanitary services. Development applications are required for both processes of (i) conversion and subdivision (tukar syarat dan pecah sempadan) and (ii) planning permission (kebenaran merancang). Application for building permission is required to be submitted for development involving construction. While the Act does not allow for planning approval for reclamation in the sea, but planning approval on the reclaimed land is similarly subject to the requirement of this Act. 10.7 NATIONAL PHYSICAL PLAN (NPP) 2005
The Town and Country Planning Act 1976 provides for one physical planning system for the country to prepare statutory physical plan at the National Level (National Physical Plan), State Level (State Structure Plan) and District Level (Local Plan). The National Physical Plan (NPP) 2005 was prepared in consultation with the States. All area management plans should reflect NPP Policy 2005 which advocates that “sensitive coastal ecosystems shall be protected and used in a sustainable manner” and the following measures are to be applied:
(i) Coastal reclamation for future urban expansion shall not be carried out except for the development of ports, marinas and jetties.
(ii) The planning and design of coastal development shall be based on the Planning
Standards and Guidelines for Coastal Development (Town and Country Planning Department JPBD)
(iii) Sensitive coastal ecosystems of national importance shall be gazetted as Protected
Areas and could be utilised for low-impact nature tourism. Amongst others, these include:

Chapter 10 LEGAL AND INSTITUTIONAL FRAMEWORK ___________________________________________________________________________________________
___________________________________________________________________________________________ March 2009 10-15
a. Parts of the mangroves in Larut and Matang District, which are important for west coast fisheries, should be gazetted as protected forest.
b. Klang Islands, especially Pulau Tengah, which should be protected as a bird sanctuary.
c. Kuala Selangor Nature Park should be given immediate legal status, and enlarged by incorporating parts of Banjar North and Banjar South Forest Reserves.
d. Apart from Rantau Abang, other turtle nesting sites such as Pulau Redang, Geliga and Paka in Terengganu and Chendor in Pahang should be protected and gazetted as turtle sanctuaries.
e. Marine park islands should be given protective status to help safeguard the marine parks
f. Kuala Gula, which should be protected as a sanctuary for migratory birds. 10.8 GOVERNMENT ADMINISTRATION SYSTEM
The government departments and agencies relevant to the management of the shoreline include the following:
Agency
Function
Economic Planning Unit (EPU)
EPU is the principle government agency responsible for preparation of development plans for the nation. Its functions includes formulating policies and strategies for socio-economic development, prepare medium and long term plans, prepare development programmes and project budget, monitoring and evaluating the achievement of development programmes and projects, advising government on economic issues, initiating and undertaking necessary economic research, planning and coordinating the privatization programme and evaluate its achievement, coordinating the country’s involvement in the development of the Growth Triangle Initiatives, initiating and coordinating bilateral and multilateral assistance and managing the Malaysian Technical Cooperation Programme.
State Executive Committee (EXCO)
EXCO is the highest executive authority in the State. It approves land conversions and subdivisions and ratifies the Development Plans. It is chaired by the Menteri Besar or the Chief Minister and its members are elected members of the State Assembly.
State Planning Committee (SPC)
The SPC is a statutory committee empowered by the Town and Country Planning Act 1976. It is chaired by the Chief Minster and its membership is stipulated by the said Act. It supervises the preparation of Development Plans and approves the Structure Plans (although the approval of Local Plan is delegated to the Councils of the Local Authorities)
State Economic Planning Unit (SEPU) Unit Perancang Ekonomi Negeri (UPEN)
The function of the SEPU is to formulate policies, strategies and programmes for the economic development of the State. It has an important role in the development of the shoreline.

Chapter 10 LEGAL AND INSTITUTIONAL FRAMEWORK ___________________________________________________________________________________________
___________________________________________________________________________________________ 10-16 March 2009
Agency
Function
Dept. of Irrigation and Drainage (DID) Jabatan Pengairan dan Saliran (JPS)
The DID is charged with providing coastal protection works, river mouth improvement works, flood mitigation works and the conservation of river systems. It is the central agency in the management of the shoreline. At the federal level, the DID also serves as the Secretariat to the National Coastal Erosion Control Council (NCECC) which formulates coastal erosion control strategies.
Dept. of Town and Country Planning (DTCP) Jabatan Perancang Bandar dan Desa (JPBD)
DTCP advises the State on town planning matters, and is the secretariat to the State Planning Committee. It oversees and assists local authorities in the implementation of the Town and Country Planning Act 1967. It plays the critical role of advising on the programme and content of development plans for the local authorities. Its decisions have a direct impact on the management of the shoreline.
Dept. of Environment (DOE) Jabatan Alam Sekitar (JAS)
DOE’s primary objective is to enhance the quality of the environment. It administers and enforces the EQA 1974. At the state level the DOE assesses preliminary EIAs and advises the State on environment matters.
Dept. of Lands & Mines (DLM) Pejabat Tanah dan Galian (PTG)
The DLM receives and processes applications for conversion and subdivision. At the district the DLM is represented by the Land Office.
District Office Pegawai Daerah
The District Officer (DO) heads administration at the district level and his office is responsible for the general administration of the district. The DO is usually appointed the Local Planning Authority for those parts of a district not under administration of a Local Authority. He is also often the President where part or all of his district is under a Local Authority. Problems pertaining to the foreshore are generally first brought to the attention of the DO.
Local Authority (LA) Majlis Perbandaran
The LA prepares, administers and monitors the Development Plan and grants planning permission. It also provides sanitary services to its area of administration and collects rates, licensing fees and other charges. The local authorities may also have personnel and funds for minor beach and foreshore maintenance.
Local Planning Authority (LPA) (i) Municipal Council (ii) JPBD Negeri
The LPA prepares, administers and monitors the Development Plan and grants planning permission. For an area where there is a Local Authority, the Local Authority assumes the role of the LPA. For an area where there is no Local Authority, the State Director of Town and Country Planning assumes the role of LPA.
Public Works Dept. (PWD) Jabatan Kerja Raya (JKR)
The function of the PWD is to develop the infrastructure and public utilities such as roads, water supply, government buildings, airports, ports and jetties. The PWD is involved in shoreline management if public buildings and roads are involved.

Chapter 10 LEGAL AND INSTITUTIONAL FRAMEWORK ___________________________________________________________________________________________
___________________________________________________________________________________________ March 2009 10-17
Agency
Function
Marine Department (MD) Jabatan Laut
The MD administers the Merchant Shipping Ordinance 1952 and the Merchant Shipping (Oil Pollution) Act 1994. It ensures all ships are seaworthy and safe, merchant shipping is organised and safe, provides ship surveys, inspections, registration and seafarer examinations, and administers ports not under the Port Authorities Act 1963. Its activities have relevance to foreshore management.
Dept. of Agriculture (DOA) Jabatan Pertanian
The objective of the DOA is to increase farm productivity through effective transfer of technology and research, to involve traditional farmers on technology use, and to increase the contribution of the agricultural sector to the national economy. Where there are farmers involved in the management of the shoreline, whether of the traditional or plantation sector, the DOA will be of assistance in such management.
Dept. of Fisheries Jabatan Perikanan
The objective of the Department of Fisheries is to sustain the productivity of inshore fisheries, promote and develop deep-sea fishing, and increase the value of fish products. It has, therefore, a concern with the protection of fish breeding areas. Generally it enforces the Fisheries Act 1985 and the EEZ Act 1984. In addition, its functions include the management of marine parks. Its activities affect the lives of fishing communities who generally live near the coast. Management of the shoreline should seek constant consultation with Department of Fisheries.
Dept. of Forestry Jabatan Perhutanan
The Department of Forestry manages the forests of the State and collects revenue from the harvesting of forest products for the State. It advises the State on forestry conservation. Its involvement with shoreline management becomes important where there are forests along or close to the shoreline, particularly mangrove forests.
Dept. of Veterinary Services (DVS) Jabatan Perkhidmatan Haiwan
The function of the DVS is to develop the livestock industry and all aspects of animal and veterinary health. The involvement of DVS in shoreline management depends on whether a significant livestock rearing presence exists in relation to the particular shoreline and whether it may interfere particularly with tourism.
Dept. of Wildlife and National Parks (DWNP)
Jabatan Perlindungan Hidupan Liar dan Taman Negara (PERHILITAN)
The main objective of the DWNP is to protect and conserve the wildlife of the country and to maintain its national parks and to fulfill the interests of the local and the international communities. As Malaysia has a very varied wildlife resource and world-renown natural vegetation, the activities of the DWNP has not been fully exploited to enhance the tourism industry.

Chapter 10 LEGAL AND INSTITUTIONAL FRAMEWORK ___________________________________________________________________________________________
___________________________________________________________________________________________ 10-18 March 2009
Agency
Function
Ministry of Culture, Arts and Tourism (MCAT) Kementerian Kebudayaan, Kesenian dan Pelancongan
The tourism promotion function of MCAT has an impact on the shoreline. At the State level, however, the promotion of tourism and tourist facilities comes under the jurisdiction of the State Economic Planning Unit.
Malaysian Industrial Development Authority (MIDA) Lembaga Kemajuan Perindustrian Malaysia
MIDA’s promotion of industrial development may have an impact on the shoreline particularly with issues of land use conflicts between industry and tourism. However, at the State level issues of location are resolved by the State Economic Planning Unit with the assistance of Department of Town and Country Planning. Potential land use conflicts could be reduced with institutionalized inter-department consultation and decision making.
Ministry of Defence – Navy (MOD) (Navy) Kementerian Pertahanan
The MOD in general and the Navy in particular, has a strategic interest in the shoreline as it has the responsibility of maintaining national sovereignty and territorial integrity.
Department of Survey
Jabatan Ukur dan Pemetaan (JUPEM)
The Department of Survey produces topographical and cadastral maps for the country and the states. Mapping information is essential to management of the shoreline.
Dept. of Mineral and Geoscience (DMG) Jabatan Mineral dan Geosains
The DMG is the principal agency for discovery and investigation of mineral resources (excluding oil and gas). It is responsible for geological mapping and produces mineral resources maps.
The land area of Peninsular Malaysia, Sabah (including the Federal Territory of Labuan) and Sarawak are respectively 131,598 km2, 73,711km2 and 124,449 km2. The 11 States in Peninsular Malaysia are administratively divided into districts and mukims. The administrative area division for Sabah and Sarawak is separated into divisions and districts. The institutional set-up of Sabah and Sarawak and the functions of the various government departments and agencies may vary from the Peninsular States as Sabah and Sarawak only became member States of the Federation of Malaysia in 1963 and some of the original organization practices are maintained. In conformity to the provisions of the Manual, this Section does not attempt to elaborate on the legal and institutional framework at State level. 10.9 INSTITUTIONS AND UNIVERSITIES
The availability of relevant and reliable information, data and records is essential to provide an informed basis for decision making for shoreline management. The Maritime Institute of Malaysia (MIMA), the Malaysian Centre for Remote Sensing (MACRES) and the National Hydraulic Institute of Malaysia (NAHRIM) as well as some of the local universities (with coastal engineering and marine science studies) are good information sources for collaboration in coastal management efforts.

Chapter 10 LEGAL AND INSTITUTIONAL FRAMEWORK ___________________________________________________________________________________________
___________________________________________________________________________________________ March 2009 10-19
10.10 COMMUNITY PARTICIPATION
The Town and Country Planning Act 1976 provides a comprehensive system for community-oriented planning with public participation and a transparent system for development plan approval. The Local Plan is a “social contract” between the Local Planning Authority on one part and the public and land owners on the other part. Any amendment is subject to consultation with the public. Public examination of the draft plans, solicitation of comments and objections are provided for through the stage of plan preparation. Stakeholders include all those with an interest in the plans and the preparation of the plans related to development in the coastal zone and are affected by the policies as may be instituted. Coastal zone issues are best handled with the participation of all stakeholders at the relevant level. The public authorities should disseminate information on government initiatives for the coastal zone in an accessible form to a wide range of stakeholders. Concerned stakeholders include some of the relevant Non-Government Organizations (NGO).
- Malaysian National Committee on Irrigation and Drainage (MANCID) - Malaysian Water Partnership (MyWP) - Malaysian Nature Society (MNS) - Worldwide Fund for Nature (WWF) - Wetlands International Asia-Pacific (WIAP) - Fishermen’s Association (Persatuan Nelayan) - Tourist Association - Housing Developers Association (HDA) - Hotel Operators Association
At the local level, the Village Committees (Jawatan Kuasa Keselamatan Kampung JKKK) representing coastal communities have current local knowledge and information on coastal issues and responses in their areas. Stakeholders engagement can be more effective with greater transparency and access to more details. This will also improve consultation and reduce confrontation in the public’s perception of coastal management affecting their lives, livelihood and the environment. A formal comprehensive stakeholder engagement strategy needs to be established to set out the targets, standards and methodology for participation in the management of shoreline. Public awareness on sustainable development and the dangers of irreversible degradation of the environment would improve understanding and enhance regard for the importance of coastal management. Government agencies as well as private sectors such as the tourism industry, the news media and corporations have been engaged in campaigns to combat pollution of inland and coastal waters, beach cleanliness and damage of coral reefs and marine habitats. These efforts are aimed at promoting better practices in the activities of all users related to the coastal zone. 10.11 NATIONAL COASTAL EROSION CONTROL COUNCIL
Following the recommendations of the National Coastal Erosion Study (NCES) Report 1985, the National Coastal Erosion Control Council (NCECC) was established in 1987 at the same time with the Coastal Engineering Technical Centre (CETC) under the DID The NCECC which has the prime responsibility to administer the coastal erosion programmes by providing operational leadership and implementation is headed by the Director General of the Implementation Coordination Unit (ICU) in the Prime Minister’s Department. The members of the NCECC includes:
• Economic Planning Unit • Ministry of Finance • Ministry of Science and Technology • Ministry of Agriculture • Department of Irrigation and Drainage • Department of Town and Country Planning

Chapter 10 LEGAL AND INSTITUTIONAL FRAMEWORK ___________________________________________________________________________________________
___________________________________________________________________________________________ 10-20 March 2009
• Department of Forestry • Department of Public Works • State Governments • Professional Institutions/Universities • Private Sector
The NCECC drafted the general Administration Circular No. 5, 1987 which requires all government agencies to submit any development proposal along the coast to the CETC for comment. In 1992 the Government of Malaysia was granted an Asian Development Bank (ADB) loan for the National Coastal Erosion Control Project. The objective of the project was to assist the Government in continuing to implement its National Coastal Erosion Control Plan (NCECP) which had identified 47 critical erosion areas from the NCES’85. The NCECC’s role in the project implementation, planning and monitoring of the NCECP is shown in Figure 10.1 with the final selection of 38 sub-projects. Project Implementation Project Planning and Monitoring
Figure 10.1 Organisation Chart for Implementation of the National Coastal Erosion Control Sector Project (ADB Loan)
Prime Minister’s Department
Economic Planning Unit
Implementation Coordination Unit
National Coastal Erosion Control Council
(NCECC)
Ministry of Agriculture (MOA)
Executive Agency
Project Steering Committee
Department of Irrigation & Drainage (DID)
Implementing Agency of
National Coastal Erosion Control Sector Project
Coastal Engineering Division
Project Management Unit (PMU) of National Coastal Erosion
Control Sector Project
States’ DID
Sub-PMU of National Coastal Erosion Control Sector Project

Chapter 10 LEGAL AND INSTITUTIONAL FRAMEWORK ___________________________________________________________________________________________
___________________________________________________________________________________________ March 2009 10-21
REFERENCES
[1] “National Coastal Erosion Study (NCES Report 1985)” prepared by Stanley Consultants, Inc in association with Moffat and Nichol, Engineers and Jurutera Konsultant (S.E.A.) Sdn. Bhd.
[2] “Integrated Shoreline Management Plan (ISMP) for the Coastline from Kuala Sg. Pahang to the State Boundary of Pahang / Terengganu”, (Report 2002) prepared by Jurutera Konsultant (Semenanjung) Sdn. Bhd.).
[3] “Integrated Shoreline Management Plan (ISMP) for South Pahang and Pulau Tioman”, (Report 2006) prepared by J.K. Bersatu Sdn. Bhd.
[4] “Integrated Shoreline Management Plan (ISMP) for Negeri Sembilan”, (Draft Final Report 2008) prepared by National Institute of Hydraulic Research Malaysia NAHRIM.
[5] “National Integrated Coastal Zone Management”, (Malaysia NICZM Report 2004) prepared for Economic Planning Unit, Prime Minister’s Department, Malaysia by Universiti Putra Malaysia.
[6] “Drafting of Policy Statement for Shoreline Management Act for Peninsular Malaysia”, (Draft Report 2006) prepared for Economic Planning Unit, Prime Minister’s Department, Malaysia by United Consult Sdn. Bhd.
[7] “Garis Panduan Permuliharaan dan Pembangunan Kawasan Sensitif Alam Sekitar (KSAS) dan Kawasan Sekitarnya”, (Draft Report 2005) prepared by PAG Consult Sdn. Bhd.
[8] “Project Completion Report on the National Coastal Erosion Control Sector Project (Loan 1120 - MAL) in Malaysia”, October 2002 prepared by Asian Development Bank.
[9] “Malaysian Natural Conservation Strategy Toward Sustainable Development (1993)”, prepared for Economic Planning Unit, Prime Minister’s Department, Malaysia
[10] “National Coastal Resources Management Policy (Draft, March 1993)”, prepared for Economic Planning Unit, Prime Minister’s Department, Malaysia.
[11] “Integrated Coastal Management for Sustainable Development (July 2002)”, prepared by Dato Ir. Hj. Keizrul bin Abdullah, Director General DID for presentation at the International Conference on Environmental Issues and Sustainable Development.
[12] “The Implementation of Chapter 17 of Agenda 21 in Malaysia – Challenges and Opportunities“, prepared by Mohd Nizam Basiron, Maritime Institute of Malaysia
[13] “Technical Seminar on Shoreline Management (Technical Papers September 2000) “, Organised by Coastal & Offshore Engineering Institute, Universiti Teknologi Malaysia.
[14] “Forum on Infrastructure Development in the Next Millenium”, (Technical Papers April 1999) - organised by the Institution of Engineers Malaysia.
[15] “Shoreline Management Guidelines”, (December 2004) - prepared by Karsten Mangor DHI Water & Environment.
[16] “Procedural Guidance for Production of Shoreline Management Plans (Interim Guidance May 2003)”, prepared for Department of Environment Food and Rural Affairs, United Kingdom.
[17] “Coastal Management Manual (September 1999) - ISBN 0730575063”, New South Wales Government
[18] “Coastal Engineering Guidelines (for working with the Australian Coast in an ecologically sustainable way)”, Draft March 1998 prepared by the National Committee in Coastal and Ocean Engineering and the Institution of Engineering, Australia.
[19] “Coastal Zone Management – Towards Best Practice (1996)”, prepared for the Department of the Environment, UK.
[20] “The Commonwealth Coastal Policy (to promote ecologically sustainable use of Australia’s coastal Zone)”, May 1995
[21] “Shoreline Management Plans (A guide for coastal defense authorities)”, prepared by the Ministry of Agriculture, Fisheries and Food and the Welsh Office and others.

Chapter 10 LEGAL AND INSTITUTIONAL FRAMEWORK ___________________________________________________________________________________________
___________________________________________________________________________________________ 10-22 March 2009
(This page is deliberately left blank)

Chapter 11 SHORELINE MONITORING AND MAINTENANCE
___________________________________________________________________________________________
___________________________________________________________________________________________ March 2009
CHAPTER 11
SHORELINE MONITORING AND MAINTENANCE


Chapter 11 SHORELINE MONITORING AND MAINTENANCE
___________________________________________________________________________________________
___________________________________________________________________________________________ March 2009 11-i
Table of Contents
Table of Contents .....................................................................................................................11-i
List of Tables ........................................................................................................................ 11-iii
List of Figures ........................................................................................................................ 11-iii
11.1 SHORELINE MONITORING SURVEY ................................................................................ 11-1
11.1.1 Introduction...................................................................................................... 11-1
11.1.2 The Timing of Surveys....................................................................................... 11-1
11.1.3 Purpose of Profile Monitoring Surveys................................................................. 11-2
11.1.4 Survey Methodology.......................................................................................... 11-3
11.1.4.1 Full Scale Survey .............................................................................. 11-3
11.1.4.2 Beach Profile Survey ......................................................................... 11-5
11.1.4.3 Supplementary Data ......................................................................... 11-6
11.1.4.4 Shore Features ................................................................................. 11-6
11.1.5 Advanced Survey Methods ................................................................................. 11-7
11.1.6 Bund Survey ..................................................................................................... 11-7
11.1.7 Rivermouth Monitoring Survey ........................................................................... 11-7
11.2 SHORELINE MONITORING REPORTING SYSTEM ............................................................. 11-7
11.2.1 Introduction...................................................................................................... 11-7
11.2.2 Reports and Reporting Schedule ........................................................................ 11-7
11.2.3 Categorisation of Coastal Erosion Areas .............................................................. 11-9
11.2.4 Data Storage and Formats for GIS and Analysis .................................................11-10
11.3 MONITORING SHORELINE CHANGE USING MAPS ..........................................................11-10
11.3.1 Basic Principles ................................................................................................11-10
11.3.2 Using Spatial Imagery ......................................................................................11-10
11.3.3 Digitizing The Shoreline ....................................................................................11-11
11.3.4 GIS Analysis.....................................................................................................11-11

Chapter 11 SHORELINE MONITORING AND MAINTENANCE
___________________________________________________________________________________________
___________________________________________________________________________________________ 11-ii March 2009
11.4 COASTAL WORKS MAINTENANCE................................................................................. 11-13
11.4.1 Coastal Bunds ................................................................................................. 11-13
11.4.2 Rock Revetments ............................................................................................ 11-14
11.4.3 Concrete Revetments ...................................................................................... 11-15
11.4.4 Vertical Structures........................................................................................... 11-16
11.4.4.1 Concrete and Gabion Seawalls......................................................... 11-16
11.4.4.2 The Labuan Blocks.......................................................................... 11-17
11.4.5 Groynes and Breakwaters ................................................................................ 11-18
11.4.6 Beach Nourishment ......................................................................................... 11-19
11.5 EMERGENCY AND TEMPORARY WORKS........................................................................ 11-19
11.5.1 Types of Physical Damage ............................................................................... 11-19
11.5.2 Emergency Remedial Works............................................................................. 11-20
REFERENCES........................................................................................................................ 11-21
APPENDIX 11-A : TYPICAL SHORE PROFILE DATA.................................................................. 11A-1
APPENDIX 11-B : SURVEY METHODOLOGY ............................................................................ 11A-2
APPENDIX 11-C : STORM EVENT REPORT.............................................................................. 11A-3

Chapter 11 SHORELINE MONITORING AND MAINTENANCE
___________________________________________________________________________________________
___________________________________________________________________________________________ March 2009 11-iii
List of Tables
Table Description Page
11.1 Timing of Survey 11-2
11.2 Guide To Categorising An Eroding Shoreline 11-9
List of Figures
Figure Description Page
11.1 Profile Lines Are Laid Perpendicular To The Shoreline 11-1
11.2 Monitoring Erosion Based On A Reference Tidal Height 11-2
11.3 Beach Profile Survey and Coastal Survey Limits 11-4
11.4 A Typical Profile Line With Survey Points That Capture Significant
Changes In The Profile
11-5
11.5 Beach Profile Survey Baseline And Points 11-6
11.6 Erosion Scarp At Pantai Puteri, Melaka 11-8
11.7 GIS Analysis of Shoreline Change Showing Erosion Areas 11-12
11.8 GIS Analysis of Shoreline Change – Measurement Lines Digitized
Perpendicular to Shoreline To Indicate Shoreline Change
11-12
11.9 Overtopping During Storms Occurring At High Tide 11-13
11.10 The Mud-Lobster Or Jabut (Sp. Thalassina Anamala) 11-14
11.11 Mud Mountains Created By Mud-Lobsters 11-14
11.12 Laying The SAUH Revetment Units 11-16
11.13 Scour At Base Of Seawall In Kg. Batu Laut Near Banting, Selangor 11-16
11.14 Placing Rocks At Base Of Seawall To Protect Against Scour 11-17
11.15 Labuan Blocks At Padang Kemunting, Alor Gajah, Melaka 11-18
11.16 Groyne at Teluk Lipat, Dungun, Terengganu (rock and Accropodes) 11-19

Chapter 11 SHORELINE MONITORING AND MAINTENANCE
___________________________________________________________________________________________
___________________________________________________________________________________________ 11-iv March 2009
(This page is deliberately left blank)

Chapter 11 SHORELINE MONITORING AND MAINTENANCE
___________________________________________________________________________________________
___________________________________________________________________________________________ March 2009 11-1
11 SHORELINE MONITORING AND MAINTENANCE
11.1 SHORELINE MONITORING SURVEY
11.1.1 Introduction
Shoreline monitoring is an essential activity for coastal authorities responsible for erosion control. Early knowledge of an erosion trend occurring facilitates better planning and preparation for the
necessary mitigation measures. Monitoring of shorelines is typically done by conducting profile surveys periodically and analysing the changes to establish the short-term and long-term trends.
Definitions of ‘short term’ and ‘long term’ are in fact relative to the management needs and strategies of the coastal authority. For the purpose of this manual, ‘long term’ is associated with a
period of 5 years or more while ‘short-term’ is anything less.
Shoreline monitoring, including study of shallow water morphology, can also be performed by
analysis of aerial photos, LiDAR and satellite images, and hydrographic/navigation charts. The advantages of these methods are that data back in time will often be available, which covers over
large areas and can be procured and analyzed without any field work. Aerial photo provides historical
records of shoreline changes over time. However there are practical limitations to the use of aerial photo arising from inadequate scale, cloud cover and the lack of reliable ground truths as reference
datum. Admiralty charts provide record of offshore bathymetric changes which is necessary for wave transformation analysis.
11.1.2 The Timing of Surveys
Considering the typical nature of Malaysian beaches, it is useful to conduct survey
annually before and after the monsoon. For the east coast of Peninsular Malaysia, a pre-
monsoon survey should be done in
September or October whilst the post-monsoon survey should be scheduled for
April. It is important to note that during the period between April and October, the east
coast is dominated by swells and beaches
tend to accrete and form a gentler profile. Hence, timing the surveys in September
would capture an accreted or recovered beach condition just prior to the onset of the
north-east monsoon in November. While a post-monsoon survey in the east coast
should typically be in late April, the reader is
advised that there have been instances where the onset of the monsoon months may occur
later or earlier than November and hence end earlier than April. If annual surveys are possible, these should preferably be carried out at around the same month each year for consistency.
On beaches where sand nourishment works have been done, it is beneficial that surveys be carried out every quarter for the first year. This is to establish the rate of loss which is known to be highest
during the first few months immediately following the completion of works. Subsequently, the survey intervals can be lengthened to once annually before and after the monsoon.
Figure 11.1 Profile Lines are Laid Perpendicular
to the Shoreline

Chapter 11 SHORELINE MONITORING AND MAINTENANCE
___________________________________________________________________________________________
___________________________________________________________________________________________ 11-2 March 2009
Table 11.1 Timing of Surveys
Survey When to Conduct
Post-nourishment monitoring Every 3 months after nourishment works for 1 year
period followed by annual survey
Annual beach monitoring East coast Peninsular Malaysia - September;
West coast Peninsular Malaysia – May
Pre-monsoon East coast Peninsular Malaysia – September/October;
West coast Peninsular Malaysia – May/June Sarawak – November
Sabah - October
Post-monsoon East coast Peninsular Malaysia – April/May; West coast Peninsular Malaysia – September/October
Sarawak – April Sabah - March
11.1.3 Purpose of Profile Monitoring Surveys
The purpose of shore profile surveys is to capture the changes in the beach levels thereby, over a time-series of surveys, enabling erosion or accretion trends to be established. An eroding beach is
one that registers a loss of sediment from the beach corresponding to a retreat of the coastline when comparing post monsoon conditions over some years. The reverse, the advance of coastline
seaward, is an accreting beach. Seasonal variations will mainly be seen as a steepening of the
foreshore during the monsoon period and the formation of a more gentle profile during the non-monsoon period. The steepening of the profile during the monsoon period is thus not necessarily an
expression of ongoing coastal erosion.
Figure 11.2 Monitoring Erosion Based On A Reference Tidal Height
Monitoring of shorelines can be achieved through (i) full-scale nearshore survey or (ii) beach profile
survey. It is important to differentiate between the two surveys since they cover different parts of the coastal area for different objectives. A full-scale nearshore survey is conducted to determine the
seabed levels as well as levels on the beach and a series of such surveys can be used to comprehensively analyse the bed changes and sediment transport characteristics along the entire
shoreface and beach. The extent of this survey is similar to that required for detailed design of coastal protection projects. Due to the detail requirements of full-scale surveys, they inevitably cost
more and require more planning as to the extent and intervals required. Hence, full-scale

Chapter 11 SHORELINE MONITORING AND MAINTENANCE
___________________________________________________________________________________________
___________________________________________________________________________________________ March 2009 11-3
monitoring surveys are usually focused on chronic erosion areas as part of design of a coastal
protection scheme.
On the other hand, beach profile surveys are simple land-based beach profile surveys extending
from the vegetation line to the low water line, i.e. only covering the beach. Beach profile surveys are conducted to determine general beach profile characteristics or the stability of beaches fronting
protection structures over time. These simple surveys are clearly advantageous when DID needs to execute short-term or temporary defense works. However, beach profile surveys are also very
useful for the long term monitoring of erosion trends when a long series of surveys are available.
This will facilitate erosion categorisation exercises. For speed and efficiency, it would be beneficial for DID to have a beach survey team in every state to carry out the beach profile survey.
11.1.4 Survey Methodology
The survey methodology between full-scale and beach profile surveys differ essentially in detail and
extent. The accuracy of a beach profile survey depends on the equipment used and the expediency one seeks.
The beach can be defined as the area between mean low water and the landward limit of the
backshore (the coastline). The survey area for monitoring purposes will therefore, in general, be
wide in the mudflat areas common to the west coast but narrower along the sloping, sandy shorelines of the east coast.
The MHWS (defining the shoreline) and MLWS (defining the seaward limit of the foreshore) values
can be obtained for the nearest standard port to the subject beach from the TLDM or JUPM Tide
Tables.
The following sections describe the various aspects of shoreline survey with a summary table in Appendix 11B.
11.1.4.1 Full Scale Survey
Datum
A detailed survey is commonly based on the JUPM National Geodetic Vertical Datum (NGVD), Land
Survey Datum (LSD) or the TLDM Chart Datum. A critical activity in maritime construction is the
accurate conversion of chart datum elevations to LSD or NGVD which is the typical reference datum used for construction purposes. The conversion factors are highly specific to the locality and have
been established for some of the Standard Ports.
Baseline
The baseline is an important feature of any form of monitoring survey as it is the reference line from
which all measurements originate. The baseline is an arbitrary line roughly parallel to the shoreline. The baseline must always be situated on dry land, normally landwards of the inland survey limit,
refer Figure 11.3. However, an individual reach (stretch of coastline) may extend for several kilometers and, within the same stretch, the coastline may vary from sandy beach to cliff faced
shorelines. The baseline will have to be set taking into account the varying beach geomorphologic
features. To ensure consistency, a system or series of monuments or existing benchmarks are used to define the baseline. The line spacing between the beach profiles are thereafter marked along the
baseline with signposts or rods. The baseline may be close to the high water mark as long as the markers or monuments are well sited and able to withstand occasional wave and run-up effects.
Monuments are permanent features that are not expected to be removed or displaced. Monuments
can be corners of established buildings or structures, sub-stations, jetty piers, memorials or similar landmarks.

Chapter 11 SHORELINE MONITORING AND MAINTENANCE
___________________________________________________________________________________________
___________________________________________________________________________________________ 11-4 March 2009
A baseline should be placed higher than the HAT plus storm surge and wave run-up position where a
line of sight could be reasonably established between the baseline position of profile lines. Should
the remote case happen whereby the baseline rods erode, the monuments should be able to reproduce the baseline.
Extent Of Survey And Survey Intervals
The inland limits of the survey should be landward enough to include existing dune features or
alternatively exceed the extreme limits of historically known water levels. The seaward limit of the
survey should be beyond the low water mark i.e. MLLW or MLWS. This may or may not envelope the entire surf zone but should be enough to capture any migration of the low waterline (MLLW or
MLWS). DELFT (1993) suggests the seaward boundary to be at a depth equivalent to twice the significant wave height at deep water during storms and incorporating tidal differences. However this
seaward limit defines the seaward limit of the littoral zone and using such limit therefore implies
surveying of the complete active coastal profile. Applying this seaward limit thus requires the use of a survey boat. (See Figure 11.3)
Full-scale or detailed surveys comprise both topographic and hydrographic surveys and are
accomplished by the use of high technology electronic equipment such as echo-sounders, total stations and differential global positioning systems (DGPS). Where possible, a full scale detailed
survey should extend beyond the depth of closure. The depth of closure or Dc is defined as the
seaward limit where changes in bed levels are not significant. Dc is an important parameter since it is typically considered as the offshore limit of sediment movement influenced by littoral processes. The
depth of closure is best determined by comparing a series of profile surveys. Where periodical surveys are unavailable, the depth of closure can be estimated from the following empirical formula:
Dc = 1.5 Hs0.137 .................................................................... (11.1)
where,
Hs0.137 = significant wave height exceeded 12 hours in a year (0.137 % exceedance); this wave is typically associated with severe storm situations
The above formula was established based on surveys off the Kelantan coast and may not be applicable for all coasts (Nor Hisham, 2007). In the east coast of Peninsular Malaysia and Kelantan in
particular, the survey should extend at least 3 km seaward of the mean low water line position. This distance would typically encompass the location of sand-bars in the east coast.
Figure 11.3 Beach Profile Survey and Coastal Survey Limits
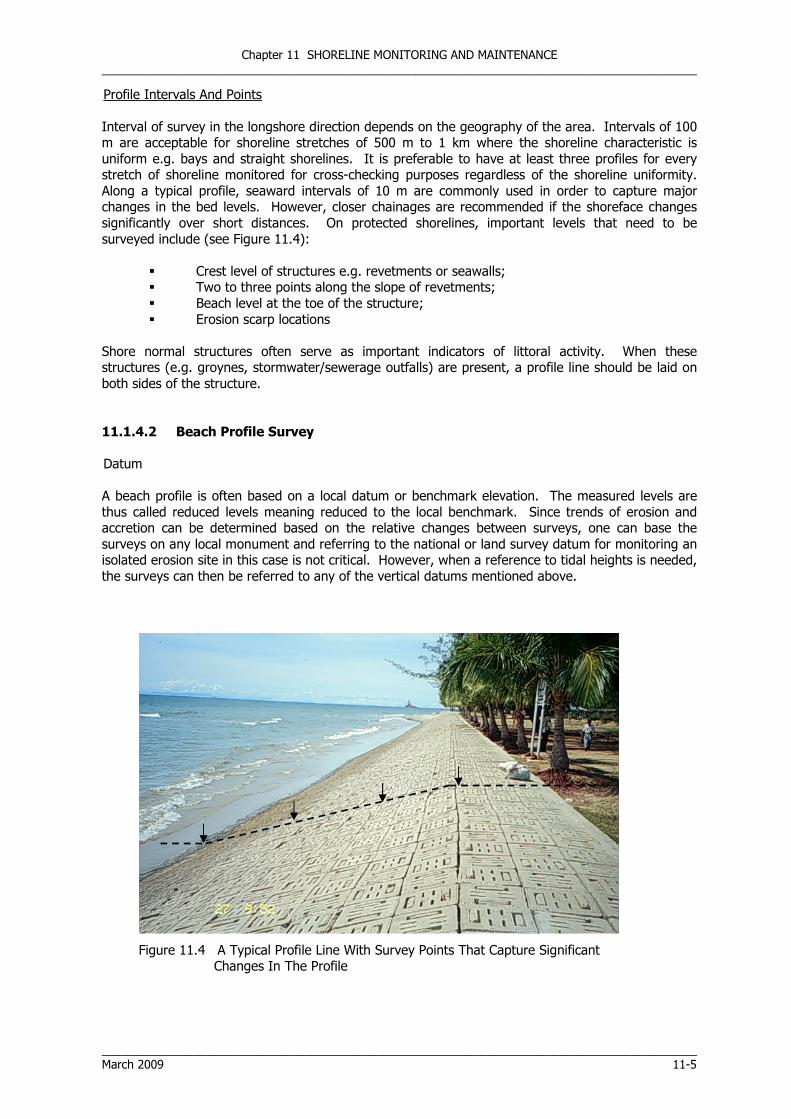
Chapter 11 SHORELINE MONITORING AND MAINTENANCE
___________________________________________________________________________________________
___________________________________________________________________________________________ March 2009 11-5
Profile Intervals And Points
Interval of survey in the longshore direction depends on the geography of the area. Intervals of 100 m are acceptable for shoreline stretches of 500 m to 1 km where the shoreline characteristic is
uniform e.g. bays and straight shorelines. It is preferable to have at least three profiles for every stretch of shoreline monitored for cross-checking purposes regardless of the shoreline uniformity.
Along a typical profile, seaward intervals of 10 m are commonly used in order to capture major changes in the bed levels. However, closer chainages are recommended if the shoreface changes
significantly over short distances. On protected shorelines, important levels that need to be
surveyed include (see Figure 11.4):
� Crest level of structures e.g. revetments or seawalls; � Two to three points along the slope of revetments;
� Beach level at the toe of the structure;
� Erosion scarp locations
Shore normal structures often serve as important indicators of littoral activity. When these structures (e.g. groynes, stormwater/sewerage outfalls) are present, a profile line should be laid on
both sides of the structure.
11.1.4.2 Beach Profile Survey
Datum
A beach profile is often based on a local datum or benchmark elevation. The measured levels are
thus called reduced levels meaning reduced to the local benchmark. Since trends of erosion and accretion can be determined based on the relative changes between surveys, one can base the
surveys on any local monument and referring to the national or land survey datum for monitoring an isolated erosion site in this case is not critical. However, when a reference to tidal heights is needed,
the surveys can then be referred to any of the vertical datums mentioned above.
Figure 11.4 A Typical Profile Line With Survey Points That Capture Significant Changes In The Profile

Chapter 11 SHORELINE MONITORING AND MAINTENANCE
___________________________________________________________________________________________
___________________________________________________________________________________________ 11-6 March 2009
Baseline
The method of establishing a baseline for beach profile survey is essentially similar to that for full-scale surveys.
Extent Of Survey And Survey Intervals
Beach profile surveys are designed to be quickly executed. The survey is conducted using
theodolites and prisms and can be conducted by small survey groups. Since the focus of the survey
is on the backshore and foreshore, the hydrographic survey can be omitted. These surveys may therefore be subjected to higher errors but have the advantage of speedy execution. The landward
limits of beach profile survey can be established in a similar way as the detailed survey although one would limit the effort with respect to the local manpower capacity and funds available. The seaward
limits of beach profile survey could be limited to the low water mark or to waist-deep water
depending on the beach slope, tide and wave conditions at the time of survey. In all situations, safety of the staff or prism handler must always be ensured. Thus, a beach profile surveys would
typically stop within the foreshore. For wide, flat beaches, the survey should concern primarily with the coastline and can be limited to 150 m from the baseline (see Figure 11.5).
Figure 11.5 Beach Profile Survey Baseline And Points
11.1.4.3 Supplementary Data
It is beneficial to incorporate sediment grab sampling as part of the profile survey. Since, bed profiles are influenced by the sediment grain size, it is recommended that a 2 kg sample is obtained
from selected points along the profile line. For beach profiles, these samples may be gathered at the high water line, mean water line and low water line. From the bed samples, the representative d50
of the sediment sample can be determined through sieve analysis. The sediment d50 or diameter of
sediment particle passing 50% is an important parameter in shore profile studies and the determination of beach-fill for nourishment.
11.1.4.4 Shore Features
Monitoring surveys should be supplemented with significant features that contribute to the character and behavior of the beach. Drainage channels, streams or outlets, whether natural or man-made,
should be noted and captured in plan drawings or photographs. The vegetation or tree line is also important to record as it is often an indicator of the mean high water mark. Rocky or unerodable
surfaces and soft or sandy surfaces are not discernable from profile survey data and this information is critical for sediment transport analyses.

Chapter 11 SHORELINE MONITORING AND MAINTENANCE
___________________________________________________________________________________________
___________________________________________________________________________________________ March 2009 11-7
11.1.5 Advanced Survey Methods
In recent years sophisticated survey in terms of faster data procurement without losing out on accuracy. Differential Geographical Positioning Systems (DGPS) now come in hand-held and back-
pack units equipped with external antennae which can be attached to vehicle roofs. As is the root of the DGPS system, satellite availability and coverage is most critical to the operation. DGPS surveys
that give sub-centimeter accuracy should be insisted in establishing the horizontal coordinates of coastal structures that may be a hindrance to maritime traffic. Typical hand-held non-differential
GPS units provide accuracy of no better than 10 meters and should be restricted to general resource
management and not to facilitate construction and surveys.
11.1.6 Bund Survey
Bund survey is another activity that should be regularly carried out by the district DID offices to
ensure the integrity of the structure. This type of survey is similar to the beach profile survey but more focused to the structure. Coastal bunds are built to protect the low-lying agricultural
hinterland. The subsoil of these lands is usually silty clay with typical soil strengths ranging from 5 to 10 kN/m2. Overtime, bunds naturally settle and when the crests become low, overtopping cases
become more frequent. It is therefore necessary to monitor bunds regularly and reduce the risk of bund breach. Bund survey can be done using the same equipment as beach profile survey.
By using vehicle-mounted DGPS units, one can quickly gather accurate levels and alignments of coastal bunds. The DGPS unit is mounted inside the vehicle with an external antennae attached to
its roof. Having recorded the height of the vehicle with respect to the vertical datum, geographical positions and elevations can be acquired as the vehicle is driven along the bund.
11.1.7 Rivermouth Monitoring Survey
Ensuring the navigability of rivermouth has been a function of the Coastal Division since the mid 1990s. The biggest threat to navigation at rivermouths is sedimentation. The maintenance-
dredging of rivermouths can be properly planned by having monitoring surveys at scheduled intervals. This can be achieved by echo sounding.
11.2 SHORELINE MONITORING REPORTING SYSTEM
11.2.1 Introduction
The Coastal Division of DID Malaysia is the national coastal management and coastal engineering technical center. One of the responsibilities is to report the status of the nation’s coastline and to
implement programs for erosion control and coastal management. More often than not, erosion incidents are investigated based on initial complaints from the public or reports in the mass media.
As coastal managers, DID district engineers must be proactive and be constantly aware of the state
of the coastline under their jurisdiction. This can be readily achieved through routine inspections of the coastline. The Coastal Division occasionally requests status reports including reports on notable
storm events from the state and district offices. State and district offices can also produce and submit similar reports as an initial response leading to official requests for erosion control action.
11.2.2 Reports and Reporting Schedule
Efficient shoreline monitoring requires regular and diligent reporting. Profile surveys provide the quantitative data needed for engineering analysis and action. It provides the technical justification
for allocation of funds and future action. Reports may also be purely on visual observations for instance when reporting storm events. The most common method is in the form of written reports
enhanced with pictures of the problem area. Reports are site specific and hence may vary in form
and content. Within the organisational structure of DID, reports are usually prepared by the district DID personnel and forwarded to the State DID office before being submitted to the Coastal Division
at DID HQ for action. These reports are described below.

Chapter 11 SHORELINE MONITORING AND MAINTENANCE
___________________________________________________________________________________________
___________________________________________________________________________________________ 11-8 March 2009
Storm Events
It is very important for the field engineer to document storm events that have caused damage or significant changes to the coast. While observations during a storm can reveal much about the
agents of erosion, these are not always practical or safe to conduct. Thus, field personnel are encouraged to conduct site visits immediately after a storm event and submit reports immediately.
The main elements of a storm event report( refer Appendix 11C for report format) are listed below:
� Dates o Date of report
o Date of site visit o Date of storm event
� Physical observations o Duration of event
o Water levels during storm event o Height of incident waves
o Formation and height of erosion scarp (see Figure 11.6) o Overtopping incidences and hotspots
o Recession of shoreline
o Effect on coastal vegetation
� Damage o Extent of damage to existing coastal structures e.g. displacement of armour units,
toe scouring etc.
o Extent of area damaged – length of stretch, extent of wave run-up o Damage to properties and infrastructure (with indication or estimate of value)
o Sedimentation of coastal outlets and jetties
These reports should be accompanied by digital images that capture the site conditions. These should preferably be accompanied by the most recent images of the same area prior to the storm
event. All images should be properly captioned.
Figure 11.6 Erosion Scarp at Pantai Puteri, Melaka

Chapter 11 SHORELINE MONITORING AND MAINTENANCE
___________________________________________________________________________________________
___________________________________________________________________________________________ March 2009 11-9
11.2.3 Categorisation of Coastal Erosion Areas
The National Coastal Erosion Study 1985 (NCES) introduced a categorisation method that would prioritise coastal erosion control works. The method comprises two elements which is the rate of
erosion and whether it has an impact on the socio-economic concerns of the erosion area in the form of activities, properties and infrastructure. A basic principle of this method of categorisation is that
the cost of protecting the target shoreline commensurate with the value of the hinterland, natural resources or socio-economic activity that is present. Since the inaugural list of erosion areas was
released in 1986, the status of coastlines has been periodically updated through project-based
analysis and Integrated Shoreline Management Plans. The user is advised to consult the Coastal Division for the most recent status information.
Under the NCES, the definitions of erosion categories are explained as follows:
� Category 1 – Critical Erosion: Shorelines currently in a state of serious erosion and where shore-based facilities or infrastructure are in immediate danger of collapse or
damage;
� Category 2 – Significant Erosion: Shorelines eroding at a serious rate whereby public property and agriculture land of value will become threatened within 5 to 10 years
unless remedial action is taken;
� Category 3 - Acceptable: Undeveloped shorelines experiencing erosion but with no or
minor economic loss if left unchecked.
Coastal status reports relating to erosion trends and for the ultimate purpose of erosion
categorisation must be submitted annually. Categorisation provides a basis for prioritization. However, the allocation of funds for any particular site does depend on the merits of the case
including causal factors and if development setback guidelines have been heeded. Nonetheless, it is sufficient for the District or State DID personnel to note the proximity of the threatened properties or
infrastructure to the mean high water line or erosion scarp and leave it to the Coastal Division to finalise in which category the threatened coast should be. When reporting to the Coastal Division,
DID State offices may propose a category for their problem shores based on the guidelines provided
in the following table.
Table 11.2 Guide to Categorising an Eroding Shoreline
Category Observation / Description
1 (Critical
Erosion)
• Shoreline erosion trend detected
• Infrastructure/property of significant value in imminent danger and
frequently within reach of storm waves • Visible damage to protection structure / bund e.g. undermining, scouring
• Frequent overtopping of coastal bund (during every Spring tide)
• Erosion scarp clearly visible
• Mangrove belt in front of bund <= 2 x erosion rate
2 (Significant
Erosion)
• Shoreline erosion trend detected
• 5 years < (Distance from HWM to Infrastructure/property of significant
value) / (erosion rate, m/yr) < 10 years • Erosion scarp visible
• 30 m < Thickness of mangrove belt in front of bund < 5 x erosion rate
• Nourished beaches where 50% of artificial berm has eroded
3
(Acceptable Erosion)
• Shoreline erosion trend detected
• No property or economic activity
• 10 years < (Distance from HWM to structure) ÷ (erosion rate, m/yr)

Chapter 11 SHORELINE MONITORING AND MAINTENANCE
___________________________________________________________________________________________
___________________________________________________________________________________________ 11-10 March 2009
11.2.4 Data Storage and Formats for GIS and Analysis
Data at the Coastal Division is stored in a customised geographical information system and analysis system. As typical of any system, data formats are standardised hence all field data must be
converted into the ‘house-style’ before they are uploaded into the system. Data usually comprises a geographical reference in the form of coordinates and a parametric value. Geographically reference
data is often called 3-D data as it places the information within a map reference. In maps, physical objects or points of interest are marked by entities such as points, lines or polygons. Parameters
such as current speed and direction or wave heights are registered in rows and columns delineated
by commas or spacings.
Shore Profile Digital Data
Shore profile is captured in rows with 3 or 4 columns. XYZ is a typical form of profile data where X
and Y represent the geographical coordinates while Z is the elevation. Another format is the 4-column type which comprises geographical coordinates, offset and elevation values. The first two
columns of data usually represent the geographical coordinates while the third column represents the offset distance value from a baseline (typically set at ‘0’). The remaining column is for the
elevation value. All digital data are preceded by header lines that describe the content of the rows and columns and other relevant information such as coordinates system and bearing of the profile
with respect to a reference line or baseline. Samples of 3-D digital data are presented in Appendix
11A.
11.3 MONITORING SHORELINE CHANGE USING MAPS
11.3.1 Basic Principles
Shoreline change can be monitored on a larger scale by observing coastal maps. In the past, to
study shoreline change, a series of historical shoreline maps of the same scale are traced and overlaid over one another. By referencing to a common horizontal coordinate system, the changes
in the coastline are measured. This method has now been superseded by the mapping and measuring capabilities of Geographical Information Systems. Using digital maps, overlays can be
easily performed and shoreline trends can be quickly calculated. Similarly, shoreline mapping and
change monitoring can be done using aerial photographs, satellite images. The key issues when studying coastal changes using maps are:
1) If the data sources are hard copies, they should be reasonably free from distortion;
2) The maps must be of the same scale otherwise, they must be transformed to the same scale;
3) Comparisons are based on permanent points or features that are common (can be seen clearly) on all maps
Although not intended as a procedural guide to GIS analysis, a description of shoreline change
monitoring using GIS is briefly described below.
11.3.2 Using Spatial Imagery
Maps, aerial photographs and satellite images are spatial images which form the basic sources of
shoreline or coastal information that are used in shoreline monitoring. With the availability of GIS tools, most shoreline monitoring work is now done digitally. Hence, the process of analysis always
begins with extensive post-processing of the available data. Having identified the coastal area and
compiled all the relevant hardcopy maps, aerial photographs and satellite images needed, they are then scanned into digital format. The typical digital file format used is the Tagged Image File Format
(TIFF) which is a common format for storing bitmap (raster-based) images. The next step is to geo-reference them i.e. to reduce them to a common X-Y coordinate system. Topography maps are
usually in the Malaysian Rectified Skew Orthomorphic (MRSO) system whilst the TLDM navigation
charts are in Universal Transverse Mercator (UTM) format. Earlier aerial photographs are often coded to indicate flight path and frames which were linked to topographic maps. Nowadays, aerial
photographs are already geo-referenced with Global Positioning System coordinates (WGS84) as the

Chapter 11 SHORELINE MONITORING AND MAINTENANCE
___________________________________________________________________________________________
___________________________________________________________________________________________ March 2009 11-11
images are captured. These aerial photographs are saved in Geo-TIFF format which is a variation of
the TIFF described earlier. Geo-TIFF images contain the relevant projection, coordinate or datum to
spatially reference the image.
Software such as ERDAS Imagine® can be used to create a photo-mosaic which is a composite image based on several aerial photographs taken for a given year. The photo-mosaic can then be
geo-referenced based on recent photographs that have already been geo-referenced. The software selects certain points in the geo-referenced aerial photographs and then identifies the same points in
the unreferenced aerial photographs thereby according them geo-coordinates to the same common
projection. Data of each year is then saved in a separate GIS layer.
11.3.3 Digitising The Shoreline
Applying GIS tools, the photo-mosaics of different years of survey can be overlaid and the visual
differences can be immediately detected. However, to allow for GIS analysis, the shorelines must then be digitized as vector lines – a GIS theme -- and at this point, the shoreline needs to be defined. The vegetation line and mean high water mark are amongst the common choices. The digitization to capture the defined shoreline is nowadays done on-screen.
11.3.4 GIS Analysis
When two vector lines representing the shoreline intersect each other at two points, a polygon is created and the area of the polygon represents an eroded or accreted area. To determine shoreline
gain or retreat, a new vector line theme is created whereby perpendicular lines are drawn at selected points to connect two historical shorelines. The length of this perpendicular line is therefore the
shoreline retreat or gain. Figures 11.7and 11.8 are schematic drawings illustrate these techniques.
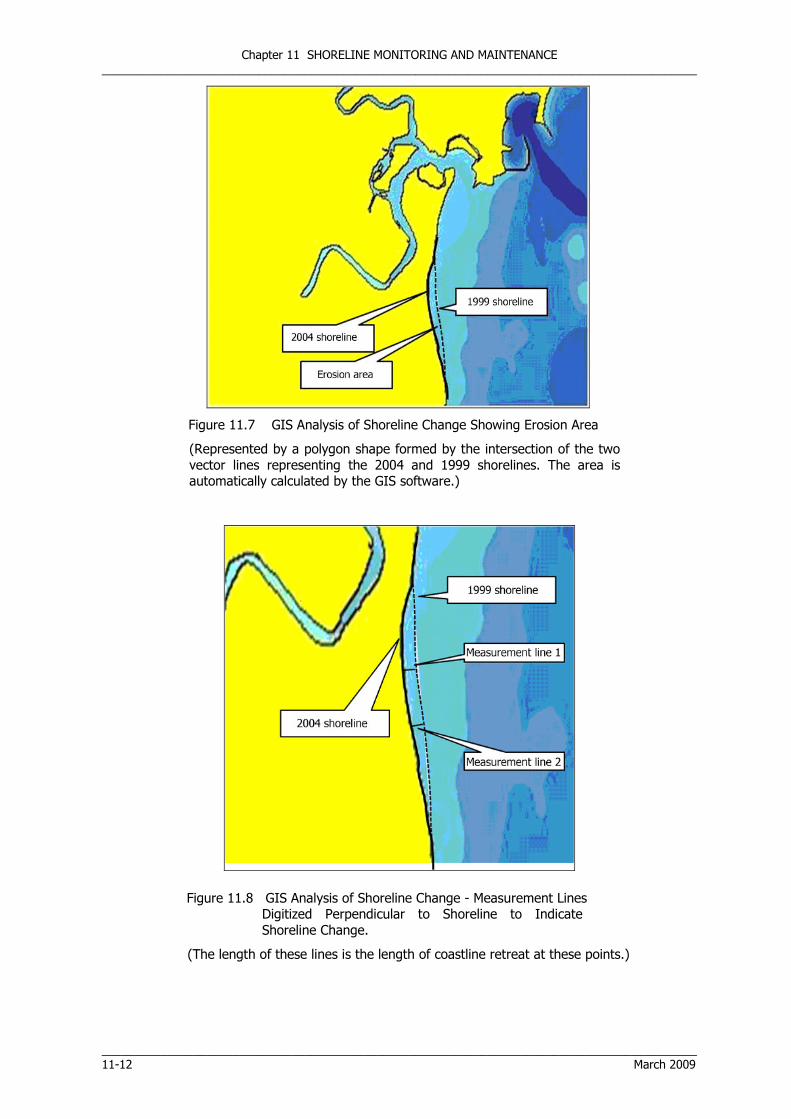
Chapter 11 SHORELINE MONITORING AND MAINTENANCE
___________________________________________________________________________________________
___________________________________________________________________________________________ 11-12 March 2009
Figure 11.7 GIS Analysis of Shoreline Change Showing Erosion Area
(Represented by a polygon shape formed by the intersection of the two
vector lines representing the 2004 and 1999 shorelines. The area is automatically calculated by the GIS software.)
Figure 11.8 GIS Analysis of Shoreline Change - Measurement Lines Digitized Perpendicular to Shoreline to Indicate
Shoreline Change.
(The length of these lines is the length of coastline retreat at these points.)

Chapter 11 SHORELINE MONITORING AND MAINTENANCE
___________________________________________________________________________________________
___________________________________________________________________________________________ March 2009 11-13
11.4 COASTAL WORKS MAINTENANCE
11.4.1 Coastal Bunds
Coastal bunds are typically constructed to protect low-lying agricultural schemes fringing the coast from saline intrusion. Extensive bund systems can be found especially in Perak, Selangor and Johor
where major drainage schemes exist.
Bund crests are designed to be at least 60 cm above the mean high water line after shrinkage and
settlement. Effectiveness of the bund can be compromised by two major factors (i) exposure to direct wave and tidal action and (ii) bund cavity due to crustacean activity.
Over time and as a result of traffic on the bund, long-term settlement occurs thereby reducing the
height of the crest and increasing the risk of overtopping. It is not uncommon for excessive
settlement to occur at localised spots. It is therefore important to monitor the bunds regularly to identify areas where settlement has occurred. On a preventive note, DID personnel must discourage
vehicles other than DID maintenance vehicles from using the bund. DID district engineers must not permit other agencies to upgrade the surface of coastal bunds. Tar-sealed surfaces will encourage
heavier usage which enhances settlement but the bunds then cannot be further raised by a simple topping-up exercise. In order to increase the bund crest level, the asphalt surface will first need to
be removed.
Figure 11.9 Overtopping During Storms Occurring At HAT
Another major threat to coastal bunds is the activity of crustaceans particularly;
� the mud-lobster (sp. Thalassina anamala); also known by its local name jabut (see Figure 11.10);
� fiddler crab
Burrowing activity of the crustaceans , particularly by the mud-lobster can be detected through the tell-tale sign of mud mounds or mountains as shown in Figure 11.11. Extensive tunneling by these
creatures can create leaks through the bunds. Bund design incorporating wide berms of up to 12
meters are intrinsic to reduce the effect of crustacean tunneling. From an ecological aspect, mud-

Chapter 11 SHORELINE MONITORING AND MAINTENANCE
___________________________________________________________________________________________
___________________________________________________________________________________________ 11-14 March 2009
lobster activity contributes to the growth of mangrove seedlings as their burrows allow oxygen to
penetrate the typically oxygen-poor mud substrate. Hence, the measures chosen to counter them
must be inhibitive rather than destructive in nature.
Figure 11.10 The Mud-Lobster Or Jabut (Sp. Thalassina Anamala)
In 2003, DID Pontian introduced the use of polystyrene sheets to combat crustacean tunneling. The
measure involves the insertion of a polystyrene sheet through the bund creating a lightweight
barrier. Field tests at the coastal bunds in Pontian disctrict have revealed that crustacean activity can be inhibited by the polystyrene barrier although the possibility of their working their way around
or underneath the barrier cannot be discounted. The sheets are placed in the vertical but there is a tendency for the mud-lobster to burrow downwards to bypass the obstruction. Hence, the
polystyrene barrier method should be considered as an interim measure.
Figure 11.11 Mud Mountains Created By Mud-Lobsters
Further deliberation on the coastal bund is at Chapter 8.
11.4.2 Rock Revetments
Armouring the seaward slopes of coastal bunds or shorelines is a common method of protection against erosion. Rock or quarry stone revetments as they are called, comprise of rocks and
geotextile cloth. In its simplest form, rocks are simply dumped on top of the beach slope providing a
barrier against wave and tidal action. These ‘un-engineered’ protection works are meant as temporary measures as they only slow down the erosion. A fully-engineered revetment on the other
hand is usually designed for 25 to 30 years and incorporates the following into the design:-

Chapter 11 SHORELINE MONITORING AND MAINTENANCE
___________________________________________________________________________________________
___________________________________________________________________________________________ March 2009 11-15
� Tidal heights and storm surge
� Incident wave height � Armour rock weight or size, interlocking ability and permeability
� Filter layers � Toe reinforcement
� Armour slope angle � Height of crest
� Geotechnical parameters of underlying soil
� Slope stability
Revetments as reinforcement to coastal bunds tend to settle over time for reasons similar to those for coastal bunds as well as the weight of the revetment itself. The increase in overtopping incidents
is an indicator of revetment degradation. Overtopping occurs due to the following reasons;
� Settlement of the crest due to long term consolidation of the bund;
� Slumping of the slope due to settlement (slope becomes steeper) which reduces the slope length required to inhibit run-up;
� Degradation of the revetment due to damage of the toe caused by beach erosion � Combination of the above
Climate change may bring about increased frequency and intensity of storms as well as a general rise in sea level which brings about higher waves at the shoreline and increase the chance of
overtopping. Hence, it is useful to carry out regular inspections along the protected shoreline as well as along the coastal bund. Visual inspections should then be made and signs of slumping, crest
settlement or armour rock movement should be carefully noted and preferably photographed.
Profile monitoring surveys can be conducted to monitor the revetment crest level. A crest level reduction of 30 cm may be considered as the critical level at which point restoration works should be
initiated.
Slumped slopes could be restored to their original angle by placing more rocks along the slope. This ‘topping-up’ exercise should be done promptly and it is important to ensure that the rocks are large
enough to withstand wave forces so as to achieve the desired effect. Filter material should also be
incorporated in order to avoid washing out of the underlying material
11.4.3 Concrete Revetments
Concrete revetments such as DID’s Simplified Armour Unit ‘H’ or SAUH (Figure 11.12), Flex-Slab® or
SineSlab® are examples of interlocking concrete revetments that have been deployed at various stretches of coastline. A common mode of failure to these systems is breakage and dislodge. SAUH
unit is vulnerable to failure at the neck of the “T”. A common condition observed on site is when broken tree trunks or branches become lodged between the units. Under wave and tidal action, the
branches knock against the up-pointing segment of the SAUH units and cause it to break. Therefore,
it is important to remove tree branches, trunks and similar heavy objects that are deposited on the SAUH revetment. Very often, the failure begins with the failure of a single unit which then exposes
the underlying gravel layer to wave run-up. The progressive loss of the underlying gravel will subsequently de-stabilize the entire section of concrete units. It is thus imperative to intervene early
when damage is detected.

Chapter 11 SHORELINE MONITORING AND MAINTENANCE
___________________________________________________________________________________________
___________________________________________________________________________________________ 11-16 March 2009
Figure 11.12 Laying The SAUH Revetment Units
In the monitoring of concrete revetments, one needs to look out for dislodged or cracked units.
Some armour units are steel-bar reinforced and these quickly rust if the units are cracked for whatever reason. Rust formations causes the surface area of the steel bars to increase which
pressures the concrete to crack further. As indicated earlier, repairs to remove and replace broken
units must be done as soon as possible and in the process, the integrity of the underlying gravel bed must be checked. If losses to the gravel bed are detected, more material must be added so as to
provide a stable base for the revetment units to sit. Filter material should also be incorporated in order to avoid washing out of the underlying material.
11.4.4 Vertical Structures
11.4.4.1 Concrete and Gabion Seawalls
Seawalls typically fail due to excessive toe scour. When waves reflect off a vertical structure, the
wave energy draws material away from the toe of the wall causing the bed level in front of the wall
to lower (Figure 11.13). Eventually, the scour is deep enough such that the wall is unable to resist the wave forces attacking the upper part of the wall. The wall eventually collapses under its own
weight.
Figure 11.13 Scour At Base Of Seawall In Kg. Batu Laut Near Banting, Selangor

Chapter 11 SHORELINE MONITORING AND MAINTENANCE
___________________________________________________________________________________________
___________________________________________________________________________________________ March 2009 11-17
Scour can be reduced by using a sloping wall rather than a vertical one. A sloped wall has a lower
coefficient of reflection and hence less energy reflected to cause scour. Placing gravel or rocks at the toe of the wall can help prevent scour (See Figure 11.13 and 11.14). The rock size is dependent
on the incident wave condition at the structure. Placing a layer of geotextile cloth prior to laying the
rocks can add to the efficiency of the toe protection.
Gabions behave like seawalls as they are usually stacked vertically. They are not recommended for coastal protection as their integrity relies on the wire cage being intact. Under saline conditions, the
wire cage rusts and deteriorates within a year. Once the cage gives way, the gravel filling spills out
and eventually the gabion stack becomes unstable. PVC-insulated wires are now commonly used to form the gabions but these only serve to slightly lengthen their life-span.
11.4.4.2 The Labuan Blocks
The Labuan Blocks are an in-house system developed in 2000 by a team of DID engineers in Labuan
as a replacement for gabions and placed in the backshore to restrict wave run-up. These simple cuboid and trapezoidal concrete block system forms a stepped profile and were designed for swift
installation (Figure 11.15). Each block is fitted with a lifting hook which allows them to be easily laid in place. The Labuan Blocks system works as a modular seawall that can be quickly installed and is
considered as an interim measure. Observations in Penang and Labuan indicate that this system
does not cause lowering of foreshore levels which is a common occurrence for vertical seawalls which are placed in the foreshore area where the sea wall is subjected to direct impact of the wave.
Figure 11.14 Placing Rocks At Base Of Seawall To Protect Against Scour
Sea wall
Toe
protection against

Chapter 11 SHORELINE MONITORING AND MAINTENANCE
___________________________________________________________________________________________
___________________________________________________________________________________________ 11-18 March 2009
Figure 11.15 Labuan Blocks At Padang Kemunting, Alor Gajah, Melaka
The common failure mechanism for the Labuan Blocks is excessive overtopping and toe scour. In
nearly all documented cases, the instances of failure due to toe scour have occurred when used in rivermouths and outlets where (i) there are strong currents flowing parallel to the structure or (ii)
along open coasts with strong littoral drift (iii) the wave heights are greater than 1.5 meters (iv) the beach is very steep. It is extremely important that the toe blocks be buried.
The effectiveness of the system increases the further away it is behind the mean sea water level since the blocks cannot withstand prolonged periods of waves breaking directly on its front.
Originally designed without interlocking parts, the Labuan Blocks can be displaced if the surrounding and underlying material is not consolidated. The system is especially vulnerable to excessive
overtopping as the loss of material behind the crest can easily lead to destabilisation of the structure. Research on the performance and improvement of the Labuan Blocks is being pursued by the
Coastal Division to enhance its capability as an alternative protection system especially to preserve
sandy beaches which have become narrow and would have been fully covered if a revetment was built.
Maintenance of the Labuan Blocks is quite straightforward. As long as the lifting hooks are intact,
they can be repositioned in place or moved to a more suitable position. If overtopping is frequent, it
is advisable to fill the area behind the crest with coarse gravel of range to prevent scouring behind the structure crest. In cases where there is local scour at the toe, an additional toe block can be
placed in front of and shielding two existing toe blocks to improve the stability.
11.4.5 Groynes and Breakwaters
In Malaysia, groynes are constructed with rocks or concrete units as the use of timber groynes have
ceased since the mid 1980s. A damaged groyne or breakwater is one where the armour units have been displaced to the point where the core has to be reconstructed (see Chapter 3). Being shore-
perpendicular structures, rivermouth breakwaters and groynes are designed with the larger armour units at their heads because the head is the most seaward point and in deeper water which means
they are exposed to larger waves than the trunk.
When inspecting concrete armour breakwaters and groynes, look out for possible fractures to
armour units especially at their most slender sections. A potentially dangerous situation could arise if the damaged units are below the mean water line or if scouring has occurred at the toe of the
breakwater/groynes. These conditions may lead to slumping of the structure slope.

Chapter 11 SHORELINE MONITORING AND MAINTENANCE
___________________________________________________________________________________________
___________________________________________________________________________________________ March 2009 11-19
Inspection of groynes and breakwaters should be conducted at least once a year after the annual
monsoon period (November to March in the case of the east coast) within which the highest waves are expected to occur.
Figure 11.16 Groyne at Teluk Lipat, Dungun, Terengganu (rock and Accropodes)
If the damage is purely the displacement of rock units, then this should be replaced quickly to protect the smaller armour units beneath. If a slump or collapse of the slope has occurred, then the
section would need to be reconstructed with similar armour units. Figure 11.16 shows minor damage has occurred at the head of the groyne at Teluk Lipat, Dungun but the crest has remained
intact. Crest levels of groynes will settle over time and need to be topped up with armour units to
the design level.
11.4.6 Beach Nourishment
When beach nourishment is designed for coastal erosion control, a sacrificial zone is provided to allow for erosion. The width of this sacrificial zone is dependent on the average annual rate of
erosion and usually 5 year period is being considered. This means that on average re-nourishment of
the beach needs to be carried out every 5 years. However in the actual situation, re-nourishment has to be carried out when the sacrificial zone has been eroded away, which could occur more or less
than 5 years after the previous nourishment was carried out.
11.5 EMERGENCY AND TEMPORARY WORKS
Coastal protection works especially revetments can fail under extreme circumstances. Quick repairs
of these structures are important to prevent catastrophes.
11.5.1 Types Of Physical Damage
The types of physical damage that can occur are as follows.
• Damage to armour
• Slips
• Damage on crests due to wave overtopping

Chapter 11 SHORELINE MONITORING AND MAINTENANCE
___________________________________________________________________________________________
___________________________________________________________________________________________ 11-20 March 2009
11.5.2 Emergency Remedial Works
Emergency works are works that have to be carried out quickly to prevent catastrophes. In most cases these works need to be done quickly and it may not be possible to carry out the works to the
normal standards and guidelines. However the work must be sufficient to provide a temporary remedy until funds and time allow more permanent and higher standard work.
a. Damage To Armour Damage to armour needs to be addressed quickly. This is because once the armour layer starts to fail, the failure of the revetment can be quite rapid. Should the damage starts to progress to
the underlayer, the revetment can fail quickly. Thus it is important to ensure that the damage is repaired quickly. Should the armour layer be made of rocks, and the rocks have been dislodged,
it is important to replace the rocks. If the damage has progressed to the underlayer, it is
important to examine the layer to ensure that the geotextile underneath is not exposed. If the geotextile is exposed, the underlayer must be replaced first before placing the armour rocks.
Mattresses using interlocking units such as Flexslab can also fail. If this happen, the only course
of action is to grout the unit to the surrounding units. The flexibility of the group of units will be lost but this is better than the whole system losing its integrity due to the failure of a few units.
For revetment slopes protected using articulate units such as SAUH, the damaged units need not be replaced. It is usually sufficient to place extra units on the damaged units to maintain the
interlocking of the units.
Walls that are made up of blocks such as the Labuan Blocks can be quite tricky to repair. It is
important that should these blocks be dislodged or get out of alignment, repairs be done quickly. The size and weight of these blocks mean that it is unlikely that the blocks are moved by wave
action alone. Usually wave overtopping, seepage and settlement are the main causes of the failure of these systems. Repairing these systems means addressing the causes of these
failures.
b. Slips Slips occur when the ground condition is too soft to sustain the weight of the revetment. In
such cases, it is futile to rebuild the revetment as the foundation has already failed. Many had attempted to rebuild the failed slope only to see the slip reoccurring almost immediately after
the repair. The best course of action will be to build a retreat bund and to quickly protect this
bund with geotextile, secondary layer and armouring.
Slips can result in a reduction in the crest level of the bund. It is important that the retreat bund be built quickly to prevent overtopping of the failed section causing a breach in the bund. If the
failure has already resulted in a breach in the bund, then a creek closure must be constructed to
close this breach.
c. Damage On Crests Due To Wave Overtopping Overtopping of crests usually need long-term measures such as raising of the bund levels. However, this can be a major operation. In the mean time, it is usually sufficient to temporarily
raise the crest of the revetment by placing a small rock mound. This will reduce the overtopping
and prevent damage to the bund.
d. Sand Bags Sand bags may be used as temporary protection of bunds should slips occur and the slope and
crest of the bund are exposed to wave action. In some cases, the sand placed in the bags are mixed with cement at a ratio of 6 (sand) to 1 (cement). When sea water penetrates the sand
bags, the mix harden, creating armour units. However, the size of bags means that the weight

Chapter 11 SHORELINE MONITORING AND MAINTENANCE
___________________________________________________________________________________________
___________________________________________________________________________________________ March 2009 11-21
of each unit is only around 50 kg. This is insufficient to prevent damage by extreme wave
heights. Thus, these methods should only be applied as temporary measures while preparing for
a more permanent solution.
REFERENCES
[1] Fulton-Bennett, K, and Griggs, G.B. (undated). “Coastal Protection Structures and their Effectiveness”, Published by State of California Dept. of Boating and Waterways and the Marine
Sciences Institute of the Univ. of California at Santa Cruz.
[2] Camfield, F.E and Morang, A. (1996). “Defining and Interpreting Shoreline Change. Ocean and Coastal Management Vol.32”, pp. 129-151. Elsevier Science Ltd.
[3] Nicholls, R.J., Birkemeier, W.A. and Hallermeier, R.J. (1996). Application of the depth of closure concept. In: Proc. 25th Coastal Engineering Conference, ASCE (1996), pp. 3874–3887.
[4] Fowler, J.E. (1993). “Coastal Scour Problems and methods for Prediction of Maximum Scour. Technical Report CERC-93-8.”, US Army Corps of Engineers.
[5] NCES (1986). “National Coastal Erosion Study Volume 1.” Prepared for the Prime Minister’s
Department Malaysia by Moffat & Nichol, Stanley Consultants and JK (SEA) Sdn. Bhd.
[6] Nor Hisham Mohd. Ghazali (2007). “Determination of Depths of Closure off the Kelantan Coast.”, Master’s thesis. Universiti Teknologi Malaysia, Johor.
[7] Vedast Makota1, Rose Sallema1 and Charles Mahika (2004), “Monitoring Shoreline Change using Remote Sensing and GIS: A Case Study of Kunduchi Area, Tanzania”; Western Indian Ocean J. Mar. Sci. Vol. 3, No. 1, pp. 1–10, 2004
[8] Melby, J.A. (2005). “Damage Development of Armour Units on Stone-armored Breakwaters and Revetment”; ERDC/CHL CHETN-III-64 US Army Corp of Engineers
[9] Maddrell, R. (2005). “Lessons Re-learnt from the Failure of Marine Structures”; International Conference on Coastlines, Structures and Breakwaters

Chapter 11 SHORELINE MONITORING AND MAINTENANCE
___________________________________________________________________________________________
___________________________________________________________________________________________ 11-22 March 2009
(This page is deliberately left blank)

Chapter 11 SHORELINE MONITORING AND MAINTENANCE
___________________________________________________________________________________________
_________________________________________________________________________________________ March 2009 11A-1
APPENDIX 11-A
TYPICAL SHORE PROFILE DATA
Pantai Sabak, Kelantan Chainage 1500 24 February 2004
Cassini Line number, x-coords, y-coords, elevation, offset from baseline
9
1 18614.95 30036.20 3.77 -134.6
2 18618.07 30038.38 3.78 -130.8 3 18621.47 30040.76 3.81 -126.6
4 18624.18 30042.65 4.03 -123.3
5 18628.81 30045.89 4.02 -117.7 6 18633.57 30049.22 1.86 -111.9
7 18637.65 30052.08 1.86 -106.9 8 18640.83 30054.30 1.31 -103.0
9 18644.72 30057.02 0.97 -98.2
Sample of shore profiles surveyed at Pantai Sabak 1998, 1999 and 2000

Chapter 11 SHORELINE MONITORING AND MAINTENANCE
___________________________________________________________________________________________
__________________________________________________________________________________________ 11A-2 March 2009
APPENDIX 11-B SURVEY METHODOLOGY
FULL SURVEY BEACH PROFILE SURVEY
Purpose Numerical modeling; sediment
transport patterns; detailed design
Beach profile changes;
beach monitoring; storm impact
Baseline Uppershore location beyond HAT Uppershore location beyond
HAT or just leeward of existing hard protection
structure
Offshore limit 1. To depth equivalent to 1.5m
x Hs0.137 or;
2. 3 km from baseline for east coast or;
3. to just beyond the location of offshore bars;
4. 3 to 5 km offshore for
mudflat shores
1. Mean low water
2. To waste depth at low
tide or; 3. 100 m from baseline for
flat shore at low tide 4. To as far seaward as
possible as long as it
remains safe for personnel
Survey/profile line interval 30 m or less for coastal protection design involving
numerical modeling; 100 m
intervals for regular monitoring of beaches 500 m to 1000 m
long
Minimum 3 profile lines every stretch of beach
Measurement interval along profile line
1. Minimum of one reading every 10 m;
2. at changes along profile and at base, slope and crest of
structures
3. at base and crest of beach dunes
1. Minimum of one reading every 10 m;
2. at changes along profile and at base, slope and
crest of structures
3. at base and crest of beach dunes
Method 1. Topographic and hydrographic surveys using
total station and multi-
frequency echo sounders; 2. DGPS positioning
3. Land-based and hydrographic survey must
overlap
1. Total station, theodolites, rod, prism
2. GPS unit (to record
general location coordinates of survey
area) 3. Profile points based on
distance reading
Datum Based on established vertical and horizontal datum
Based on temporary datum or reduced to local reference
datum

Chapter 11 SHORELINE MONITORING AND MAINTENANCE
___________________________________________________________________________________________
_________________________________________________________________________________________ March 2009 11A-3
APPENDIX 11-C STORM EVENT REPORT
DATE: ……………………………….
TIME: ………………………………… LOCATION: ……………………….STATE: ………………………………………
WEATHER: ……………………………………………………………………………………
Duration of event Start: ………………………… End: …………………………..
Water levels during storm event* ……………………. m Height of incident waves* ……………………. m
Formation and height of erosion scarp ……………………. m
Description
Overtopping incidences and hotspots
Recession of shoreline ……………………. m Effect on coastal vegetation:
* relative or qualitative indication
DAMAGES Extent of damage to existing coastal structures e.g. displacement of armour units, toe
scouring etc.
Extent of area damaged – length of stretch, extent of wave run-up
Damage to properties and infrastructure (with indication or estimate of value)
Sedimentation of coastal outlets and jetties

Chapter 11 SHORELINE MONITORING AND MAINTENANCE
___________________________________________________________________________________________
__________________________________________________________________________________________ 11A-4 March 2009
(This page is deliberately left blank)

Chapter 12 FUTURE OUTLOOKS
___________________________________________________________________________________________
___________________________________________________________________________________________
March 2009
CHAPTER 12
FUTURE OUTLOOKS


Chapter 12 FUTURE OUTLOOKS
___________________________________________________________________________________________
___________________________________________________________________________________________
March 2009 12-i
Table of Contents
Table of Contents .................................................................................................................... 12-i
List of Tables ........................................................................................................................12-iii
List of Figures ........................................................................................................................12-iii
12.1 INTRODUCTION............................................................................................................ 12-1
12.2 ECOSYSTEM RESTORATION........................................................................................... 12-1
12.2.1 Marine Ecosystem Services ................................................................................ 12-1
12.2.2 Degradation of Marine Ecosystem Services.......................................................... 12-3
12.2.3 Interdisciplinary Design...................................................................................... 12-3
12.2.4 Adaptive Approach to Management .................................................................... 12-4
12.3 TECHNOLOGY ADVANCEMENT ....................................................................................... 12-5
12.3.1 Satellite Positioning ........................................................................................... 12-5
12.3.2 Laser-based (LIDAR) Surveying and Mapping ...................................................... 12-7
12.3.3 Aerial Photogrammetry ...................................................................................... 12-8
12.3.4 Computer-Aided Design and Modeling .............................................................. 12-10
12.3.5 Coastal Hydroinformatics System ..................................................................... 12-10
12.3.6 Real-time Monitoring using Video-imaging Techniques....................................... 12-11
12.4 TRANS-BOUNDARY ISSUES.......................................................................................... 12-15
12.4.1 Regional Assessment and Monitoring................................................................. 12-16
12.5 INTEGRATED APPROACHES IN MANAGEMENT .............................................................. 12-18
12.5.1 Integrated River Basin Management (IRBM)...................................................... 12-18
12.5.2 IRBMP – ISMP Linkage..................................................................................... 12-18
12.6 DECISION SUPPORT SYSTEM USING ISMP .................................................................. 12-19
12.6.1 ISMP Database ............................................................................................... 12-19
12.6.2 ISM-DSS Users and their Requirements ........................................................... 12-19
12.6.3 Functional Specification for ISM-DSS ............................................................... 12-21
12.6.4 Development Of Specific Participation Strategies/ Partnership ............................ 12-24

Chapter 12 FUTURE OUTLOOKS
___________________________________________________________________________________________
___________________________________________________________________________________________
12-ii March 2009
12.7 FORMULATION OF A COASTAL DEVELOPMENT CONTROL ACT .......................................12-24
12.7.1 A Shoreline Management Act ............................................................................12-24
REFERENCES.........................................................................................................................12-25

Chapter 12 FUTURE OUTLOOKS
___________________________________________________________________________________________
___________________________________________________________________________________________
March 2009 12-iii
List of Tables
Table Description Page
12.1 Marine Ecosystem Services 12-2
12.2 Comparison between LIDAR and Aerial Photogrammetry (after FEMA, 2002) 12-9
List of Figures
Figure Description Page
12.1 A schematic Representation of the Marine Ecosystem Services 12-2
12.2 Adaptive Management Approach 12-4
12.3 Obtaining 3D positions from satellites 12-6
12.4 Typical Differential GPS setup 12-7
12.5 Typical LIDAR survey of a shoreline (after NOAA, 1999) 12-8
12.6 Components of a Coastal Hydroinformatics System 12-11
12.7 Example of a Video-Imaging System used for Beach Monitoring 12-13
12.8 Example of a Video-Imaging System used in the monitoring of sandbar 12-14
development at a River Mouth
12.9 Images of Wave Breaking Phenomena 12-15
12.10 The Framework for a Regional Approach in Overcoming Trans-boundary Issues 12-16
12.11 The Evaluation Procedure in an Environmental Assessment of a Proposed 12-17
Mega-Project
12.12 The Process Flow of the Regional Assessment and Monitoring System 12-17
12.13 Application for Conversion and Sub division – Flow Chart 12-20
12.14 Application for Planning Permission – Flow Chart 12-20
12.15 Functionality Modules in ISM-DSS 12-22
12.16 Strategic Three-Tier Partnership 12-24

Chapter 12 FUTURE OUTLOOKS
___________________________________________________________________________________________
___________________________________________________________________________________________
12-iv March 2009
(This page is deliberately left blank)
Chapter 12 FUTURE OUTLOOKS
___________________________________________________________________________________________
___________________________________________________________________________________________
March 2009 12-1
12 FUTURE OUTLOOKS
12.1 INTRODUCTION
This chapter describes the overview of a number of recent developments in the coastal engineering
and management disciplines, particularly so where recent concerns on the environment and the need
for soft engineering solutions have garnered interdisciplinary interests. Alternatively, a new outlook into the dimensions of the marine ecosystem services also need to be highlighted. This is because a
coastal engineer is no longer confined to designing solutions for coastal defense works, typically constructing structures to prevent flooding, erosion and sedimentation. In fact, a coastal engineer in
this era, has to be a “well-balanced” person who is familiar with the sensitive needs of the
environment. Managing a shoreline not only needs the knowledge of the technical know-how and the basic sciences, it may even be regarded as an art of tackling “soft” and sensitive issues related to the
environment. Hence, solutions have to be designed to provide value-added features that benefit both the physical and biological features of the marine ecosystem, a great stride towards sustainable
development along the coast. Today, where most coastal engineering projects are concerned, terms
like “eco-friendly”, “environment-friendly”, “soft methods”, “bio-technical solutions”, “eco-engineering techniques” are becoming popular and even compulsive to some developers and authorities.
Other than that, demand for an adaptive approach to coastal management has to be emphasized
and coastal managers must be willing to adopt this technique. Evidences of long-term water level changes as a result of climatic fluctuations need also to be considered in the design of coastal
structures. Mammoth-scale coastal engineering projects such as coastal reclamation and deepening
of navigation channels may lead to trans-boundary issues. It is also heartening to note that the art of designing shore protection projects has evolved from a “trial-and-error”, to “rules of thumb”, to
the use of modern technology in terms of data acquisition through satellite and LIDAR-based technologies. As such, the vulnerability of the coastline against natural hazards such as tsunamis
and sea level rise may be determined via GIS-based risk mapping techniques. These techniques will
be briefly described in the following sections.
12.2 ECOSYSTEM RESTORATION
Coastal restoration is an ecosystem conservation strategy that is beginning to gain more widespread acceptance. The term, “restoration” is used to indicate human intervention that is designed to
accelerate the recovery of damaged habitats, or to bring ecosystems back to as close an approximation as possible of their pre-disturbance states. An engineer however would choose to
become more practical by working towards “rehabilitation” or “enhancement”. “Rehabilitation” or
“enhancement” simply means “the act of partially, or more rarely, fully replacing structural or functional characteristics of an ecosystem that have been diminished or lost, or the substitution of
alternative qualities or characteristics than those originally present with the provision that they have more social, economic or ecological value than existed in the disturbed or degraded state”.
12.2.1 Marine Ecosystem Services
Tropical marine ecosystems along the coast often include coral reefs, seagrass beds and mangroves. These ecosystems are not autonomous units, but rather integral parts of a “seascape” interlinked by
ecological and hydrodynamic processes. They also form the physical boundaries for the seascape:
mangroves at the transition zone between terrestrial and aquatic environments and coral reefs at the interface between coastal areas and the open sea. Between the two are the seagrass beds (see
Figure 12.1). Nevertheless, there are several places where coral reefs, mangroves and seagrass ecosystems occur in relative isolation. For example, at large river deltas, mangroves develop on
accreting sediments and reefs are not found in the immediate vicinity such as those along the west coast of Peninsular Malaysia. However, along the coast of Sabah, mangroves here are more likely to
have strong interconnectedness with adjacent seagrass beds and coral reefs.

Chapter 12 FUTURE OUTLOOKS
___________________________________________________________________________________________
___________________________________________________________________________________________
12-2 March 2009
Figure 12.1 A schematic representation of the Marine Ecosystem Services
Table 12.1 illustrates some of the several services afforded by the three ecosystems. These
constitute multiple functions ranging from physical, biological, physio-chemical, social as well as economic contributions to the environment.
Table 12.1 Marine Ecosystem Services
Services
Mangrove
Sea-
grass
Coral
reef
Artificial
substitution
Erosion control ** * Revetment/Seawall
/Nourishment
Storm and flood protection ** * ** Seawall/Bund/ Artificial dune
Nursery, feeding and breeding ground ** * ** Aquaculture
Maintenance of biodiversity and genetic
resources * * **
Interrupts fresh water discharge **
Trap sediments and pollutants ** * Water treatment
plant/Mangrove
replanting
Nutrient filter ** * Water treatment
plant/Mangrove replanting
Export of organic matter ** *
Carbon dioxide sink ** *
Oxygen production ** *
Water catchment and groundwater recharge *
Educational and scientific information * * **
Support recreation * * ** Nourishment
Sustaining the livelihood of coastal
communities ** * **
Cultural, spiritual and artistic values * *
Note: * = significant; ** = very significant
Interaction with terrestrial
Mangroves
Seagrass
bed
Coral Reef
Interaction with open sea
Shore protection
Flood control
Protection against
coastal storms
Marine resources
Tropical seascape
Marine biodiversity

Chapter 12 FUTURE OUTLOOKS
___________________________________________________________________________________________
___________________________________________________________________________________________
March 2009 12-3
12.2.2 Degradation of Marine Ecosystem Services
The case of ecosystem degradation has never been more compelling. The pressure from growing populations, massive development, non functional development schemes and unplanned construction
are particularly evident in the last 20 years. It is believed that the severity of the pressure has accelerated the demise of the natural ecosystems so much so that there is an emerging need to
prevent further loss of these habitats. Natural factors such as storms, hurricanes and temperature rise worsen the condition. Perhaps one of the most important human disturbances on the coral
reefs, seagrasses and mangroves is the increased amount of pollutant loading either from disposal of
raw sewerage into the sea or high concentrations of sediments which can cause smothering of reef organisms. Seagrass beds, since they are frequently located up to the intertidal zones, are especially
vulnerable to any form of coastal activity such as dredging and reclamation works.
In the context of sustainable development, coastal engineering works including shore protection,
beach creation, recreational marine parks, ports and marinas, etc., may have a considerable impact on the health of the marine ecosystem. Traditional methods of building “hard” structures have
currently been recognized as not environment-friendly. On the other hand, “soft” methods such as beach nourishment, construction of artificial beaches and non-structural solutions despite getting
popular, have their own setbacks. Ironically, marine ecosystem services afforded by natural systems such as mangroves, seagrass beds and coral reefs provide protection against floods and storms,
reduction of shoreline retreat and riverbank erosion as well as maintenance of biodiversity.
Nevertheless, depletion of these coastal resources (mangroves, seagrasses, coral reefs, sandridges, etc) is increasing in concern. Coastal restoration techniques employing state-of-the-art design of
ecologically-friendly structures should not be intended to replace the natural ecosystems but rather to enhance or revitalize the marine environment so much so that succession processes (e.g. by
natural restoration) would take over after the intervention. It is recommended that the dimensions
of the marine ecosystem services be integrated into the design features of coastal engineering structures in order for them to have added values in the design. Hence, ecosystem restoration plans
should be formulated and evaluated in terms of their net contribution to increase ecosystem value. Shore protection projects should strive to adopt a holistic approach and to consider ecosystem
restoration of these natural resources.
It must be reminded that the marine ecosystem out there is a complex ingredient of so many
uncertainties. Also, solutions are very much site-specific and success on the use of certain products depends on specific characteristics of the recipient site, such as exposure conditions, depth,
substrate type, etc. There are several ecologically-friendly methods in attempting to holistically incorporate the health of the marine ecosystem into a coastal restoration programme. However, the
emergent consensus is that neither engineering techniques nor the non-engineering methods are
enough to prevent the loss of the shoreline or even the habitats. In addition to simply setting aside certain areas for conservation, or restoring the natural habitats using biological means, there is
probably a need to actively pursue the implantation of some of the bio-engineered products –, the submerged porous breakwater system, the beach drainage system, engineered reefs, etc, as a
coveted gesture towards enhancing and sustaining the marine ecosystem services, hence promoting
coastal restoration in a sustainable manner.
12.2.3 Inter-disciplinary Design
Inter-disciplinary design is one area where engineers, biologists, chemists and other science disciplines work together to the wide range of technical and environmental issues encountered in the
planning and design of coastal development projects. The disciplines should be integrated and be
involved in the planning process from the very beginning. The team may also include archaeologists, attorneys, economists, landscape architects, planners, etc, depending on the type of studies or
design to be formulated.
On the other hand, a coastal engineer needs to be equipped not only with the coastal engineering
knowledge, he or she has to be sufficiently prepared with some background information on environmental issues and even perhaps, get accustomed with the ecological jargons. For example,
in applying the bio-engineering techniques for shore protection, it involves a combination of

Chapter 12 FUTURE OUTLOOKS
___________________________________________________________________________________________
___________________________________________________________________________________________
12-4 March 2009
biological methods with engineering structures. Bioengineering uses vegetation plantings for
shoreline stabilization under light to moderate wave action. While conventional engineering approach
relies solely on structural components and nourishment, the success of vegetative techniques depend highly on the biological knowledge such as type of plant species, plant cover, plant density
and maturity. At the same time, its hydrodynamic capability in terms of the wave-plant-soil interaction is poorly explained within the non-engineering community. Hence, the success and
effectiveness of bio-engineered design projects depend on the cooperative nature of both disciplines concerned.
12.2.4 Adaptive Approach to Management
The marine ecosystem is a complex ingredient of so many uncertainties. A point to note in the design of coastal development projects, particularly so for soft engineering systems of shore
protection, is that the management framework must allow for flexibility. This is important because
continual modifications to the design must be undertaken to accommodate changes in the ecological system and its function as time goes by. The present state of ecological knowledge and
understanding of the coastal processes makes it very difficult to predict the changes unless and until a good monitoring programme is instituted. New information obtained from here may therefore
necessitate such modifications and in some cases, re-engineering of the system may be necessary. Figure 12.2 describes the chain of activities involved in an adaptive management approach for the
design of soft engineering systems of shore protection in order to allow for flexibility and innovative
solutions. Updated baseline knowledge and experience can be used to design well functioning systems, which can then be tested and optimized by the state of the art modeling.
Figure 12.2 Adaptive Management Approach
Although careful planning may be involved in most of the designs, unforeseen or unanticipated
circumstances could occur at the site, resulting in partial or sometimes complete failures in the
designs. The bio-technical systems introduced in some parts of the world are a classic example. These design solutions are still in a trial-and-error stage despite having been introduced more than
30 years ago. Unfortunately, some design attempts have even led to failures (e.g. the Seascape
Synthetic Seaweed project at Barbados (Atherley, 1989) but the same technique when applied
elsewhere (e.g. the Shell/Nicolon Artificial Seaweed System in the Netherlands) appear to serve its
function successfully.
A local example is a pilot project using fibre-coil mangrove planting and geo-tubes in Yan, Kedah, in the late 1990’s. This project has set the first step towards applying bioengineering principles, though
with some mixed success in protecting the shoreline. In Tg. Piai, Johor, geo-tubes are applied to
Continual
Improvement
Re-engineering
Monitoring
New
Information
State-of-the-art
design; allow for
flexibility

Chapter 12 FUTURE OUTLOOKS
___________________________________________________________________________________________
___________________________________________________________________________________________
March 2009 12-5
provide a coastal protection system for the degrading mangroves, this time with some degree of
success. Judging from these experiences, it is recognized that monitoring, maintenance and
replacement measures are critical factors in determining the success of the project. Coastal managers must be willing to accommodate a certain degree of “failures” and allow for modifications
in the original design.
12.3 TECHNOLOGY ADVANCEMENT
The central activity in coastal engineering planning, design and management is the development and application of tools for reliable data acquisition in computer models. This section will briefly describe
the recent development in surveying techniques and the advancement of ICT as applied in modeling and monitoring work. The topics include:
• Satellite positioning
• Laser-based (Lidar) surveying and mapping
• Computer-aided design and modeling
• Real-time monitoring using video-imaging techniques
12.3.1 Satellite Positioning
The methodology commonly adopted by most surveyors in determining the 3D coordinates of points
uses the Global Positioning System (GPS) technology. The following section explains in brief the GPS survey and positioning system.
(i) GPS Survey
GPS is a location system based on a constellation of about 24 satellites orbiting the earth at altitudes of approximately 17,600 km. GPS was developed by the United States Department of Defense
(DOD), for its tremendous application as a military locating utility. However, over the past several
years, GPS has proven to be a useful tool in non-military mapping applications as well. GPS satellites are orbited high enough to avoid the problems associated with land based systems, yet can provide
accurate positioning 24 hours a day, anywhere in the world. Uncorrected positions determined from GPS satellite signals (such as stand-alone autonomous usage) produce accuracies in the range of 50
to 100 meters. When using a technique called differential correction, users can get positions accurate up to centimetres level.
(ii) GPS Positioning In a nutshell, GPS is based on satellite ranging - calculating the distances between the receiver and
the position of 3 or more satellites (4 or more if elevation is desired) and then applying an appropriate mathematical model. Assuming the positions of the satellites are known, the location of
the receiver can be calculated by determining the distance from each of the satellites to the receiver.
GPS takes these 3 or more known references and measured distances and "triangulates" an additional position. Figure 12.3 shows schematically how 3D positions of any point on the earth’s
surface can be determined or calculated based on the satellites signals. The following section describes the approaches that can be employed in determining positions using GPS.
(iii) GPS Positioning Types
(A) Absolute Positioning
The mode of positioning relies upon a single receiver station. It is also referred to as 'stand-alone' GPS, because, unlike differential positioning, ranging is carried out strictly between
the satellite and the receiver station, not on a ground-based reference station that assists
with the computation of error corrections. As a result, the positions derived in absolute mode are subject to the unmitigated errors inherent in satellite positioning. Overall accuracy of
absolute positioning ranges between 50 to 100 meters.

Chapter 12 FUTURE OUTLOOKS
___________________________________________________________________________________________
___________________________________________________________________________________________
12-6 March 2009
Figure 12.3 Obtaining 3D positions from satellites
(B) Differential Positioning
Relative or Differential GPS carries the triangulation principles one step further, with a
second receiver at a known reference point. To further facilitate determination of a point's position, relative to the known earth surface point, this configuration demands collection of
an error-correcting message from the reference receiver.
Differential-mode positioning relies upon an established control point. The reference station
is placed on the control point, a triangulated position. This allows for a correction factor to be calculated and applied to other roving GPS units used in the same area and in the same
time series. Inaccuracies in the control point's coordinate are directly in addition to errors
inherent in the satellite positioning process. Error corrections are derived by the reference station very rapidly, as the factors propagating position errors are not static over time. This
error correction allows for a considerable amount of error to be negated, potentially as much as 90 percent. As such, differential methods could yield accuracies up to 1 cm. Figure 12.4
shows a typical GPS setup for differential measurements.
(iv) GPS Survey
The following criteria are recommended to be adopted for a GPS verification survey: a) Observation technique: Differential Fast Static (15min observations)
b) Observation epoch: every 10 sec
c) No. of satellites to be observed: 7 - 12 d) Mask Angle: 15 degrees
e) GPS : Trimble dual frequency GPS receivers. f) GPS Base Station : GPS stations established by JUPEM will be used as fix reference
stations for both sites

Chapter 12 FUTURE OUTLOOKS
___________________________________________________________________________________________
___________________________________________________________________________________________
March 2009 12-7
Figure 12.4 Typical Differential GPS setup
12.3.2 Laser-based (LIDAR) Surveying and Mapping
Light Detection and Ranging (LIDAR) is a remote sensing system used to collect topographic data.
This technology is applied by scientists and engineers to aid them in conducting studies that require topographic data. One example of such applications is documenting topographic changes along
shorelines. LIDAR data is collected with aircraft-mounted lasers capable of recording elevation measurements at a precision of 20 centimeters. After a baseline data set has been created, follow-up
flights can be used to detect shoreline changes (NOAA, 1999). In recent years, applications of LIDAR
sensors have grown rapidly, due to two technological developments. First, electro-mechanical technology has improved scanners and lasers to the point that they can be accurately and reliably
controlled in a moving aircraft. Second, aircraft positioning using GPS, and Inertial Navigation Systems, or INS, technology has advanced to the point that aircraft position and orientation can be
continuously determined to high levels of precision.
A schematic laser ranging scanning is shown in Figure 12.5. A series of 30-degree wide swath is created (overlapping swath) on the ground, thus permitting the collection of topographic information
over a strip approximately 300 meters in width from the nominal 600 meter data collection altitude. The main components of a LIDAR system are the laser, the scanning mechanism and projection
optics, the receiver optics, and the platform navigation sensors.
RECEIVER
ANTENNAE
LAPTOP COMPUTER
RECEIVER
ANTENNAE
DATA COLLECTOR
PC for Editing and
Differential Correction
Host Computer with
Database Programming
GPS Setup

Chapter 12 FUTURE OUTLOOKS
___________________________________________________________________________________________
___________________________________________________________________________________________
12-8 March 2009
Figure 12.5 Typical LIDAR survey of a shoreline (after NOAA, 1999)
Scanning airborne laser ranging systems may be mounted on either fixed-wing or rotary-wing aircraft and may be internally mounted in a camera port or contained in an attached pod. The most
important element of the platform is its navigation system. As mentioned earlier, an inertial
navigation system is operated in conjunction with high accuracy GPS receivers to provide aircraft orientation information and also position information between GPS updates.
It should be reminded at this point that, LIDAR instruments only collect elevation data whose
positions are recorded by the high-precision on-board GPS. As such, these 3D data points are normally superimposed with photogrammetrically obtained orthophotographs to produce the
necessary high-resolution rectified maps of the study areas. The 3Ddata points also allow the
generation of a digital terrain model (DTM) of the ground surface.
Laser scanning technology continues to improve rapidly. Current attainable accuracies are about 15 cm in absolute elevation and about 5 cm in relative elevation (between adjacent points). The
generation of digital terrain models with grid spacings of 1 meter is also possible.
12.3.3 Aerial Photogrammetry
Aerial photogrammetry has many applications in today’s mapping environment. Aerial photography is used to create topographic (relief) and planimetric (nonrelief) maps, forest cover type maps for the
forest industry, base maps for municipalities, and orthophotograph, or digital imagery maps. In
addition, it provides the foundation for Geographic Information Systems (GIS). Maps depicting land use and wetland boundaries - vitally important for observing economic growth and conserving our
natural resources - are based on aerial data.
In an aircraft, the aerial photographer obtains vertical imagery of the terrain, following a systematic
flight pattern at a fixed altitude. Taken in a series of overlapping pairs, each photograph depicts an area that includes surveyed reference points or mathematically derived locations on the ground.
These points, linked together mathematically, help to eliminate inaccuracies in the images that the tip and tilt of the aircraft and the varying elevations of the land create. Through the process of
photogrammetry, the photographs are overlapped and interpreted in a stereoplotter, which produces
a three-dimensional view or relief model of the terrain. The photogrammetrist uses this model to produce line maps.

Chapter 12 FUTURE OUTLOOKS
___________________________________________________________________________________________
___________________________________________________________________________________________
March 2009 12-9
In addition to line maps, another important end-product of photogrammetry is orthophotograph. It is
in essential a photoghraphic image of the ground but has been rectified to depict true scale, thus,
enabling direct measurements in estimating distances. Orthophotographs are useful in identifying and delineating natural or man-made features, a process that is vital in this study. Since
orthophotographs derived from aerial photos are of high resolution, they prove to be very informative and invaluable in studies that require some kind of photo interpretation, such as this.
Engineers also depend on photogrammetric solutions to problems such as wave shapes, sedimentation in channels and deformation of structures. Hydrologists rely on the photogrammetric
analysis of slope, ground coverage, watershed areas in order to determine run-off quantities for
water supply study. Engineers have also utilized photogrametrically derived DTM and orthophotographs in coastal mapping (Overton, et.al.1996).
LIDAR vs Aerial Photogrammetry
Both LIDAR and aerial photogrammetry have been extensively used in mapping the shoreline along coastal areas. While one excelled in certain aspects the other faltered and came short of the
objectives required, and vice-versa. Table 12.2 gives a summary of the comparison between these two methods.
Table 12.2 Comparison between LIDAR and Aerial Photogrammetry (after FEMA, 2002)
LIDAR Photogrammetry
Energy source Active Passive
Geometry Polar Perspective
Sensor type Point Frame or linear scanning
Point measurement Direct Indirect
Sampling Individual points Full area
Associated image None or monochrome High quality spatial & radiometric
Horizontal accuracy 2-5 < than vertical accuracy 1/3 better than vertical
Vertical accuracy 10-15 cm (10 cm per 1,000m
over heights of 2,500 m)
Function of flying height and
focal length of camera
Flight planning More complex due to small strips and potential data voids
Overlap and side lap need to be considered
Flight restrictions Less impact from weather,
day/night, cloud condition
Must fly during day and need
clear sky
Production rate Can be more automated and faster
Budget 25%-33% of photogrammetric compilation budget
Production Proprietary software: processing
performed by vendors, operators
Desktop software available to
end-user
Limited contrast area acquisition
Can acquire data: used extensively for coastal mapping
Difficult and expensive
In some studies, it was observed that both LIDAR and Digital Photogrammetry were employed. LIDAR was the main method of obtaining the relief, DTM and all features (mapping) while Digital
Photogrammetry was used to produce high-resolution orthophotographs of the study areas for the purpose of feature identification and delineation.
Specifications for Air-borne and LIDAR Survey
Technical specifications for an air-borne survey may be prepared with reference to the following documents:
(1) FEMA Guidelines and Specifications for Flood Mapping Partners, Appendix A: Guidance for Aerial Mapping and Surveying, Feb 2002.
(2) FEMA Guidelines and Specifications for Flood Mapping Partners, Appendix 4B: Airborne Light
Detection and Ranging Systems, Feb 2000. (3) USACE, EM 1110-1-1000 Engineering and Design Photogrammetric Mapping, Washington
DC, July 2002.
Chapter 12 FUTURE OUTLOOKS
___________________________________________________________________________________________
___________________________________________________________________________________________
12-10 March 2009
12.3.4 Computer-Aided Design And Modeling
Informatics systems integrating ICT with specific physical knowledge of the marine environment make it possible to integrate a whole range of environment-concerned disciplines and have opened
the way towards 6th generation (built-in AI and real-time) simulation software. The advent of ICT and knowledge-based information systems has pushed the technology to the market-driven research
in the following ways:
- Video-camera techniques based on the world-acknowledged Argus platform for on-line video-
filming and analysis; - Database management systems for storage, retrieval, and combination of all kinds of
information; - Geographical Information Systems (GIS) to allow users to use map representations of the
information stored in the database;
- Online regional and local hydrodynamic, wave and ecological modeling capable of producing time series of all relevant parameters in selected points as well as animations of 2D ad 3D
patterns of selected parameters over relevant areas including statistics of all parameters; - Multimedia systems for combining different modes of presentation;
- Computer networks to permit world-wide exchange and sharing of information; - Expert knowledge in all kinds of domain to be captured, stored and applied;
- Etc.
12.3.5 Coastal Hydroinformatics System
There is no doubt that enormous amount of valuable data were obtained during the several EIA studies and these data should be fully utilized in a pro-active and systematic manner for more
accurate decision making. A Decision-Support System for coastal management is recommended via the use of a centralized Database and Modelling System or Hydroinformatics in order to develop an
effective coastal management system in the country. At the present moment, DID is archiving all
these data in its GIS database with the hope to expand the system to include a user-friendly decision-support system in the future. The availability of huge amounts of data and information
obtained from the monitoring program could be fully integrated into a decision-support system that goes beyond the traditional hydrodynamic and coastal modeling. Computer technology and software
engineering techniques have become standard approaches to assess the environmental impacts of
man-made structures on the coastal regime. Thus, a hydroinformatics system implies the integration of the information system, modeling system and knowledge-base in order to provide information in a
fast and interactive manner. Figure 12.6 shows a global overview of a hydroinformatics system.

Chapter 12 FUTURE OUTLOOKS
___________________________________________________________________________________________
___________________________________________________________________________________________
March 2009 12-11
Figure 12.6 Components of a Coastal Hydroinformatics System
12.3.6 Real-Time Monitoring Using Video-Imaging Techniques
Much of our current knowledge about a coastal area has been based on relatively few,
comprehensive field data. In order to support policy-making for effective management, the government of Malaysia needs a comprehensive set of real-time data on the marine environmental
parameters, for the purpose of set-up and evaluation of present and future coastal development projects with respect to usage, planning and management of the coastal area. At the present
moment, collection and management of these marine data such as waves, currents, bathymetry and sea water levels are separately undertaken by various government agencies and institutions. These
are traditionally accomplished by surveys of beach profile and field measurement of currents, waves,
water levels, sediment and water quality sampling. Recent observations point to the importance of all these data in providing ground truth to ensure sustainable development.
The technology consists of a network of video cameras and real-time observations to provide
archived records of shallow-water wave characteristics, currents, water levels and meteorological
conditions (wind speed and direction, temperature, barometric pressure) as well as digital images of the beach and nearshore processes, at several locations spanning a study area. The system can be
designed to provide real-time information to local, State and Federal government agencies for long-term records of wave, weather conditions and shoreline response for use by the coastal scientific
community as well as coastal managers in planning and making strategic decisions for the
sustainable development in the coastal area. It can be designed to present information on the actual status of the coastal bathymetry and related processes such as erosion, sediment transport and
deposition.
The heart of the technology is a series of communication and informatics tools (video cameras, telephone lines), imaging techniques and analyses encompassed in an Integrated Database and
Modelling System (IDMS). It comprises three main systems:
(i) Coastal Imaging System: consisting of a station or stations set up along the coast to capture
digital images of the coastline, including snapshots, time-exposure and variance images. The station is complete with power, security, and phone lines to communicate with the other
systems. Neural networks for data interpretation, system optimization and fuzzy logic are
used during image processing and analysis. All data and results of the analysis are then

Chapter 12 FUTURE OUTLOOKS
___________________________________________________________________________________________
___________________________________________________________________________________________
12-12 March 2009
transferred to an Integrated Database and Modelling System (IDMS) for further analysis and
simulation work;
(ii) Real-Time Coastal Observation Network System: consists of automatic, on-line insitu
measurement of currents, waves, temperature and selected water quality parameters, such TSS, O & G, etc.
(iii) Integrated Database and Modelling System: This system receives and feeds real-time
information on the hydro-meteorologic situation from the other two systems. Data are
processed, analysed and computed using processing and simulation softwares (e.g. weekly shoreline analysis, wave breaking phenomena, weekly seabed contour changes, daily
sediment concentration levels, etc). The information can be presented as video-animated graphics to other user groups and/or to responsible departments as necessary for strategic
management of the areas concerned.
The real-world land-sea interaction can be monitored by means of a video-camera filming as well as
field measurement system for ground truth validation. Field data is transferred to a central site (computerized management center), where data processing and forecasting will take place using
management softwares, databases, mathematical models and specific site knowledge. Results will be displayed to the decision-makers in an easily interpretable format via a communication system
management software and decision-aid software. A variety of modeling tools are also needed to
implement these aspects successfully, with appropriate expert and opinions to ensure that each tool is used correctly e.g. a need for tools to navigate through the model, to link to external databases, to
CAD systems, digital terrain models, GIS, and so on. Between the system and the users is the interface, which will utilize the best and most friendly technology. The manager can thus
interactively simulate the operation of structures, compare results in alternative scenarios, and
decide on the best course of action.
Real-time monitoring and coastal imaging techniques are the most recent research ventures being developed at several renowned institutions in the world and are becoming very popular in many
countries. Several companies and research institutions use the ARGUS System developed by Oregon State University, USA as part of a comprehensive Coastal and Environmental Monitoring Programme.
From a station, several useful data can be obtained over miles of beach and in every hour for years.
Stations are unmanned, data are transferred over internet and maintenance costs are virtually zero. In fact, the data collected over years at Agate Beach on the Pacific coast, USA (the first Argus
station) and at Palm Beach, north of Sydney, Australia, are being updated every hour for the past 3 – 5 years. They are being collected and analysed to monitor large-scale coastal changes associated
with coastal construction works and sand nourishment activities of the adjacent beaches. All images
may be viewed and downloaded by visiting the image archive installed in the institution’s web site. Figures 12.7 to 12.9 illustrate examples of video-imaging techniques being used in coastal
monitoring projects in Australia and USA.
The technology has high potential in the local market due to the demand for sustainable
development in the country, with several coastal reclamation projects, port development, marinas, islands and coastal resorts. The government policies in imposing Environmental Monitoring
Programmes, Shoreline Monitoring Programmes, etc to developers or project proponents will require monitoring systems that may be able to provide long-term solution to the existing coastal erosion
and environmental problems. Hence, the technology may become a key component in a comprehensive Environmental Monitoring Programme (EMP) that could be imposed onto future
mega-scale coastal development projects.

Chapter 12 FUTURE OUTLOOKS
___________________________________________________________________________________________
___________________________________________________________________________________________
March 2009 12-13
Figure 12.7 Example of a Video-Imaging System used for Beach Monitoring
Weekly Shoreline Analysis
ABMS camera housings
ABMS oblique timex image
Argus Beach Monitoring Station (ABMS)
developed by researchers at Coastal
Imaging Laboratory, Oregon State University.

Chapter 12 FUTURE OUTLOOKS
___________________________________________________________________________________________
___________________________________________________________________________________________
12-14 March 2009
Detecting current movement and tracking plumes
Figure 12.8 Example Of A Video-Imaging System Used In The Monitoring of
Sandbar Development At A River Mouth
20 February 1999 15:00
Tide elevation: 0.55m
27 October 1999 14:00
Tide elevation: 0.62m

Chapter 12 FUTURE OUTLOOKS
___________________________________________________________________________________________
___________________________________________________________________________________________
March 2009 12-15
Figure 12.9 Image Types of Wave Breaking Phenomena
12.4 TRANS-BOUNDARY ISSUES
Towards the end of the last century, there appeared to be a dramatic change in perception to
coastal development and management in the country as well as in neighbouring countries. Possibly the greatest change of all was the increasing number of mega projects such as coastal reclamation
and sand mining projects in the country submitted for approval from the relevant authorities. Mega
projects along the coast could create pressures on aquatic systems over large geographic areas. Considering that most of these mega projects were proposed by states bordering the Straits of
Melaka, such as Perlis, Kedah, Penang, Perak, Selangor, Negeri Sembilan, Melaka and Johor, there was an ardent need from the approving authorities to impose a Macro-Environmental Impact
Assessment exercise prior to further detailed assessments of individual developments. On the other
hand, states of Sabah and Pahang have developed their own Shoreline Management Plans (SMP) which consider the overall coastal regime and perceived as part of a complete coastal management
strategy.
Before any mega-scale coastal engineering project is implemented, it is important that a framework for a regional approach has to be drawn out in order to take into consideration the possible outcome
of trans-boundary issues. This includes a thorough understanding of the coastal processes, its
resources and use, in which the underlying factors and current policies must be known. Knowledge-based information is crucial for sustainable management, and hence a Decision-Support System is
deemed relevant for an effective coastal management system in the country. This leads to the application of hydroinformatics which will be highlighted in the following sub-section. Figure 12.10
summarises the key elements to be considered in resolving trans-boundary issues on a regional
scale:
• Formulation of a regional assessment and monitoring policy
• Use of Hydroinformatics
• Development of specific participation/strategic partnership
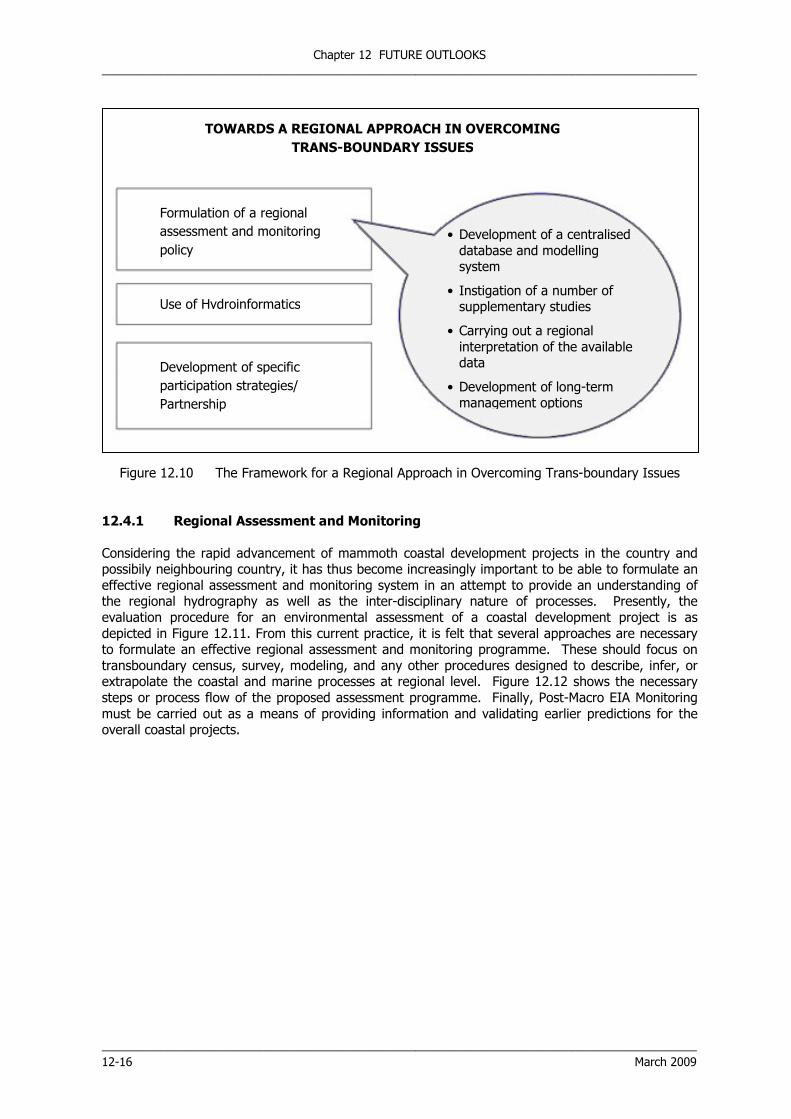
Chapter 12 FUTURE OUTLOOKS
___________________________________________________________________________________________
___________________________________________________________________________________________
12-16 March 2009
Figure 12.10 The Framework for a Regional Approach in Overcoming Trans-boundary Issues
12.4.1 Regional Assessment and Monitoring
Considering the rapid advancement of mammoth coastal development projects in the country and possibily neighbouring country, it has thus become increasingly important to be able to formulate an
effective regional assessment and monitoring system in an attempt to provide an understanding of the regional hydrography as well as the inter-disciplinary nature of processes. Presently, the
evaluation procedure for an environmental assessment of a coastal development project is as
depicted in Figure 12.11. From this current practice, it is felt that several approaches are necessary to formulate an effective regional assessment and monitoring programme. These should focus on
transboundary census, survey, modeling, and any other procedures designed to describe, infer, or extrapolate the coastal and marine processes at regional level. Figure 12.12 shows the necessary
steps or process flow of the proposed assessment programme. Finally, Post-Macro EIA Monitoring
must be carried out as a means of providing information and validating earlier predictions for the overall coastal projects.
Formulation of a regional
assessment and monitoring
policy
Development of specific
participation strategies/
Partnership
Use of Hydroinformatics
• Development of a centralised
database and modelling system
• Instigation of a number of supplementary studies
• Carrying out a regional
interpretation of the available data
• Development of long-term management options
TOWARDS A REGIONAL APPROACH IN OVERCOMING
TRANS-BOUNDARY ISSUES

Chapter 12 FUTURE OUTLOOKS
___________________________________________________________________________________________
___________________________________________________________________________________________
March 2009 12-17
Figure 12.11 The Evaluation Procedure in an Environmental Assessment of a Proposed Mega-Project
Figure 12.12 The Process Flow of the Regional Assessment and Monitoring System
Problem Information from Field Data
• Measurements
• Digitised charts
• Databases
• GIS systems
• Remote sensing
• Etc.
Coastal Application Computer Models
• Hydrodynamic
• Morphological
• Water quality
• Wave
• Ecological
• Etc.
Results Presentation
• Graphics
• Animation
• Video
• Other
visualisation techniques
Design Optimisation & Problem Solving
• Design decisions
• Monitoring programmes
• Operation and
maintenance
• Mitigation
measures
• Etc.
Input Preparation
Processing Program
Output
Presentation
Interpretation

Chapter 12 FUTURE OUTLOOKS
___________________________________________________________________________________________
___________________________________________________________________________________________
12-18 March 2009
12.5 INTEGRATED APPROACHES IN MANAGEMENT
12.5.1 Integrated River Basin Management (IRBM)
The National Water Resources Study (NWRS) 1982 delineated major river catchments in Peninsular
Malaysia into 26 river basins. Sabah (including Labuan) and Sarawak were demarcated with 26 and
21 river basins respectively. The study investigated geology, meteorology, river conditions,
hydrology, groundwater resources, agriculture, inland fishery, ecology, water quality and inland
navigation. Irrigation, domestic and industrial water demands and power requirement were projected
to fiscal year 2000. Based on water resources engineering and development planning, potential dam
sites and inter-state water transfer systems were recommended. The study also covered socio-
economic, legal and institutional aspects. The Master Action Plan recommended actions for the
Federal and State Governments to ensure efficient and effective execution of water resources
development and management for the future.
In the Global Water Partnership concept, Integrated River Basin Management (IRBM) is “the process
of coordinating conservation, management and development of water, land and related resources
across sectors within a given river basin, in order to maximize the economic and social benefits
derived from water resources in an equitable manner while preserving and, where necessary
restoring freshwater ecosystems”.
The Integrated River Basin Management Plan (IRBMP) provides objectives, goals, policies and
strategies for effective management of the water and related land resources in the river basins in an
integrated manner. The Plan takes into account existing land use, water availability and demands,
pollution and sources, aquatic and terrestrial ecosystem needs, flood vulnerability, and implication of
changes in land use and future water demands. The involvement and participation of the key
stakeholders and local communities are essential for the development of the IRBMP and its success
and sustainability.
The National Water Resources Council is the apex of the IRBM management framework. Hence
formulation of IRBMP for all major basins will have the highest level of endorsement which is the
National Water Resources Council chaired by the Prime Minister with members comprising all the
States’ Chief Ministers and Menteri Besar and the related Federal Ministers.
12.5.2 IRBMP-ISMP Linkage
Rivers carrying sediments to the river mouth provide fluvial nourishment of beaches. The sand and
gravel may accumulate at the growing delta or are transported longshore or carried out to sea to
form offshore shoal. The volume and characteristics of the fluvial sediments are influenced by
hinterland gradients, intensity and velocity of rainfall runoffs and vegetation cover.
Deforestation, agriculture, forestry, mining and urban development activities in the catchment reduce
vegetation cover leading to increase runoff, soil erosion and river flooding which contribute larger
quantities of sediment load for beach progradation. Alternately, reduced rainfall runoff, sand
entrapment in impounding reservoirs from dam construction, successful re-vegetation and soil
conservation works cause diminishing of fluvial sediment supply. Dam and barrage operations
regulate flow generally with lower release back to the river system and will change salinity in
estuaries and lagoons. Sand mining in rivers reduces the quantity of fluvial sediments naturally
available to be transported to the sea. Beach erosion occurs around outlets from rivers that have
been diverted to other parts of the coast where a new delta may begin to form.

Chapter 12 FUTURE OUTLOOKS
___________________________________________________________________________________________
___________________________________________________________________________________________
March 2009 12-19
Land based pollutants are produced by development in river basins such as agriculture, industry,
housing and tourism and will be carried in the river run-off to the sea. Major pollutants are
sediments, sewage, solid wastes, nutrients, synthetic organic chemicals, oils and pathogens which
are harmful to the ecosystems, living resources and human health.
DID has completed the first phase of a study to develop a River Basin Information Management
System (RB-IMS) incorporating a Register of Rivers. This inventory adopted the demarcation of the
river basins according to the NWRS Report 1982. The RB-IMS, together with the River Basin
Geographical Information System (RB-GIS), River Basin Simulation Modelling System (RB-SMS) and
Web Browser Access System (WBAS) have been proposed as the complete components of a River
Basin Decision Support System (RB-DSS).
ISMP has a crucial linkage to and is dependent on IRBM for effective control of downstream effects
from works and regulation in the river basins. The activities and operations will ultimately impact on
the coastal environment and marine ecosystem being the end receptor of the river system. The ISMP
will form the knowledge for decision support system for integrated shoreline management (ISM-DSS)
of coastal areas. The Decision Support System (DSS) for the integrated management of the coastal
areas and for the integrated river basins in the country have similar objectives. Hence, the proposed
specifications for the software and hardware of the ISM-DSS system should, wherever possible, be in
harmony with those of the RB-DSS and vice versa.
12.6 DECISION SUPPORT SYSTEM USING ISMP
12.6.1 ISMP Database
The ISMP formulated on a State basis provides a mapping of Management Units (MUs) along the
State’s shoreline and a definition and prioritisation of management objectives with a proposed
development control strategy for each MU. The ISMP takes into account the natural processes,
coastal defense needs, environment considerations, planning issues and current and potential land
uses. The findings and recommendations of the ISMP form the knowledge base of the Decision
Support System (ISM-DSS) to assist the State in managing the coastal zone.
Comprehensive database can be derived from the ISMP baseline study in respect to coastal
processes, water quality, coastal habitat, ecosystems, land use and the Structure Plans and Local
Plans. Other relevant data related to legal and institutional framework warrant inclusion in the data
base. These include enactments, government circulars, local authorities’ by-laws and rules,
regulations, standards and guidelines of the various government departments.
12.6.2 ISM-DSS Users and their Requirements
Decision Support System (DSS) is an interactive system that enables users to apply information to
identify issues, review and generate decisions or advice.
The ISM-DSS is intended for government agencies to access the information contained in the ISMP
with which to formulate and refine their technical advice in the process of evaluating development
application or to decide upon the approval of the applications. Development applications are required
to go through both processes of (i) conversion and subdivision (tukar syarat and pecah sempadan):
Figure 12.13 and (ii) planning permission (kebenaran merancang) : Figure 12.14. Developments
involving constructions are also required to submit applications for building permission. This is
submitted after the planning permission has been obtained.

Chapter 12 FUTURE OUTLOOKS
___________________________________________________________________________________________
___________________________________________________________________________________________
12-20 March 2009
Figure 12.13 Application for Conversion and Subdivision - Flow Chart
Figure 12.14 Application for Planning Permission - Flow Chart
The users from the government agencies fall under four general groups.
• The agencies and groups that have direct roles in decision making related to the
proposed developments such as UPEN, EXCO members, members of Local Councils,
and members of State Planning Committees, • Department of Town and Country Planning with involvement in formulating the
Structure Plan and Local Plans.
• Land Office and Local Authorities that process development applications.
• The technical advisory group including Department of Irrigation and Drainage,
Department of Environment, Public Works Department and others (such as Department of Agriculture, Department of Fisheries, etc as may be necessary) that
provide technical advice to the first three groups of agencies.
DISTRICT
OFFICE
EXCO
Technical Departments
Department of Town and Country Planning
Department of Irrigation and Drainage
Department of Environment
Public Works Department
APPLICANT
PTG
LOCAL
AUTHORITY
SECRETARIAT
In the case of a District Council
- External Technical Departments
constituting the Planning Committee
In the case of a Municipal Council
- A Planning Committee advised by
Internal Technical Departments for
advice and to recommend a decision
FULL COUNCIL
APPLICANT

Chapter 12 FUTURE OUTLOOKS
___________________________________________________________________________________________
___________________________________________________________________________________________
March 2009 12-21
The first group of principal decision makers will receive information through the Executive
Information System EIS (besides directly accessing the ISMP information in the system) and will
have current knowledge of general trends related to proposed development applications in the State.
They can also perform further examination to get details of the results of development reviews that
are carried out by DID.
The second and third group will be able to use ISMP information and any other relevant updates in
the ISM-DSS database for consideration in formulating the Local and Structure Plans. All users,
additionally, can participate in discussions through collaborative tools provided in the system.
The fourth group of technical advisory agencies can access ISM-DSS to quickly assess the
compliance of a proposed development against the recommendations of ISMP. Through the system,
analysis like finding out comparable areas in terms of development considerations that are covered
in ISMP can also be carried out.
State Economic Planning Unit (UPEN) has the coordinating role in the implementation of the ISMP
and hence will rightly assume a similar role for implementation of the ISM-DSS for management of
development along the States’ coast. DID will maintain the information immediately pertinent to
ISMP. Usage of the system will generally be provided to the registered users from government
agencies in a secured manner.
12.6.3 Functional Specification for ISM-DSS
Based on the possible usage of the DSS by the different group of users, the functionalities of the
DSS will focus on the applicability of ISM-DSS across the agencies with ISMP as the knowledge base.
The application will serve as a means to disseminate information about ISMP, assists in the use of
the information in reviewing a development application proposal, increases the accessibility of the
information through functions that are provided through GIS and database. Over time this will allow
accumulation of information that is captured through the usage of the application thus permitting the
build up of database for reference.
Eight modules are identified to be main components of the ISM-DSS (Figure 12.15). Other
components such as Information Portal and Database Management System are provided to
accommodate sharing of the information and management/storage of data respectively.

Chapter 12 FUTURE OUTLOOKS
___________________________________________________________________________________________
___________________________________________________________________________________________
12-22 March 2009
Figure 12.15 Functionality Modules in ISM-DSS
(1) Information Reference : Information reference will provide users the access to information
that is contained in the database related to ISMP. For selected users, this module will also provide access to summary of information related to development applications that have
been processed by DID; this is further discussed in Executive Information System below.
This module channels information that is to be disseminated and includes functions that
enable the users to perform analysis on the ISMP information, support query submission to the system, which will return results based on the queries. The security of the data and
application is also ensured. This module can also be linked to the information portal that would have supplementary information on coastal management or development related
information that could be published by the relevant agencies including UPEN, PTG and the local authorities.
(2) Receiving and Processing of Proposed Development Submission : Receiving and processing of development submission module includes electronic form and interface to upload softcopy
data. It also provides a facility to maintain, create, update, and delete data as well as serves as a central repository for all submissions that are to be included in the system.
Electronic Form allows data to be input and updated online. It facilitates validation of data against pre-defined information and library, importing and converting of data, and loading of
data into ISM-DSS. With this facility, fields that contain information that is invariable will only need to be filled once by users when they register the information into the e-forms for
the first time. Also included is the ability to support entries into forms and documents and “auto-assist” for codes in the fields (for example, repeat applicants will have all the relevant
information and codes pre-filled in the form). This module would also provide the ability to
do minimum validation check on the data to ensure completion of the needed information.
(3) Document Management: This module provides file management and indexing capability as well as tools to manage, organise, customise, and enhance content-driven Web site. It also
makes routine the usage of templates for standard documents and reports, creation of
contents for EIS, as well as the collection of information from responses in a proposed development reviewing process.
Supplementing the capability of a database, it provides the means to record all types of
business content and information including submission documents, images, and decision
outcome/advice and making them to be part of a centralised knowledge base. It also
includes tools to controlling the creation, deletion, access, and use of files.
Info
rma
tio
n P
ort
al
Database Management System
Geographical Information System
Document
Management
Conformance Management
Development
Approval Receiving and Processing
Executive
Information System
Decision Evaluation
Information Reference
Decision Management
Chapter 12 FUTURE OUTLOOKS
___________________________________________________________________________________________
___________________________________________________________________________________________
March 2009 12-23
(4) Geographical Information System : GIS will be used appropriately to serve as a graphical
representation of the results that provide decision-makers with information in the most
concise form. GIS capability will provide the interface, analysis, and data retrieval that are viewable through the Web. Also included is the capability to use the ISMP information in
GIS-ready format, which is accessible through the Web, with data set that resides locally on an agency’s machine (workstation). Through this function, an agency can use ISMP
information along with the data in his system as long as the data are in GIS format.
Recommendations and the associated advice that are reached in a reviewing process, which
can also be used as inputs for further decisions, will be stored in the database and can be linked to the relevant maps.
(5) Decision Management : Evaluation of an input or response that is given by a user will
determine the next sequence of action in the system (either to prompt for further input, to
lead the user to a piece of specific information, or to produce a report, for example). This functionality caters for the interactions between decision-makers and the various alternatives
that are available in the system before arriving at a decision outcome.
In the course of making a decision, the relevant information can be suggested by the system (based on the information that are available in the database), and when appropriate, input
from users will be further requested and captured in the database.
(6) Conformance Management : A user can perform the first level analysis of a proposed
development where the compliance against the recommendations of ISMP information can be checked. To be included in this module (which is a sub-module of the decision
management module (5)) is the checking of an application against the relevant management
strategy in ISMP; checking the submitted application against completion of information for further processing; and suggestion for auto-field completion of an electronic form (Web
form).
An initial checklist of the relevant criteria collected from information in ISMP could be compiled. Through time, the users in DID, during their responses while using the system,
will refine this information.
(7) Decision Evaluation : This module will include the analytical steps to be undertaken by the
users at DID when using the system. Forming a sub-module to decision management module (5), it provides access to the information in the database. It also links to GIS where
it is relevant to access GIS functionality.
This information database will form the central database, the input of which also includes the
intermediate decisions (advice, recommendation, comments, etc.) that are made during a reviewing process and in turn can be associated with maps as applicable.
(8) Executive Information System : This module is designed to provide information in an aggregate form (including graphs and maps with drill-down capability for details) so that
executive officers in the organisation can quickly scan it for summaries and trends to enable quick understanding of relevant situation in making the final decision related to a pending
application.
Also included in this module are tools for users in DID to manage the contents so that the
information can be easily published to a portal thus accessible by the executive officers.

Chapter 12 FUTURE OUTLOOKS
___________________________________________________________________________________________
___________________________________________________________________________________________
12-24 March 2009
12.6.4 Development Of Specific Participation Strategies /Partnership
Because of the extent of the coastal system and the comprehensive nature of the scope of work specified in a regional monitoring and assessment, the most effective means is by a concerted effort
of researchers/scientists in universities, preferably via collaborative work and research with practicing engineers in the government and private sectors. Figure 12.16 shows the various levels of
management in three dimensions that can be represented schematically in the form of a tri-parte partnership in a three-tier management level. A suggestion to set up a Coastal Hydroinformatic
Centre either within a University or government department would be a great stride ahead for a
strategic partnership amongst the key players of the country where coastal management is concerned.
Figure 12.16 Strategic Three-Tier Partnership
12.7 FORMULATION OF A COASTAL DEVELOPMENT CONTROL ACT
12.7.1 A Shoreline Management Act
A Draft of the Policy Statement for Shoreline Management Act for Peninsular Malaysia was completed
in 2006 pursuant to a Cabinet decision for DID to formulate a suitable law or by law to ensure all future developments in the coastal zone comply with the requirements of DID Guideline 1/1997 and
any existing Integrated Shoreline Management Plan in consultation with the Ministry of Housing and Local Government. The Draft Policy Statement reiterated that current legislations do not address
sufficiently or provide adequate regulation on the management of development and activities along
the expanse of the shoreline. The recommendation of the Draft Policy Statement are directed towards reinforcing the powers of existing regulations related to various activities along the shoreline
including construction of structures; dumping of effluent, sewage and sullage into the sea; encroachment into conservation areas; public access; building set-backs; fishing grounds; protection
of historical features; control of land clearing; loss of archaeologically important areas; and loss of
conservation areas.
For the purpose of shoreline management, the shoreline is taken as the zone of 3 nautical miles seaward and one km landward of the Highest Astronomical Tide Contour or including up to the
intertidal contour whichever is further. The Draft Policy Statement and the Shoreline Management
Act are still in draft term.
THE 3-TIER PARTNERSHIP
Decision
Making
Data Assimilation
and Communication
Information Database
Policy-makers,
Politicians, planners,
engineers
Engineers, Modellers,
scientists,
Methematicians, etc.
Data managers,
System analysts,
Surveyors, etc.
Scenario
information
Interactive models,
Simulation models
Measurement
data
Functional
Management Level

Chapter 12 FUTURE OUTLOOKS
___________________________________________________________________________________________
___________________________________________________________________________________________
March 2009 12-25
REFERENCES
TOPIC ON ECOSYSTEM RESTORATION
[1] Hadibah Ismail (1999). Managing Coastal Erosion the Environment-Friendly Way. Proceedings, International Symposium and Exposition on Coastal Environment and Management (ISCEM ’99).
Sheraton Imperial Kuala Lumpur, 13 – 15 October.
[2] Hadibah Ismail (2003). Value-Added Shore Protection Structures for Enhancement of the Marine Ecosystem Services. Proceedings, Technical Seminar on Shoreline Management, Kota
Kinabalu, Sabah,18 – 19 August.
[3] Hadibah Ismail (2004). Innovative Environment-Friendly Coastal Restoration Techniques for Enhancement of Eco-tourism Potential in Coastal Areas. Proceedings, Seminar on Coastal Resources and Tourism, Bt. Merah Laketown Resort, Perak, 20 – 21 December.
[4] Hadibah Ismail (2005), “Designing Engineered Marine Ecosystems for Shore Protection against Future Tsunami Wave Attack – As a reconstruction strategy to strengthen coastal protection infrastructure”, Proceedings, International Hydrography and Oceanography Conference and
Exhibition (IHOCE’05), 5 – 7 July 2005, PWTC Kuala Lumpur.
[5] Hadibah Ismail, Eldina Fatimah and Ahmad Khairi Abdul Wahab (2005), “Wave Energy Dissipation over Pseudo Mangrove Roots”, Proceedings, International Conference on Innovations and Technologies in Oceanography for Sustainable Development (ITOS’05), 26 – 29 September 2005,
Kuala Lumpur.
[6] Kamphuis, J. William (2000), “Introduction to Coastal Engineering and Management”, in Advanced Series on Ocean Engineering – Volume 16, World Scientific.
[7] Moberg, F. and Ronnback, P., (2003). Ecosystem services of the tropical seascape: interactions, substitutions and restoration, Ocean and Coastal Management 46, pp 27 – 46, Elsevier.
[8] NOAA Coastal Services Centre, Coastal Ecosystem Restoration, website:
http://www.csc.noaa.gov/coastal/implementation/implementation.htm
[9] Saw Hin Seang (2000), Erosion Control Plan for the Malaysian Coastline, Proceedings,
Technical Seminar on Shoreline Management, 18 – 19 September 2000, Kuching, Sarawak.
[10] USACE (1984), Shore Protection Manual, Waterways Experiment Station, Vicksburgh, USA.
[11] USACE (2003), Coastal Engineering Manual, Part III: Engineering and Design, Coastal and Hydraulic Laboratory, Waterways Experiment Station, Vicksburgh, USA
(http://bigfoot.cerc.wes.army.mil/c133.html)
[12] U.S Army Corps of Engineers (1997). ER 1110-2-1407 Hydraulic Design for Coastal Shore ProtectionProjects. Washington D.C.
[13] USACE (1984), Shore Protection Manual, Waterways Experiment Station, Vicksburgh, USA.
[14] USACE (2003), Coastal Engineering Manual, Part III: Engineering and Design, Coastal and Hydraulic Laboratory, Waterways Experiment Station, Vicksburgh, USA
(http://bigfoot.cerc.wes.army.mil/c133.html)
[15] Yozzo, D.J., Davis, J.E., and Cagney, P., (2001). Coastal Engineering for Environmental Enhancement, Technical Report No. EM 1110-2-1100, Coastal Engineering Manual, USACE.
[16] Black, Kerry and Mead, Shaw. Wave Rotation for Coastal Protection, in Multi-Purpose Reefs
for Cromer, http://cromerreefs.bravehost.com/waverotators.html.
[17] Douglass, Scott L. and Judy Stout., Stabilisation of eroding shorelines in estuarine wave climates with constructed fringe wetlands incorporating offshore breakwaters, Report submitted to
SAC, May 2002.
[18] Eldina Fatimah, Hadibah Ismail and Ahmad Khairi Abdul Wahab. Preliminary Investigations on Wave-Structure Interactions of an Artificial Mangrove Root System (ArMS). Proceedings, Seventh Annual IEM Water Resources Colloquium, 18 June 2005.

Chapter 12 FUTURE OUTLOOKS
___________________________________________________________________________________________
___________________________________________________________________________________________
12-26 March 2009
[19] Fogarty, David. Tsunami-Hit Nations Look to Save Mangroves. Reuters, 17 January
2005.Menashe, Elliot. Bio-structural Erosion Control: Incorporating vegetation into Engineering Designs to protect Puget Sound Shorelines. Puget Sound Research Conference, 13 February 2001.
[20] Hadibah Ismail. Innovative Environment-Friendly Coastal Restoration Techniques for Enhancement of Eco-Tourism Potential in Coastal Areas. Proceedings, Seminar on Coastal Resources and Tourism, Bt. Merah Laketown Resort, Perak, 20 – 21 December 2004.
[21] Hadibah Ismail, “Value-Added Shore Protection Structures for the Enhancement of the Marine Ecosystem Services”, Keynote Address in the Proceedings, Technical Seminar on Shoreline
Management, 18 – 19 Aug 2003.
[22] Moberg, F. and Ronnback, P., Ecosystem services of the tropical seascape: interactions, substitutions and restoration, Ocean and Coastal Management 46, pp 27 – 46, Elsevier (2003).
[23] Patterson, Tim et al. Best Management Practices for Soft Engineering of Shorelines. Binational Conference sponsored by the Greater Detroit American Heritage River Initiative and
Partners. http://www.tellusnews.com./ahr/report_chapter3.html.
[24] Yap, Helen T., The Case for Restoration of tropical coastal ecosystems, Ocean and Coastal Management 43, pp 841 – 851, Elsevier (2000).
[25] Campbell, M. L., and Paling, E.I., Evaluating vegetative transplant success in Posidonia australis: a field trial with habitat enhancement, Marine Pollution Bulletin, in press, (2003).
[26] Seabed Scour Control Systems Limited website: http://www.scourcontrol.co.uk/email.html
[27] Grootenboer, D. Artificial Seaweed: Coastal and sub-marine pipeline protection studies with
stretched polypropylene foam strands – Special Series Report, Dtsr.0002.72, Shell Research N. V.
(1972).
[28] Tee Yee Sin, Hydraulic Investigations of an Artificial Seagrass for Underwater Erosion
Control. M. Eng. Thesis, Universiti Teknologi Malaysia (1999).
[29] Atherley. K.A., Seascape Synthetic Seaweed: A Failed Solution to Erosion in Barbados, Coastal Zone 89.
[30] Yozzo, D.J., Davis, J.E., and Cagney, P., Coastal Engineering for Environmental Enhancement, Technical Report No. EM 1110-2-1100, Coastal Engineering Manual (2001).
[31] Comoss, E.J., Kelly, D.A., and Leslie, H. Z., Innovative erosion control involving the beneficial use of dredge material, indigenous vegetation and landscaping along the Lake Erie Shoreline. Ecological Engineering 19, (2002)
[32] Widjo, Kongko, Sasamoto, Makoto, and Sakai, S. Tsunami Energy Dissipation in Mangrove Forest. Untitled document.
[33] Turner,I.L., et al (2000). Predicted and observed coastline changes at the Gold Coast
artificial reef. International Coastal Engineering Conference, ASCE, Sydney, p. 1836 – 1847.
[34] Turner,I.L., et al (2001). The application of video-imaging to quantify beach response to
sand nourishment and construction of an artificial reef. 15th Australasian Coastal and Ocean Engineering Conference, IED, Gold Coast, p. 55 – 60.
[35] Video Metric SystemsTM. Argus Beach Monitoring Stations (ABMS). NorthWest Research
Associates Inc.htm
[36] http://waterforecast.dhi.dk/defaultUK.asp
[37] Hadibah Ismail, Faridah Jaffar Sidek, and Ahmad Khairi Abdul Wahab (1999). Effective Coastal Management Strategies in the Era of Hydroinformatics – A UTM Focus, Proceedings International Conference on the International Oceanographic Data & Information Exchange in the
Western Pacific, Langkawi Island, November.

Chapter 12 FUTURE OUTLOOKS
___________________________________________________________________________________________
___________________________________________________________________________________________
March 2009 12-27
[38] Hadibah Ismail (2001). Approaches to Formulating Regional Assessment and Monitoring of
Coastal Processes due to Mammoth-Scale Reclamation Projects. Proceedings, National Conference
on Hydraulics, Hydrology and Sustainable Water Resources Management – Advances in Research and Management. Bangi, 24 – 25 September 2001.
[39] Muhammad Akhir Othman and Iwan Tan (1999). Coastal Monitoring: A Shoreline Management Tool for the 21st Century. Proceedings, International Symposium and Exposition on Coastal Environment and Management: Challenges in the New Millenium, Kuala Lumpur, October
1999.
[40] National Hydraulic Research Institute of Malaysia (NAHRIM) and Coastal & Offshore
Engineering Institute (COEI) of UTM, “Macro-Environmental Impact Assessment for the Kedah Coastal Reclamation Vols. I and II”, Final Report submitted to UPEN Kedah, October 1997.
[41] KTA Tenaga Sdn Bhd, Centre for Environmental Technologies (CETEC) and NAHRIM, “Macro Environmental Impact Assessment for Coastal Land Reclamation Projects in Melaka”, Final Report
submitted to the State Government of Melaka, August 1998.
[42] Tom Foster (1999). West Coast of Sabah Shoreline Management Plan. Proceedings, International Symposium and Exposition on Coastal Environment and Management: Challenges in
the New Millenium, Kuala Lumpur, October.
[43] Institution of Civil Engineers (1989). Coastal Management. Thomas Telford, London, May
1989.
[44] Department of Irrigation and Drainage Malaysia (2000). General Guidelines for Coastal Engineering Hydraulic Studies Using Computer Models, Revised Edition.

Chapter 12 FUTURE OUTLOOKS
___________________________________________________________________________________________
___________________________________________________________________________________________
12-28 March 2009
(This page is deliberately left blank)