Volume 2 Report - | dcrb
143
Comprehensive Annual Financial Report FOR THE FISCAL YEAR ENDED SEPTEMBER 30, 2006 Volume 2
Transcript of Volume 2 Report - | dcrb
ComprehensiveAnnual FinancialReport
F O R T H E F I S C A L Y E A R E N D E D S E P T E M B E R 3 0 , 2 0 0 6
Volume 2D
istrict ofC
olum
bia R
etiremen
t Board
Com
preh
ensive A
nn
ual Fin
ancial R
eport for th
e Fiscal Year En
ded
Septem
ber 30,
2006 V
olum
e 2
District of Columbia Retirement Board900 7th Street, NWSecond FloorWashington, DC 20001
DCRBAnnReptCov06TealVOL2 5/19/08 4:05 PM Page 1

Comprehensive Annual Financial Report
1
for the fiscal year ended September 30, 2006
Volume 2
District of Columbia Retirement Board
900 7th Street, NW, 2nd Floor
Washington, DC 20001
(202)343-3200
(202) 566-5000 (fax)
www.dcrb.dc.gov

2

Volume II
Table 1: Names and Addresses of the Board of Trustees .........................................................................................5
State Street Bank Consolidated Financial Statement .......................................................................................7
Consolidated Statement of Income ..........................................................................................................................7
Consolidated Statement of Condition......................................................................................................................8
Consolidated Statement of Changes in Shareholders’ Equity .................................................................................9
Consolidated Statement of Cashflows ....................................................................................................................10
Notes to Consolidated Financial Statement ...........................................................................................................11
Schedule of Reportable Transactions ..............................................................................................................57
District of Columbia Teachers’ Retirement Fund .................................................................................................57
District of Columbia Police Officers’ and Firefighters’ Retirement Fund ...........................................................61
Schedule of Transactions with Parties of Interest ...........................................................................................65
Schedule of Trustee Activities Sponsored by Service Providers ....................................................................70
Fund Return Data ...............................................................................................................................................71
Executive Summary:
Total Fund Asset Class Performance .....................................................................................................................71
Managers’ Performance ...........................................................................................................................................71
Total Fund Asset Allocation and Structure Analysis..............................................................................................72
Total Fund and Asset Class Performance Highlights .............................................................................................73
Manager’s Performance Highlights.........................................................................................................................74
Total Fund:
Asset Allocation Analysis .........................................................................................................................................76
Return Attribution Analysis ....................................................................................................................................76
Performance Versus Benchmark .............................................................................................................................77
Rolling Period Returns Relative to Total Fund Benchmark ..................................................................................77
Financial Efficiency Analysis ...................................................................................................................................78
Risk Reward Analysis ...............................................................................................................................................78
Peer Group Performance Comparison ...................................................................................................................79
3
Table of Contents
D C R B C O M P R E H E N S I V E A N N U A L F I N A N C I A L R E P O R T

Domestic Equity Segment:
Performance Versus Benchmark .............................................................................................................................80
Return Attribution Analysis ....................................................................................................................................80
Risk/Reward Analysis ...............................................................................................................................................81
Peer Group Performance Comparison ..................................................................................................................81
International Equity Segment :
Performance Versus Benchmark ............................................................................................................................82
Risk/Reward Analysis ..............................................................................................................................................82
Peer Group Performance Comparison ..................................................................................................................83
Fixed Income Segment:
Performance Versus Benchmark ............................................................................................................................83
Risk/Reward Analysis ..............................................................................................................................................84
Peer Group Performance Comparison ...................................................................................................................84
Annual Actuarial Valuation................................................................................................................................85
Actuarial Certification........................................................................................................................................................85
Introduction........................................................................................................................................................................86
Section 1: Summary of Fund Provisions, Member Statistics, and Actuarial Assumptions...........................91
1.1: Brief Outline of Fund Provisions ..............................................................................................................................91
District of Columbia Retirement Program for Teachers .........................................................................................91
Retirement Program for District of Columbia Police Officers and Fire Fighters ..................................................93
1.2: Participant Data as of October 1, 2006 .....................................................................................................................96
1.3: Actuarial Methods and Assumptions ......................................................................................................................124
Section 2: Asset Information ...........................................................................................................................128
2.1: Current Value of District Assets as of October 1, 2006..........................................................................................128
2.2: Actuarial Value of District Assets as of October 1, 2006........................................................................................129
Section 3: Actuarial Computations .................................................................................................................130
3.1: Computation of Fiscal Year 2008 District Payment ...............................................................................................130
3.2: Computation of Gain/Loss from Prior Valuation ..................................................................................................131
Teachers’ Retirement Fund Gain/Loss ....................................................................................................................132
Police Officers Retirement Fund Gain/Loss ...........................................................................................................132
Fire Fighters’ Retirement Fund Gain/Loss..............................................................................................................133
3.3: Summary of Principal Valuation Results ................................................................................................................134
Teachers Retirement Fund.......................................................................................................................................135
Police Officers and Fire Fighters Retirement Fund (Combined) ..........................................................................136
Police Officers Retirement Fund .............................................................................................................................137
Fire Fighters Retirement Fund ................................................................................................................................138
3.4: Accrued Liabilities under the Entry Age Normal Method.....................................................................................139
3.5: §1-907.02(c) Adjustment to the Fiscal Year 2008 District Payment......................................................................140
Section 4: Disclosure Information ..................................................................................................................141
4.1: Schedules of Funding Status and Employer Contributions Required Under GASB Statement No. 25..............141
4
DCRB Comprehensive Annual Financial Report Volume II Table of Contents

5
Table 1: Names and Addresses of the Board of Trustees
Lyle M. Blanchard
Greenstein Delorme & Luchs
1620 L Street, NW, Suite 900
Washington, DC 20036
Barbara Davis Blum
900 7th Street, NW, Second Floor,
Washington, DC 20001
Mary A. Collins
Washington Teachers Union
1717 K Street, NW, Suite 902
Washington, DC 20036
Shireen L. Dodson
900 7th Street, NW, Second Floor,
Washington, DC 20001
Brian K. Lee
1923 Vermont Avenue, NW
Washington, DC 20001
Lasana Mack
Office of Finance and Treasury
1275 K Street, NW
Suite 6000
Washington, D.C. 20005
Judith C. Marcus
900 7th Street, NW, Second Floor,
Washington, DC 20001
Joan Parrot-Fonseca
JPF & Associates
1729 Upshur Street, NW
Washington, DC 20011
Darrick O. Ross
Metropolitan Police Dept.
1700 Rhode Island Ave., NE
Washington, DC 20018-1844
William Simons
900 7th Street, NW, Second Floor,
Washington, DC 20001
George R. Suter
900 7th Street, NW, Second Floor,
Washington, DC 20001
Thomas N. Tippett
900 7th Street, NW, Second Floor,
Washington, DC 20001
Michael J. Warren
900 7th Street, NW, Second Floor,
Washington, DC 20001
DCRB Comprehensive Annual Financial Report Volume II Names and Addresses of the Board of Trustees

6

DCRB Comprehensive Annual Financial Report Volume II Consolidated Statement of Income
7
State Street Bank Consolidated Financial Statements
Consolidated Statement of IncomeYears ended December 31, 2006 2005 2004(Dollars in millions, except per share amounts)
Fee Revenue:Servicing fees $ 2,723 $ 2,474 $ 2,263Management fees 943 751 623Trading services 862 694 595Securities finance 386 330 259Processing fees and other 272 302 308_______ _______ _______Total fee revenue 5,186 4,551 4,048Net Interest Revenue:Interest revenue 4,324 2,930 1,787Interest expense 3,214 2,023 928_______ _______ _______Net interest revenue 1,110 907 859Provision for loan losses — — (18)_______ _______ _______Net interest revenue after provision for loan losses 1,110 907 877Gains on sales of available-for-sale investment securities, net 15 (1 ) 26Gain on sale of Private Asset Management business — 16 —_______ _______ _______Total revenue 6,311 5,473 4,951Operating Expenses:Salaries and employee benefits 2,652 2,231 1,957Information systems and communications 501 486 527Transaction processing services 496 449 398Occupancy 518 484 514_______ _______ _______Total operating expenses 4,540 4,041 3,759_______ _______ _______Income from continuing operations before income tax expense 1,771 1,432 1,192Income tax expense from continuing operations 675 487 394_______ _______ _______Income from continuing operations 1,096 945 798Income (Loss) from discontinued operations 16 (165 ) —Income tax expense (benefit) from discontinued operations 6 (58 ) —_______ _______ _______Net income (loss) from discontinued operations 10 (107 ) —_______ _______ _______Net income $ 1,106 $ 838 $ 798_______ _______ ______________ _______ _______Earnings Per Share From Continuing Operations:
Basic $ 3.31 $ 2.86 $ 2.38Diluted 3.26 2.82 2.35
Income (Loss) Per Share From Discontinued Operations:Basic $ .03 $ (.33 ) $ —Diluted 03 (.32 ) —
Earnings Per Share:Basic 3.34 $ 2.53 $ 2.38Diluted 3.29 2.50 2.35
Average Shares Outstanding (in thousands):Basic 331,350 330,361 334,606Diluted 335,732 334,636 339,605
The accompanying notes are an integral part of these consolidated financial statements.
DCRB Comprehensive Annual Financial Report Volume II Consolidated Statement of Condition
8
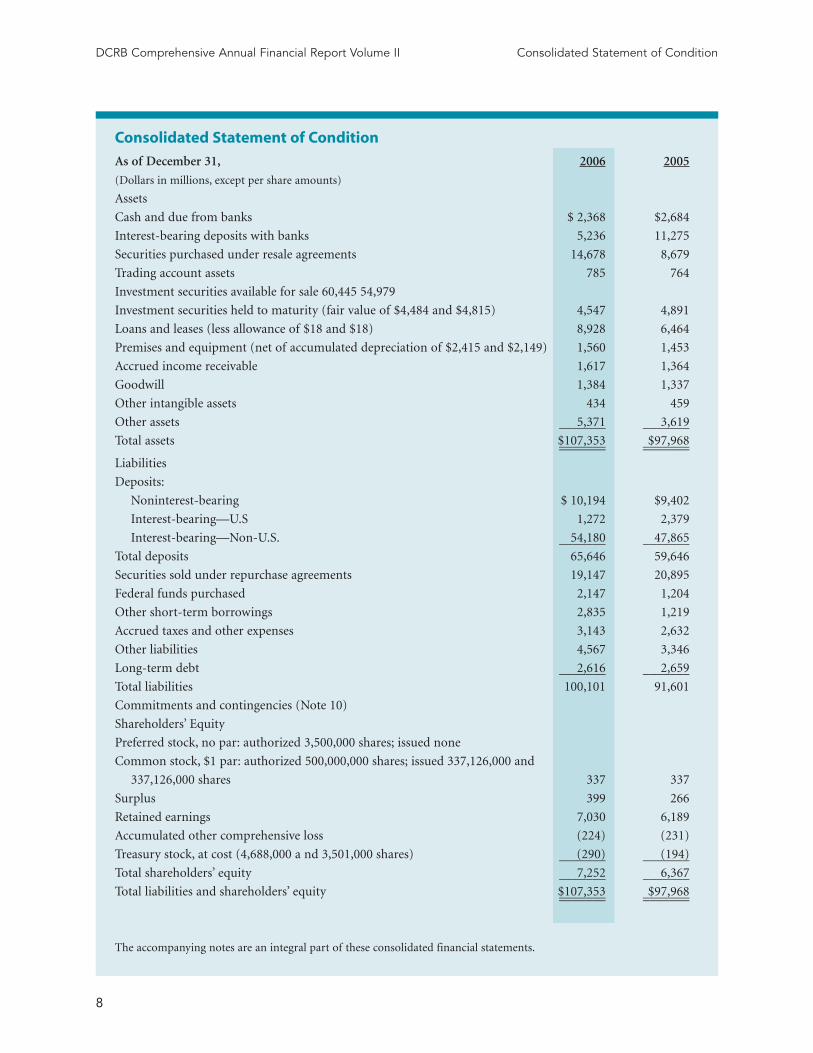
Consolidated Statement of Condition
As of December 31, 2006 2005
(Dollars in millions, except per share amounts)
Assets
Cash and due from banks $ 2,368 $2,684
Interest-bearing deposits with banks 5,236 11,275
Securities purchased under resale agreements 14,678 8,679
Trading account assets 785 764
Investment securities available for sale 60,445 54,979
Investment securities held to maturity (fair value of $4,484 and $4,815) 4,547 4,891
Loans and leases (less allowance of $18 and $18) 8,928 6,464
Premises and equipment (net of accumulated depreciation of $2,415 and $2,149) 1,560 1,453
Accrued income receivable 1,617 1,364
Goodwill 1,384 1,337
Other intangible assets 434 459
Other assets 5,371 3,619_______ _______Total assets $107,353 $97,968_______ ______________ _______
Liabilities
Deposits:
Noninterest-bearing $ 10,194 $9,402
Interest-bearing—U.S 1,272 2,379
Interest-bearing—Non-U.S. 54,180 47,865_______ _______Total deposits 65,646 59,646
Securities sold under repurchase agreements 19,147 20,895
Federal funds purchased 2,147 1,204
Other short-term borrowings 2,835 1,219
Accrued taxes and other expenses 3,143 2,632
Other liabilities 4,567 3,346
Long-term debt 2,616 2,659_______ _______Total liabilities 100,101 91,601
Commitments and contingencies (Note 10)
Shareholders’ Equity
Preferred stock, no par: authorized 3,500,000 shares; issued none
Common stock, $1 par: authorized 500,000,000 shares; issued 337,126,000 and
337,126,000 shares 337 337
Surplus 399 266
Retained earnings 7,030 6,189
Accumulated other comprehensive loss (224) (231)
Treasury stock, at cost (4,688,000 a nd 3,501,000 shares) (290) (194)_______ _______Total shareholders’ equity 7,252 6,367_______ _______Total liabilities and shareholders’ equity $107,353 $97,968_______ ______________ _______
The accompanying notes are an integral part of these consolidated financial statements.

Consolidated Statement of Changes in Shareholders’ Equity(Dollars in millions, except per share amounts, shares in thousands)
Accumulated COMMON Other TREASURY
STOCK Retained Comprehensive STOCKShares Amount Surplus Earnings (Loss) Income Shares Amount Total
Balance at December 31, 2003 337,132 $ 337 $ 329 $ 5,007 $ 192 2,658 $ (118 ) $ 5,747Comprehensive Income:Net income 798 798Change in net unrealized gains/losses on available-for-sale
securities, net of related taxes of $(91) andreclassification adjustment (130) (130)
Change in minimum pension liability, net of related taxes of $(19) (26) (26)Foreign currency translation, net of related taxes of $17 85 85Change in unrealized gains/losses on cash flow hedges, net
of related taxes of $(1) (3) (3)Change in unrealized gains/losses on hedges of netinvestments in non-U.S. subsidiaries, net of related taxes of $(14) (26) (26)_______ _______ _______ _______ _______Total comprehensive income 798 (100) 698Cash dividends declared—$.64 per share (215) (215)Common stock acquired 4,098 (178) (178)Impact of fixing the variable-share settlement rate of SPACES (26) (26)Common Stock Issued Pursuant to:Stock awards and options exercised, including tax benefit
of $20 (6) (10) (3,128) 141 131Debt conversion (4) (104) 4 —Other (43) 2 2Balance at December 31, 2004 337,126 337 289 5,590 92 3,481 (149 ) 6,159_______ _______ _______ _______ _______ _______ _______ _______Comprehensive Income:Net income 838 838Change in net unrealized gains/losses on available-for-sale
securities, net of related taxes of $(150) andreclassification adjustment (229) (229)
Foreign currency translation, net of related taxes of $(54) (140) (140)Change in unrealized gains/losses on hedges of netinvestments in non-U.S. subsidiaries, net of related taxes of $20 37 37Change in unrealized gains/losses on cash flow hedges, netof related taxes of $6 9 9_______ _______ _______ _______ _______Total comprehensive income 838 (323) 515Cash dividends declared—$.72 per share (239) (239)Common stock acquired 13,130 (664) (664)Common Stock Issued Pursuant to:SPACES (73) (8,712) 418 345Stock awards and options exercised, including tax benefit
of $20 50 (4,319) 197 247Other (79) 4 4Balance at December 31, 2005 337,126 337 266 6,189 (231) 3,501 (194) 6,367_______ _______ _______ _______ _______ _______ _______ _______Comprehensive Income:Net income 1,106 1,106Change in net unrealized gains/losses on available-for-salesecurities, net of related taxes of $40 and reclassification
adjustment 58 58Foreign currency translation, net of related taxes of $56 124 124Change in unrealized gains/losses on hedges of netinvestments in non-U.S. subsidiaries, net of related taxes of $(10) (18) (18)Change in minimum pension liability, net of related taxes
of $(107) (160) (160)Change in unrealized gains/losses on cash flow hedges, net
of related taxes of $2 3 3_______ _______ _______ _______ _______Total comprehensive income 1,106 7 1,113Cash dividends declared—$.80 per share (265) (265)Common stock acquired 5,782 (368) (368)Common stock received under COVERS contracts 30 1,199 (26) 4Common Stock Issued Pursuant to:Stock awards and options exercised, including tax benefit of $43 103 (5,782) 300 403Other (12) (2) (2)_______ _______ _______ _______ _______ _______ _______ _______Balance at December 31, 2006 337,126 $ 337 $ 399 $ 7,030 $ (224) 4,688 $ (290) $ 7,252_______ _______ _______ _______ _______ _______ _______ ______________ _______ _______ _______ _______ _______ _______ _______
DCRB Comprehensive Annual Financial Report Volume II Statement of Changes in Shareholders’ Equity
9
DCRB Comprehensive Annual Financial Report Volume II Consolidated Statement of Cash Flows
10
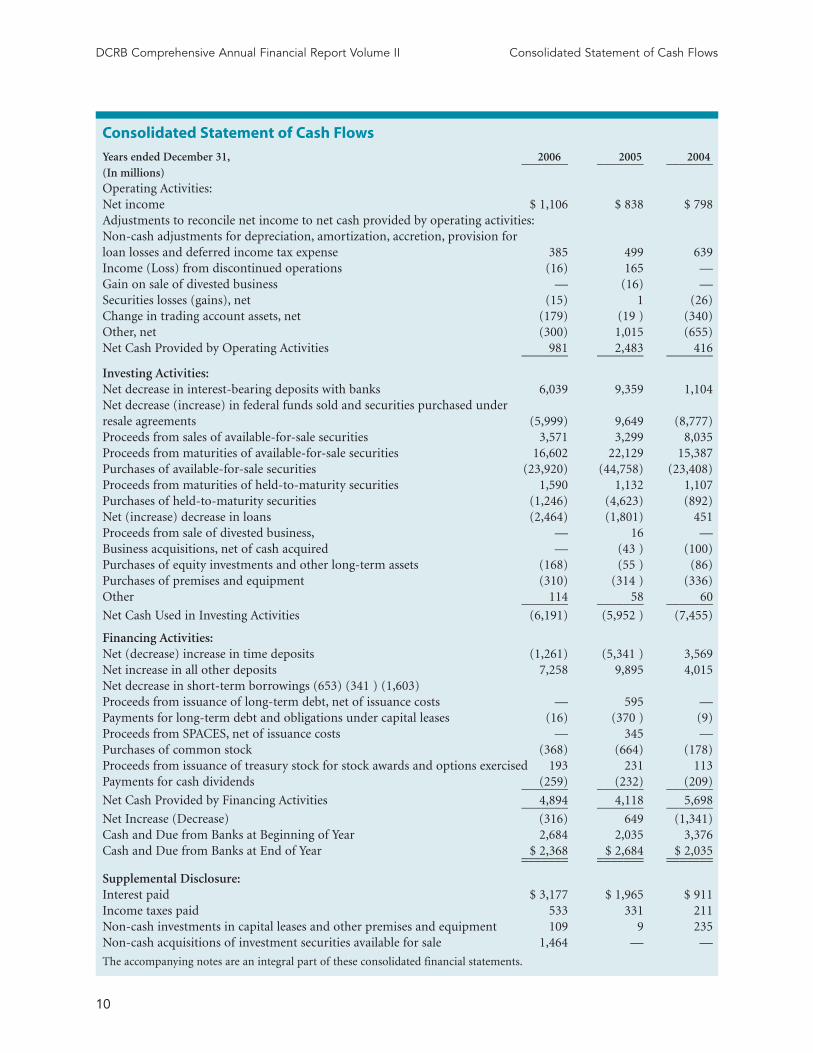
Consolidated Statement of Cash Flows
Years ended December 31, 2006 2005 2004_______ _______ _______(In millions)Operating Activities:Net income $ 1,106 $ 838 $ 798Adjustments to reconcile net income to net cash provided by operating activities:Non-cash adjustments for depreciation, amortization, accretion, provision forloan losses and deferred income tax expense 385 499 639Income (Loss) from discontinued operations (16) 165 —Gain on sale of divested business — (16) —Securities losses (gains), net (15) 1 (26)Change in trading account assets, net (179) (19 ) (340)Other, net (300) 1,015 (655)Net Cash Provided by Operating Activities 981 2,483 416_______ _______ _______
Investing Activities:Net decrease in interest-bearing deposits with banks 6,039 9,359 1,104Net decrease (increase) in federal funds sold and securities purchased underresale agreements (5,999) 9,649 (8,777)Proceeds from sales of available-for-sale securities 3,571 3,299 8,035Proceeds from maturities of available-for-sale securities 16,602 22,129 15,387Purchases of available-for-sale securities (23,920) (44,758) (23,408)Proceeds from maturities of held-to-maturity securities 1,590 1,132 1,107Purchases of held-to-maturity securities (1,246) (4,623) (892)Net (increase) decrease in loans (2,464) (1,801) 451Proceeds from sale of divested business, — 16 —Business acquisitions, net of cash acquired — (43 ) (100)Purchases of equity investments and other long-term assets (168) (55 ) (86)Purchases of premises and equipment (310) (314 ) (336)Other 114 58 60_______ _______ _______Net Cash Used in Investing Activities (6,191) (5,952 ) (7,455)
Financing Activities:Net (decrease) increase in time deposits (1,261) (5,341 ) 3,569Net increase in all other deposits 7,258 9,895 4,015Net decrease in short-term borrowings (653) (341 ) (1,603)Proceeds from issuance of long-term debt, net of issuance costs — 595 —Payments for long-term debt and obligations under capital leases (16) (370 ) (9)Proceeds from SPACES, net of issuance costs — 345 —Purchases of common stock (368) (664) (178)Proceeds from issuance of treasury stock for stock awards and options exercised 193 231 113Payments for cash dividends (259) (232) (209)_______ _______ _______Net Cash Provided by Financing Activities 4,894 4,118 5,698_______ _______ _______Net Increase (Decrease) (316) 649 (1,341)Cash and Due from Banks at Beginning of Year 2,684 2,035 3,376Cash and Due from Banks at End of Year $ 2,368 $ 2,684 $ 2,035_______ _______ ______________ _______ _______
Supplemental Disclosure:Interest paid $ 3,177 $ 1,965 $ 911Income taxes paid 533 331 211Non-cash investments in capital leases and other premises and equipment 109 9 235Non-cash acquisitions of investment securities available for sale 1,464 — —
The accompanying notes are an integral part of these consolidated financial statements.
Note 1. Summary of SignificantAccounting Policies
The accounting and financial reporting policies of State
Street Corporation conform to accounting principles
generally accepted in the United States of America, or
“GAAP.” Unless otherwise indicated or unless the con-
text requires otherwise, all references in these notes to
consolidated financial statements to “State Street,” “we,”
“us,” “our” or similar references mean State Street
Corporation and its subsidiaries on a consolidated
basis. The parent company is a financial holding com-
pany headquartered in Boston, Massachusetts. We
report two lines of business:
• Investment Servicing provides services for U.S.
mutual funds and collective investment funds, cor-
porate and public retirement plans, insurance com-
panies, foundations, endowments and other invest-
ment pools worldwide. Products include custody,
product-and participant-level accounting, daily
pricing and administration; master trust and mas-
ter custody; recordkeeping; foreign exchange, bro-
kerage and other trading services; securities
finance; deposit and short-term investment facili-
ties; loans and lease financing; investment manager
and hedge fund manager operations outsourcing;
and performance, risk and compliance analytics to
support institutional investors.
• Investment Management offers a broad array of
services for managing financial assets, including
investment management and investment research
services, primarily for institutional investors world-
wide. These services include passive and active U.S.
and non-U.S. equity and fixed income strategies,
and other related services, such as securities finance.
The preparation of consolidated financial statements
requires management to make estimates and assump-
tions in the application of certain of our accounting
policies that materially affect the reported amounts of
assets, liabilities, revenue and expenses. As a result of
unanticipated events or circumstances, actual results
could differ from those estimates. The following is a
summary of our significant accounting policies.
Basis of Presentation:
Our consolidated financial statements include the
accounts of the parent company and its majority-owned
subsidiaries, including its principal banking subsidiary,
State Street Bank and Trust Company, or “State Street
Bank,” as well as special purpose entities considered to
be variable interest entities for which State Street is the
primary beneficiary under existing accounting stan-
dards. All material inter-company transactions and bal-
ances have been eliminated. Certain previously reported
amounts have been reclassified to conform to current
year presentation.
We consolidate subsidiaries in which we hold a
majority of the voting rights or exercise control.
Investments in unconsolidated subsidiaries, recorded in
other assets, are generally accounted for using the equi-
ty method of accounting if we have the ability to exer-
cise significant influence over the operations of the
investee. For investments accounted for under the equi-
ty method, our share of income or loss is recorded in
processing fees and other revenue. Investments not
meeting the criteria for equity method treatment are
accounted for using the cost method of accounting.
Foreign Currency Translation:
The assets and liabilities of our operations with func-
tional currencies other than the U.S. dollar are translat-
ed at month-end exchange rates, and revenue and
expenses are translated at rates that approximate aver-
age monthly exchange rates. Gains or losses from the
translation of the net assets of subsidiaries with func-
tional currencies other than the U.S. dollar, net of relat-
ed taxes, are recorded in accumulated other comprehen-
sive income.
Cash and Cash Equivalents:
For purposes of the consolidated statement of cash
flows, cash equivalents have been defined as cash and
due from banks.
DCRB Comprehensive Annual Financial Report Volume II Notes to Consolidated Financial Statements
11
Notes to Consolidated Financial Statements

Securities Purchased Under Resale Agreements
and Securities Sold Under Repurchase
Agreements:
U.S. Treasury and federal agency securities, or “U.S. gov-
ernment securities,” purchased under resale agreements
or sold under repurchase agreements are treated as col-
lateralized financing transactions, and are recorded in
the consolidated statement of condition at the amounts
at which the securities will be subsequently resold or
repurchased, plus accrued interest. Our policy is to take
possession or control of securities underlying resale
agreements, allowing borrowers the right of collateral
substitution and/or short-notice termination. We reval-
ue these securities daily to determine if additional col-
lateral is necessary from the borrower to protect us
against credit exposure. We can use these securities as
collateral for repurchase agreements. For securities sold
under repurchase agreements collateralized by our U.S.
government securities portfolio, the dollar value of the
U.S. government securities remains in investment secu-
rities in our consolidated statement of condition. Where
a master netting agreement exists or both parties are
members of a common clearing organization, resale and
repurchase agreements with the same counterparty or
clearing house and maturity date are reported on a net
basis.
Investment Securities Available for Sale
and Held to Maturity:
Our investment securities portfolio principally includes
debt securities purchased in connection with our asset
and liability management activities. These securities are
classified at the time of purchase, based on manage-
ment’s intentions, as available for sale or held to matu-
rity. Securities available for sale are those that manage-
ment intends to hold for an indefinite period of time,
including securities used as part of our asset and liabil-
ity management strategy that may be sold in response to
changes in interest rates, prepayment risk, liquidity
needs or other similar factors. Debt and marketable
equity securities classified as available for sale are
reported at fair value, and after-tax net unrealized gains
and losses are reported in accumulated other compre-
hensive income, a component of shareholders’ equity.
Gains or losses on sales of available-for-sale securities
are computed using the specific identification method.
Securities held to maturity are debt securities that man-
agement has the positive intent and ability to hold to
maturity. Securities classified as held to maturity are
reported at cost, adjusted for amortization of premiums
and accretion of discounts.
Management reviews the fair value of the portfolio at
least quarterly, and evaluates individual securities for
declines in fair value that may be other than temporary,
considering factors such as current and expected future
interest rates, credit ratings, dividend payments, the
financial health of the issuer and other pertinent infor-
mation, including current developments with respect to
the issuer, as well as the duration of the decline and
management’s intent and ability to hold the security. If
declines are deemed other than temporary, an impair-
ment loss is recognized and the amortized cost basis of
the investment security is written down to its current
fair value, which becomes the new cost basis. Other-
than-temporary unrealized losses on available-for-sale
and held-to-maturity securities, if any, are recorded as a
reduction of processing fees and other revenue.
Loans and Lease Financing:
Loans are generally reported at the principal amount
outstanding, net of the allowance for loan losses,
unearned income, and any net unamortized deferred
loan origination fees. Interest revenue is recognized
using the interest method or on a basis approximating a
level rate of return over the term of the loan. Fees
received for providing loan commitments and letters of
credit that we anticipate will result in loans typically are
deferred and amortized to interest revenue over the life
of the related loan, beginning with the initial borrow-
ing. Fees on commitments and letters of credit are
amortized to processing fees and other revenue over the
commitment period when funding is not known or
expected.
Loans are placed on non-accrual status when they
become 60 days past due as to either principal or inter-
est, or earlier when, in the opinion of management, full
collection of principal or interest is not probable. Loans
60 days past due, but considered both well secured and
in the process of collection, are treated as exceptions
and may be exempted from non-accrual status. When
we place a loan on non-accrual status, the accrual of
interest is discontinued and previously recorded but
DCRB Comprehensive Annual Financial Report Volume II Notes to Consolidated Financial Statements
12
unpaid interest is reversed and generally charged against
net interest revenue. For loans on non-accrual status,
revenue is recognized on a cash basis after recovery of
principal, if and when interest payments are received.
Leveraged lease investments are reported at the
aggregate of lease payments receivable and estimated
residual values, net of non-recourse debt and unearned
income. Lease residual values are reviewed regularly for
other-than-temporary impairment, with valuation
adjustments recorded currently against processing fees
and other revenue. Unearned income is recognized to
yield a level rate of return on the net investment in the
leases. Gains and losses on residual values of leased
equipment sold are recorded in processing fees and
other revenue.
Allowance for Loan Losses:
The adequacy of the allowance for loan losses is evalu-
ated on a regular basis by management. Factors consid-
ered in evaluating the adequacy of the allowance
include previous loss experience, current economic
conditions and adverse situations that may affect the
borrower’s ability to repay, the estimated value of the
underlying collateral and the performance of individual
credits in relation to contract terms, and other relevant
factors. The provision for loan losses charged to earn-
ings is based upon management’s judgment of the
amount necessary to maintain the allowance at a level
adequate to absorb estimated probable credit losses.
Loans are charged off to the allowance for loan loss-
es in the reporting period in which either an event
occurs that confirms the existence of a loss or it is deter-
mined that a loan or a portion of a loan is not col-
lectible. Recoveries are recorded on a cash basis.
In addition, we maintain a reserve for off-balance
sheet credit exposures that is recorded in other liabili-
ties. The adequacy of this reserve is subject to the same
considerations and review as the allowance for loan
losses. Provisions to change the level of this reserve are
recorded in other operating expenses.
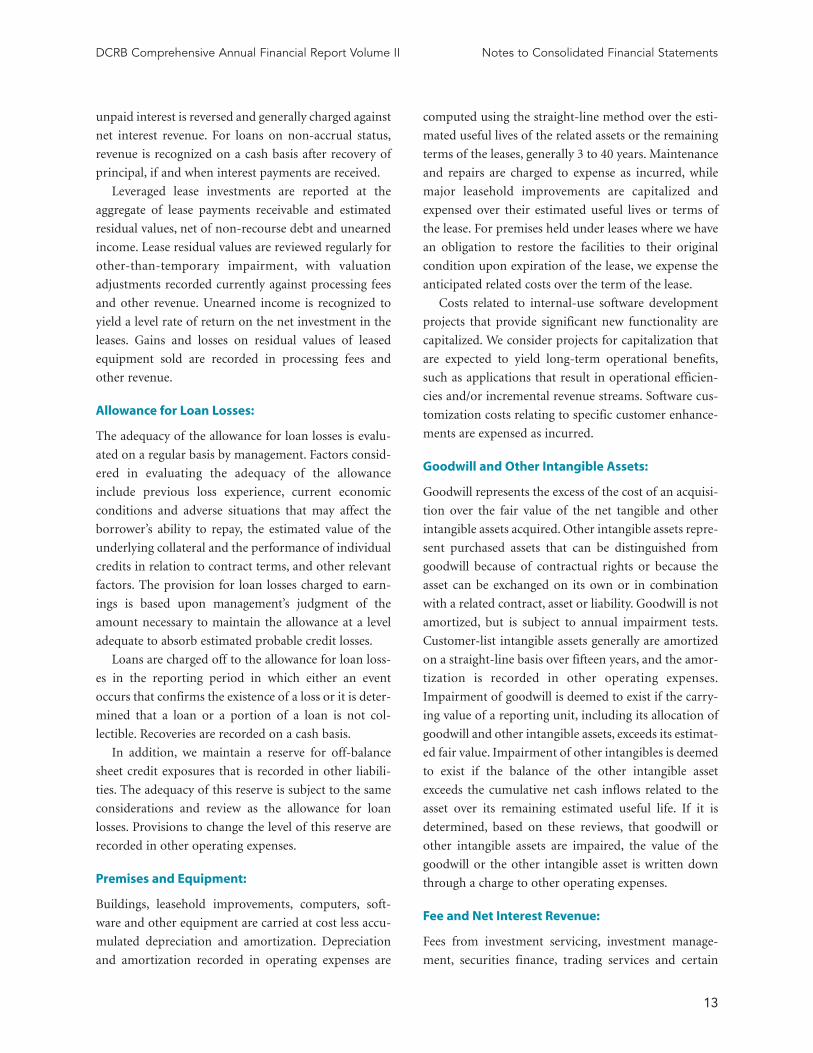
Premises and Equipment:
Buildings, leasehold improvements, computers, soft-
ware and other equipment are carried at cost less accu-
mulated depreciation and amortization. Depreciation
and amortization recorded in operating expenses are
computed using the straight-line method over the esti-
mated useful lives of the related assets or the remaining
terms of the leases, generally 3 to 40 years. Maintenance
and repairs are charged to expense as incurred, while
major leasehold improvements are capitalized and
expensed over their estimated useful lives or terms of
the lease. For premises held under leases where we have
an obligation to restore the facilities to their original
condition upon expiration of the lease, we expense the
anticipated related costs over the term of the lease.
Costs related to internal-use software development
projects that provide significant new functionality are
capitalized. We consider projects for capitalization that
are expected to yield long-term operational benefits,
such as applications that result in operational efficien-
cies and/or incremental revenue streams. Software cus-
tomization costs relating to specific customer enhance-
ments are expensed as incurred.
Goodwill and Other Intangible Assets:
Goodwill represents the excess of the cost of an acquisi-
tion over the fair value of the net tangible and other
intangible assets acquired. Other intangible assets repre-
sent purchased assets that can be distinguished from
goodwill because of contractual rights or because the
asset can be exchanged on its own or in combination
with a related contract, asset or liability. Goodwill is not
amortized, but is subject to annual impairment tests.
Customer-list intangible assets generally are amortized
on a straight-line basis over fifteen years, and the amor-
tization is recorded in other operating expenses.
Impairment of goodwill is deemed to exist if the carry-
ing value of a reporting unit, including its allocation of
goodwill and other intangible assets, exceeds its estimat-
ed fair value. Impairment of other intangibles is deemed
to exist if the balance of the other intangible asset
exceeds the cumulative net cash inflows related to the
asset over its remaining estimated useful life. If it is
determined, based on these reviews, that goodwill or
other intangible assets are impaired, the value of the
goodwill or the other intangible asset is written down
through a charge to other operating expenses.
Fee and Net Interest Revenue:
Fees from investment servicing, investment manage-
ment, securities finance, trading services and certain
DCRB Comprehensive Annual Financial Report Volume II Notes to Consolidated Financial Statements
13

types of processing fees and other revenue are recorded
based on estimates or specific contractual terms as
transactions occur or services are rendered, provided
that persuasive evidence exists, the price to the customer
is fixed or determinable and collectibility is reasonably
assured. Amounts accrued at period-end are recorded in
accrued income receivable in our consolidated state-
ment of condition. Investment management perform-
ance fees are recorded in arrears after the performance
period ends, based on predetermined benchmarks asso-
ciated with the applicable fund’s performance. Interest
revenue on interest-earning assets and interest expense
on interest-bearing liabilities is recorded based on the
effective yield of the related financial instrument.
Employee Benefits Expense:
Employee benefits expense includes prior and current
service costs of pension and other postretirement bene-
fit plans, which are accrued on a current basis, as well as
contributions under defined contribution savings plans,
unrestricted awards under other employee compensa-
tion plans, and the amortization of restricted stock
awards.
Equity-Based Compensation:
We record compensation expense, equal to the estimat-
ed fair value of employee stock options on the grant
date, on a straight-line basis over the options’ vesting
period. We use a Black-Scholes option-pricing model to
determine the fair value of the options granted.
On January 1, 2006, we adopted Statement of
Financial Accounting Standards, or “SFAS,” No. 123
(revised 2004), Share-Based Payment. This new standard
requires the fair value of all share-based payments to
employees, including awards made prior to January 1,
2003, to be recognized in the consolidated statement of
income. We elected to use the modified prospective
method, under which compensation expense is record-
ed over the remaining vesting period for only the por-
tion of stock awards not fully vested as of January 1,
2006. The impact of adoption of the new standard was
not material to our consolidated financial condition or
results of operations, because the number of options
granted prior to January 1, 2003, that were not fully
vested as of January 1, 2006, was not significant. In addi-
tion, we elected to adopt the alternative transition
method prescribed by Financial Accounting Standards
Board, or “FASB,” Staff Position FAS 123(R)-3, and
reclassified $86 million of tax benefits related to equity-
based compensation from general surplus account to a
specifically designated surplus account within share-
holders’ equity.
The following table illustrates the pro forma effect
on net income and earnings per share as if all outstand-
ing and unvested stock options in each period were
accounted for using estimated fair value, for the years
indicated.
Years Ended December 31, 2005 2004______ ______
(In millions, except per share amounts)
Net income, as reported $ 838 $ 798
Add: Stock option compensation
expense included in reported net
income, net of related taxes 20 15
Deduct: Total stock option
compensation expense determined
under fair value method for all
awards, net of related taxes (27 ) (42)______ ______Pro forma net income $ 831 $ 771______ ____________ ______
Earnings per share:
Basic—as reported $ 2.53 $ 2.38
Basic—pro forma 2.51 2.30
Diluted—as reported $ 2.50 $ 2.35
Diluted—pro forma 2.48 2.27
Income Taxes:
We use an asset and liability approach to account for
income taxes. Our objective is to recognize the amount
of taxes payable or refundable for the current year
through charges or credits to the current tax provision,
and to recognize deferred tax assets and liabilities for
the future tax consequences resulting from temporary
differences between the amounts reported in the con-
solidated financial statements and their respective tax
bases. The measurement of tax assets and liabilities is
based on enacted tax laws and applicable tax rates. A
deferred tax valuation allowance is established if it is
considered more likely than not that all or a portion of
the deferred tax assets will not be realized.
DCRB Comprehensive Annual Financial Report Volume II Notes to Consolidated Financial Statements
14

Earnings Per Share:
Basic earnings per share is calculated by dividing net
income available to common shareholders by the
weighted-average number of common shares outstand-
ing for the period, which excludes unvested shares of
restricted stock. Diluted earnings per share is calculated
by dividing net income available to common sharehold-
ers by the weighted-average number of common shares
outstanding for the period and the shares representing
the dilutive effect of stock options and awards and other
equity-related financial instruments. The effect of stock
options and restricted stock outstanding is excluded
from the calculation of diluted earnings per share in
periods in which their effect would be antidilutive.
Derivative Financial Instruments:
A derivative financial instrument is a financial instru-
ment or other contract which has one or more underly-
ing and one or more notional amounts, no initial net
investment, or a smaller initial net investment than
would be expected for similar types of contracts, and
which requires or permits net settlement. Derivatives
that we enter into include forwards, futures, swaps,
options and other instruments with similar characteris-
tics.
We record derivatives in our consolidated statement
of condition at their fair value. On the date a derivative
contract is entered into, we designate the derivative as:
(1) a hedge of the fair value of a recognized fixed-rate
asset or liability or of an unrecognized firm commit-
ment (a “fair value” hedge); (2) a hedge of a forecasted
transaction or of the variability of cash flows to be
received or paid related to a recognized variable-rate
asset or liability (a “cash flow” hedge); (3) a foreign cur-
rency fair value or cash flow hedge (a “foreign currency”
hedge); (4) a hedge of a net investment in a non-U.S.
operation; or (5) held for trading purposes (“trading”
instruments).
Changes in the fair value of a derivative that is high-
ly effective—and that is designated and qualifies as a fair
value hedge—are recorded currently in processing fees
and other revenue, along with the changes in fair value
of the hedged asset or liability attributable to the hedged
risk. Changes in the fair value of a derivative that is
highly effective—and that is designated and qualifies as
a cash flow hedge—are recorded, net of tax, in other
comprehensive income, until earnings are affected by
the hedged cash flows ( e.g., when periodic settlements
on a variable-rate asset or liability are recorded in earn-
ings). Cash flow hedge ineffectiveness, defined as the
extent to which the changes in fair value of the deriva-
tive exceed the variability of cash flows of the forecasted
transaction, is recorded in processing fees a nd other
revenue.
Changes in the fair value of a derivative that is high-
ly effective—and that is designated and qualifies as a
foreign currency hedge—are recorded currently either
in processing fees and other revenue or in other com-
prehensive income, net of tax, depending on whether
the hedge transaction meets the criteria for a fair value
or a cash flow hedge. If, however, a derivative is used as
a hedge of a net investment in a non-U.S. operation, its
changes in fair value, to the extent effective as a hedge,
are recorded, net of tax, in the foreign currency transla-
tion component of other comprehensive income. Lastly,
entire changes in the fair value of derivatives classified
as trading instruments are recorded in trading services
revenue.
At both the inception of the hedge and on an ongo-
ing basis, we formally assess and document the effec-
tiveness of a derivative designated as a hedge in offset-
ting changes in the fair value of hedged items and the
likelihood that the derivative will be an effective hedge
in future periods. We discontinue hedge accounting
prospectively when we determine that the derivative will
not remain effective in offsetting changes in fair value or
cash flows of the underlying risk being hedged, the
derivative expires, terminates or is sold, or management
discontinues the hedge designation.
Unrealized gains and losses on foreign exchange and
interest-rate contracts are reported at fair value in the
consolidated statement of condition as a component of
other assets and other liabilities, respectively, on a gross
basis, except where such gains and losses arise from con-
tracts covered by qualifying master netting agreements.
Recent Accounting Developments:
In September 2006, the FASB issued SFAS No. 158,
Employers’ Accounting for Defined Benefit Pension and
Other Postretirement Plans—an amendment of FASB
Statements No . 87, 88, 106 and 132(R). This new stan-
dard is intended to make it easier for financial statement
DCRB Comprehensive Annual Financial Report Volume II Notes to Consolidated Financial Statements
15

users to understand an employer’s financial position
and ability to meet the obligations of its benefit plans.
The standard requires recognition in our consolidated
statement of condition of the overfunded or under-
funded status of our tax-qualified defined benefit pen-
sion plan, nonqualified retirement plans and postretire-
ment benefit plans, which is the difference between the
fair value of plan assets and the related b enefit obliga-
tions. The standard also requires the reclassification of
the after-tax amount of any unrecognized actuarial
gains and losses and unrecognized prior service costs to
accumulated other comprehensive income, a compo-
nent of shareholders’ equity. In subsequent years, the
after-tax amount of changes in unrecognized actuarial
gains and losses, as well as unrecognized prior service
costs, will be recorded in other comprehensive income.
The standard was effective as of December 31, 2006
for the recognition of our plans’ funded status, and
applies prospectively for the remaining provisions.
Upon adoption of the standard, to recognize the after-
tax difference between our plans’ net funded status and
the amounts currently recorded in the consolidated
statement of condition, we recorded an after-tax reduc-
tion of accumulated other comprehensive income of
approximately $164 million. Disclosures required by the
new standard are included in Note 17.
In September 2006, the FASB issued SFAS No. 157,
Fair Value Measurements. This new standard defines fair
value, establishes a framework for measuring fair value
in conformity with GAAP, and expands disclosures
about fair value measurements. Prior to this standard,
there were varying definitions of fair value and limited
guidance for applying those definitions under GAAP. In
addition, the guidance was dispersed among the many
accounting pronouncements that require fair value
measurements. This standard is intended to increase
consistency and comparability in fair value measure-
ments and disclosures about fair value measurements.
The provisions of this standard are effective beginning
January 1, 2008. We are currently evaluating the poten-
tial impact of adoption of this standard on our consoli-
dated financial position and results of operations.
In September 2006, the Securities and Exchange
Commission issued Staff Accounting Bulletin, or “SAB,”
No. 108, Considering the Effects of Prior Year
Misstatements When Quantifying Misstatements in
Current Year Financial Statements. SAB No. 108 provides
interpretive guidance on how the effects of the carry-
over or reversal of prior year financial statement mis-
statements should be considered in quantifying a cur-
rent year misstatement. The guidance provided by SAB
No. 108 must be initially applied to financial statements
for the year ended December 31, 2006. This guidance
has not had any material impact on our consolidated
financial condition or results of operations.
In July 2006, the FASB issued FASB Staff Position, or
“FSP,” No. FAS 13-2, Accounting for a Change or
Projected Change in the Timing of Cash Flows Relating to
Income Taxes Generated by a Leveraged Lease Trans-
action. The FSP, which must be applied as of January 1,
2007, requires that the recognition of lease income over
the term of a lease be recalculated if there is a change in
the expected timing of tax-related cash flows. The
cumulative effect of applying the provisions of the FSP
must be recorded as an adjustment to the beginning
balance of retained earnings as of January 1, 2007. Our
application of the FSP’s provisions to certain of our
leveraged leases resulted in an after-tax reduction of the
beginning balance of retained earnings on January 1,
2007 of approximately $226 million. Future revenue
from the affected leases is expected to increase over the
remaining terms of the affected leases by an amount
approximately equal to the after-tax reduction.
In July 2006, to improve comparability in the report-
ing of income tax assets and liabilities in the absence of
guidance in existing income tax accounting standards,
the FASB issued Interpretation No. 48, Accounting for
Uncertainty in Income Taxes—an interpretation of FASB
Statement No. 109. Generally, this Interpretation clari-
fies the accounting for uncertainty in income taxes rec-
ognized in a company’s financial statements in accor-
dance with existing income tax accounting standards,
and prescribes certain thresholds and attributes for the
financial statement recognition and measurement of tax
positions taken or expected to be taken in a tax return.
The Interpretation must be applied as of January 1,
2007, and the cumulative effect of applying the
Interpretation’s provisions must be recorded as an
adjustment of the beginning balance of retained earn-
ings as of that date. Our application of the
Interpretation’s provisions t o our tax positions as of
January 1, 2007 did not have a material impact on our
DCRB Comprehensive Annual Financial Report Volume II Notes to Consolidated Financial Statements
16
consolidated financial position or results of operations.
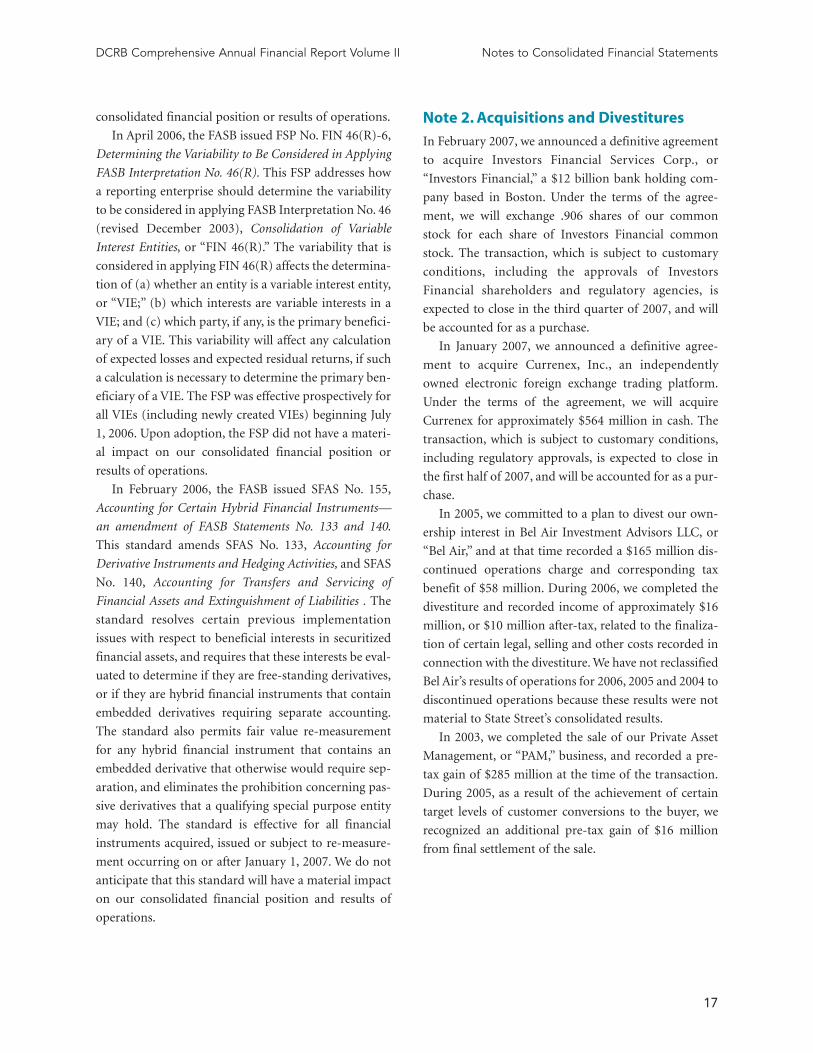
In April 2006, the FASB issued FSP No. FIN 46(R)-6,
Determining the Variability to Be Considered in Applying
FASB Interpretation No. 46(R). This FSP addresses how
a reporting enterprise should determine the variability
to be considered in applying FASB Interpretation No. 46
(revised December 2003), Consolidation of Variable
Interest Entities, or “FIN 46(R).” The variability that is
considered in applying FIN 46(R) affects the determina-
tion of (a) whether an entity is a variable interest entity,
or “VIE;” (b) which interests are variable interests in a
VIE; and (c) which party, if any, is the primary benefici-
ary of a VIE. This variability will affect any calculation
of expected losses and expected residual returns, if such
a calculation is necessary to determine the primary ben-
eficiary of a VIE. The FSP was effective prospectively for
all VIEs (including newly created VIEs) beginning July
1, 2006. Upon adoption, the FSP did not have a materi-
al impact on our consolidated financial position or
results of operations.
In February 2006, the FASB issued SFAS No. 155,
Accounting for Certain Hybrid Financial Instruments—
an amendment of FASB Statements No. 133 and 140.
This standard amends SFAS No. 133, Accounting for
Derivative Instruments and Hedging Activities, and SFAS
No. 140, Accounting for Transfers and Servicing of
Financial Assets and Extinguishment of Liabilities . The
standard resolves certain previous implementation
issues with respect to beneficial interests in securitized
financial assets, and requires that these interests be eval-
uated to determine if they are free-standing derivatives,
or if they are hybrid financial instruments that contain
embedded derivatives requiring separate accounting.
The standard also permits fair value re-measurement
for any hybrid financial instrument that contains an
embedded derivative that otherwise would require sep-
aration, and eliminates the prohibition concerning pas-
sive derivatives that a qualifying special purpose entity
may hold. The standard is effective for all financial
instruments acquired, issued or subject to re-measure-
ment occurring on or after January 1, 2007. We do not
anticipate that this standard will have a material impact
on our consolidated financial position and results of
operations.
Note 2. Acquisitions and Divestitures
In February 2007, we announced a definitive agreement
to acquire Investors Financial Services Corp., or
“Investors Financial,” a $12 billion bank holding com-
pany based in Boston. Under the terms of the agree-
ment, we will exchange .906 shares of our common
stock for each share of Investors Financial common
stock. The transaction, which is subject to customary
conditions, including the approvals of Investors
Financial shareholders and regulatory agencies, is
expected to close in the third quarter of 2007, and will
be accounted for as a purchase.
In January 2007, we announced a definitive agree-
ment to acquire Currenex, Inc., an independently
owned electronic foreign exchange trading platform.
Under the terms of the agreement, we will acquire
Currenex for approximately $564 million in cash. The
transaction, which is subject to customary conditions,
including regulatory approvals, is expected to close in
the first half of 2007, and will be accounted for as a pur-
chase.
In 2005, we committed to a plan to divest our own-
ership interest in Bel Air Investment Advisors LLC, or
“Bel Air,” and at that time recorded a $165 million dis-
continued operations charge and corresponding tax
benefit of $58 million. During 2006, we completed the
divestiture and recorded income of approximately $16
million, or $10 million after-tax, related to the finaliza-
tion of certain legal, selling and other costs recorded in
connection with the divestiture. We have not reclassified
Bel Air’s results of operations for 2006, 2005 and 2004 to
discontinued operations because these results were not
material to State Street’s consolidated results.
In 2003, we completed the sale of our Private Asset
Management, or “PAM,” business, and recorded a pre-
tax gain of $285 million at the time of the transaction.
During 2005, as a result of the achievement of certain
target levels of customer conversions to the buyer, we
recognized an additional pre-tax gain of $16 million
from final settlement of the sale.
DCRB Comprehensive Annual Financial Report Volume II Notes to Consolidated Financial Statements
17
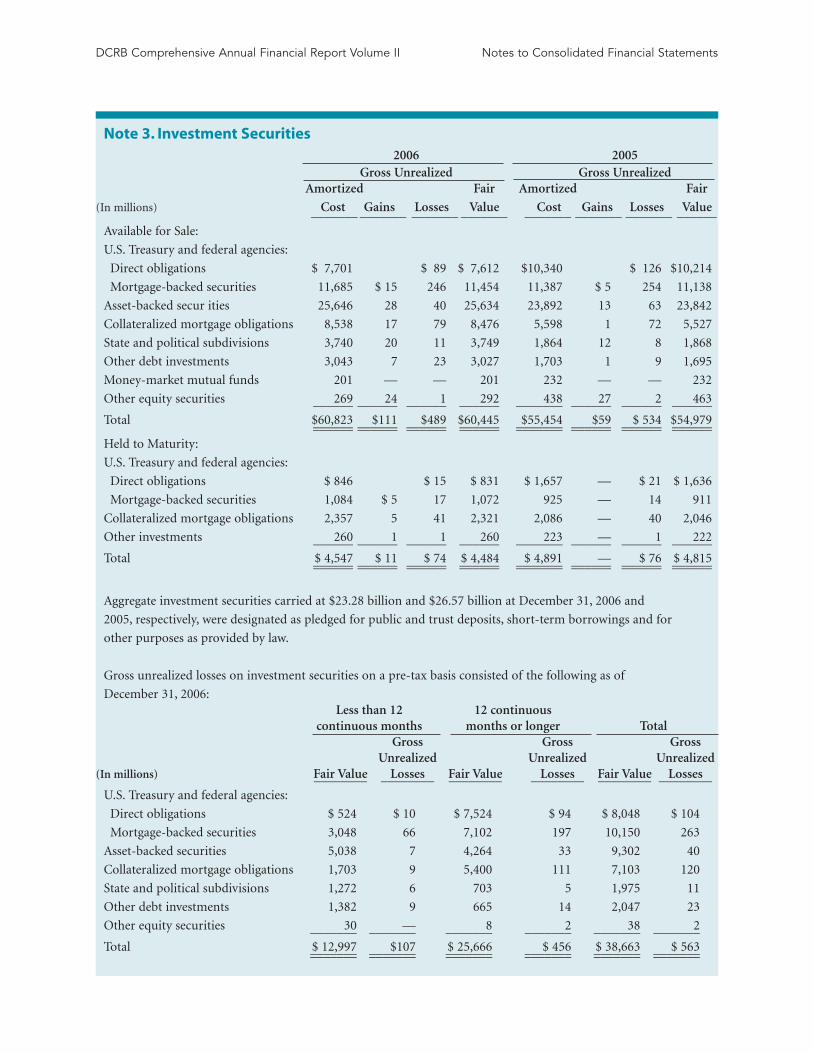
2006 2005Gross Unrealized Gross Unrealized
Amortized Fair Amortized Fair
(In millions) Cost Gains Losses Value Cost Gains Losses Value_______ _______ _______ _______ _______ _______ _______ ______
Available for Sale:
U.S. Treasury and federal agencies:
Direct obligations $ 7,701 $ 89 $ 7,612 $10,340 $ 126 $10,214
Mortgage-backed securities 11,685 $ 15 246 11,454 11,387 $ 5 254 11,138
Asset-backed secur ities 25,646 28 40 25,634 23,892 13 63 23,842
Collateralized mortgage obligations 8,538 17 79 8,476 5,598 1 72 5,527
State and political subdivisions 3,740 20 11 3,749 1,864 12 8 1,868
Other debt investments 3,043 7 23 3,027 1,703 1 9 1,695
Money-market mutual funds 201 — — 201 232 — — 232
Other equity securities 269 24 1 292 438 27 2 463______ ______ ______ ______ _______ ______ ______ ______
Total $60,823 $111 $489 $60,445 $55,454 $59 $ 534 $54,979______ ______ ______ ______ _______ ______ ______ ____________ ______ ______ ______ _______ ______ ______ ______
Held to Maturity:
U.S. Treasury and federal agencies:
Direct obligations $ 846 $ 15 $ 831 $ 1,657 — $ 21 $ 1,636
Mortgage-backed securities 1,084 $ 5 17 1,072 925 — 14 911
Collateralized mortgage obligations 2,357 5 41 2,321 2,086 — 40 2,046
Other investments 260 1 1 260 223 — 1 222______ ______ ______ ______ _______ ______ ______ ______
Total $ 4,547 $ 11 $ 74 $ 4,484 $ 4,891 — $ 76 $ 4,815______ ______ ______ ______ _______ ______ ______ ____________ ______ ______ ______ _______ ______ ______ ______
Aggregate investment securities carried at $23.28 billion and $26.57 billion at December 31, 2006 and
2005, respectively, were designated as pledged for public and trust deposits, short-term borrowings and for
other purposes as provided by law.
DCRB Comprehensive Annual Financial Report Volume II Notes to Consolidated Financial Statements
Gross unrealized losses on investment securities on a pre-tax basis consisted of the following as of
December 31, 2006:Less than 12 12 continuous
continuous months months or longer TotalGross Gross Gross
Unrealized Unrealized Unrealized(In millions) Fair Value Losses Fair Value Losses Fair Value Losses________ ________ ________ ________ ________ ________
U.S. Treasury and federal agencies:
Direct obligations $ 524 $ 10 $ 7,524 $ 94 $ 8,048 $ 104
Mortgage-backed securities 3,048 66 7,102 197 10,150 263
Asset-backed securities 5,038 7 4,264 33 9,302 40
Collateralized mortgage obligations 1,703 9 5,400 111 7,103 120
State and political subdivisions 1,272 6 703 5 1,975 11
Other debt investments 1,382 9 665 14 2,047 23
Other equity securities 30 — 8 2 38 2_______ _______ _______ _______ _______ _______
Total $ 12,997 $107 $ 25,666 $ 456 $ 38,663 $ 563_______ _______ _______ _______ _______ ______________ _______ _______ _______ _______ _______
Note 3. Investment Securities

As more fully described in Note 1, management peri-
odically reviews the investment securities portfolio to
determine if other-than-temporary impairment has
occurred. This review encompasses all investment secu-
rities and includes such quantitative factors as current
and expected future interest rates, the length of time the
cost basis has exceeded the fair value and the severity of
the impairment measured as the ratio of fair value to
amortized cost, and includes all investment securities
for which we have issuerspecific concerns regardless of
quantitative factors. After a full review of all investment
securities, taking into consideration current economic
conditions, adverse situations that might affect our abil-
ity to fully collect interest and principal, the timing of
future payments, the value of underlying collateral of
assetbacked securities, and other relevant factors, man-
agement considers the aggregate decline in fair value
and the resulting gross unrealized losses of $563 million
on 3,897 securities at December 31, 2006 to be tempo-
rary. The losses are primarily the result of rising interest
rates over the course of 2005 and part of 2006, not the
result of any material changes in the credit characteris-
tics of the investment securities portfolio. Management
has the ability and the intent to hold the securities until
recovery in market value.
DCRB Comprehensive Annual Financial Report Volume II Notes to Consolidated Financial Statements
19
Gross gains and losses realized from sales of available-for-sale securities were as follows for the years
indicated:
(In millions) 2006 2005 2004_______ _______ _______
Gross gains $ 33 $ 9 $ 49
Gross losses 18 10 23_______ _______ _______
Net gains (losses) $ 15 $ (1 ) $ 26_______ _______ ______________ _______ _______
Maturities of debt investment securities were as follows as of December 31, 2006:
Under 1 1 to 5 6 to 10 Over 10
(In millions) Year Years Years Years_______ _______ _______ _______
Available for Sale:
U.S. Treasury and federal agencies:
Direct obligations $ 4,684 $ 2,440 $ 488
Mortgage-backed securities 160 951 4,982 $ 5,361
Asset-backed securities 1,324 10,239 8,967 5,104
Collateralized mortgage obligations 142 1,892 3,231 3,211
State and political subdivisions 500 1,828 1,077 344
Other investments 996 1,285 731 15_______ _______ _______ _______
Total $ 7,806 $ 18,635 $ 19,476 $ 14,035_______ _______ _______ ______________ _______ _______ _______
Held to Maturity:
U.S. Treasury and federal agencies:
Direct obligations $ 95 $ 751
Mortgage-backed securities — 22 $ 320 $ 742
Collateralized mortgage obligations — 71 2 ,052 593
Other investments 76 96 85 3_______ _______ _______ _______
Total $ 171 $ 1,581 $ 1,457 $ 1,338_______ _______ _______ ______________ _______ _______ _______
The maturities of asset-backed securities, mortgage-backed securities and collateralized
mortgage obligations are based upon expected principal payments.

DCRB Comprehensive Annual Financial Report Volume II Notes to Consolidated Financial Statements
Note 4. Loans and Lease Financing
(In millions) 2006 2005_______ _______
Commercial and Financial:
U.S. $ 3,480 $ 2,298
Non-U.S. 3,137 1,854
Lease Financing:
U.S. 415 404
Non-U.S. 1,914 1,926_______ _______
Total loans. 8,946 6,482
Less allowance for loan losses (18) (18)_______ _______
Net loans $ 8,928 $ 6,464_______ ______________ _______
Aggregate securities settlement advances and overdrafts included in commercial and financial loans in the table
above were $5.69 billion and $3.41 billion at December 31, 2006 and 2005, respectively.
The components of the net investment in leveraged leases were as follows as of December 31:
(In millions) 2006 2005_______ _______
Net rental income receivable $ 3,272 $ 3,314
Estimated residual values 196 215
Unearned income (1,139) (1,199)_______ _______
Investment in leveraged leases 2,329 2,330
Less related deferred income taxes (1,779) (1,735)_______ _______
Net investment in leveraged leases $ 550 $ 595_______ ______________ _______
Changes in the allowance for loan losses were as follows for the years ended December 31:
(In millions) 2006 2005 2004_______ _______ _______
Balance at beginning of year $ 18 $ 18 $ 61
Provision for loan losses — — (18)
Reclassification — — (25)_______ _______ _______
Balance at end of year $ 18 $ 18 $ 18_______ _______ ______________ _______ _______
During 2004, we reclassified $25 million of the allowance for loan losses to other liabilities as a reserve for off-
balance sheet commitments. Subsequent to the reclassification, the reserve for off-balance sheet commitments
was reduced by $10 million, which was recorded as a reduction of other operating expenses. Additionally, we
reduced the allowance for loan losses by $18 million through the provision for loan losses as a result of reduced
credit exposures and improved credit quality.
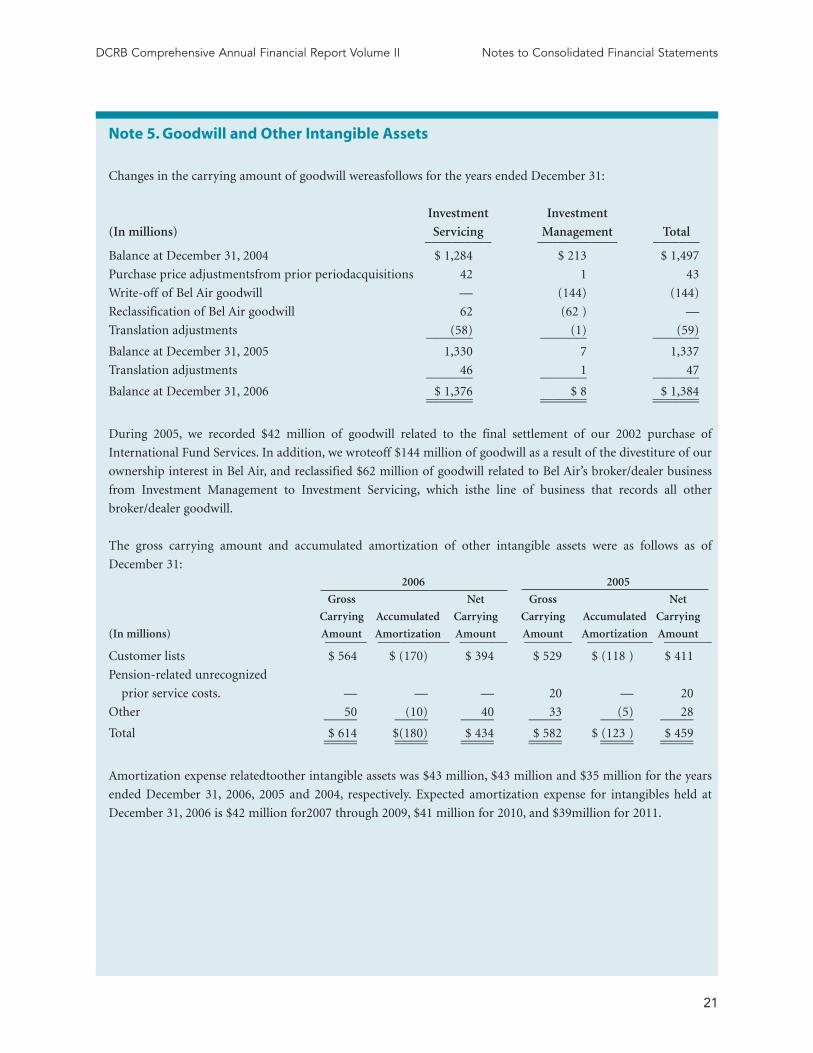
Note 5. Goodwill and Other Intangible Assets
Changes in the carrying amount of goodwill wereasfollows for the years ended December 31:
Investment Investment
(In millions) Servicing Management Total__________ ____________ _______
Balance at December 31, 2004 $ 1,284 $ 213 $ 1,497
Purchase price adjustmentsfrom prior periodacquisitions 42 1 43
Write-off of Bel Air goodwill — (144) (144)
Reclassification of Bel Air goodwill 62 (62 ) —
Translation adjustments (58) (1) (59) _______ _______ _______
Balance at December 31, 2005 1,330 7 1,337
Translation adjustments 46 1 47 _______ _______ _______
Balance at December 31, 2006 $ 1,376 $ 8 $ 1,384 _______ _______ ______________ _______ _______
During 2005, we recorded $42 million of goodwill related to the final settlement of our 2002 purchase of
International Fund Services. In addition, we wroteoff $144 million of goodwill as a result of the divestiture of our
ownership interest in Bel Air, and reclassified $62 million of goodwill related to Bel Air’s broker/dealer business
from Investment Management to Investment Servicing, which isthe line of business that records all other
broker/dealer goodwill.
The gross carrying amount and accumulated amortization of other intangible assets were as follows as of
December 31:2006 2005
Gross Net Gross Net
Carrying Accumulated Carrying Carrying Accumulated Carrying
(In millions) Amount Amortization Amount Amount Amortization Amount_______ ____________ ________ ________ ___________ ________
Customer lists $ 564 $ (170) $ 394 $ 529 $ (118 ) $ 411
Pension-related unrecognized
prior service costs. — — — 20 — 20
Other 50 (10) 40 33 (5) 28 _____ _____ _____ _____ _____ _____
Total $ 614 $(180) $ 434 $ 582 $ (123 ) $ 459 _____ _____ _____ _____ _____ __________ _____ _____ _____ _____ _____
Amortization expense relatedtoother intangible assets was $43 million, $43 million and $35 million for the years
ended December 31, 2006, 2005 and 2004, respectively. Expected amortization expense for intangibles held at
December 31, 2006 is $42 million for2007 through 2009, $41 million for 2010, and $39million for 2011.
DCRB Comprehensive Annual Financial Report Volume II Notes to Consolidated Financial Statements
21

Note 6. Other Assets
Other assets consisted of the following as of December 31:
(In millions) 2006 2005
Unrealized gains onderivative financialinstruments $ 3,060 $2,114
Equity investmentsinunconsolidated subsidiaries 336 315
Prepaid pension expense 53 187
Other 1,922 1,003
Total $ 5,371 $ 3,619
Note 7. Deposits
At December 31, 2006 and 2005, we had $16.74 billion and $17.84 billion, respectively, of time deposits out-
standing. Non-U.S. time deposits were $6.80 billion and $8.30 billion at December 31, 2006 and 2005, respec-
tively. Substantially all U.S. and non-U.S. time deposits were in amounts of $100,000 or more. The scheduled
maturities of time deposits were as follows at December 31, 2006:
(In millions)
2007 ........................................................................................................................................... $ 16,557
2008 .......................................................................................................................................... 3
2009 .......................................................................................................................................... 165
2010 .......................................................................................................................................... 13
2011 ........................................................................................................................................... —
After 2011 ................................................................................................................................. —________
Total .......................................................................................................................................... $ 16,738________________
At December 31, 2006, the scheduled maturities of U.S. time deposits were as follows:
(In millions)
3 months or less........................................................................................................................ $ 9,717
4 months to a year .................................................................................................................... 54
Over one year............................................................................................................................ 170________
Total........................................................................................................................................... $ 9,941________________
DCRB Comprehensive Annual Financial Report Volume II Notes to Consolidated Financial Statements
22

Note 8. Short-Term Borrowings
Our short-term borrowings include securities sold under repurchase agreements, federal funds purchased and
other short-term borrowings, including commercial paper. Collectively, short-term borrowings had weighted-
average interest rates of 4.46% and 2.82% for the years ended December 31, 2006 and 2005, respectively.
The following table reflects the amounts outstanding and weighted-average interest rates of the primary com-
ponents of short-term borrowings as of and for the years ended December 31:
Securities Sold Under
Federal Funds Purchased Repurchase Agreements_______________________ ______________________
(Dollars in millions) 2006 2005 2004 2006 2005 2004______ ______ ______ ______ ______ ______
Balance at December 31, $2,147 $ 1,204 $ 435 $19,147 $20,895 $21,881
Maximum outstanding at any month end 8,040 3,982 5,500 23,024 24,690 26,773
Average outstanding during the year 2,777 2,306 2,891 20,883 22,432 22,989
Weighted average interest rate at end of year 5.18% 4.08% 1.75% 4.43% 3.79% 1.64%
Weighted average interest rate during the year 5.04 3.23 1.40 4.38 2.73 1.02
Securities sold under repurchase agreements included the following at December 31, 2006:
(In millions)
Collateralized with securities purchased under resale agreements .............................................. $ 10,517
Collateralized with investment securities....................................................................................... 8,630________
Total.................................................................................................................................................. $ 19,147________________
The obligations to repurchase securities sold are reco rded as a liability in our consoli dated statement of con-
dition. U.S. government securities with a fair value of $8.79 billion underlying the repurchase agreements
remained in investment securities. Information about these U.S. government securities and the related repur-
chase agreements, including accrued interest, as of December 31, 2006, is presented in the following table. The
table excludes repurchase agreements collateralized with securities purchased under
resale agreements.
U.S. Government Repurchase
Securities Sold Agreements_________________________ ______________________
(Dollars in millions)
Amortized Cost Fair Value Amortized Cost Rate
Overnight maturity. $ 8,917 $ 8,794 $ 8,632 4.43%_______ _______ _______ _______
DCRB Comprehensive Annual Financial Report Volume II Notes to Consolidated Financial Statements
23

During 2005, we entered into an agreement with a
clearing organization that enables us to net all securities
purchased under resale agreements and sold under
repurchase agreements with counterparties that are also
members of this organization. As a result of netting, the
average balances of securities purchased under resale
agreements and securities sold under repurchase agree-
ments were each reduced by $6.41 billion for 2006 and
$1.70 billion for 2005. Other short-term borrowings at
December 31, 2006 included $1.5 billion related to our
tax-exempt investment programs, which were consoli-
dated onto our statement of condition during 2006.
These trusts, and the consolidation, are more fully dis-
cussed in Note 11.
We maintain a commercial paper program under
which we can issue up to $3 billion with original matu-
rities of up to 270 days from the date of issue. At
December 31, 2006 and 2005, $998 million and $864
million, respectively, of commercial paper were out-
standing. In addition, State
Street Bank currently has authority to issue bank
notes up to an aggregate of $750 million with original
maturities ranging from 14 days to five years. At
December 31, 2006 and 2005, no notes payable were
outstanding, and at December 31, 2006, all $750 million
was available for issuance.State Street Bank currently
maintains a line of credit of CAD $800 million, or
approximately $688 million, to support its Canadian
securities processing operations. The line of credit has
no stated termination date and is cancelable by either
party with prior notice. At December 31, 2006, no bal-
ance was due on this line of credit.
DCRB Comprehensive Annual Financial Report Volume II Notes to Consolidated Financial Statements
24
Note 9. Long-Term Debt
(Dollars in millions) 2006 2005
Statutory business trusts:
8.035% subordinated notes due to State Street Capital Trust B in 2027 $ 309 $ 322
7.94% subordinated notes due to State Street Capital Trust A in 2026 206 210
Floating rate subordinated notes due to State Street Capital Trust I in 2028(2) 155 154
Parent company and non-bank subsidiary issuances:
Long-term capital lease 501 515
7.65% subordinated notes due 2010(1) 294 295
7.35% notes due 2026 150 150
9.50%mortgage note due 2009 6 9
State Street Bank issuances:
5.25% subordinated notes due 2018(1) 96 405
5.30% subordinated notes due 2016 399 399
Floating rate subordinated notes due 2015(2) 200 200_______ _______
Total long-term debt $2,616 $2,659_______ ______________ _______
(1) We have entered into various interest-rate swap contracts to modify our interest expense on certain sub-
ordinated notes from a fixed rate to a floating rate. These swaps are recorded as fair value hedges, and at
December 31, 2006 and 2005, we recorded a decrease of $9 million and an increase of $18 million, respective-
ly, in the carrying value of long-term debt.
(2) We have entered into interest-rate swaps, which are recorded as cash flow hedges, to modify our
floating-rate interest expense on the subordinated notes due 2028 and 2015 to a fixed rate. See Note 15 for
additional information about derivatives.

We maintain an effective universal shelf registration
that allows for the offering and sale of debt securities,
capital securities, common stock, depositary shares and
preferred stock, and warrants to purchase such securi-
ties, including any shares into which the preferred stock
and depositary shares may be convertible, or any com-
bination thereof. Statutory Business Trusts:
We have three statutory business trusts, State Street
Capital Trusts A and B and State Street Capital Trust I,
and as of both December 31, 2006 and 2005, these trusts
collectively have issued $650 million of cumulative
semi-annual and quarterly income trust preferred capi-
tal securities.
Proceeds received by the trusts from their capitaliza-
tion and from their capital securities issuances were
invested in junior subordinated debentures issued by
the parent company. The junior subordinated deben-
tures are the sole assets of the trusts. The trusts are
wholly-owned by us; however, we do not consolidate the
trusts under existing accounting standards.
Payments made by the trusts on the capital securities
are dependent on our payments made to the trusts on
the junior subordinated debentures. Our fulfillment of
these commitments has the effect of providing a full,
irrevocable and unconditional guarantee of the trusts’
obligations under the capital securities. While the capi-
tal securities are not recorded in our consolidated state-
ment of condition, they continue to qualify as Tier 1
capital under federal regulatory capital guidelines.
Information about restrictions on our ability to obtain
funds from our subsidiary banks is in Note 14.
Interest paid on the debentures is recorded in inter-
est expense. Distributions on the capital securities are
payable from interest payments received on the deben-
tures and are due semi-annually by State Street Capital
Trusts A and B, and quarterly by State Street Capital
Trust I, subject to deferral for up to five years under cer-
tain conditions. The capital securities are subject to
mandatory redemption in whole at the stated maturity
upon repayment of the debentures, with an option by us
to redeem the debentures at any time upon the occur-
rence of certain tax events or changes to tax treatment,
investment company regulation or capital treatment; or
at any time after March 15, 2007, for the Capital
Securities B, after December 30, 2006, for the Capital
Securities A, and after May 15, 2008, for the Capital
Trust I securities. For State Street Capital Trusts A and
B, redemption premiums are payable on a declining
basis according to the terms of the trust agreements. All
redemptions are subj ect to federal regulatory approval.
Parent Company and Non-Bank Subsidiary Issuances:
At December 31, 2006 and 2005, $501 million and
$515 million, respectively, were included in longterm
debt related to the capital leases for One Lincoln Street
and the One Lincoln Street parking garage. See Note 18
for additional information.
The 7.65% subordinated notes due 2010 qualify as
Tier 2 capital under federal regulatory capital guide-
lines. The 7.35% notes are unsecured.
The 9.50% mortgage note was fully collateralized by
property at December 31, 2005. The scheduled principal
payments for the next three years are $3 million for
2007 and 2008 and less than $1 million for 2009, at
which time the debt will be entirely paid off.
State Street Bank Issuances:
State Street Bank currently has authority to issue up to
an aggregate of $1 billion of subordinated fixed-rate,
floating-rate or zero-coupon bank notes with a maturi-
ty of five to fifteen years. With respect to the 5.25% sub-
ordinated bank notes due 2018, State Street Bank is
required to make semi-annual interest payments on the
outstanding principal balance of the notes on April 15
and October 15 of each year, and the notes qualify as
Tier 2 capi tal under regulatory capita l guidelines.
With respect to the 5.30% subordinated notes due
2016 and the floating-rate subordinated notes due 2015,
State Street Bank is required to make semi-annual inter-
est payments on the outstanding principal balance of
the 5.30% notes on January 15 and July 15 of each year
beginning in July 2006, and quarterly interest payments
on the outsta nding principal balance of the floating-r
ate notes onMarch 8, June 8, September 8 and
December 8 of each year beginning in March 2006. The
notes qualify as Tier 2 capital under regulatory capital
guidelines.
DCRB Comprehensive Annual Financial Report Volume II Notes to Consolidated Financial Statements
25

Note 10. Commitments and Contingencies
Off-Balance Sheet Commitments and Contingencies:
Credit-related financial instruments include indemnified securities financing, unfunded commitments
to extend credit or purchase assets and standby letters of credit. The total potential loss on unfunded
commitments, standby and commercial letters of credit and securities finance indemnifications is equal to
the total contractual amount, which does not consider the value of any collateral.
The following is a summary of the contractual amount of credit-related, off-balance sheet financial
instruments at December 31. Amounts reported do not reflect participations to unrelated third parties.
(In millions) 2006 2005__________ __________
Indemnified securities financing $ 506,032 $ 372,863
Liquidity asset purchase agreements 30,251 24,412
Unfunded commitments to extend credit 6,354 14,403
Standby letters of credit 4,926 5,027
DCRB Comprehensive Annual Financial Report Volume II Notes to Consolidated Financial Statements
26
On behalf of our customers, we lend their securities to
creditworthy brokers and other institutions. In certain
circumstances, we may indemnify our customers for the
fair market value of those securities against a failure of
the borrower to return such securities. Collateral funds
received in connection with our securities finance serv-
ices are held by us as agent and are not recorded in our
consolidated statement of condition. We require the
borrowers to provide collateral in an amount equal to or
in excess of 100% of the fair market value of the securi-
ties borrowed. The borrowed securities are revalued
daily to determine if additional collateral is necessary.
We held, as agent, cash and U.S. government securities
totaling $527.37 billion and $387.22 billion as collateral
for indemnified securities on loan at December 31, 2006
and 2005, respectively.
Approximately 81% of the unfunded commitments
to extend credit and liquidity asset purchase agreements
expire within one year from the date of issue. Since
many of the commitments are expected to expire or
renew without being drawn upon, the total commit-
ment amounts do not necessarily represent future cash
requirements.
In the normal course of business, we provide liquidity
and credit enhancements to asset-backed commercial
paper programs, or “conduits.” These conduits are more
fully described in Note 11. The commercial paper
issuances and commitments of the conduits to provide
funding are supported by liquidity asset purchase agree-
ments and backup liquidity lines of credit, the majority of
which are provided by us. In addition, we provide direct
credit support to the conduits in the form of standby let-
ters of credit. Our commitments under liquidity asset
purchase agreements and backup lines of credit totaled
$23.99 billion at December 31, 2006, and are included in
the preceding table. Our commitments understandby let-
ters of credit totaled $1.01 billion at December 31, 2006,
and are also included in the preceding table.
Deterioration in asset performance or certain other
factors may shift the asset risk from the commercial
paper investors to us as the liquidity or credit enhance-
ment provider. In addition, the conduits may need to
draw upon the backup facilities to repay maturing com-
mercial paper. In these instances, we would either
acquire the assets of the conduits or make loans to the
conduits secured by the conduits’ assets. Potential loss-
es, if any, from these conduits are not expected to mate-
rially affect our consolidated financial condition or
results of operations.
In the normal course of business, we hold assets
under custody and management in a custodial or fidu-
ciary capacity. Management conducts regular reviews of
its responsibilities in this regard and considers the
results in preparing the consolidated financial state-
ments. In the opinion of management, no contingent
liabilities existed at December 31, 2006, that would have
had a material adverse effect on State Street’s consoli-
dated financial position or results of operations.

Legal Proceedings:
We are involved in various industry-related regulatory,
governmental and law enforcement inquiries and sub-
poenas, as well as legal proceedings that arise in the nor-
mal course of business. In the opinion of management,
after discussion with counsel, these regulatory, govern-
mental and law enforcement inquiries and subpoenas,
and legal proceedings can be successfully defended or
resolved without a material adverse effect on our con-
solidated financial condition or results of operations.
Tax Contingencies:
In the normal course of business, we are subject to chal-
lenges from U.S. and non-U.S. tax authorities regarding
the amount of taxes due. These challenges may result in
adjustments to the timing or amount of taxable income
or deductions or the allocation of income among tax
jurisdictions. During 2004, the U.S. Internal Revenue
Service, or “IRS,” completed its review of our federal
income tax returns for tax years 1997, 1998 and 1999
and proposed to disallow tax deductions related to
lease-in-lease-out, or “LILO,” transactions. We believe
that we reported the tax effects of these transactions
properly, based on applicable statutes, regulations and
case law in effect at the time they were entered into.
During the second quarter of 2005, we filed an appeal
with the IRS, which continues, with respect to their pro-
posed disallowance of these tax deductions. In January
2007, a U.S. District Court found for the government in
a LILO case involving another financial institution. The
financial institution is appealing the decision. The IRS
has indicated that it is reviewing its LILO settlement
position in light of the outcome of this case. During
2005, the IRS announced that it had classified sale-in-
lease-out, or “SILO,” transactions as tax shelters, or “list-
ed transactions.” The IRS began its review of our tax
returns for the years 2000–2003 during the second
quarter of 2005, and is reviewing these SILO transac-
tions. During the fourth quarter of 2006, the IRS pro-
posed to disallow tax deductions related to certain SILO
transactions. We believe that we reported the tax effects
of these transactions properly, based on applicable
statutes, regulations and case law in effect at the time
they were entered into.
During 2006, we recorded an additional tax provi-
sion of approximately $46 million to accrue for the
potential resolution of the above-described issues with
the IRS. While it is unclear whether we will be able to
reach an acceptable settlement with the IRS with respect
to LILO transactions, management believes we are suf-
ficiently accrued as of December 30, 2006 for tax expo-
sures, including exposures related to LILO and SILO
transactions, and related interest expense. In future
periods, if management revises its evaluation of this tax
position, the effect of the revision will be recorded in
income tax expense in that period.
Note 11. Securitizations and VariableInterest Entities
Tax-Exempt Investment Programs:
In the normal course of business, we structure and sell
certificated interests in pools of tax-exempt investment-
grade assets principally to mutual fund customers. We
utilize trusts which are structured as qualifying special
purpose entities, or “ QSPEs,” which, while not subject
to the requireme nts of FIN 46(R), are governed by the
accounting and reporting provisions of SFAS No. 140,
Accounting for the Transfers and Servicing of Financial
Assets and Extinguishments of Liabilities. We may also
provide liquidity and remarketing services to the
QSPEs. Historically, we transferred assets to these unaf-
filiated QSPEs from our investment securities portfolio
at fair market value and treated such transfers as sales.
The QSPEs financed the acquisition of these assets by
selling certificated interests issued by the QSPE to third-
party investors and we typically purchased a minority
residual interest in these QSPEs.
During the third quarter of 2006, we determined that
off-balance sheet accounting treatment for these trusts
was not appropriate. As a result, we consolidated the
trusts onto our consolidated statement of condition as of
September 30, 2006, resulting in an increase in assets,
composed of municipal securities available for sale, and
liabilities, composed of other short-term borrowings, of
approximately $1.5 billion. In addition, we recorded a
cumulative gain of $15 million in trading services rev-
enue for the quarter ended September 30, 2006. The con-
solidation of these trusts did not change the economic
substance of the programs, and its impact was not mate-
rial to consolidated financial statements of prior periods.
The consolidation of the trusts is reported as a non-cash
DCRB Comprehensive Annual Financial Report Volume II Notes to Consolidated Financial Statements
27

acquisition of investment securities available for sale in
our consolidated statement of cash flows.
The trusts had a weighted-average life of approxi-
mately 4.9 years at December 31, 2006, compared to
approximately 6.2 years at December 31, 2005. Under
separate agreements, we provide standby bond purchase
agreements to most of these trusts, which obligate State
Street to acquire the bonds at par value in the event that
the re-marketing agent is unable to place the certificat-
ed interests of the trusts with investors. The standby
bond purchase agreements are subject to early termina-
tion by State Street in the event of a shortfall in the
required over-collateralization in the trust. As the pri-
mary standby bond purchase agreement provider, we
are not obligated to acquire bonds in the event of the
following credit events: payment default, bankruptcy of
issuer or credit enhancement provider, imposition of
taxability, or downgrade of an asset held by the trust
below investment grade. Our commitments to the trusts
under these standby bond purchase agreements totaled
$1.68 billion at December 31, 2006, none of which were
utilized at period-end. In the event that our obligations
under these agreements are triggered, no material
impact to our consolidated financial condition or
results of operations would occur, because the bonds are
recorded in our consolidated statement of condition.
Asset-Backed Commercial Paper Programs:
We established an asset-backed commercial paper pro-
gram in 1992. Currently, we administer four third-party
owned, special purpose, multi-seller asset-backed com-
mercial paper programs, or “conduits,” that purchase
financial assets with various asset classifications from a
var iety of third-parties. These conduits, which are
structured as bankruptcy-remote limited liability com-
panies, provide access to the efficiencies of the global
commercial paper markets, which have historically
offered an attractive cost of financing relative to bank-
based borrowing. Asset purchases by the conduits are
funded by issuing commercial paper, which is support-
ed by liquidity asset purchase agreements and backup
liquidity lines of credit, the majority of which are pro-
vided by us. In addition, we provide direct credit sup-
port to the conduits in the form of standby letters of
credit. All fees are charged based on market price. The
sellers continue to service the transferred assets and
absorb the first losses of the conduits by providing col-
lateral in the form of excess assets also known as over-
collaterization.
We hold no equity ownership in these conduits.
These entities typically meet the definition of a variable
interest entity as defined by FIN 46(R). We are not the
primary beneficiary of these conduits, as defined by FIN
46(R), as a re sult of the issuance of subordinated notes
by the conduits to third-party investors, and we do not
record these conduits in our consolidated financial
statements. At December 31, 2006 and 2005, total assets
in unconsolidated conduits were $25.25 billion and
$17.90 billion, respectively. Our off-balance sheet com-
mitments to these conduits are disclosed in Note 10.
Collateralized Debt Obligations:
We manage a series of collateralized debt obligations, or
“CDOs.” A CDO is a managed investment vehicle which
purchases a portfol io of diversified highly-rated assets.
A CDO funds purchases throu gh the issuance of sever-
al tranches of debt and equity, the repayment and
return of which are linked to the performance of the
assets in the CDO. Typically, our involvement is as col-
lateral manager. We may also invest in a small percent-
age of the debt issued. These entities typically meet the
definition of a variable interest entity as defined by FIN
46(R). We are not the primary beneficiary of these
CDOs, as defined by FIN 46(R), and do not record these
CDOs in our consolidated financial statements. At
December 31, 2006 and 2005, total assets in these CDOs
were $3.48 billion and $2.73 billion, respectively.
During 2005, we acquired and transferred $60 mil-
lion of investment securities from our available-forsale
portfolio into a CDO. This transfer, which was executed
at fair market value in exchange for cash, was treated as
a sale. We did not acquire or transfer any investment
securities to a CDO during 2006.
Note 12. Shareholders’ Equity
Treasury Stock:
During the first quarter of 2006, we purchased 3 million
shares of our common stock under a program author-
ized by our Board of Directors, or “Board,” in 2005. On
March 16, 2006, the Board authorized a new program
for the purchase of up to 15 million shares of our com-
DCRB Comprehensive Annual Financial Report Volume II Notes to Consolidated Financial Statements
28

DCRB Comprehensive Annual Financial Report Volume II Notes to Consolidated Financial Statements
29
mon stock for general corporate purposes, including
mitigating the dilutive impact of shares issued under
employee benefit programs, and terminated the 2005
program. Under this new program, we purchased 2.8
million shares of our common stock during 2006, and
as of December 31, 2006, 12.2 million s hares were avail-
able for purchase. We utilize third-party broker-dealers
to acquire common shares on the open market in the
execution of our stock purchase program.
In addition, shares may be acquired for other
deferred compensation plans, held by an external
trustee, that are not part of the common stock purchase
program. As of December 31, 2006, on a cumulative
basis, approximately 395,000 shares have been pur-
chased and are held in trust. These shares are recorded
as treasury stock in our consolidated statement of con-
dition.
During 2006, 2005 and 2004, we purchased and
recorded as treasury stock a total of 5.8 million shares,
13.1 million shares and 4.1 million shares, respectively,
at an average historical cost per share of $63, $51 and
$43, respectively.
Accumulated Other Comprehensive (Loss) Income:
(In millions) 2006 2005 2004_____ _____ _____
Foreign currency translation $ 197 $ 73 $213
Unrealized gain (loss) on hedges
of net investments in non-U.S.
subsidiaries (7) 11 (26)
Unrealized loss on available-
for-sale securities (227) (285) (56)
Minimum pension liability (186) (26) (26)
Unrealized loss on cash flow hedges (1) (4 ) (13)_____ _____ _____
Total $ (224) $ (231) $ 92_____ _____ __________ _____ _____
For the year ended December 31, 2006, we realized
net gains of $15 million on sales of available-forsale
securities. Unrealized losses of $7 million were included
in other comprehensive income at December 31, 2005,
net of deferred taxes of $4 million, related to these sales.
For the year ended December 31, 2005, we realized
net losses of $1 million on sales of available -forsale
securities. Unrealized gains of $1 million were included
in other comprehensive income at December 31, 2004,
net of deferred taxes of less than $1 million, related to
these sales. For the year ended December 31, 2004, we
realized net gains of $26 million on sales of available-
forsale securities. Unrealized gains of $11 million were
included in other comprehensive income at December
31, 2003, net of deferred taxes of $7 million, related to
these sales.
Note 13. Equity-Based Compensation
The 2006 Equity Incentive Plan was approved by share-
holders in April 2006, and 20,000,000 shares of com-
mon stock were approved for issuance for stock and
stock-based awards, including stock options, stock
appreciation rights, restricted stock, deferred stock and
performance awards. In addition, up to 8,000,000 shares
from our 1997 Equity Incentive Plan, that were available
to issue or become available due to cancellations and
forfeitures, may be awarded under the 2006 Plan. The
1997 Plan expired on December 18, 2006. As of
December 31, 2006, 1,305,420 shares from the 1997
Plan have been added to and may be awarded from the
2006 Plan. As of December 31, 2006, 106,045 awards
have been made under the 2006 Plan. We have stock
options outstanding from previous plans, including the
1997 Plan, under which no further grants can be made.
The exercise price of non-qualified and incentive
stock options and stock appreciation rights may not be
less than the fair value of such shares at the date of
grant. Stock options and stock appreciation rights
issued under the 2006 Plan and the prior 1997 Plan gen-
erally vest over four years and expire no later than ten
years from the date of grant. For restricted stock awards
issued under the 2006 Plan and the prior 1997 Plan,
stock certificates are issued at the time of grant and
recipients have dividend and voting rights. In general,
these grants vest over three years. For deferred stock
awards issued under the 2006 Plan and the prior 1997
Plan, no stock is issued at the time of grant. Generally,
these grants vest over two-, three- or four-year periods.
Performance awards granted under the 2006 Equity
Incentive Plan and the prior 1997 Plan are earned over
a performance period based on achievement of goals,
generally over two- to threeyear periods. Payment for
performance awards is made in shares of our common
stock or in cash equal to the fair market value of our
common stock, based on certain financial ratios after
the conclusion of each performance period.
We record compensation expense, equal to the esti-
mated fair value of the options on the grant date, on a

DCRB Comprehensive Annual Financial Report Volume II Notes to Consolidated Financial Statements
30
Information about the 2006 Plan and 1997 Plan as of December 31, 2006, and activity during the year then ended
is presented below:Weighted Average
Weighted Average Remaining AggregateShares Exercise Contractual Intrinsic
(in millions) (in thousands) Price Term (in years) Value______________ ___________ _________________ ____________
Stock Options and Stock Appreciation Rights:
Outstanding at December 31, 2005. 23,956 $ 44.60
Granted 972 62.63
Exercised (4,823) 40.81
Forfeited or expired. (316) 51.32_______
Outstanding at December 31, 2006 19,789 $ 46.28 5.6 $ 419______________
Exercisable at December 31, 2006 15,132 $ 44.84 4.8 $ 342
The weighted-average grant date fair value of options granted in 2006, 2005 and 2004 was $21.09, $14.38 and
$13.17, respectively. The total intrinsic value of options exercised during the years ended December 31, 2006, 2005
and 2004, was $102 million, $56 million and $45 million, respectively.
As of December 31, 2006, total unrecognized compensation cost related to stock options and stock appreciation
rights was $39 million, which is expected to be recognized over a weighted-average period of 11 months.
Other stock awards and related activity consisted of the following for the year ended December 31, 2006:
Weighted-Average Grant DateRestricted Stock Awards Shares Fair Value___________ _______________________
(Shares in thousands)
Outstanding at December 31, 2005 378 $ 46.82
Granted 184 62.62
Vested (168) 46.49
Forfeited (21) 51.12_______
Outstanding at December 31, 2006 373 $ 54.42______________
straight-line basis over the options’ vesting period. We
use a Black-Scholes option-pricing model to estimate
the fair value of the options granted.
The weighted-average assumptions used in connec-
tion with the option-pricing model were as follows for
the years indicated.
2006 2005 2004______ ______ ______
Dividend yield. 1.41 % 1.85 % 1.35%
Expected volatility 26.50 28.70 27.10
Risk-free interest rate 4.60 4.19 3.02
Expected option lives (in years) 7.8 7.8 5.0
Compensation expense related to stock options,
stock appreciation rights, restricted stock awards,
deferred stock awards and performance awards, which
we record as a component of salaries and employee ben-
efits expense in our consolidated statement of income,
was $208 million, $110 million and $74 million for the
years ended December 31, 2006, 2005 and 2004, respec-
tively. The related total income tax benefit recorded in
our consolidated statement of income was $83 million,
$44 million and $30 million for 2006, 2005 and 2004,
respectively.

DCRB Comprehensive Annual Financial Report Volume II Notes to Consolidated Financial Statements
31
The weighted-average grant date fair value of restricted
stock awards granted in 2005 and 2004 was $45.26 and
$51.39 per share, respectively. The total fair value of
restricted stock awards vested was $8 million, $8 million
and $10 million for 2006, 2005 and 2004, respectively.
As of December 31, 2006, total unrecognized compen-
sation cost related to restricted stock was $13 million,
which is expected to be recognized over a weighted-
average period of 11 months.Weighted-
Average
Grant Date
Deferred Stock Awards Shares Fair Value______ _________
(Shares in thousands)
Outstanding at December 31, 2005 3,203 $43.60
Granted 3,083 60.94
Vested (1,270) 43.80
Forfeited (162) 53.33
Outstanding at December 31, 2006 4,854 $54.21
The weighted-average grant date fair value of
deferred stock awards granted in 2005 and 2004 was
$43.40 and $50.28 per share, respectively. The total fair
value of deferred stock awards vested was $56 million,
$14 million and $51 million for 2006, 2005 and 2004,
respectively. As of December 31, 2006, total unrecog-
nized compensation cost related to deferred stock
awards was $149 million, which is expected to be recog-
nized over a weighted-average period of 14 months.Weighted-
Average
Grant Date
Performance Awards Shares Fair Value______ _________
(Shares in thousands)
Outstanding at December 31, 2005 1,283 $48.52
Granted 959 59.87
Forfeited (193 ) 52.71
Paid Out (160 ) 52.78
Outstanding at December 31, 2006 1,889 $53.49
The weighted-average grant date fair value of per-
formance awards granted in 2005 and 2004 was $47.91
and $50.35 per share, respectively. The total fair value of
performance aw ards paid out was $9 million and $12
million for 2006 and 2005, respectively. There were no
payments made for performance awards in 2004, as the
only program in place at that time paid out every other
year and 2004 was not a payout year. As of December 31,
2006, total unrecognized compensation cost related to
performance awards was $38 million, which is expected
to be recognized over a weighted-average period of 23
months.
We generally utilize treasury shares to satisfy the
issuance of stock under our equity incentive plans. We
do not have a specific policy concerning purchases of
our common stock to satisfy stock issuances, including
exercises of options. We have a general policy concern-
ing purchases of stock to meet common stock issuances
under our employee benefit plans, including option
exercises and other corporate purposes. Various factors
determine the amount and timing of our purchases of
our common stock, including our capital requirements,
the number of shares we expect to issue under employ-
ee benefit plans, market conditions (including the trad-
ing price of our common stock), and legal considera-
tions. These factors can change at any time, and there
can be no assurance as to the number of shares of com-
mon stock we will purchase or when we will purchase
them.
Note 14. Regulatory Matters
Regulatory Capital:
We are subject to various regulatory capital require-
ments administered by federal banking agencies. Failure
to meet minimum capital requirements can initiate cert
ain mandatory and discretionary actions by regulators
that, if undertaken, could have a direct material effect
on our consolidated financial condition. Under regula-
tory capital adequacy guidelines, we must meet specific
capital requirements that involve quantitative measures
of our consolidated assets, liabilities and off-balance
sheet exposures as calculated under regulatory account-
ing practices. Our capital amounts and classification are
subject to qualitative judgments by the regulators about
components, risk weightings and other factors.
Quantitative measures established by regulation to
ensure capital adequacy require State Street and State
Street Bank to maintain minimum risk-based capital
and leverage ratios as set forth in the following table.
The risk-based capital ratios are Tier 1 capital and total
capital divided by adjusted total riskweighted assets and
market-risk equivalents, and the Tier 1 leverage ratio is

Tier 1 capital divided by adjusted quarterly average
assets. As of December 31, 2006 and 2005, State Street
and State Street Bank met all capital adequacy require-
ments to which they were subject.
As of December 31, 2006, State Street Bank was cat-
egorized as “well capitalized” under the regulatory
framework. To be categorized as “well capitalized,” State
Street Bank must exceed the “well capitalized” guideline
ratios, as set forth in the table, and meet certain other
requirements. State Street Bank exceeded all “well capi-
talized” requirements as of December 31, 2006 and
2005. There are no conditions or events since December
31, 2006 that management believes have changed the
capital category of State Street Bank.
DCRB Comprehensive Annual Financial Report Volume II Notes to Consolidated Financial Statements
32
The regulatory capital ratios and related amounts were as follows as of December 31:
Regulatory Guidelines(1) State Street State Street Bank____________________ ______________ _________________
(Dollars in millions) Well
Minimum Capitalized 2006 2005 2006 2005________ __________ _______ _______ _______ _______
Risk-Based Ratios:
Tier 1 capital 4 % 6 % 13.7% 11.7% 12.0 % 10.3%
Total capital 8 10 15.9 14.0 14.1 12.5
Tier 1 leverage ratio 4 5 5.8 5.6 5.6 5.4
Shareholders’ equity $ 7,252 $ 6,367 $ 6,769 $ 6,139
Capital trust secu rities 650 650 — —
Unrealized losses on available-for-sale securities 227 285 239 2 92
Unrealized (gains) los ses on cash flow hedges — 4 163 (10)
Recognition of pension plan funded status 164 — — —
Qualifying minority interest inconsolidated subsidiaries — 2 — 2
Less:
Goodwill 1,384 1,337 1,297 1,247
Other intangible assets 434 459 401 438
Other deductions 2 1 — —_______ _______ _______ _______
Tier 1 capital 6,473 5,511 5,473 4,738
Qualifying subordinated debt 1,178 1,238 998 998
Allowances for on- and off-balance
sheet credit exposures 30 30 30 30
Unrealized gains on available-forsale
equity securities 10 12 1 6_______ _______ _______ _______
Tier 2 capital 1,218 1,280 1,029 1,034
Deduction for investments in
finance subsidiaries (184) (174) (62 ) (52)_______ _______ _______ _______
Total capital $ 7,507 $ 6,617 $ 6,440 $ 5,720_______ _______ _______ ______________ _______ _______ _______
Adjusted total risk-weighted assets and market-risk equivalents:
On-balance sheet $ 31,447 $ 27,288 $ 30,000 $ 25,965
Off-balance sheet 15,371 19,586 15,375 19,602
Market-risk equivalents 395 361 394 351_______ _______ _______ _______
Total $ 47,213 $ 47,235 $ 45,769 $ 45,918_______ _______ _______ _______
Adjusted quarterly average assets $ 110,794 $ 98,970 $ 97,132 $ 87,667_______ _______ _______ ______________ _______ _______ _______
(1) State Street Bank must meet the regulatory designa-
tion of “well capitalized” in order for us to maintain our
status as a financial holding company, including main-
taining a minimum Tier 1 risk-based capital ratio (Tier
1 capital divided by adjusted total risk-weighted assets
and market-risk equivalents) of 6%, a minimum total
risk-based capital ratio (total capital divided by adjust-
ed total risk-weighted assets and market-risk equiva-
lents) of 10%, and a Tier 1 leverage ratio (Tier 1 capital
divided by adjusted quarterly average assets) of 5%. In
addition, Federal Reserve Regulation Y defines “well
capitalized” for a bank holding company such as us for
purposes of determining eligibility for a streamlined
review process for acquisition proposals. For such
Regulation Y purposes, “well capitalized” requires us to
maintain a minimum Tier 1 risk-based capital ratio of
6% and a minimum total risk-based capital ratio of
10%.
Cash, Dividend, Loan and Other Restrictions:
During 2006, our bank subsidiaries were re quired by
the Federal Reserve to maintain average cash reserve
balances of $103 million. In addition, federal and state
banking regulations place certain restrictions on divi-
dends paid by bank subsidiaries to a parent holding
company. For 2007, a ggregate dividends by State Street
Bank without prior regulatory approval are limited to
approximately $766 million of its undistributed earn-
ings at December 31, 2006, plus an additional amount
equal to its net profits, as defined, for 2007 up to the
date of any dividend.
The Federal Reserve Act requires that extensions of
credit by State Street Bank to certain affiliates, including
the parent company, be secured by specific collateral,
that the extension of credit to any one affiliate be limit-
ed to 10% of its capital and surplus (as defined), and
that extensions of credit to all such affiliates be limited
to 20% of its capital and surplus.
At December 31, 2006, consolidated retained earn-
ings included $230 million representing undistributed
earnings of affiliates that are accounted for using the
equity method.
Note 15. Derivative Financial Instruments
We use derivatives to support customers’ needs, conduct
trading activities, and manage our interestrate and cur-
rency risk.
As part of our trading activities, we assume positions in
both the foreign exchange and interest-rate markets by
buying and selling cash instruments and using deriva-
tive financial instruments, including foreign exchange
forward contracts, foreign exchange and interest-rate
options, and interest-rate swaps. In the aggregate, long
and short foreign exchange forward positions are
matched closely to minimize currency and interest-rate
risk. All foreign exchange contracts are valued daily at
current market rates.
Interest-rate contracts involve an agreement with a
counterparty to exchange cash flows based on the
movement of an underlying interest-rate index. An
interest-rate swap agreement involves the exchange of a
series of interest payments, either at a fixed or variable
rate, based upon the notional amount without the
exchange of the underlying principal amount. An inter-
est-rate option contract provides the purchaser, for a
premium, the right, but not the obligation, to receive an
interest rate based upon a predetermined notional value
during a specified period. An interest-rate futures con-
tract is a commitment to buy or sell, at a future date, a
financial instrument at a contracted price; it may be set-
tled in cash or through the delivery of the contracted
instrument.
Foreign exchange contracts involve an agreement to
exchange one currency for another currency at an
agreed-upon rate and settlement date. Foreign exchange
contracts consist of cross-currency swap agreements
and foreign exchange forward and spot contracts.
DCRB Comprehensive Annual Financial Report Volume II Notes to Consolidated Financial Statements
33

The following table summarizes the contractual or notional amounts of derivative financial instruments held or
issued for trading and asset and liability management as of December 31:
(In millions) 2006 2005
Trading:
Interest-rate contracts:
Swap agreements .$ 1,011 $ 4,508
Options and caps purchased 1,216 912
Options and caps written 3,224 2,564
Futures 154 534
Foreign exchange contracts:
Forward, swap and spot 492,063 414,376
Options purchased 8,313 6,624
Options written 8,063 6,763
Asset and Liability Management:
Interest-rate contracts:
Swap agreements .2,770 5,369
Foreign exchange contracts:
Swap agreements 132 355
In connection with our asset and liability management activities, we have executed interest-rate swap agreements
designated as fair value and cash flow hedges to manage interest-rate risk. The notional values of these interest-rate
swap agreements and the related assets or liabilities being hedged were as follows at December 31:
2006 2005______________________________ _____________________________
Fair Value Cash Flow Fair Value Cash Flow
Hedges Hedges Total Hedges Hedges Total_______ _______ _______ _______ _______ _______
Available-for-sale investment securities $ 1,452 $ 1,452 $ 2,211 $ 2,211
Interest-bearing time deposits(1) 118 $ 300 418 118 $ 1,490 1,608
Long-term debt(2)(3) 700 200 900 1,200 350 1,550_______ _______ _______ _______ _______ _______
Total $ 2,270 $ 500 $ 2,770 $ 3,529 $ 1,840 $ 5,369_______ _______ _______ _______ _______ ______________ _______ _______ _______ _______ _______
(1) For the years ended December 31, 2006 and 2005, the overall weighted-average interest rate for interest-bear-
ing time deposits was 5.02% and 3.23%, respectively, on a contractual basis, and 3.52% and 3.19%, respectively,
including the effects of hedges.
(2) For the year ended December 31, 2006, the fair value hedges of long-term debt decreased the carrying value of
long-term debt presented in our consolidated statement of condition by $9 million and in the year ended
December 31, 2005 it increased the value by $18 million.
(3) For the years ended December 31, 2006 and 2005, the overall weighted-average interest rate for longterm debt
was 6.72% and 6.58%, respectively, on a contractual basis, and 6.77% and 5.63%, respectively, including the effects
of hedges.
DCRB Comprehensive Annual Financial Report Volume II Notes to Consolidated Financial Statements
34
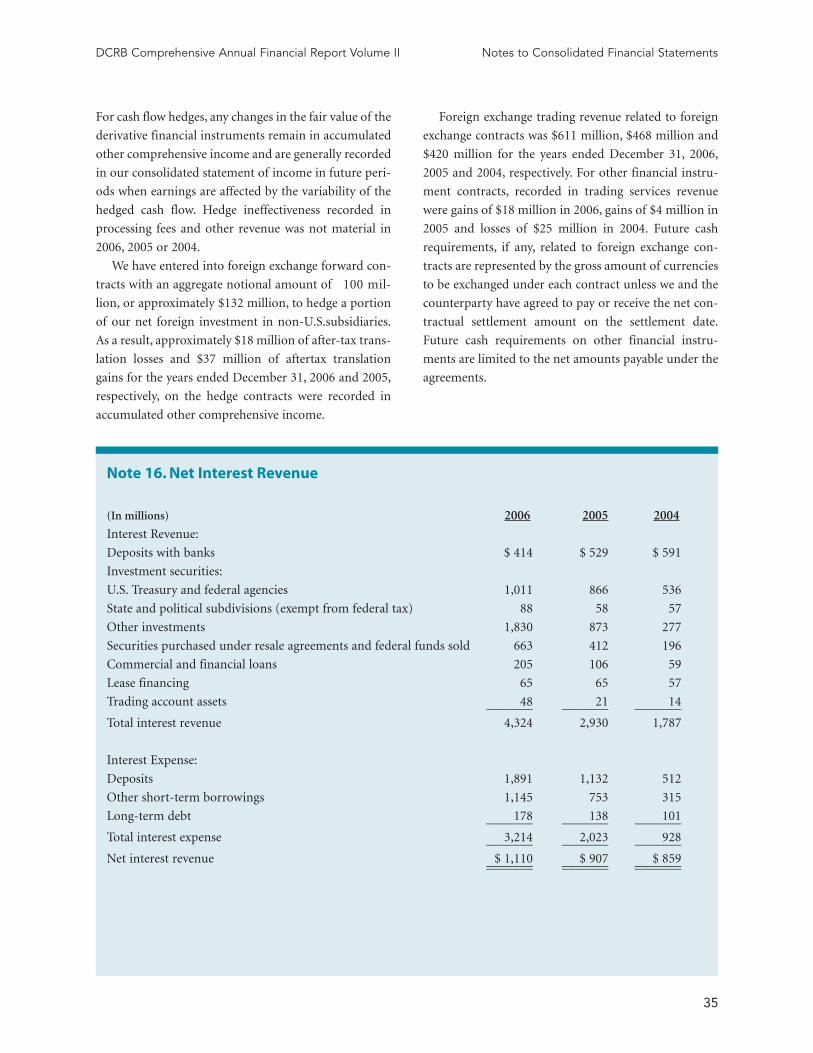
For cash flow hedges, any changes in the fair value of the
derivative financial instruments remain in accumulated
other comprehensive income and are generally recorded
in our consolidated statement of income in future peri-
ods when earnings are affected by the variability of the
hedged cash flow. Hedge ineffectiveness recorded in
processing fees and other revenue was not material in
2006, 2005 or 2004.
We have entered into foreign exchange forward con-
tracts with an aggregate notional amount of 100 mil-
lion, or approximately $132 million, to hedge a portion
of our net foreign investment in non-U.S.subsidiaries.
As a result, approximately $18 million of after-tax trans-
lation losses and $37 million of aftertax translation
gains for the years ended December 31, 2006 and 2005,
respectively, on the hedge contracts were recorded in
accumulated other comprehensive income.
Foreign exchange trading revenue related to foreign
exchange contracts was $611 million, $468 million and
$420 million for the years ended December 31, 2006,
2005 and 2004, respectively. For other financial instru-
ment contracts, recorded in trading services revenue
were gains of $18 million in 2006, gains of $4 million in
2005 and losses of $25 million in 2004. Future cash
requirements, if any, related to foreign exchange con-
tracts are represented by the gross amount of currencies
to be exchanged under each contract unless we and the
counterparty have agreed to pay or receive the net con-
tractual settlement amount on the settlement date.
Future cash requirements on other financial instru-
ments are limited to the net amounts payable under the
agreements.
DCRB Comprehensive Annual Financial Report Volume II Notes to Consolidated Financial Statements
35
Note 16. Net Interest Revenue
(In millions) 2006 2005 2004
Interest Revenue:
Deposits with banks $ 414 $ 529 $ 591
Investment securities:
U.S. Treasury and federal agencies 1,011 866 536
State and political subdivisions (exempt from federal tax) 88 58 57
Other investments 1,830 873 277
Securities purchased under resale agreements and federal funds sold 663 412 196
Commercial and financial loans 205 106 59
Lease financing 65 65 57
Trading account assets 48 21 14_______ _______ _______
Total interest revenue 4,324 2,930 1,787
Interest Expense:
Deposits 1,891 1,132 512
Other short-term borrowings 1,145 753 315
Long-term debt 178 138 101_______ _______ _______
Total interest expense 3,214 2,023 928_______ _______ _______
Net interest revenue $ 1,110 $ 907 $ 859_______ _______ ______________ _______ _______

Note 17. Employee Benefits
State Street Bank and certain of its U.S. subsidiaries participate in a non-contributory, tax-qualified defined bene-
fit pension plan. In addition to this primary plan, we have non-qualified unfunded supplemental retirement plans,
or “SERPs,” that provide certain officers with defined pension benefits in excess of allowable qualified plan limits.
Non-U.S. employees participate in local defined benefit plans.
State Street Bank and certain of its U.S. subsidiaries participate in a post-retirement plan that provides health
care and insurance benefits for retired employees.
Combined information for the U.S. and non-U.S. defined benefit plans, and information for the postretirement
plan, is as follows as of the December 31 measurement date:
Primary U.S.
and Non-U.S. Defined Post-Retirement
Benefit Plans Plan___________________ ___________________
2006 2005 2006 2005_______ _______ _______ _______Benefit Obligations:
Beginning of year $ 759 $650 $79 $ 72
Service cost 59 50 4 4
Interest cost. 39 35 5 4
Employee Contributions 1 — — —
Transfers in — 27 — —
Actuarial losses/(gains) (4) 62 9 4
Benefits paid (47) (45) (7) (5)
Expenses paid . (1) (2) — —
Special termination benefits — 1 — —
Foreign currency translation 27 (19 ) — —_______ _______ _______ _______
End of year $ 833 $759 $90 $ 79_______ _______ _______ _______
Plan Assets at Fair Value:
Beginning of year $ 706 $592
Actual return on plan assets 84 63
Employer contributions 57 98 $ 6 $ 5
Transfers in — 13
Benefits paid (47) (45) (6) (5)
Expenses paid (1) (2)
Foreign currency translation 22 (13)_______ _______ _______ _______
End of year $ 821 $706 $ — $ —_______ _______ _______ _______
Accrued Benefit Expense:
Funded status (plan assets less benefit obligations) $ (12) $ (53) $ (90 ) $ (79)
Transition obligation N/A — N/A 6
Net actuarial loss N/A 263 N/A 22
Prior service credit N/A (23) N/A —_______ _______ _______ _______
Net prepaid (accrued) benefit expense $ (12) $ 187 $(90 ) $(51)_______ _______ _______ ______________ _______ _______ _______
N/A—Disclosure not applicable for period indicated as a result of the adoption of SFAS No. 158.
DCRB Comprehensive Annual Financial Report Volume II Notes to Consolidated Financial Statements
36

Primary U.S.and Non-U.S. Defined Post-Retirement
Benefit Plans Plan_____________________ ______________(In millions) 2006 2005 2006 2005______ ______ ______ _____Amounts Recognized in the Consolidated Statement of Condition:As of December 31:Prepaid benefit cost N/A $ 183 — —Accrued benefit liability N/A (26) N/A $ (51)Other N/A 30 — —Non-current assets $ 53 N/A — N/ACurrent liabilities — N/A $ (8 ) N/ANoncurrent liabilities (65) N/A (82) N/A______ ______ ______ ______Net prepaid (accrued) amount recognized in statement of condition $ (12) $ 187 $ (90) $ (51)______ ______ ______ ____________ ______ ______ ______Amounts Recognized in Accumulated Other Comprehensive Income:Initial net obligation — N/A $ (5 ) N/APrior service credit $ 20 N/A — N/ANet loss (217) N/A (29) N/A______ ______ ______ ______Accumulated other comprehensive loss (197) N/A (34) N/ACumulative employer contributions inexcess of net periodic benefit cost 185 N/A (56) N/A______ ______ ______ ______Net obligation recognized in statement of condition $ (12) N/A $ (90) N/A______ ______ ______ ____________ ______ ______ ______Determination of Adjustment Related to Adoption of SFAS No. 158:Liability before adoption of the funded status provisions of SFAS No. 158. $ 31 N/A N/A N/AAccumulated other comprehensive loss before adoption offunded status recognition provisions of SFAS No. 158 31 N/A N/A N/ATransition obligation after adoption of funded status provisions of SFAS No. 158 — N/A $ 5 N/APrior service cost (20) N/A — N/ANet loss 217 N/A 29 N/A______ ______ ______ ______Accumulated other comprehensive loss after adoption of fundedstatus recognition provisions of SFAS No. 158 $ 197 N/A $ 34 N/A______ ______ ______ ______Increase in accumulated other comprehensive loss, before taxes, toreflect the adoption of SFAS No. 158 $ 166 N/A $ 34 N/A______ ______ ______ ____________ ______ ______ ______Accumulated benefit obligation $ 751 $ 689 N/A N/AActuarial Assumptions (U.S. Plans):Used to determine benefit obligations as of December 31:Discount rate. 5.75% 5.50% 5.75 % 5.50%Rate of increase for future compensation 4.50 4.50 — —Used to determine periodic benefit cost for the years ended December 31:Discount rate 5.50% 5.75% 5.50 % 5.75%Rate of increase for future compensation 4.50 4.50 — —Expected long-term rate of return on plan assets 8.00 8.00 — —Assumed health care cost trend rates as of December 31:Cost trend rate assumed for next year — — 10.00% 11.00%Rate to which the cost trend rate is assumed to decline . — — 5.00 5.00Year that the rate reaches the ultimate trend rate — — 2013 2013
N/A—Disclosure not applicable for period indicated as a result of the adoption of SFAS No. 158.
DCRB Comprehensive Annual Financial Report Volume II Notes to Consolidated Financial Statements
37

Expected benefit payments for the next ten years are as follows:
Primary U.S. and
Non-U.S. Defined Non-Qualified Post-Retirement
(In millions) Benefit Plans SERPs Plan_____________ ____________ _____________
2007 $ 43 $ 7 $ 8
2008 32 6 8
2009 29 5 7
2010 29 6 7
2011 28 10 7
2012–2016 153 37 32
The accumulated benefit obligation for all of our U.S. defined benefit pension plans was $613 million and $581
million at December 31, 2006, and 2005, respectively.
To develop the assumption of the expected long-term rate of return on plan assets, we considered the histori-
cal returns and the future expectations for returns for each asset class, as well as the target asset allocation of the
pension portfolio. This analysis resulted in the determination of the assumed long-term rate of return on plan
assets of 8.00% for the year ended December 31, 2006.
For the tax-qualified U.S. defined benefit pension plan, the asset allocation as of December 31, 2006 and 2005,
and the strategic target allocation for 2007, by asset category, were as follows:
ASSET CATEGORY
Strategic Target Percentage of Plan
Allocation Assets at December 31,_______________ ______________________
2007 2006 2005______ ______ ______
Equity securities 45% 46% 59%
Fixed income securities 45 45 29
Other 10 9 12______ ______ ______
Total 100% 100% 100%______ ______ ____________ ______ ______
The preceding strategic target asset allocation was last amended effective July 31, 2006. Consistent with that tar-
get allocation, the plan should generate a real return above inflation, and superior to that of a benchmark index
consisting of a combination of appropriate capital markets indices weighted in the same proportions as the plan’s
strategic target asset allocation. Equities included domestic and international publicly-traded common, preferred
and convertible securities. Fixed income securities included domestic and international corporate and govern-
ment debt securities, as well as asset-backed securities and private debt. The “other” category included real estate,
alternative investments and cash and cash equivalents. Derivative financial instruments are an acceptable alterna-
tive to investing in these types of securities, but may not be used to leverage the plan’s portfolio.
Expected employer contributions to the tax-qualified U.S. defined benefit pension plan, SERPs and post-
retirement plan for the year ending December 31, 2007 are $14 million, $7 million and $8 million, respectively.
DCRB Comprehensive Annual Financial Report Volume II Notes to Consolidated Financial Statements
38

State Street has unfunded S ERPs that provide certain officers with defined pension benefits in excess of qualifiedplan limits imposed by U.S. federal tax law. Information for the SERPs was as follows for the years endedDecember 31:
Non-Qualified SERPs(In millions) 2006 2005Benefit Obligations:Beginning of year.. $ 107 $ 99Service cost 6 4Interest cost. 7 5Actuarial loss. 24 11Benefits paid (6) (8)Settlements — (8)Plan amendments.. 4 4_______ _______
End of year $ 142 $ 107_______ ______________ _______
Accrued Benefit Expense:
Funded status (plan assets less benefit obligations) $ (142) $ (107)
Net actuarial loss.. N/A 39
Prior service cost... N/A 17_______ _______
Net accrued benefit expense. $ (142) $ (51)_______ _______
Amounts Recognized in the Consolidated Statement of Condition:Accrued benefit liability N/A $ (78)Intangible assets N/A 20Accumulated other comprehensive loss. N/A 7Non-current assets. — N/ACurrent liabilities.. $ (7) N/ANon-current liabilities. (135) N/A_______ _______
Net accrued amount recognized in statement of condition $ (142) $ (51)_______ _______
Amounts Recognized in Accumulated Other Comprehensive Income:Initial net obligation — N/APrior service cost $ (19) N/ANet loss (59) N/A_______ _______
Accumulated other comprehensive loss. $ (78) N/ACumulative employer contributions in excess of net periodic benefit cost (64) N/A_______ _______Net obligation recognized in statement of condition. $ (142) N/A_______ _______
Determination of Adjustment related to adoption of SFAS No. 158:Liability before adoption of the funded status provisions of SFAS No. 158 $ 32 $ 27Actual intangible asset. 18 20Accumulated other comprehensive loss before adoption of funded status recognition provisions of SFAS No. 158 14 7Transition obligation after adoption of the funded status provisions of SFAS No. 158 — N/APrior service cost 19 N/ANet loss 59 N/A_______ _______Accumulated other comprehensive loss after adoption of funded status recognition provisions of SFAS No. 158 $ 78 N/A_______ _______Increase in accumulated other comprehensive loss, before taxes, to r
eflect the adoption of SFAS No. 158 $ 64 N/A_______ _______
Accumulated benefit obligation. $ 96 $ 78Actuarial assumptions:
Assumptions used to determine benefit obligations and periodic benefit costs are consistent withthose noted for the post-retirement plan, with the following exception:Rate of increase for future compensation 4.75% 4.75%
N/A—Disclosure not applicable for period indicated as a result of the adoption of SFAS No. 158.
DCRB Comprehensive Annual Financial Report Volume II Notes to Consolidated Financial Statements
39

Primary U.S. and Non-U.S.Defined Benefit Plans Post-Retirement Plan
(In millions) 2006 2005 2004 2006 2005 2004_____ _____ _____ _____ _____ _____Components of Net Periodic Benefit Cost:Service cost $ 59 $ 50 $ 41 $ 4 $ 3 $ 3Interest cost 39 35 32 5 4 4Assumed return on plan assets (53) (45) (40) — — —Amortization of transition obligation (asset) — — (1) 1 1 1Amortization of prior service cost . (2) (2) (2) — — —Amortization of net loss 17 15 16 2 1 1Net periodic benefit cost 60 53 46 12 9 9Special Events Accounting Expense:Special termination benefits — 1 — — — —Special events accounting expense — 1 — — — —_____ _____ _____ _____ _____ _____Total expense $ 60 $ 54 $ 46 $ 12 $ 9 $ 9_____ _____ _____ _____ _____ __________ _____ _____ _____ _____ _____Estimated amounts that will be amortized from accumulatedother comprehensive income over the next fiscal year:Initial net asset — $ (1)Prior service credit $ 2 —Net loss (14) (1)Estimated amortization $ (12) $ (2)_____ __________ _____
Non-Qualified SERPs___________________(In millions) 2006 2005 2004_____ _____ _____Components of Net Periodic Benefit Cost:Service cost $ 6 $ 4 $ 5Interest cost 7 5 6Amortization of prior service cost 2 2 1Amortization of net loss 4 2 2_____ _____ _____Net periodic benefit cost $ 19 $ 13 $ 14Special Events Accounting Expense:Settlements — 2 1_____ _____ _____Special events accounting expense — 2 1_____ _____ _____Total expense $ 19 $ 15 $ 15_____ _____ __________ _____ _____Estimated amounts that will be amortized from accumulated other comprehensive income over the next fiscal year:Initial net obligation —Prior service cost $ (2)Net loss (4)_____Estimated amortization $ (6)__________
DCRB Comprehensive Annual Financial Report Volume II Notes to Consolidated Financial Statements
40
For those defined benefit plans that had accumulated
benefit obligations in excess of plan assets as of
December 31, 2006 and 2005, the accumulated benefit
obligations were $326 million and $262 million, respec-
tively, and the plan assets were $200 million and $163
million, respectively.
For those defined benefit plans that had projected
benefit obligations in excess of plan assets as of
December 31, 2006 and 2005, the projected benefit obli-
gations were $411 million and $866 million, respective-
ly, and the plan assets were $204 million and $706 mil-
lion, respectively.
If trend rates in health care costs were increased by
1%, the post-retirement benefit obligation as of
December 31, 2006, would have increased 7%, and the
aggregate expense for service and interest costs for 2006
would have increased 13%. Conversely, if trend rates in
health care costs were reduced by 1%, the post-retire-
ment benefit obligation as of December 31, 2006, would
have decreased 6%, and the aggregate expense for serv-
ice and interest costs for 2006 would have decreased
11%.
The following table presents the actuarially deter-
mined expense (income) for our U.S. and non-U.S.
defined benefit plans, SERPs and post-retirement plan
for the years ended December 31:

Certain of our U.S. employees are e ligible to con-
tribute a portion of their pre-tax salary to a 401(k) sav-
ings plan and an Employee Stock Ownership Plan, or
“ESOP.” Our matching portion of these contributions is
paid in cash, and the related expense was $20 million for
2006, $21 million for 2005 and $16 million for 2004. In
addition, employees in certain non-U.S. offices partici-
pate in other local plans. Expenses related to these plans
were $32 million, $39 million and $31 million for 2006,
2005 and 2004, respectively.
The ESOP is a non-leveraged plan. Compensation
cost is equal to the contribution called for by the plan
formula and is equal to the cash contributed for the
purchase of shares on the open market or the fair value
of the shares contributed from trea sury stock.
Dividends on share s held by the ESOP are charged to
retained earnings, and shares are treated as outstanding
for purposes of calculating earnings per share.
Note 18. Occupancy Expense andInformation Systems and C ommunica-tions Expense
Occupancy expense and information systems and com-
munications expense included expense for depreciation
of buildings, leasehold improvements, computers, e
quipment and furniture and fixtures. Total depreciation
expense for the years ended December 31, 2006, 2005
and 2004 was $309 million, $315 million and $301 mil-
lion, respectively.
As of December 31, 2006, accumulated amortization
of assets under capital leases was $83 million.
Amortization of assets recorded under capital leases and
the costs of operating leases for office space are record-
ed in occupancy expense. The costs of operating leases
related to computers and equipment are recorded in
information systems and communications expense.
The following is a summary of future minimum
lease payments under non-cancelable capital and oper-
ating leases as of December 31, 2006:
DCRB Comprehensive Annual Financial Report Volume II Notes to Consolidated Financial Statements
41
(In millions) Capital Leases Operating Leases Total_____________ _________________ ________
2007 $ 51 $ 148 $ 199
2008 52 137 189
2009 52 110 162
2010 52 98 150
2011 52 58 110
Thereafter 615 451 1,066_______ _______ _______
Total minimum lease payments 874 $ 1,002 $ 1,876_______ _______ ______________ _______ _______
Less amount representing interest payments (373)_______
Present value of minimum lease payments $ 501______________

We have entered into non-cancelable operating leases
for premises and equipment. Future minimum rental
commitments in the preceding table have been reduced
by aggregate sublease rental commitments of $151 mil-
lion for operating leases and $64 million for capital leas-
es. Nearly all leases include renewal options.
Total rental expense amounted to $179 million, $181
million and $190 million in 2006, 2005 and
2004,respectively. Rental expense has been reduced by
sublease revenue of $13 million, $10 million and $20
million for the years ended December 31, 2006, 2005
and 2004, respectively. During 2005 and 2004, we
entered into sub-lease agreements for our headquarters
building and other office space in Boston. These sub-
lease agreements resulted in the recognition of charges
to occupancy expense of $26 million and $16 million
for the years ended December 31, 2005 and 2004,
respectively.
DCRB Comprehensive Annual Financial Report Volume II Notes to Consolidated Financial Statements
42
We lease approximately 865,000 square feet at One
Lincoln Street, an office building located in Boston,
Massachusetts, and a related 366,000 square-foot
underground parking garage, under 20-year, non-can-
celable capital leases expiring in September 2023. As of
December 31, 2006 and 2005, an aggregate net book
value of $447 million and $474 million, respectively, for
the capital leases was recorded in premises and equip-
ment in our consolidated statement of condition, and
the related liability was recorded in long-term debt.
Capital lease asset amortization is recorded in occupan-
cy expense over the lease terms. Lease payments are
recorded as a reduction of the liability, with a portion
recorded as imputed interest expense. For the years
ended December 31, 2006 and 2005, interest expense
related to these capital lease obligations, recorded in net
interest revenue, was $37 million and $38 million,
respectively.
Note 19. Other Operating Expenses
The components of other operating expenses were as follows for the years ended December 31:
(In millions) 2006 2005 2004_______ _______ ______
Professional services $157 $ 184 $ 165
Merger, integration and divestiture costs(1) — — 62
Other(2) 361 300 287______ ______ ______
Total other operating expenses $518 $ 484 $ 514______ ______ ____________ ______ ______
(1) Amount represented merger and integration costs related to our acquisition of a substantial portion of
the Global Securities Services, or “GSS,” business of Deutsche Bank AG.
(2) Amount for 2004 included $21 million of restructuring costs incurred in connection with a workforce
reduction.

Note 20. Income Taxes
The components of income tax expense from continuing operations consisted of the following for the years
ended December 31:
(In millions) 2006 2005 2004_______ _______ _______
Current:
Federal $ 328 $185 $ 31
State 82 46 27
Non-U.S. 265 139 157_______ _______ _______
Total current 675 370 215
Deferred:
Federal 27 83 160
State (9) 14 23
Non-U.S. (18) 20 (4)_______ _______ _______
Total deferred — 117 179_______ _______ _______
Total income tax expense from continuing operations $ 675 $ 487 $ 394_______ _______ ______________ _______ _______
DCRB Comprehensive Annual Financial Report Volume II Notes to Consolidated Financial Statements
43
Current and deferred income taxes from continuing
operations for 2005 and 2004 have been reclassified to
reflect tax returns as actually filed. The income tax
expense (benefit) related to net realized securities gains
or losses was $6 million, $(1) million and $10 million
for 2006, 2005 and 2004, respectively. Pre-tax income
from continuing operations attributable to operations
located outside the U. S. was $759 million, $494 million
and $424 million for 2006, 2005 and 2004, respectively.
For those foreign subsidiaries for which accumulated
earnings of the subsidiary are considered to be perma-
nently invested, no provision for deferred U.S. income
taxes is recorded. The total undistributed retained earn-
ings of these subsidiaries was $324 million at December
31, 2006. If the accumulated earnings in these sub-
sidiaries had been temporarily invested, a deferred U.S.
tax liability of $56 million would have been recorded.
Income tax expense from continuing operations for
2006 included an additional provision of $35 million
primarily related to the impact of the Tax Increase
Prevention and Reconciliation Act, or “TIPRA,” on
income generated from certain of our leveraged leases,
more fully described below, and $46 million related to
the potential resolution of issues with the IRS concern-
ing our LILO and SILO transactions. Additional infor-
mation about issues related to LILO and SILO transac-
tions is in Note 10. Income tax expense from continuing
operations for 2004 included a cumulative benefit of
$18 million resulting from a change in the effective state
tax rate applied to leveraged lease transactions.
During 2006, TIPRA repealed the federal income tax
exclusion, effective on January 1, 2007, which was previ-
ously allowed for a portion of the income generated
from certain leveraged leases of aircraft. As a result of
this legislation, and in accordance with existing lease
accounting standards, we recalculated the allocation of
the components of leasing-related income over the
terms of the affected leases and recorded a non-cash
charge to income tax expense of approximately $35 mil-
lion primarily related to the impact of this legislation.

DCRB Comprehensive Annual Financial Report Volume II Notes to Consolidated Financial Statements
44
Significant components of deferred tax liabilities and assets were as follows at December 31:
(In millions) 2006 2005_______ _______
Deferred Tax Liabilities:
Lease financing transactions $1,779 $ 1,735
Foreign currency translation 90 34
Pension — 29
Other 12 —
Operating expenses 62 50______ ______
Total deferred tax liabilities 1,943 1,848
Deferred Tax Assets:
Unrealized losses on available-for-sale securities, net 153 190
Deferred compensation 108 54
Pension 81 —
Unrecognized loss related to discontinued operations — 58
Allowance for loan losses 11 11
Tax carryforwards 1 1
Other 76 12______ ______
Total deferred tax assets 430 326
Valuation allowance for deferred tax assets (1) (1)______ ______
Net deferred tax assets 429 325______ ______
Net deferred tax liabilities $1,514 $ 1,523______ ____________ ______
Management considers the valuation allowance adequate to reduce the total deferred tax asset to an amount
that will more likely than not be realized. At December 31, 2006, we had non-U.S. and state tax loss carryfor-
wards of $1 million that expire beginning in 2007.
A reconciliation of the U.S. s tatutory income tax rate to the effective tax rate based on income from continu-
ing operations before income taxes was as follows for the years ended December 31:
2006 2005 2004______ ______ ______
U.S. federal incom e tax rate 35.0 % 35.0 % 35.0%
Changes from Statutory Rate:
State taxes, net of federal benefit 2.9 3.3 3.7
Tax-exempt interest revenue, net of disallowed interest (1.1) (1.5) (2.2)
Tax credits (1.4) (1.3) (.6)
Foreign tax differential (1.2) (1.0) (1.1)
Provision related to TIPRA 1.8 — —
Provision related to LILO and SILO transactions 2.6 — —
Leveraged lease transactions—cumulative benefit — — (.9)
Other, net (.5) (.5) (.8)_______ _______ _______
Effective tax rate 38.1 % 34.0 % 33.1%_______ _______ ______________ _______ _______
See Note 10 for information about the IRS’s review of our federal income tax returns and contingencies relat-
ed to LILO and SILO transactions.

DCRB Comprehensive Annual Financial Report Volume II Notes to Consolidated Financial Statements
45
Note 21. Earnings Per Share
The following table presents the computation of basic and diluted earnings per share for the years ended
December 31:
2006 2005 2004______ ______ ______
(Dollars in millions, except per share amounts)
Net Income $ 1,106 $ 838 $ 798
Average Shares Outstanding (in thousands):
Basic average shares 331,350 330,361 334,606
Effect of dilutive securities:
Stock options and stock awards 4,349 2,762 3,358
Equity-related financial instruments 33 1,513 1,641_______ _______ _______
Dilutive average shares 335,732 334,636 339,605_______ _______ ______________ _______ _______
Anti-dilutive securities (in thousands)(1) 973 8,791 10,289
Earnings per Share
Basic $ 3.34 $ 2.53 $ 2.38
Diluted 3.29 2.50 2.35
(1) Represents stock options outstanding but not included in the computation of dilut ed average shares because
the exercise prices of the instruments were greater than the average fair value of our common stock during those
periods.
Note 22. Line of Business Information
We report two lines of business: Investment Servicing
and Investment Management. Given our services and
management organization, the results of operations for
these lines of business are not necessarily comparable
with those of other companies, including companies in
the financial services industry.
Investment Servicing provides services for U.S.
mutual funds, collective investment funds worldwide,
corporate and public retirement plans, insurance com-
panies, foundations, endowments, and other invest-
ment pools. Products include custody, accounting, daily
pricing and administration; master trust and master
custody; recordkeeping; foreign exchange, brokerage
and other trading services; securities finance; deposit
and short-term investment facilities; loans and lease
financing; investment manager and hedge fund manag-
er operations outsourcing; and performance, risk and
compliance analytics to support institutional investors.
We provide shareholder services, which include mutual
fund and collective investment fund shareholder
accounting, through 50%-owned affiliates, Boston
Financial Data Services, Inc. and the International
Financial Data Services group of companies.
Investment Management offers a broad array of
services for managing financial assets, including invest-
ment management and investment research, primarily
for institutional investors worldwide. These services
include passive and active U.S. and non-U.S. equity and
f ixed income investment management strategies, and
other related services, such as securities finance.
Revenue and expenses are directly charged or allocat-
ed to the lines of business through management infor-
mation systems. We price our products and services on
the basis of overall customer relationships and other
factors; therefore, revenue may not necessarily reflect
market pricing on products within the business lines in
the same way it would for independent business entities.
Assets and liabilities are allocated according to rules that
support management’s strategic and tactical goals.
Capital is allocated based on risk-weighted assets
employed and management’s judgment. Capital alloca-
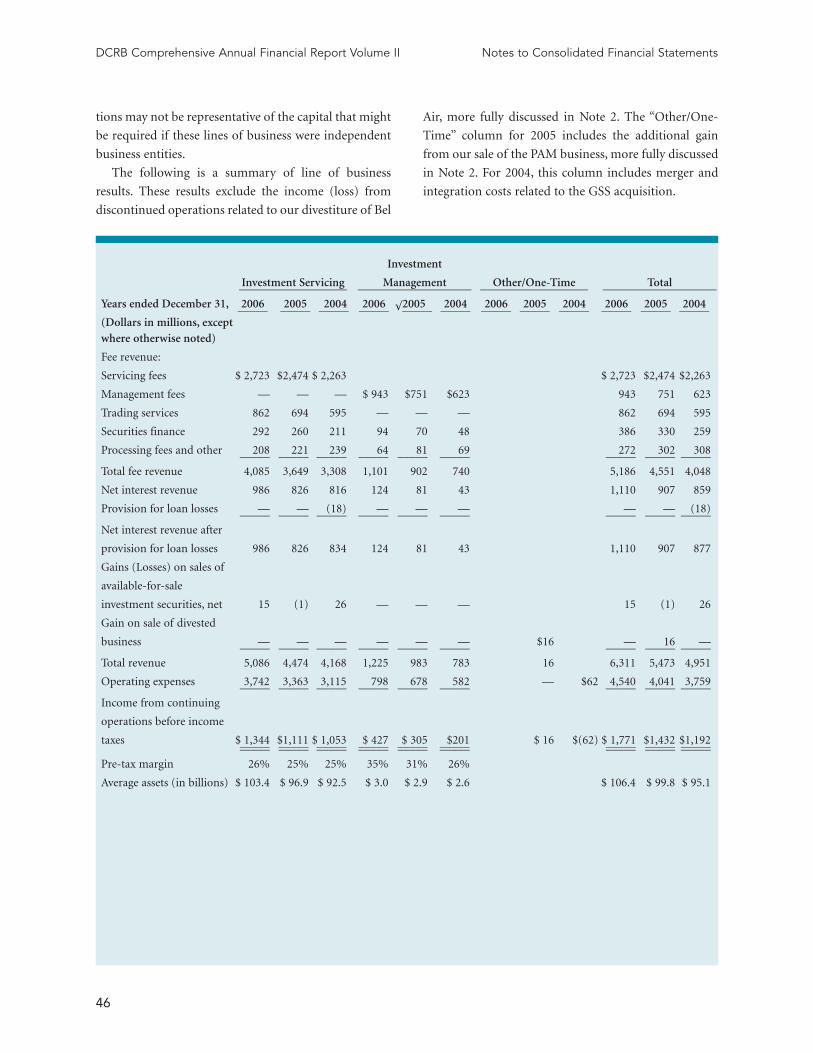
tions may not be representative of the capital that might
be required if these lines of business were independent
business entities.
The following is a summary of line of business
results. These results exclude the income (loss) from
discontinued operations related to our divestiture of Bel
Air, more fully discussed in Note 2. The “Other/One-
Time” column for 2005 includes the additional gain
from our sale of the PAM business, more fully discussed
in Note 2. For 2004, this column includes merger and
integration costs related to the GSS acquisition.
DCRB Comprehensive Annual Financial Report Volume II Notes to Consolidated Financial Statements
46
Investment
Investment Servicing Management Other/One-Time Total__________________ ___________________ __________________ ___________________
Years ended December 31, 2006 2005 2004 2006 2005 2004 2006 2005 2004 2006 2005 2004_____ _____ _____ _____ √_____ _____ _____ _____ _____ _____ _____ _____(Dollars in millions, exceptwhere otherwise noted)
Fee revenue:
Servicing fees $ 2,723 $2,474 $ 2,263 $ 2,723 $2,474 $2,263
Management fees — — — $ 943 $751 $623 943 751 623
Trading services 862 694 595 — — — 862 694 595
Securities finance 292 260 211 94 70 48 386 330 259
Processing fees and other 208 221 239 64 81 69 272 302 308_____ _____ _____ _____ _____ _____ _____ _____ _____
Total fee revenue 4,085 3,649 3,308 1,101 902 740 5,186 4,551 4,048
Net interest revenue 986 826 816 124 81 43 1,110 907 859
Provision for loan losses — — (18) — — — — — (18)_____ _____ _____ _____ _____ _____ _____ _____ _____
Net interest revenue after
provision for loan losses 986 826 834 124 81 43 1,110 907 877
Gains (Losses) on sales of
available-for-sale
investment securities, net 15 (1) 26 — — — 15 (1) 26
Gain on sale of divested
business — — — — — — $16 — 16 —_____ _____ _____ _____ _____ _____ _____ _____ _____
Total revenue 5,086 4,474 4,168 1,225 983 783 16 6,311 5,473 4,951
Operating expenses 3,742 3,363 3,115 798 678 582 — $62 4,540 4,041 3,759_____ _____ _____ _____ _____ _____ _____ _____ _____
Income from continuing
operations before income
taxes $ 1,344 $1,111 $ 1,053 $ 427 $ 305 $201 $ 16 $(62) $ 1,771 $1,432 $1,192_____ _____ _____ _____ _____ _____ _____ _____ __________ _____ _____ _____ _____ _____ _____ _____ _____
Pre-tax margin 26% 25% 25% 35% 31% 26%
Average assets (in billions) $ 103.4 $ 96.9 $ 92.5 $ 3.0 $ 2.9 $ 2.6 $ 106.4 $ 99.8 $ 95.1

Note 23. Non-U.S. Activities
We define non-U.S. activities as those revenue-producing assets and transactions that arise from customers domi-
ciled outside the United States. Due to the nature of our business, precise segregation of U.S. and non-U.S. activ-
ities is not possible. Subjective judgments have been used to arrive at operating results related to non-U.S. activi-
ties, including the application of transfer pricing and asset and liability management policies. Interest expense
allocations are based on the av erage cost of short-term borrowed funds.
The following table summarizes non-U.S. operating results for the years ended December 31, and assets as of
December 31, based on the domicile location of customers:
2006 2005 2004_______ _______ _______
(In millions)
Results of Operations:
Total fee revenue $ 2,349 $ 1,881 $ 1,549
Interest revenue 749 653 660
Interest expense 357 404 393_______ _______ _______
Net interest revenue 392 249 267_______ _______ _______
Total revenue 2,741 2,130 1,816
Operating expenses 1,840 1,589 1,309_______ _______ _______
Income before income taxes 901 541 507
Income tax expense 346 205 191_______ _______ _______
Net income $ 555 $ 336 $ 316_______ _______ ______________ _______ _______
Assets:
Interest-bearing deposits with banks $ 5,193 $11,235 $20,451
Other assets. 19,510 8,800 6,719_______ _______ _______
Total assets $24,703 $20,035 $27,170_______ _______ ______________ _______ _______
Non-U.S. revenue for 2006 included $833 million in the United Kingdom, primarily from our London operations.
DCRB Comprehensive Annual Financial Report Volume II Notes to Consolidated Financial Statements
47

• If no quoted market prices are available, financial
instruments are valued by discounting the expected
cash flow(s) using an estimated current market
interest rate for the financial instrument.
• For derivative financial instruments, fair value is
estimated as the amount at which an asset or liabil-
ity could be bought or sold in a current transaction
between willing parties, other t han in a forced liq-
uidation or sale.
The short maturity of our assets and liabilities results
in a significant number of financial instruments for
which fair value equals or closely approximates the
value reported in our consolidated statement of condi-
tion. These financial instruments are reported in the
following captions in the consolidated statement of
condition: cash and due from ban ks; interest-bearing
deposits with banks; securities purchased under resale
agreements; accrued income receivable; deposits; secu-
rities sold under repurchase agreements; federal funds
purchased; and other short-te rm bo rrowings. The fair
value of trading account assets equals their reported
value. In addition, due to the relatively short-term
nature of our net loans (excluding leases), substantially
all of which are due within one year, we have deter-
mined that fair value approximates the reported value.
Loan commitments have no reported value because
terms are at prevailing market rates.
DCRB Comprehensive Annual Financial Report Volume II Notes to Consolidated Financial Statements
48
Note 24. Fair Values of FinancialInstruments
Fair value estimates are generally subjective in nature,
and are made as of a specific point in time based on the
characteristics of the financial instruments and relevant
market information. Disclosure of fair values is not
required for certain items, such as lease financing, equi-
ty method investments, obligations for pension and
other postretirement plans, premises and equipment,
other intangible assets and income tax assets and liabil-
ities. Accordingly, aggregate fair value amounts present-
ed do not purport to represent, and should not be con-
sidered representative of, our underlying “market” or
franchise value. In addition, because of differences in
methodologies and assumptions used to estimate fair
values, our fair values should not be compared to those
of other financial institutions.
We use the following methods to estimate the fair value
of financial instruments:
• For financial instruments that have quoted market
prices, those quoted prices are used to determine
fair value.
• Financial instruments that have no defined maturi-
ty, have a remaining maturity of 180 days or less, or
reprice frequently to a market rate are assumed to
have a fair value that approximates reported value,
after taking into consideration any applicable cred-
it risk.

The reported value and fair value for other captions in the consolidated statement of condition were
as follows as of December 31:
Reported Value Fair Value
(In millions)
2006:
Financial Assets:
Investment securities:
Available for sale $ 60,445 $ 60,445
Held to maturity 4,457 4,484
Net loans (excluding leases) 6,599 6,599
Unrealized gains on derivative financial instruments—trading 3,006 3,006
Unrealized gains on derivative financial instruments—asset and liability
management 54 54
Financial Liabilities:
Long-term debt 2,616 2 ,695
Unrealized losses on derivative financial instruments—trading 3,026 3,026
Unrealized losses on derivative financial instruments—asset and liability
management
31 31
2005:
Financial Assets:
Investment securities:
Available for sale $ 54,979 $ 54,979
Held to maturity 4,891 4,815
Net loans (excluding leases) 4,134 4,134
Unrealized gains on derivative finan cial instruments—trading 2,038 2,038
Unrealized gains on derivative financial instruments—asset and liability
management
76 76
Financial Liabilities:
Long-term debt 2,659 2,775
Unrealized losses on derivative financial instruments—trading 2,042 2,042
Unrealized losses on derivative financial instruments—asset and liability
management 76 76
DCRB Comprehensive Annual Financial Report Volume II Notes to Consolidated Financial Statements
49

Note 25. Parent Company Financial Statements
STATEMENT OF INCOME
Years ended December 31, 2006 2005 2004_____ _____ _____
(In millions)
Interest on securities purchased under resale agreements $ 559 $ 332 $ 140
Cash dividends from consolidated bank subsidiary 415 570 400
Cash dividends from consolidated non-bank subsidiaries and
unconsolidated affiliates 177 74 50
Other, net 34 42 28______ ______ ______
Total revenue 1,185 1,018 618
Interest on securities sold under repurchase agreements 463 265 112
Other interest expense 146 131 78
Other expenses 36 6 11______ ______ ______
Total expenses 645 402 201
Income tax expense (benefit) (4) 33 11______ ______ ______
Income before equity in undistributed income of subsidiaries and affiliates 544 583 406
Equity in undistributed income (loss) of subsidiaries and affiliates:
Consolidated bank subsidiary 602 165 338
Consolidated non-bank subsidiaries and unconsolidated affiliates (40) 90 54______ ______ ______
Net income $ 1,106 $ 838 $ 798______ ______ ____________ ______ ______
DCRB Comprehensive Annual Financial Report Volume II Notes to Consolidated Financial Statements
50

STATEMENT OF CONDITION
As of December 31, 2006 2005_______ ______
(In millions)
Assets:
Interest-bearing deposits with bank subsidiary $ 841 $ 550
Securities purchased under resale agreements from:
External parties 9,269 8,464
Consolidated non-bank subsidiary and unconsolidated affiliates 21 615
Investment securities available for sale . 103 91
Investments in subsidiaries:
Consolidated bank subsidiary 6,768 6,139
Consolidated non-b ank subsidiaries 940 983
Unconsolidated affiliates 166 164
Notes and other receivables from:
Consolidated bank subsidiary 3 19
Consolidated non-bank subsidiaries and affiliates 120 71
Other assets. 140 70_______ _______
Total assets $ 18,371 $ 17,166_______ ______________ _______
Liabilities:
Securities sold under repurchase agreements $ 8,772 $ 8,624
Commercial paper 998 864
Accrued taxes, expenses and other liabilities due to:
Consolidated bank subsidiary 54 33
Consolidated non-bank subsidiaries 7 7
External parties 167 148
Long-term debt 1,121 1,123
Total liabilities 11,119 10,799
Shareholders’ equity 7,252 6,367_______ _______
Total liabilities and shareholders’ equity $ 18,371 $ 17,166_______ ______________ _______
DCRB Comprehensive Annual Financial Report Volume II Notes to Consolidated Financial Statements
51
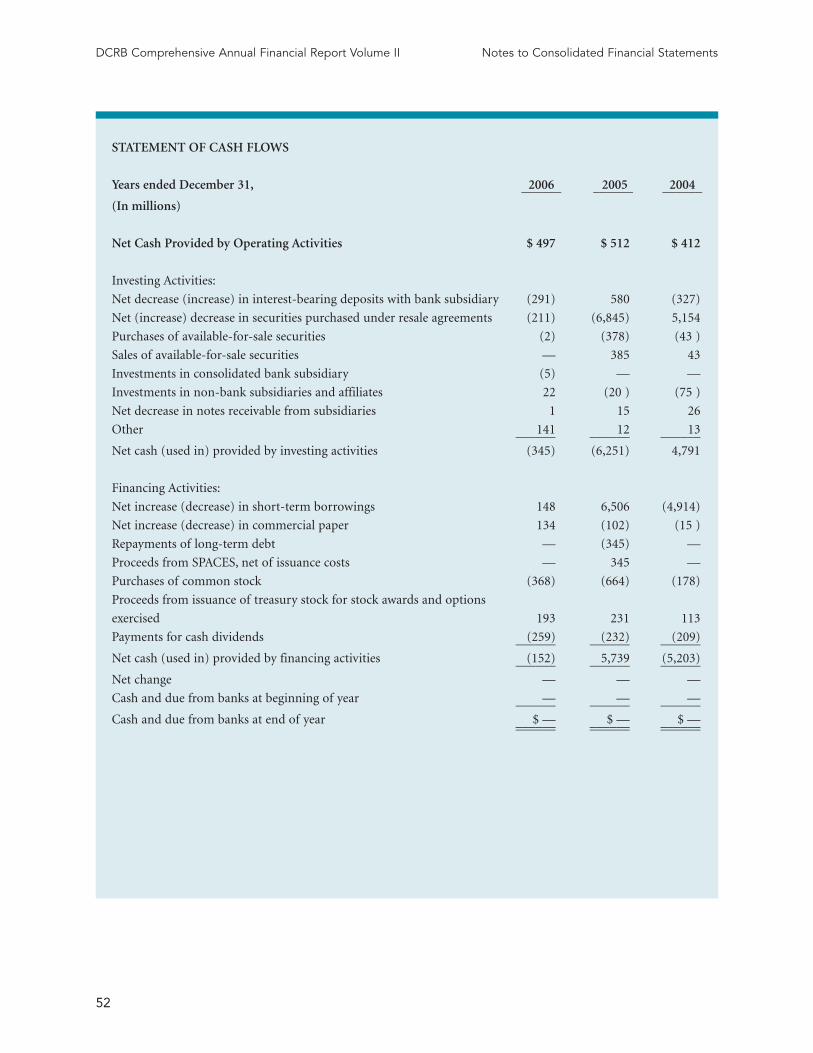
STATEMENT OF CASH FLOWS
Years ended December 31, 2006 2005 2004______ ______ ______
(In millions)
Net Cash Provided by Operating Activities $ 497 $ 512 $ 412
Investing Activities:
Net decrease (increase) in interest-bearing deposits with bank subsidiary (291) 580 (327)
Net (increase) decrease in securities purchased under resale agreements (211) (6,845) 5,154
Purchases of available-for-sale securities (2) (378) (43 )
Sales of available-for-sale securities — 385 43
Investments in consolidated bank subsidiary (5) — —
Investments in non-bank subsidiaries and affiliates 22 (20 ) (75 )
Net decrease in notes receivable from subsidiaries 1 15 26
Other 141 12 13______ ______ ______
Net cash (used in) provided by investing activities (345) (6,251) 4,791
Financing Activities:
Net increase (decrease) in short-term borrowings 148 6,506 (4,914)
Net increase (decrease) in commercial paper 134 (102) (15 )
Repayments of long-term debt — (345) —
Proceeds from SPACES, net of issuance costs — 345 —
Purchases of common stock (368) (664) (178)
Proceeds from issuance of treasury stock for stock awards and options
exercised 193 231 113
Payments for cash dividends (259) (232) (209)______ ______ ______
Net cash (used in) provided by financing activities (152) 5,739 (5,203)______ ______ ______
Net change — — —
Cash and due from banks at beginning of year — — —______ ______ ______
Cash and due from banks at end of year $ — $ — $ —______ ______ ____________ ______ ______
DCRB Comprehensive Annual Financial Report Volume II Notes to Consolidated Financial Statements
52
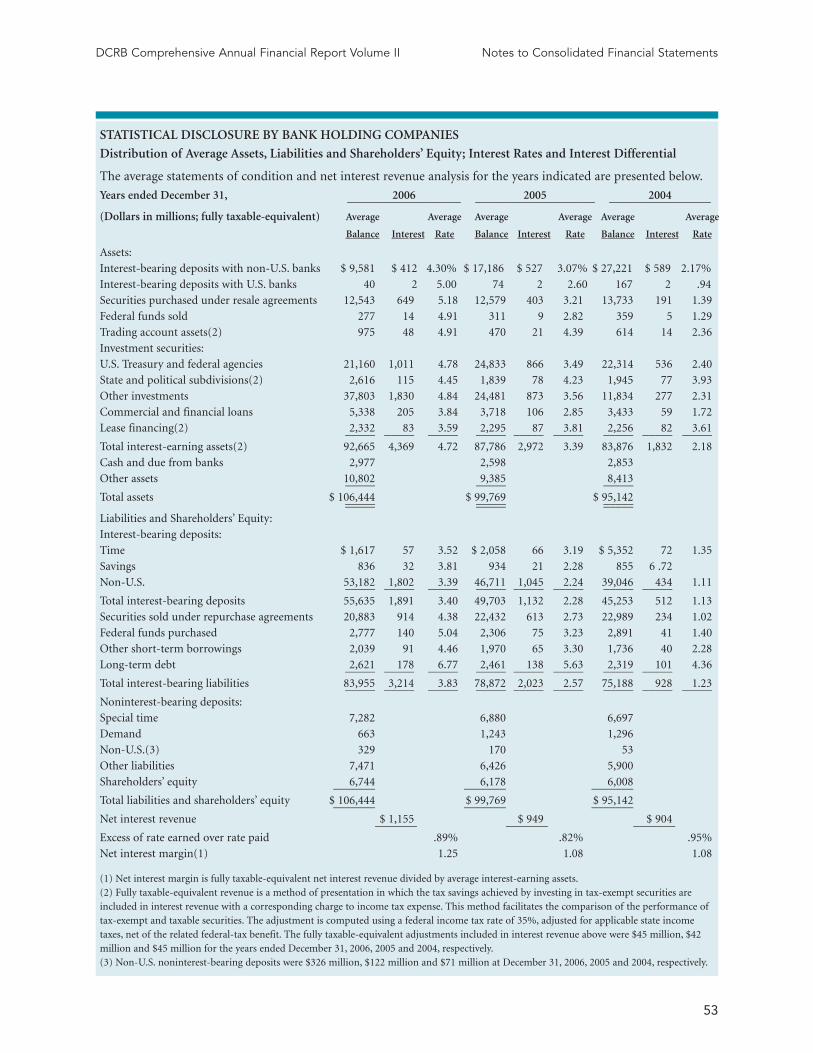
STATISTICAL DISCLOSURE BY BANK HOLDING COMPANIES
Distribution of Average Assets, Liabilities and Shareholders’ Equity; Interest Rates and Interest Differential
The average statements of condition and net interest revenue analysis for the years indicated are presented below.
Years ended December 31, 2006 2005 2004___________________ ____________________ _________________
(Dollars in millions; fully taxable-equivalent) Average Average Average Average Average Average
Balance Interest Rate Balance Interest Rate Balance Interest Rate
Assets:
Interest-bearing deposits with non-U.S. banks $ 9,581 $ 412 4.30% $ 17,186 $ 527 3.07% $ 27,221 $ 589 2.17%
Interest-bearing deposits with U.S. banks 40 2 5.00 74 2 2.60 167 2 .94
Securities purchased under resale agreements 12,543 649 5.18 12,579 403 3.21 13,733 191 1.39
Federal funds sold 277 14 4.91 311 9 2.82 359 5 1.29
Trading account assets(2) 975 48 4.91 470 21 4.39 614 14 2.36
Investment securities:
U.S. Treasury and federal agencies 21,160 1,011 4.78 24,833 866 3.49 22,314 536 2.40
State and political subdivisions(2) 2,616 115 4.45 1,839 78 4.23 1,945 77 3.93
Other investments 37,803 1,830 4.84 24,481 873 3.56 11,834 277 2.31
Commercial and financial loans 5,338 205 3.84 3,718 106 2.85 3,433 59 1.72
Lease financing(2) 2,332 83 3.59 2,295 87 3.81 2,256 82 3.61_____ _____ _____ _____ _____ _____ _____ _____ _____
Total interest-earning assets(2) 92,665 4,369 4.72 87,786 2,972 3.39 83,876 1,832 2.18
Cash and due from banks 2,977 2,598 2,853
Other assets 10,802 9,385 8,413_____ _____ _____
Total assets $ 106,444 $ 99,769 $ 95,142_____ _____ __________ _____ _____
Liabilities and Shareholders’ Equity:
Interest-bearing deposits:
Time $ 1,617 57 3.52 $ 2,058 66 3.19 $ 5,352 72 1.35
Savings 836 32 3.81 934 21 2.28 855 6 .72
Non-U.S. 53,182 1,802 3.39 46,711 1,045 2.24 39,046 434 1.11_____ _____ _____ _____ _____ _____ _____ _____
Total interest-bearing deposits 55,635 1,891 3.40 49,703 1,132 2.28 45,253 512 1.13
Securities sold under repurchase agreements 20,883 914 4.38 22,432 613 2.73 22,989 234 1.02
Federal funds purchased 2,777 140 5.04 2,306 75 3.23 2,891 41 1.40
Other short-term borrowings 2,039 91 4.46 1,970 65 3.30 1,736 40 2.28
Long-term debt 2,621 178 6.77 2,461 138 5.63 2,319 101 4.36_____ _____ _____ _____ _____ _____ _____ _____
Total interest-bearing liabilities 83,955 3,214 3.83 78,872 2,023 2.57 75,188 928 1.23_____ _____ _____ _____ _____ _____ _____ _____ _____
Noninterest-bearing deposits:
Special time 7,282 6,880 6,697
Demand 663 1,243 1,296
Non-U.S.(3) 329 170 53
Other liabilities 7,471 6,426 5,900
Shareholders’ equity 6,744 6,178 6,008_______ _______ _______
Total liabilities and shareholders’ equity $ 106,444 $ 99,769 $ 95,142_______ _______ _______
Net interest revenue $ 1,155 $ 949 $ 904_______ _______ _______
Excess of rate earned over rate paid .89% .82% .95%
Net interest margin(1) 1.25 1.08 1.08
(1) Net interest margin is fully taxable-equivalent net interest revenue divided by average interest-earning assets.(2) Fully taxable-equivalent revenue is a method of presentation in which the tax savings achieved by investing in tax-exempt securities are included in interest revenue with a corresponding charge to income tax expense. This method facilitates the comparison of the performance oftax-exempt and taxable securities. The adjustment is computed using a federal income tax rate of 35%, adjusted for applicable state income taxes, net of the related federal-tax benefit. The fully taxable-equivalent adjustments included in interest revenue above were $45 million, $42 million and $45 million for the years ended December 31, 2006, 2005 and 2004, respectively.(3) Non-U.S. noninterest-bearing deposits were $326 million, $122 million and $71 million at December 31, 2006, 2005 and 2004, respectively.
DCRB Comprehensive Annual Financial Report Volume II Notes to Consolidated Financial Statements
53
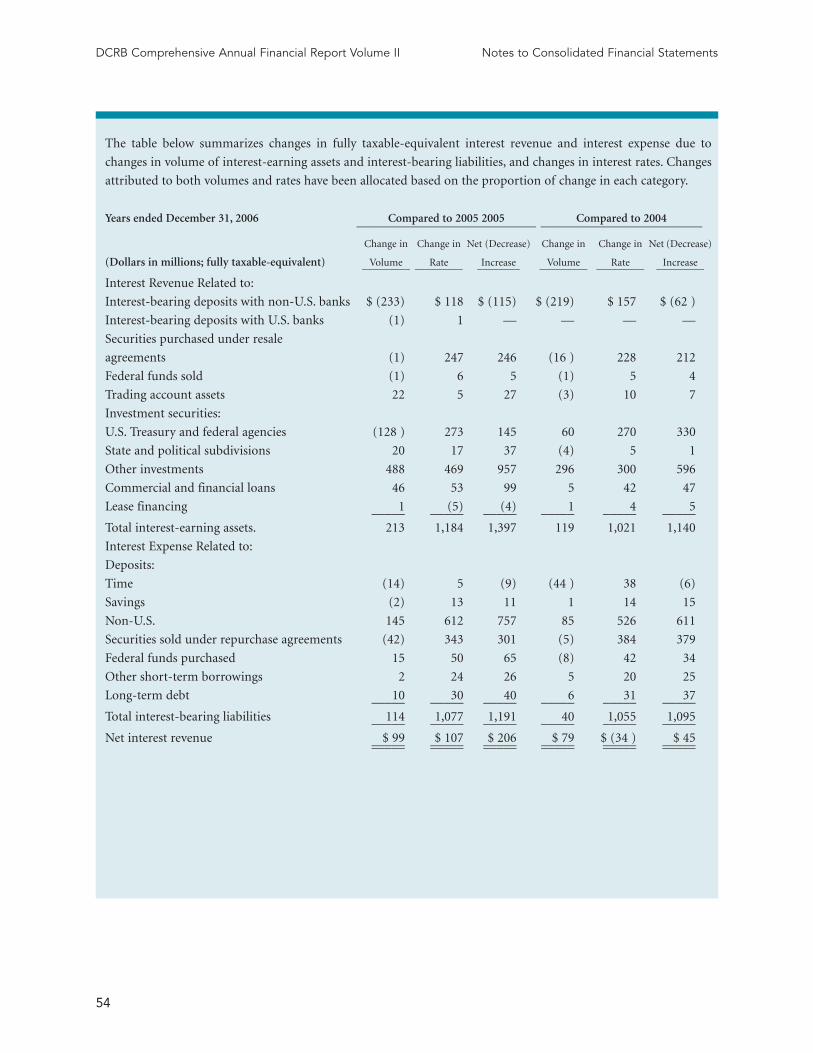
The table below summarizes changes in fully taxable-equivalent interest revenue and interest expense due to
changes in volume of interest-earning assets and interest-bearing liabilities, and changes in interest rates. Changes
attributed to both volumes and rates have been allocated based on the proportion of change in each category.
Years ended December 31, 2006 Compared to 2005 2005 Compared to 2004______________________________ ___________________________
Change in Change in Net (Decrease) Change in Change in Net (Decrease)
(Dollars in millions; fully taxable-equivalent) Volume Rate Increase Volume Rate Increase_________ _________ ________ _________ _________ _________
Interest Revenue Related to:
Interest-bearing deposits with non-U.S. banks $ (233) $ 118 $ (115) $ (219) $ 157 $ (62 )
Interest-bearing deposits with U.S. banks (1) 1 — — — —
Securities purchased under resale
agreements (1) 247 246 (16 ) 228 212
Federal funds sold (1) 6 5 (1) 5 4
Trading account assets 22 5 27 (3) 10 7
Investment securities:
U.S. Treasury and federal agencies (128 ) 273 145 60 270 330
State and political subdivisions 20 17 37 (4) 5 1
Other investments 488 469 957 296 300 596
Commercial and financial loans 46 53 99 5 42 47
Lease financing 1 (5) (4) 1 4 5_____ _____ _____ _____ _____ _____
Total interest-earning assets. 213 1,184 1,397 119 1,021 1,140
Interest Expense Related to:
Deposits:
Time (14) 5 (9) (44 ) 38 (6)
Savings (2) 13 11 1 14 15
Non-U.S. 145 612 757 85 526 611
Securities sold under repurchase agreements (42) 343 301 (5) 384 379
Federal funds purchased 15 50 65 (8) 42 34
Other short-term borrowings 2 24 26 5 20 25
Long-term debt 10 30 40 6 31 37_____ _____ _____ _____ _____ _____
Total interest-bearing liabilities 114 1,077 1,191 40 1,055 1,095_____ _____ _____ _____ _____ _____
Net interest revenue $ 99 $ 107 $ 206 $ 79 $ (34 ) $ 45_____ _____ _____ _____ _____ __________ _____ _____ _____ _____ _____
DCRB Comprehensive Annual Financial Report Volume II Notes to Consolidated Financial Statements
54

Quarterly Summarized Financial Information
(Dollars and shares in millions, 2006 Quarters 2005 Quarters____________________________ _____________________________
except per share amounts) Fourth Third Second First Fourth Third Second First_______ ______ _______ _______ _______ _______ _______ _______
Consolidated Statement of Income:
Total fee revenue $ 1,305 $ 1,246 $ 1,375 $ 1,260 $ 1,176 $ 1,135 $ 1,143 $ 1,097
Interest revenue 1,226 1,103 1,034 961 861 773 693 603
Interest expense 910 837 772 695 619 537 476 391_____ _____ _____ _____ _____ _____ _____ _____
Net interest revenue 316 266 262 266 242 236 217 212
Provision for loan losses — — — — — — — —_____ _____ _____ _____ _____ _____ _____ _____
Net interest revenue after
provision for loan losses . 316 266 2 62 266 242 236 217 212
Gains (Losses) on sales of available-for-sale
securities, net 1 3 14 (3) (2) 1 1 (1)
Gain on sale of divested business — — — — — 16 — —_____ _____ _____ _____ _____ _____ _____ _____
Total revenue 1,622 1,515 1,651 1,523 1,416 1,388 1,361 1,308
Total operating expenses 1,178 1,090 1,176 1,096 1,039 1,008 1,028 966_____ _____ _____ _____ _____ _____ _____ _____
Income from continuing
operations before income taxes 444 425 475 427 377 380 333 342
Income tax expense from continuing operations 135 147 248 145 128 130 113 116
Income from continuing operations 309 278 227 282 249 250 220 226
Net income (loss) from discontinued operations — — — 10 — (107) — —_____ _____ _____ _____ _____ _____ _____ _____
Net income $ 309 $ 278 $ 227 $ 292 $ 249 $ 143 $ 220 $ 226_____ _____ _____ _____ _____ _____ _____ _____
Earnings Per Share From
Continuing Operations:
Basic $ .93 $ .84 $ .69 $ .85 $ .75 $ .76 $ .67 $ .68
Diluted .91 .83 .68 .84 .74 .75 .66 .67
Income (Loss) Per Share From
Discontinued Operations:
Basic $ — $ — $ — $ .03 $ — $ (.33) $ — $ —
Diluted — — — .03 — (.32) — —
Earnings Per Share:
Basic $ .93 $ .84 $ .69 $ .88 $ .75 $ .43 $ .67 $ .68
Diluted 91 .83 .68 .87 .74 .43 .66 .67
Average Shares Outstanding:
Basic 331 330 331 333 331 329 330 332
Diluted 337 336 336 337 337 334 334 335
Dividends per share $ .21 $ .20 $ .20 $ .19 $ .19 $ .18 $ .18 $ .17
Stock price:
High $ 68.36 $ 63.67 $ 65.91 $ 62.95 $ 59.80 $ 51.50 $ 51.93 $ 49.25
Low 61.50 54.49 56.86 55.44 48.47 47.20 40.62 42.60
Close 67.44 62.40 58.09 60.43 55.44 48.92 48.25 43.72
DCRB Comprehensive Annual Financial Report Volume II Notes to Consolidated Financial Statements
55

56

DCRB Comprehensive Annual Financial Report Volume II Schedule of Reportable Transactions
Disrict of Columbia Teachers’ Retirement FundSchedule of Five Percent Reportable Series of TransactionsYear Ended September 30, 2006
Each transaction with State Street Bank and Trust Company as disclosed in this schedule represents a “reportable
transaction” as that term is defined by D.C. Code §1-903.06(b)(3).
57

DCRB Comprehensive Annual Financial Report Volume II Schedule of Reportable Transactions
58

DCRB Comprehensive Annual Financial Report Volume II Schedule of Reportable Transactions
59

60
DCRB Comprehensive Annual Financial Report Volume II Schedule of Reportable Transactions

61
DCRB Comprehensive Annual Financial Report Volume II Schedule of Reportable Transactions
Police Officers’ and Firefighters’ Retirement FundSchedule of Five Percent Reportable Series of TransactionsYear Ended September 30, 2006
Each transaction with State Street Bank and Trust Company as disclosed in this schedule represents a “reportable
transaction” as that term is defined by D.C. Code §1-903.06(b)(3).

62
DCRB Comprehensive Annual Financial Report Volume II Schedule of Reportable Transactions
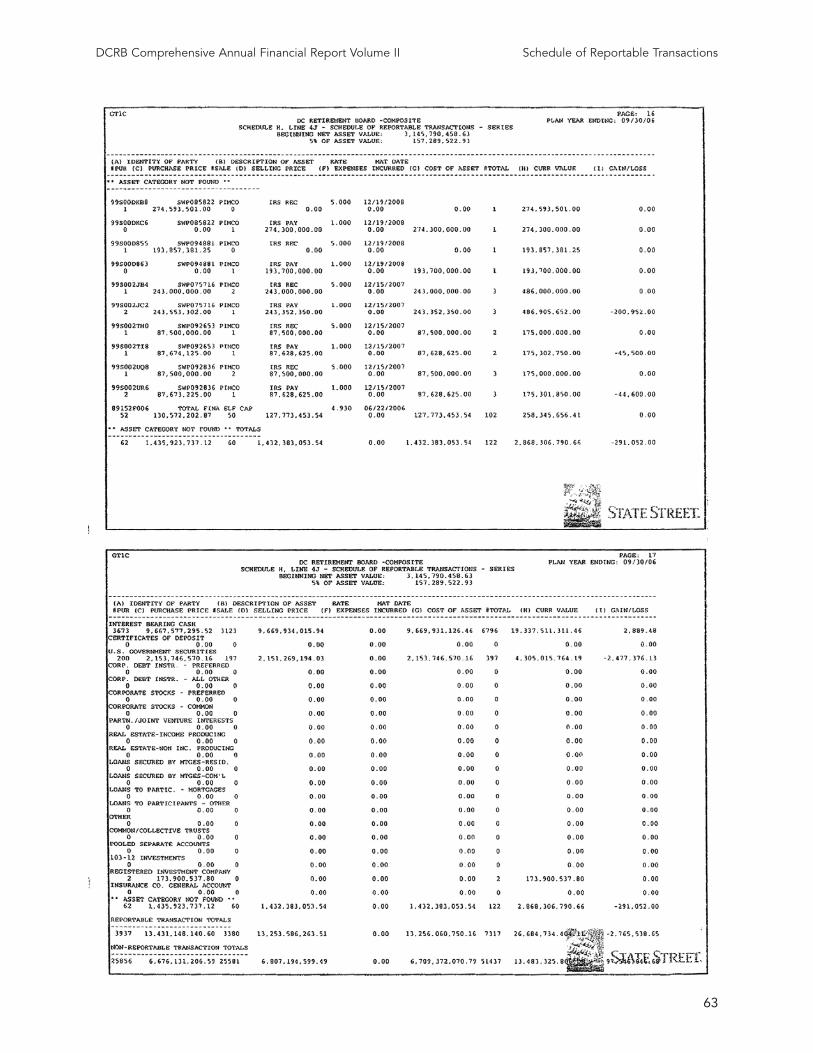
63
DCRB Comprehensive Annual Financial Report Volume II Schedule of Reportable Transactions

64
DCRB Comprehensive Annual Financial Report Volume II Schedule of Reportable Transactions

65
Schedule of Transactions with Parties of Interest
VENDOR NAME INVOICE AMOUNT DESCRIPTION OF SERVICE
A B C
BARBARA DAVIS BLUM $10,197 TRUSTEE COMPENSATION
WILLIAM SIMONS $8,140 TRUSTEE COMPENSATION
LYLE BLACHARD $2,577 TRUSTEE COMPENSATION
SHIREEN DODSON $10,000 TRUSTEE COMPENSATION
JOAN PARROTT-FONSECA $9,689 TRUSTEE COMPENSATION
MICHAEL J. WARREN $8,859 TRUSTEE COMPENSATION
MARY COLLINS $4,683 TRUSTEE COMPENSATION
JUDITH MARCUS $9,969 TRUSTEE COMPENSATION
GEORGE SUTER $6,256 TRUSTEE COMPENSATION
DARRICK ROSS $9,639 TRUSTEE COMPENSATION
BRIAN K. LEE $9,546 TRUSTEE COMPENSATION
THOMAS TIPPETT $6,467 TRUSTEE COMPENSATION
ALLIANCE CAPITAL MANAGEMENT $107,471 INVESTMENT MANAGERS
ARIEL CAPITAL MANAGEMENT $220,858 INVESTMENT MANAGERS
BACHOW INVESTMENT PARTNERS III L.P. $13,299 INVESTMENT MANAGERS
BLACKSTONE CAPITAL PARTNERS IV, L.P. $2,376 INVESTMENT MANAGERS
BROWN CAPITAL MANAGEMENT $604,272 INVESTMENT MANAGERS
CAPITAL GARDIAN TRUST COMPANY $1,752,799 INVESTMENT MANAGERS
EDGAR LOMAX COMPANY $532,228 INVESTMENT MANAGERS
EACM ADVISORS $764,002 INVESTMENT MANAGERS
FAIRVIEW CAPITAL PARTNERS II, L.P $92,740 INVESTMENT MANAGERS
GRYPHON INTERNATIONAL INVESTMENT CORP $913,547 INVESTMENT MANAGERS
HEITMAN, LLC $128,907 INVESTMENT MANAGERS
HUGHES CAPITAL MANAGEMENT, INC $218,611 INVESTMENT MANAGERS
LSV ASSET MANAGEMENT $1,073,109 INVESTMENT MANAGERS
MCKINLEY CAPITAL MANAGEMENT INC $627,828 INVESTMENT MANAGERS
PACIFIC INVESTMENT MANAGEMENT CO $920,329 INVESTMENT MANAGERS
RSTW PARTNERS III, L.P. $61,817 INVESTMENT MANAGERS
SANDS CAPITAL MANAGEMENT INC $640,287 INVESTMENT MANAGERS
THOMPSON, SIEGAL & WALMSLEY $958,229 INVESTMENT MANAGERS
WESTERN ASSET MANAGEMENT CO $674,599 INVESTMENT MANAGERS
WATSON, WYATT & COMPANY $271,667 INVESTMENT MANAGERS
PATHEON VENTURES $85,030 INVESTMENT MANAGERS
PLEXUS GROUP $20,000 INVESTMENT MANAGERS
DCRB Comprehensive Annual Financial Report Volume II Schedule of Transactions with Parties of Interest

66
WILSHIRE ASSOCIATES INC $36,000 INVESTMENT MANAGERS
STATE STREET BANK & TRUST Co $605,186 INVESTMENT MANAGERS
MACK CALI ($24,401) SERVICE PROVIDERS
ALICIA TRAYNHAM ($100) SERVICE PROVIDERS
TUITION REIMBURSEMENT ($50) SERVICE PROVIDERS
FLORENCE JONES ($12) SERVICE PROVIDERS
ALLISON KELLY $13 SERVICE PROVIDERS
FORBES $30 SERVICE PROVIDERS
NATIONAL CAP AREA PARAL ASSN $70 SERVICE PROVIDERS
LOVELY SUSAN THOMAS $72 SERVICE PROVIDERS
ZACHARY BOOKS $75 SERVICE PROVIDERS
WORLDWIDE EMPLOYEE BEN. NTWK. $100 SERVICE PROVIDERS
ZIERER VISA SERVICES/S. DODSON $121 SERVICE PROVIDERS
SURE-FIT SECURITY $125 SERVICE PROVIDERS
CAPITAL SERVICES AND SUPPLIES $130 SERVICE PROVIDERS
KATHERINE MARSHALL $132 SERVICE PROVIDERS
JONES, DAY $150 SERVICE PROVIDERS
LORNA TUCKER-JACKSON $156 SERVICE PROVIDERS
HEWLETT PACKARD $197 SERVICE PROVIDERS
DC BAR PSAC $225 SERVICE PROVIDERS
NASP $225 SERVICE PROVIDERS
SHIREEN DODSON $229 SERVICE PROVIDERS
DAVID BAILEY $233 SERVICE PROVIDERS
PALM FACILITY SERVICES $240 SERVICE PROVIDERS
UNILUX LTD $254 SERVICE PROVIDERS
BARRONS $273 SERVICE PROVIDERS
A-S-K ASSOCIATES $275 SERVICE PROVIDERS
WASHINGTON POST $306 SERVICE PROVIDERS
PUBLIC PENSION FINANCIAL FORUM $325 SERVICE PROVIDERS
HOWE FURNITURE CORP $399 SERVICE PROVIDERS
WILLIAM SIMONS $408 SERVICE PROVIDERS
GOVERNMENT FINANCIAL OFFICERS ASSOCIATION $420 SERVICE PROVIDERS
ABSOLUTE ACRYLIC INC $435 SERVICE PROVIDERS
CCH INC $492 SERVICE PROVIDERS
MAPS $500 SERVICE PROVIDERS
PRM CONSULTING, INC. $500 SERVICE PROVIDERS
MICHAEL SLAVIN $507 SERVICE PROVIDERS
FINANCIAL TIMES $528 SERVICE PROVIDERS
DCRB Comprehensive Annual Financial Report Volume II Schedule of Transactions with Parties of Interest
VENDOR NAME INVOICE AMOUNT DESCRIPTION OF SERVICE
A B C

67
EXODUS AUTOMATIC, INC. $543 SERVICE PROVIDERS
US BUSINESS INTERIORS $545 SERVICE PROVIDERS
FALCON PRODUCTS $547 SERVICE PROVIDERS
RICHARD WORTHAM $596 SERVICE PROVIDERS
PAMELA ASHFORD-GLENN $609 SERVICE PROVIDERS
INTL. FOUNDATION OF EMPLOYMENT $675 SERVICE PROVIDERS
NAPPA $715 SERVICE PROVIDERS
NATL ASS OF PUBLIC PENSION $745 SERVICE PROVIDERS
PRISM $775 SERVICE PROVIDERS
SHERYL SUMMA $783 SERVICE PROVIDERS
JOAN PASSERINO $813 SERVICE PROVIDERS
SPRINT $939 SERVICE PROVIDERS
PICA DELI GOURMET $965 SERVICE PROVIDERS
THOMPSON WEST $1,082 SERVICE PROVIDERS
GOVCONNECTION, INC. $1,116 SERVICE PROVIDERS
LAWSONS GOURMET#2 $1,172 SERVICE PROVIDERS
SOCIETY FOR HUMAN RESOURCE MGMT. $1,180 SERVICE PROVIDERS
NCTR $1,200 SERVICE PROVIDERS
SERVICE EXCELLENCE INC $1,200 SERVICE PROVIDERS
NCPERS $1,290 SERVICE PROVIDERS
IRON MOUNTAIN $1,324 SERVICE PROVIDERS
CRAIN COMMUNICATION $1,408 SERVICE PROVIDERS
ASPEN PUBLISHERS $1,439 SERVICE PROVIDERS
IMRAN CHAUDRY $1,616 SERVICE PROVIDERS
DUTCHMILL CATERERS $1,744 SERVICE PROVIDERS
STEELCASE $1,960 SERVICE PROVIDERS
STANFORD UNIVERSITY $1,970 SERVICE PROVIDERS
PREMIER PLANTSCAPES $2,036 SERVICE PROVIDERS
DARRICK ROSS $2,055 SERVICE PROVIDERS
THOMAS TIPPETT $2,098 SERVICE PROVIDERS
PHOENIX GRAPHICS $2,200 SERVICE PROVIDERS
CINGULAR INTERACTIVE $2,254 SERVICE PROVIDERS
NPEA $2,285 SERVICE PROVIDERS
NATL ASSC OF STATE RETIREMENT ADMIN $2,400 SERVICE PROVIDERS
JOAN PARROTT-FONSECA $2,409 SERVICE PROVIDERS
OFFICE MOVERS $2,918 SERVICE PROVIDERS
IMPREST FUND $2,942 SERVICE PROVIDERS
COUNCIL OF INST. INVESTORS $3,000 SERVICE PROVIDERS
DCRB Comprehensive Annual Financial Report Volume II Schedule of Transactions with Parties of Interest
VENDOR NAME INVOICE AMOUNT DESCRIPTION OF SERVICE
A B C
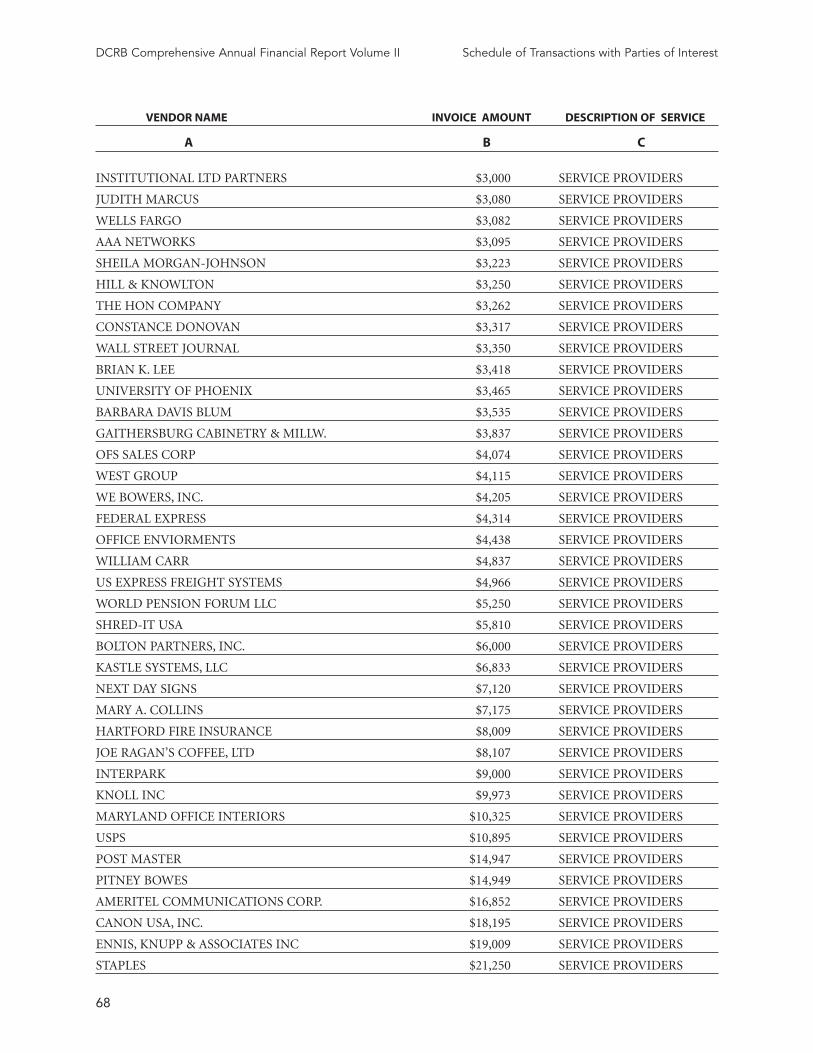
68
INSTITUTIONAL LTD PARTNERS $3,000 SERVICE PROVIDERS
JUDITH MARCUS $3,080 SERVICE PROVIDERS
WELLS FARGO $3,082 SERVICE PROVIDERS
AAA NETWORKS $3,095 SERVICE PROVIDERS
SHEILA MORGAN-JOHNSON $3,223 SERVICE PROVIDERS
HILL & KNOWLTON $3,250 SERVICE PROVIDERS
THE HON COMPANY $3,262 SERVICE PROVIDERS
CONSTANCE DONOVAN $3,317 SERVICE PROVIDERS
WALL STREET JOURNAL $3,350 SERVICE PROVIDERS
BRIAN K. LEE $3,418 SERVICE PROVIDERS
UNIVERSITY OF PHOENIX $3,465 SERVICE PROVIDERS
BARBARA DAVIS BLUM $3,535 SERVICE PROVIDERS
GAITHERSBURG CABINETRY & MILLW. $3,837 SERVICE PROVIDERS
OFS SALES CORP $4,074 SERVICE PROVIDERS
WEST GROUP $4,115 SERVICE PROVIDERS
WE BOWERS, INC. $4,205 SERVICE PROVIDERS
FEDERAL EXPRESS $4,314 SERVICE PROVIDERS
OFFICE ENVIORMENTS $4,438 SERVICE PROVIDERS
WILLIAM CARR $4,837 SERVICE PROVIDERS
US EXPRESS FREIGHT SYSTEMS $4,966 SERVICE PROVIDERS
WORLD PENSION FORUM LLC $5,250 SERVICE PROVIDERS
SHRED-IT USA $5,810 SERVICE PROVIDERS
BOLTON PARTNERS, INC. $6,000 SERVICE PROVIDERS
KASTLE SYSTEMS, LLC $6,833 SERVICE PROVIDERS
NEXT DAY SIGNS $7,120 SERVICE PROVIDERS
MARY A. COLLINS $7,175 SERVICE PROVIDERS
HARTFORD FIRE INSURANCE $8,009 SERVICE PROVIDERS
JOE RAGAN’S COFFEE, LTD $8,107 SERVICE PROVIDERS
INTERPARK $9,000 SERVICE PROVIDERS
KNOLL INC $9,973 SERVICE PROVIDERS
MARYLAND OFFICE INTERIORS $10,325 SERVICE PROVIDERS
USPS $10,895 SERVICE PROVIDERS
POST MASTER $14,947 SERVICE PROVIDERS
PITNEY BOWES $14,949 SERVICE PROVIDERS
AMERITEL COMMUNICATIONS CORP. $16,852 SERVICE PROVIDERS
CANON USA, INC. $18,195 SERVICE PROVIDERS
ENNIS, KNUPP & ASSOCIATES INC $19,009 SERVICE PROVIDERS
STAPLES $21,250 SERVICE PROVIDERS
DCRB Comprehensive Annual Financial Report Volume II Schedule of Transactions with Parties of Interest
VENDOR NAME INVOICE AMOUNT DESCRIPTION OF SERVICE
A B C

69
AUDIOVISUAL WASHINGTON $22,500 SERVICE PROVIDERS
ING LIFE INSURANCE $22,516 SERVICE PROVIDERS
BALMAR PRINTING $22,725 SERVICE PROVIDERS
HILL ENTERPRISES $23,160 SERVICE PROVIDERS
SOURCECORP $27,067 SERVICE PROVIDERS
AMERICAN ARBITRATION ASSN. $29,863 SERVICE PROVIDERS
VERIZON FEDERAL, INC. $30,578 SERVICE PROVIDERS
JGV CONSULTING $31,586 SERVICE PROVIDERS
WMATA $32,628 SERVICE PROVIDERS
FOLIOGRAPH GALLERY $35,501 SERVICE PROVIDERS
KIMBALL INTERNATIONAL $36,335 SERVICE PROVIDERS
PALMER LEGAL STAFFING $39,471 SERVICE PROVIDERS
ORRICK, HERRINGTON, SUCLIFFE $43,955 SERVICE PROVIDERS
ED FRIEND, INC. $46,149 SERVICE PROVIDERS
CITIBANK $47,690 SERVICE PROVIDERS
ROBERT HALF INT $50,838 SERVICE PROVIDERS
THOMPSON, COBB & BAZILLO $51,620 SERVICE PROVIDERS
THE TOWNSEND GROUP $56,250 SERVICE PROVIDERS
MORGAN, LEWIS & BOCKIUS $70,015 SERVICE PROVIDERS
NGEN, LLC $73,653 SERVICE PROVIDERS
KORN/FERRY INTERNATIONAL $82,979 SERVICE PROVIDERS
GROOM LAW GROUP, CHARTERED $94,003 SERVICE PROVIDERS
AON RISK SERVICES $109,204 SERVICE PROVIDERS
THE JOHN AKRIDGE COMPANIES $1,037,182 SERVICE PROVIDERS
TREASURY OF THE PUB DEBT $1,242,492 SERVICE PROVIDERS
Grand Total $15,093,864
DCRB Comprehensive Annual Financial Report Volume II Schedule of Transactions with Parties of Interest
VENDOR NAME INVOICE AMOUNT DESCRIPTION OF SERVICE
A B C
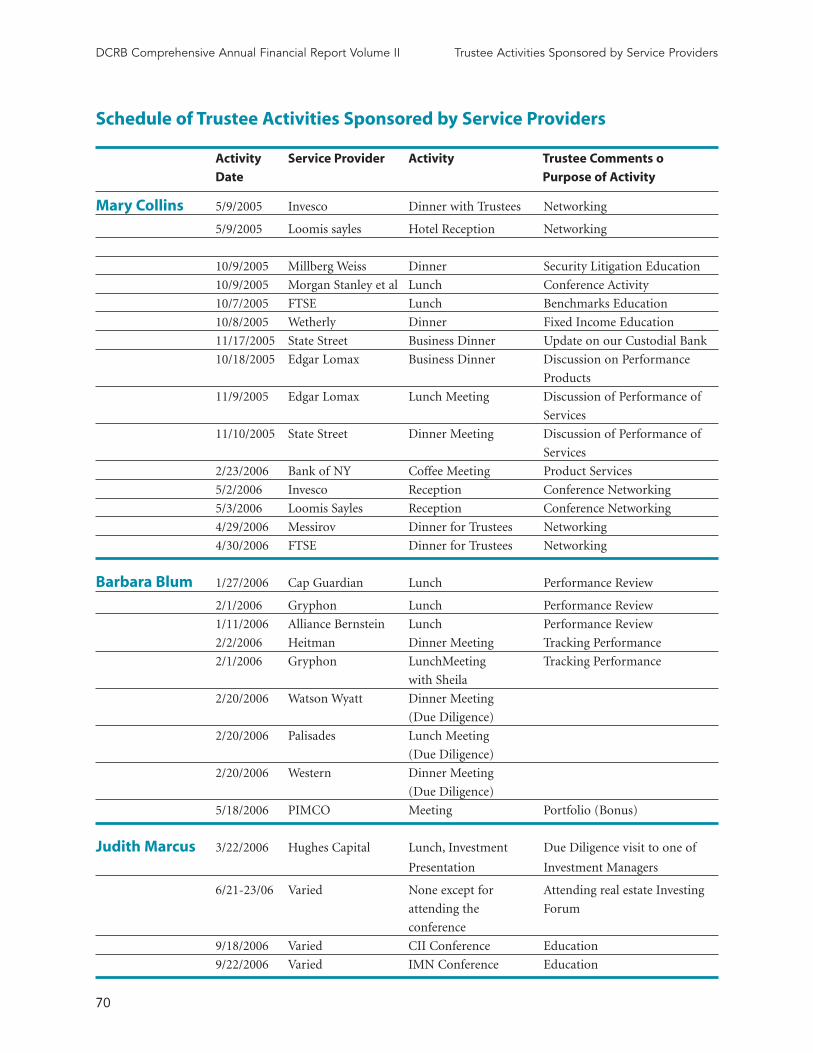
70
Schedule of Trustee Activities Sponsored by Service Providers
Mary Collins 5/9/2005 Invesco Dinner with Trustees Networking
5/9/2005 Loomis sayles Hotel Reception Networking
10/9/2005 Millberg Weiss Dinner Security Litigation Education
10/9/2005 Morgan Stanley et al Lunch Conference Activity
10/7/2005 FTSE Lunch Benchmarks Education
10/8/2005 Wetherly Dinner Fixed Income Education
11/17/2005 State Street Business Dinner Update on our Custodial Bank
10/18/2005 Edgar Lomax Business Dinner Discussion on Performance
Products
11/9/2005 Edgar Lomax Lunch Meeting Discussion of Performance of
Services
11/10/2005 State Street Dinner Meeting Discussion of Performance of
Services
2/23/2006 Bank of NY Coffee Meeting Product Services
5/2/2006 Invesco Reception Conference Networking
5/3/2006 Loomis Sayles Reception Conference Networking
4/29/2006 Messirov Dinner for Trustees Networking
4/30/2006 FTSE Dinner for Trustees Networking
Barbara Blum 1/27/2006 Cap Guardian Lunch Performance Review
2/1/2006 Gryphon Lunch Performance Review
1/11/2006 Alliance Bernstein Lunch Performance Review
2/2/2006 Heitman Dinner Meeting Tracking Performance
2/1/2006 Gryphon LunchMeeting Tracking Performance
with Sheila
2/20/2006 Watson Wyatt Dinner Meeting
(Due Diligence)
2/20/2006 Palisades Lunch Meeting
(Due Diligence)
2/20/2006 Western Dinner Meeting
(Due Diligence)
5/18/2006 PIMCO Meeting Portfolio (Bonus)
Judith Marcus 3/22/2006 Hughes Capital Lunch, Investment Due Diligence visit to one of
Presentation Investment Managers
6/21-23/06 Varied None except for Attending real estate Investing
attending the Forum
conference
9/18/2006 Varied CII Conference Education
9/22/2006 Varied IMN Conference Education
DCRB Comprehensive Annual Financial Report Volume II Trustee Activities Sponsored by Service Providers
Activity Service Provider Activity Trustee Comments o
Date Purpose of Activity

71
Fund Return Data
DCRB Comprehensive Annual Financial Report Volume II Fund Return Data

72
DCRB Comprehensive Annual Financial Report Volume II Fund Return Data
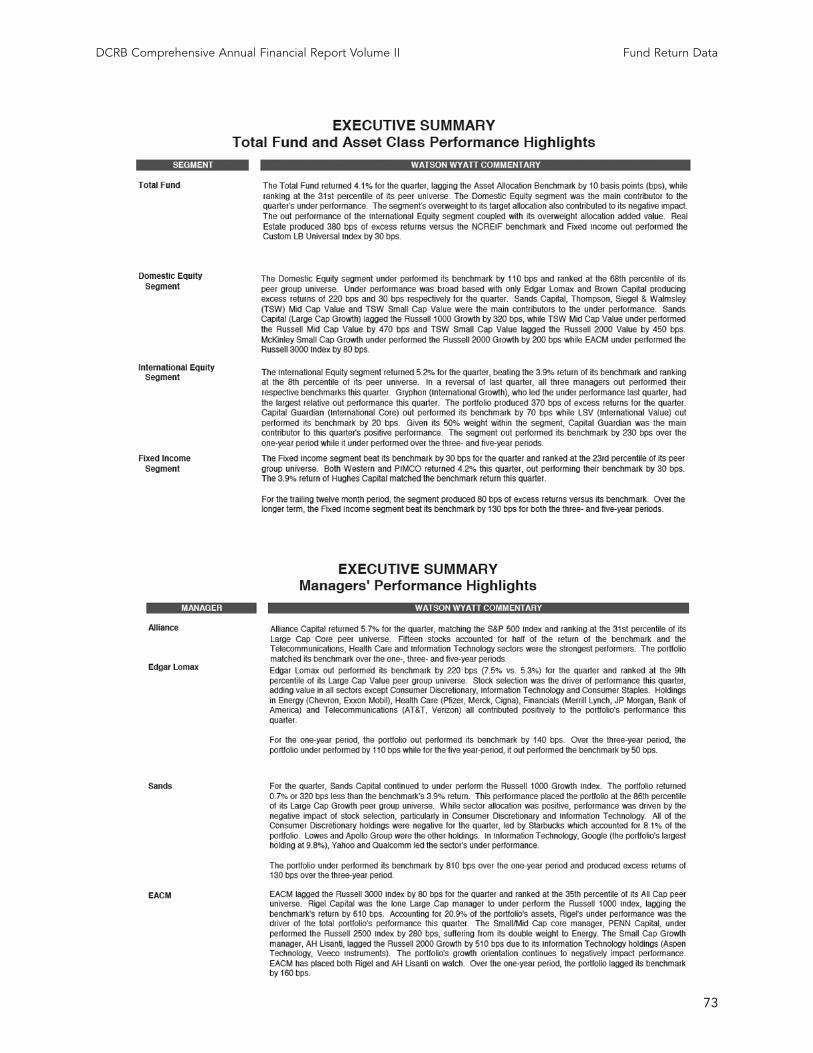
73
DCRB Comprehensive Annual Financial Report Volume II Fund Return Data
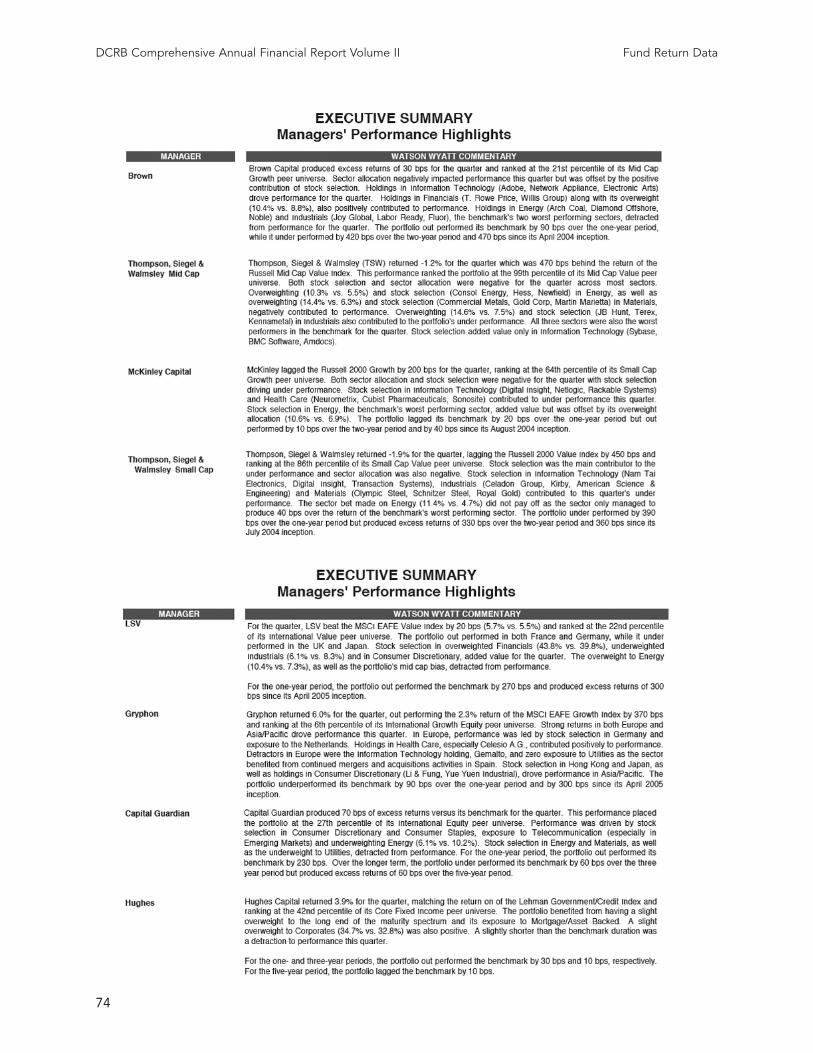
74
DCRB Comprehensive Annual Financial Report Volume II Fund Return Data

75
DCRB Comprehensive Annual Financial Report Volume II Fund Return Data

76
DCRB Comprehensive Annual Financial Report Volume II Fund Return Data

77
DCRB Comprehensive Annual Financial Report Volume II Fund Return Data

78
DCRB Comprehensive Annual Financial Report Volume II Fund Return Data

79
DCRB Comprehensive Annual Financial Report Volume II Fund Return Data

80
DCRB Comprehensive Annual Financial Report Volume II Fund Return Data
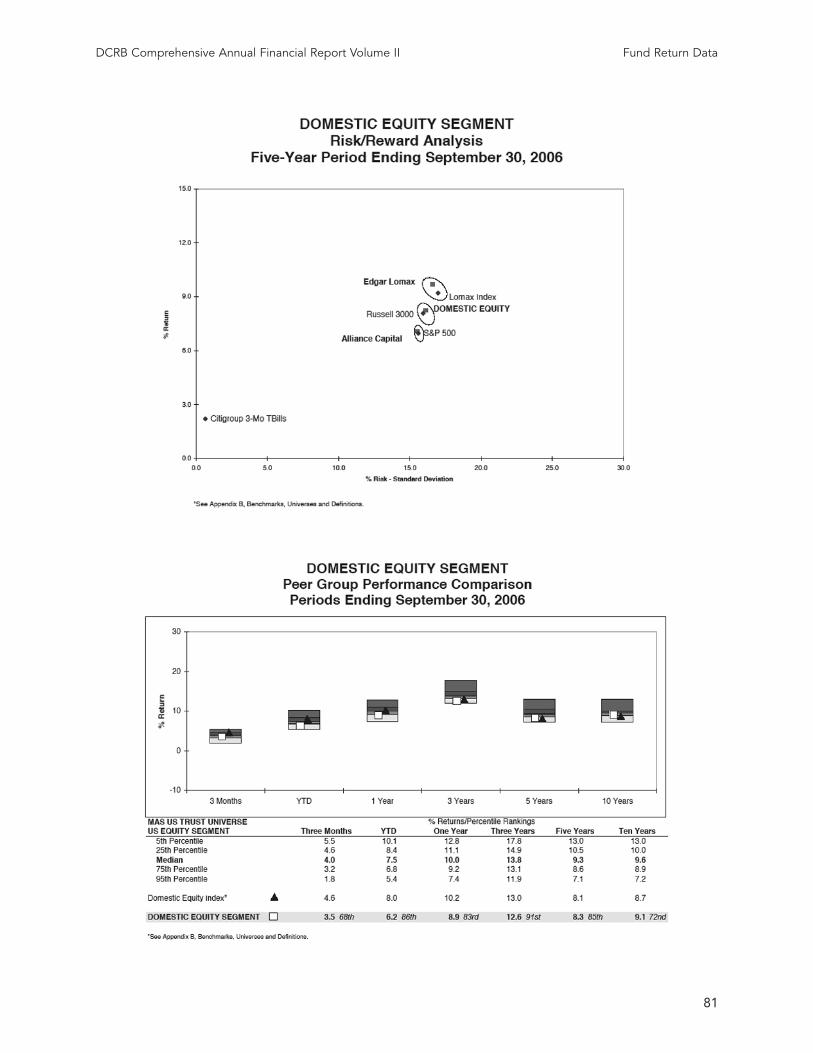
81
DCRB Comprehensive Annual Financial Report Volume II Fund Return Data

82
DCRB Comprehensive Annual Financial Report Volume II Fund Return Data

83
DCRB Comprehensive Annual Financial Report Volume II Fund Return Data
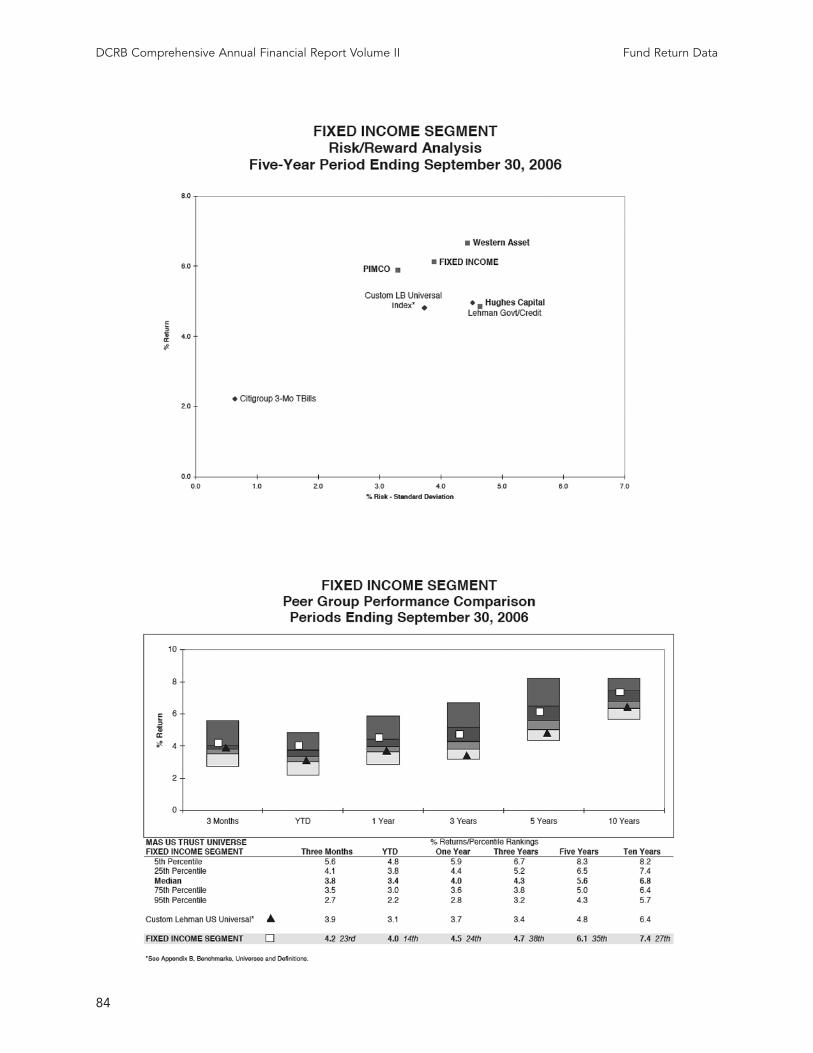
84
DCRB Comprehensive Annual Financial Report Volume II Fund Return Data

85
DCRB Comprehensive Annual Financial Report Volume II Annual Actuarial Valuation
District of Columbia Retirement BoardActuarial Valuation as of October 1, 2006 For Fiscal Year 2008 Contributions
Prepared on January 22, 2007

86
Executive Summary
This actuarial valuation of the District of Columbia
Police Officers and Fire Fighters’ Retirement Fund and
the District of Columbia Teachers’ Retirement Fund
(the Funds) has produced a decrease in recommended
contributions between Fiscal Year 2007 and Fiscal Year
2008. The contribution determined through this valua-
tion is as follows:
The costs shown above reflect all required adjustments.
The total District cost as a percentage of payroll (before
adjustments under D.C. Code §1-907.02(c)) decreased
from 20.9% for Fiscal Year 2007 to 19.9% for Fiscal Year
2008. The normal contribution rates (before adjust-
ments under D.C. Code §1-907.02(c)) for FY 2007 were
2.4% for Teachers and 35.9% for Police Officers and Fire
Fighters.
We have used the District cost as a percentage of total
payroll in order to show the net effects of the various
types of actuarial gains and losses on District cost.
Gains and losses for the individual groups (Teachers,
Police, and Fire) are shown in the cost calculations in
Section 3.
The overall decrease in cost was the net result of sev-
eral factors:
• Demographic experience produced an actuarial gain.
Actual demographic experience (mortality, disabili-
ties, terminations, and retirements occurring at rates
other than expected) combined with data improvement
and refinement efforts combined for a net loss. A sig-
nificant contributor to the gain was the large number of
terminations within the Teachers’ Plan.
• Salary experience produced an actuarial gain.
The total salary for continuing active participants in all
plans was lower than expected based on last year’s valu-
ation and salary increase assumptions.
• Asset returns produced an actuarial gain.
The actuarially-determined rate of return on the value
of Funds’ assets was 9.3% during Fiscal Year 2006. This
was lower than the return on market value of 9.8%, due
to partial deferment of gains as prescribed by the actu-
arial smoothing method. The 9.3% return on actuarial
value was higher than the assumed rate of 7.25%, pro-
ducing an actuarial gain that decreased District costs.
The asset gains that were deferred will provide
a cushion for asset experience during the next
two fiscal years, meaning that even if assets
returns on a market value basis are below
expected levels during Fiscal 2007, returns on
an actuarial basis may still create gains or
somewhat mitigate losses.
• New entrants to the Plans produced an actuarial loss.
New members continued to enter the Plans during
Fiscal Year 2006. There were 943 new entrants and
rehired members between the three groups. Since the
District’s contribution rate for new entrants is greater
than the contribution rate for continuing plan mem-
bers, the District cost increased, particularly for
Teachers.
It is likely that the District contribution will contin-
ue to increase over time, particularly for the Teachers’
Plan. Assuming that the number of active members
remains relatively constant, new members and rehires
will continue to generate rate increases each year, until
the normal rate for the Plans approach the long-term
projected rate. This expected long-term rate for the
Teachers’ Plan based on new entrant costs is still consid-
erably above the current rate (10.3% versus 2.4%),
while the long-term rates for Police and Fire are slightly
higher than the current rates.
The aggregate effect of non-asset experience on
District cost as a percentage of payroll was a slight
decrease. Increased payroll from the prior valuation,
however, means that this is actually an increase of
$800,000.
More detail is provided below on the gains and loss-
es which occurred since the last valuation.
DCRB Comprehensive Annual Financial Report Volume II Annual Actuarial Valuation
Introduction
Contribution Teachers’ Police Officers Total Date Retirement & Fire Fighters’ District
Fund Retirement Fund Cost
Fiscal Year 2007 $14,600,000 $140,100,000 $154,700,000
Fiscal Year 2008 $6,000,000 $137,000,000 $143,000,000

87
Purpose of the Report
This Report presents the results of the October 1, 2006
actuarial valuation of the D.C. Police Officers and Fire
Fighters’ Retirement Fund and the D.C. Teachers’
Retirement Fund for the District of Columbia
Retirement Board. The purposes of the actuarial valua-
tion are:
• To determine the appropriate contribution to the
Funds to be paid by the District in Fiscal Year 2008
in accordance with the Replacement Plan Act;
• To review the experience of the Funds over the past
year and to discuss reasons for changes in the Funds
costs;
• To identify and discuss any emerging trends in
Fund costs; and
• To present those items required for disclosure
under Statements No. 25 and 27 of the Govern-
mental Accounting Standards Board (GASB).
• To determine the funded status of the Fund using
the Entry Age Normal actuarial funding method.
Organization of the Report
This Report is organized into five sections:
• The Summary contains a presentation of the con-
clusions of the valuation and a discussion of the
reasons for changes since the last valuation. The
conclusions and changes are presented separately
for each group.
• Section 1 contains an outline of the Funds’ provi-
sions on which our calculations are based, statisti-
cal data regarding Fund participants, and a summa-
ry of the actuarial assumptions used to compute
liabilities and costs.
• Section 2 presents information concerning the
assets of the Funds. Computation of the actuarial
value of the assets is shown.
• Section 3 contains details of the calculation of actu-
arial liabilities, gains and losses, and District cost.
Part of this section is dedicated to the calculation of
accrued liabilities under the Entry Age Normal cost
method.
Section 4 contains pension plan information
required under Statements No. 25 and 27 of the
Governmental Accounting Standards Board.
District Normal Cost — Teachers
Since the last actuarial valuation as of October 1, 2005,
the Teacher’s normal cost (Total cost before
§1-907.02(c) adjustment) has decreased as a percentage
of active members’ payroll and as a dollar amount. The
table below shows a brief summary.
Valuation Date (Corresponding District Normal CostFiscal Year) (% Payroll) ($ in Millions)__________ ____________
October 1, 2005
(FY 2007) 4.6% $15.7
October 1, 2006
(FY 2008) 2.4% $8.1
Change in District Normal Cost fromOctober 1, 2005 to October 1, 2006 -Teachers
The table below summarizes the impact of actuarial
experience and changes in benefits on Plan cost.
District Normal CostValuation Date (% Payroll) ($ in Millions)__________ ____________
October 1, 2005 4.6% $15.7
Change Due to Demographic
Experience (2.0)% (7.6)
Change Due to Salary
Experience 0.0% 0.0
Change Due to Asset
Experience (0.9)% (2.8)
Change Due to New Entrants 0.7% 2.8
October 1, 2006 2.4% $8.1
An analysis of the costs in the table demonstrates the
following:
• Demographic experience was favorable.
Demographic experience arises from actual death, dis-
ability, termination, and retirement experience during
the year in comparison with actuarial assumptions. In
this case, the effects of data improvement and refine-
ment efforts are also included.
Plan cost decreased by 2.0% from October 1, 2005 to
October 1, 2006, where the latter figure is based on the
Plan’s continuing members (i.e., excluding those hired
since the prior valuation), expected pay for the contin-
DCRB Comprehensive Annual Financial Report Volume II Annual Actuarial Valuation

88
uing members, and expected assets (the amount that
would be on hand if the assets earned exactly 7.25% on
an actuarial basis during the year between valuations).
This decrease in Plan cost indicates that actual demo-
graphic experience primarily terminations) as well as
data improvements during FY 2006 resulted in an actu-
arial gain of $7.6 million.
Detailed information regarding changes in member-
ship of the Fund is shown in Section 1.2 of this Report.
• Pay increases in aggregate were as expected.
Total pay for continuing active employees was very close
to the pay projected using valuation assumptions. The
effect on actuarial liabilities and costs was correspond-
ingly negligible.
• The rate of return on assets was higher than expected.
The return on a market value basis was 9.8% (net of
expenses), but only part of this was realized due to the
asset smoothing method used by the Fund, which defers
part of each year’s gain/loss. Therefore, the actuarially-
determined rate of return on the value of Fund assets
was 9.3% during FY 2006. This return was higher than
the 7.25% assumed return, producing an actuarial gain
that decreased costs to the Fund by $2.8 million, or
0.9% of payroll.
Further information on asset returns can be found in
Section 3 of this report.
• New members to the Plan increased costs.
There were 631 new entrants and rehired members in
the Teacher’s Plan during FY 2006, approximately the
same number as in the prior year. The long-term cost of
these new members is significantly above the current
cost of the plan (10.3% versus 2.4%). As a result, the
Plan cost moved in the direction of the average new
entrant cost, in this case increasing by 0.7% of pay, or
$2.8 million.
Overall, actuarial gains resulted in a cost decrease
from 4.6% to 2.4% of member payroll. The normal con-
tribution decreased from $15.7 million to $8.1 million.
A full development of costs and reasons for changes
from October 1, 2005 to October 1, 2006 are shown in
Sections 3.1 and 3.2 of this report.
District Normal Cost — Police Officers
Since the last actuarial valuation was performed as of
October 1, 2005, the Police Officers’ cost has decreased
slightly as a percentage of active members’ payroll, but
has risen in dollars due to increases in payroll. The table
below shows a brief summary.
Valuation Date (Corresponding District Normal CostFiscal Year) (% Payroll) ($ in Millions)__________ ____________
October 1, 2005
(FY 2007) 38.0% $97.9
October 1, 2006
(FY 2008) 37.7% $99.2
Change in District Normal Cost fromOctober 1, 2005 to October 1, 2006 —Police Officers
The table below summarizes the impact of actuarial
experience and changes in benefits on Plan cost.
District Normal CostValuation Date (% Payroll) ($ in Millions)__________ ____________
October 1, 2005 38.0% $97.9
Change Due to Demographic
Experience 1.1% 2.3
Change Due to Salary
Experience (0.7)% (3.0)
Change Due to Asset
Experience (1.0)% (2.5)
Change Due to New Entrants 0.3% 4.5
October 1, 2006 37.7% $99.2
An analysis of the costs in the table reveals the follow-
ing:
• Demographic experience combined with the effects of
improved data quality, specifically pay information,
resulted in an increase in the normal contribution rate of
1.1% of pay, a $2.3 million increase in the contribution.
More detailed information regarding changes in mem-
bership is shown in Section 1.2 of this Report.
• Pay increases in aggregate were lower than expected.
There was a gain due to lower than expected pay
increases, resulting in a decrease in the normal rate of
0.7% of payroll , or $3.0 million.
DCRB Comprehensive Annual Financial Report Volume II Annual Actuarial Valuation

89
• The rate of return on assets was higher than expected.
As a result of investment gains, the normal cost
decreased by 1.0% of payroll, or $2.5 million.
• New members to the Plan increased costs.
There were 227 new entrants and rehired members in
the Police Officers Plan during the plan year. The long-
term normal contribution rate for these new members
is slightly above the current cost of the plan. As a result,
the Plan cost moved in the direction of the average new
entrant rate, increasing by 0.3%, or $4.5 million.
Overall, actuarial gains slightly outweighed losses
and the impact of new entrants, causing the Funds’ costs
to decrease from 38.0% to 37.7% as a percentage of
member payroll. Increased total payroll, however,
caused the normal contribution to increase from $97.9
million to $99.2 million. A full development of costs
and reasons for changes from October 1, 2005 to
October 1, 2006 are shown in Sections 3.1 and 3.2 of
this report.
District Normal Cost —Fire FightersSince the last actuarial valuation was per-formed as of October 1, 2005, the FireFighters’ cost has decreased as a percentage ofactive members’ payroll, but increased in dol-lars due to higher payroll. The table belowshows a brief summary.
Valuation Date (Corresponding District Normal CostFiscal Year) (% Payroll) ($ in Millions)___________ ____________
October 1, 2005
(FY 2007) 32.9% $32.4
October 1, 2006
(FY 2008) 31.5% $33.2
Change in District Normal Cost fromOctober 1, 2005 to October 1, 2006 —Fire Fighters
The table below summarizes the impact of actuarial
experience and changes in benefits on Plan cost.
District Normal CostValuation Date (% Payroll) ($ in Millions)_________ ___________
October 1, 2005 32.9% $32.4
Change Due to Demographic
Experience (0.4)% 1.0
Change Due to Salary
Experience ( 0.6)% ( 0.9)
Change Due to Asset
Experience (1.0)% ( 1.0)
Change Due to New Entrants 0.6% 1.7
October 1, 2006 31.5% $33.2
An analysis of the costs in the table above reveals the fol-
lowing:
• Demographic experience was favorable.
Demographic experience, including the effects of data
improvement initiatives, resulted in actuarial gains. The
effect on cost as a percentage of payroll was a 0.4%
decrease. An expected increase in payroll caused the
normal cost to increase by $1.0 million.
The detailed data concerning changes in member-
ship of the Fund is shown in Section 1.2 of this Report.
• Pay increases in aggregate were lower than expected.
There was a gain due to pay increases that were lower
than expected based on the prior valuation. This
decreased cost by 0.6% of payroll, or $0.9 million.
• The rate of return on assets was higher than expected.
Favorable investment experience resulted in a decrease
in the normal cost of 1.0% of payroll, an actuarial gain
of $1.0 million.
• New members to the Plan increased costs.
There were 85 new entrants and rehired members in the
Fire Fighters’ Plan during FY 2006. The long-term nor-
mal rate of these new members is higher than the cur-
rent cost of the plan. As a result, the Plan cost moved in
the direction of the average new entrant cost, in this case
increasing by 0.6% of payroll, or $1.7 million.
Overall, actuarial gains slightly outweighed losses and
the impact of new entrants, causing the Funds’ costs to
decrease from 32.9% to 31.5% as a percentage of mem-
ber payroll. Increases in total payroll however, caused
an increase in the normal contribution from $32.4 mil-
lion to $33.2 million. A full development of costs and
reasons for changes from October 1, 2005 to October 1,
2006 are shown in Sections 3.1 and 3.2 of this report.
DCRB Comprehensive Annual Financial Report Volume II Annual Actuarial Valuation

90
Contribution rates are below their expected ultimate level as a percentage of payroll. The estimated long-term con-
tribution rates for the current Tier of benefits are approximately 10%, 42% and 41% for the Teachers, Police Officers
and Fire Fighters respectively. These rates were calculated as the normal contribution rates for the new entrants to
each Plan. Assuming that recent hiring patterns continue and that populations in each group remain close to their
current levels, rate increases are to be expected due to new members.
The asset return and inflation rates assumed for this valuation appear to constitute a considerable degree of con-
servatism. The real rate of return is defined as the nominal rate, less inflation. Thus, a real return of 2.25% is being
assumed. To the extent that future real asset returns are in excess of this, there will be actuarial gains. Increasing the
real return assumption would result in lower liabilities and costs. It would also decrease the probability of future gains.
During 2007, a full experience study will be conducted to determine if any changes in assumptions are warranted. All
demographic and economic assumptions, including return and inflation, will be investigated as part of this study. Any
adjustments to current assumptions will be recommended for the next valuation, as of October 1, 2007.
The Governmental Accounting Standards Board (GASB) has recently announced proposed revisions to Standards
25 and 27, which would require “disclosure by governments that use the aggregate actuarial cost method of the fund-
ed status and present a multiyear schedule of funding progress using the entry age actuarial cost method as a surro-
gate.” This is because the Aggregate method does not explicitly define an accrued liability. Accordingly, a determina-
tion of the funding ratios using the Entry Age Normal actuarial cost method for each plan has been included within
this report. The actuarial assumptions (demographic and economic) used for these calculations are the same as were
used to determine the required contributions.
This report has been prepared using generally accepted actuarial methods and assumptions. If there are any ques-
tions about this report, please feel free to contact us.
Respectfully submitted,
Gregory M. Stump, FSA Graham A. Schmidt, ASA Edward H. Friend, FSA
DCRB Comprehensive Annual Financial Report Volume II Annual Actuarial Valuation
Conclusion and Additional Information

91
Section 1:Summary of Fund Provisions, Member Statistics, andActuarial Assumptions
DCRB Comprehensive Annual Financial Report Volume II Annual Actuarial Valuation
Summary of Plans’ Provisions:
District of Columbia Teachers’ Retirement
Plan
Membership
Eligibility
Permanent, temporary, and probationary teachers for
the District of Columbia public day schools become
members automatically on their date of employment.
Other employees covered by the Retirement of Public
School Teachers Act — including librarians, principals,
and counselors — also become members on their date
of employment. Substitute teachers and employees of
the Department of School Attendance and Work
Permits are not covered. Some former D.C. teachers
working at charter schools are eligible to remain in the
Plan.
Member Contributions
Members hired before November 1, 1996 are required to
contribute 7% of annual pay minus any pay received for
summer school. Members hired on or after November
1, 1996 contribute 8% of annual pay minus pay received
for summer school.
Members can also make voluntary contributions of
up to 10% of annual pay toward an annuity in addition
to any vested pension.
Interest is not credited to each member’s accumulat-
ed contributions.
Service
School Service
One year of school service is granted for each year of
employment with the D.C. public day schools.
Credited Service
Service granted or purchased in addition to school
service.
Voluntary Retirement
Eligibility
For participants hired before November 1, 1996:
• Age 62 with 5 years of school service;
• Age 60 with 20 years of total service, including 5
years of school service; or
• Age 55 with 30 years of total service, including 5
years of school service.
For participants hired on or after November 1, 1996:
• Age 62 with 5 years of school service;
• Age 60 with 20 years of total service, including 5
years of school service; or
• Any age with 30 years of total service, including 5
years of school service.
Benefit Amount
For participants hired before November 1, 1996:
• 1.5% of high 3-year average pay times service up to
5 years, plus
• 1.75% of average pay times service between 5 and
10 years, plus
• 2.0% of average pay times service over 10 years.
For participants hired on or after November 1, 1996:
• 2.0% of average pay times service.
For all participants, there is a minimum benefit of
1.0% of average pay plus $25 for each year of service
Involuntary Retirement
Eligibility
Retired involuntarily for reasons other than misconduct
or delinquency with:
• 25 years of total service, including 5 years of school
service; or
• Age 50 with 20 years of total service, including 5
years of school service.
Benefit Amount
Voluntary Retirement benefit reduced 1/6% per month
(2% per year) that date of retirement precedes age 55.

92
DCRB Comprehensive Annual Financial Report Volume II Annual Actuarial Valuation
Disability Retirement Benefit
Eligibility
5 years of school service and a physical or mental dis-
ability that prevents the member from performing
his/her job.
Benefit Amount
Voluntary Retirement benefit subject to a minimum of
the lesser of 40% of average pay and the benefit that the
member would receive projecting service to age 60.
Lump Sum Death Benefit
Eligibility
Death before completion of 18 months of school serv-
ice or death without an eligible spouse, child, or parent.
Benefit Amount
Refund of paid contributions
Installment Benefit Payable upon Death — Spouse Only
Eligibility
Death before retirement and married for at least two
years or have a child by the marriage.
Benefit Amount
55% of the Voluntary Retirement benefit subject to the
minimums specified in the Disability Retirement
Benefit.
Installment Benefit Payable upon Death — Spouse and DependentChildren
Eligibility
For the spouse, as described above; for the children,
unmarried and under 18, 22 if full-time student, or any
child dependent because of a disability incurred before
age 18. Death does not have to occur before retirement
for the children’s benefits.
Benefit Amount
Spouse benefit as described above, plus a benefit per
child of the smallest of:
• 60% of average pay divided by the number of eligi-
ble children;
• $5,640 (if hired before January 1, 1980), $5,448 (if
hired between January 1, 1980 and October 31,
1996) or $5,400 (if hired on or after November 1,
1996) per child; or
• $16,920 (if hired before January 1, 1980), $16,344
(if hired between January 1, 1980 and October 31,
1996), or $16,200 (if hired on or after November 1,
1996), divided by the number of children, payable
until the children are no longer eligible.
Installment Benefit Payable upon Death — Dependent Children Only
Eligibility
Same as the children’s benefit above.
Benefit Amount
Per child, the smallest of:
• 75% of average pay divided by the number of eligi-
ble children;
• $6,876 (if hired before January 1, 1980), $6,636 (if
hired between January 1, 1980 and October 31,
1996) or $6,552 (if hired on or after November 1,
1996) per child; or
• $20,628 (if hired before January 1, 1980), $19,908
(if hired between January 1, 1980 and October 31,
1996) or $19,656 (if hired on or after November 1,
1996) divided by the number of children, payable
until the children are no longer eligible.
Installment Benefit Payable upon Death — Surviving Parents Only
Eligibility
Death before retirement and no eligible spouse or chil-
dren, and parents receive at least one-half of their total
income from member.
Benefit Amount
Spouse benefit as described above.

93
DCRB Comprehensive Annual Financial Report Volume II Annual Actuarial Valuation
Deferred Vested Benefit
Eligibility
5 years of school service.
Benefit Amount
Voluntary Retirement Benefit beginning at age 62.
Form of Payment Options
Normal Form of Payment
Unreduced Annuity.
Reduced Annuity with a maximum (55%) Survivor
Annuity (to Spouse)
The original benefit is reduced by 2.5% of annual pen-
sion up to $3,600, plus 10% of any amount over $3,600.
Reduced Annuity with a Partial Survivor Annuity
(to Spouse)
A joint and survivor annuity with a benefit payable to
the spouse of between $1 and 54% of the unreduced
retirement benefit. The original benefit is reduced by
dividing the amount of the survivor’s annuity by 55%,
then reducing the original benefit by 2.5% of this
amount up to $3,600, plus 10% of any amount over
$3,600.
Reduced Annuity with a Survivor Annuity to a
person with an “Insurable Interest”
A joint and 55% survivor annuity with the original ben-
efit reduced 10% plus an additional 5% for each full 5
years, up to 25 years, the survivor is younger, with a total
reduction of 40% for any survivor who is 25 or more
years younger.
Reduced Annuity with an Insurance Benefit
Benefits may be reduced and the balance used to pur-
chase life insurance.
Cost-of-Living Adjustments
All participants receive an increase effective each March
based on the annual change in the Consumer Price
Index (all items — U.S. City average) from December to
December. The annual increase is capped at 3% for
members hired on or after November 1, 1996.
Retirement Program for District ofColumbia Police Officers and Firefighters
Membership
Eligibility
All police officers and firefighters of the District of
Columbia automatically become members on their date
of employment. Police Cadets are not eligible.
Member Contributions
Members hired before November 10, 1996 are required
to contribute 7% of annual salary, including any differ-
ential for special assignment, but excluding overtime,
longevity, holiday, or military pay. Members hired on or
after November 10, 1996 contribute 8% of annual
salary, including any differential for special assignment,
but excluding overtime, holiday, or military pay.
Interest is not credited to each member’s accumulat-
ed contributions.
Service
Departmental Service
Each full year and additional months of employment
with either the Metropolitan Police Force or the D.C.
Fire Department.
Credited Service
Service granted or purchased in addition to departmen-
tal service.
Average Pay
For those hired before February 15, 1980, basic pay for
the highest 12 consecutive months. For those hired on
or after February 15, 1980, basic pay for the highest 36
consecutive months divided by three.
Longevity Pay (Police Only)
Members who complete 25 years of active service prior
to retirement are entitled to an additional 15% of their
basic compensation. Members who complete 30 years of
active service are entitled to an additional 20% of their
basic pay.

94
DCRB Comprehensive Annual Financial Report Volume II Annual Actuarial Valuation
Normal Retirement Benefit
Eligibility
For participants hired before February 15, 1980:
• 20 years of service
For participants hired before November 10, 1996:
• Age 60; or
• Age 50 with 25 years of departmental service; or
For participants hired on or after November 10, 1996:
• Age 60; or
• No age requirement with 25 years of service.
Benefit Amount
For participants hired before November 10, 1996:
• 2.5% of average pay times departmental service up
to 25 years (20 years if hired before February 15,
1980), plus
• 3.0% of average pay times departmental service
over 25 (or 20) years, plus
• 2.5% of average pay times credited service.
For participants hired on or after November 10, 1996:
• 2.5% of average pay times total service.
• For all participants, there is a maximum benefit of
80% of average pay.
Service-Related Disability RetirementBenefit
Eligibility
Disabled as a result of an illness or injury in the line of
duty.
Benefit Amount
For participants hired before February 15, 1980
• 2.5% of average pay times total years of service,
subject to a minimum benefit of 66-2/3% of aver-
age pay and subject to a maximum benefit of 70%
of average pay.
For participants hired on or after February 15, 1980
• 70% of final pay times percentage of disability, sub-
ject to a minimum benefit of 40% of final pay.
Non-Service-Related DisabilityRetirement Benefit
Eligibility
5 years of departmental service and a physical or men-
tal disability that prevents the member from performing
his/her job.
Benefit Amount
For participants hired before February 15, 1980
• 2.0% of average pay times total years of service,
subject to a minimum benefit of 40% of average
pay and subject to a maximum benefit of 70% of
average pay.
For participants hired on or after February 15, 1980
• 70% of final pay times percentage of disability, sub-
ject to a minimum benefit of 30% of final pay.
Lump Sum Death Benefit
Eligibility
Death occurring in the line of duty, not resulting from
willful misconduct, an intention to bring about his/her
own death, or drunkenness.
Benefit Amount
$50,000.
Installment Benefit Payable upon Death — Spouse Only, Member Not Killedin Line of Duty after December 29, 1993
Eligibility
Death and, if retired, married for at least one year or
have a child by the marriage.
Benefit Amount
40% of the greater of average pay and the salary for step
6 salary class 1 of the D.C. Police and Fireman’s Salary
Act in effect, adjusted for cost-of-living increases if
death occurs after retirement. The benefit cannot exceed
the rate of pay at death (or retirement if death occurs
after retirement.)
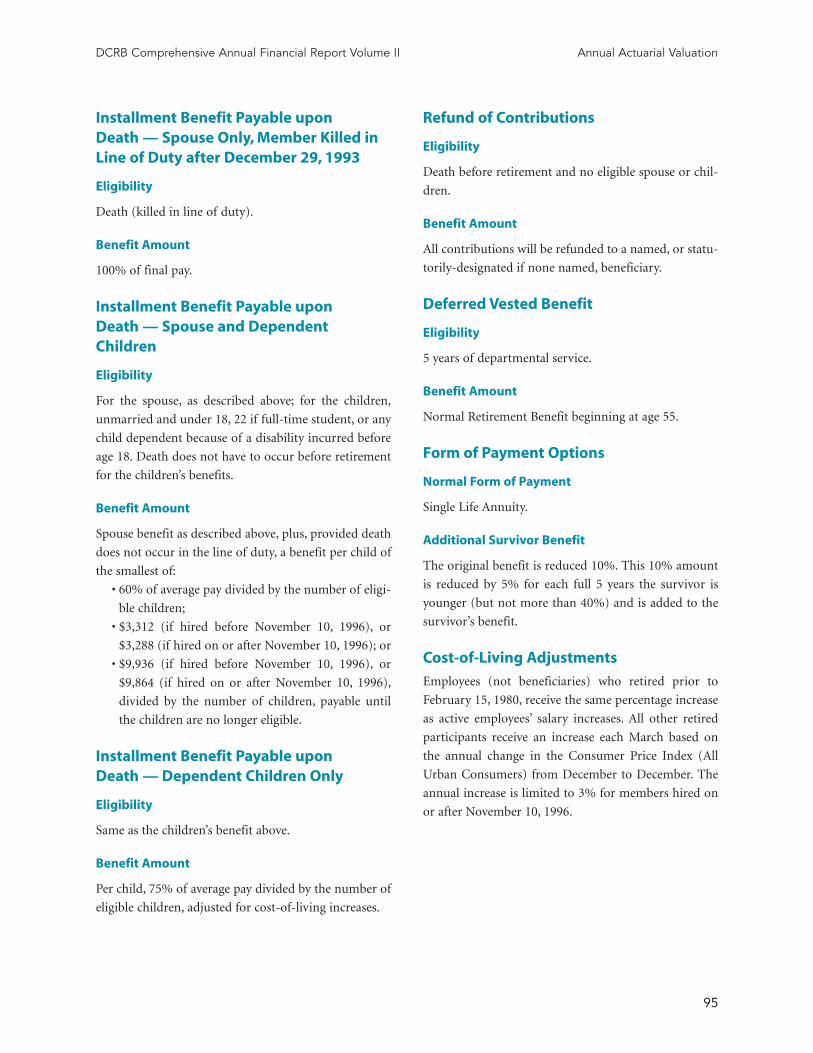
95
DCRB Comprehensive Annual Financial Report Volume II Annual Actuarial Valuation
Installment Benefit Payable upon Death — Spouse Only, Member Killed inLine of Duty after December 29, 1993
Eligibility
Death (killed in line of duty).
Benefit Amount
100% of final pay.
Installment Benefit Payable upon Death — Spouse and DependentChildren
Eligibility
For the spouse, as described above; for the children,
unmarried and under 18, 22 if full-time student, or any
child dependent because of a disability incurred before
age 18. Death does not have to occur before retirement
for the children’s benefits.
Benefit Amount
Spouse benefit as described above, plus, provided death
does not occur in the line of duty, a benefit per child of
the smallest of:
• 60% of average pay divided by the number of eligi-
ble children;
• $3,312 (if hired before November 10, 1996), or
$3,288 (if hired on or after November 10, 1996); or
• $9,936 (if hired before November 10, 1996), or
$9,864 (if hired on or after November 10, 1996),
divided by the number of children, payable until
the children are no longer eligible.
Installment Benefit Payable upon Death — Dependent Children Only
Eligibility
Same as the children’s benefit above.
Benefit Amount
Per child, 75% of average pay divided by the number of
eligible children, adjusted for cost-of-living increases.
Refund of Contributions
Eligibility
Death before retirement and no eligible spouse or chil-
dren.
Benefit Amount
All contributions will be refunded to a named, or statu-
torily-designated if none named, beneficiary.
Deferred Vested Benefit
Eligibility
5 years of departmental service.
Benefit Amount
Normal Retirement Benefit beginning at age 55.
Form of Payment Options
Normal Form of Payment
Single Life Annuity.
Additional Survivor Benefit
The original benefit is reduced 10%. This 10% amount
is reduced by 5% for each full 5 years the survivor is
younger (but not more than 40%) and is added to the
survivor’s benefit.
Cost-of-Living Adjustments
Employees (not beneficiaries) who retired prior to
February 15, 1980, receive the same percentage increase
as active employees’ salary increases. All other retired
participants receive an increase each March based on
the annual change in the Consumer Price Index (All
Urban Consumers) from December to December. The
annual increase is limited to 3% for members hired on
or after November 10, 1996.

96
1.2: Participant Data as of October 1, 2006
Active Participants Teachers Police Officers Fire Fighters
Number 5,088 3,747 1,509
Average Age 45.9 38.9 38.9
Average Service 11.9 12.5 12.9
Average Pay $64,369 $65,001 $64,508
Inactive Participants
Service Retired District Total1 District Total* District Total*
Number 2,017 4,907 549 3,135 166 933
Average Age 63.9 71.5 55.5 62.3 55.8 65.2
Average Benefit $7,493 $38,250 $8,212 $47,046 $11,924 $55,019
Beneficiaries
Number 71 457 181 1,309 48 491
Average Age 47.9 69.4 31.3 65.2 28.7 69.8
Average Benefit $4,442 $17,483 $4,045 $22,781 $4,413 $24,638
Disabled
Number 87 455 217 1,283 46 500
Average Age 57.2 70.7 44.8 63.8 51.2 69.2
Average Benefit $7,219 $26,204 $17,061 $38,934 $11,711 $45,363
Terminated Vested
Number 612 981 79 215 15 29
Average Age 45.7 52.6 41.5 54.3 42.1 49.3
Average Benefit $4,827 $7,977 $8,952 $11,672 $5,393 $11,153
1 Federal and District payments combined.
DCRB Comprehensive Annual Financial Report Volume II Annual Actuarial Valuation

97
DCRB Comprehensive Annual Financial Report Volume II Annual Actuarial Valuation
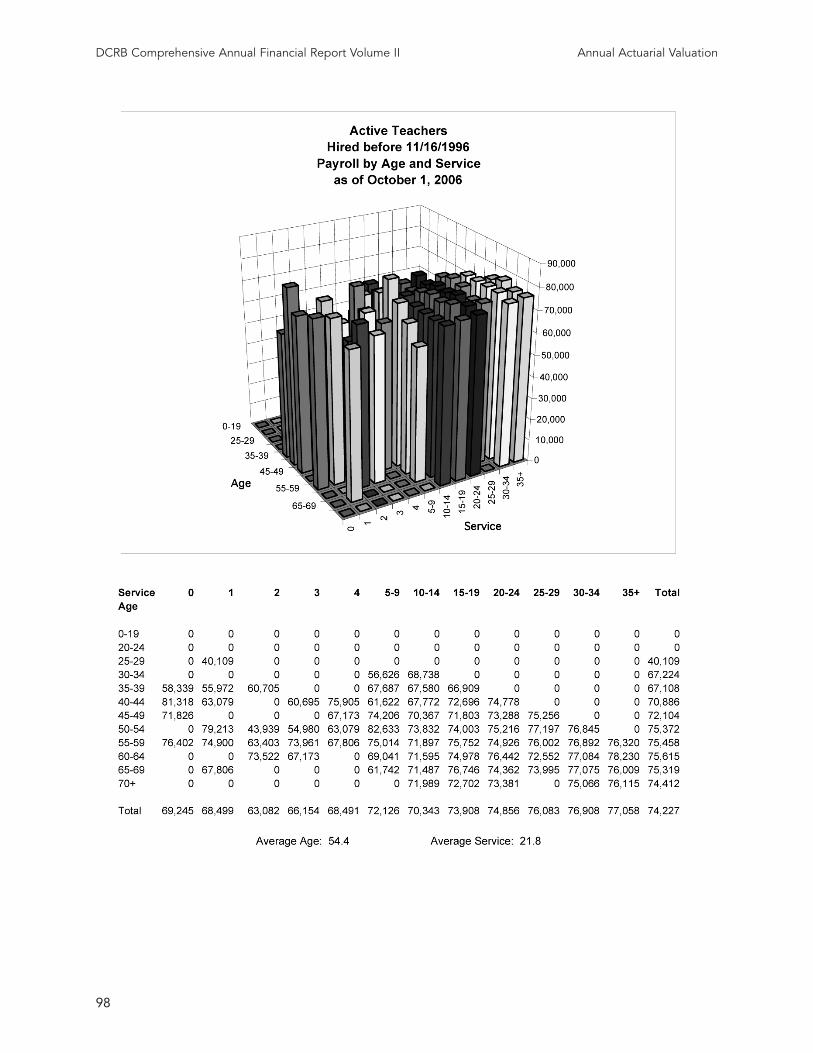
98
DCRB Comprehensive Annual Financial Report Volume II Annual Actuarial Valuation

99
DCRB Comprehensive Annual Financial Report Volume II Annual Actuarial Valuation

100
DCRB Comprehensive Annual Financial Report Volume II Annual Actuarial Valuation

101
DCRB Comprehensive Annual Financial Report Volume II Annual Actuarial Valuation

102
DCRB Comprehensive Annual Financial Report Volume II Annual Actuarial Valuation

103
DCRB Comprehensive Annual Financial Report Volume II Annual Actuarial Valuation

104
DCRB Comprehensive Annual Financial Report Volume II Annual Actuarial Valuation

105
DCRB Comprehensive Annual Financial Report Volume II Annual Actuarial Valuation

106
DCRB Comprehensive Annual Financial Report Volume II Annual Actuarial Valuation

107
DCRB Comprehensive Annual Financial Report Volume II Annual Actuarial Valuation
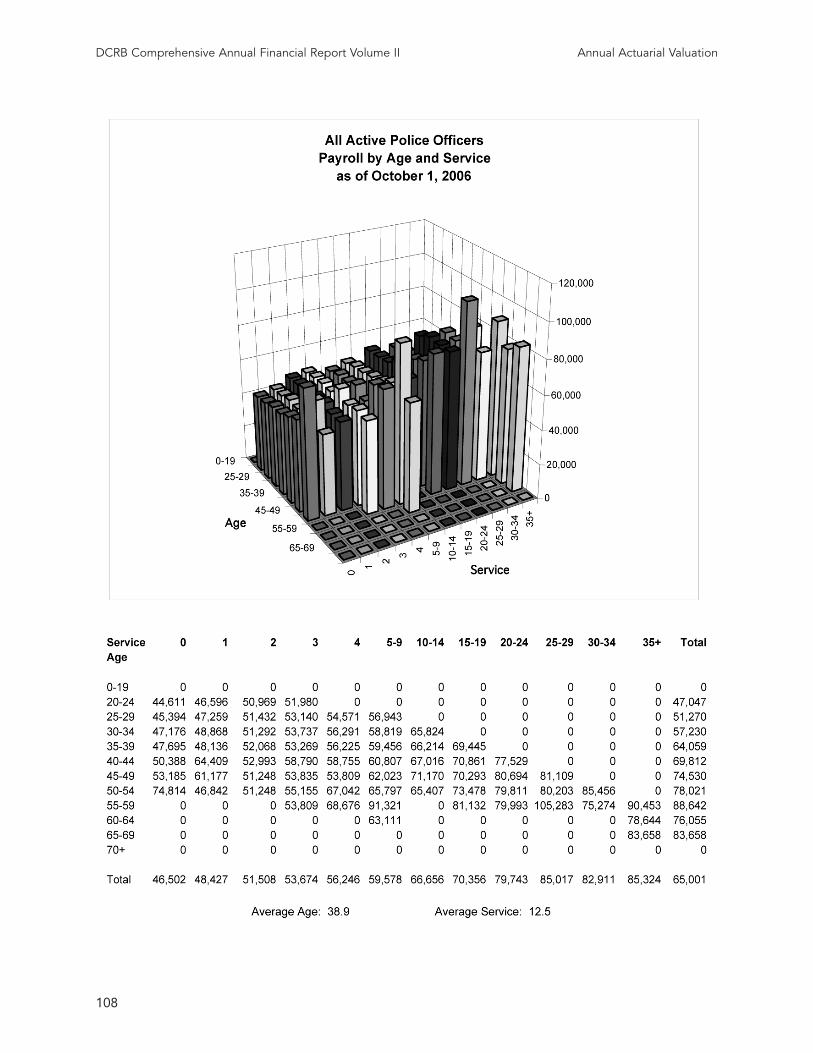
108
DCRB Comprehensive Annual Financial Report Volume II Annual Actuarial Valuation

109
DCRB Comprehensive Annual Financial Report Volume II Annual Actuarial Valuation

110
DCRB Comprehensive Annual Financial Report Volume II Annual Actuarial Valuation

111
DCRB Comprehensive Annual Financial Report Volume II Annual Actuarial Valuation

112
DCRB Comprehensive Annual Financial Report Volume II Annual Actuarial Valuation

113
DCRB Comprehensive Annual Financial Report Volume II Annual Actuarial Valuation

114
DCRB Comprehensive Annual Financial Report Volume II Annual Actuarial Valuation

115
DCRB Comprehensive Annual Financial Report Volume II Annual Actuarial Valuation
Inactive Teachers
Service RetireesCombined
District Average District andCount District Benefit Total Count Fed Benefit
Under 35 0 $0 0 $0
35-39 0 $0 1 $48,840
40-44 0 $0 0 $0
45-49 0 $0 0 $0
50-54 4 $10,420 4 $34,059
55-59 425 $10,513 439 $42,528
60-64 911 $7,337 1,056 $39,695
65-69 473 $5,849 904 $38,040
70-74 156 $5,629 868 $38,476
75-79 40 $5,395 692 $35,981
80-84 7 $6,305 451 $34,938
85-89 1 $14,676 276 $36,860
90-94 0 $0 144 $37,626
95-99 0 $0 62 $39,310
100 and over 0 $0 10 $45,271____________ _______ _______ _______ _______
Total 2,017 $7,493 4,907 $38,250
BeneficiariesCombined
District Average District and
Count District Benefit Total Count Fed Benefit
Under 19 14 $2,589 28 $5,323
20-24 4 $1,369 10 $5,813
25-29 0 $0 0 $0
30-34 0 $0 0 $0
35-39 0 $0 2 $5,640
40-44 1 $9,888 2 $7,722
45-49 5 $6,502 10 $16,322
50-54 9 $5,395 13 $14,116
55-59 15 $5,936 32 $16,204
60-64 10 $2,239 43 $14,836
65-69 9 $4,730 51 $18,378
70-74 4 $7,171 57 $17,033
75-79 0 $0 69 $19,575
80-84 0 $0 58 $18,343
85-89 0 $0 39 $21,084
90-94 0 $0 30 $28,444
95-99 0 $0 10 $19,658
100 and over 0 $0 3 $19,192____________ _______ _______ _______ _______
Total 71 $4,442 457 $17,483
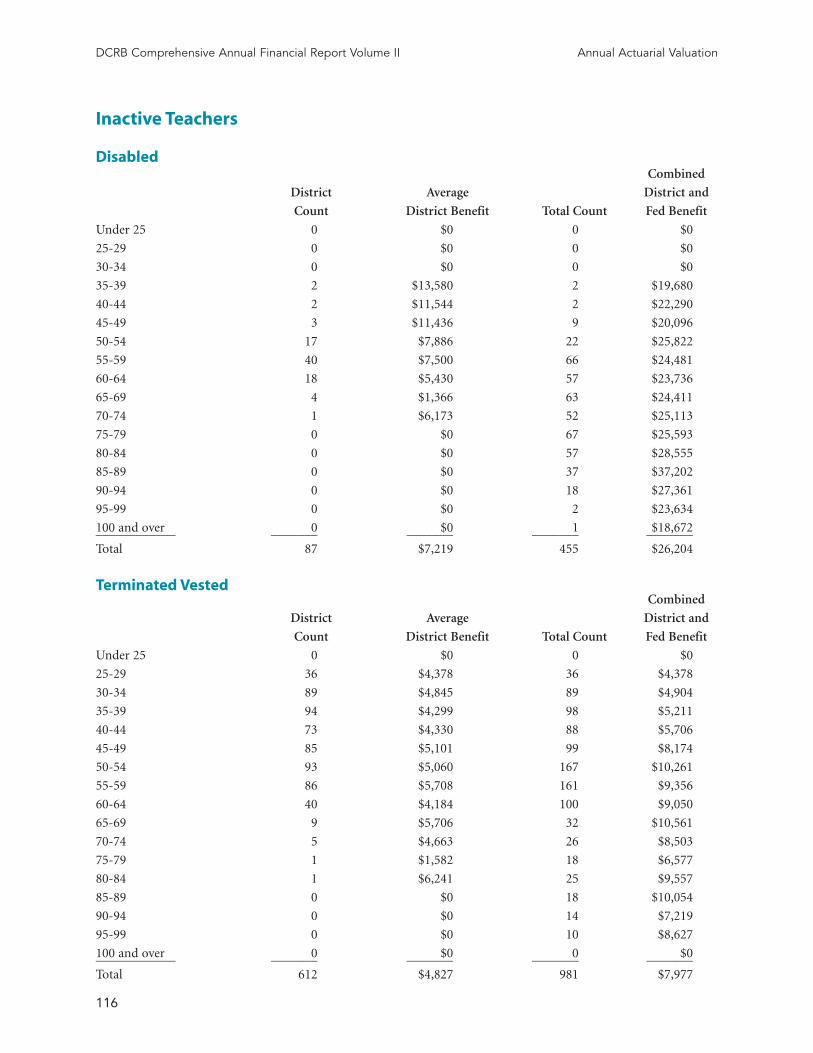
116
DCRB Comprehensive Annual Financial Report Volume II Annual Actuarial Valuation
Inactive Teachers
DisabledCombined
District Average District and
Count District Benefit Total Count Fed Benefit
Under 25 0 $0 0 $0
25-29 0 $0 0 $0
30-34 0 $0 0 $0
35-39 2 $13,580 2 $19,680
40-44 2 $11,544 2 $22,290
45-49 3 $11,436 9 $20,096
50-54 17 $7,886 22 $25,822
55-59 40 $7,500 66 $24,481
60-64 18 $5,430 57 $23,736
65-69 4 $1,366 63 $24,411
70-74 1 $6,173 52 $25,113
75-79 0 $0 67 $25,593
80-84 0 $0 57 $28,555
85-89 0 $0 37 $37,202
90-94 0 $0 18 $27,361
95-99 0 $0 2 $23,634
100 and over 0 $0 1 $18,672____________ _______ _______ _______ _______
Total 87 $7,219 455 $26,204
Terminated VestedCombined
District Average District and
Count District Benefit Total Count Fed Benefit
Under 25 0 $0 0 $0
25-29 36 $4,378 36 $4,378
30-34 89 $4,845 89 $4,904
35-39 94 $4,299 98 $5,211
40-44 73 $4,330 88 $5,706
45-49 85 $5,101 99 $8,174
50-54 93 $5,060 167 $10,261
55-59 86 $5,708 161 $9,356
60-64 40 $4,184 100 $9,050
65-69 9 $5,706 32 $10,561
70-74 5 $4,663 26 $8,503
75-79 1 $1,582 18 $6,577
80-84 1 $6,241 25 $9,557
85-89 0 $0 18 $10,054
90-94 0 $0 14 $7,219
95-99 0 $0 10 $8,627
100 and over 0 $0 0 $0____________ _______ _______ _______ _______
Total 612 $4,827 981 $7,977

117
DCRB Comprehensive Annual Financial Report Volume II Annual Actuarial Valuation
Inactive Police Officers
Service RetireesCombined
District Average District andCount District Benefit Total Count Fed Benefit______ _____________ _________ _________
Under 35 0 $0 0 $0
35-39 1 $22,596 1 $22,596
40-44 0 $0 0 $0
45-49 25 $12,793 25 $53,744
50-54 232 $10,292 389 $48,816
55-59 228 $6,554 1,011 $44,920
60-64 60 $4,421 784 $45,388
65-69 3 $6,141 477 $45,470
70-74 0 $0 250 $48,534
75-79 0 $0 123 $60,041
80-84 0 $0 49 $63,282
85-89 0 $0 17 $80,439
90-94 0 $0 6 $53,924
95-99 0 $0 3 $45,432
100 and over 0 $0 0 $0____________ _______ _______ _______ _______
Total 549 $8,212 3,135 $47,046
BeneficiariesCombined
District Average District andCount District Benefit Total Count Fed Benefit______ _____________ _________ _________
Under 19 82 $1,778 88 $4,893
20-24 18 $3,376 25 $11,465
25-29 0 $0 0 $0
30-34 1 $1,392 2 $4,566
35-39 14 $12,186 18 $22,622
40-44 9 $11,630 16 $22,829
45-49 17 $5,708 43 $19,853
50-54 18 $3,576 97 $20,801
55-59 8 $4,327 147 $21,819
60-64 9 $4,278 145 $23,567
65-69 0 $0 146 $24,505
70-74 1 $10,155 119 $26,272
75-79 2 $1,649 143 $25,684
80-84 2 $502 118 $25,604
85-89 0 $0 118 $26,554
90-94 0 $0 66 $27,925
95-99 0 $0 15 $25,056
100 and over 0 $0 3 $25,152____________ _______ _______ _______ _______
Total 181 $4,045 1,309 $22,781

118
DCRB Comprehensive Annual Financial Report Volume II Annual Actuarial Valuation
Inactive Police Officers
DisabledCombined
District Average District andCount District Benefit Total Count Fed Benefit______ _____________ _________ _________
Under 25 0 $0 0 $0
25-29 2 $21,564 2 $21,564
30-34 8 $20,992 8 $23,172
35-39 48 $21,030 54 $26,125
40-44 60 $19,345 70 $26,643
45-49 44 $17,891 71 $28,811
50-54 42 $11,475 121 $34,558
55-59 10 $4,051 191 $36,360
60-64 3 $3,834 188 $36,694
65-69 0 $0 143 $40,851
70-74 0 $0 122 $42,833
75-79 0 $0 150 $46,828
80-84 0 $0 98 $49,517
85-89 0 $0 36 $48,052
90-94 0 $0 23 $54,369
95-99 0 $0 6 $75,576
100 and over 0 $0 0 $0____________ _______ _______ _______ _______
Total 217 $17,061 1,283 $38,934
Terminated VestedCombined
District Average District andCount District Benefit Total Count Fed Benefit______ _____________ _________ _________
Under 25 0 $0 0 $0
25-29 0 $0 0 $0
30-34 7 $7,164 7 $7,937
35-39 25 $7,417 26 $11,858
40-44 25 $9,643 26 $19,873
45-49 18 $9,312 22 $19,328
50-54 4 $15,730 18 $13,495
55-59 0 $0 51 $5,251
60-64 0 $0 24 $5,125
65-69 0 $0 16 $11,829
70-74 0 $0 16 $13,790
75-79 0 $0 7 $17,893
80-84 0 $0 1 $15,389
85-89 0 $0 0 $0
90-94 0 $0 1 $19,380
95-99 0 $0 0 $0
100 and over 0 $0 0 $0____________ _______ _______ _______ _______
Total 79 $8,952 215 $11,672

119
DCRB Comprehensive Annual Financial Report Volume II Annual Actuarial Valuation
Inactive Firefighters
Service RetireesCombined
District Average District andCount District Benefit Total Count Fed Benefit______ _____________ _________ _________
Under 35 0 $0 0 $0
35-39 0 $0 0 $0
40-44 0 $0 0 $0
45-49 8 $14,061 8 $48,365
50-54 64 $14,973 77 $56,820
55-59 71 $10,903 148 $57,225
60-64 22 $5,954 241 $52,599
65-69 1 $3,535 233 $52,754
70-74 0 $0 121 $52,393
75-79 0 $0 69 $63,280
80-84 0 $0 22 $64,766
85-89 0 $0 12 $72,407
90-94 0 $0 2 $66,930
95-99 0 $0 0 $0
100 and over 0 $0 0 $0____________ _______ _______ _______ _______
Total 166 $11,924 933 $55,019
BeneficiariesCombined
District Average District andCount District Benefit Total Count Fed Benefit______ _____________ _________ _________
Under 19 27 $3,664 27 $6,635
20-24 4 $1,182 5 $3,038
25-29 0 $0 1 $27,636
30-34 0 $0 0 $0
35-39 1 $13,416 1 $20,628
40-44 1 $10,585 5 $22,411
45-49 2 $873 10 $15,824
50-54 7 $4,890 20 $21,371
55-59 3 $1,636 29 $22,817
60-64 0 $0 43 $23,817
65-69 2 $20,560 69 $24,561
70-74 0 $0 44 $27,021
75-79 0 $0 77 $27,164
80-84 1 $2,168 63 $27,476
85-89 0 $0 65 $28,464
90-94 0 $0 23 $28,107
95-99 0 $0 8 $30,530
100 and over 0 $0 1 $24,144____________ _______ _______ _______ _______
Total 48 $4,413 491 $24,638
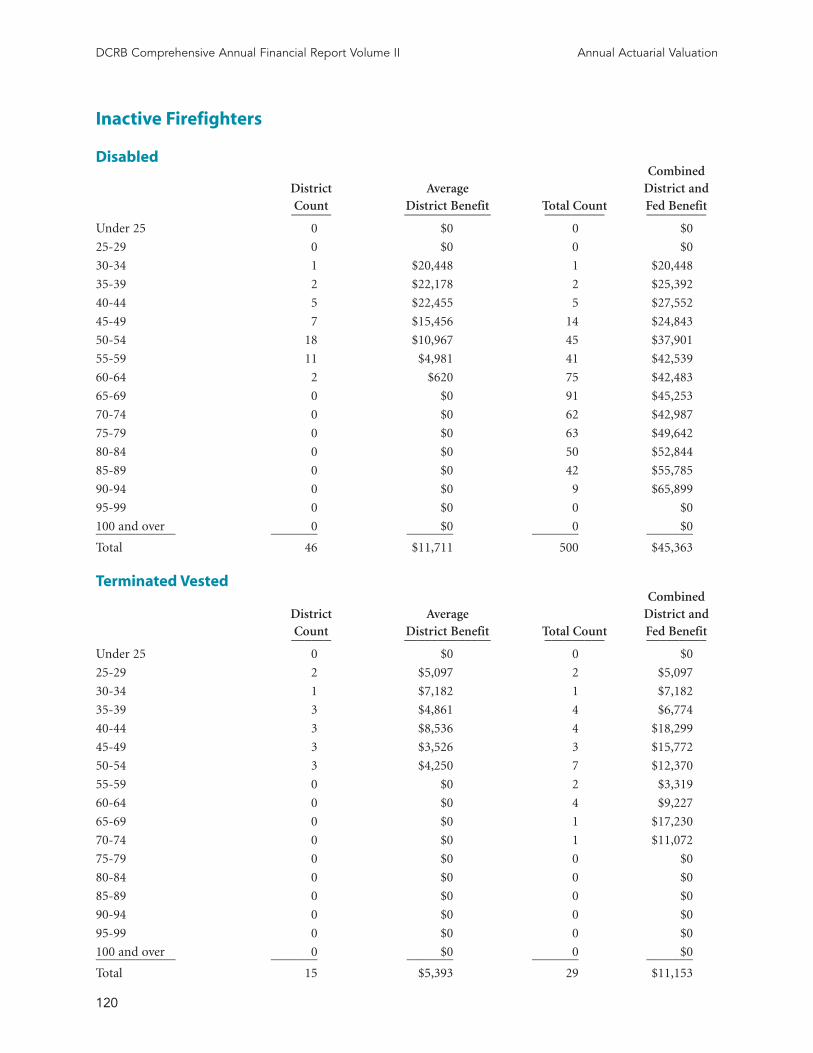
120
DCRB Comprehensive Annual Financial Report Volume II Annual Actuarial Valuation
Inactive Firefighters
DisabledCombined
District Average District andCount District Benefit Total Count Fed Benefit______ _____________ _________ _________
Under 25 0 $0 0 $0
25-29 0 $0 0 $0
30-34 1 $20,448 1 $20,448
35-39 2 $22,178 2 $25,392
40-44 5 $22,455 5 $27,552
45-49 7 $15,456 14 $24,843
50-54 18 $10,967 45 $37,901
55-59 11 $4,981 41 $42,539
60-64 2 $620 75 $42,483
65-69 0 $0 91 $45,253
70-74 0 $0 62 $42,987
75-79 0 $0 63 $49,642
80-84 0 $0 50 $52,844
85-89 0 $0 42 $55,785
90-94 0 $0 9 $65,899
95-99 0 $0 0 $0
100 and over 0 $0 0 $0____________ _______ _______ _______ _______
Total 46 $11,711 500 $45,363
Terminated VestedCombined
District Average District andCount District Benefit Total Count Fed Benefit______ _____________ _________ _________
Under 25 0 $0 0 $0
25-29 2 $5,097 2 $5,097
30-34 1 $7,182 1 $7,182
35-39 3 $4,861 4 $6,774
40-44 3 $8,536 4 $18,299
45-49 3 $3,526 3 $15,772
50-54 3 $4,250 7 $12,370
55-59 0 $0 2 $3,319
60-64 0 $0 4 $9,227
65-69 0 $0 1 $17,230
70-74 0 $0 1 $11,072
75-79 0 $0 0 $0
80-84 0 $0 0 $0
85-89 0 $0 0 $0
90-94 0 $0 0 $0
95-99 0 $0 0 $0
100 and over 0 $0 0 $0____________ _______ _______ _______ _______
Total 15 $5,393 29 $11,153

121
DCRB Comprehensive Annual Financial Report Volume II Annual Actuarial Valuation
Changes in Plan Membership
Teachers
Non-VestedTerminations Vested Total
Actives Due Refunds Terminations Disabled Retired Beneficiaries Participants_______ ___________ ____________ ________ ______ ___________ __________
October 1, 2005 5,707 3,270 758 466 4,886 461 15,548
New Entrants 583 - - - - - 583
Rehires 48 (21) (5) - (1) - 21
Disabilities (8) - - 8 - - 0
Retirements (176) - (6) - 182 - 0
Vested Terminations (276) - 276 - - - 0
Died, With Beneficiaries’
Benefit Payable (5) - - - (14) 19 0
Died, Without Beneficiary,
and Other Terminations (681) 674 (1) (20) (148) - (176)
Transfers - - - - - - 0
Refund of Contributions (104) (86) (39) - - - (229)
Beneficiary Deaths - - - - - (33) (33)
Domestic Relations Orders - - - - - 1 1
Data Corrections/Not Reported - 17 (2) 1 2 9 27
October 1, 2006 5,088* 3,854 981 455 4,907 457 15,742
* Includes members assumed to be on leave of absence.

122
DCRB Comprehensive Annual Financial Report Volume II Annual Actuarial Valuation
Changes in Plan Membership
Police Officers
Non-VestedTerminations Vested Total
Actives Due Refunds Terminations Disabled Retired Beneficiaries Participants_______ ___________ ____________ ________ ______ ___________ __________
October 1, 2005 3,741 529 213 1,258 3,153 1,263 10,157
New Entrants 218 - - - - - 218
Rehires 9 (2) - - - - 7
Disabilities (55) - - 55 - - 0
Retirements (28) - - - 28 - 0
Vested Terminations (26) - 26 - - - 0
Died, With Beneficiaries’
Benefit Payable (2) - (2) (16) (21) 46 5
Died, Without Beneficiary,
and Other Terminations (53) 51 (2) (24) (24) - (52)
Transfers - - - - - - 0
Refund of Contributions (58) (17) (20) - - - (95)
Beneficiary Deaths - - - - - (59) (59)
Domestic Relations Orders - - - - - 11 11
Data Corrections/Not Reported 1 20 - 10 (1) 48 78
October 1, 2006 3,747 581 215 1,283 3,135 1,309 10,270
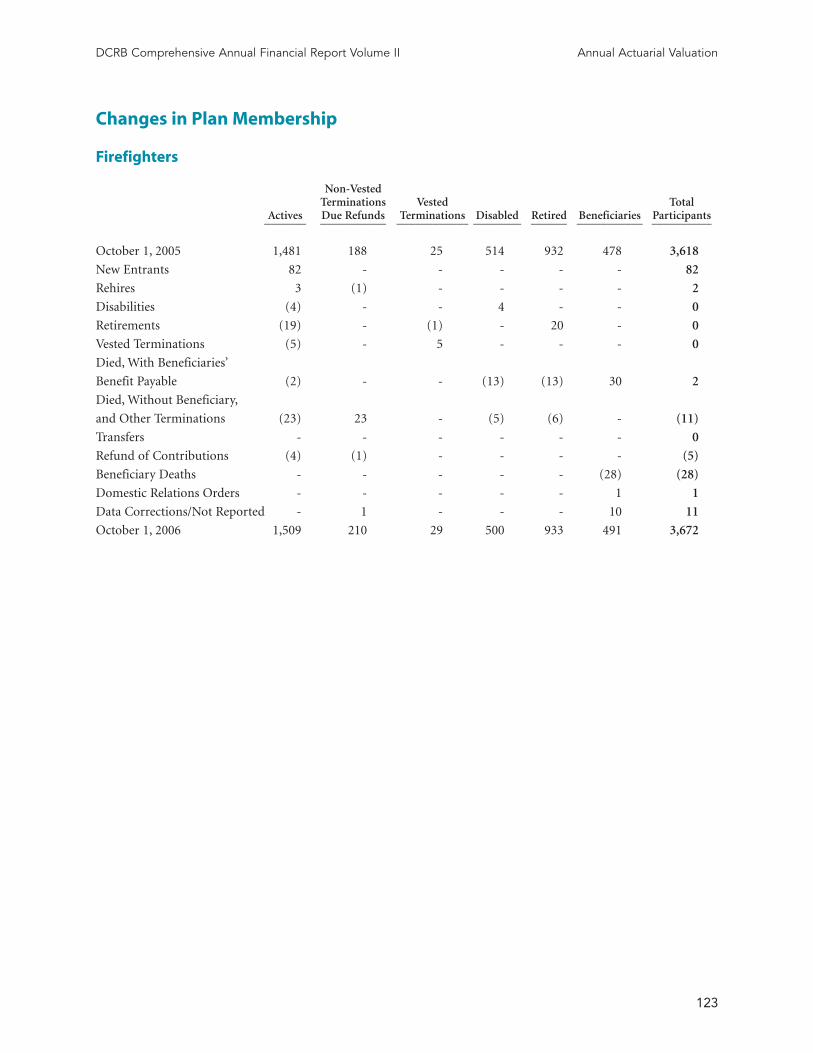
123
DCRB Comprehensive Annual Financial Report Volume II Annual Actuarial Valuation
Changes in Plan Membership
Firefighters
Non-VestedTerminations Vested Total
Actives Due Refunds Terminations Disabled Retired Beneficiaries Participants_______ ___________ ____________ ________ ______ ___________ __________
October 1, 2005 1,481 188 25 514 932 478 3,618
New Entrants 82 - - - - - 82
Rehires 3 (1) - - - - 2
Disabilities (4) - - 4 - - 0
Retirements (19) - (1) - 20 - 0
Vested Terminations (5) - 5 - - - 0
Died, With Beneficiaries’
Benefit Payable (2) - - (13) (13) 30 2
Died, Without Beneficiary,
and Other Terminations (23) 23 - (5) (6) - (11)
Transfers - - - - - - 0
Refund of Contributions (4) (1) - - - - (5)
Beneficiary Deaths - - - - - (28) (28)
Domestic Relations Orders - - - - - 1 1
Data Corrections/Not Reported - 1 - - - 10 11
October 1, 2006 1,509 210 29 500 933 491 3,672

124
DCRB Comprehensive Annual Financial Report Volume II Annual Actuarial Valuation
1.3: Actuarial Methods and Assumptions
Actuarial Funding Method
The funding method required by the “Replacement Plan
Act” is the Aggregate Funding Method. Under this
Method, the District must contribute the level percent
of pay that — combined with the actuarial value of
assets, expected investment earnings, and future
employee contributions — will pay for the benefits of
the current participants by the time the current work-
force leaves employment.
Actuarial Assumptions
Valuation Date
All assets and liabilities are computed as of October 1,
2006.
Rate of Return
The annual rate of return on all Fund assets is assumed
to be 7.25%, net of investment and administrative
expenses.
Cost of Living
The cost of living as measured by the Consumer Price
Index (CPI) will increase at the rate of 5.00% per year.
Increases in Pay
Assumed pay increases for active members consist of
increases due to cost of living adjustments and promo-
tion and increases due to longevity and retention incen-
tives. Cost of living increases are assumed to result in a
general wage increase of 5.0% for all employees. Sample
rates for the increases due to promotions are given in
the table below. Rates for the longevity and retention
incentives are given separately.
PoliceService Teachers Officers Firefighters
0 4.000% 5.000% 2.500%
5 4.000% 3.563% 2.500%
10 3.000% 2.584% 2.500%
15 2.000% 2.314% 2.500%
20 1.000% 2.000% 2.500%
25 0.159% 1.100% 2.500%
30 0.393% 0.500% 2.500%
35 0.331% 0.000% 2.500%
40 0.270% 0.000% 0.000%
Active Member Mortality
Rates of mortality for active male teachers are given by
the 1994 Uninsured Pension (UP94) Male Table with
generational improvement using Projection Scale AA,
with a one-year age set forward. Rates of mortality for
active female teachers are given by the 1994 Uninsured
Pension (UP94) Female Table with generational
improvement using Projection Scale AA, with a one-
year age set forward.
Mortality
Rates of mortality for active male police officers and fire
fighters are given by the 1994 Uninsured Pension
(UP94) Male Table with generational improvement
using Projection Scale AA, with a three-year age set for-
ward. Rates of mortality for active female police officers
and firefighters are given by the 1994 Uninsured
Pension (UP94) Female Table with generational
improvement using Projection Scale AA, with a three-
year age set forward.
To value the pre-retirement death benefit for police
officers and firefighters, the benefit form for all retire-
ments (normal or disabled) is assumed to be a 54.2%
Joint and Survivor annuity for all participants.
25% of all police officer and fire fighter active deaths
are assumed to occur in the line of duty.

125
DCRB Comprehensive Annual Financial Report Volume II Annual Actuarial Valuation
Retired Member Mortality
Rates of mortality for retired male teachers are given by
the 1994 Uninsured Pension (UP94) Male Table with
generational improvement using Projection Scale AA.
Rates of mortality for active female teachers are given by
the 1994 Uninsured Pension (UP94) Female Table with
generational improvement using Projection Scale AA.
Rates of mortality for active male police officers and
firefighters are given by the 1994 Uninsured Pension
(UP94) Male Table with generational improvement
using Projection Scale AA, with a two-year age set for-
ward. Rates of mortality for active female police officers
and firefighters are given by the 1994 Uninsured
Pension (UP94) Female Table with generational
improvement using Projection Scale AA, with a two-
year age set forward.
Disabled Member Mortality
Rates of mortality among disabled members are speci-
fied for male and female members; separate tables are
used for teachers and for public safety disabled mem-
bers. Sample rates for teachers are as follows:
Age Male Female
20 2.4000% 2.4000%
30 2.4000% 2.4000%
40 2.4000% 2.4000%
50 2.4545% 2.4000%
60 2.5910% 2.4000%
70 3.8006% 2.4000%
80 7.2111% 4.1413%
90 13.1554% 10.0013%
Sample rates for police officers and firefighters are as
follows:
Age Male Female
20 0.9033% 0.5616%
30 0.9033% 0.5616%
40 0.9033% 0.5616%
50 0.9033% 0.5616%
60 1.3029% 0.8310%
70 2.6405% 1.7147%
80 6.4974% 4.2282%
90 15.6801% 12.2128%
Service Retirement
Retirement is assumed to occur among teachers in
accordance with the table below:
Age First Year Subsequent Eligible Years
50-55 20% 20%
56 40% 20%
57-59 60% 20%
60-69 20% 20%
70 100% 100%
For police officers and firefighters, the following rates of
retirement are assumed.
Age Police Officers Firefighters
40 7.5% 2.0%
41 10.0% 3.0%
42 12.0% 4.0%
43 15.0% 5.0%
44 15.0% 5.0%
45 15.0% 6.0%
46 15.0% 7.0%
47 17.0% 8.0%
48 19.0% 9.0%
49 21.0% 11.0%
50 23.0% 13.0%
51 25.0% 15.0%
52 25.0% 20.0%
53 25.0% 25.0%
54 30.0% 30.0%
55 40.0% 35.0%
56 50.0% 35.0%
57 50.0% 35.0%
58 50.0% 35.0%
59 50.0% 35.0%
60 100% 100%
It is assumed that all police officers and firefighters
retire after 31 years of service.

126
DCRB Comprehensive Annual Financial Report Volume II Annual Actuarial Valuation
Disability
Separate rates of disability are assumed among teachers,
police officers and firefighters, with rates for both sexes
combined. Below are sample rates:
Age Teachers Police Officers Firefighters
25 0.0300% 0.4383% 0.2893%
30 0.0572% 0.5750% 0.3795%
35 0.0932% 0.8500% 0.5610%
40 0.1292% 1.2500% 0.8250%
45 0.2040% 1.9633% 1.2958%
50 0.3212% 3.2500% 2.1450%
55 0.5520% 5.7750% 3.8115%
60 0.5700% 8.2500% 5.4450%
65 0.0000% 8.2500% 5.4450%
For police officers and firefighters, it is assumed that
50% of the disabilities are due to accidents in the line of
duty. The benefit amount for some members is defined
to be based on the “% of disability.” For all police offi-
cer and firefighter disabilities, the “% of disability” is
assumed to be 100%.
Withdrawal
Separate rates of withdrawal/termination are assumed
among teachers, police officers, and firefighters, with
rates for both sexes combined. Withdrawal rates are not
applied to Members eligible for service retirement.
Age Teachers Police Officers Firefighters
20 25.00% 12.13% 1.60%
25 23.00% 6.57% 1.60%
30 16.00% 4.23% 1.60%
35 11.00% 2.32% 1.60%
40 6.80% 1.33% 1.60%
45 4.80% 1.03% 1.60%
50 3.60% 0.00% 0.00%
55 0.00% 0.00% 0.00%
60 0.00% 0.00% 0.00%
For police officers and firefighters, all terminations are
assumed to result in the withdrawal of contributions,
with no further benefits payable. For teachers with more
than 5 years of service, terminated employees are
expected to receive a deferred vested benefit. Teachers
with less than 5 years of service receive a refund of accu-
mulated contributions.
Pay for Benefits
Allowances have been made for special increases in
Compensation prior to termination or retirement. For
police officers, an additional increase of 5% is given for
the Base Retention Differential after 20 years of service.
Also, police officers are assumed to receive a longevity
increase of 10% after 20 years of service, and additional
increases of 5% after 25 and 30 years of service.
Firefighters are assumed to receive retention incentives
of 5%, 10%, 15%, and 20% applied to base pay after 15,
20, 25, and 30 years of service, respectively.
Family Composition
64% of teachers and 80% of police officers and firefight-
ers are assumed to be married. Male spouses are
assumed to be three years older than their wives. Active
employees are assumed to have one dependent child
aged 10.
Employment Status
No future transfers among member groups are
assumed.
Actuarial Value of Plan Assets
The actuarial value of District assets is a modified mar-
ket-related value. The actuarial value of assets method
approved by the Board is defined as the expected actu-
arial value of assets (assuming a 7.25% rate of return)
plus 1/3 of the difference between the expected and
actual market value of assets. There is then a final
adjustment made for the effect of the adjustment pur-
suant to D.C. Code §1-907.02(c). This adjustment is
explained and developed in Section 3.5.
The detailed calculation of the actuarial value of
District assets is shown in Section 2.5.
Participant Data
Data on active and inactive members and their benefici-
aries as of the valuation date was supplied by the
District’s Office of Pay and Retirement Services (OPRS),
on electronic media. As is usual in studies of this type,
member data was neither verified nor audited, but was
reviewed for reasonableness.

127
DCRB Comprehensive Annual Financial Report Volume II Annual Actuarial Valuation
Certain assumptions were made with respect to
information provided by the District of Columbia:
• Charter school teachers data is not available. To
account for this group, active liabilities and payroll
were increased by 1.5%
• The data is incomplete with respect to former
members who have a deferred vested benefit. Thus,
benefits for these individuals are assumed based on
their service and pay history as available.
• Benefit service has been determined based on
employee contribution history.
• Benefit splits between federal and District have
been estimated for terminated vested participants
with missing benefit amounts based on employee
contribution history.
• It is assumed that all Fire and Police members with
prior military service will purchase this service. To
account for this, an average amount of prior service
of 0.4 years based on a prior study is assumed for all
Police and Fire members.

128
DCRB Comprehensive Annual Financial Report Volume II Annual Actuarial Valuation
2.1: Current Value of District Assets as of October 1, 2006
The allocation of benefit payments and investment income between police and fire are approximations based on the
most recent information available from the District of Columbia and the D.C. Retirement Board.
$ millions Teachers Police Fire Police & Fire Total Fund________ ________ ______ ____________ ___________
(1) Current Value of Assets as of
October 1, 20051 $1,145.6 $1,424.6 $553.9 $1,978.5 $3,124.1
(2) FY 2006 District Contributions $15.5 $86.9 $30.6 $ 117.5 $ 133.0
(3) FY 2006 Employee Contributions $25.1 $17.9 $7.2 $ 25.1 $ 50.2
(4) FY 2006 Actual Benefit Payments2 $(8.1) $(3.2) $(0.3) $(3.5) $(11.6)
(5) FY 2006 Investment Earnings3 $122.2 $146.4 $57.2 $ 203.6 $ 325.8
(6) Actual Current Value of Assets
as of October 1, 2006 $1,300.3 $1,672.6 $648.6 $2,321.2 $3,621.5
(7) Benefits Payable for FY 2006 $(15.9) $(10.1) $(2.9) $(13.0) $(28.9)
(8) Final Current Value of Assets as of
October 1, 2006 $1,284.4 $1,662.5 $645.7 $2,308.2 $3,592.6
(9)Approximate Rate of Return
9.8%
1 The current value of assets as of October 1, 2005 was equal to the market value less estimated benefits payable of
$12.4 million for the Teachers, $7.2 million for the Police Officers, and $2.1 million for the Fire Fighters.
2 The fund paid $21.7 million in benefits which was already reflected as benefits payable.
3 Net of transferred amounts
Section 2:Asset Information

129
DCRB Comprehensive Annual Financial Report Volume II Annual Actuarial Valuation
2.2: Actuarial Value of District Assets as of October 1, 2006
The current actuarial value of assets method approved by the Board is the expected actuarial value of assets (assum-
ing a 7.25% return on the previous year’s AVA) plus one-third of the difference between the expected and actual cur-
rent value of assets. There is then a final adjustment made for the effect of the adjustment pursuant to D.C. Code §1-
907.02(c).
$ millions Teachers Police Fire Police & Fire Total Fund________ ______ _____ ____________ _________
(1) Actuarial Value of Assets as of
October 1, 2005 $1,104.6 $1,392.5 $541.1 $1,933.6 $3,038.2
(2) FY 2006 District Contributions $15.5 $86.9 $30.6 $ 117.5 $ 133.0
(3) FY 2006 Employee Contributions $25.1 $17.9 $7.2 $ 25.1 $ 50.2
(4) FY 2006 Estimated Benefit Payments $(24.0) $(13.3) $(3.2) $(16.5) $(40.5)
(5) FY 2006 Expected Investment Earnings4 $86.3 $103.5 $40.4 $ 143.9 $ 230.2
(6) Expected Actuarial Value of Assets as of
October 1, 2006 $1,207.5 $1,587.5 $616.1 $2,203.6 $3,411.1
(7) Final Current Value of Assets as of
October 1, 2006 $1,284.4 $1,662.5 $645.7 $2,308.2 $3,592.6
(8) Smoothed Value of Assets as of
October 1, 2006 [(6) + 1/3 x (7 – 6)] $1,233.1 $1,612.5 $626.0 $2,238.5 $3,471.6
(9) Present Value of D.C.
Code §1-907.02(c) Adjustment $(3.1) $10.0 $4.1 $14.1 $11.0
(10) Final Actuarial Value of Assets
as of October 1, 2006 [(8) + (9)] $1,230.0 $1,622.5 $630.1 $2,252.6 $3,482.6
(11) Approximate Rate of Return (on AVA) 9.6% 9.2% 9.2% 9.2% 9.3%
4 Net of transferred amounts

130
DCRB Comprehensive Annual Financial Report Volume II Annual Actuarial Valuation
3.1: Computation of Fiscal Year 2008 District Payment
This table shows the development of the fiscal year 2008 District payment. It represents the values used in the
Required Actuarial Certification under D.C. Code §1-907.
$ millions Teachers Police Fire Total__________ ________ _______ _______
(1) Present Value of Future
District Benefits $1,530.1 $2,830.0 $1,074.3 $5,434.4
(2) Actuarial Value of Assets
(Section 3.2) $1,230.0 $1,622.5 $630.1 $3,482.6
(3) Present Value of Future
Employee Contributions $228.8 $200.1 $85.5 $ 514.4
(4) Present Value of Future
Normal Costs [(1) – (2) – (3),
not less than $0] $ 71.3 $1,007.4 $ 358.7 $1,437.4
(5) Present Value Future
Payroll $3,008.0 $2,671.3 $1,137.3 $6,816.6
(6) Normal Contribution
Rate [(4) ÷ (5)] 2.4% 37.7% 31.5% n/a
(7) Projected FY 2008 Payroll $338.4 $263.2 $105.5 $ 707.1
(8) Projected FY 2008
Payment Before §1-907.02(c)
[(6) x (7)] $8.1 $99.2 $33.2 $ 140.5
(9) D.C. Code §1-907.02(c)
Adjustment (Section 3.3) $(2.1) $4.0 $0.6 $2.5
(10) FY 2008 Payment
[(8) + (9), not less than $0] $6.0 $103.2 $33.8 $ 143.0
Section 3:Actuarial Computations

131
DCRB Comprehensive Annual Financial Report Volume II Annual Actuarial Valuation
3.2: Computation of Gain/Loss from Prior Valuation — Total Plan
This table shows the development of the gains & losses for the FY 2008 payment. Changes are due to (in order):
non-salary based demographics, salary changes, asset returns, and new entrants.
2006 Results, 2006 Results, 2006 Results,Returning Returning Returning 2006 Results,Members, Members, Members, All Members,Expected Expected Actual ActualSalaries, Salaries, Salaries, Salaries,Expected Expected Actual Actual
$ millions 2005 Results Assets Assets Assets Assets__________ ________ _________ _________ _________
(1) Present Value of Future District Benefits $5,107.8 $5,315.2 $5,275.5 $5,275.5 $5,434.4
(2) Actuarial Value of Assets 3,038.2 3,422.1 3,422.1 3,482.6 3,482.6
(3) Present Value of Future Employee Contributions 531.6 477.6 476.3 476.3 514.3
(4) Present Value of Future Normal Costs $1,538.0 $1,415.4 $1,377.1 $1,316.6 $1,437.5
(5) Present Value Future Payroll $7,102.7 $6,361.2 $6,341.4 $6,341.4 $6,816.6
(6) Normal Contribution Rate 20.9% 21.1% 20.7% 19.7% 19.9%
(7) Projected FY 2008 Payroll $698.41 $672.2 $667.2 $667.2 $707.0
(8) Projected FY 2008 Payment before Adjustments $146.01 $141.7 $137.8 $131.5 $140.5
(9) (Gain)/Loss (% of payroll) N/A 0.2% (0.4)% (1.0)% 0.2%
(10) (Gain)/Loss ($ Amount) N/A $(4.3) $(3.9) $(6.3) $9.0

132
DCRB Comprehensive Annual Financial Report Volume II Annual Actuarial Valuation
Teachers’ Retirement Fund Gain/Loss
This table shows the development of the gains & losses for the FY 2008 payment. Changes are due to (in order):
non-salary based demographics, salary changes, asset returns, and new entrants.
2006 Results, 2006 Results, 2006 Results,Returning Returning Returning 2006 Results,Members, Members, Members, All Members,Expected Expected Actual ActualSalaries, Salaries, Salaries, Salaries,Expected Expected Actual Actual
$ millions 2005 Results Assets Assets Assets Assets__________ ________ _________ _________ _________
(1) Present Value of Future District Benefits $1,502.5 $1,484.9 $1,484.5 $1,484.5 $1,530.1
(2) Actuarial Value of Assets 1,104.6 1,204.4 1,204.4 1,230.0 1,230.0
(3) Present Value of Future Employee Contributions 247.4 207.8 208.9 208.9 228.8
(4) Present Value of Future Normal Costs $150.5 $72.7 $71.2 $45.6 $71.3
(5) Present Value Future Payroll $3,306.7 $2,746.5 $2,759.4 $2,759.4 $3,008.0
(6) Normal Contribution Rate 4.6% 2.6% 2.6% 1.7% 2.4%
(7) Projected FY 2008 Payroll $342.12 $313.2 $312.3 $312.3 $322.3
(8) Projected FY 2008 Payment before Adjustments $15.71 $8.1 $8.1 $5.3 $8.1
(9) (Gain)/Loss (% of payroll) N/A (2.0)% 0.0% (0.9)% 0.7%
(10) (Gain)/Loss ($ Amount) N/A $(7.6) $0.0 $(2.8) $2.8

133
DCRB Comprehensive Annual Financial Report Volume II Annual Actuarial Valuation
Police Officers’ Retirement Fund Gain/Loss
This table shows the development of the gains & losses for the FY 2008 payment. Changes are due to (in order):
non-salary based demographics, salary changes, asset returns, and new entrants.
2006 Results, 2006 Results, 2006 Results,Returning Returning Returning 2006 Results,Members, Members, Members, All Members,Expected Expected Actual ActualSalaries, Salaries, Salaries, Salaries,Expected Expected Actual Actual
$ millions 2005 Results Assets Assets Assets Assets__________ ________ _________ _________ _________
(1) Present Value of Future District Benefits $2,624.4 $2,781.7 $2,750.4 $2,750.4 $2,830.0
(2) Actuarial Value of Assets 1,392.5 1,597.5 1,597.5 1,622.5 1,622.5
(3) Present Value of Future Employee Contributions 202.2 189.6 187.4 187.4 200.1
(4) Present Value of Future Normal Costs $1,029.7 $994.6 $965.5 $940.5 $1,007.4
(5) Present Value Future Payroll $2,709.1 $2,542.0 $2,513.3 $2,513.3 $2,671.3
(6) Normal Contribution Rate 38.0% 39.1% 38.4% 37.4% 37.7%
(7) Projected FY 2008 Payroll $257.73 $256.3 $253.1 $253.1 $263.2
(8) Projected FY 2008 Payment before Adjustments $97.91 $100.2 $97.2 $94.7 $99.2
(9) (Gain)/Loss (% of payroll) N/A 1.1% (0.7)% (1.0)% 0.3%
(10) (Gain)/Loss ($ Amount) N/A $2.3 $(3.0) $(2.5) $4.5
8 Applies to Fiscal Year 2007

134
Firefighters’ Retirement Fund Gain/Loss
This table shows the development of the gains & losses for the FY 2008 payment. Changes are due to (in order):
non-salary based demographics, salary changes, asset returns, and new entrants.
2006 Results, 2006 Results, 2006 Results,Returning Returning Returning 2006 Results,Members, Members, Members, All Members,Expected Expected Actual ActualSalaries, Salaries, Salaries, Salaries,Expected Expected Actual Actual
$ millions 2005 Results Assets Assets Assets Assets__________ ________ _________ _________ _________
(1) Present Value of Future District Benefits $980 $1,048.6 $1,040.6 $1,040.6 $1,074.3
(2) Actuarial Value of Assets 541.1 620.2 620.2 630.1 630.1
(3) Present Value of Future Employee Contributions 81.9 80.3 80.0 80.0 85.4
(4) Present Value of Future Normal Costs $357.9 $348.1 $340.4 $330.5 $358.8
(5) Present Value Future Payroll $1,086.9 $1,072.7 $1,068.6 $1,068.6 $1,137.3
(6) Normal Contribution Rate 32.9% 32.5% 31.9% 30.9% 31.5%
(7) Projected FY 2008 Payroll $98.64 $102.8 $101.8 $101.8 $105.5
(8) Projected FY 2008 Payment before Adjustments $32.41 $33.4 $32.5 $31.5 $33.2
(9) (Gain)/Loss (% of payroll) N/A (0.4)% (0.6)% (1.0)% 0.6%
(10) (Gain)/Loss ($ Amount) N/A $1.0 $(0.9) $(1.0) $1.7
9 Applies to Fiscal Year 2007
DCRB Comprehensive Annual Financial Report Volume II Annual Actuarial Valuation

135
Teachers’ Retirement Fund
($ in millions)
Participant Data
October 1, 2006 October 1, 2005 Change
Active Members
Hired Prior to November 16, 1996 2,219 2,454 (9.6)%
Hired After November 16, 1996 2,869 3,253 (11.8)%
Total Active 5,088 5,707 (10.8)%
Retired Members, Beneficiaries and
Terminated Vested (Post June 30, 1997) 2,787 2,397 16.4%
Total Participants 7,875 8,104 (2.8)%
Annual Salaries of Active Members $322.3 $325.8 (1.1)%
Annual Retirement Benefits for Retirees &
Beneficiaries (Post June 30, 1997) $15.9 $14.3 11.2%
Assets and Liabilities
Present Value of Future District Benefits $1,530.1 $1,502.5 1.8%
District Assets for Valuation Purposes (Actuarial Value) 1,230.0 1,104.6 11.4%
Present Value of Future Employee Contributions 228.8 247.4 (7.5)%
Present Value of Future District Contributions 71.3 150.5 (52.6)%
Present Value of Future Salaries 3,008.0 3,306.7 (9.0)%
Current Value of
DistrictAssets (Market Value) 1,284.4 1,145.6 12.1%
Contribution Results
FY 2008 FY 2007 Change
Normal Contribution Rate 2.4% 4.6% (47.8)%
Projected Payroll $338.4 $342.1 (1.1)%
District Payment Before Adjustment $8.1 $15.7 (48.4)%
District Payment After Adjustment $6.0 $14.6 (58.9)%
3.3: Summary of Principal Valuation Results
DCRB Comprehensive Annual Financial Report Volume II Annual Actuarial Valuation

136
Police Officers’ and Firefighters’ Retirement Fund (Combined)
($ in millions)
Participant Data
October 1, 2006 October 1, 2005 Change
Active Members
Hired Prior to February 15, 1980 158 201 (21.4)%
Hired Between February 15, 1980 and November 10, 1996 2,933 3,011 (2.6)%
Hired After November 10, 1996 2,165 2,010 7.7%
Total 5,256 5,222 0.7%
Retired Members, Beneficiaries and
Terminated Vested (Post June 30, 1997) 1,301 1,141 13.5%
Total Participants 6,557 6,363 3.0%
Annual Salaries of Active Members $351.0 $339.3 3.4%
Annual Retirement Benefits for Retirees &
Beneficiaries (Post June 30, 1997) $13.0 $10.4 25.0%
Assets and Liabilities
Present Value of Future District Benefits $3,904.3 $3,605.3 8.3%
District Assets for Valuation Purposes (Actuarial Value) 2,252.6 1,933.6 16.5%
Present Value of Future Employee Contributions 285.6 284.1 0.5%
Present Value of Future District Contributions 1,366.1 1,387.6 (1.5)%
Present Value of Future Salaries 3,808.6 3,796.0 0.3%
Current Value of District Assets
(Market Value) 2,308.2 1,978.5 16.7%
Contribution Results
FY 2008 FY 2007 Change
Normal Contribution Rate 35.9% 36.6% (1.9)%
Projected Payroll $368.7 $356.3 3.5%
District Payment Before Adjustment $132.4 $130.3 1.6%
District Payment After Adjustment $137.0 $140.1 (2.2)%
DCRB Comprehensive Annual Financial Report Volume II Annual Actuarial Valuation

137
Police Officers Retirement Fund
($ in millions)
Participant Data
October 1, 2006 October 1, 2005 Change
Active Members
Hired Prior to February 15, 1980 72 97 (25.8)%
Hired Between February 15, 1980 and
November 10, 1996 2,138 2,212 (3.3)%
Hired After November 10, 1996 1,537 1,432 7.3%
Total Active 3,747 3,741 0.2%
Retired Members, Beneficiaries and
Terminated Vested (Post June 30, 1997) 1,026 901 13.3%
Total Participants 4,773 4,642 2.8%
Annual Salaries of Active Members $250.6 $245.4 2.1%
Annual Retirement Benefits for Retirees &
Beneficiaries (Post June 30, 1997) $10.1 $8.1 24.7%
Assets and Liabilities
Present Value of Future District Benefits $2,830.0 $2,624.4 7.8%
District Assets for Valuation Purposes (Actuarial Value) 1,622.5 1,392.5 16.5%
Present Value of Future Employee Contributions 200.1 202.2 (1.0)%
Present Value of Future District Contributions 1,007.4 1,029.7 (2.2)%
Present Value of Future Salaries 2,671.3 2,709.1 (1.4)%
Current Value of District Assets
(Market Value) 1,662.5 1,424.6 16.7%
Contribution Results
FY 2008 FY 2007 Change
Normal Contribution Rate 37.7% 38.0% (0.8)%
Projected Payroll $263.2 $257.7 2.1%
District Payment Before Adjustment $99.2 $97.9 1.3%
District Payment After Adjustment $103.2 $104.2 (1.0)%
DCRB Comprehensive Annual Financial Report Volume II Annual Actuarial Valuation
‘

138
Firefighters’ Retirement Fund
($ in millions)
Participant Data
October 1, 2006 October 1, 2005 Change
Active Members
Hired Prior to February 15, 1980 86 104 (17.3)%
Hired Between February 15, 1980 and November 10, 1996 795 799 (0.5)%
Hired After November 10, 1996 628 578 8.7%
Total Active 1,509 1,481 1.9%
Retired Members, Beneficiaries and
Terminated Vested (Post June 30, 1997) 275 240 14.2%
Total Participants 1,784 1,721 3.7%
Annual Salaries of Active Members $100.4 $93.9 6.9%
Annual Retirement Benefits for Retirees &
Beneficiaries (Post June 30, 1997) $2.9 $2.3 26.1%
Assets and Liabilities
Present Value of Future District Benefits $1,074.3 $980.9 9.5%
District Assets for Valuation Purposes (Actuarial Value) 630.1 541.1 16.4%
Present Value of Future Employee Contributions 85.5 81.9 4.4%
Present Value of Future District Contributions 358.7 357.9 0.2%
Present Value of Future Salaries 1,137.3 1,086.9 4.6%
Current Value of District Assets
(Market Value) 645.7 553.9 16.6%
Contribution Results
FY 2008 FY 2007 Change
Normal Contribution Rate 31.5% 32.9% (4.3)%
Projected Payroll $105.5 $98.5 7.1%
District Payment Before Adjustment 33.2 32.4 2.5%
District Payment After Adjustment 33.8 35.9 (5.8)%
DCRB Comprehensive Annual Financial Report Volume II Annual Actuarial Valuation

139
3.4: Accrued Liabilities under the Entry Age Normal Method
District benefits, as well as the value of the District ben-
efits accrued based on past service based on the Entry
Age Normal method, which assigns total liabilities to
past service (accrued liabilities), current service (normal
cost), and future service (future normal costs). The
actuarial assumptions (demographic and economic)
used for the calculations in the table below are the same
as were used to determine the required contributions.
These assumptions are described in detail in Section 1.3,
and summarized in Section 4.1 of this report.
The Governmental Accounting Standards Board
(GASB) has recently announced proposed revisions to
Standards 25 and 27, which would require “disclosure
by governments that use the aggregate actuarial cost
method of the funded status and present a multiyear
schedule of funding progress using the entry age actuar-
ial cost method as a surrogate.” This is because the
Aggregate method does not explicitly define an accrued
liability.
The table below shows the present value of the future
Present Value of Future District Benefits as of October 1, 2006
($ millions) Teachers Police Fire Total
Active Present Value of Future District Benefits $1,208.8 $2,589.1 $1,012.4 $4,810.3
Inactive Present Value of Future District Benefits
Retirees 265.1 97.7 42.4 405.2
Disabled Employees 19.9 118.4 15.6 153.9
Beneficiaries
(including QDRO) 5.3 17.7 3.0 26.0
Terminated Vested 31.0 7.1 0.9 39.0
Total Inactive 321.3 240.9 61.9 624.1
Total Present Value of Future District Benefits $1,530.1 $2,830.0 $1,074.3 $5,434.4
Accrued Liabilities for District Benefits as of October 1, 2006
Active Accrued Liability $784.7 $1,587.4 $568.8 $2,940.9
Inactive Accrued Liability 321.3 240.9 61.9 624.1
Total Accrued Liability (AL) $1,106.0 $1,828.3 $ 630.7 $3,565.0
Actuarial Value of Assets (AVA) $1,230.0 $1,622.5 $630.1 $3,482.6
Market Value of Assets (MVA) $1,284.4 $1,662.5 $645.7 $3,592.6
AVA Funding Ratio (AVA/AL) 111.2% 88.7% 99.9% 97.7%
MVA Funding Ratio (MVA/AL) 116.1% 90.9% 102.4% 100.8%
DCRB Comprehensive Annual Financial Report Volume II Annual Actuarial Valuation

140
3.5: §1-907.02(c) Adjustment to the Fiscal Year 2008 District Payment
contribution rates, which were determined as of
October 1, 2004. This result is the fiscal year 2006 con-
tribution that was required to be made by the District.
The required contribution is then compared to the
actual fiscal year 2006 contribution paid by the District.
The difference between the required and actual contri-
butions is the preliminary D.C. Code §1-907.02(c)
adjustment.
For FY 2007, none of the groups has a credit balance,
therefore there is no carryover amount that can be
applied in future years.
Beginning in fiscal year 2001, the District payment was
adjusted pursuant to D.C. Code §1-907.02(c). This sec-
tion stipulates that “… the enrolled actuary shall deter-
mine whether the amount appropriated for the applica-
ble fiscal year resulted in an overpayment or a shortfall
based upon the actual covered payroll.”
The D.C. Code §1-907.02(c) adjustment to the fiscal
year 2008 District payment is calculated by taking the
actual fiscal year 2006 covered payroll for each employ-
ee class (which is provided by the District) and multi-
plying by the corresponding fiscal year 2006 normal
$ millions Teachers Police Fire
(1) Actual FY 2006 Covered Payroll $316.2 $237.6 $92.0
(2) FY 2006 Normal Contribution Rate 4.3% 38.0% 33.7%
(3) Actual FY 2006 Contribution Required $13.6 $90.3 $31.0
(4) Actual FY 2006 Contribution Paid $15.7 $86.3 $30.4
(5) Preliminary D.C. Code §1-907.02(c) Adjustment to
FY 2008 Payment [(3) – (4)] $(2.1) $4.0 $0.6
(6) FY 2007 Unrecognized Amount $0.0 $0.0 $0.0
(7) Final D.C. Code §1-907.02(c) Adjustment to FY 2008 Payment
[(5) + (6)] $(2.1) $4.0 $0.6
DCRB Comprehensive Annual Financial Report Volume II Annual Actuarial Valuation

141
DCRB Comprehensive Annual Financial Report Volume II Annual Actuarial Valuation
4.1: Schedules of Funding Status andEmployer Contributions Required UnderGASB Statement No. 25
The Governmental Accounting Standards Board
(GASB) Statements No. 25 and 27 relate to the disclo-
sure of pension liabilities shown in public employers’
financial statements. For accounting periods beginning
after June 15, 1996, information required under these
statements must be prepared for public employers who
seek compliance with generally accepted accounting
principles (GAAP) on behalf of their public employee
retirement systems.
GASB Statement No. 25 requires preparation of
schedules of funding status and employer contribu-
tions, as well as the disclosure of plan provisions, actu-
arial assumptions, and other information.
The required schedules are shown below. In each
case, we have relied upon information from our files
and contained in the reports of other actuaries
employed by the District in completing the schedules.
While we have no reason to believe that this informa-
tion is inaccurate, we strongly recommend that employ-
er personnel verify the schedules below before they are
included in the District’s financial statements.
The District of Columbia Retirement Board uses the
Aggregate actuarial cost method and is therefore not
required to disclose a schedule of funding progress.
There is a proposal (in exposure draft format at the time
of this report) which would require funds using the
Aggregate method to disclose funding status informa-
tion based on Entry Age Normal (EAN) calculations.
The numbers shown below have been determined based
on this actuarial cost method.
Section 4:Disclosure Information
EAN Unfunded Unfunded
Actuarial Actuarial Actuarial Actuarial Liability as a
Valuation Value of Accrued Accrued Covered Percent
Date Assets Liability Liability Funded Ratio Payroll of Payroll
10/1/2006 $3,482.6 $3,565.0 $82.4 97.7% $673.4 12.2%

142
DCRB Comprehensive Annual Financial Report Volume II Annual Actuarial Valuation
Schedule of Employer Contributions($ in Millions)
Police Officers andTeachers’ Retirement Fund Fire Fighters’ Retirement Fund Total Fund
Annual Annual Annual
Year Required Percentage Required Percentage Required Percentage
Ending Contribution Contributed Contribution Contributed Contribution Contributed
9/30/1998 $9.6 100% $47.7 100% $57.3 100%
9/30/1999 $12.8 145% $35.1 100% $47.9 112%
9/30/2000 $10.7 100% $39.9 100% $50.6 100%
9/30/2001 $6.6 100% $47.0 100% $53.6 100%
9/30/2002 $1.0 100% $61.4 100% $62.4 100%
9/30/2003 $0.0 100% $69.8 100% $69.8 100%
9/30/2004 $2.9 100% $95.5 100% $98.4 100%
9/30/2005 $10.2 100% $106.2 100% $116.4 100%
9/30/2006 $15.7 100% $116.7 100% $132.4 100%
The table below summarizes certain information about this actuarial report.
Valuation date October 1, 2006
Actuarial cost method for Contributions Aggregate
Actuarial cost method for Accrued Liabilities Entry Age Normal
Amortization method N/A
Remaining amortization period N/A
Asset valuation method Actuarial value: 1/3 Excess earnings subtracted from
expected actuarial value.
Actuarial assumptions:
Investment rate of return* 7.25%
Projected salary increases* 5.4% - 9.0% for Teachers, 5.5% - 10.0% for Police
Officers and Fire Fighters
*Includes inflation at 5.0%
Cost of living adjustments 5.0%
(COLA limited to 3.0% for those hired after November 10, 1996)