Volume 1 Journal on Management Issue- · PDF fileJournal on Management ... Datta Meghe...
108
www.dmietr.edu.in ISSN 2449 -9253 DMIETR JUNE-2013 Volume-2 Journal on Management Outlook Department of Business Management (MBA) Datta Meghe Institute of Engineering, Technology & Research, Wardha.
Transcript of Volume 1 Journal on Management Issue- · PDF fileJournal on Management ... Datta Meghe...

International Journal on journal)
Volume 1
Issue- June
ISSN 2449 -9253
www.dmietr.edu.in ISSN 2449 -9253
DMIETR
JUNE-2013
Volume-2
Journal on Management
Outlook
Department of Business Management (MBA)
Datta Meghe Institute of Engineering, Technology
& Research, Wardha.
ISSN 2449 -9253 DMIETR Journal on Management Outlook
2
ISSN 2449-9253
DMIETR Journal on Journal on Management Outlook
(e journal)
Volume 2
Issue- JUNE 2013
DMIETR, Wardha

ISSN 2449 -9253 DMIETR Journal on Management Outlook
3
©DMIETR,
No part of this publication may reproduced store in a retrieval system or
transmitted in any form or by any means, electronic, mechanical,
photocopying, recording or otherwise, without the prior permission of
the publisher, Press, DMIETR. The publisher does not responsible does
not assume any responsibility for any injury and / or damage to person
or property as matter of product liability , negligence or otherwise or
from any use or operation of any use or operation of any method ,
instruction or ideas contained in material here in.
ISSN 2449 -9253 DMIETR Journal on Management Outlook
4
Chief Editor Prof. Shailesh Kediya, HOD, D.M.I.E.T.R
Managing Editors
Prof. Atul Kharad Prof. Rupesh Dahake
Lecturer, Lecturer
D.M.I.E.T.R. Wardha D.M.I.E.T.R, Wardha
Editorial Advisory Board Editorial Board
Dr. Sachin Untawale
Chairman & Principal
D.M.I.E.T.R.
Dr. Kiran Nerkar
Associate Editor
Dr. Vinayak Deshpande
Professor & Director,
Department of Business Management,
RTM Nagpur university, Nagpur
Dr. Ajit Shringarpure
Associate Editor
Dr. D. K. Agrawal
Former Dean,
Faculty of Engineering,
RTM Nagpur University, Nagpur
Dr. K. V. Somnadh
Associate Editor
Dr. Kiran Nerkar
Chairman,
Business Management Board,
RTM Nagpur university, Nagpur
Dr. Ajay Pethe
Member
Dr. Shiny Chib
Professor, DMIMS, Nagpur
Prof. Amol Narayane
Member
Prof. Prasanjit Bhagat
Govt. Polytechnic College, Arvi
Prof. Pravin Katariya
Member

ISSN 2449 -9253 DMIETR Journal on Management Outlook
5
Index
Sr. No Name of the Author Topic Name Page
No.
1
Dr. Bharat Meghe,
Dr. Kiran Nerkar
Prof. Shailesh O. Kediya
A Case Study On Performance Management
Of Logistic Management 6
2
K. Venu Gopal
Guntuboina Ravikumar .L.S
Dr K.V.Somanadh
Succession Planning Of Family Business:
The Entreprenerurial Perspectives 18
3 Prof. Dr. Ravish A. Sarode
Prof. Dr. Parag R. Kawley
“Agriculture Distress In Wardha District In
The Vidarbha Regionof Maharashtra” 29
4 Mrs. Sangeeta Pandit Health Care Management In Cancer Care-An
Exploratory Study 44
5
Dr. Bharat Meghe,
Dr. Kiran Nerkar,
Prof. Shailesh O. Kediya
A Case Study On Performance Management
Of Logistic Management 63
6
Kapil V. Deshmukh
Prof. R. A. Lekurwale,
Nilesh Dhote
Non-Contact Length Measurement 75
7 Mr. Aditya Bal Environment Management Audit: -A
Supporting Tool For “Challenging Problems
In Environment Management 79
8 Dr. Milind R. Patil Invasion of MNCs on Indian Economy 89
9 Prof.Shayam Fardale, Prof.Amol Narayane & Prof.Dr.Rajiv Jadhao
Total Quality Management Or TQM In New
Organization 91

ISSN 2449 -9253 DMIETR Journal on Management Outlook
6
A case study on performance management of Logistic Management
Dr. Bharat Meghe,
Dean, Faculty of Commerce, RTM Nagpur University, Nagpur
, Dr. Kiran Nerkar,
Chairman, Business Management Board, RTM Nagpur University, Nagpur
Prof. Shailesh O. Kediya
HOD, MBA, Datta Meghe Institute of Engineering, Technology & Research, Wardha, [email protected]
Abstract:
Logistic Management works in the areas of planning, organizing, and managing the flow of
goods, information and other resources between the point of production and point of
consumption. The logistics and its processes have a good impact in almost every sector of the
industries. There is a growing concern for the macro and micro level logistics of Indian steel
industry since it is highly material intensive. The objectives of this paper is to study the logistics
management practices at Lloyds Steel Industries Ltd & to study various performance indicators
of logistic management such as Profit Before Interest, Depreciation, Taxes and Margin
(PBIDTM), Earning Before Interest, Depreciation, Taxes and Margin (EBITM), Return On
Capital Employed (ROCE), Working Capital Cycle (WCC) and Debtor Turnover (DT). The
scope of this study is restricted to 6 Steel Industries. The facts and figures for this study are
collected over past 10 years. The statistical tools such coefficient of variation and decisions
under uncertainty like Criterion of Optimism, Pessimism, Savage and Laplace are implemented
to find the best alternative for a respective performance indicator.
Keywords: Logistics, Decision under uncertainty, performance indicator, material sensitive.
A. Introduction:
A.1. Concept of Logistics:
Council of Logistics Management (1991) defined that logistics is 'part of the supply chain process
that plans, implements, and controls the efficient, effective forward and reverse flow and storage of
goods, services, and related information between the point of origin and the point of consumption
in order to meet customers' requirements'. Johnson and Wood's definition (cited in Tilanus, 1997)
uses 'five important key terms', which are logistics, inbound logistics, materials management,

ISSN 2449 -9253 DMIETR Journal on Management Outlook
7
physical distribution, and supply-chain management, to interpret. Logistics describes the entire
process of materials and products moving into, through, and out of firm.
A. 2. Nature, Need and Significance of the study:
Lloyds Steel Industry Ltd, Bhugaon, Wardha, incurs huge cost on transportation both for incoming
raw material and outgoing finished product. The industry use outsourcing for transportation and
mostly the nature of outsourcing is contractual for efficient transportation. Various decisions
regarding inventory, transportation and other logistics activities affects the overall cost of the
production.
The study aims at analyzing the nature of the problems related to logistics management in Lloyds
Steel Industries Ltd, Bhugaon, Wardha and provide the optimal solution to logistics management
in Lloyds Steel Industries, Bhugaon, Wardha.
A.3. Aims and Objectives:
The aim of the study is to understand the complexities of the logistics management and to present
this in a simple lucid manner.
A. 3. 1. Objectives:
1. To study the factors those are critical for the success of logistics management in the
industry
2. to study the various performance indicators of logistic management such as Profit Before
Interest, Depreciation, Taxes and Margin (PBIDTM), Earning Before Interest,
Depreciation, Taxes and Margin (EBITM), Return On Capital Employed (ROCE),
Working Capital Cycle (WCC) and Debtor Turnover (DT).
A.4. Scope:
As mentioned, the study is related to integrated logistics management. It is limited to steel
industries specially Lloyds steel industries ltd, Bhugaon, Wardha. The logistics data of other steel
industries taken wherever required.
A.5. Limitations:
ISSN 2449 -9253 DMIETR Journal on Management Outlook
8
The study is limited to Lloyds Steel Industries Ltd., Bhugaon, Wardha only. Wherever possible
the data from other company and industry is taken for proper results.
B. Logistics Management- Historical Development & Literature Review
Logistics was initially a military activity concerned with getting soldiers and munitions to the
battlefront in time for flight, but it is now seen as an integral part of the modern production
process. The main background of its development is that the recession of America in the 1950s
caused the industrial to place importance on goods circulations. The term, logistics, was initially
developed in the context of military activities in the late 18th and early 19th centuries and it
launched from the military logistics of World War II. The probable origin of the term is the
Greek logistikos, meaning 'skilled in calculating'. (BTRE, 2001) Military definitions typically
incorporate the supply, movement and quartering of troops in a set. And now, a number of
researches were taken and made logistics applications from military activities to business
activities.
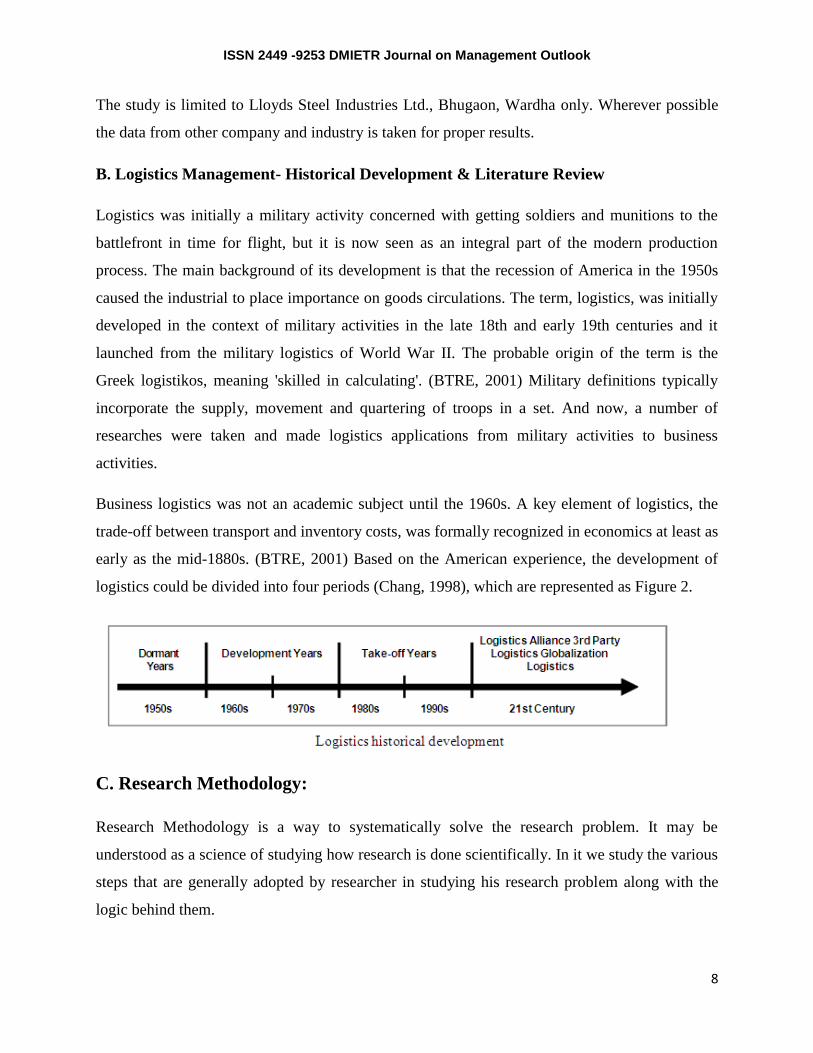
Business logistics was not an academic subject until the 1960s. A key element of logistics, the
trade-off between transport and inventory costs, was formally recognized in economics at least as
early as the mid-1880s. (BTRE, 2001) Based on the American experience, the development of
logistics could be divided into four periods (Chang, 1998), which are represented as Figure 2.
C. Research Methodology:
Research Methodology is a way to systematically solve the research problem. It may be
understood as a science of studying how research is done scientifically. In it we study the various
steps that are generally adopted by researcher in studying his research problem along with the
logic behind them.

ISSN 2449 -9253 DMIETR Journal on Management Outlook
9
C.1. Research Design:
A research design is a master plan specifying the methods and procedures for collecting and
analyzing the needed information. It is a framework or blueprint that plans the action for the
research work.
Different research designs can be conveniently described if we categories them as :
Exploratory Research Studies
Descriptive & Diagnostic Research Studies
The researcher has used Exploratory Research Technique to get into the insights of the
proposed research work. When the purpose of a research is to gain familiarity with a
phenomenon or acquire new insights into it in order to formulate a more precise problem or
develop hypothesis, the exploratory research comes in handy.
C.2. Data Collection Methods:
The data is the raw material with which the foundation of subsequent analysis and statistical
interpretation is firmly laid.
The data are of two types:-
Primary Data, and
Secondary Data
Primary Data collection:
There are several methods of collecting primary data. Important methods are 1. Observation
method 2. Interview Method 3. Through Questionnaires 4. Through Schedules.
Out of these available methods the researcher has collected the primary data by following
methods:
Direct personal observation
Interview method- personal interview – Structured & unstructured interview
Secondary Data:

ISSN 2449 -9253 DMIETR Journal on Management Outlook
10
The researcher has collected secondary data required for this particular research work through
the following sources:
Annual Reports of Lloyds Steel Industries Ltd.
Books
Magazines
Management Journals – Specifically SCM and Logistics journals
Internet – published articles and informative websites.
C.3. Sampling:
The study is mainly related to Lloyds Steel Industries Ltd. Bhugaon, Wardha only. The relevant
financial data and non-financial data are collected for the period of year 2005-2010 in most of
the cases. Wherever possible & available data before year 2005 was also accessed.
C.4. Analysis:
Analysis and interpretation are giving meaning to the collected information by comparing them
with the existing information.
The stages followed by the researcher for the data analysis are:
1. Editing
2. Tabulation and graphical representation
3. Hypothesis testing
The researcher has used Karl Pearson Coefficient of Correlation & one tailed one sampled sign
test for small samples for hypothesis testing.
D. Logistics Management in Lloyds Steel Industries
There are logistics Management activities both inbound and outbound processes or even during
the in process. The main logistic activities are as follows:
D.1. Purchasing and Material Management
ISSN 2449 -9253 DMIETR Journal on Management Outlook
11
It has found that the procurement of raw materials for Lloyds Steel Industry is very complex.
Raw material purchasing plan of Lloyds steel Company is based on forecasts both in terms of
quantity and quality and the forecast of the steel price in the market. This is also based on the
available capital with the industry. The reasons of this complexity are as follows:
1) Raw materials cost which is the major cost of steel production fluctuates all the time. During
the study period of 2005-10, it has been found that average raw material cost constitutes 45.50%
to the total cost incurred in the company & 47.70 % of the average sales of the company. This
has made the purchasing plan cannot run according to normal period of time as it should be. At
times, when the Company realized that the price of raw materials decreased and there is a trend
that it will increase in the near future and if the Company have sufficient capital to buy a big
quantity of raw materials in order to reduce risk on the increasing price in the future, they will
order a big quantity of raw materials which are much more than what they normally need in each
production cycle.
2) Major Raw Material required for production is sprung iron, steel scrap and pig iron. Only
scrap is imported from UK, USA and Middle East. Rest of the raw material is purchases from
different cities from India i.e. Ghughus-Kadali, Bombay, Raipur, Bhandara and so on.
D.2. Warehouse Management
Warehouse acts as a linking activity between seller of raw materials and steel Company or
between steel Company and consumers. Raw materials are kept at the warehouse for further use
in the production process. If there is no warehouse, the factory might lack of raw materials in the
production process. In another case, warehouse was used to keep the finished products to wait
for further deliveries to the customers. So, warehouse acts as a support to the production process
to run according to the schedule and it has an important role in terms of marketing in order to
respond to the needs of the customers.
From the research, it has found that there is no warehouse with the company. There are few
bunkers with the company. The characteristics are as follows:
1) Pig Iron and Scrap is stored at bunker.
2) Raw materials which are intermediate and finished products is stored inside the factory
premises.
3) The locations of the bunkers of steel products are mostly in the same location as the
production area waiting for future transportation or delivery to the customers. This is because the
steel industry products are very heavy and has very low flexibility in terms of moving. In case of
moving, it is necessary to use special and expensive equipment and tools like Mobile Cranes and
EOT (Electric Overhead Trains).
ISSN 2449 -9253 DMIETR Journal on Management Outlook
12
4) Other marketing activities i.e. packaging, labeling, quality controlling happens inside the
factory building.
D.3. Inventory Management
Inventory management activities in the company are logistics activities which happened during
the inbound, in process, and outbound logistics process. Inbound logistics of raw materials are
quite complicate in the quantity calculation.
Company uses the Kanban system for inventory management. An important determinant of the
success of production scheduling based on "pushing" the demand is the quality of the demand
forecast that can receive such "push."
Kanban, by contrast, is part of an approach of receiving the pull from the demand. Therefore, the
supply or production is determined according to the actual demand of the customers. In contexts
where supply time is lengthy and demand is difficult to forecast, the best one can do is to
respond quickly to observed demand.
D.4. Transportation and Material Handling Activities
Transportation and material handling is an important logistics activity which creates the
circulation of products throughout all the supply chain efficiently. From the research, it has
found that transportation is outsourced.
This is due to the fact that these Outsource companies are more efficient in managing
transportation to prevent empty trips, as they are able manage transportation between several
customers. Besides, it has found that the characteristics of raw materials and finished products
transportation in the company are as follows:
1) Inbound transportation
Transportation of various raw materials imported from abroad is mostly in CIF (Cost, Insurance
and Freight) term.
Various transportation costs incurred before the arrival at the destination port, has already
included in the raw materials costs. Transportation mode is the Bulk Vessel. For the local
companies, the transportation costs will be the transportation costs from the port to the factory.
For the transportation of raw materials from local sources, each supplier makes the delivery to
the factory by truck. There is a Weighing Scale at the factory to weight both incoming truck and
outgoing truck (empty truck) in order to find the weight of raw material sold to the factory. The
type of truck depends on the quantity of the scrap they transported.
2) Outbound transportation

ISSN 2449 -9253 DMIETR Journal on Management Outlook
13
Due to the fact that the steel products are very heavy in weight and/or very long in size, it is
necessary to use long truck called Flat Base Trailer which could handle more weight than other
trucks. The moving of intermediate steel products needs lifting machines i.e. Crane.
Besides, there are other special tools designed for each type of steel i.e. Plate Clamp which is
used to seize the steel plate during transportation.
D.5. Customer Response Management
From the research, it has found that Company has organized customer services in order to
respond to customer‘s needs very well by using small amount of staff for such activity. This is
due to the fact that customers are relatively fixed and situated in identified locations. However, if
there is any mistake incurred with the products under delivery schedule, between delivery
processes or after delivery to consumers, company also has efficient measures to correct these
mistakes.
D.6. Reverse Logistics Activities
In Lloyds steel industry, it has found that it has very little reverse logistics cost. Sales return
amounts less than 1% to the total sale. From the study, there are following operations:
1) Steel Company have got processes and management to handle returned products from their
customers when the quality of the products delivered did not meet customer‘s needs by changing
the correct ones or offer discount for the next purchases etc.
2) LSIL manages wastes incurred during the production process by reselling them to local steel
manufactures that can use those wastes as raw materials in another production or by recycling
the waste.
D.7. LEAD TIME AND LOGISTICS COST FOR LLOYDS STEEL INDUSTRY
Another output from the study is lead time which is one of the performance measures in logistics
management. Lead time in supply chain for the upstream process in case of importing raw
material is higher than the supply from within nation vendors. Downstream lead time varies from
15 days to 21 days depending upon different products and locations.
E.Graphical Representation:
Lloyds Steel Industries, Bhushan Steel Ltd., JSW Steel Ltd., Pennar Industries Ltd., Real Strips
Ltd., Ruchi Strips & Alloys Ltd. are compared on various parameters like PBIDTM, EBITM,
ROCE, Inventory Turnover, Working capital turnover & Debtor turnover. The graphical
presentation & results are give below:-

ISSN 2449 -9253 DMIETR Journal on Management Outlook
14
1.Graph showing PBIDTM 2. Graph showing EBITM
3. Graph showing ROCE 4. Graph Showing Inventory Turnover in Times
5. Graph showing Working Capital Cycle 6. Graph showing Debtors turnover in days.
Statistical Inferences:
Based on the data collected, the average and the standard deviation were calculated to determine
the coefficient of variations. The following table reflects the ranking with respect to the
consistency related to the each parameter under consideration.

ISSN 2449 -9253 DMIETR Journal on Management Outlook
15
Plants\ Factors PBIDTM EBITM ROC IT WCC DT
Lloyds Steel Industries
6 2 1 2 2 1
Bhushan Steel Ltd. 2 4 2 6 6 4
JSW Steel Ltd. 4 5 4 4 4 2
Pennar Industries Ltd.
1 1 6 1 1 3
Real Strips Ltd. 3 3 3 3 3 6
Ruchi Strips & Alloys Ltd.
5 6 5 5 5 5
Criterion \ Factors PBIDTM EBITM ROC IT WCC DT
Optimism
Criterion Pennar Industries Ltd
Pennar Industries Ltd
Lloyds Steel Industries
Pennar Industries Ltd
Pennar Industries Ltd
Lloyds Steel Industries
Pessimism
Criterion Pennar Industries Ltd
Pennar Industries Ltd
Lloyds Steel Industries
Pennar Industries Ltd
Pennar Industries Ltd
Lloyds Steel Industries
Savage Criterion Bhushan Steel Ltd.
Lloyds Steel Industries
Bhushan Steel Ltd.
Lloyds Steel Industries
Lloyds Steel Industries
JSW Steel Ltd.
Laplace Criterion Pennar Industries Ltd
Pennar Industries Ltd
Lloyds Steel Industries
Pennar Industries Ltd
Pennar Industries Ltd
Lloyds Steel Industries
Conclusion:
On an average, PBIDTM has increased year on year basis.
On an average, EBITM has increased year on year basis
When logistics cost decreases operating profit may increase and vice-versa.
Higher inventory turnover may not increase the operating profit.
Fast working capital cycle increases the operating profit.
Fast Debtor turnover results in higher operating profit.
When logistics cost is lower, it may not reduce the overall cost.
Pennar Industries Ltd is one of the consistent industry as compared to all the other
Logistics management plays a vital role in steel industry. It has direct impact on profitability of
the steel company. The logistics management is also very important to gain customer
satisfaction. Lloyds Steel Industries Ltd. is so far lagging behind in logistics management as
ISSN 2449 -9253 DMIETR Journal on Management Outlook
16
compare to the industry standard. The efforts should be taken to improve the logistics
performances.
Bibliography and References.
1] Alberto P (2000), "The Logistics of Industrial Location Decisions: An Application of the
Analytical Hierarchy Process Methodology", International Journal of Logistics: Research
and Application.
2] Bearnon, B.M (1998), "Supply Chain design & analysis: Models & Methods,"
International Journal of Production Economics.
3] Cooper, M. C. and Ellram, L M. (1993),'Characteristics of Supply Chain Management
and the Implications for Purchasing and Logistics Strategy', The International Journal of
Logistics Management.
4] Vaidya Sanjiv, Ghosh, S. and Agarwal Vivek (2004). "Supply Chain Management – The
ERP way". Supply chain management – for global competitiveness Edition II.
5] Hays, William Lee, (1973) Statistics for the Social Sciences, Holt, Rinehart and Winston.
6] Creswell, J. (1998). Qualitative inquiry and research design: Choosing among five
traditions. Thousand Oaks, California: Sage Publications.
7] Creswell, J. (2003). Research Design: Qualitative, Quantitative, and Mixed Methods
Approaches. Thousand Oaks, California: Sage Publications.
8] S Saha, Standard Deviation, Measures of Dispersion, Business Statistics.
9] Khanna, K.K. (1985), Physical Distribution management-Logistical Approach, Himalaya
publication house.
10] Roy, Chowdhury B.K., (1990), Logistics Management, Universal publishing house.
ISSN 2449 -9253 DMIETR Journal on Management Outlook
17
Websites :
1. www. Wikipedia.com
2. http://www.logisticsworld.com/logistics.htm
3. http://www.steelworld.com/proessar.pdf
4. http://www.sundram.com/logistics.htm
5. www.cnbc.com/
6. http://dssresearch.com
7. www.google.com
8. http://www.icra.in/Files/PDF/SpecialComments/2010-February-Steel.pdf
9. http://newsletters.cii.in/newsletters/steelsummit2009/pdf/SESSION_1/RVS_Ramakrishna
10. http://www.burke.com.
11. http://www.research-int.com
12. http://www.cmor.org

ISSN 2449 -9253 DMIETR Journal on Management Outlook
18
SUCCESSION PLANNING OF FAMILY BUSINESS:
THE ENTREPRENERURIAL PERSPECTIVES
K. Venu Gopal*
*Faculty member, MBA Department, Aditya Institute of Technology & Management, Tekkali,
Srikakulam Dist (AndhraPradesh)-532201, Email- [email protected], M- 91-
9866663988.
Guntuboina Ravikumar .L.S**
**Scholar, Department of Commerce and Management Studies, Andhra University,
Visakhapatnam E-mail:[email protected], Mobile: 9849049820.
Dr K.V.Somanadh***
***Assistant Professor, G.S.College of Commerce, Wardha, Maharashtra. E- mail:
[email protected] Mobile No: 8007787321.
Introduction
Family businesses are an important group of enterprises not only within the small and
medium-sized (SME) sector but also many of the world‘s large enterprises are in family
businesses. Dispite a few statistics feed enough to map the presence of family businesses
throughout the world, many studies conducted in different countries have confirmed the weight
these businesses carry in national economies. In the past, family businesses were often perceived
to be the weakest type of enterprises; if they were successful, it would be concluded that such
success was attributed to their family character.

ISSN 2449 -9253 DMIETR Journal on Management Outlook
19
Though family businesses account for more than 85% of businesses in India, yet there is
aucity of knowledge about their ways of organizing and managing business in these rapidly
changing times. Several studies estimate that only 30 percent of family enterprises survive to the
second generation because of unsolved or badly solved transition of ownership and management
to the next family generation and many enterprises fail soon after the second generation takes
control . Failure in succession represents a serious problem not only for family enterprises and
their employees, but also for the prosperity of an economy. Intergenerational succession
represents a crucial point in the lifecycle of any family business and, as such, has been a primary
focus of research. According to Howorth and co-authors (2006), the transfer of entrepreneurial
learning between family members and the revitalization of entrepreneurial spirit through the
transfer of ownership and management provide rich insights for entrepreneurship research.
Family firms must have a long-term view in managing their business. Poor succession
planning leads to uncertainties in future, family conflicts for control and adverse impact on
business performance. Therefore, family firms must take all contingencies into account and
systematically plan for the development of second line of command that is, the next generation
of the owning family. Proper training and timely grooming of the younger generation equip the
successors to effectively discharge their duties in future. Systematic integration of family
members in the business helps maintain the thread of continuity in business leadership. For the
plan to work effectively, it is important that successors must be provided timely inputs related to
the goals, expectations and obligations of their positions. Well-documented succession plan must
be evolved that clearly outlines the roles and responsibilities of all succeeding family members.
The younger generation must be motivated and supported to take up leadership role in future.
Main goal of contribution is to broaden our understanding of family businesses‘ succession
issues & possible solutions, with special focus on succession planning & supporting
infrastructure needed in order to carry out transfer of ownership and management successfully.
Objectives of the study:
1. To find out the entrepreneurial perspectives exist in the successive planning of the
business;
2. Whether exists any impact on the part of the existing enterprise due to the successive
planning or not;
ISSN 2449 -9253 DMIETR Journal on Management Outlook
20
3. To draw attention towards the required changes for adoption in the case of the successive
planning of entrepreneurial management.
Limitations of the study:
1. The study is completely based on the secondary data;
2. The practices considered have been of both national and international;
3. The study has been of the experiences of the Small and Medium Enterprises only.
Literature Review:
Numerous attempts have been made to articulate conceptual and operational definitions
of a family enterprise. The focus of most of these efforts has been on defining family enterprises
so that they can be distinguished from non-family enterprises. However, none of these attempts
has resulted in a generally accepted definition in either developed market economies or post-
socialist countries. Researchers also question the homogeneity of these enterprises since a large
majority of enterprises in most countries involve a significant ―family‖ impact. Empirical
research has revealed that family enterprises vary in terms of degrees of family involvement
(e.g., Sharma, 2004), which can change during the lifetime of the family business and is well
illustrated within different family business developmental models (e.g., Gersick et al., 1997).
Mandl (2008, 2), in the study ―Overview of family business relevant issues,‖ found 90 different
definitions across 33 European countries, which mainly require major family influence on
ownership and management/strategic control. Other characteristics used to differentiate family
businesses from non-family ones were the active involvement of family members in the
enterprise‘s everyday activities, the enterprise‘s contribution to the family‘s income generation,
and intergenerational considerations. A recent study (Mandl, 2008,) confirms the absence of a
single definition of a family business that would be ―widely and exclusively applied to every
conceivable area, such as to public and policy discussions, to legal regulations, as an eligibility
criterion for support services, and to the provision of statistical data and academic research.‖ The
lack of a single definition for family business leads to other problems in addition to the absence
of reliable and comparable data on family businesses in national economies.
Chrisman and co-authors (2005, 556-557) describe such approaches to definitions as the
components-of-involvement approach to defining a family enterprise and thus propose as more
adequate definition whose essential approach is "based on the belief that family involvement is
only a necessary condition; family involvement must be directed toward behaviors that produce

ISSN 2449 -9253 DMIETR Journal on Management Outlook
21
certain distinctiveness before it can be considered a family firm." As such, two enterprises with
the same extent of family involvement may not be family businesses if either lacks the intention,
vision, familialness, and/or behavior that constitute the essence of a family business. The essence
approach in Family Businesses: The Extensiveness of Succession Problems and Possible
Solutions defining a family business is followed in this contribution. Therefore, we do not create
an operational definition, but rather explain some distinguishing characteristics of family
businesses. Many studies indicate that family enterprises have unique developmental
characteristics compared to non-family enterprises. Steier and Ward (2006) suggested that family
businesses differ from non-family ones along important strategic and organizational dimensions.
As the term family business implies, the most important differences have something to do with
how a family influences the behavior of a firm. Mandl (2008, 54-55) exposed one of the most
important characteristics of family businesses—namely, the strong inter-relationship between the
family and the business; the family is at the center of the enterprise, formally (e.g., through
ownership, involvement in management or employment) or informally (e.g., by providing advice
and consultancy) influencing the business. These parallel decision-making lines increase the
complexity of the enterprise‘s functioning. According to Olson and co-authors (2003), family
businesses are complicated by dynamics within the family that owns and manages them. These
dynamics affect not only business performance, but also business growth, change, and transitions
over time.
Succession planning increases the availability of experienced and capable employees that
are prepared to assume these roles as they become available. Taken narrowly, "replacement
planning" for key roles is the heart of succession planning. Effective succession or talent-pool
management concerns itself with building a series of feeder groups up and down the entire
leadership pipeline or progression (Charan, Drotter, Noel, 2001). In contrast, replacement
planning is focused narrowly on identifying specific back-up candidates for given senior
management positions. For the most part position-driven replacement planning (often referred to
as the "truck scenario") is a forecast, which research indicates does not have substantial impact
on outcomes.
In addition to a business‘s creation and growth, succession is a crucial phase in the firm‘s
lifecycle. Many authors (e.g., Handler, 1994; Sharma et al., 2003) differentiate between

ISSN 2449 -9253 DMIETR Journal on Management Outlook
22
succession in management and succession in ownership, although in most SMEs (both family
and non-family) both processes go hand-in-hand. Succession is one of the key developmental
problems in the SME population; however due to the involvement of a Entrepreneurship -
Gender, Geographies and Social Context family in the business it is much more emotional in
family businesses (e.g., Kets de Vries, 1993; Morris et al., 1997; Sharma et al., 2003). Research
results indicate that succession in family businesses often does not work out (Dyck et al., 2002;
Kets de Vries, 1993; Morris et al., 1997; Sharma et al., 2003), which is why succession is one of
the most studied and researched issues in the field of family business research (Sharma, 2004).
Although this subject accounts for approximately one third of the family business literature, no
general theory of succession or succession planning in family enterprises has emerged (Sharma
et al., 2003). Failure in succession represents a serious problem not only to family enterprises,
but also to the health of an economy. Owner-managers are often not aware of the problem of
securing the continuity of their enterprises. Due to their occupation with daily operational
problems, they often cannot—or do not want to—start preparing changes in ownership and
management of their enterprises early enough. They are often not aware of the crucial
importance of solving succession issues on time.
Although many problems are linked to family business succession, according to
Molly and co-authors (2010), it should not necessarily be seen as a negative event in the lifecycle
of a family business as no evidence is found that a family firm‘s profitability is affected by
succession. The succession is more a process than an event of transferring ownership and
management control to the successor (Overview of Family Business, 2009, 16); it is a multistage
process that occurs over time, beginning before heirs even enter the business (Handler, 1994).
According to Longenecker and Schoen (1996), parent-child succession in the leadership of a
family business involves a long-term diachronic process of socialization. In other words, family
successors are gradually prepared for leadership through a lifetime of learning
experiencesHandler (1994) exposed the need of mutual role adjustment.
Research indicates many succession-planning initiatives fall short of their intent
(Corporate Leadership Council, 1998). "Bench strength," as it is commonly called, remains a
stubborn problem in many if not most companies. Studies indicate that companies that report the
greatest gains from succession planning feature high ownership by the CEO and high degrees of

ISSN 2449 -9253 DMIETR Journal on Management Outlook
23
engagement among the larger leadership team. Companies that are well known for their
succession planning and executive talent development practices include: General Electricals,
IBM, Pepsi etc.
Transfers of management and ownership by Succession Planning
Succession planning refers to the deliberate and formal process that facilitates the transfer
of ownership and management control. There is significant overlap between activities considered
by researchers to be components of the succession process and those activities considered to be
parts of succession planning (Sharma et al., 2003). In opinion of many authors (Morris et al.,
1997; Sharma et al., 2003) succession planning is expected to help improve the probability of the
success for the succession process. According to the experts‘ opinion, the necessary preparation
period may take from five to ten years. If the preparation and planning also includes the
qualification of a potential successor, even longer periods may be required (Transfer of SMEs,
2002, 21). Many studies show that successions are not planned in due time (Bjuggren & Sund,
2001; Sharma et al., 2003) and that the first generation family enterprises did less succession
planning than the second and third generation family enterprises (Sonfield & Lussier, 2004).
Studies within the EU Member States also indicate that the majority of owner-managers did not
take the necessary steps to plan and carry out upcoming successions. This results in failed
business transfers, which take jobs, assets and opportunities with them (Transfer of SMEs,
2002). Also the research carried out in Slovenia show that family businesses‘ ownermanagers are
not always aware of the importance of timely succession preparations.
Transparent marketplaces for the transfer of businesses
In addition to raising awareness, specific consultancy, and mentoring that facilitates the
transfer process, marketplaces that provide a platform for bringing together potential buyers and
sellers are an important tool for fostering successful business transfers. Marketplaces are
increasingly important since the number of transfers to third parties is increasing. It is therefore
becoming more and more important to facilitate the matching of potential buyers and sellers of
businesses, thereby contributing to successful transfers. According to findings from the project
on fostering transparent marketplaces for business transfers in many countries to third parties are
characterized by specific factors: matching the preferences of buyers and sellers, building trust
(information asymmetries), and addressing emotional, psychological, and technical issues.

ISSN 2449 -9253 DMIETR Journal on Management Outlook
24
Buyers and sellers have different preferences regarding the business; therefore, it might be
complicated to match a potential buyer and potential seller in the same area and at the same time.
The research shows a numerical difference often occurs between the supply and demand sides in
transfer databases. Such databases usually include more offers of businesses (2/3 of
advertisements) than persons actively looking for a business (1/3 of advertisements).
INDIAN SCENARIO
Financial Goals of Family Business
Proper financial goals of both the business and the family need to be ascertained and a
balance between the two sets of objectives has to be achieved. The family wealth has to be
managed keeping the multiple criteria, often conflicting, in mind. It is prudent on the part of
business families to seek help of professional wealth managers including in-house financial
experts or institutions for achieving their financial goals. A family office may serve as a good
source of professional help for better monitoring and management of family wealth.
Retaining Relationships
Harmonious relationships in the family are important to make a family business
successful. It ensures that communication channels among family members are open and any
issues or conflicts that arise are sorted out directly in the best interest of the family and the
business. Most commonly, communication gaps arise among family members that are often
provoked by role confusion, emotions (envy, fear and anger), political divisions or other
relationship problems within the family. These lead to increasing misunderstandings and
negative perception about the other member(s), resulting in growing friction among family
members and clouding of decision-making. It is important on the part of the family elders to
anticipate these matters and resolve them at an early stage to maintain cordial family relations.
It will be important for Indian business families to focus on harmonizing familial
relationships, as strong family bonding is the main source of strength for their businesses. Clarity
in family members‘ business roles and responsibilities along with well-defined reward structure
goes a long way in ensuring that no business issues play a spoiler in family ties. It is also
important that families devise a mechanism for early resolution of family matters that may
potentially have an adverse effect on the business. Instead of pushing them under the carpet,

ISSN 2449 -9253 DMIETR Journal on Management Outlook
25
family problems must be identified and addressed proactively. Fair compensation structure for
all family members helps in maintaining cordial family ties. Dividends, salaries, benefits and
compensation for participating and non-participating family members must be clearly defined
and justified. The endeavour must be to minimize dependence of family members on business
finances for sustaining lifestyles thereby reducing friction in family. Family businesses also need
to have proper retirement and estate planning to address the necessities of older members when
they leave the company Poor accountability and operations control severely impinge
organisational efficiency. The business also fails to attract and retain good external talent. The
process of professionalization of family business includes setting up of management systems and
structures in the organisation, bringing objectivity and in several cases decreasing dependence on
the entrepreneur or the family members. It is important on the part of the family business owners
to institutionalize these structures and mechanisms. Family executives involved in business also
need to be equipped with modern management techniques. They must develop a team of
management professionals, formalize work procedures, delegate work with proper control
mechanisms. The challenge here is to ensure that the core values and spirit of the family are not
stifled due to professionalization.
Professionalization
Indian family business organisations need to adopt professionalisation in their businesses
that would facilitate strategic planning, systematic business processes, analytical decision-
making and formalization. However all of these must be institutionalized in the true spirit and
not just for name‘s sake. Family firms need to adopt merit based task assignment if they are to
remain sustainable. It will help the family firms move away from personality based business
decision making. They need to make further progress when it comes to accountability of family
members. Also, they need to understand that as they grow and professionalize themselves, family
members must concentrate more on strategic issues and leave day-to-day operations to
professionals. A lot of energy of the family should be devoted to entrepreneurship, including
innovations in existing operations. This would increase the overall efficiency and effectiveness
of the business. The family business leadership has to ensure that though their businesses are
professionalized, they must retain the personal or familial touch that made their business unique
in the first place. Maintaining this fine balance is definitely a challenging task that requires

ISSN 2449 -9253 DMIETR Journal on Management Outlook
26
visionary leadership qualities. True professionalisation will result in more efficient business
practices, sustainable business model and appreciation from all stakeholders.
Leadership
Leadership in family business seems to be undergoing a phenomenal change. While
earlier it was autocratic, now it is gradually becoming participative. The younger generation is
joining the family businesses and increasingly taking up leadership roles. The senior generation
has begun to regard them as capable and well-trained professionals. Albeit slowly but surely,
seniors are giving them freedom in decision-making. Family business leaders are beginning to
evolve a long-term vision and strategy for their businesses. They are progressively trying to
overcome the resistance to change and are opening up to new business ideas. Family business
leadership is also gradually learning to ‗let go‘ their control and are effectively delegating
operational decision-making to focus more on strategy. Some family firms have adopted radical
changes in leadership style whereas at the other extreme of this continuum there still remain
some firms that are being lead in traditional ways.
Conclusions
The problem of succeeding the owner (in the majority of SMEs, also manager) is a
critical issue in all SMEs, particularly in family businesses because of its emotional nature.
Various statistics indicate the limited survival rates of family businesses due to poorly solved
difficulties surrounding the succession. Succession is gaining more importance because of the
expected retirement of a substantial amount of family businesses‘ ownermanagers. . In realizing
successful transfers, an important role is played by owners-managers of transferable enterprises
as well as by national governments, which should establish supporting measures and
infrastructure. The search for potential successors and preparations for succession should start
early enough. Owners-managers should be aware of the fact that succession takes time and
should be planned; this is true for transfer within the family as well as selling the business to
third parties. Therefore, the main issue to tackle to ensure successfully transfer is to raise family
Business owner-managers‘ awareness of the importance of early preparation and then make
support (tools, measures, and infrastructure) available for the transfer. Owner-managers close to
retirement should be actively approached to support them with advice regarding succession and
potential successors should be trained to take up their role as family business owner and/or

ISSN 2449 -9253 DMIETR Journal on Management Outlook
27
leader through well-structured, partially tailor-made programs or workshops. The respective
national institutions and organizations should create such measures and infrastructure to foster
successful business transfers, promote entrepreneurs to prepare business transfers in a timely
manner, and engage potential entrepreneurs in thinking about taking over the existing enterprise.
In addition to raising owner-managers‘ awareness, providing information on support available
for facilitating business transfers and offering special training programs on business transfers,
including succession topics in study programs, special counseling on business transfers, and
creation of a business sellers and buyers database/marketplace, are critical.
References
1) Annual Report. (2009). European SMEs under Pressure. Annual report on EU Small and
Medium-sized enterprises 2009. European Commission, 21.9.2011, Available from:
http://ec.europa.eu/enterprise/policies/sme/facts-figures-analysis/performancereview/
2) Astrachan, J. H. & Shanker, M. C. (2003). Family Businesses' Contribution to the U.S.
Economy: A Closer Look. Family Business Review, Vol. 16, No. 3, (December 2003),
pp. 211-219, ISSN 0894-4865
3) Business Review, Vol. 14, No. 1, (March 2001), pp. 11–23, ISSN 0894-4865
4) Cabrera-Suárez, K., De Saa-Pérez, P. & García-Almeida, D. (2001). The Succession
Process from a Resource and Knowledge-based View of the Family Firm. Family
Business Review, Vol. 14, No. 1, (March 2001), pp. 37-46, ISSN 0894-4865
5) Chrisman, J. J., Chua, J. H. & Sharma, P. (2005). Trends and Directions in the
Development of a Strategic Management Theory of the Family Firm. Entrepreneurship
Theory and Practice, Vol. 29, No. 5, (September 2005), pp. 555-575, ISSN 1042-2587
6) Handler, W. C. (1994). Succession in Family Business: A Review of the Research.
Family Business Review, Vol. 7, No. 2, (June 1994), pp. 133-157, ISSN 0894-4865
7) Marketplaces (2006). Markets for Business Transfers. Fostering Transparent
Marketplaces for the Transfer of Businesses in Europe. Report of the Expert Group.
European
8) Sharma, P., Chrisman, J.J., Pablo, A.L. & Chua, J.H. (2001). Determinants of Initial
Satisfaction with the Succession Process in Family Firms: A Conceptual Model.
Entrepreneurship Theory and Practice, Vol. 25, No. 3, (Spring 2001), pp. 17-35, ISSN

ISSN 2449 -9253 DMIETR Journal on Management Outlook
28
1042-2587 9) Dyer, W.G. Jr. (1989). Integrating Professional Management into a Family Owned
Business. Family Business Review, Vol. 2 Issue 3, pp. 221-235.
10) Ward, J. L. (1987). Keeping the family business healthy. San Francisco, CA: Jossey Bass.
Whiteside, M. F., and Brown, F. H. (1991). Drawbacks of a dual systems approach to
family firms: Can we expand our thinking? Family Business Review, 4(4), 383-395.
***

ISSN 2449 -9253 DMIETR Journal on Management Outlook
29
“AGRICULTURE DISTRESS IN WARDHA DISTRICT IN THE VIDARBHA REGIONOF MAHARASHTRA”
Prof. Dr. Ravish A. Sarode Prof. Dr. Parag R. Kawley
(M.Com. M.Phil., M.A. (Eco), Ph.D.) (M.Com. B.Ed., Ph.D.)
Associate Professor, Assit. Professor,
R.S. Bidkar College, Vidyabharti College,
Ta. Hinganghat, Dist. Wardha. Ta. Seloo, Dist. Wardha.
Email : [email protected] : [email protected]
Abstract
The US Department of Agriculture has forecast a shortfall of 15 to 17 milliontonnes in
India‘s rice output during 2009-10. Government has announced thatabout 2 million tonnes of rice
may have to be imported soon to feed the publicdistribution system without interruption, since
government stock has come downto 15.35 million tonnes on 1st October 2009. The reduction in
Kharif crop productionis largely due to widespread drought in many parts of the country as well
as heavyfood in parts of Andhra Pradesh and Karnataka. Ensuring food security for ahuman
population of 1.1 billion and a farm annual population of 1 billion is thusa formidable task.
Fortunately, unlike in China, whose annual food grain production is currently 500million tonnes,
we have a large untapped yield reservoir in most cropping systems,even with the technologies on
the shelf. An Rs.25, 000 crore Rashtriya Krishi VikasYojana has been launched to help in
bridging the prevailing gap between potentialand actual yields.
AStudy of Wardha District focuses on the technological dimension of the
agriculturalcrisis that is currently gripping the Indian economy. A perusal of this study will
showthat it will be possible to bridge the prevailing yield gap in the district, providedintegrated
attention is given to knowledge delivery, input supply, popularizationof appropriate
technologies, soil health, water harvesting and management, andmarket management. The results
of the study show that there are considerable opportunities forincreasing the productivity and
profitability of small and marginal farm holdingsthrough a technological up gradation of farm
practices, supported by assured andremunerative marketing opportunities.
Key Words:Agricultural Distress, Economic Development, Human Development.

ISSN 2449 -9253 DMIETR Journal on Management Outlook
30
Introduction :
It is well recognised that Indian agriculture is currently in a state of crisis. Factors
underlying the crisis are complex and manifold and relate largely to the nature of economic
strategy pursued by the state as well as several institutional, technological, ecological, and
weather-related factors. While a large number of factors contribute to the crisis in agriculture,
leading to enormous distress among people dependent on it, the focus of the current study is to
address one dimension of the agricultural problem, namely, the technological. The technological
dimension would encompass a wide spectrum of non-price factors relating to crop production
and crop productivity. Issues that influence agricultural production, namely, the physical
environment; the extent and nature of agricultural inputs used; the nature of crop-protection
practices followed; and the overall management practices adopted in cultivation including
aspects of irrigation and technology deliverywould all be addressed in this study on Wardha
District.
Wardha District lies in the Vidarbha region of Maharashtra. It has been experiencing a
distress situation in agriculture over the last decade and has been identified as one of the six
districts where a special package to alleviate agricultural distress was launched by the
government of Maharashtra in the year 2005. Further to this, in the year 2006, Wardha was one
of the thirty-one districts identified by the Government of India as prone to agriculture-related
suicides and has received a rehabilitation package involving short-term and long-term measures
to be implemented during 2006–2009.
Map of Maharashtra Showing Wardha District within Vidarbha

ISSN 2449 -9253 DMIETR Journal on Management Outlook
31
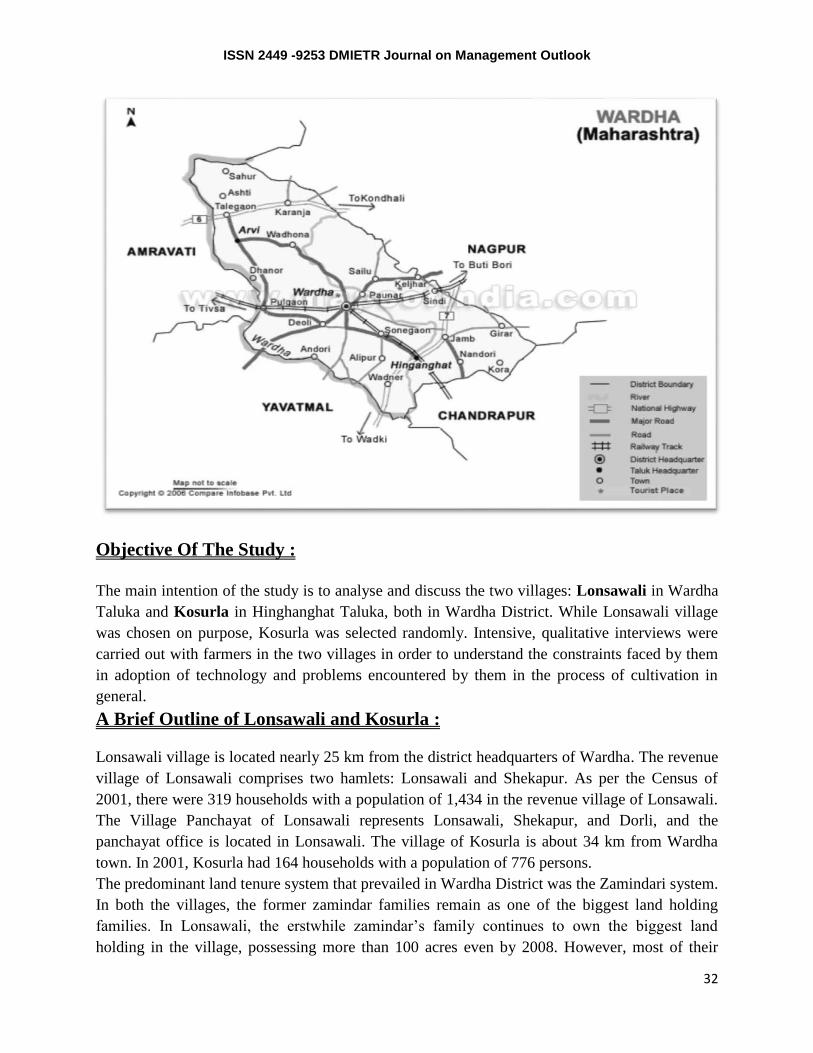
Salient Features of Wardha District :
Wardha District is located in the Vidarbha region of Maharashtra state and is named after its
most important river, the Wardha. The district is bounded on the west and north by Amravati
District, on the south by Yavatmal District, on the southeast by Chandrapur District and on the
east by Nagpur District. The boundaries with Amravati and Yavatmal districts are identified by
the river Wardha. The district covers 6,309 sq.km and the total population of the district is 1.2
million of which 74 percent, or 9.1 lakh, population live in rural areas according to the Census of
2001. The percentage of population living in rural areas in Wardha District is far higher than in
the state as a whole. Maharashtra being one of the most urbanised states in the country accounts
for less than 60 percent of its total population in rural areas by 2001. Thus, Wardha District is
more rural compared with the state as a whole.
Map of Wardha District
ISSN 2449 -9253 DMIETR Journal on Management Outlook
32
Objective Of The Study :
The main intention of the study is to analyse and discuss the two villages: Lonsawali in Wardha
Taluka and Kosurla in Hinghanghat Taluka, both in Wardha District. While Lonsawali village
was chosen on purpose, Kosurla was selected randomly. Intensive, qualitative interviews were
carried out with farmers in the two villages in order to understand the constraints faced by them
in adoption of technology and problems encountered by them in the process of cultivation in
general.
A Brief Outline of Lonsawali and Kosurla :
Lonsawali village is located nearly 25 km from the district headquarters of Wardha. The revenue
village of Lonsawali comprises two hamlets: Lonsawali and Shekapur. As per the Census of
2001, there were 319 households with a population of 1,434 in the revenue village of Lonsawali.
The Village Panchayat of Lonsawali represents Lonsawali, Shekapur, and Dorli, and the
panchayat office is located in Lonsawali. The village of Kosurla is about 34 km from Wardha
town. In 2001, Kosurla had 164 households with a population of 776 persons.
The predominant land tenure system that prevailed in Wardha District was the Zamindari system.
In both the villages, the former zamindar families remain as one of the biggest land holding
families. In Lonsawali, the erstwhile zamindar‘s family continues to own the biggest land
holding in the village, possessing more than 100 acres even by 2008. However, most of their

ISSN 2449 -9253 DMIETR Journal on Management Outlook
33
land is either left barren or given out on tenancy. In Kosurla, the former zamindar‘s family held
more than 200 acres even as late as 1970. Subsequently, the land was partitioned among the
zamindar‘s heirs, and they remain the big land holding families of Kosurla Village.
In Lonsawali, data collected by the Village Knowledge Centre of MSSRF in 2006– 07, indicates
that slightly more than one-fourth of households, 26.97 percent, in the village are landless
households. Among those who report land ownership, a little more than 50 percent are either
marginal or small farmers holding less than 5 acres. Small farmers are the predominant category,
accounting for 44 percent, while marginal farmers, holding less than 2.5 acres, account for 8
percent of all farmers. Farmers with semi-medium holdings of size 5–10 acres from 29 percent of
all farmers, while those having medium-to-large holdings, above 10 acres, constitute 19 percent
of the total.28 In Kosurla, while we were not fortunate to have
a detailed data base, the information we gathered suggests that the pattern of land ownership that
prevails here today is not very different from that of Lonsawali: it is said that about one-fourth of
the families do not own land and that the landed families are divided more or less equally if they
are classified as those owning below 5 acre and those, above 5 acre.
Lonsawali received electricity connection for agricultural purposes around 1969–70.The Land
Development Bank started sanctioning loans for well digging purposessince 1958 in Wardha
District. Making use of this loan facility, with the onset ofvillage electrification, a few farmers
went in for wells connected with electricmotors. According to the village administrative officer,
in 2003–04, there were116 wells in the help of which about 90 had electric motors. In 2008,
there weretwo submersible motors in the village and all the rest were 3-HP, no
submersiblemotors. Water is usually at a depth of 40–50 feet, and considering that the capacityof
suction pipe is only 25 feet the motors are kept within the well, adjacent to thewall of the well.
During monsoon, when the water level in the well rises, the motoris pulled upwards and often
kept outside the well on a temporary structure. It issaid that nearly half the wells in the village
are dry and not in use. Of the grosscropped area of 948.6 Ha in 2006–07, 148 Ha, or 15 percent,
is irrigated by wells.Of the irrigated area, only 22 acres receive irrigation throughout the year
while therest have irrigation only during the monsoon season. That is, while all wells have water
during the kharif, only a few wells continue to have enough water for a rabicrop. It is said that in
the last ten years no new wells have been dug in the village asit has been difficult to get loans for
this purpose.29 However, in 2008, about twenty-five farmers in Lonsawali have a sprinkler
system.
In Kosurla, electricity for agricultural purposes was received much later, that is,in 1980–82. In
2008, there were about ten wells in the village but none seem to bein use. In Kosurla there is a
problem in digging wells as they have a tendency tocave in. The caving in of wells is a problem
associated with the soil structure andtexture. Most of the wells that were dug in heavy clay soils
seemed to have cavedin after digging to some depth. In such places, wells can be taken only if
supportingpillars are provided. This is highly cost intensive which makes it impossible for asmall
farmer with heavy clay soil type in his field to dig wells.
ISSN 2449 -9253 DMIETR Journal on Management Outlook
34
In Lonsawali, cotton and sorghum were the traditional crops of the village, and theywere
essentially rainfed. The sorghum variety that was used was called desi gavraniand this was sown
in June and harvested in January. In 1964 the first sorghumhybrid CSH1 was released in the
country and from about 1969-70 farmers startedcultivating hybrids. Over the years sorghum
varieties have gone out of circulationand only sorghum hybrids are cultivated in the village.30
As regards cotton, thevarieties that were grown were (L47 and L973), till the long staple cotton
hybrid(H4) was introduced in the village in 1968. Traditionally, red gram was alwaysgrown as
an intercrop with cotton, and cotton was sown in June and harvestedin February. For about two
to three years, H4 cotton was popular in the villageand then farmers shifted to MCU 5. This
variety was also not popular for long asit was affected by red leaf curl and farmers shifted to
Ankur 651 and then to H10.Since then, a large number of cotton hybrids and varieties have been
released by thepublic research system as well as the private companies and these were
patronisedby the farmers. During the late 1990s, with the introduction of soyabean in thevillage,
a large number of farmers shifted at least part of their cotton/sorghum areato soyabean. In 2005,
with aggressive marketing of Bt cotton by seed companies,many farmers started cultivating Bt
cotton; However, there were different types of Bt cotton seeds that were available in the market:
legal Bt cotton seeds that wereauthorised for sale as well as illegal Bt cotton seeds or general Bt
cotton.31 In 2008,the charm of Bt cotton seems to have faded among farmers in Lonsawali.
Hybridcotton is popular among farmers and the seeds are purchased in shops either inWaifad
(4.5 km) or Pulgaon (7–8 km) or Wardha (25 km).
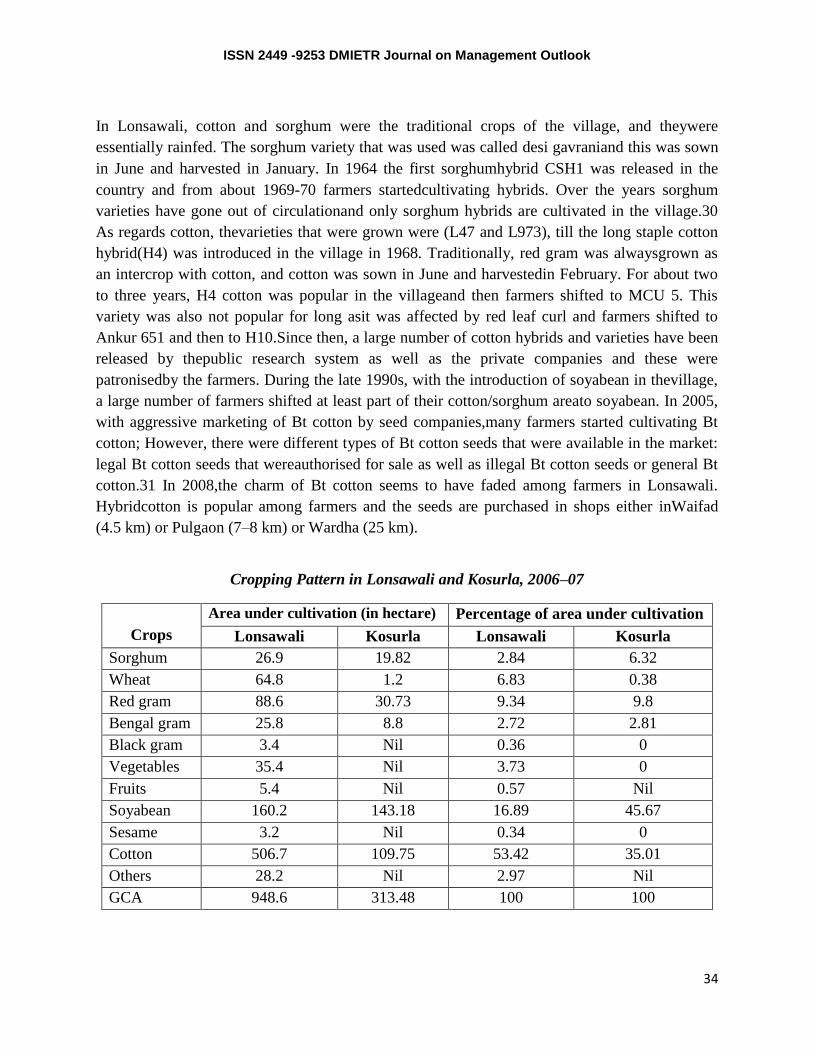
Cropping Pattern in Lonsawali and Kosurla, 2006–07
Crops
Area under cultivation (in hectare) Percentage of area under cultivation
Lonsawali Kosurla Lonsawali Kosurla
Sorghum 26.9 19.82 2.84 6.32
Wheat 64.8 1.2 6.83 0.38
Red gram 88.6 30.73 9.34 9.8
Bengal gram 25.8 8.8 2.72 2.81
Black gram 3.4 Nil 0.36 0
Vegetables 35.4 Nil 3.73 0
Fruits 5.4 Nil 0.57 Nil
Soyabean 160.2 143.18 16.89 45.67
Sesame 3.2 Nil 0.34 0
Cotton 506.7 109.75 53.42 35.01
Others 28.2 Nil 2.97 Nil
GCA 948.6 313.48 100 100

ISSN 2449 -9253 DMIETR Journal on Management Outlook
35
The cropping pattern that prevailed in Kosurla, till the introduction of soyabeanin the village in
1998, was one of cotton and sorghum intercropped with red gram during the Kharifseason and
wheat, gram and oil seed during the Rabiseason. Kosurla was one of the ‗rabi‘ villages where on
waterlogged lands dry Rabicrops were cultivated. The proportions of waterlogged lands were
relatively higher in Kosurla and during monsoon these lands were flooded routinely, and
therefore one could cultivate these lands only during Rabiseason. These lands are left fallow
during the Kharifseason and are allowed to absorb the rain water during the south west monsoon
and after the cessation of rains, dry wheat or gram or oil seeds were cultivated. The crop was
grown using the moisture retained by the soil. After 1998, with the introduction of Soyabean in
the village, the practice of cultivating dry Rabicrops disappeared. There are several reasons
attributed for the decline of dry Rabicrops. First, dry Rabicrop requires extensive land
preparation with two to three harrowing/ploughing. The land being marshy is not workable with
a tractor and needs bullock and manual labour to cultivate. Shortage of animal and manual labour
as well as the sheer drudgery involved in preparing the waterlogged area for the dry rabi season
makes soyabean, which is cultivated during the Kharifseason, a more viable option. Second,
unlike the cotton crop that is highly susceptible to flooding at all stages, soyabean can
moderately withstand water logging conditions when the crop is in its vegetative phase. The peak
flooding period of July–August in Wardha District coincides with the vegetative growth phase of
soybean. By resorting to soyabean cultivation, the farmers are able to reap at least some
suboptimal yield when they take up soyabean. Third,consideringthat the prevalent rate for
soyabean is quite remunerative, the farmers are able to absorb the losses even if the field gets
flooded and there is a consequent crop loss. Fourth, soyabean is a cash crop which is sold in the
market and is helpful in meeting the cash needs of farmers while dry Rabicrops such as wheat or
gram were often retained only for home consumption.
Analysing the data for the year 2006–07 for Lonsawali and Kosurla, it is clear that Kharifis the
principal agricultural season in the villages, as shown in Table. While cotton is the major crop
accounting for 53.42 percent of gross cropped area in Lonsawali, soyabean is the major crop
accounting for 45.67 percent of gross cropped area in Kosurla. In both the villages, cotton and
soyabean together account for 70 percent to 80 percent of total area under crops. As red gram is
intercropped with cotton as well as soyabean, it figures as the third most important crop in both
the villages. The intercrop ratio varies across the two villages. In Lonsawali, the prevalent
practice is six rows of soyabean or cotton for one row of red gram while in Kosurla the ratio
varied from 6:1 to 10:1. While both the villages were traditionally sorghum-growing areas, in
2006–07, the area cultivated with sorghum is very minimal in the villages. In both the villages, a
drastic decline in area under sorghum was reported. Farmers are increasingly moving away from
cultivation of sorghum for various reasons: it is more remunerative to grow crops such as
soyabean or cotton intercropped with red gram; when a shift away from sorghumtakes place in
an area, those who continue to grow sorghum become the target of attack by wild life and birds.
This results in the intensity of loss to be relatively higher for the farmers who grow sorghum and
results in them slowly moving away from sorghum cultivation. Third, in Kosurla incidence of a
ISSN 2449 -9253 DMIETR Journal on Management Outlook
36
pernicious weed, striga, which grows in sorghum field and competes with the crop, has also been
cited. All in all, there is a shift away from what was once the staple diet of the villagers. The
Rabicrops, wheat and gram are grown under irrigated conditions in Lonsawali while in Kosurla,
wheat and grams are dry crops. In Kosurla, dry wheat and gram cultivated in the Rabiseason
account for about 3 percent of gross cropped area while in Lonsawali, rabi crops account for 9
percent to 10 percent.
Some of the major cultivation practices with regard to land preparation, sowingoperations,
application of fertilisers and pesticides as well as practices with regard to procurement of inputs,
sale of produce etc. vary very little within the village as well as across the two villages. Let us
discuss some salient aspects of these practices.
For the Kharifseason, land preparation usually starts in the month of April. Farm yard manure
which largely comprises of animal dung is applied to the field in April and is ploughed into the
field in the month of May.33 The quantum of farm yard manure applied varies from farmer to
farmer as it is related to the number of animals he owns. However, our estimate is that on an
average one tractor trolley (approximately 5 tonnes) of farm yard manure per acre was applied.
Farmers tend to alternate their plots for application of farm yard manure when supply is not
adequate to cover their entire land holding. After receiving the first showers of rain, in June, the
field is given two to three rounds of harrowing. By and large, farmers use country ploughs and
bullocks for ploughing and harrowing while some large farmers do use tractors.
In Lonsawali as well as Kosurla the practice of making compost is not prevalent. We found one
farmer in each village that had just begun the process of making a compost pit. The farm yard
manure in both the villages are preserved either in open pits (in Kosurla) or uncovered heaps (in
Lonsawali). This leads to volatilisation losses of nitrogen, which is the main macro nutrient in
the animal dung. When dung is left on the soil surface, some of the nitrogen is eventually
converted to ammonia and nitrogen gas, and passes into the atmosphere. However, application of
farm yard manure helps in improving soil texture even if there has been a loss of nutritive value.
In Kosurla the practice of penning appears to be relatively more prevalent. Sheep and goats from
as far away as Gujarat and from the neighbouring Yavatmal District are penned on the fields.
The dung these sheep and goats leave in the field dries up, checking the ammonification loss of
nitrogen and working this back to the field after receiving first rains helps utilise its manorial
value. Farmers alternate the location for penning every year. This is usually done during the
period from January to April or May, when there are no crops on the field. Charges paid to the
shepherd are in the range of Rs.1,000–1,500 for one night. In Lonsawali, one of the big farmers
has leased out nearly sixty acres of his barren land for goat grazing. The lessee grazes nearly 600
to 700 goats during June to November on this land and in return pays twenty-eight trolleys of
goat dung. If the lessee is unable to provide twenty-eight trolleys of dung then for every trolley
less than the agreed number of twenty-eight, he compensates by paying Rs.500.

ISSN 2449 -9253 DMIETR Journal on Management Outlook
37
Collective grazing of cattle is organised in both the villages. A cowherdtends around thirty to
forty animals, which may be cows as well as buffaloes,belonging to different farmers in the
village. He collects the animals everymorning around 11 a.m. and takes them to a common
grazing land for grazing. He is paid Rs.40–50 per cow per month and Rs.100 per buffalo.
Bullocks are not sent for grazing.
Sowing of seeds is usually done after the receipt of first showers.35 Sowing isdone by female
labourers using the traditional method of opening furrowswith an implement called phandi
(wooden/iron) and line-sowing of seeds bydropping seeds through a bamboo or metal funnel.
This method is followedfor soyabean, cotton, red gram, and sorghum. Seeds are bought in the
marketin neighbouring towns or big villages from private shops for all crops exceptred gram.
Usually retained seeds are used for red gram.Over the last twoyears, soyabean seeds are being
given on subsidy through the Departmentof Agriculture under the Prime Minister‘s Relief
Package. In the perceptionof farmers this has been a very useful and timely intervention. Seeds
that arepopular among farmers are Ankur 651, for cotton hybrid; Eagle seeds and JS335, for
soyabean; and Maruthi for red gram.
In general, weed management is done manually. Hand weeding and harrowing is done in all
crops. However, some farmers do use weedicides like WhipSuper®, Pursuit®, TargaSuper®,
and Kloben® in soyabean to control both broad and narrow-leaved weeds. While the dosage of
weedicide used is usually lower than the recommended norm, the preparation of weedicide
mixture and time of spraying is generally as per the recommendation.
Other than cotton which is handpicked, all other crops are harvested by cutting the stalk and
bundling the same. Threshers are used to separate the grain/pod from the stalk. The stalk is
crushed into husk by the thresher and this is used as cattle feed. In cotton there are generally
three to four pickings. Cotton stalks are either burnt on the field or used as fuel wood. Red gram
and cotton stalks are also used for banding and fencing.
Agricultural produce is usually sold either on the auctioning floor of AgriculturalProduce
Marketing Committee, or to private traders who come to the doorsteps of farmers or to traders in
neighbouring big villages or towns. While bigger farmers whose holding capacity is relatively
higher hold on to their stock till the appropriate price is offered, the smaller farmers dispose off
their produce as soon as the harvest is over.
ISSN 2449 -9253 DMIETR Journal on Management Outlook
38
Major Issues in Lonsawali and Kosurla :
Our detailed discussions with farmers bring out a range of issues—economic,socio-political, and
climatic factors—that act as constraints to crop production and productivity.
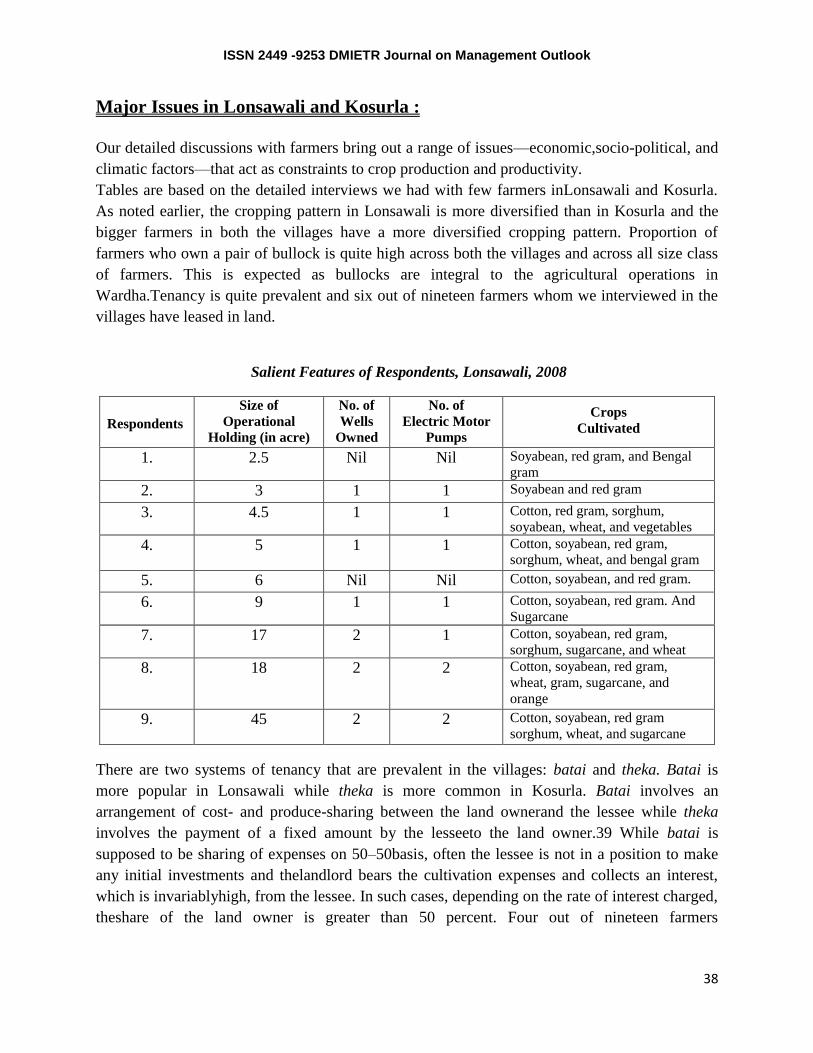
Tables are based on the detailed interviews we had with few farmers inLonsawali and Kosurla.
As noted earlier, the cropping pattern in Lonsawali is more diversified than in Kosurla and the
bigger farmers in both the villages have a more diversified cropping pattern. Proportion of
farmers who own a pair of bullock is quite high across both the villages and across all size class
of farmers. This is expected as bullocks are integral to the agricultural operations in
Wardha.Tenancy is quite prevalent and six out of nineteen farmers whom we interviewed in the
villages have leased in land.
Salient Features of Respondents, Lonsawali, 2008
Respondents
Size of
Operational
Holding (in acre)
No. of
Wells
Owned
No. of
Electric Motor
Pumps
Crops
Cultivated
1. 2.5 Nil Nil Soyabean, red gram, and Bengal
gram
2. 3 1 1 Soyabean and red gram
3. 4.5 1 1 Cotton, red gram, sorghum,
soyabean, wheat, and vegetables
4. 5 1 1 Cotton, soyabean, red gram,
sorghum, wheat, and bengal gram
5. 6 Nil Nil Cotton, soyabean, and red gram.
6. 9 1 1 Cotton, soyabean, red gram. And
Sugarcane
7. 17 2 1 Cotton, soyabean, red gram,
sorghum, sugarcane, and wheat
8. 18 2 2 Cotton, soyabean, red gram,
wheat, gram, sugarcane, and
orange
9. 45 2 2 Cotton, soyabean, red gram
sorghum, wheat, and sugarcane
There are two systems of tenancy that are prevalent in the villages: batai and theka. Batai is
more popular in Lonsawali while theka is more common in Kosurla. Batai involves an
arrangement of cost- and produce-sharing between the land ownerand the lessee while theka
involves the payment of a fixed amount by the lesseeto the land owner.39 While batai is
supposed to be sharing of expenses on 50–50basis, often the lessee is not in a position to make
any initial investments and thelandlord bears the cultivation expenses and collects an interest,
which is invariablyhigh, from the lessee. In such cases, depending on the rate of interest charged,
theshare of the land owner is greater than 50 percent. Four out of nineteen farmers

ISSN 2449 -9253 DMIETR Journal on Management Outlook
39
weinterviewed have benefited from the Maharashtra Agricultural Lands (Ceiling onHoldings)
Act that came into force in 1962 and they have received 2–3 acres fromthe government.
Salient Features of Respondents, Kosurla, 2008
Respondents
Operational
Holding
No. of
Wells
Owned
No. of
Electric Motor
Pumps
Crops
Cultivated
1. 3.5 Nil Nil Soyabean, cotton, And red gram
2. 4 Nil Nil Cotton and red gram
3. 4.75 Nil Nil Soyabean, cotton, and red gram
4. 6 Nil Nil Soyabean and red gram.
5. 8 Nil Nil Cotton, soyabean, and red gram.
6. 8 Nil Nil Cotton, soyabean, red gram.
7. 22 1 1 Cotton, soyabean, red gram,
8. 28 1 1 Soyabean, cotton, red gram, Bengal
gram, wheat, and sweet lime.
9. 36 2 2 Soyabean and red gram
Another important reason why farmers are unable to follow the recommendations given by
scientists as regards the quantum and combination of fertilisers is to do with the farmers‘ ability
to purchase fertilisers in the market as well as the availability of various kinds of fertilisers in the
market. Fertilisers are often bought on credit from private shop keepers, and the farmers are
forced to take whatever fertiliser they are supplied with. Further, shortage of chemical fertiliser
during sowing seasons is a recurrent problem faced by farmers across the country.
One-time application of fertilisers is practised by farmers instead of the recommended split doses
at critical stages—at sowing, at square formation and at peak flowering stage in the case of
cotton—and these practices would have implications for crop yield.
As regards pesticide, it is clear that Endosulfan is the most popular pesticide and it is one that is
even used against red leaf disease. This is an erroneous practice and one that will have no effect
in controlling the disease. This is because red leaf curl is not the result of a pest attack. Red leaf
curl is the symptom of a physiological disease which occurs due to nutrient deficiency, and the
correct control measure is spraying of the deficient nutrient. Mixing of different groups of
pesticides is also another incorrect practice which is common across farmers. Even where certain
groups of pesticide can be mixed, unless the dilution rate is as per the recommendation the
mixture can result in detrimental effects.
Our observations on farmers‘ practices with regard to pesticide application dosuggest that there
is a problem of lack of awareness of correct practices among farmers, as illustrated using Tables.

ISSN 2449 -9253 DMIETR Journal on Management Outlook
40
Pesticides Used by Respondents in Soyabean Cultivation, 2007-08
Village
Name
Respondents Size of Operational
Holding (2007–08) (in
acre)
Name of the Pesticides
Lonsawali 1 2.5 None
2 3 None
3 4.5 None
4 5 Endosulfan
5 6 None
6 9 None
7 17 None
8 18 Endosulfan and Pursuit
Kosurla 1 3.5 None
2 4.75 None
3 6 Pursuit and copper powder
4 8 Endosulfan ,Metasystox®Copper
Powder.
5 8 None
6 22 Pursuit®
7 28 Whip super®, Kloben®,
Endosulfan/Roger®,thiomethoxam.
8 36 Pusuit and Targa super®. Avant®and
a mixture of Biozyme andEndosulfan
used on red gram.
Pesticides Used by Respondents in Cotton Cultivation, 2007–08
Village
Name
Respondents Size ofOperational
Holding(2007–08)
(in acre)
Name of the Pesticides
Lonsawali 1 2.5 Endosulfan and Monoseal
2 3 None
3 4.5 Endosulfan and Monocrotophos
4 5 Endosulfan
5 6 Endosulfan and Monocrotophos
6 9 Magnesium sulphate, Confidor,
Aggressor, Spruthi tonic
7 17 Confidor, Endosulfan, and Avant
8 18 Endosulfan
Kosurla 1 3.5 Endosulfan and Confidor
2 4.75 Endosulfan
3 6 Endosulfan

ISSN 2449 -9253 DMIETR Journal on Management Outlook
41
4 8 Endosulfan ,Metasystox®
Copper Powder.
5 8 Endosulfan ,Metasystox®
Copper Powder.
6 22 Endosulfan and Metasystox ®
7 28 Endosulfan, Metasystox®, Ecalyx,
Quinalphose.
8 36 Endosulfan and Metasystox®.
Yield of cotton, red gram, and soyabean, during the kharif season of 2007–08, as reported by
farmers is provided in Table. By and large, all farmers have reported a higher yield of cotton
compared to the district average while that is not the case with soyabean. The progressive
farmers we met—Respondent 8 in Lonsawali and Respondent 8 in Kosurla—have reported yield
that are higher than the district yield with regard to cotton and soyabean. There is very high intra-
village variation in reported yields, a factor that is largely related to quality of soil in Lonsawali
and the problem of flooding of fields and lack of drainage in Kosurla. The majority soil type in
Lonsawali is light black soil which is very low in organic carbon content, has low caution-
exchange capacity, and very poor water-holding capacity.
Yield of Major Crops in Lonsawali and Kosurla
Name of the
Village Respondents Yield of Crops (kg per acre)
Cotton Soyabean Red gram
Lonsawali 1 104 (100) 200 (35) 120 (24)
2 NA 260 (43) 2
3 20 (19) 300 (50) 33 (7)
4 750 (721) 800 (133) 100 (20)
5 400 (365) 457 (76) 300 (60)
6 480 (462) 500 (83) 175 (35)
7 300 (288) 800 (133) 100 (20)
8 NA NA NA
Kosurla 1 280 (269) 570 (95) 57 (11)
2 160 (154) NA 120 (24)
3 200 (192) 280 (47) 72 (14)
4 NA 580 (97) 160 (32)
5 350 (337) 340 (57) 110 (22)
6 100 (96) 300 (50) 117 (23)

ISSN 2449 -9253 DMIETR Journal on Management Outlook
42
7 517 (497) 359 (60) 25 (5)
8 243 (234) 700 (117) 64 (13)
Concluding Observations :
Our study of Lonsawali and Kosurla clearly indicate the need to undertake soil- and water-
conservation activities in order to minimise crop-loss incurred by farmers. All the ten farmers we
interviewed in Kosurla and three out of ten farmers in Lonsawali had encountered problems of
water logging and lack of drainage leading subsequently to crop-loss. Further, the quality of soil,
particularly in Lonsawali, is poor and requires soil fertility enhancing measures. Need for soil-
and water conservation measures have increased further with the tendency of farmers to convert
waterlogged areas where dry-rabi crops were grown earlier into Kharif cultivation. Desisting of
waterways close to the fields as well as initiation of other appropriate measures, it appears,
would go a long way in minimising the loss incurred by farmers.
Our analysis of cultivation practices adopted by farmers indicates that farmers do not get any
help or guidance from the state agricultural extension machinery. Advice regarding crop
practices is received by farmers only from private shop-owners dealing with agricultural inputs.
There are several areas where farmers require advice: land preparation, selection of seeds, timing
of sowing, type and quantum of fertiliser to be used, identification of pests, decision on
appropriate pesticide etc. Total lack of advice on any of these aspects result in faulty and
inappropriate use of techniques such as application of Endosulfan to arrest red leaf curl or
sowing retained seeds of hybrid cotton etc. by the farmers so that the efforts taken by them often
do not bring desired results. Even the method of conservation of farmyard manure leaves much
to be desired, and there is plenty of scope for simple scientificinterventions that would help
farmers in retaining the nutrient value of farmyard manure. Moreover, in an area where soils
have so many inherent deficiencies, a proactive role by the state in arranging for systematic soil
testing and provision of advice on that basis would have helped farmers in choosing the
appropriate mix of fertilisers.
Apart from bringing out the importance of soil and water conservation activitiesand the need to
revive and strengthen the agricultural extension machinery, our study of the two villages also
corroborates some of the other findings of secondary data analysis pertaining to Wardha District.
For instance, decline in area under cotton, sorghum wheat, and gram and increase in area under
Soyabean observed in the district as a whole is happening in our study villages too. While an
important finding of our analysis of land-use pattern of Wardha District, namely, decline in net
sown area and increase in fallow, needs to be studied more carefully at the village level, our
preliminary analysis indicates that farmers with large land holdings have left part of their
cultivable land fallow for various reasons.

ISSN 2449 -9253 DMIETR Journal on Management Outlook
43
References :
Government of India (GoI).2006. Report of Fact Finding Team on Vidarbha. 2006.
Planning Commission.
Census of Maharashtra 1991 and 2001. District Primary Census Abstract.
Challa O, K.S. Gajbhiye, and M. Velayutham 1999. Soil Series of Maharashtra.
Technical Bulletin, National Bureau of Soil Survey and Land Use Planning (NBSSLUP).
Nagpur.
Government of Maharashtra (GoM) 2002. Human Development Report Maharashtra.
Government of Maharashtra (GoM) 2006. Maharashtra Gazetteer: Wardha District, (e-
book edition).
Handbook of Agriculture. Indian Council of Agricultural Research, 2006.
India Meteorological Department. Wardha District Monthly Rainfall and RainyDays
Data, 1967 to 2006. Pune.
Kolay A.K. 1993, Basic Concepts of Soil Science, Wiley Eastern Limited, New Delhi.
Magdoff F. and Harold van Es. 2000. Building Soils for Better Crops, Handbook Series
Book 4, Sustainable Agriculture Publications, University of Vermont, Burlington VT.
Mishra, S. 2006. Suicide of Farmers in Maharashtra. Indira Gandhi Institute
ofDevelopmenr Research, Mumbai.
Nagaraj, K and J. Jeyaranjan. 2004. Tamil Nadu Economy: Contours of Change – A
Secondary Data Exploration. (Unpublished monograph). Madras Institute of
Development Studies and Institute of Development Alternatives. Chennai.
Narula A.M.; K.R.Kranthi; S.K.Banerjee et al 2001. ―Insecticide Resistance Management
Based Cotton IPM: A Success Story‖ CICR, Directorate of Cotton Development, GOI,
Ministry of Agriculture, Department of Agriculture and Co-operation, Mumbai.
National Commission on Farmers. 2004. Serving Farmers and Saving Farming Ministry
of Agriculture, Government of India, New Delhi.
Dr Panjabrao Desmukh Agricultural University (PDKV) 2007 Statistical Analysis of
Yield Gap of Crops and Identifying Factors Responsible, R1. Ag. Econ. Stat-366/1,
Akola.
Sehgal J.L; D.K.Mandal; C.Mandal et al.1990. Agro-Ecological Regions of India.
National Bureau of Soil Survey and Land Use Planning, Nagpur.
Sharma, A. 2008. ‗Technology Delivery to Cotton Farmers in Vidarbha Region of
Maharashtra‘, Technical paper, National Consultation on Technology Development and
Delivery Models for Sustainable Livelihoods, M.S. Swaminathan Research Foundation.
Sharma, J.P; K.S.Gajbhiye; C.Mandal et al. 2005. Soil Resource Atlas. Wardha District.
National Bureau of Soil Survey and Land Use Planning. Nagpur.

ISSN 2449 -9253 DMIETR Journal on Management Outlook
44
Health Care Management in Cancer Care-An exploratory study
Dr. Sangeeta Pandit
HoD(Finance), SIMSREE-Sydenham Institute of Management Studies, Research
& Entrepreneurship Education Mumbai
Objective/Purpose: This paper will focus on how to apply good management practices to
make the entire journey from diagnosis to cure a smooth and stress free one. The objective of this
paper is to find solutions to the humungous problems in Cancer Care. The purpose is to build a
business model of Social Enterprises dealing in Cancer Care.
Methodology: The methodology used is collecting primary data from questionnaires sent to
patients and doctors. Secondary Data is taken from Hospital sites and articles published in
journals and newspapers. Using Excel tools and statistical tools, data collected is analyzed and
situation as perceived and experienced by stakeholders of cancer care is arrived at. Analysis of
hospitals is done and of the external environment is done. Value Chain analysis and SWOT
techniques are used.
Results: Awareness of early signs of cancer symptoms is lacking. Awareness of life style
practices that could cause cancer is lacking. Facilities to take diagnostic tests are not adequate.
Treatment costs are formidable. The side effects of drugs take a toll.
Conclusion: Need is there to create awareness for prevention and early detection of cancer.
Children too must be made aware. Diagnostic centers must be revamped and numbers increased.
Re look at medical insurance schemes. Patients need counseling on Diet and Hygiene. This is a
sunrise sector.
Limitation of the study: Sample size is of only 25 patients and of doctors in the field of
oncology is of only 10. A larger sample was not possible due to paucity of time.
Key Words: Cancer Care, Cancer Care Management, Sunrise sector, Awareness, Strategy.

ISSN 2449 -9253 DMIETR Journal on Management Outlook
45
1. Introduction
1.1 Cancer Care Management:
Health Care Management could include pedreatric or geriatric population. It could include
treatment for specific ailments like diabetes or coronary problems. It could include treatments
that need hospitalization or do not need hospitalization. It is indeed a vast topic. To make the
paper meaningful, I am focusing on only Cancer Care Management.
1.2 Description of the disease Cancer:
Cancer is caused due to cells of our body growing in an uncontrolled manner. When the process
of our old body cells dying and new ones being created to replace them goes haywire, tumors are
formed. If such a tumor can spread to other parts it is called a malignant one. Some cancers do
not form tumors but involve the blood like leukemia. There are several types of cancers like Skin
cancer, Oral cancer, AML, CML, Breast cancer, Prostate etc. Depending on the type, they are
referred to as carcinomas, sarcomas, leukemia‘s' and lymphomas'.
1.3 Statistics:
As per WHO records, every year in India about 7 lakhs people get cancer. About 33% cases are
of Oral cancer. Wardha district in Maharashtra has the highest incidence of mouth cancer in the
world.
Tata Memorial Hospital (TMH) is a premier cancer hospital of India. People from all over India
and neighboring countries visit this hospital. About 6500 surgeries are conducted annually and
about 1000 patients attend the daily OPD –Out patient department. Chemotherapy, Radiation and
Surgery are the common methods of treatment. TMH is a Training and Research Institute too.
1.4 Cancer Facilities:
Most States in India have hospitals giving Cancer care. In Maharashtra other than Mumbai and
Pune, there are cancer hospitals in Parbhani, Aurangabad, Miraj, Nagpur, Nasik, Jalgaon,
Wardha and Yavatmal.

ISSN 2449 -9253 DMIETR Journal on Management Outlook
46
1.5 Steps in Cancer Care:
1. Diagnosis
There is no one test that can help in cancer diagnosis. It needs a holistic approach of
understanding patient history, physical examination, various tests and procedures.
Tests and procedures may include imaging-MRI, sonography etc. It may involve tumor
biopsy and tests for tumor markers. There are various laboratory tests from blood tests to
sophisticated tests that may be advised like CA125, PSA, CEA etc.
2. Treatment
Chemotherapy, Radiation and Surgery are the common ways of treating cancer.
Chemotherapy is normally administered intravenously, through a needle or a catheter. It
may also be by way of pills or injections. It could be a mix of drugs.
Radiation is commonly given externally through high energy waves. The waves may be
electron beams or cobalt-60 gamma waves. Sometimes, internal radiation is given by way
of pills, injections or an implant placed in the body. Radiation department needs a lot of
investment and maintenance.
Surgery may be required in cancer treatment for a variety of reasons. It may be
preventive surgery to remove parts that are pre-cancerous, it may involve removing a
small part to conduct a biopsy for diagnosis, and it may be to cure the cancer or
sometimes just to relieve pain.
3. Follow-up and Rehabilitation
When a patient is discharged, he or she is asked to return on a certain date for follow-up.
Follow-up procedures may involve physical examination, CT scans, X-rays and lab tests.
The frequency decreases over a period of time. Certain protocols require prolonged
medication.
Patient has to return to normal routine and continue with the occupation or profession he
or she was involved in. Sometimes, one needs to change ones way of working. Some
patients need prosthesis for better quality of life like artificial limbs.

ISSN 2449 -9253 DMIETR Journal on Management Outlook
47
2. Literature Review
Writing this project, involved reading medical magazines and literature published by NGOs and
hospitals.
Following 2 articles brings out importance of research and different way of looking at issues.
2.1 Sarah Glyn in ‗Medical News Today‘ had written an article dated 30th
March, 2013 reporting
about a new test that could help early detection of Pancreatic Cancer. Most of the cases of
pancreatic cancer are detected at a late stage when treatment becomes difficult. This new
screening test as reported in Cancer Journal of the American Association for Cancer Research is
a safe and easy screening method.
2.2 A research based article was published in the 2011 issue of ‗Cochrane Database of
Systematic Reviews‘ Vol.8, on how Music Intervention can help cancer patients. The article
showed how listening to music helps cancer patients cope with the treatment. Pain and side
effects can be better managed; quality of life of patients improves.
3. Gaps Analysis
3.1 A lot of scientific research is happening in the field of cancer. Sophisticated drugs are
decreasing side effects and increasing chance of survival. Articles of path breaking research
conducted are reported in Medical Journals.
3.2 Governments and Non Government Organizations are supporting Cancer Care in a big way.
Hospital charges are subsidized, financial aid given, information disseminated and emotional
support too extended.
3.3 However a need was felt to write this paper. Cancer Care can improve by leaps and bounds if
the issues are looked at holistically and macro solutions found.
4. Objectives of the Study

ISSN 2449 -9253 DMIETR Journal on Management Outlook
48
The objective of the study is to explore the opportunities in setting up a standalone Cancer Care
Center. The objective is to understand how innovative approach and best management practices
can make the Center earn profits as well as serve society. The objective is how profits can be
generated when the Center also focuses on eradication of tobacco consumption habit.
5. Research Methodology
5.1 Primary Data:
A questionnaire was circulated amongst 25 patients. Patients were a geographical mix hailing
from Mumbai, districts of Maharashtra and outside Maharashtra. They were in the age group of
35 to 55. Questionnaire was also circulated amongst 10 oncologists and onco surgeons. Doctors
were from Mumbai and in the age group 45 to 55.
The Questionnaires are reproduced in Annexure I
5. 2 Secondary Data:
Information was mainly sourced from the site of Tata Memorial Hospital and of WHO. Also
information was gathered from the various articles published in Journals, newspapers and from
literature published by hospitals and NGOs
6. Results, Discussion and Findings
6.1. Percentage of patients who felt they were diagnosed easily (30%) and not easily. (70%)
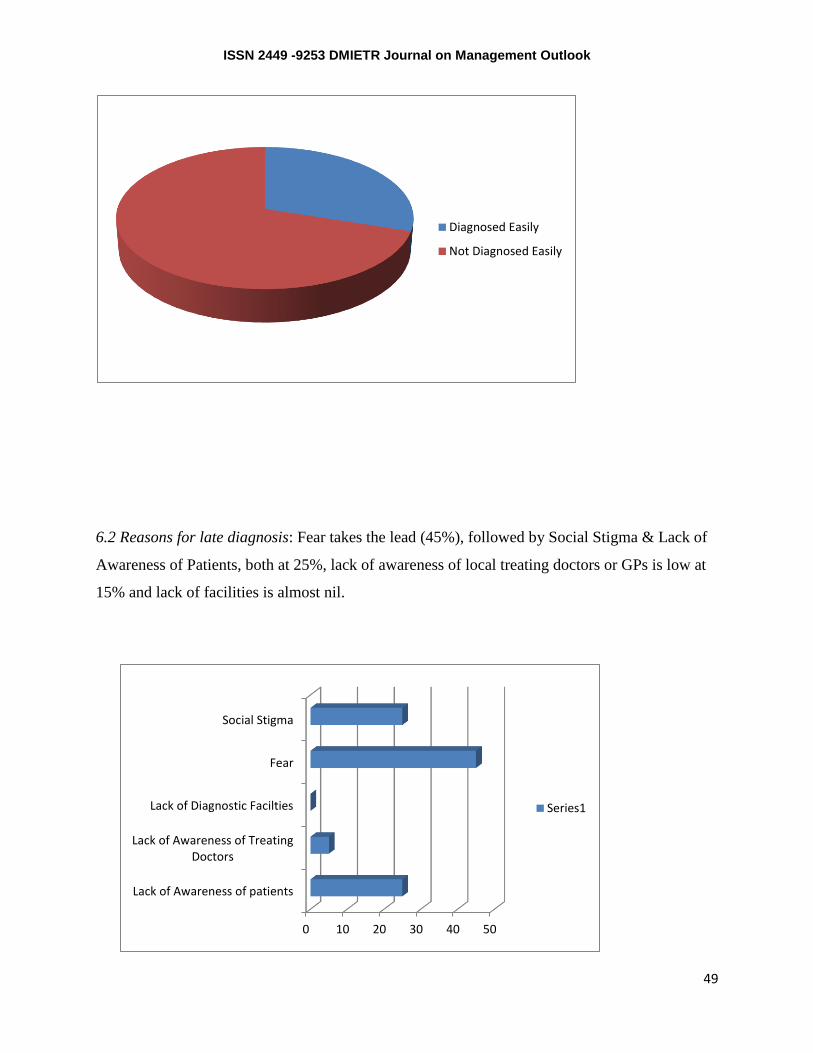
ISSN 2449 -9253 DMIETR Journal on Management Outlook
49
6.2 Reasons for late diagnosis: Fear takes the lead (45%), followed by Social Stigma & Lack of
Awareness of Patients, both at 25%, lack of awareness of local treating doctors or GPs is low at
15% and lack of facilities is almost nil.
Diagnosed Easily
Not Diagnosed Easily
0 10 20 30 40 50
Lack of Awareness of patients
Lack of Awareness of TreatingDoctors
Lack of Diagnostic Facilties
Fear
Social Stigma
Series1

ISSN 2449 -9253 DMIETR Journal on Management Outlook
50
6.3. Time gap between Diagnosis and commencement of treatment: The gap of more than a
week but less than a month is high at 60%, less than a week is 30% and more than a month is
10%.
6.4. Reasons for Starting Treatment late: 35% of the sample said it was due to coping with
the news of the diagnosis, 25% due to patient‘s unwillingness to take treatment, 20% as to
the confusion in choosing the center, 10% for the reason of family resistance and 10% for
financial reasons
Less than a week
More than a week butless than a month
More than a month

ISSN 2449 -9253 DMIETR Journal on Management Outlook
51
6.5. Life Styles that caused Cancer:
Of the cancers that may have happened due to life styles, 85% of the cases could be due
to tobacco consumption and balance reasons like junk food, obesity and occupational
hazard could be about 5% each.
could not decide thecenter to take treatment
coming to terms with thediagnosis
could not arrange thefinances
resistance from family totake treatment
patients unwillingness totake treatment
Series1
020406080
100
Series1

ISSN 2449 -9253 DMIETR Journal on Management Outlook
52
6.6 Discussions :( based on the Questionnaires)
(1) Fear Factor
A lot of fear is associated with the word Cancer. It is referred to as the big-C. Patients
fear to hear the diagnosis of cancer. They perceive it as a death warrant.
(2) Social Issues
Patients tend to conceal the diagnosis. They fear society. Will they be invited for
weddings and social functions of family and friends? Will the diagnosis impact the
marriage prospects of their daughter? Will neighbors ostracize them? Such questions
haunt them and they do not want people to know they have cancer
(3) Finance
The very poor get a lot of free treatment from public hospitals. In Tata Memorial
Hospital, patients are classified in to categories as per economic background. The NC-No
Cost patients
Do not have to pay for Radiation. Hospital pharmacy subsidizes medicine costs. There is
differential costing for the various tests. Also there are various Trusts that patients apply
too. Money is sent by the Trusts directly to TMH, with the patient name and file number
on it.
In spite of these facilities, poor patients need to take loans and sell their land and house to
fund the treatment. Pre Diagnostic expenditures are not funded. It takes time for trusts to
transfer funds. There is a long queue for certain procedures and patients may have to visit
private hospitals. Food and lodging expenditures keep mounting as cancer treatment is of
an extended period ranging from 3 months to 3 years or even more. Middle class and
even the rich are affected by the financial stress of the treatment. Certain drugs are very
expensive. Patients are mostly not covered by Medical Insurance.
(4) Life Styles
Tobacco is consumed in India in various ways. Bidi and cigarettes are puffed. Tobacco is
chewed and also kept in the mouth for long. Gutka consumption has become a habit and

ISSN 2449 -9253 DMIETR Journal on Management Outlook
53
style statement. In Tata Memorial Hospital, out of every 10 cases about 7 are of Oral
Cancer.
(5) Facilities
Patients flock to cities for treatment. Patients of Tata Memorial Hospital are from all
over India and even from the neighboring countries. Even if facilities are available closer
to their place, they prefer to travel further to take treatment in a big city rather than in a
small town.
(6) Blood
Cancer treatment often requires infusion of blood and platelets. Most hospitals encourage
voluntary donations from friends and relatives of the patient. Many find it difficult to
garner volunteers
6.7Findings
Innovative Concepts that worked
Google: Customers can be broadly classified as non paying users and paying advertisers.
Increasing market share of non paying users has increased revenues from advertisements
Wal-Mart: Selling branded products at low costs by extensively using data analysis of all their
individual stores. Not allowing products to remain on shelf for long, replenishing dwindling
stocks quickly and using winning strategies of profit units for others.
GE: Jack Welch had a unique style of leadership and steered the company for 20 years taking
bold decisions. His way of working has now become management principles. Some of them are
–Embrace change and do not fear it; Act like a leader and not manger; constantly review for
expansion/divestment; focus on the 3 issues of customer satisfaction, employee satisfaction and
cash flows and not on numbers.
Motorola: Developed Six Sigma in 1985, a set of tools and strategies for process improvement.
Causes of defects are analyzed and removed. Experts are groomed within the organization and
termed champions, Black belts etc according to the quantified targets they can meet like cost
reduction or rejection rate.
Today this tool is used by many organizations.

ISSN 2449 -9253 DMIETR Journal on Management Outlook
54
.
7. Conclusions
Conclusions are drawn from:
(a) Analyzes of findings arrived at from the primary data collected.
(b) Literature relating to Cancer, Cancer Care and Hospitals
(c) Value Chain Analysis and SWOT Analysis
7.1 Social
Patients need an assurance that they will not be rejected by society. Their family should not fall
from social grace due to their diagnosis.
There are lot of myths and superstition prevailing in our society. People are not aware that cancer
is not infectious or contagious. Not aware that except for a few type of cancers, most cancers are
not hereditary.
7.2 Financial
India is a country of contrasts. We have rich Indians in the top 10 richest people of the world and
a huge population living below the poverty lines. The fundamental need of medical access is
denied due to abject poverty.
Radiation equipments, machines for blood separation and other equipments need huge capital
expenditure, maintenance and periodic up gradation. Poor patients in spite of a lot of subsidies
from government and private trusts cannot cope with the medical costs. Even the middle class
feel the strain.
7.3 Medical Insurance

ISSN 2449 -9253 DMIETR Journal on Management Outlook
55
The penetration of this sector has not been adequate. There are many players competing with
each other. ICICI Health Insurance, Bajaj Allianz to name a few. However, insurance companies
have not succeeded in convincing and covering a major portion of the population
7.4 Awareness
People are not aware of the risks faced in tobacco consumption.
Patients are not aware of the side effects of the drugs and are not prepared for it.
Care givers are not aware of the level of hygiene and kind of diet to be given to patients.
Awareness of the nature of the disease and its prognosis is dismally lacking.
8. Managerial Recommendations:
8.1. Awareness of nexus between tobacco consumption and cancer:
It is estimated that every year 7 lakh people are diagnosed with cancer of which 33% are caused
due to tobacco consumption. Imagine if these people had not consumed tobacco, India would
have about 2.3 lakh less cancer cases.
The awareness carried out by pictorial representations and statutory warning is not sending the
message. Increasing costs and bringing bans on tobacco products is also not having the desired
impact.
As per the Global Youth Tobacco Survey, in India, 25% of the population below 15 is using
tobacco products. We must thus start massive awareness drives targeting children.
1. School text books can include in their science text book scientifically proved harmful
side effects of tobacco consumption.
2. Essay competitions and poster competitions on this subject can be made mandatory by
the Education department
3. Inter school skit competition on this topic can be held annually.
The objective is that non tobacco consumers must not become tobacco users.
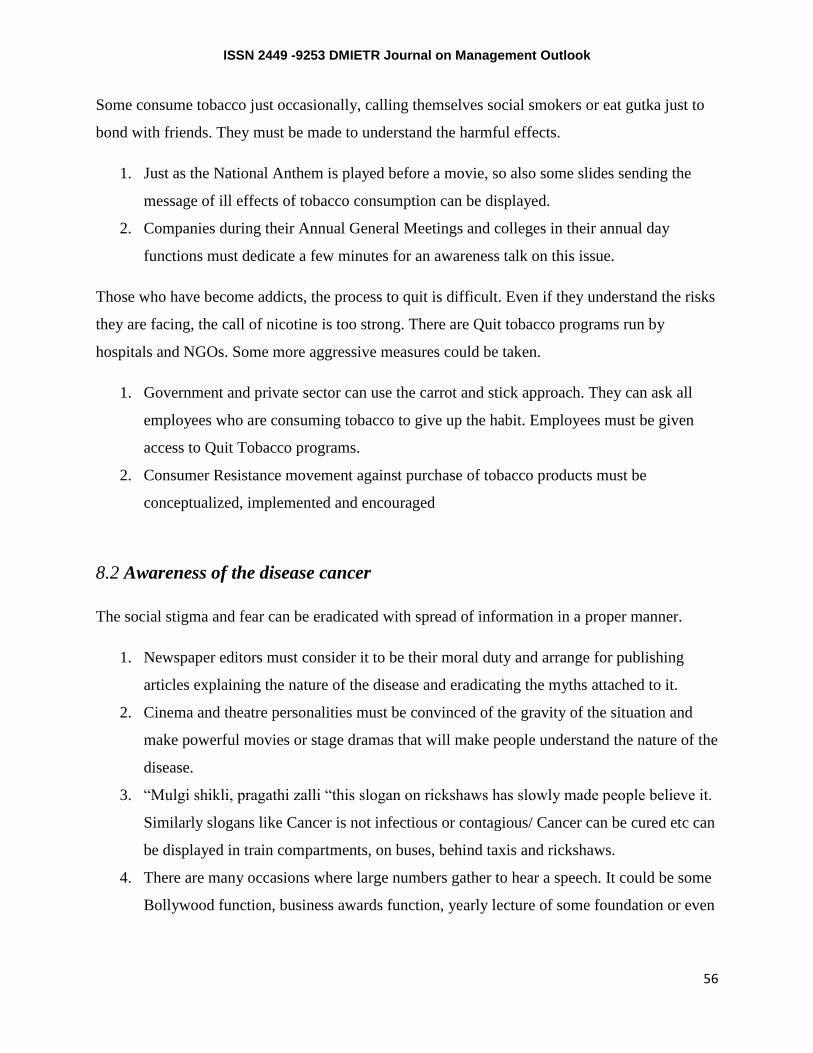
ISSN 2449 -9253 DMIETR Journal on Management Outlook
56
Some consume tobacco just occasionally, calling themselves social smokers or eat gutka just to
bond with friends. They must be made to understand the harmful effects.
1. Just as the National Anthem is played before a movie, so also some slides sending the
message of ill effects of tobacco consumption can be displayed.
2. Companies during their Annual General Meetings and colleges in their annual day
functions must dedicate a few minutes for an awareness talk on this issue.
Those who have become addicts, the process to quit is difficult. Even if they understand the risks
they are facing, the call of nicotine is too strong. There are Quit tobacco programs run by
hospitals and NGOs. Some more aggressive measures could be taken.
1. Government and private sector can use the carrot and stick approach. They can ask all
employees who are consuming tobacco to give up the habit. Employees must be given
access to Quit Tobacco programs.
2. Consumer Resistance movement against purchase of tobacco products must be
conceptualized, implemented and encouraged
8.2 Awareness of the disease cancer
The social stigma and fear can be eradicated with spread of information in a proper manner.
1. Newspaper editors must consider it to be their moral duty and arrange for publishing
articles explaining the nature of the disease and eradicating the myths attached to it.
2. Cinema and theatre personalities must be convinced of the gravity of the situation and
make powerful movies or stage dramas that will make people understand the nature of the
disease.
3. ―Mulgi shikli, pragathi zalli ―this slogan on rickshaws has slowly made people believe it.
Similarly slogans like Cancer is not infectious or contagious/ Cancer can be cured etc can
be displayed in train compartments, on buses, behind taxis and rickshaws.
4. There are many occasions where large numbers gather to hear a speech. It could be some
Bollywood function, business awards function, yearly lecture of some foundation or even

ISSN 2449 -9253 DMIETR Journal on Management Outlook
57
a politician‘s speech. At such times, to the captive audience, a small talk or documentary
can be shown to create awareness of this disease.
5. There are many event management companies. They could be approached and when they
organize events hey must request their client to give them a few minutes to create
awareness of cancer.
8.3 Diet and Hygiene counseling:
Cancer treatment is very aggressive. To sustain the treatment, patient needs to be physically
competent. Diet plays an important role here. All hospitals must have adequate literature on
Balanced Diet, foods to avoid and which to include in Diet. Such literature must be made
available to patients in audio and written forms.
The immune system of patients is low and they are prone to getting infections, patients must be
given a card as to how to maintain good hygiene standards. Gargling after every meal and
washing hands before eating are some examples of what should be written on the cards.
8.4 Early Detection
Cancer is a disease which earlier the detection, easier is its management. There are some early
symptoms which must be popularized through the channels of radio, TV and newspapers that
will encourage people to visit their doctors and get themselves tested. Lumps, patches on the
tongue, sudden loss of weight are some of the early signs.
8.5 Facilities:
The pace of increase in medical facilities has not kept pace with increase in population. Instead
of people travelling long distances to get treatment, the treatment facilities have to go to them.
This is easier said than done. Even if nodal areas have hospitals, people staying in far flung
villages and hamlets need transportation.
Roads and a good vibrant transport system is the need of the hour. PPP-Public private
partnerships must be encouraged to solve this issue.

ISSN 2449 -9253 DMIETR Journal on Management Outlook
58
Corporatization of hospitals has started. Hospitals with pleasing environment which could be
visited only by the rich are now accessible to the middle class. But corporate conscious does go
to sleep at times. There must be an independent regulatory body to ensure that there are no mal
practices.
8.6 Medical Insurance
Insurance industry is now open to private players but the penetration of medical insurance is low.
Only about 15% of the Indian population has medical insurance under government schemes or
from private health insurance schemes. Medical insurance has suffered a lot of teething problems
like court cases on settlement of claims, delays in bills settlements etc. Today some of the major
players are ICICI Lombard, Max Bupa, AppolloMunich, Bharti Axa, HDFC Ergo, Star Health,
Reliance and Bajaj Allianz.
We do not have a standalone medical insurance company. This sector is a sunrise sector. But
only companies with sound ethics can deliver. Our vast population must benefit and not be
conned. Companies entering this sector must not be in a hurry to reap benefits but must be so
financially sound that they can afford to wait to start earning profits.
IRDA must play a more regulatory role to steer the medical insurance growth in such a way that
premiums are affordable, companies do not have wrong intentions, implementation is easy and
corruption free.
Various issues like role of TPA-third party administrator and contracts between hospitals and
insurance companies need to be sorted out.
8.7 Ambience
Having a pleasant and pleasing ambience does not cost much but could impact patient opinion in
a positive manner. By word of mouth, hospital branding builds up. Soft music, stress balls,
crèche, manicured lawns, easy access to magazines and newspapers are small additions that
would go a long way. Substance always precedes form but importance of form cannot be
undermined.

ISSN 2449 -9253 DMIETR Journal on Management Outlook
59
8.8 Social Organization
It is perceived that profit must be the mission of every organization but having that as the sole
mission does not work. For sustainability and reducing business risk a larger mission is needed.
Patients are the source of profits; it would be prudent to focus on patients and not vice versa.
Organizations that have stood the test of time are those that were customer driven.
Development of Strategy is a key phase. Strategies need to be feasible to implement. They need
to be cost efficient. Above all they need to be the right strategies that will steer the organization
towards its chosen goal.
A Single Industry strategy like that of McDonalds to be adopted. It fosters a high degree of
relatedness to other departments in the organization. Operating synergies will be high as core
competencies are shared. Learning curve will also steeper as operations are focused and
repetitive.
Growth Strategy must be adopted. All its sub unit strategies, policies and rules must lead to
reaping of economies of scale, brand building, ensuring sustainability and encouraging
innovativeness.
Units to be classified as per the BCG matrix and accordingly decisions of finance allocation to be
taken.
8.6 Financial Goal Setting and Forecasting:
Financial Management must not be knee jerk methods. Goal setting and Forecasting to be done
in a scientific manner.
The aspects involved:
A
(a) Amount of capital to be raised
(b) Sources of finance
(c) Estimated cost of finance to be raised
(d) Time of procurement
B
ISSN 2449 -9253 DMIETR Journal on Management Outlook
60
(a) Investment in Capital projects
(b) Estimating Working Capital requirements
C
Financial Forecasting by preparing projected Profit and Loss account, Balance Sheet and
Cash Flow Systems.
Relying on existing data, using statistical tools future to be predicted. is predicted.
Changes to be made by observing trends and macro economic factors.
To ensure that operating profits are adequate, periodically Economic Value addition is
calculated. (EVA).
In Business, Cash is King, Cash Flows must be estimated.
8.9 References
1. Robert Anthony & Govindrajan -Management Control Systems- The McGraw-Hill Companies
2. Koontz & Weihrich -Essentials of Management -Tata McGraw-Hill
3. Khan & Jain -Financial Management –-Tata McGraw Hill Education Pvt. Ltd.
4. The Economic Times-March 2013 issues-Benett, Coleman & Co. Ltd.
From the Web Sites of
5. Tata Memorial Hospital- tmc.gov.in
5. WHO –www.who
6. CPAA -www.cpaaindia.org
7. Medical news Journals-www.medicalnewstoday
8. Music Therapy Research-cancerresearchchuk.org
Annexure I- Questionnaires used
Questionnaire to Patients
Q 1. Was Your Cancer Diagnosed easily? Yes/No
Q 2. If No, what were the reasons:
(I) Lack of your awareness.
(2) Lack of treating doctors awareness.

ISSN 2449 -9253 DMIETR Journal on Management Outlook
61
( 3 ) Lack of diagnostic centers
Q 3. Were you asked to repeat the tests? Yes/No
Q 4. If Yes, what were the reasons:
(1) Your doctor had no confidence in the reports
( 2) Any other reason
Q 5.
What was the time-gap between diagnosis and commencement of
treatment?
( 1) less than a week
( 2) more than a week but less than a month
( 3) more than a month
Q6. If more than a month, what were the reasons?
( 1) not decided on the center to take treatment
( 2) coming to terms with the diagnosis
( 3) could not arrange the finances
Q7. Did you suffer from side effects?
Q8. If yes, were they:
( 1) Loss of appetite
( 2) Hair loss
( 3 ) Diarrhea
( 4) Insomnia
( 5) Any others
Q9. Do you feel adequate time was given to you by the doctor? Yes/No
Q10. How did you fund your treatment?
( 1) From your Savings
( 2) Loans
( 3) Insurance
(4) Help from trusts, friends, relatives
( 5) Employee benefits or any other source
Q11. Do you have any suggestions for improving cancer care?

ISSN 2449 -9253 DMIETR Journal on Management Outlook
62
Questionnaire to Doctors
Q 1. Could your patient's life style have caused the cancer? Yes/No
Q 2. If yes, what could have been the reason?
Q 3. Could the cancer have been diagnosed earlier? Yes/No
Q 4. If yes, what could have been the reasons for late diagnosis?
Q5. Do patients generally agree to be treated? Yes/No
Q6. If No, what could be the reasons?
Q7. Do patients generally complete the treatment? Yes/No
Q8. If no, what could be the reasons?
Q9.
Are beds, operation theatres, diagnostic facilities, medicines etc. easily
available? Yes/No
Q10. If no, please give reasons.
Q11. What do you feel could be done to improve cancer care?

ISSN 2449 -9253 DMIETR Journal on Management Outlook
63
A case study on performance management of Logistic Management
Dr. Bharat Meghe,
Dean, Faculty of Commerce, RTM Nagpur University, Nagpur
, Dr. Kiran Nerkar,
Chairman, Business Management Board, RTM Nagpur University, Nagpur
Prof. Shailesh O. Kediya
HOD, MBA, Datta Meghe Institute of Engineering, Technology & Research, Wardha, [email protected]
Abstract:
Logistic Management works in the areas of planning, organizing, and managing the flow of
goods, information and other resources between the point of production and point of
consumption. The logistics and its processes have a good impact in almost every sector of the
industries. There is a growing concern for the macro and micro level logistics of Indian steel
industry since it is highly material intensive. The objectives of this paper is to study the logistics
management practices at Lloyds Steel Industries Ltd & to study various performance indicators
of logistic management such as Profit Before Interest, Depreciation, Taxes and Margin
(PBIDTM), Earning Before Interest, Depreciation, Taxes and Margin (EBITM), Return On
Capital Employed (ROCE), Working Capital Cycle (WCC) and Debtor Turnover (DT). The
scope of this study is restricted to 6 Steel Industries. The facts and figures for this study are
collected over past 10 years. The statistical tools such coefficient of variation and decisions
under uncertainty like Criterion of Optimism, Pessimism, Savage and Laplace are implemented
to find the best alternative for a respective performance indicator.
Keywords: Logistics, Decision under uncertainty, performance indicator, material sensetive.
A. Introduction:
A.1. Concept of Logistics:
Council of Logistics Management (1991) defined that logistics is 'part of the supply chain process
that plans, implements, and controls the efficient, effective forward and reverse flow and storage of
goods, services, and related information between the point of origin and the point of consumption
in order to meet customers' requirements'. Johnson and Wood's definition (cited in Tilanus, 1997)
uses 'five important key terms', which are logistics, inbound logistics, materials management,

ISSN 2449 -9253 DMIETR Journal on Management Outlook
64
physical distribution, and supply-chain management, to interpret. Logistics describes the entire
process of materials and products moving into, through, and out of firm.
A. 2. Nature, Need and Significance of the study:
Lloyds Steel Industry Ltd, Bhugaon, Wardha, incurs huge cost on transportation both for incoming
raw material and outgoing finished product. The industry use outsourcing for transportation and
mostly the nature of outsourcing is contractual for efficient transportation. Various decisions
regarding inventory, transportation and other logistics activities affects the overall cost of the
production.
The study aims at analyzing the nature of the problems related to logistics management in Lloyds
Steel Industries Ltd, Bhugaon, Wardha and provide the optimal solution to logistics management
in Lloyds Steel Industries, Bhugaon, Wardha.
A.3. Aims and Objectives:
The aim of the study is to understand the complexities of the logistics management and to present
this in a simple lucid manner.
A. 3. 1. Objectives:
3. To study the factors those are critical for the success of logistics management in the
industry
4. to study the various performance indicators of logistic management such as Profit Before
Interest, Depreciation, Taxes and Margin (PBIDTM), Earning Before Interest,
Depreciation, Taxes and Margin (EBITM), Return On Capital Employed (ROCE),
Working Capital Cycle (WCC) and Debtor Turnover (DT).
A.4. Scope:
As mentioned, the study is related to integrated logistics management. It is limited to steel
industries specially Lloyds steel industries ltd, Bhugaon, Wardha. The logistics data of other steel
industries taken wherever required.
A.5. Limitations:

ISSN 2449 -9253 DMIETR Journal on Management Outlook
65
The study is limited to Lloyds Steel Industries Ltd., Bhugaon, Wardha only. Wherever possible
the data from other company and industry is taken for proper results.
B. Logistics Management- Historical Development & Literature Review
Logistics was initially a military activity concerned with getting soldiers and munitions to the
battlefront in time for flight, but it is now seen as an integral part of the modern production
process. The main background of its development is that the recession of America in the 1950s
caused the industrial to place importance on goods circulations. The term, logistics, was initially
developed in the context of military activities in the late 18th and early 19th centuries and it
launched from the military logistics of World War II. The probable origin of the term is the
Greek logistikos, meaning 'skilled in calculating'. (BTRE, 2001) Military definitions typically
incorporate the supply, movement and quartering of troops in a set. And now, a number of
researches were taken and made logistics applications from military activities to business
activities.
Business logistics was not an academic subject until the 1960s. A key element of logistics, the
trade-off between transport and inventory costs, was formally recognized in economics at least as
early as the mid-1880s. (BTRE, 2001) Based on the American experience, the development of
logistics could be divided into four periods (Chang, 1998), which are represented as Figure 2.
C. Research Methodology:
Research Methodology is a way to systematically solve the research problem. It may be
understood as a science of studying how research is done scientifically. In it we study the various
steps that are generally adopted by researcher in studying his research problem along with the
logic behind them.

ISSN 2449 -9253 DMIETR Journal on Management Outlook
66
C.1. Research Design:
A research design is a master plan specifying the methods and procedures for collecting and
analyzing the needed information. It is a framework or blueprint that plans the action for the
research work.
Different research designs can be conveniently described if we categories them as :
Exploratory Research Studies
Descriptive & Diagnostic Research Studies
The researcher has used Exploratory Research Technique to get into the insights of the
proposed research work. When the purpose of a research is to gain familiarity with a
phenomenon or acquire new insights into it in order to formulate a more precise problem or
develop hypothesis, the exploratory research comes in handy.
C.2. Data Collection Methods:
The data is the raw material with which the foundation of subsequent analysis and statistical
interpretation is firmly laid.
The data are of two types:-
Primary Data, and
Secondary Data
Primary Data collection:
There are several methods of collecting primary data. Important methods are 1. Observation
method 2. Interview Method 3. Through Questionnaires 4. Through Schedules.
Out of these available methods the researcher has collected the primary data by following
methods:
Direct personal observation
Interview method- personal interview – Structured & unstructured interview
Secondary Data:

ISSN 2449 -9253 DMIETR Journal on Management Outlook
67
The researcher has collected secondary data required for this particular research work through
the following sources:
Annual Reports of Lloyds Steel Industries Ltd.
Books
Magazines
Management Journals – Specifically SCM and Logistics journals
Internet – published articles and informative websites.
C.3. Sampling:
The study is mainly related to Lloyds Steel Industries Ltd. Bhugaon, Wardha only. The relevant
financial data and non-financial data are collected for the period of year 2005-2010 in most of
the cases. Wherever possible & available data before year 2005 was also accessed.
C.4. Analysis:
Analysis and interpretation are giving meaning to the collected information by comparing them
with the existing information.
The stages followed by the researcher for the data analysis are:
1. Editing
2. Tabulation and graphical representation
3. Hypothesis testing
The researcher has used Karl Pearson Coefficient of Correlation & one tailed one sampled sign
test for small samples for hypothesis testing.
D. Logistics Management in Lloyds Steel Industries
There are logistics Management activities both inbound and outbound processes or even during
the in process. The main logistic activities are as follows:
D.1. Purchasing and Material Management

ISSN 2449 -9253 DMIETR Journal on Management Outlook
68
It has found that the procurement of raw materials for Lloyds Steel Industry is very complex.
Raw material purchasing plan of Lloyds steel Company is based on forecasts both in terms of
quantity and quality and the forecast of the steel price in the market. This is also based on the
available capital with the industry. The reasons of this complexity are as follows:
1) Raw materials cost which is the major cost of steel production fluctuates all the time. During
the study period of 2005-10, it has been found that average raw material cost constitutes 45.50%
to the total cost incurred in the company & 47.70 % of the average sales of the company. This
has made the purchasing plan cannot run according to normal period of time as it should be. At
times, when the Company realized that the price of raw materials decreased and there is a trend
that it will increase in the near future and if the Company have sufficient capital to buy a big
quantity of raw materials in order to reduce risk on the increasing price in the future, they will
order a big quantity of raw materials which are much more than what they normally need in each
production cycle.
2) Major Raw Material required for production is sprung iron, steel scrap and pig iron. Only
scrap is imported from UK, USA and Middle East. Rest of the raw material is purchases from
different cities from India i.e. Ghughus-Kadali, Bombay, Raipur, Bhandara and so on.
D.2. Warehouse Management
Warehouse acts as a linking activity between seller of raw materials and steel Company or
between steel Company and consumers. Raw materials are kept at the warehouse for further use
in the production process. If there is no warehouse, the factory might lack of raw materials in the
production process. In another case, warehouse was used to keep the finished products to wait
for further deliveries to the customers. So, warehouse acts as a support to the production process
to run according to the schedule and it has an important role in terms of marketing in order to
respond to the needs of the customers.
From the research, it has found that there is no warehouse with the company. There are few
bunkers with the company. The characteristics are as follows:
1) Pig Iron and Scrap is stored at bunker.
2) Raw materials which are intermediate and finished products is stored inside the factory
premises.
3) The locations of the bunkers of steel products are mostly in the same location as the
production area waiting for future transportation or delivery to the customers. This is because the
steel industry products are very heavy and has very low flexibility in terms of moving. In case of
moving, it is necessary to use special and expensive equipment and tools like Mobile Cranes and
EOT (Electric Overhead Trains).

ISSN 2449 -9253 DMIETR Journal on Management Outlook
69
4) Other marketing activities i.e. packaging, labeling, quality controlling happens inside the
factory building.
D.3. Inventory Management
Inventory management activities in the company are logistics activities which happened during
the inbound, in process, and outbound logistics process. Inbound logistics of raw materials are
quite complicate in the quantity calculation.
Company uses the Kanban system for inventory management. An important determinant of the
success of production scheduling based on "pushing" the demand is the quality of the demand
forecast that can receive such "push."
Kanban, by contrast, is part of an approach of receiving the pull from the demand. Therefore, the
supply or production is determined according to the actual demand of the customers. In contexts
where supply time is lengthy and demand is difficult to forecast, the best one can do is to
respond quickly to observed demand.
D.4. Transportation and Material Handling Activities
Transportation and material handling is an important logistics activity which creates the
circulation of products throughout all the supply chain efficiently. From the research, it has
found that transportation is outsourced.
This is due to the fact that these Outsource companies are more efficient in managing
transportation to prevent empty trips, as they are able manage transportation between several
customers. Besides, it has found that the characteristics of raw materials and finished products
transportation in the company are as follows:
1) Inbound transportation
Transportation of various raw materials imported from abroad is mostly in CIF (Cost, Insurance
and Freight) term.
Various transportation costs incurred before the arrival at the destination port, has already
included in the raw materials costs. Transportation mode is the Bulk Vessel. For the local
companies, the transportation costs will be the transportation costs from the port to the factory.
For the transportation of raw materials from local sources, each supplier makes the delivery to
the factory by truck. There is a Weighing Scale at the factory to weight both incoming truck and
outgoing truck (empty truck) in order to find the weight of raw material sold to the factory. The
type of truck depends on the quantity of the scrap they transported.
2) Outbound transportation
ISSN 2449 -9253 DMIETR Journal on Management Outlook
70
Due to the fact that the steel products are very heavy in weight and/or very long in size, it is
necessary to use long truck called Flat Base Trailer which could handle more weight than other
trucks. The moving of intermediate steel products needs lifting machines i.e. Crane.
Besides, there are other special tools designed for each type of steel i.e. Plate Clamp which is
used to seize the steel plate during transportation.
D.5. Customer Response Management
From the research, it has found that Company has organized customer services in order to
respond to customer‘s needs very well by using small amount of staff for such activity. This is
due to the fact that customers are relatively fixed and situated in identified locations. However, if
there is any mistake incurred with the products under delivery schedule, between delivery
processes or after delivery to consumers, company also has efficient measures to correct these
mistakes.
D.6. Reverse Logistics Activities
In Lloyds steel industry, it has found that it has very little reverse logistics cost. Sales return
amounts less than 1% to the total sale. From the study, there are following operations:
1) Steel Company have got processes and management to handle returned products from their
customers when the quality of the products delivered did not meet customer‘s needs by changing
the correct ones or offer discount for the next purchases etc.
2) LSIL manages wastes incurred during the production process by reselling them to local steel
manufactures that can use those wastes as raw materials in another production or by recycling
the waste.
D.7. LEAD TIME AND LOGISTICS COST FOR LLOYDS STEEL INDUSTRY
Another output from the study is lead time which is one of the performance measures in logistics
management. Lead time in supply chain for the upstream process in case of importing raw
material is higher than the supply from within nation vendors. Downstream lead time varies from
15 days to 21 days depending upon different products and locations.
E.Graphical Representation:
Lloyds Steel Industries, Bhushan Steel Ltd., JSW Steel Ltd., Pennar Industries Ltd., Real Strips
Ltd., Ruchi Strips & Alloys Ltd. are compared on various parameters like PBIDTM, EBITM,
ROCE, Inventory Turnover, Working capital turnover & Debtor turnover. The graphical
presentation & results are give below:-

ISSN 2449 -9253 DMIETR Journal on Management Outlook
71
2.Graph showing PBIDTM 2. Graph showing EBITM
3. Graph showing ROCE 4. Graph Showing Inventory Turnover in Times
5. Graph showing Working Capital Cycle 6. Graph showing Debtors turnover in days.
Statistical Inferences:
Based on the data collected, the average and the standard deviation were calculated to determine
the coefficient of variations. The following table reflects the ranking with respect to the
consistency related to the each parameter under consideration.
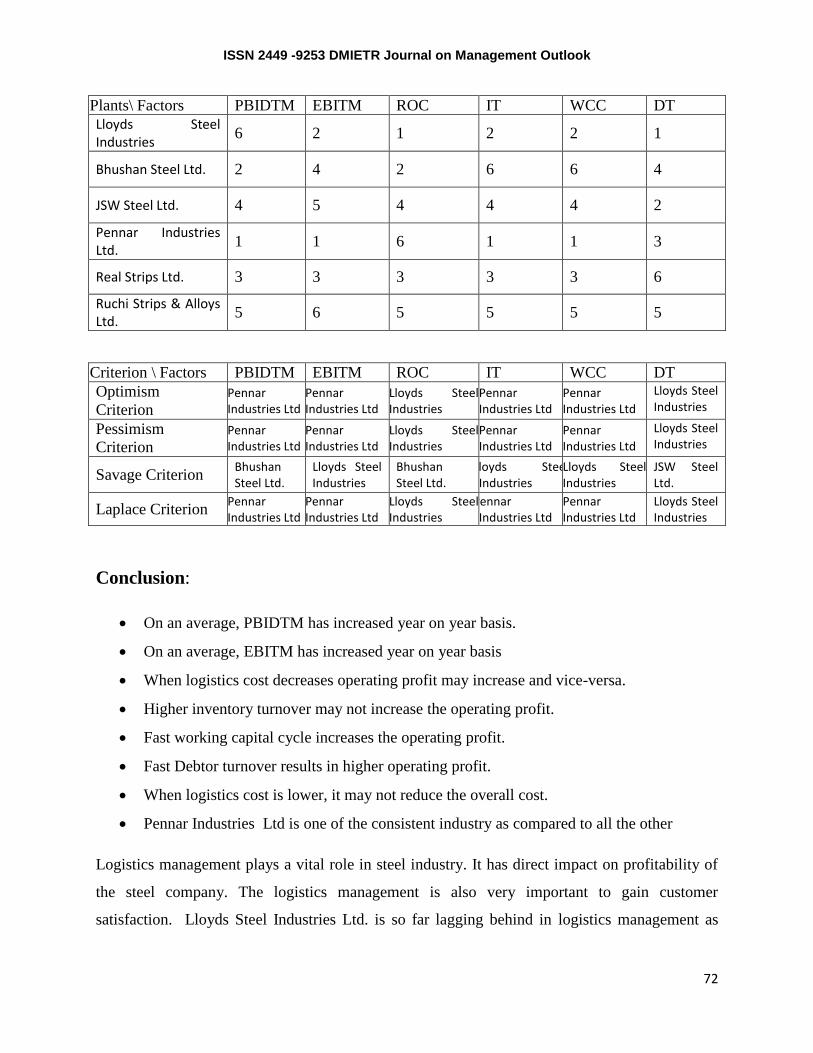
ISSN 2449 -9253 DMIETR Journal on Management Outlook
72
Plants\ Factors PBIDTM EBITM ROC IT WCC DT
Lloyds Steel Industries
6 2 1 2 2 1
Bhushan Steel Ltd. 2 4 2 6 6 4
JSW Steel Ltd. 4 5 4 4 4 2
Pennar Industries Ltd.
1 1 6 1 1 3
Real Strips Ltd. 3 3 3 3 3 6
Ruchi Strips & Alloys Ltd.
5 6 5 5 5 5
Criterion \ Factors PBIDTM EBITM ROC IT WCC DT
Optimism
Criterion Pennar Industries Ltd
Pennar Industries Ltd
Lloyds Steel Industries
Pennar Industries Ltd
Pennar Industries Ltd
Lloyds Steel Industries
Pessimism
Criterion Pennar Industries Ltd
Pennar Industries Ltd
Lloyds Steel Industries
Pennar Industries Ltd
Pennar Industries Ltd
Lloyds Steel Industries
Savage Criterion Bhushan Steel Ltd.
Lloyds Steel Industries
Bhushan Steel Ltd.
Lloyds Steel Industries
Lloyds Steel Industries
JSW Steel Ltd.
Laplace Criterion Pennar Industries Ltd
Pennar Industries Ltd
Lloyds Steel Industries
Pennar Industries Ltd
Pennar Industries Ltd
Lloyds Steel Industries
Conclusion:
On an average, PBIDTM has increased year on year basis.
On an average, EBITM has increased year on year basis
When logistics cost decreases operating profit may increase and vice-versa.
Higher inventory turnover may not increase the operating profit.
Fast working capital cycle increases the operating profit.
Fast Debtor turnover results in higher operating profit.
When logistics cost is lower, it may not reduce the overall cost.
Pennar Industries Ltd is one of the consistent industry as compared to all the other
Logistics management plays a vital role in steel industry. It has direct impact on profitability of
the steel company. The logistics management is also very important to gain customer
satisfaction. Lloyds Steel Industries Ltd. is so far lagging behind in logistics management as

ISSN 2449 -9253 DMIETR Journal on Management Outlook
73
compare to the industry standard. The efforts should be taken to improve the logistics
performances.
Bibliography and References.
1] Alberto P (2000), "The Logistics of Industrial Location Decisions: An Application of the
Analytical Hierarchy Process Methodology", International Journal of Logistics: Research
and Application.
2] Bearnon, B.M (1998), "Supply Chain design & analysis: Models & Methods,"
International Journal of Production Economics.
3] Cooper, M. C. and Ellram, L M. (1993),'Characteristics of Supply Chain Management
and the Implications for Purchasing and Logistics Strategy', The International Journal of
Logistics Management.
4] Vaidya Sanjiv, Ghosh, S. and Agarwal Vivek (2004). "Supply Chain Management – The
ERP way". Supply chain management – for global competitiveness Edition II.
5] Hays, William Lee, (1973) Statistics for the Social Sciences, Holt, Rinehart and Winston.
6] Creswell, J. (1998). Qualitative inquiry and research design: Choosing among five
traditions. Thousand Oaks, California: Sage Publications.
7] Creswell, J. (2003). Research Design: Qualitative, Quantitative, and Mixed Methods
Approaches. Thousand Oaks, California: Sage Publications.
8] S Saha, Standard Deviation, Measures of Dispersion, Business Statistics.
9] Khanna, K.K. (1985), Physical Distribution management-Logistical Approach, Himalaya
publication house.
10] Roy, Chowdhury B.K., (1990), Logistics Management, Universal publishing house.

ISSN 2449 -9253 DMIETR Journal on Management Outlook
74
Websites :
13. www. Wikipedia.com
14. http://www.logisticsworld.com/logistics.htm
15. http://www.steelworld.com/proessar.pdf
16. http://www.sundram.com/logistics.htm
17. www.cnbc.com/
18. http://dssresearch.com
19. www.google.com
20. http://www.icra.in/Files/PDF/SpecialComments/2010-February-Steel.pdf
21. http://newsletters.cii.in/newsletters/steelsummit2009/pdf/SESSION_1/RVS_Ramakrishna
22. http://www.burke.com.
23. http://www.research-int.com
24. http://www.cmor.org

ISSN 2449 -9253 DMIETR Journal on Management Outlook
75
“NON CONTACT LENGTH MEASUREMENT‖
Submitted By
KAPIL V. DESHMUKH*, PROF R.A. LEKURWALE, NILESH DHOTE,
(D.M.I.E.T.R. WARDHA)
ABSTRACT:- In this paper an ―non-contact length measuring device ―which can measure the length of an object
without touching it from any particular distance is suggested .Mathematical trigonometric relationship of sine,
cosine and tangent is used with observations of device to measure length.
Keyword: -non-contact length measuring, trigonometric relation
NON CONTACT LENGTH MEASUREMENT
INTRODUCTION: - let us assume that we need to measure the length of a pole standing in front at a some
distance normally we need to take a measuring tape, climbthe pole and measure the distance.For this we need to
climb the pole, it becomes more tedious job to measure the length of the pole moreover if the pole is carrying the
current it becomedangerous. This is one of the example there may be some other case also.
Now I am herewith introducing you with a device which will measure the length of pole without touching it
and from any specific safe distance from it. It is non contact, light measurement device. It is basically dependent on
sine, cosine and tangent of the angle that is formed by the light from any particular distance between two ends of the
object which length is to be calculated.
MATHEMATICAL RELATIONSHIP: - Let us now look toward figure 1
A
x
y
ground level OӨ B
z
fig 1 schematic representation of actual process
Here in this figure an pole is shown A-B whose length is to be calculated by the device ―O‖ at a particular distance
from the base of the pole ―B‖.
Let y: - height of pole A-B
z:- distance of pole from device ―O‖ at ground level
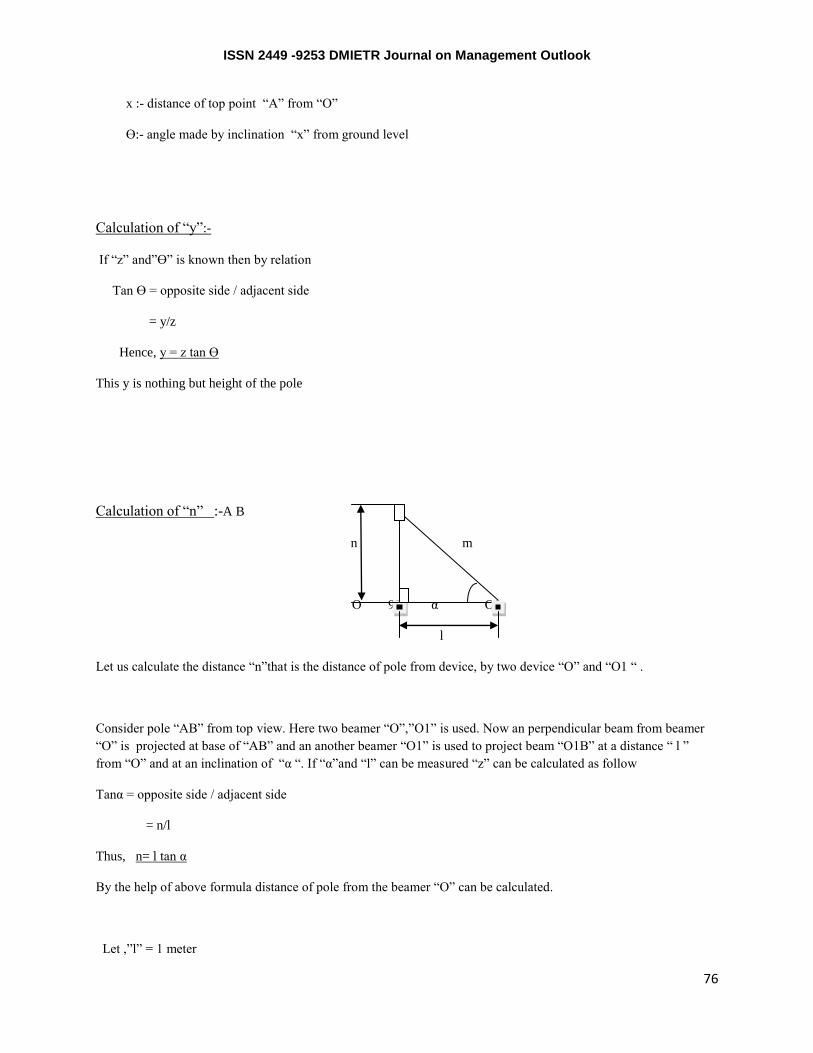
ISSN 2449 -9253 DMIETR Journal on Management Outlook
76
x :- distance of top point ―A‖ from ―O‖
Ө:- angle made by inclination ―x‖ from ground level
Calculation of ―y‖:-
If ―z‖ and‖Ө‖ is known then by relation
Tan Ө = opposite side / adjacent side
= y/z
Hence, y = z tan Ө
This y is nothing but height of the pole
Calculation of ―n‖ :-A B
n m
O 90 α O1
l
Let us calculate the distance ―n‖that is the distance of pole from device, by two device ―O‖ and ―O1 ― .
Consider pole ―AB‖ from top view. Here two beamer ―O‖,‖O1‖ is used. Now an perpendicular beam from beamer
―O‖ is projected at base of ―AB‖ and an another beamer ―O1‖ is used to project beam ―O1B‖ at a distance ― l ‖
from ―O‖ and at an inclination of ―α ―. If ―α‖and ―l‖ can be measured ―z‖ can be calculated as follow
Tanα = opposite side / adjacent side
= n/l
Thus, n= l tan α
By the help of above formula distance of pole from the beamer ―O‖ can be calculated.
Let ,‖l‖ = 1 meter
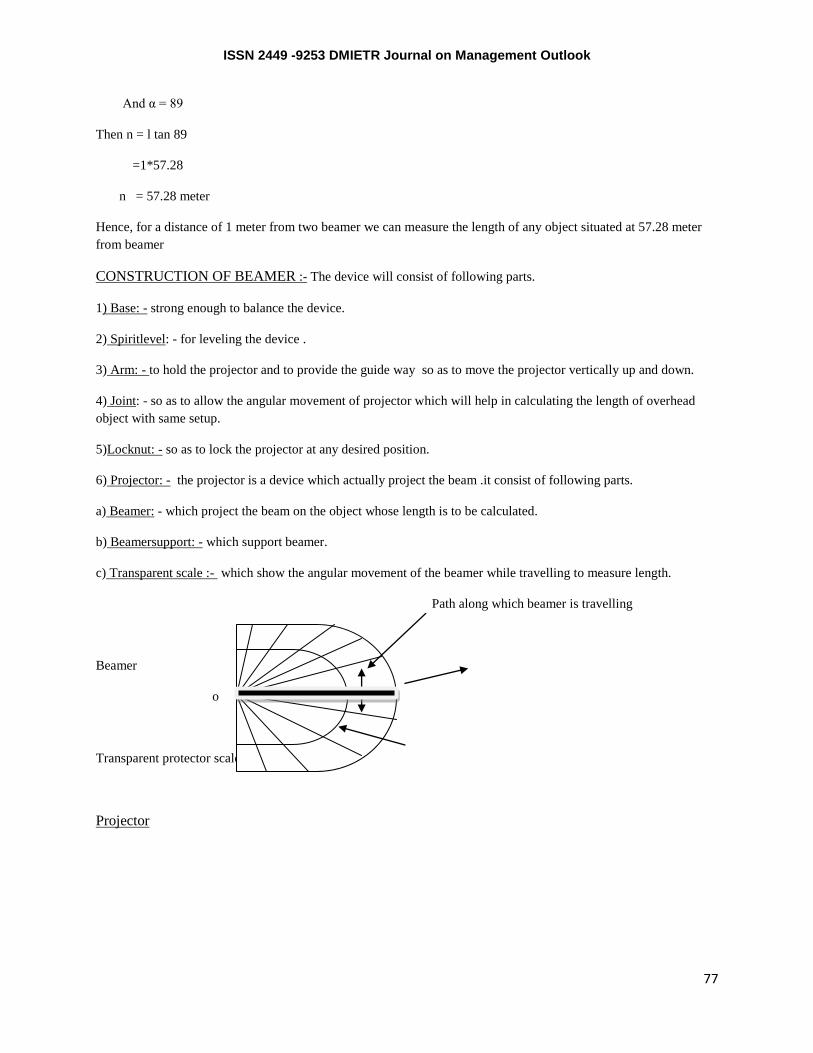
ISSN 2449 -9253 DMIETR Journal on Management Outlook
77
And α = 89
Then n = l tan 89
=1*57.28
n = 57.28 meter
Hence, for a distance of 1 meter from two beamer we can measure the length of any object situated at 57.28 meter
from beamer
CONSTRUCTION OF BEAMER :- The device will consist of following parts.
1) Base: - strong enough to balance the device.
2) Spiritlevel: - for leveling the device .
3) Arm: - to hold the projector and to provide the guide way so as to move the projector vertically up and down.
4) Joint: - so as to allow the angular movement of projector which will help in calculating the length of overhead
object with same setup.
5)Locknut: - so as to lock the projector at any desired position.
6) Projector: - the projector is a device which actually project the beam .it consist of following parts.
a) Beamer: - which project the beam on the object whose length is to be calculated.
b) Beamersupport: - which support beamer.
c) Transparent scale :- which show the angular movement of the beamer while travelling to measure length.
Path along which beamer is travelling
Beamer
o
Transparent protector scale
Projector
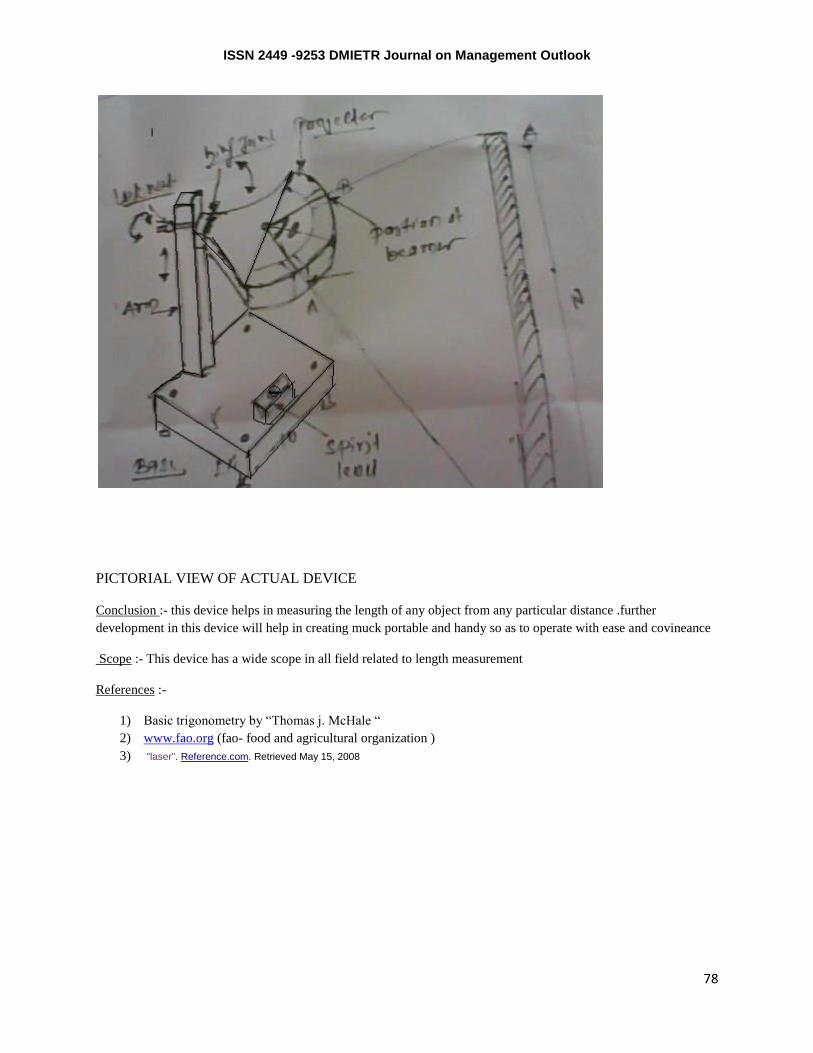
ISSN 2449 -9253 DMIETR Journal on Management Outlook
78
PICTORIAL VIEW OF ACTUAL DEVICE
Conclusion :- this device helps in measuring the length of any object from any particular distance .further
development in this device will help in creating muck portable and handy so as to operate with ease and covineance
Scope :- This device has a wide scope in all field related to length measurement
References :-
1) Basic trigonometry by ―Thomas j. McHale ―
2) www.fao.org (fao- food and agricultural organization )
3) "laser". Reference.com. Retrieved May 15, 2008

ISSN 2449 -9253 DMIETR Journal on Management Outlook
79
Environment Management Audit: -A Supporting Tool for
“Challenging Problems in Environment Management”
By: Aditya A.Bal
1) Introduction
Modern industrial civilization along with the mushrooming growth in the human population has
led to a rapid degradation in the human environment. world over , more than a hundred square
kilometer land with natural environment is used every day for houses, factories, roads , railways
, canals and other facilities for modern civilization. Much of the forest cover in Asia and Africa
are vanishing at an alarming rate leading to desertification and famine apart from contributing to
the green house effect .Pollution control in industry is a challenge in present global scenario.
Industries should not only concentrate on profit making but also on the protection of
environment due to harmful effects of the pollutants, as experienced by the public, therefore,
there is a considerable increase in awareness amongst the public. Now, public is demanding
environment friendly industrial growth and putting pressure on the Government for taking
necessary steps to pressurize the industries in meeting the pollution norms. The government has
put some regulations in this regard viz Air Act, Water Act and Environment Protection Act
which are being amended from time to time formulating more and more stringent norms to
comply with.
On March 13, 1992, the Ministry of Environment and Forest issued a notification under the
Environment ( Protection ) Act 1986 and subsequently amended on April 22, 1993, stating that
every industry has to submit an ‗Environment Statement‘ for the financial year ending March 31,
in a prescribed format by September 30 of every year, beginning 1993. Following are the notable
features of the format.
Exhibit 1

ISSN 2449 -9253 DMIETR Journal on Management Outlook
80
a) Consumption pattern of different resources and raw materials alike.
b) Quality generation of pollutants, hazardous waste and solid waste.
c) Disposable methods of waste
d) Resource conservation
e) Investment details and
f) Environment management system
2) Defining Environmental Audit
The concept of Environmental Audit (EA) dates back to 1980. International Chamber of
Commerce (ICC) took an important initiative to transform it in the form of an instrument
(or tool) for corporate environmental management. Environmental Audit has been
defined in several forms.
A systematic objective method of reviewing management systems & controls and
verifying whether environmental standards, regulatory, company and good
industry standards, are being met. ( M/s Arthur D. Little, USA EA Consultants)
A systematic examination of performance to ensure compliance with
requirements during the operational phase of industrial activity including the
following components:
- Full Management Commitment
- Audit Team Objectivity
- Professional Competence
- Well defined and systematic approach
- Quality Assurance

ISSN 2449 -9253 DMIETR Journal on Management Outlook
81
- Follow up
A management tool comprising a systematic, documented, periodic, and objective
evaluation of the performance of the organization, management and equipment
designed to protect the environment with the aim of
- Facilitating management control of environmental practices
- Assessing compliance with company policies, including observance of the
existing regulatory requirements
There was no universally accepted definition of Environmental Audit. The methodology that
should be followed was also not standardized, until ICC took the responsibility of restricting it.
The definition of Environmental auditing mentioned above was finally adopted by ICC.
Environmental Audit is typically a combination of (I ) Pollution Audit, (ii ) the Pollution
Prevention or Waste minimization Audit and ( iii ) Environmental management Systems Audit.
The audit gathers information about the Environmental Management Systems, adopted by the
organization, status on compliance requirements and standards. The audit also highlights whether
other information and data required are lacking. Additionally, it incorporates an assessment of
Risks and study for Waste Utilization/minimization, through following measures.
An activity of verification of records
A comparison of outputs with expectations
An assessment of avoidable errors and waste
The Environmental Audit is also considered as ―Pro-Active‖ activity wherein, apart from finding
faults, weak areas in the system are identified and measures are undertaken for improving overall
productivity of the industry.
3) The Objectives

ISSN 2449 -9253 DMIETR Journal on Management Outlook
82
The scope and nature of each audit varies according to the objectives of the audit and the
character being reviewed or examined. Broadly, the objective may fall in one of the
following categories:
a) Identification of actual and potential risk and liabilities
b) Ensuring whether the plant operations are in line with the company‘s requirement and
adopting good management practices
c) To determine compliance with statutory and regulatory bodies requirements
4) The Advantages
The advantages of EA to the pursuing industry are as broad as the audit objective. The
prime and obvious advantage of the audit is to help in safeguarding the environment and
to assist in compliance with the regulatory requirement. The action reduces exposure to
ligation. Normally, the advantages of Audit vary from situation as listed below:
Increasing employee awareness of Environmental Laws, regulations and standards
Finding out the potential cost saving areas within the plant including waste
minimization/resource recovery possibilities
Better exchange of data between group related to operation and management
Helping management to take decisions in relation to plant modification or alteration
Ensuring better relation with the regulatory authorities by way of meeting regulatory
requirement
Providing an info-base which can be used in emergent conditions and validating its
potential
5) Five Step Approach for Effective Environment Audit Management

ISSN 2449 -9253 DMIETR Journal on Management Outlook
83
Exhibit 2.
Step 1. Set policy
SET POLICY
ORGANISE STAFF
PLAN and SET STANDARDS
MEASURE PERFORMANCE
LEARN FROM EXPERIENCE
ISSN 2449 -9253 DMIETR Journal on Management Outlook
84
Policy must aim to minimize and control all accidental loss. Identifying hazards and
assessing risks, deciding what precautions are needed, putting them in place.
Step 2. Organize Staff
To manage risks effectively we need the participation of staff and commitment to it. This
can be achieved through the 4 C‘s namely.
i) Competence: Competence involves assessing the skills required to carry out all tasks
effectively. Make arrangements for access to sound advice and help.
ii) Control: Leading by example. Identify people responsible for particular jobs
especially where special expertise is called for. Ensuring that all management
personnel understand their responsibilities, and that all employees know what they
must do and how they will be supervised and held accountable.
iii) Cooperation: Consulting staff and their representatives and involving them in
planning and reviewing performance. Writing procedures and solving problems.
iv) Communication: Providing information about hazards, risks and preventive measures.
Discussing Health, Safety and Environment issues regularly.
Plan and Set Standards
Planning involves setting objective, identifying hazards, assessing risks, implementing
standards of performance and developing positive culture for health, safety and
environment. Planning should provide for the following
Identifying hazards and assessing risks, and deciding how they can be eliminated
or controlled
Complying with the health, safety and environment laws that apply to your
business
Agreeing health, safety and environment targets with managers and supervisors
Purchasing and supply practices which take health, safety and environment into
account
Design of tasks, processes , equipment, products and service
Measure Performance
Measuring performance requires to know the following

ISSN 2449 -9253 DMIETR Journal on Management Outlook
85
Where you are
Where you want to
What is the difference and why
Learn from experience
Monitoring provides the information to review activities and decide how to improve
performance. Review the effectiveness of your environment management paying
attention to:
The degree of compliance with health, safety and environment performance
Areas where standards are absent or inadequate
Achievement of stated objectives within given time scales
Injury, illness and incident data
6) Recognized Benefits of Environment Audit
Increase awareness of employees about environmental policies and responsibilities
Assist in substantiating compliance with laws and regulations and with company‘s
policy and standards
Major thrust areas can be identified where training and education is required to be
given to employees.
Assures adequate and up to date information base for decision making in relation to
plant modification and expansion.
Reduce the risks of prosecutions and penalties, etc.
Facilitate comparisons and exchange of information between similar operations.
Means of potential cost savings can be identified through waste minimization, reuse,
recycle, recovery and reduction in pollution levels.
7) Specific Pressures Faced by the Industries in India
o The environmental deterioration is causing concern to government and public

ISSN 2449 -9253 DMIETR Journal on Management Outlook
86
o The Government of India is transferring pollution abatement responsibilities to
industry
o As the economy shifts towards greater export orientation, Indian industry and
businesses are finding the export difficult due to our poor environmental
performance compared to the one accepted internationally. This impedes market
penetration.
8) Environmental Audit as a Management Tool
Environmental audit serves as a best technique to detect wastage and improve
productivity, as a help in abating environmental damage and in complying with
prescribes norms and regulations. Management has deep interest in each of these aspects.
Environmental audit is not merely a step to comply with the requirement to furnish an
annual environmental statement. The importance of environmental audit lies in
introspection, self discipline and enlightened self interest. Environmental audit has been
recognized as an important tool for environmental management. Environmental audit
provides support to an organization to monitor whether adopted Environmental
Management Systems (EMS) conform to planned arrangements. Audit also helps in
monitoring of their effectiveness and suitability. Evaluation and application of the data
generated during the activity of audit can also be carried out effectively for the
presentation to management. Such periodic presentations facilitate management‘s
overview of the performance of the organization with respect to the EMS activities. The
environmental audit is an independent verification of whether EMS confirms to the
specified criteria. Audit can be carried out by the organization itself. This is termed as
internal audit. An agency certified as auditors may also carry out this job called third
party audit.
9) Environmental Audit Scenario in India
EA in India is different from that in Developed Countries in terms of Objectives, Scope,
Coverage and Methodology.
The EA in India is named as Environmental Statement (ES), which is a part of the EA .
The aim of the ES of an audit is to facilitate supervision and, at the same time, gain
information on the measures required to be taken by the concerned unit as regards
compliance with the company‘s internal policies and with the regulation in force. The ES
should enable units to take a comprehensive look at i) their industrial operations and
facilities, ii) understanding of material flows, iii) focus on areas where waste reduction is
possible and, iv) consequently saving in input costs.
Objectives

ISSN 2449 -9253 DMIETR Journal on Management Outlook
87
Prevent or Reuse Waste Generation- by examining the production process
involved in Industrial Operations and Identifying origin of wastes.
Maximize the raw material conversion and improve in-plant practices.
Evolve possible alternatives for raw material substitution or process change.
Examine whether recycle, recovery or reuse is possible.
Treat the unavoidable waste in order to minimize its adverse impact on the
environment.
Scope
Every agency carrying out industrial operation or process, requiring consent to operate,
have to submit the ES every year before 30th
September.
Coverage
Every industry will have to provide information on the water, energy and other raw
material consumption, pollution generated, information on hazardous wastes and solid wastes
along with the disposal practices. The industries are also required to specify the impact of
pollution control measures on conservation on conservation of natural resources.
Methodology
For preparing the ES, following steps are to be adopted by an authorized audit team as
suggested by Ministry of Environment aand Forest Govt. of India.
Preparatory Activity
On Site Visit
Post Visit Activities.
10) Life Cycle Assessment ( LCA)
This is a tool to assess the environmental impact of a product manufactured and its
copmparison with other available products with specific reference to adverse effect on
environment, during and after their production. Since the evaluation of impact of product
is right from its inception to final disposal, this is called as cradle to grave approach. This
technique considers all the stages of product from the environmental angle. Such an
information can be obtained from the environmental life cycle assessment.

ISSN 2449 -9253 DMIETR Journal on Management Outlook
88
11) Conclusion
Environmental Audit is a must for better environmental pollution control. It must be
treated as a helping tool and not as a statutory requirement. Environmental audit also
proves helpful in decision making. It should be conducted voluntarily and faithfully.
Environmental audit leads to pollution control and as well as pollution prevention which
in turn increases productivity and quality.
We as human being always demand something from the mother earth. But the essence
lies in to know what our mother earth demands from us. The day when we find an answer
to this we can definitely say that we as human being have certainly given back something
to our earth in return to the immense resources and such a beautiful environment that she
has given to us. Just think of the answer. This is an appeal to all those who go through
this article.
References
1) “An Introduction to Environmental Management”, Dr.Anand S.Bal
2) “Environmental Audit- What it is and how to Organise it”, Annon 1993
3) “Environmental Audit- The Green Accounting”, Kharbanda.O.P
4) “Successful Health and Safety Management-The Role of Audits”, David Eves,
ISSN 2449 -9253 DMIETR Journal on Management Outlook
89
Invasion of MNCs on Indian Economy
Dr. Milind R. Patil
HoD, Commerce Department,
Arts, Commerce and Science College, Arvi, Dist. Wardha.
Abstract: - Being the second largest population of the world, Indian economy has much
more importance over the world economic scenario. Unique of its kind, 70% Indian economy is
based on agriculture and related businesses. Almost 80% population is directly related to or
indirectly dependable on agriculture.
Before Liberalization, Indian economy was much stable and growing at a moderate
speed. GDP and inflation ratio was maintained and hence average Indian life was happy go easy.
Most of the farmers were dependent on traditional farming practices and their average produce
was sufficient enough to meet the needs of life. Till this time farming was not recognized as a
business, rather it was part of life and was a routine.
MNCs have changed the perspective of businesses. Huge investments, tremendous
production, big marketing chains and in addition infrastructure facilities were the real strengths.
Most of the production and distribution is based on mechanized work and less human power is
required everywhere. This is one of the most disturbing part for our country. As compare to setup
and business volume, these MNCs does not require large number of workers to handle all works.
Mechanical work and automation reduced their recurring expenses. This way MNCs are able to
reduce production cost at a great extent. Low production cost means high profit of margin.
Extensive advertising is the key of sell. All eminent personalities of film world and star players
are brand ambassadors of these companies. Continuous and repeated display of advertisements
on almost every media, automatically creates demands and sales.
Also most of their local distributors are always face a problem of dumping huge stocks.
Stocks of moving goods are not only dumped but non-moving goods were also dumped.
Distributors margin is not more than 5% including all expenses. It has been calculated by many
distributors that at the end of the financial year they have earned only 2% of their investments. In
addition to this advance payments are taken. Every distributor is electronically linked with the

ISSN 2449 -9253 DMIETR Journal on Management Outlook
90
marketing head and day to day inventory is checked out. Company‘s Sales Manager checks the
day to day inventory of every distributor and place orders as per his own wish. Distributors are
unaware of these orders and before delivery of goods to his warehouse, payments have been
credited to company‘s account. Most of the distributors does not have freedom of business. They
just work like employees of the company.
The real threat of these MNCs to Indian economy is of profit sharing. These companies
generate huge profits using all above unethical business practices. This profit is transferred to the
parent company situated abroad. Raw material, machinery for production are not purchased from
local market but imported from the source country.
While evaluating all above working styles of MNCs it can be easily noted that there is no
contribution of these companies in our economical growth, rather due to these companies our
local manufacturers are unable to find market and have lost their businesses. Widespread Local
Indian industry of FMCG products is now no more. Most of them way long established brands
have been disappeared from market. Regional small scale industries collapsed. This has resulted
in huge unemployment on regional level and labor in search of jobs moving towards metros. All
those small industries are unable to fight these MNCs and lost their bread and butter.
Also these companies are not interested in overall growth of country. These companies
are playing double tactics to save taxes in India. Raw material imported is not a finish product
and comes in a low taxable category whereas Government has given some tax benefits to these
industries or these companies are taking advantages of loop wholes of taxation policies. A very
good example of this VAT. Local Indian manufacturer have to pay multi point taxes on goods
produced and marketed. Each point of tax directly increases prices of the goods. Whereas MNCs
are taking advantages of Stock transfer facility in VAT. These companies have own
infrastructure of warehousing, logistics and micro distribution. A product manufactured is not
sold through a chain. All infrastructure of company is used to save this tax and stock transfer is
shown in the accounts. Hence the product is sold to retailer only. The entire chain in between is
skipped by these companies. This way these companies are creating revenue loss.
All in all MNCs are nothing but invasion on Indian economy. After all no business is
established to help people. The only and simple purpose of every business is to generate profit.
MNCs are not interested in Indian development. These companies have nothing to do with India
and Indian people, only motto is to generate profit. As we are second largest population in the
world our markets can generate profits more than many countries of America and Europe.
Lastly, after GATT we are mire spectators of lost economy of our country. Like
Argentina, we will also be forced to critical financial situations in coming days. The only thing
we can do is to stop purchasing MNCs products. America has launched a campaign, ―Be
American, Buy American.‖. Where we are? Shall we forgot our beloved Mahatma Gandhi? and
his Swadeshi Mantra? If not, standup and start action from your own family.

ISSN 2449 -9253 DMIETR Journal on Management Outlook
91
TOTAL QUALITY MANAGEMENT OR TQM IN NEW ORGANISATION
1st Author: Mr. Shyam K Fardale.
Asst. Prof. Datta Meghe Institute of Engineering Technology, Wardha.Mob. 9923155657.
2nd
Author: Dr. Rajiv Jadhao
Head of Commerce Dept.,
Associate Professor,
Lok Mahavidyalaya, Wardha.
3rd
Author: Mr. Amol Narayane
Asst. Prof. Datta Meghe Institute of Engineering Technology, Wardha.Mob. 9923155657
Abstract
Total quality management is a management system for a customer focused organization that
involves all employees in continual improvement of all aspects of the organization. TQM uses
strategy, data, and effective communication to integrate the quality principles into the culture and
activities of the organization.
TQM functions on the premise that the quality of products and processes is the responsibility of
everyone who is involved with the creation or consumption of the products or services offered by
an organization. In other words, TQM capitalizes on the involvement of management, workforce,
suppliers, and even customers, in order to meet or exceed customer expectations. Considering the
practices of TQM as discussed in six empirical studies, Cua, McKone, and Schroeder (2001)
identified the nine common TQM practices as cross-functional product design, process
management, supplier quality management, customer involvement, information and feedback,
committed leadership, strategic planning, cross-functional TQM Programmes, and employee
involvement.

ISSN 2449 -9253 DMIETR Journal on Management Outlook
92
INTRODUCTION
Total quality management or TQM:-
Definition:-Total quality management is a management system for a customer focused
organization that involves all employees in continual improvement of all aspects of the
organization. TQM uses strategy, data, and effective communication to integrate the quality
principles into the culture and activities of the organization.
Definition:-Total quality management or TQM is an integrative philosophy of management for
continuously improving the quality of products and processes.
TQM functions on the premise that the quality of products and processes is the responsibility of
everyone who is involved with the creation or consumption of the products or services offered by an
organization. In other words, TQM capitalizes on the involvement of management, workforce, suppliers,
and even customers, in order to meet or exceed customer expectations. Considering the practices of
TQM as discussed in six empirical studies, Cua, McKone, and Schroeder (2001) identified the nine
common TQM practices as cross-functional product design, process management, supplier quality
management, customer involvement, information and feedback, committed leadership, strategic
planning, cross-functional TQM Programmes, and employee involvement.
Objective & Scope of the Study.
Objective:-
1. To identify the TQM practices followed by the company.
2. To evaluate the impact of Total Quality practices in New Organisation.
3. To study the effect of Quality Practices on productivity New Organisation.
Scope:-
ISSN 2449 -9253 DMIETR Journal on Management Outlook
93
This research provides me with an opportunity to explore in the field of Quality
Management.This research also provides the feedback of people involved in the Total Quality
Management Apart from that it would provide a great deal of exposure to interact with the high profile
managers of the company.
This project will give brief information about Total Quality Management used by New
Organisation.
1. This project will be useful to the New Organisationas well as the Industries which follow the same
Total Quality Management.
2. This will helps the industries to make appropriate Total Quality Managementmodule.
Limitation:-
1. The Paper is limited to New Organisation.
2. The duration of the Paper is about 1-2 months observation & Actual preactice (2011-12).
3. The project is evaluated only on the parameter of Total Quality Management.
Hypothesis of the project
1. The company has good policy & measures towards Total Quality Management.
2. Total Quality Management impart positive attitude, knowledge & improve the efficiency of
employeesProcess ,Productivity.
Hypothesis testing will result in either accepting the hypothesis or rejecting it.
RESEARCH METHODOLOGY
Meaning: -

ISSN 2449 -9253 DMIETR Journal on Management Outlook
94
In common, language research refers to a search for knowledge. We can also
define Research as a scientific and systematic search for pertinent information on a specific
topic. Thus, research is an original contribution to the existing stock of knowledge making
for its advancement. It is a purposive investigation. The main aim of research is to find out
the truth which is hidden and which has not been discovered yet. Research process involves
defining the problem, formulating the hypothesis, organizing and evaluating the data,
deriving inference and conclusion after careful testing.
Definition: -
According to berry “A careful investigation or inquiry especially through search
for new facts in any branch of knowledge”
Redman and Mory defined research as “Systematized effort to gain new knowledge”
For every comprehensive research, a proper research methodology is indispensable and it has
to be properly conceived.
Collection of data:-
Initially the informal discussion was administered with personnel manager and then the sample
was fixed as in the second step, the questionnaire was about the subject Total Quality Managementand
its usefulness for the organization with assistance of personnel manager.
Primary data:-
Primary data is collected through direct interaction with the New OrganisationEmployees
through questionnaire
Secondary data:-
Through Official documents like -
1. Various files of administrator department

ISSN 2449 -9253 DMIETR Journal on Management Outlook
95
2. Annual TQM Programmes reports,Audit Reports etc.
3. Data from Administrative department.
SAMPLING
Sampling is the selection of the part of the element from the entire population. Sample is the
small group taken under consideration from the total group/population. Therefore, for this study
selected employee from New Organisation.
Calculation of sample size is based on random sampling technique for the project.
Sample Space – 10 New Organisation.
Samples – Organisation Practices.
Sampling Technique – Random Sampling
Sample Size – 10 New Organisation.
DATA EVALUATION:
The extensive data collected through the questionnaires is evaluated to arrive at the needs of TQM
Programmes to the employees and the effect of TQM Programmes on the improvement of their
performance & implementation of TQM.
Total Quality Managementat in New Organisation:-
Definition:-Total quality management is a management system for a customer focused
organization that involves all employees in continual improvement of all aspects of the
organization. TQM uses strategy, data, and effective communication to integrate the quality
principles into the culture and activities of the organization.
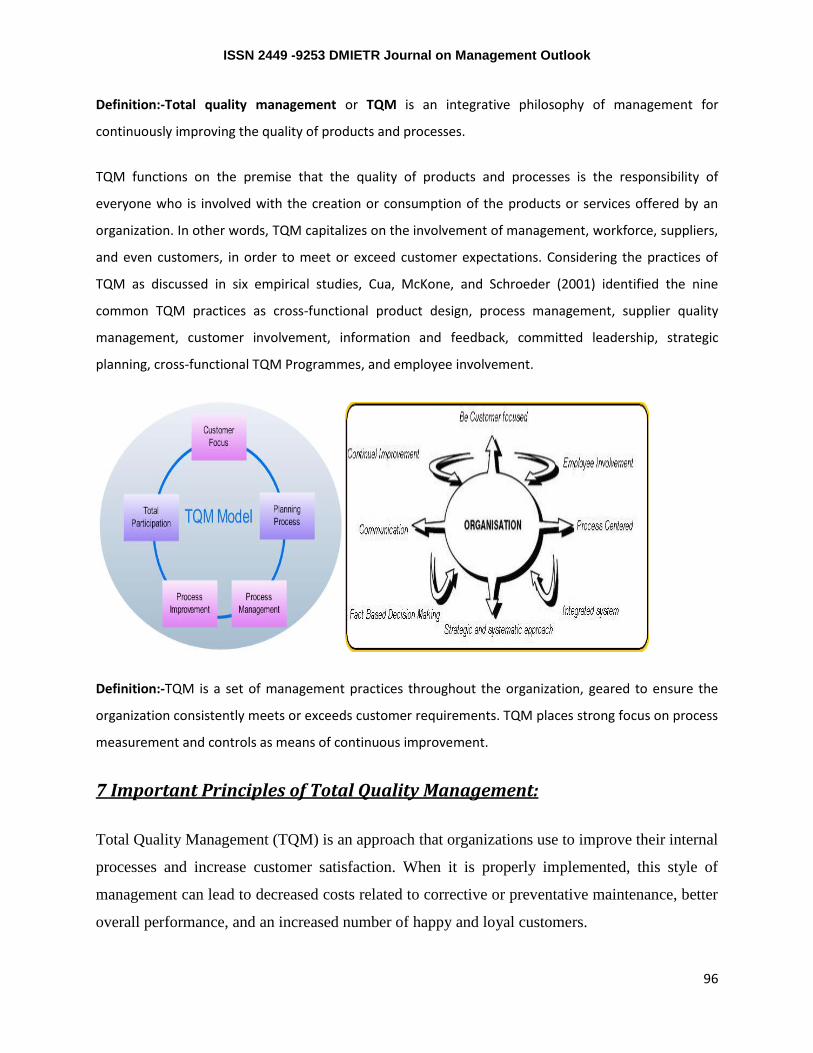
ISSN 2449 -9253 DMIETR Journal on Management Outlook
96
Definition:-Total quality management or TQM is an integrative philosophy of management for
continuously improving the quality of products and processes.
TQM functions on the premise that the quality of products and processes is the responsibility of
everyone who is involved with the creation or consumption of the products or services offered by an
organization. In other words, TQM capitalizes on the involvement of management, workforce, suppliers,
and even customers, in order to meet or exceed customer expectations. Considering the practices of
TQM as discussed in six empirical studies, Cua, McKone, and Schroeder (2001) identified the nine
common TQM practices as cross-functional product design, process management, supplier quality
management, customer involvement, information and feedback, committed leadership, strategic
planning, cross-functional TQM Programmes, and employee involvement.
Definition:-TQM is a set of management practices throughout the organization, geared to ensure the
organization consistently meets or exceeds customer requirements. TQM places strong focus on process
measurement and controls as means of continuous improvement.
7 Important Principles of Total Quality Management:
Total Quality Management (TQM) is an approach that organizations use to improve their internal
processes and increase customer satisfaction. When it is properly implemented, this style of
management can lead to decreased costs related to corrective or preventative maintenance, better
overall performance, and an increased number of happy and loyal customers.

ISSN 2449 -9253 DMIETR Journal on Management Outlook
97
However, TQM is not something that happens overnight. While there are a number of software
solutions that will help organizations quickly start to implement a quality management system,
there are some underlying philosophies that the company must integrate throughout every
department of the company and at every level of management. Whatever other resources you
use, you should adopt these seven important principles of Total Quality Management as a
foundation for all your activities.
1. Quality can and must be managed
Many companies have wallowed in a repetitive cycle of chaos and customer complaints. They
believe that their operations are simply too large to effectively manage the level of quality. The
first step in the TQM process, then, is to realize there is a problem and that it can be controlled.
2. Processes, not people, are the problem
If your process is causing problems, it won‘t matter how many times you hire new employees or
how many TQM Programmes sessions you put them through. Correct the process and then train
your people on these new procedures.
3. Don’t treat symptoms, look for the cure
If you just patch over the underlying problems in the process, you will never be able to fully
reach your potential. If, for example, your shipping department is falling behind, you may find
that it is because of holdups in manufacturing. Go for the source to correct the problem.
4. Every employee is responsible for quality
Everyone in the company, from the workers on the line to the upper management, must realize
that they have an important part to play in ensuring high levels of quality in their products and
services. Everyone has a customer to delight, and they must all step up and take responsibility for
them.

ISSN 2449 -9253 DMIETR Journal on Management Outlook
98
5. Quality must be measurable
A quality management system is only effective when you can quantify the results. You need to
see how the process is implemented and if it is having the desired effect. This will help you set
your goals for the future and ensure that every department is working toward the same result.
6. Quality improvements must be continuous
Total Quality Management is not something that can be done once and then forgotten. It‘s not a
management ―phase‖ that will end after a problem has been corrected. Real improvements must
occur frequently and continually in order to increase customer satisfaction and loyalty.
7. Quality is a long-term investment
Quality management is not a quick fix. You can purchase QMS software that will help you get
things started, but you should understand that real results won‘t occur immediately. TQM is a
long-term investment, and it is designed to help you find long-term success.
Before you start looking for any kind of quality management software, it is important to make
sure you are capable of implementing these fundamental principles throughout the company.
This kind of management style can be a huge culture change in some companies, and sometimes
the shift can come with some growing pains, but if you build on a foundation of quality
principles, you will be equipped to make this change and start working toward real long-term
success.
Steps to Creating a Total Quality Management System:
1. Clarify Vision, Mission and Values
Develop TQM Programmes and communication process to ensure all staff are aware of Vision,
Mission and Values.
2. Identify Critical Success Factors (CSF)
Some possible CSF:

ISSN 2449 -9253 DMIETR Journal on Management Outlook
99
Financial Performance
Customer Satisfaction
Process Improvement
Market Share
3. Develop Measures and Metrics to Track CSF Data
4. Identify Key Customer Groups
Customers
Employees
Suppliers
Vendors
Volunteers
5. Solicit Feedback
Solicit feedback from each customer group in an effort to identify what is important to them.
Organizations often make the mistake of thinking they know what is important to customers
and ask the wrong survey questions. This feedback is obtained through customer focus groups.
6. Develop Survey Tool
Develop survey tool based on feedback of what is important to customers.
7. Survey Each Customer Group
Survey each customer group to get baseline data on customers’ perception of current practice.
8. Develop Improvement Plan
Develop improvement plan based on customer feedback for each group. Improvement plan
includes SMART goals with assignments to specific staff for follow through.
9. Goals May Include Some of the Following:

ISSN 2449 -9253 DMIETR Journal on Management Outlook
100
Process improvement initiatives, such as: Hold times when calling
Leadership Development: Walk-the-Talk
Management TQM Programmes/Development: How to manage employees in a quality
environment
Staff TQM Programmes/Development: Customer Service
Performance Management: Setting expectations, creating job descriptions that support the
vision and holding staff accountable.
10. Resurvey
After a period of time (12-18 months), resurvey key customers to see if scores have improved.
Customer needs and expectations change over time so being in-tune to changing needs and
expectations is critical to long-term success.
11. Monitor CSF
Monitor CSF monthly to ensure progress toward goals.
12. Incorporate Satisfaction Data into Marketing Plans
Once you’ve achieved some positive results with your satisfaction data, use it as a marketing tool!
The Benefits of TQM
1)TQM looks at the organization as a ―system‖ and incorporates improvement efforts to enhance
the organizational structure so customer (both internal and external) needs are met and
streamlined for cost effective and service oriented approaches.
2)Some specific TQM benefits are customer loyalty, cost savings, higher productivity, higher
profitability, improved processes, improved employee morale and positive work environment.
3)From personal experience, I‘ve incorporated TQM in the service industry. And as in most
leadership/management models, if you focus on the customer‘s needs and wants, provide your
employees with the tools to meet those needs and reward them for doing a good job, you have a
very solid model for supporting a loyal customer base.

ISSN 2449 -9253 DMIETR Journal on Management Outlook
101
Reliability engineering:
Reliability engineering is an engineering field, that deals with the study, evaluation, and life-
cycle management of reliability: the ability of a system or component to perform its required
functions under stated conditions for a specified period of time. It is often measured as a
probability of failure or a measure of availability. However, maintainability is also an important
part of reliability engineering.
Reliability engineering for complex systems requires a different, more elaborated systems
approach than reliability for non-complex systems / items. Reliability engineering is closely
related to system safety engineering in the sense that they both use common sorts of methods for
their analysis and might require input from each other. Reliability analysis have important links
with function analysis, requirements specification, systems design, hardware design, software
design, manufacturing, testing, maintenance, transport, storage, spare parts, operations research,
human factors, technical documentation, TQM Programmes and more.
Most industries do not have specialized reliability engineers and the engineering task often
becomes part of the tasks of a design engineer, logistics engineer, systems engineer or quality
engineer. Reliability engineers should have broad skills and knowledge.
Meaning: Reliability has to do with the quality of measurement. In its everyday sense, reliability
is the "consistency" or "repeatability" of your measures. Before we can define reliability
precisely we have to lay the groundwork. First, you have to learn about the foundation of
reliability, the true score theory of measurement. Along with that, you need to understand the
different types of measurement error because errors in measures play a key role in degrading
reliability. With this foundation, you can consider the basic theory of reliability, including a
precise definition of reliability. There you will find out that we cannot calculate reliability -- we
can only estimate it. Because of this, there a variety of different types of reliability that each have
multiple ways to estimate reliability for that type. In the end, it's important to integrate the idea
of reliability with the other major criteria for the quality of measurement -- validity -- and
develop an understanding of the relationships between reliability and validity in measurement.
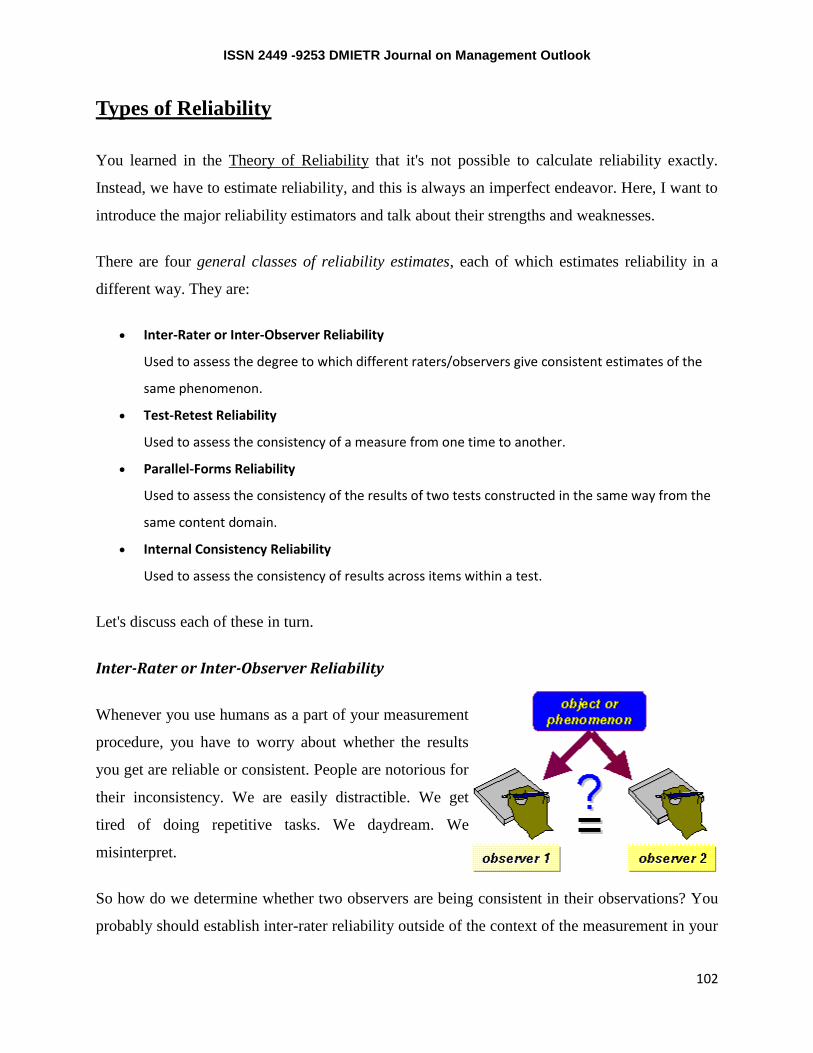
ISSN 2449 -9253 DMIETR Journal on Management Outlook
102
Types of Reliability
You learned in the Theory of Reliability that it's not possible to calculate reliability exactly.
Instead, we have to estimate reliability, and this is always an imperfect endeavor. Here, I want to
introduce the major reliability estimators and talk about their strengths and weaknesses.
There are four general classes of reliability estimates, each of which estimates reliability in a
different way. They are:
Inter-Rater or Inter-Observer Reliability
Used to assess the degree to which different raters/observers give consistent estimates of the
same phenomenon.
Test-Retest Reliability
Used to assess the consistency of a measure from one time to another.
Parallel-Forms Reliability
Used to assess the consistency of the results of two tests constructed in the same way from the
same content domain.
Internal Consistency Reliability
Used to assess the consistency of results across items within a test.
Let's discuss each of these in turn.
Inter-Rater or Inter-Observer Reliability
Whenever you use humans as a part of your measurement
procedure, you have to worry about whether the results
you get are reliable or consistent. People are notorious for
their inconsistency. We are easily distractible. We get
tired of doing repetitive tasks. We daydream. We
misinterpret.
So how do we determine whether two observers are being consistent in their observations? You
probably should establish inter-rater reliability outside of the context of the measurement in your

ISSN 2449 -9253 DMIETR Journal on Management Outlook
103
study. After all, if you use data from your study to establish reliability, and you find that
reliability is low, you're kind of stuck. Probably it's best to do this as a side study or pilot study.
And, if your study goes on for a long time, you may want to reestablish inter-rater reliability
from time to time to assure that your raters aren't changing.
There are two major ways to actually estimate inter-rater reliability. If your measurement
consists of categories -- the raters are checking off which category each observation falls in --
you can calculate the percent of agreement between the raters. For instance, let's say you had 100
observations that were being rated by two raters. For each observation, the rater could check one
of three categories. Imagine that on 86 of the 100 observations the raters checked the same
category. In this case, the percent of agreement would be 86%. OK, it's a crude measure, but it
does give an idea of how much agreement exists, and it works no matter how many categories
are used for each observation.
The other major way to estimate inter-rater reliability is appropriate when the measure is a
continuous one. There, all you need to do is calculate the correlation between the ratings of the
two observers. For instance, they might be rating the overall level of activity in a classroom on a
1-to-7 scale. You could have them give their rating at regular time intervals (e.g., every 30
seconds). The correlation between these ratings would give you an estimate of the reliability or
consistency between the raters.
You might think of this type of reliability as "calibrating" the observers. There are other things
you could do to encourage reliability between observers, even if you don't estimate it. For
instance, I used to work in a psychiatric unit where every morning a nurse had to do a ten-item
rating of each patient on the unit. Of course, we couldn't count on the same nurse being present
every day, so we had to find a way to assure that any of the nurses would give comparable
ratings. The way we did it was to hold weekly "calibration" meetings where we would have all of
the nurses ratings for several patients and discuss why they chose the specific values they did. If
there were disagreements, the nurses would discuss them and attempt to come up with rules for
deciding when they would give a "3" or a "4" for a rating on a specific item. Although this was
not an estimate of reliability, it probably went a long way toward improving the reliability
between raters.

ISSN 2449 -9253 DMIETR Journal on Management Outlook
104
Test-Retest Reliability
We estimate test-retest reliability when we administer the same test to the same sample on two
different occasions. This approach assumes that there is no substantial change in the construct
being measured between the two occasions. The amount of time allowed between measures is
critical. We know that if we measure the same thing twice that the correlation between the two
observations will depend in part by how much time elapses between the two measurement
occasions. The shorter the time gap, the higher the correlation; the longer the time gap, the lower
the correlation. This is because the two observations are related over time -- the closer in time we
get the more similar the factors that contribute to error. Since this correlation is the test-retest
estimate of reliability, you can obtain considerably different estimates depending on the interval.
Parallel-Forms Reliability
In parallel forms reliability you first have to create two parallel forms. One way to accomplish
this is to create a large set of questions that address the same construct and then randomly divide
the questions into two sets. You administer both instruments to the same sample of people. The
correlation between the two parallel forms is the estimate of reliability. One major problem with
this approach is that you have to be able to generate lots of items that reflect the same construct.
This is often no easy feat. Furthermore, this approach makes the assumption that the randomly
divided halves are parallel or equivalent. Even by chance this will sometimes not be the case.
The parallel forms approach is very similar to the split-half reliability described below. The
major difference is that parallel forms are constructed so that the two forms can be used
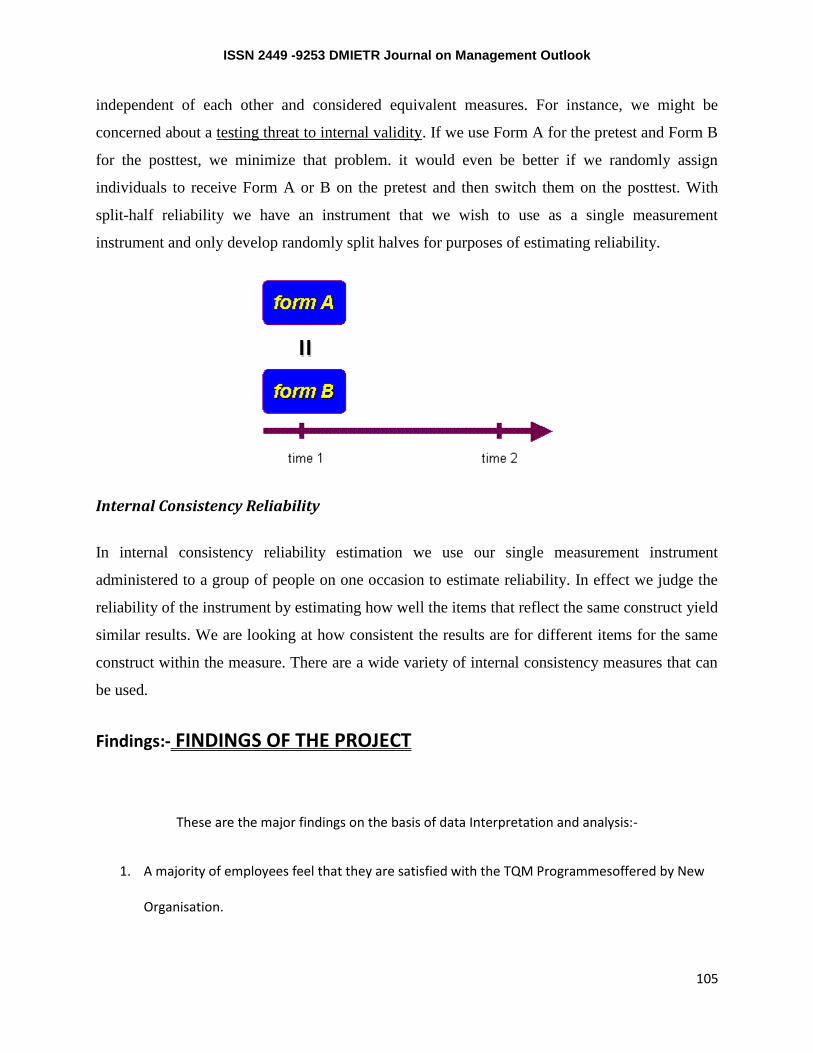
ISSN 2449 -9253 DMIETR Journal on Management Outlook
105
independent of each other and considered equivalent measures. For instance, we might be
concerned about a testing threat to internal validity. If we use Form A for the pretest and Form B
for the posttest, we minimize that problem. it would even be better if we randomly assign
individuals to receive Form A or B on the pretest and then switch them on the posttest. With
split-half reliability we have an instrument that we wish to use as a single measurement
instrument and only develop randomly split halves for purposes of estimating reliability.
Internal Consistency Reliability
In internal consistency reliability estimation we use our single measurement instrument
administered to a group of people on one occasion to estimate reliability. In effect we judge the
reliability of the instrument by estimating how well the items that reflect the same construct yield
similar results. We are looking at how consistent the results are for different items for the same
construct within the measure. There are a wide variety of internal consistency measures that can
be used.
Findings:- FINDINGS OF THE PROJECT
These are the major findings on the basis of data Interpretation and analysis:-
1. A majority of employees feel that they are satisfied with the TQM Programmesoffered by New
Organisation.
ISSN 2449 -9253 DMIETR Journal on Management Outlook
106
2. Respondents said that Individual Assessment and requirements are their TQM Programmes
need identified by the company.
3. Most of the employees are satisfied with the adequate duration of the TQM Programmes
program.
4. Most of the employees satisfied with the TQM Programmes schedule of New Organisation.
5. Most of the employees are satisfied with the infrastructure facilities.
6. Most of the respondents in the company believe in on- the- job TQM Programmes as well as off-
the- job TQM Programmes.
7. In case of on –the –job TQM Programmes coaching is the best option.
8. Conference or discussion method is mostly prefer in case of off –the –job TQM Programmes.
9. of emplyees are moderately satisfied with the TQM Programmes methods followed by the
company.
10. TQM Programmes is beneficial to both organization as well as emplyees.
11. Most of the employees satisfied with TQM Programmes instructions of the trainer.
12. Most of the employees receive the feed back after TQM Programmes period.
13. Looking towards the past year production performance, company achieved higher
production level. This is result of continuous striving effort towards goal of one million
hr per annum with focus on state of art technology.
SUGGESTIONS & RECCOMENDATION
1. TQM Programmes programs should be made more innovative and interesting to make
Attractive to the workers.
2. TQM Programmes modules should be carefully designed to make more objects oriented.
3. TQM Programmes should be provided with example.

ISSN 2449 -9253 DMIETR Journal on Management Outlook
107
4. Required more TQM Programmes programs enhanced trainee performance at work
place.Conduct the TQM Programmes programs frequently.
5. Organization should increase TQM Programmes programs towards technical areas for more
technical people.
6. Take the feedback from the trainees and it must be implementing for next TQM Programmes
program.
7. TQM Programmes is required to particular and much more related to shop floor difficulties or
provide on -the-Job TQM Programmes.
REFERENCES/BIBLIOGRAPHY
1. Books:
1) Operations Management Theory and Practice, B. Mahadevan, Pearson education, Second
impression 2007
Publication-(Himalaya Publication House)
2) Production & Operations Management – Chary Text and cases; page no.(238-266) Publication-(McGraw-Hill Publishing colt)
C. R. Kothari ,( 2nd Revised Edition ) “Research Methodology, Methods & Techniques”;
Page No.10-19, Publication- (New Age International Publishers)
Production & Operations Management—S. ANIL KUMAR & SURESH,New age international
publication
TQM Programmes Polices adopted by
–New Organisation,

ISSN 2449 -9253 DMIETR Journal on Management Outlook
108
2. Websites:
www.google.com
http://www.lundustrialgroup.com/coldrolling.html
http://www.isoorgg.com/
http://www.Qualitymanual.com/steelmeltshop.html