Volt/VAR Control and Optimization Concepts and...
58
Volt/VAR Control and Optimization Concepts and Issues Bob Uluski, EPRI Technical Executive
Transcript of Volt/VAR Control and Optimization Concepts and...

Volt/VAR Controland Optimization Concepts and Issuesand Issues
Bob Uluski, EPRI
Technical Executive

•Basic concepts of Volt-VAR
Control and Optimization
2© 2011 Electric Power Research Institute, Inc. All rights reserved.
•How these technologies
should be assessed (“Proof of
Concept”)

What is Volt-VAR control?
• Volt-VAR control (VVC) is a fundamental operating requirement of all
electric distribution systems
• The prime purpose of VVC is to maintain acceptable voltage at all points
along the distribution feeder under all loading conditions
3© 2011 Electric Power Research Institute, Inc. All rights reserved.

Volt-VAR Control in a Smart Grid World
• Expanded objectives for Volt-VAR control include
– Basic requirement – maintain acceptable voltage
– Support major “Smart Grid” objectives:• Improve efficiency (reduce technical losses) through voltage
optimization
• Reduce electrical demand and/or Accomplish energy conservation through voltage reduction
4© 2011 Electric Power Research Institute, Inc. All rights reserved.
conservation through voltage reduction
• Promote a “self healing” grid (VVC plays a role in maintaining voltage after “self healing” has occurred)
• Enable widespread deployment of Distributed generation, Renewables, Energy storage, and other distributed energy resources (dynamic volt-VAR control)

Concept of Conservation Voltage Reduction
• ANSI standards have some
flexibility in the allowable
delivery voltage
• Distribution utilities
typically have delivery
voltage in upper portion of
the range
5© 2011 Electric Power Research Institute, Inc. All rights reserved.
the range
• Concept of CVR: Maintain
voltage delivered to the
customer in the lower
portion of the acceptable
range
Source: PCS Utilidata

Conservation Voltage Reduction – Why Do It?
•Many electrical devices operate more efficiently (use less power) with reduced voltage
P = V 2 ÷÷÷÷ R
6© 2011 Electric Power Research Institute, Inc. All rights reserved.
P = V 2 ÷÷÷÷ R
“Constant Impedance” Load
“Evaluation of Conservation Voltage
Reduction (CVR) on a National
Level”; PNNL; July 2010

Impact of Voltage Reduction on Electric motors
Conservation Voltage Reduction
Efficiency improve for small voltage
reduction
Incremental change in efficiency drops off and then turns
negative as voltage
Efficiency Current2
7© 2011 Electric Power Research Institute, Inc. All rights reserved.
negative as voltage is reduced
Negative effect occurs sooner for
heavily loaded motors
Voltage Voltage

Conservation Voltage Reduction – Why Do It?
•Some newer devices have exhibit “constant power” behavior to some extent
8© 2011 Electric Power Research Institute, Inc. All rights reserved.

Recent results
• Despite trend to constant power, reported results are still pretty favorable
9© 2011 Electric Power Research Institute, Inc. All rights reserved.

CVR Also Impacts Reactive Power
10© 2011 Electric Power Research Institute, Inc. All rights reserved.
Effect of CVR on kVAR is more significant than on kW
kW CVRf ≈ 0.7
kVAR CVRf ≈ 3.0

Summary of Voltage Optimization Benefits
• Voltage optimization is a very effective energy efficiency measure
– Demand Reduction - 1.5% to 2.1%; Energy Reduction - 1.3% - 2%
– “Painless” efficiency measure for utilities and customers
– Cost effective – Leverage existing equipment
11© 2011 Electric Power Research Institute, Inc. All rights reserved.
– Cost effective – Leverage existing equipment
– Short implementation schedule
• Reduce number of tap changer operations
• Improved voltage profile
• Early detection of:
– Voltage quality problems
– Voltage regulator problems
EPRI PQ/Smart Distribution Conference & Expo June 2010

Approaches to Volt VAR Control
• Standalone Voltage regulator and LTC controls with line drop compensation set to “end-of-line” voltage for CVR
• On-Site Voltage Regulator (OVR) for single location voltage regulation
12© 2011 Electric Power Research Institute, Inc. All rights reserved.
• “Rule-based” DA control of capacitor banks and voltage regulators for CVR with/without voltage measurement feedback from end of line
• “Heuristic” voltage regulation (e.g. PCS Utilidata“AdaptiVolt”, Cooper Power Systems IVVC)
• “Distribution model based” Volt-VAR Optimization

Standalone Controller Approach
•VV Control managed by individual, independent, standalone volt-VAR regulating devices:
– Substation transformer load tap changers (LTCs) with voltage regulators
– Line voltage regulators
– Fixed and switched capacitor banks
Current/Voltage Current/Voltage
13© 2011 Electric Power Research Institute, Inc. All rights reserved.
Voltage
Sensor
Capacitor
Bank
Standalone
Controller
Distribution Primary Line
"Local" Current/
Voltage
Measurements On/Off Control
Command
Signal
Voltage
Sensor
Voltage
Regulator
Standalone
Controller
"Local" Current/
Voltage
Measurements On/Off Control
Command
Signal

Reactive Power Compensation Using
Fixed and Switched Capacitor Banks
•Switch single capacitor bank
on or off based on “local”
conditions (voltage, load,
reactive power, etc.)
•Control parameters
– Power Factor
14© 2011 Electric Power Research Institute, Inc. All rights reserved.
– Power Factor
– Load Current
– Voltage
– Var Flow
– Temperature
– Time of day and day of week
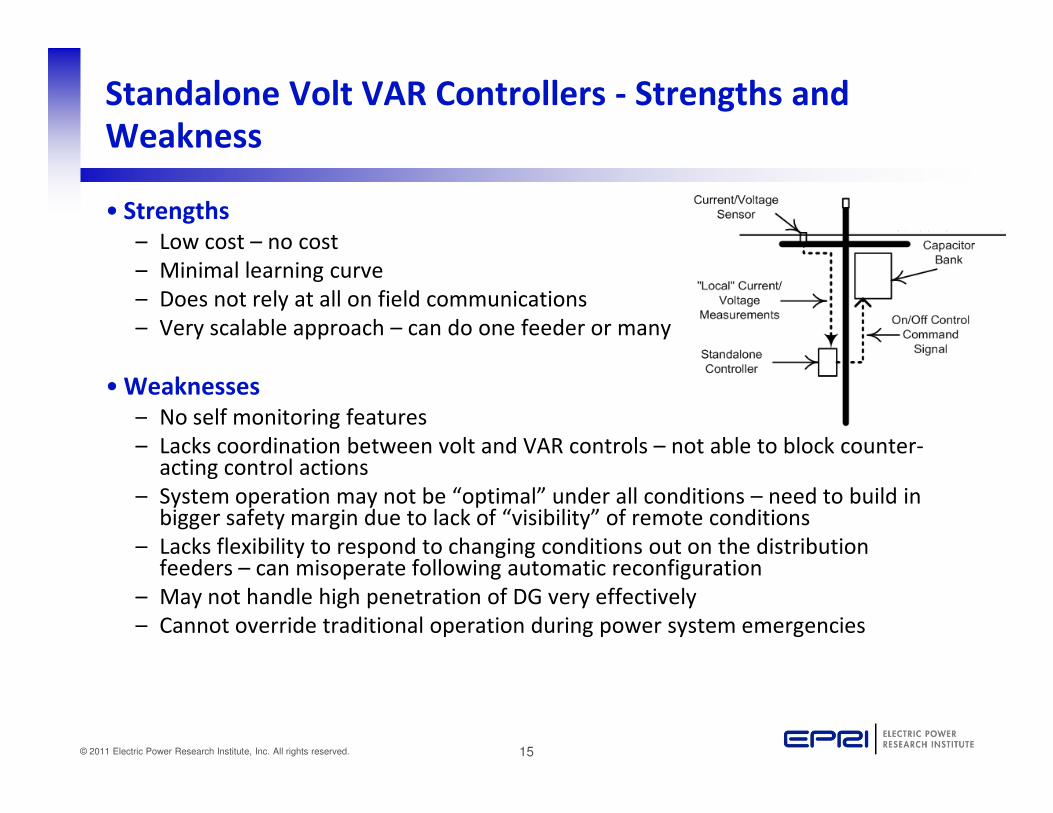
Standalone Volt VAR Controllers - Strengths and
Weakness
• Strengths– Low cost – no cost
– Minimal learning curve
– Does not rely at all on field communications
– Very scalable approach – can do one feeder or many
• Weaknesses– No self monitoring features
15© 2011 Electric Power Research Institute, Inc. All rights reserved.
– No self monitoring features
– Lacks coordination between volt and VAR controls – not able to block counter-acting control actions
– System operation may not be “optimal” under all conditions – need to build in bigger safety margin due to lack of “visibility” of remote conditions
– Lacks flexibility to respond to changing conditions out on the distribution feeders – can misoperate following automatic reconfiguration
– May not handle high penetration of DG very effectively
– Cannot override traditional operation during power system emergencies

“SCADA” Controlled Volt-VAR
•Volt-VAR power apparatus monitored and controlled by
Supervisory Control and Data Acquisition (SCADA)
•Volt-VAR Control typically handled by two separate
(independent) systems:
– VAR Dispatch – controls capacitor banks to improve power factor,
reduce electrical losses, etc
16© 2011 Electric Power Research Institute, Inc. All rights reserved.
reduce electrical losses, etc
– Voltage Control – controls LTCs and/or voltage regulators to reduce
demand and/or energy consumption (aka, Conservation Voltage
Reduction)
•Operation of these systems is primarily based on a stored set
of predetermined rules (e.g., “if power factor is less than 0.95,
then switch capacitor bank #1 off”)

SCADA (Rule Based) Volt-VAR Control
System Components
• Substation Remote Terminal Unit (RTU) – handles device monitoring and control
• VVO/CVR processor – contains “rules” for volt and VAR control
• Switched Cap banks & local measurement facilities
• Voltage regulators (LTCs) & local measurement facilities
• Communication facilities
• End of line voltage feedback (optional)
VVO/CVR
17© 2011 Electric Power Research Institute, Inc. All rights reserved.
VVO/CVR
Processor
RTU
End of Line Voltage
Feedback

SCADA (Rule Based) Volt-VAR Control
Part 1: VAR Control (Power Factor Correction)
VVO/CVR
Processor
Voltage Profile
120
122
124
18© 2011 Electric Power Research Institute, Inc. All rights reserved.
Processor
RTU
P = 3846 kW
Q = 1318 kVAR
PF = .946
Losses = 96 kW
116
118
0 0.25 0.5 0.75 1

SCADA (Rule Based) Volt-VAR Control
Part 1: VAR Control (Power Factor Correction)
VVO/CVR
Processor
Sample Rules:
1. Identify “candidate” cap banks for switching
• Cap bank “i” is currently “off”
• Rating of cap bank “i” is less than
measured reactive power flow at head end
of the feeder
19© 2011 Electric Power Research Institute, Inc. All rights reserved.
Processor
RTU
P = 3846 kW
Q = 1318 kVAR
PF = .946
Losses = 96 kW
2. Choose the “candidate” cap bank that has the
lowest measured local voltage
3. Switch the chosen cap bank to the “ON” position
1 2 N

SCADA (Rule Based) Volt-VAR Control
Part 1: VAR Control (Power Factor Correction)
VVO/CVR
Processor
Voltage Profile
120
122
124
20© 2011 Electric Power Research Institute, Inc. All rights reserved.
Processor
RTU
P = 3846 kW
Q = 1318 kVAR
PF = .946
Losses = 96 kW
Chosen
cap bank
116
118
0 0.25 0.5 0.75 1

SCADA (Rule Based) Volt-VAR Control
Part 1: VAR Control (Power Factor Correction)
VVO/CVR
Processor
Voltage Profile
120
122
124
21© 2011 Electric Power Research Institute, Inc. All rights reserved.
Processor
RTU
P = 3880 kW
Q = 920 kVAR
PF = .973
Losses = 91 kW
Chosen
cap bank
116
118
0 0.25 0.5 0.75 1

SCADA (Rule Based) Volt-VAR Control
Part 1: VAR Control (Power Factor Correction)
VVO/CVR
Processor
Voltage Profile
120
122
124
22© 2011 Electric Power Research Institute, Inc. All rights reserved.
Processor
RTU
P = 3920 kW
Q = 687 kVAR
PF = .985
Losses = 89 kW
116
118
0 0.25 0.5 0.75 1

SCADA (Rule Based) Volt-VAR Control
Part 1: VAR Control (Power Factor Correction)
VVO/CVR
Processor
Voltage Profile
120
122
124
23© 2011 Electric Power Research Institute, Inc. All rights reserved.
Processor
RTU
P = 3940 kW
Q = 532 kVAR
PF = .991
Losses = 88 kW
116
118
0 0.25 0.5 0.75 1

SCADA (Rule Based) Volt-VAR Control
Part 1: VAR Control (Power Factor Correction)
VVO/CVR
Processor
Voltage Profile Before and After
120
122
124
24© 2011 Electric Power Research Institute, Inc. All rights reserved.
Processor
RTU
P = 3940 kW
Q = 532 kVAR
PF = .991
Losses = 88 kW
116
118
0 0.25 0.5 0.75 1

SCADA (Rule Based) Volt-VAR Control
Part 2: Voltage Control (CVR)
VVO/CVR
Processor
Sample rule for voltage reduction:
1. If voltage at head end of
the feeder exceeds LTC
setpoint, then lower the
voltage
25© 2011 Electric Power Research Institute, Inc. All rights reserved.
Processor
RTU

SCADA (Rule Based) Volt-VAR Control
Part 2: Voltage Control (CVR)
VVO/CVR
Processor
Voltage Profile
120
122
124
26© 2011 Electric Power Research Institute, Inc. All rights reserved.
Processor
RTU 116
118
0 0.25 0.5 0.75 1

SCADA (Rule Based) Volt-VAR Control
Part 2: Voltage Control (CVR)
VVO/CVR
Processor
Voltage Profile
120
122
124
27© 2011 Electric Power Research Institute, Inc. All rights reserved.
Processor
RTU
P = 3898 kW
Q = 508 kVAR
PF = .992
Losses = 88 kW
116
118
0 0.25 0.5 0.75 1

SCADA (Rule Based) Volt-VAR Control
Part 2: Voltage Control (CVR)
VVO/CVR
Processor
Voltage Profile
120
122
124
28© 2011 Electric Power Research Institute, Inc. All rights reserved.
Processor
RTU
End of Line Voltage
Feedback
P = 3805 kW
Q = 508 kVAR
PF = .991
Losses = 88 kW
116
118
0 0.25 0.5 0.75 1

SCADA (Rule Based) Volt-VAR Control
Part 2: Voltage Control (CVR)
VVO/CVR
Processor
Voltage Profile
120
122
124
29© 2011 Electric Power Research Institute, Inc. All rights reserved.
Processor
RTU
End of Line Voltage
Feedback
P = 3778 kW
Q = 492 kVAR
PF = .992
Losses = 88 kW
116
118
0 0.25 0.5 0.75 1

SCADA (Rule Based) Volt-VAR Control
Part 2: Voltage Control (CVR)
VVO/CVR
Processor
Voltage Profile Before and After
120
122
124
30© 2011 Electric Power Research Institute, Inc. All rights reserved.
Processor
RTU
End of Line Voltage
Feedback
P = -41 kW (1.05%)
Q = -809 kVAR (61%)
PF = +.045
Losses = -8%Changes:
116
118
0 0.25 0.5 0.75 1

SCADA Controlled Volt VAR Summary
•Strengths:– Usually some efficiency improvement versus standalone controllers
– Self monitoring
– Can override operation during system emergencies
– Can include remote measurements in the “rules” – smaller margin of safety needed
•Weaknesses:
31© 2011 Electric Power Research Institute, Inc. All rights reserved.
•Weaknesses:– Somewhat less scalable that standalone controllers (minimum deployment is
one substation)
– More complicated – requires extensive communication facilities
– Does not adapt to changing feeder configuration (rules are fixed in advance)
– Does not adapt well to varying operating needs (rules are fixed in advance)
– Overall efficiency is improved versus traditional approach, but is not necessarily optimal under all conditions
– Operation of VAR and Volt devices usually not coordinated (separate rules for cap banks & Vregs)
– Does not adapt well to presence of high DG penetration

Distribution Model Driven Volt-VAR Control
and Optimization
• Develops and executes a coordinated “optimal” switching plan for all voltage control devices to achieve utility-specified objective functions:
– Minimize energy consumption
– Minimize losses
32© 2011 Electric Power Research Institute, Inc. All rights reserved.
– Minimize losses
– Minimize power demand
– Combination of the above
• Can bias the results to minimizetap changer movement and otherequipment control actions that putadditional “wear and tear” on thephysical equipment

DMS Volt-VAR Optimization
33© 2011 Electric Power Research Institute, Inc. All rights reserved.

Volt VAR Optimization (VVO) System OperationSwitch
Status
Voltage Feedback, Accurate load data
Bank voltage & status, switch control
IVVC requires real-
34© 2011 Electric Power Research Institute, Inc. All rights reserved.
Bank voltage & status, switch control
Monitor & control tap position, measure load
voltage and loadMonitor & control tap position, measure load
voltage and load
IVVC requires real-time monitoring & control of sub & feeder devices

Volt VAR Optimization (VVO) System Operation
Permanent asset changes
Cuts, jumpers, manual switching
Real-Time Updates
35© 2011 Electric Power Research Institute, Inc. All rights reserved.
Permanent asset changes (line extension, reconductor)
IVVC requires an accurate, up-to date
electrical model

Volt VAR Optimization (VVO) System Operation
OLPF calculates losses, voltage
36© 2011 Electric Power Research Institute, Inc. All rights reserved.
losses, voltage profile, etc
Powerflow
Results
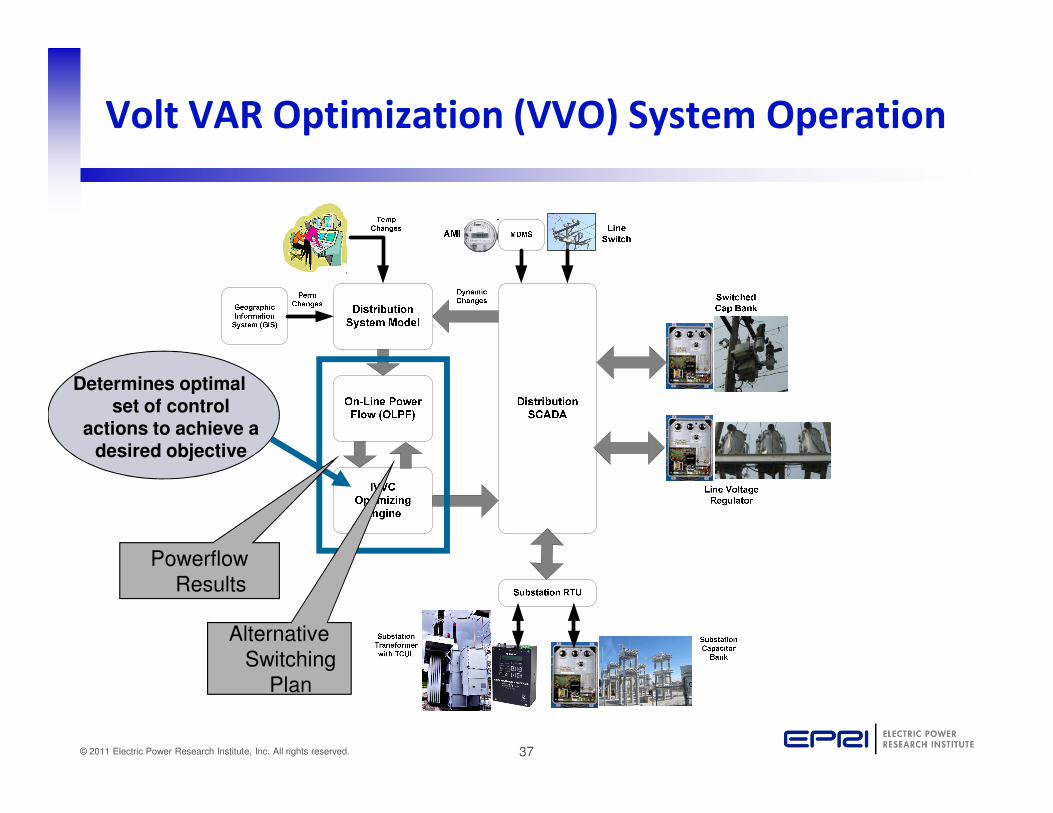
Volt VAR Optimization (VVO) System Operation
Determines optimal set of control
37© 2011 Electric Power Research Institute, Inc. All rights reserved.
Powerflow
Results
Alternative
Switching
Plan
set of control actions to achieve a
desired objective

Volt VAR Optimization (VVO) System Operation
Determines optimal set of control
38© 2011 Electric Power Research Institute, Inc. All rights reserved.
Optimal
Switching
Plan
set of control actions to achieve a
desired objective

DMS-Based Volt VAR Optimization
Strengths and Weaknesses• Strengths
– Fully coordinated, optimal solution
– Flexible operating objectives - Accommodates varying operating objectives depending on present need
– Able to handle complex feeder arrangements - Dynamic model updates automatically when reconfiguration occurs
– Works correctly following feeder reconfiguration
– System can model the effects of Distributed Generation and other
39© 2011 Electric Power Research Institute, Inc. All rights reserved.
– System can model the effects of Distributed Generation and other modern grid elements - Handles high penetration of DER properly, including proper handling of reverse power flows
• Weaknesses
– Not very scalable – would not use this approach for one feeder or substation due to high control center
– High cost to implement, operate and sustain
– Learning curve for control room personnel
– Lack of field proven products

Auto-Adaptive Volt VAR Optimization
• processes real-time distribution system information to determine appropriate volt-VAR control actions and provide closed-loop feedback to accomplish electric utility specified objectives
• uses advanced signal processing techniques to determine what control actions are needed
40© 2011 Electric Power Research Institute, Inc. All rights reserved.
Courtesy of PCS Utilidata

Auto-Adaptive Approach
• Strengths
– Does not require models or predetermined rules
– Highly scalable (one substation or many)
• Weaknesses
– (Presenter’s opinion) → How it works is a bit of a
41© 2011 Electric Power Research Institute, Inc. All rights reserved.
– (Presenter’s opinion) → How it works is a bit of a mystery

Proving the Concept
42© 2011 Electric Power Research Institute, Inc. All rights reserved.

Proof of Concept:What is it? and Why Do it?
• What is it?:
– Typically a small-scale CVR demonstration on a few representative substations
• Live operation on real feeders
• Close observation of the results
From EPRI “Green Circuits”
43© 2011 Electric Power Research Institute, Inc. All rights reserved.
• Close observation of the results that are achieved
• Why Do It?
– Not all feeders are created equal
– Will CVR work as well on my distribution system?

Objectives for Proof of Concept
• Primary Objectives:
– Show that CVR produces benefits without customer complaints
– Show that it works before “making the plunge”
44© 2011 Electric Power Research Institute, Inc. All rights reserved.
• Secondary Objectives:
– gain valuable implementation and operating experience
– compare vendor solutions

Measurement and VerificationCVR Impact on Energy
45© 2011 Electric Power Research Institute, Inc. All rights reserved.

Measurement and VerificationCVR Impact on Demand
46© 2011 Electric Power Research Institute, Inc. All rights reserved.
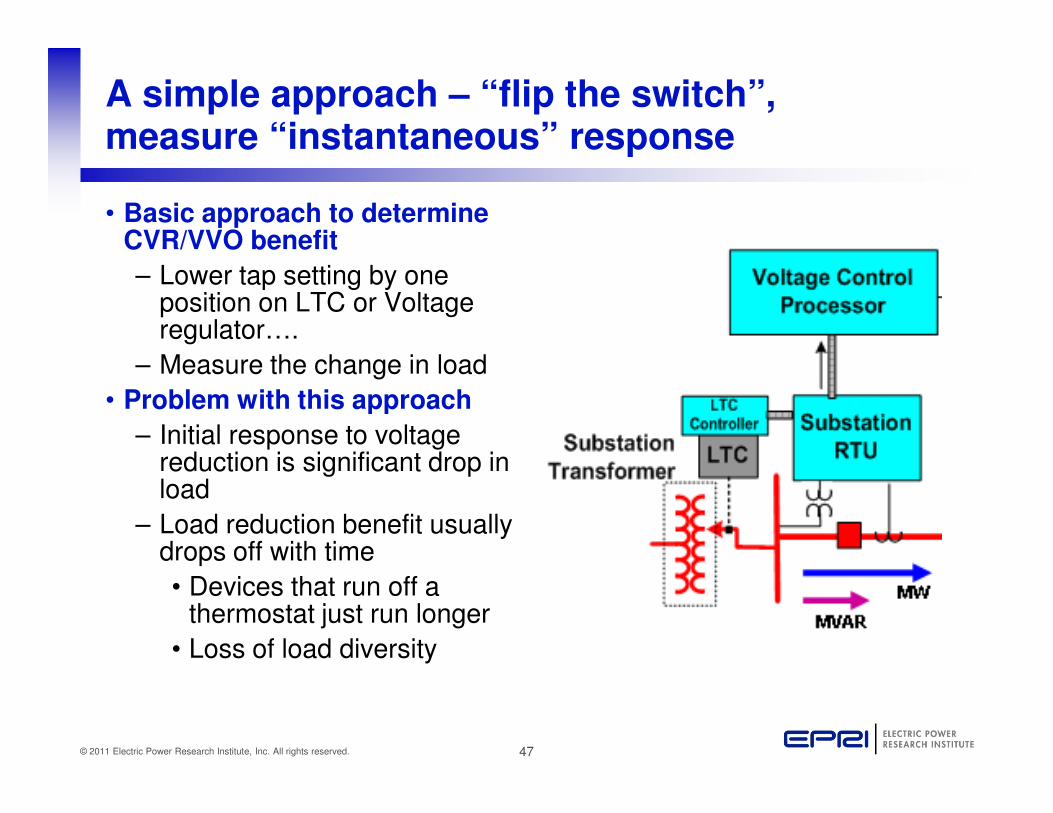
A simple approach – “flip the switch”,measure “instantaneous” response
• Basic approach to determine CVR/VVO benefit
– Lower tap setting by one position on LTC or Voltage regulator….
– Measure the change in load
• Problem with this approach
47© 2011 Electric Power Research Institute, Inc. All rights reserved.
• Problem with this approach
– Initial response to voltage reduction is significant drop in load
– Load reduction benefit usually drops off with time
• Devices that run off a thermostat just run longer
• Loss of load diversity

A simple approach – “flip the switch”,measure “instantaneous” response
• Basic approach to determine CVR/VVO benefit
– Lower tap setting by one position on LTC or Voltage regulator
– Measure the change in load
• Problem with this approach
48© 2011 Electric Power Research Institute, Inc. All rights reserved.
• Problem with this approach
– Initial response to voltage reduction is significant drop in load
– Load reduction benefit usually drops off with time
• Devices that run off a thermostat just run longer
• Loss of load diversity

A simple approach – measure instantaneous response (CVR response drops off with time)
100000
120000
140000
kW
0.00
1.00
2.00
Lo
ad
to
V D
ep
en
den
cy
Instantaneous CVR Factor
Initial CVR Factor = 1.6
Stable CVR Factor = 0.7
49© 2011 Electric Power Research Institute, Inc. All rights reserved.
40000
60000
80000
14:15:00
11/6/1997
18:15:00
11/6/1997
22:15:00
11/6/1997
2:15:00
11/7/1997
6:15:00
11/7/1997
10:15:00
11/7/1997
Time
kW
-3.00
-2.00
-1.00
Lo
ad
to
V D
ep
en
den
cy
GTP kW, OVVC On GTP Adjusted kW
%delta kW/%delta Bus V Cumul. Avg. %dkW/%dV
Avg. Red'n:
2405 kW
2.43%
Avg. Red'n:
1911 kW
2.09%

Determining the benefits over time
• To overcome this issue, should observe CVR/VVO operation over time
• Benefit is difference between electrical conditions when CVR/VVO is running minus electrical conditions if CVR/VVO was not running
• For example:
50© 2011 Electric Power Research Institute, Inc. All rights reserved.
• For example:
– Reduction in energy consumption = energy consumedwhen running CVR/VVO – energy that would have been consumed if CVR/VVO was not running
• Trick is determining what would have happened if CVR/VVO was not running!

S&C/Current Group approach to CVR/VVO M&V
• Use Powerflow program to determine what would have happened if CVR/VVO was not running
– Most recent SCADA real/reactive power measurements
– Load allocated from standard load profiles for each customer class
On-LinePower Flow
Prev SCADA
Measurements
Load
Allocation
Model
What “would
Have” happened
51© 2011 Electric Power Research Institute, Inc. All rights reserved.
profiles for each customer class
– Voltage regulators and switched capacitor banks use standard controls
– Compare power flow output with actual measures while running CVR/VVO
Have” happened
Difference
CVR/VVO
What actuallyhappened
SCADA
CVR/VVO
Benefits

CVR/VVO “Time On – Time Off” Demonstrations
• Approach summary:
– Turn CVR/VVO ON for period of time and record results
– Turn CVR/VVO OFF for similar time period and record results
– CVR/VVO Benefit is difference between the two
52© 2011 Electric Power Research Institute, Inc. All rights reserved.
TIME MW MVAR VOLTAGE CVR On/Off
01:30:00 1.5351 -0.6036 123.9707634 Off
01:45:00 1.626 -0.6147 123.9192437 Off
02:00:00 1.7889 -0.6281 123.7390301 Off
02:15:00 1.6447 -0.649 118.846097 On
02:30:00 1.7859 -0.6947 119.0263457 On
02:45:00 1.5786 -0.6539 118.8975816 On
03:00:00 1.8166 -0.7025 118.9490662 On
CVR/VVO
OFF
CVR/VVO
ON

CVR/VVO “Time On – Time Off” Demonstrations
• Issues:
– Easy to see benefits if load is nearly the same for the 2 time periods
Day On- Day Off Results - Consecutive days
MEGAWATTS
Sample from Green Circuits
project
53© 2011 Electric Power Research Institute, Inc. All rights reserved.
1
1.2
1.4
1.6
1.8
2
2.2
2.4
0 10 20 30 40 50 60 70 80 90 100
1/4 Hours (96 1/4 hours - 1 day)
CVR Off
CVR On
project

CVR/VVO “Time On – Time Off” Demonstrations
– If natural load fluctuations occur, results are corrupted:• Load variation due to temperature
• Random (stochastic) customer behavior
• Feeder outages, load transfers
• Weekday/weekend, holidays
– Need to exclude “outlier” data (missing data, bad data) that can distort results
CVR/VVO Day On - Day Off Results Sample from Green Circuits
54© 2011 Electric Power Research Institute, Inc. All rights reserved.
CVR/VVO Day On - Day Off Results
Consecutive Days
0
0.5
1
1.5
2
2.5
1 9 17 25 33 41 49 57 65 73 81 89
Quarter hours
Lo
ad
MW
CVR On
CVR Off
Green Circuits project

Techniques for dealing with fluctuations
• Exclude all missing and obviously bad data
• Exclude all data for weekends and special days (holidays)
• Normalize load to adjust for day to day variations due to:
– Temperature/weather changes
– Random (stochastic) customer behavior
55© 2011 Electric Power Research Institute, Inc. All rights reserved.
– Random (stochastic) customer behavior
• Two strategies
– CVR Protocol Number 1 (developed by David Bell of PCS Utilidata) – used by Northwest Energy Efficiency Alliance (NEEA)
– EPRI “Green Circuits” analysis (developed in cooperation with Dr Bobby Mee of Univ Tenn.)

Techniques for dealing with fluctuations
• Exclude bad/missing dataand data for special days
• Perform statistical analysis to identify and eliminate potential outliers data. (Minimum Covariance Determinant (MCD) Robust Regression )
NEEA
kW = β0 +β1 * hdh + β2 * cdhWhere: hdh = heating-degree hours
cdh = cooling-degree hours
2 methods for determining what load
56© 2011 Electric Power Research Institute, Inc. All rights reserved.
Regression )
• Normalize the load:– NEEA
• Adjust for temperature variations
– EPRI Green Circuits• Adjust based on another
circuit with a similar load composition
• Similar circuit cannot be affected by voltage reduction on CVR fdr
EPRI GREEN CIRCUITS
kW = k1 * kWcomparable + k2 * Vstate
Where: kWcomp = avg power measured at a comparable circuit
Vstate = 1 for normal voltage, 0 for reduced voltage
2 methods for determining what load “would have been” without CVR

Some other points about POC
• Should pick substations that include representative feeder designs and customer mix
• POC time period should be long enough to capture seasonal variations
57© 2011 Electric Power Research Institute, Inc. All rights reserved.
• CVR control system used for POC doesn’t necessarily have to be the final vendor solution

Together…Shaping the Future of Electricity
Robert W. Uluski, PE
58© 2011 Electric Power Research Institute, Inc. All rights reserved.
Robert W. Uluski, PE
215-317-9105