
Voltage Flicker Assessment in Distribution Feeders With Large Wind Farms
97
Voltage Flicker Assessment in Distribution Feeders with Large Wind Farms By Diego Mascarella Master of Engineering Department of Electrical and Computer Engineering McGill University, Montreal, Quebec October 2012 A thesis submitted to McGill University in partial fulfillment of the requirements for the degree of Master of Engineering in Electrical Engineering © Diego Mascarella, 2012
-
Upload
milejoncevski -
Category
Documents
-
view
224 -
download
0
Transcript of Voltage Flicker Assessment in Distribution Feeders With Large Wind Farms
8/9/2019 Voltage Flicker Assessment in Distribution Feeders With Large Wind Farms
http://slidepdf.com/reader/full/voltage-flicker-assessment-in-distribution-feeders-with-large-wind-farms 1/97
Voltage Flicker Assessment
in Distribution Feeders withLarge Wind Farms
By Diego Mascarella
Master of Engineering
Department of Electrical and Computer Engineering
McGill University, Montreal, Quebec
October 2012
A thesis submitted to McGill University in partial fulfillment of the requirements for the degree
of Master of Engineering in Electrical Engineering
© Diego Mascarella, 2012

8/9/2019 Voltage Flicker Assessment in Distribution Feeders With Large Wind Farms
http://slidepdf.com/reader/full/voltage-flicker-assessment-in-distribution-feeders-with-large-wind-farms 2/97

8/9/2019 Voltage Flicker Assessment in Distribution Feeders With Large Wind Farms
http://slidepdf.com/reader/full/voltage-flicker-assessment-in-distribution-feeders-with-large-wind-farms 3/97
i | P a g e
Abstract
In recent years, Doubly Fed Induction Generator (DFIG) wind turbines connected to rural
distribution feeders represents an emerging trend that has experienced growth. Higher
penetration levels of embedded wind generation has interesting benefits (i.e. peak-shaving,
congestion alleviation, reduction of losses, etc.) but raises important issues concerning the
quality of power delivered to utility consumers. This thesis investigates the technical limitations
involved with integrating large DFIG based wind farms into existing distribution feeders with
regard to voltage flicker. This dissertation includes an overview of firstly, the applicable
Electromagnetic Compatibility (EMC) standards related to the measurement and assessment of
flicker emissions produced by distribution-connected wind farms. Secondly, aerodynamic,
turbine and feeder characteristics which influence voltage flicker. Thirdly, the level of modeling
required to conduct a pre-connection flicker study. Based on these three aspects, flicker
emissions produced by a DFIG are quantified and a rule of thumb and a set of guidelines are
presented for the acceptance of a 10 MW to 14 MW distributed wind farm, compliant to the
allocated flicker emission quota. If the rule of thumb does indeed reveal a problem, bothpassive and active flicker mitigation techniques are proposed such that EMC of the power
system is preserved.

8/9/2019 Voltage Flicker Assessment in Distribution Feeders With Large Wind Farms
http://slidepdf.com/reader/full/voltage-flicker-assessment-in-distribution-feeders-with-large-wind-farms 4/97
ii | P a g e
Résumé
Au cours des dernières années, les éoliennes à base de génératrice asynchrone à double
alimentation (DFIG) connectées à des réseaux de distribution rurale représentent une tendance
émergente en croissance. Le niveau de pénétration plus élevé d'énergie éolienne présente des
avantages intéressants (i.e. écrêtement des pointes, la réduction de la congestion, la réduction
des pertes, etc.) mais il soulève d'importantes questions liées à la qualité de l'énergie livrée aux
consommateurs. Cette thèse étudie les limites techniques liées à l'intégration des grands parcs
éoliens dans les réseaux de distribution existants au niveau du scintillement. Cette thèse
comprend, premièrement, une vue d'ensemble des normes applicables sur la compatibilité
électromagnétique concernant la mesure et l'évaluation des émissions produites par des parcs
éoliens connectés à des réseaux de distribution. Deuxièmement, l'aérodynamisme, la turbine et
les caractéristiques du réseau de distribution sont étudiés pour leurs influences sur le
scintillement. Troisièmement, le niveau de la modélisation requis pour mener une étude de
pré-connexion sur le scintillement est évalué. Sur la base de ces trois aspects, les émissions de
scintillements induites par les éoliennes DFIG sont quantifiées. Une méthode empirique et un
ensemble de directives sont présentés pour l'intégration d'un parc éolien de 10 MW à 14 MW
afin d’assurer une conformité au quota alloué pour l’émission de scintillement. Si la méthode
empirique révèle un problème, des techniques passives et actives d'atténuation de
scintillement sont proposées afin que la compatibilité électromagnétique du réseau électrique
soit préservée.

8/9/2019 Voltage Flicker Assessment in Distribution Feeders With Large Wind Farms
http://slidepdf.com/reader/full/voltage-flicker-assessment-in-distribution-feeders-with-large-wind-farms 5/97
iii | P a g e
Acknowledgements
First and foremost, I would like to thank my supervisor, Prof. Géza Joós, for his
continuous guidance and support throughout my engineering master’s degree. Through the
many discussions we had, his insight, knowledge and perspective have helped me develop the
engineering skills required to tackle any challenge.
Furthermore, I acknowledge the assistance provided by Dr. Anthony J. Rodolakis. I also
thank Prof. François Bouffard and Prof. Boon-Teck Ooi who helped me gain ample knowledge of
power engineering fundamentals through our discussions and courses lectured. I extend my
thanks to all my power engineering research colleagues, especially, Moataz Ammar and Ali
Shojaei, who enriched my work through many discussions, suggestions and comments.
I appreciate the financial and technical support of the Hydro-Québec industrial research
fund, Natural Sciences and Engineering Research Council of Canada (NSERC), and McGill
University.
Finally, I would like to dedicate this work to my family, Santo, Anna, Francesco and
Marco Antonio, whose help, support and encouragement have been greatly appreciated during
all my years of study.

8/9/2019 Voltage Flicker Assessment in Distribution Feeders With Large Wind Farms
http://slidepdf.com/reader/full/voltage-flicker-assessment-in-distribution-feeders-with-large-wind-farms 6/97
iv | P a g e
Table of ContentsAbstract .......................................................................................................................................................... i
Résumé ......................................................................................................................................................... ii
Acknowledgements ...................................................................................................................................... iii
List of Figures .............................................................................................................................................. vii
List of Tables ................................................................................................................................................ ix
List of Abbreviations ..................................................................................................................................... x
List of Acronyms ........................................................................................................................................... xi
Chapter 1: Introduction ................................................................................................................................ 1
1.1 Proliferation of wind energy ............................................................................................................... 1
1.2 Wind turbine technologies ................................................................................................................. 2
1.2.1 Overview ...................................................................................................................................... 2
1.2.2 Variable speed configurations ..................................................................................................... 2
1.3 Impact of large distribution-connected wind farms on the power system ........................................ 3
1.4 Description of the light flicker phenomenon ...................................................................................... 4
1.4.1 Voltage fluctuations and flicker ................................................................................................... 4
1.4.2 Physiology of flicker perception ................................................................................................... 5
1.5 Factors influencing flicker ................................................................................................................... 6
1.5.1 Overview ...................................................................................................................................... 6
1.5.2 Wind flow and local characteristics ............................................................................................. 6
1.5.3 Wind turbine topology and wind penetration ............................................................................. 7
1.5.4 Distribution feeder characteristics............................................................................................... 8
1.6 Flicker mitigation .............................................................................................................................. 11
1.7 Problem statement & project description ........................................................................................ 14
1.8 Thesis outline .................................................................................................................................... 15
Chapter 2: Flicker Evaluation, Measurement & Modeling ......................................................................... 16
2.1 Overview ........................................................................................................................................... 16
2.2 Perspective, description, limitations and modeling of the IEC Flickermeter .................................... 16
2.2.1 Perspective and description of the IEC Flickermeter ................................................................. 16
2.2.2 Limitations of the IEC Flickermeter instrument ......................................................................... 17

8/9/2019 Voltage Flicker Assessment in Distribution Feeders With Large Wind Farms
http://slidepdf.com/reader/full/voltage-flicker-assessment-in-distribution-feeders-with-large-wind-farms 7/97
v | P a g e
2.2.3 Modeling and implementation of the IEC Flickermeter instrument ......................................... 17
2.2.4 Compliance testing of the IEC Flickermeter instrument ............................................................ 24
2.3 Flicker measurement guidelines for wind generators ...................................................................... 25
2.4 Summation law of flicker originating from multiple sources............................................................ 262.5 Compatibility, planning and emission levels for flicker .................................................................... 27
Chapter 3: Flicker Oriented Modeling ........................................................................................................ 29
3.1 Overview ........................................................................................................................................... 29
3.2 Wind speed modeling ....................................................................................................................... 29
3.2.1 Description of the equivalent wind speed model ...................................................................... 29
3.2.2 Description of the stochastic component .................................................................................. 30
3.2.3 Implementation of the stochastic component .......................................................................... 31
3.2.4 Description of the deterministic component ............................................................................. 32
3.2.5 Implementation of the deterministic component ..................................................................... 32
3.3 Wind turbine modeling ..................................................................................................................... 35
3.3.1 Overview .................................................................................................................................... 35
3.3.2 Aerodynamic model ................................................................................................................... 35
3.3.3 Mechanical Model...................................................................................................................... 37
3.3.4 Generator Model ....................................................................................................................... 38
3.3.5 Converter model ........................................................................................................................ 39
3.3.6 Associated MPPT controls .......................................................................................................... 40
Chapter 4: Quantification of DFIG Induced Flicker Emissions & Potential Mitigation Techiniques ........... 42
4.1 General methodology and approach ................................................................................................ 42
4.2 Test network topology ...................................................................................................................... 43
4.3 Sensitivity analysis based on factors that influence flicker .............................................................. 44
4.3.1 Influence of wind and aerodynamic effects on flicker emissions .............................................. 44
4.3.2 Influence of grid parameters on flicker emissions ..................................................................... 48
4.5 Flicker mitigation via reactive power control ................................................................................... 51
4.5.1 Overview .................................................................................................................................... 51
4.5.2 Power factor control .................................................................................................................. 51
4.5.3 Improved controller for flicker mitigation ................................................................................. 56
Chapter 5: Flicker Study on a Real Distribution Feeder .............................................................................. 59

8/9/2019 Voltage Flicker Assessment in Distribution Feeders With Large Wind Farms
http://slidepdf.com/reader/full/voltage-flicker-assessment-in-distribution-feeders-with-large-wind-farms 8/97
vi | P a g e
5.1 Overview ........................................................................................................................................... 59
5.2 Description of the distribution feeder under study .......................................................................... 59
5.3 Grid characteristics at potential interconnection points .................................................................. 60
5.4 Decoupling of the distribution feeder using RT-LAB ......................................................................... 615.5 Flicker study using the detailed distribution feeder model .............................................................. 62
5.5.1 Influence of varying levels of distributed wind penetration...................................................... 62
5.5.2 Influence of changing the interconnection point ...................................................................... 63
5.5.3 Flicker profile ............................................................................................................................. 64
5.5.4 Addition of flicker producing loads ............................................................................................ 65
5.5 Flicker mitigation via reactive power control ............................................................................... 67
5.7 Summary ........................................................................................................................................... 68
Chapter 6: Conclusions & Recommendations for Future Work ................................................................. 69
6.1 Presentation of the Rule of Thumb ................................................................................................... 69
6.2 Summary ........................................................................................................................................... 71
6.3 Conclusion ......................................................................................................................................... 72
6.4 Recommendations for further work ................................................................................................. 72
6.4.1 Adaptable reactive power based flicker mitigation technique .................................................. 72
6.4.2 Flicker mitigation via energy storage ......................................................................................... 74
Appendix ..................................................................................................................................................... 75
Appendix A .............................................................................................................................................. 75
Appendix B .............................................................................................................................................. 76
References .................................................................................................................................................. 77
8/9/2019 Voltage Flicker Assessment in Distribution Feeders With Large Wind Farms
http://slidepdf.com/reader/full/voltage-flicker-assessment-in-distribution-feeders-with-large-wind-farms 9/97
vii | P a g e
List of Figures
Figure 1-1 Global cumulative installed wind capacity [1] ............................................................................. 1Figure 1-2 Type 3, Variable speed WTG with partial-scale PEC [8] ............................................................... 3
Figure 1-3 Type 4, Variable speed WTG with full-scale PEC [8] .................................................................... 3
Figure 1-4 Change in luminous flux resulting from a temporary voltage change [13] ................................. 5
Figure 1-5 Voltage change over a distribution network with wind power ................................................... 9
Figure 2-1 IEC Flickermeter processing diagram [15] ................................................................................. 18
Figure 2-2 Weighting filter frequency response ......................................................................................... 20
Figure 2-3 Filter frequency responses ........................................................................................................ 21
Figure 2-4 Calibration of flicker instrument & removal of filter start transient ......................................... 22
Figure 2-5 The process of CDF evaluation [17] ........................................................................................... 23
Figure 2-6 IFL vs. modulation frequency (left), Instrument error vs. modulation frequency (right) .......... 24Figure 2-7 Pst vs. repetition rate (left), Instrument error vs. repetition rate (right) .................................. 25
Figure 2-8 Electromagnetic compatibility [56] ........................................................................................... 27
Figure 2-9 Flicker emission limit for DG connection [56]............................................................................ 28
Figure 3-1 Implementation of the stochastic component .......................................................................... 31
Figure 3-2 Stochastic wind speed profile .................................................................................................... 31
Figure 3-3 Implementation of the deterministic components ................................................................... 32
Figure 3-4 Blade passing effect components .............................................................................................. 33
Figure 3-5 Resulting torque and power fluctuations .................................................................................. 33
Figure 3-6 Time and frequency domain representation of the deterministic component ........................ 34
Figure 3-7 vs. curves ........................................................................................................................... 36Figure 3-8 vs. curve ............................................................................................................................ 36
Figure 3-9 Aerodynamic model ................................................................................................................... 37
Figure 3-10 Mechanical model ................................................................................................................... 37
Figure 3-11 Maximum power point tracking curve .................................................................................... 40
Figure 3-12 Speed controller ...................................................................................................................... 41
Figure 3-13 Pitch controller ........................................................................................................................ 41
Figure 4-1 Parametric test network ............................................................................................................ 43
Figure 4-2 Flicker emissions due to changes in mean wind speed ............................................................. 44
Figure 4-3 Flicker emissions due to changes in mean wind speed and turbulence intensity..................... 45
Figure 4-4 Flicker emissions due to changes in mean wind speed and the inclusion of deterministic blade
passing effects ............................................................................................................................................. 46
Figure 4-5 Flicker emissions due to mode of operation ............................................................................. 47
Figure 4-6 Influence of short circuit capacity on flicker emissions ............................................................. 48
Figure 4-7 Influence of grid parameters on flicker emissions..................................................................... 49
Figure 4-8 Flicker emissions due to changes in the voltage connection level ............................................ 50
Figure 4-9 Power factor angle controller, version 1 ................................................................................... 52

8/9/2019 Voltage Flicker Assessment in Distribution Feeders With Large Wind Farms
http://slidepdf.com/reader/full/voltage-flicker-assessment-in-distribution-feeders-with-large-wind-farms 10/97
viii | P a g e
Figure 4-10 Power factor angle controller, version 2 ................................................................................ 52
Figure 4-11 Wind installations real power produced ................................................................................. 53
Figure 4-12 Reactive power absorbed from the grid in order to mitigate flicker ...................................... 54
Figure 4-13 Influence of turbine power factor on flicker ........................................................................... 55
Figure 4-14 Influence of the angle difference between the and ............................................ 55Figure 4-15 Improved reactive power based flicker mitigation controller ................................................. 56
Figure 4-16 Reactive power absorbed/supplied by the installation to mitigate flicker emissions (i.e.) .................................................................................................................................................................... 57
Figure 4-17 Sensitivity analysis ................................................................................................................... 58
Figure 5-1 Distribution feeder under study ................................................................................................ 60
Figure 5-2 Decoupled distribution feeder ................................................................................................... 61
Figure 5-3 Influence of Short circuit ratio on flicker emissions .................................................................. 62
Figure 5-4 Time shifted wind speed profiles and associated output power waveforms............................ 63
Figure 5-5 Flicker emissions at difference interconnection points ............................................................. 64
Figure 5-6 Interconnection to Bus 9 ........................................................................................................... 65Figure 5-7 Instantaneous flicker emissions due to three scenarios ........................................................... 66
Figure 5-8 Influence of flicker generating loads ......................................................................................... 66
Figure 5-9 Influence of reactive power based mitigation technique on flicker emissions ......................... 67
Figure 5-10 Reactive power supplied or absorbed by each turbine needed to mitigate flicker ................ 68
Figure 5-11 Net reactive power absorbed by the wind installation to mitigate flicker .............................. 68
Figure 6-1 Wind farms flicker emission plane with reference to the emission limit .................................. 69
Figure 6-2 Rule of Thumb developed to screen for flicker problems due to large distribution-connected
wind farms .................................................................................................................................................. 70
Figure 6-4 Controller diagram ..................................................................................................................... 73
Figure 6-5 Supplementary control algorithm ............................................................................................. 73

8/9/2019 Voltage Flicker Assessment in Distribution Feeders With Large Wind Farms
http://slidepdf.com/reader/full/voltage-flicker-assessment-in-distribution-feeders-with-large-wind-farms 11/97
ix | P a g e
List of Tables
Table 2-1 Flicker planning and emissions levels [57] .................................................................................. 27Table 4-1 Base case parameters ................................................................................................................. 43
Table 4-2 Test network properties ............................................................................................................. 52
Table 4-3 Sensitivity analysis ...................................................................................................................... 55
Table 4-4 Summary of results ..................................................................................................................... 57
Table 4-5 Sensitivity analysis ...................................................................................................................... 58
Table 5-1 Distribution feeder grid characteristics ...................................................................................... 60
Table 5-2 Summary of flicker measurements ............................................................................................. 64
Table 5-3 Flicker profile .............................................................................................................................. 65

8/9/2019 Voltage Flicker Assessment in Distribution Feeders With Large Wind Farms
http://slidepdf.com/reader/full/voltage-flicker-assessment-in-distribution-feeders-with-large-wind-farms 12/97
x | P a g e
List of Abbreviations
CDFCL
DG
DFIG
EHV
EMC
ESS
FS
GSC
HV
IEC
IFLIGBT
MPPT
MV
PCC
PEC
PFC
PI
PL
PMSG
PSD
RSCSCC
SCR
STATCOM
SVC
VC
VS
VSC
WRIG
WRSG
WTG
Cumulative Distribution FunctionCompatibility Level
Distributed Generator
Doubly Feed Induction Generator
Extra High Voltage
Electromagnetic Compatibility
Energy Storage System
Fixed Speed
Grid Side Converter
High Voltage
International Electrotechnical Commission
Instantaneous Flicker LevelInsolated Gate Bipolar Transistor
Maximum Power Point Tracking
Medium Voltage
Point of Common Coupling
Power Electronic Converter
Power Factor Control
Proportional Integral
Planning Level
Permanent Magnet Synchronous Generator
Power Spectral Density
Rotor Side ConverterShort Circuit Capacity
Short Circuit Ratio
Static Synchronous Compensator
Static Var Compensator
Voltage Control
Variable Speed
Voltage Source Converter
Wound Rotor Induction Generator
Wound Rotor Synchronous Generator
Wind Turbine Generator

8/9/2019 Voltage Flicker Assessment in Distribution Feeders With Large Wind Farms
http://slidepdf.com/reader/full/voltage-flicker-assessment-in-distribution-feeders-with-large-wind-farms 13/97
xi | P a g e
List of Acronyms
Empirical wind shear exponent Tower radius Area swept by rotor blades Blade pitch angle Capacitance Power coefficient Shaft mutual damping Sampling frequency Hub height Generator inertia
Turbine inertia
d-axis rotor current d-axis stator current q-axis rotor current q-axis stator current DC link current Turbulence intensity Reactive compensation gain Shaft stiffness Tip-speed ratio
Optimal tip-speed ratio
Turbulence length
Rotor leakage inductance Stator leakage inductance Magnetizing inductance Total rotor inductance Total stator inductance Number of wind turbines Generator rotor speed Reference generator rotor speed Measured generator rotor speed
Synchronous speed
Turbine rotor speed Azimuthal angle d-axis rotor flux d-axis stator flux Grid impedance angle Power factor angle q-axis rotor flux

8/9/2019 Voltage Flicker Assessment in Distribution Feeders With Large Wind Farms
http://slidepdf.com/reader/full/voltage-flicker-assessment-in-distribution-feeders-with-large-wind-farms 14/97
xii | P a g e
q-axis stator flux Number of pole pairs Real power
DC link power
Grid side converter power
Long term flicker severity index Mechanical power Rotor side converter power Short term flicker severity index
Q Reactive power Measured reactive power Reference reactive power Air density Rotor radius
Line resistance
Rotor resistance Stator resistance Generator rotor angle Turbine rotor angle Electromagnetic torque Sampling time
Turbine mechanical torque
Wind speed DC link voltage d-axis rotor voltage
d-axis stator voltage
Line-to-line voltage q-axis rotor voltage q-axis stator voltage Distance from blade origin to tower midline Line reactance
8/9/2019 Voltage Flicker Assessment in Distribution Feeders With Large Wind Farms
http://slidepdf.com/reader/full/voltage-flicker-assessment-in-distribution-feeders-with-large-wind-farms 15/97
Chapter 1: Introduction
1 | P a g e
Chapter 1:
Introduction1.1 Proliferation of wind energy
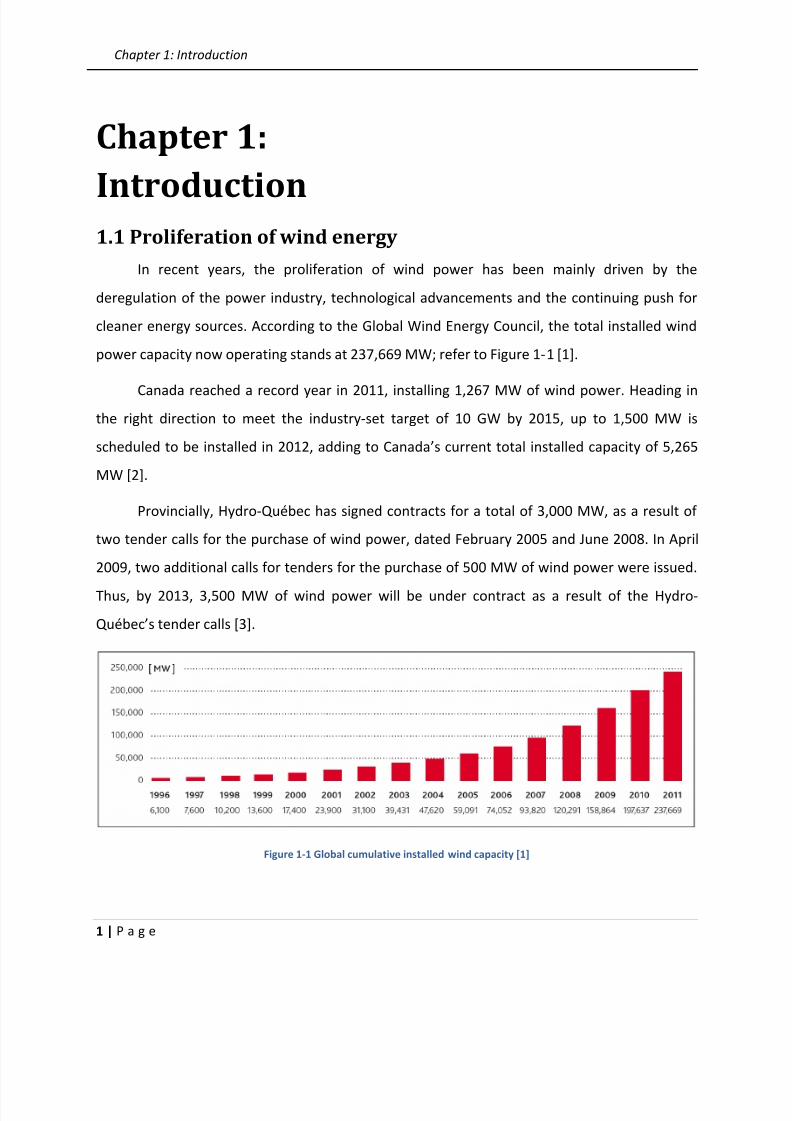
In recent years, the proliferation of wind power has been mainly driven by the
deregulation of the power industry, technological advancements and the continuing push for
cleaner energy sources. According to the Global Wind Energy Council, the total installed wind
power capacity now operating stands at 237,669 MW; refer to Figure 1-1 [1].
Canada reached a record year in 2011, installing 1,267 MW of wind power. Heading in
the right direction to meet the industry-set target of 10 GW by 2015, up to 1,500 MW is
scheduled to be installed in 2012, adding to Canada’s current total installed capacity of 5,265
MW [2].
Provincially, Hydro-Québec has signed contracts for a total of 3,000 MW, as a result of
two tender calls for the purchase of wind power, dated February 2005 and June 2008. In April
2009, two additional calls for tenders for the purchase of 500 MW of wind power were issued.
Thus, by 2013, 3,500 MW of wind power will be under contract as a result of the Hydro-
Québec’s tender calls [3].
Figure 1-1 Global cumulative installed wind capacity [1]
8/9/2019 Voltage Flicker Assessment in Distribution Feeders With Large Wind Farms
http://slidepdf.com/reader/full/voltage-flicker-assessment-in-distribution-feeders-with-large-wind-farms 16/97
Chapter 1: Introduction
2 | P a g e
The large-scale integration of wind power, particularly that which is distribution-
connected, projected to be as high as 30% of all new generation [4], however, gives rise to new
challenges for the power system. The highly fluctuating nature of the wind constitutes the main
challenge towards a harmonious integration of the wind power [5], yet regional grid code
requirements must be abided. Thus, as the penetration levels of distribution-connected wind
power increases, it becomes necessary to ensure that the proper studies and measures are
taken such that power system operates smoothly.
1.2 Wind turbine technologies
1.2.1 Overview
Wind Turbine Generator (WTG) designs have progressed mainly with regards to the
rotational speed, Power Electronic Converter (PEC) and drive train components. Referring to
the rotation speed, WTG topologies can be classified into Fixed Speed (FS), limited variable
speed and Variable Speed (VS) [8]. VS wind turbines, which include a PEC in their topology, can
be further classified into WTGs with a partial-scale and a full-scale PEC, based on the relative
rating of the PEC to the WTGs generation capacity. Furthermore, referring to the drive train
system, the WTG topologies can be classified into geared-drive and direct-drive wind turbines
[6]-[8].
WTGs are commonly classified as Type 1, Type 2, Type 3 and Type 4 [8],[31]. Type 1 and
Type 2 WTGs consist of FS and limited variable speed topologies. Whereas, Type 3 and Type 4
WTGs consist of VS topologies and represent the dominant modern day design and hence, will
be further discussed.
1.2.2 Variable speed configurations
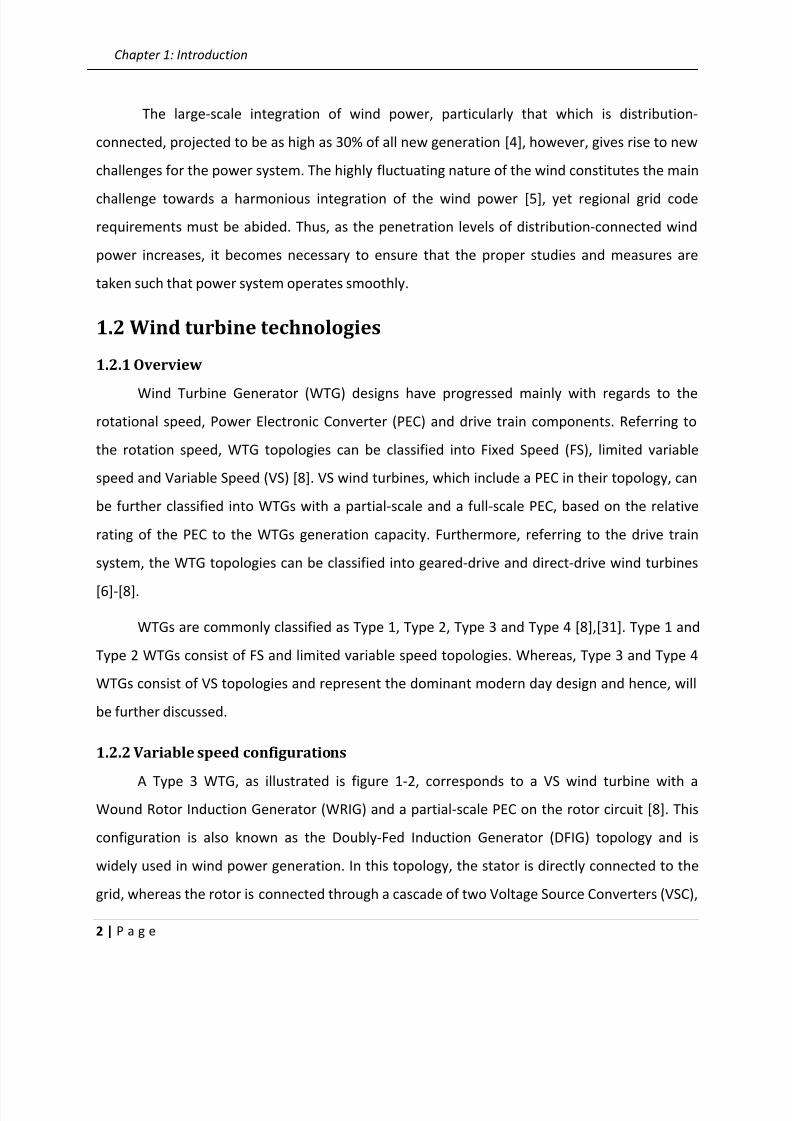
A Type 3 WTG, as illustrated is figure 1-2, corresponds to a VS wind turbine with aWound Rotor Induction Generator (WRIG) and a partial-scale PEC on the rotor circuit [8]. This
configuration is also known as the Doubly-Fed Induction Generator (DFIG) topology and is
widely used in wind power generation. In this topology, the stator is directly connected to the
grid, whereas the rotor is connected through a cascade of two Voltage Source Converters (VSC),
8/9/2019 Voltage Flicker Assessment in Distribution Feeders With Large Wind Farms
http://slidepdf.com/reader/full/voltage-flicker-assessment-in-distribution-feeders-with-large-wind-farms 17/97
Chapter 1: Introduction
3 | P a g e
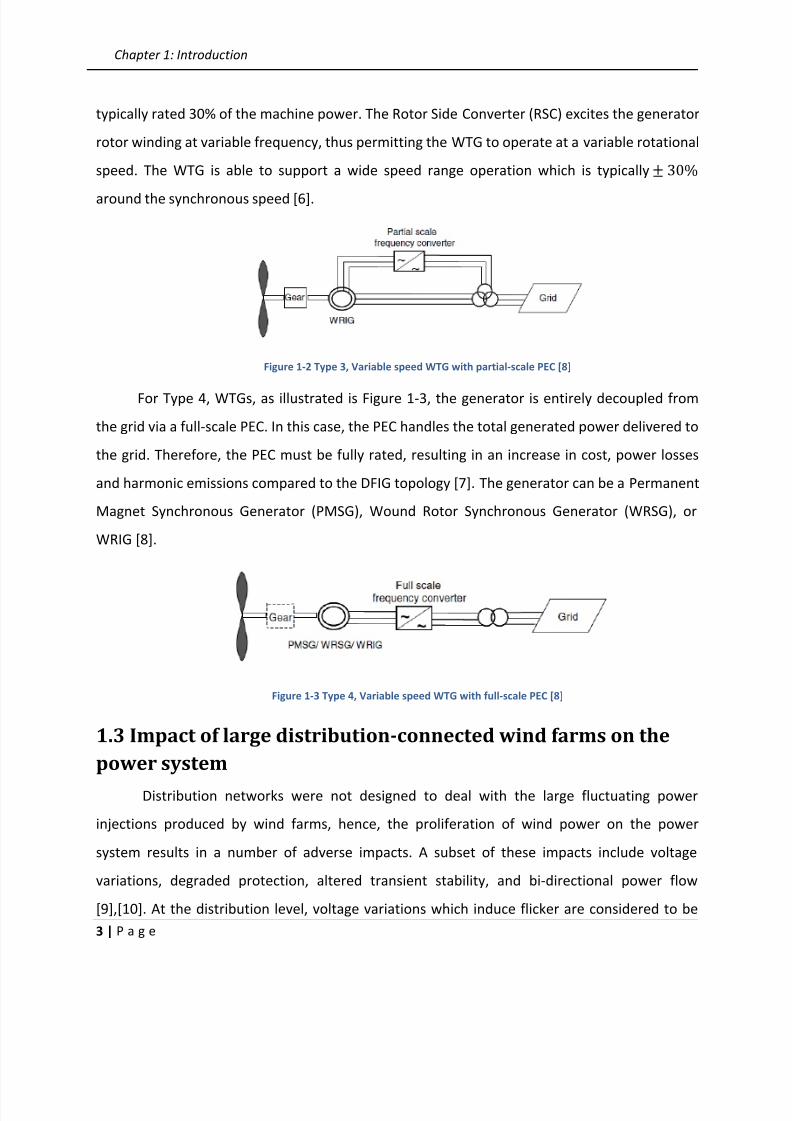
typically rated 30% of the machine power. The Rotor Side Converter (RSC) excites the generator
rotor winding at variable frequency, thus permitting the WTG to operate at a variable rotational
speed. The WTG is able to support a wide speed range operation which is typically
around the synchronous speed [6].
Figure 1-2 Type 3, Variable speed WTG with partial-scale PEC [8]
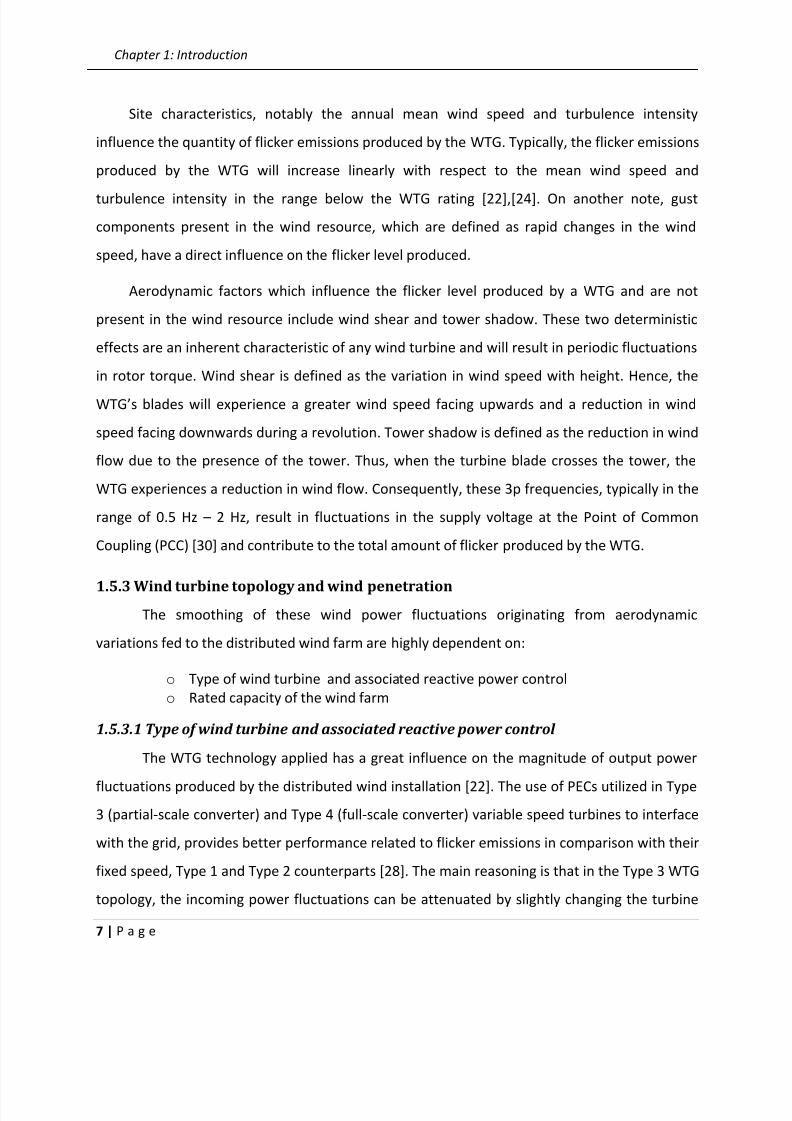
For Type 4, WTGs, as illustrated is Figure 1-3, the generator is entirely decoupled from
the grid via a full-scale PEC. In this case, the PEC handles the total generated power delivered to
the grid. Therefore, the PEC must be fully rated, resulting in an increase in cost, power losses
and harmonic emissions compared to the DFIG topology [7]. The generator can be a Permanent
Magnet Synchronous Generator (PMSG), Wound Rotor Synchronous Generator (WRSG), or
WRIG [8].
Figure 1-3 Type 4, Variable speed WTG with full-scale PEC [8]
1.3 Impact of large distribution-connected wind farms on the
power system
Distribution networks were not designed to deal with the large fluctuating power
injections produced by wind farms, hence, the proliferation of wind power on the power
system results in a number of adverse impacts. A subset of these impacts include voltage
variations, degraded protection, altered transient stability, and bi-directional power flow
[9],[10]. At the distribution level, voltage variations which induce flicker are considered to be

8/9/2019 Voltage Flicker Assessment in Distribution Feeders With Large Wind Farms
http://slidepdf.com/reader/full/voltage-flicker-assessment-in-distribution-feeders-with-large-wind-farms 18/97
Chapter 1: Introduction
4 | P a g e
one of the main power quality problems associated with large penetrations wind power. These
voltage variations are mainly due to the stochastic and non-dispatchable nature of the local
wind resource by which the typical 25 kV North American rural distribution feeder is less
suitable to handle, due to network characteristics, leading to objectionable flicker levels.
Generally, the normal tolerances of feeder voltage levels are , however, rapid
voltage variations become a nuisance at levels as low as , in weak feeders which are often
located in rural areas where the wind farms are connected [11]. This nuisance is termed as
flicker, which is defined as a subjective phenomenon that is experienced by human beings
when exposed to the fluctuating luminous flux of light sources. Utility surveys have shown that
most people are tolerant to an occasional light flicker event, but when light flicker is frequent
and/or continuous, consumers are annoyed and start to complain [12],[13]. Hence, light flicker
can be the limiting factor determining the amount of wind power which can be connected to a
distribution feeder and thus, the phenomenon must be studied.
1.4 Description of the light flicker phenomenon
1.4.1 Voltage fluctuations and flicker
Voltages fluctuations and flicker are linked terms and are commonly used indistinctly.
Nonetheless, these terms are defined differently, although they frequently can occur at the
same time [14]. Therefore, it is essential to clearly differentiate these two terms:
Voltage fluctuations are defined entirely from an electrical point of view and are
described as variations of the voltage waveform whose amplitudes are bound to of the
nominal voltage level. The magnitude of these voltage fluctuations are typically well below the
thresholds of sensitivity of most electrical equipment and are not likely to result in operating
problems [14],[16]. However, for some specific cases, voltage fluctuations can induce variations
in the luminous flux of light sources, hence, affecting the light bulbs operation [14].

8/9/2019 Voltage Flicker Assessment in Distribution Feeders With Large Wind Farms
http://slidepdf.com/reader/full/voltage-flicker-assessment-in-distribution-feeders-with-large-wind-farms 19/97
Chapter 1: Introduction
5 | P a g e
Figure 1-4 Change in luminous flux resulting from a temporary voltage change, (informative, not to scale) [13]
The International Electrotechnical Commission (IEC) standard IEC 61000-3-7 [48],
defines flicker as an impression of unsteadiness of visual sensation induced by a light stimulus
whose luminance or spectral distribution fluctuates with time. Essentially, flicker corresponds
to the visual discomfort experienced by a person, when exposed to variations in the luminous
flux of light sources. These luminous flux variations are induced by voltage fluctuations, as can
be seen in Figure 1-4, thus, there is a clear connection between flicker and voltage fluctuations.
However, a human factor is involved in the definition of flicker, while voltage fluctuations are
defined entirely from an electrical point of view [14]. This implies that in order for a flicker
problem to occur, the following two factors are required: 1) voltage fluctuations causing
variations in luminous flux, defined as the objective factor and 2) a person exposed to these
luminous flux variations, defined as the subjective factor [14],[16]. Thus, as the human
physiological process has a significant influence in quantifying the flicker disturbance, thorough
knowledge of the human visual perception is essential for the measurement of the flicker.
1.4.2 Physiology of flicker perception
As mentioned in the previous section, flicker is basically a physiological phenomenon
that can at certain severity levels cause significant discomfort to the person exposed to it. The
work conducted by de Lange [18], in the 1950s and Rashbass [19] in the 1970s, demonstrated
that the response of the human eye has the behavior of a band-pass filter between 0.5 Hz and
42 Hz, with the highest sensitivity to the luminous flux at a frequency around 8 to 9 Hz.
Physiological effects also depend on several other key factors (i.e. the amplitude of the

8/9/2019 Voltage Flicker Assessment in Distribution Feeders With Large Wind Farms
http://slidepdf.com/reader/full/voltage-flicker-assessment-in-distribution-feeders-with-large-wind-farms 20/97
Chapter 1: Introduction
6 | P a g e
fluctuations, the duration of the disturbance, the activity/state of the person and the color of
the lighting source). They also concluded that the brain response to light stimulus has a
memory effect with a time constant of around 300 ms, implying that slow changes in luminous
flux are more noticeable than fast changes in luminous flux which are smoothed out
[14],[18],[19],[53]. Based on these results, the IEC Flickermeter was progressively developed to
simulate the human physiological process in order to quantify the flicker disturbance and will
be discussed in chapter 2.
1.5 Factors influencing flicker
1.5.1 Overview
The connection of a large wind farm to a distribution network may greatly influence the
flicker level in the supply voltage provided to utility customers. The main factor contributing to
the deterioration of voltage quality are the rapid variations of the wind farm’s output power,
which induce fluctuations in the feeder’s voltage, attributing to flicker [78]. Flicker emissions
arise in consequence of the fluctuating nature of the wind farm’s output power which is
composed of both deterministic components (due to tower shadow and wind shear) and
stochastic components (due to wind gusts, wind turbulence and wind speed variability)
[11],[20]-[31],[78]. Furthermore, network characteristics such as the short circuit capacity, grid
impedance angle and the local load will be the determining factors attenuating or aggravating
the feeder’s flicker level [21]-[26].
1.5.2 Wind flow and local characteristics
Flicker emissions produced by a distributed wind installation during continuous
operation are in most part induced by power fluctuations originating from variations in the
rotor torque. Aerodynamic factors influencing variations in rotor torque of the WTG,
contributing to increased amounts of flicker emissions, initiate from three main sources:
o Mean wind speed
o Wind gusts and turbulence intensity
o Blade passing effects
8/9/2019 Voltage Flicker Assessment in Distribution Feeders With Large Wind Farms
http://slidepdf.com/reader/full/voltage-flicker-assessment-in-distribution-feeders-with-large-wind-farms 21/97
Chapter 1: Introduction
7 | P a g e
Site characteristics, notably the annual mean wind speed and turbulence intensity
influence the quantity of flicker emissions produced by the WTG. Typically, the flicker emissions
produced by the WTG will increase linearly with respect to the mean wind speed and
turbulence intensity in the range below the WTG rating [22],[24]. On another note, gust
components present in the wind resource, which are defined as rapid changes in the wind
speed, have a direct influence on the flicker level produced.
Aerodynamic factors which influence the flicker level produced by a WTG and are not
present in the wind resource include wind shear and tower shadow. These two deterministic
effects are an inherent characteristic of any wind turbine and will result in periodic fluctuations
in rotor torque. Wind shear is defined as the variation in wind speed with height. Hence, the
WTG’s blades will experience a greater wind speed facing upwards and a reduction in wind
speed facing downwards during a revolution. Tower shadow is defined as the reduction in wind
flow due to the presence of the tower. Thus, when the turbine blade crosses the tower, the
WTG experiences a reduction in wind flow. Consequently, these 3p frequencies, typically in the
range of 0.5 Hz – 2 Hz, result in fluctuations in the supply voltage at the Point of Common
Coupling (PCC) [30] and contribute to the total amount of flicker produced by the WTG.
1.5.3 Wind turbine topology and wind penetration
The smoothing of these wind power fluctuations originating from aerodynamic
variations fed to the distributed wind farm are highly dependent on:
o Type of wind turbine and associated reactive power control
o Rated capacity of the wind farm
1.5.3.1 Type of wind turbine and associated reactive power control
The WTG technology applied has a great influence on the magnitude of output power
fluctuations produced by the distributed wind installation [22]. The use of PECs utilized in Type
3 (partial-scale converter) and Type 4 (full-scale converter) variable speed turbines to interface
with the grid, provides better performance related to flicker emissions in comparison with their
fixed speed, Type 1 and Type 2 counterparts [28]. The main reasoning is that in the Type 3 WTG
topology, the incoming power fluctuations can be attenuated by slightly changing the turbine

8/9/2019 Voltage Flicker Assessment in Distribution Feeders With Large Wind Farms
http://slidepdf.com/reader/full/voltage-flicker-assessment-in-distribution-feeders-with-large-wind-farms 22/97
Chapter 1: Introduction
8 | P a g e
rotor speed, hence, using the VS operation of the machine to smooth power fluctuations
[22],[26]. On a similar note, Type 4 WTGs are fully decoupled from the grid via a PEC, hence the
energy stored in the DC-link of the PEC provides a buffer to smooth out power fluctuations.
Furthermore, for Type 3 and Type 4 WTGs the output active and reactive power can be
controlled independently. Thus, the reactive power can be controlled to reduce the voltage
fluctuations caused by active power fluctuations as opposed to operating the WTG at a unity
power factor [27].
1.5.3.2 Rated capacity of wind farm
As the wind farm capacity increases, the flicker emissions produced by the distributed
wind installation at PCC will tend to increase as well. A measure of the distributed wind
penetration is the Short Circuit Ratio (SCR) defined by:
(1.1)
Where is the rated apparent power of the wind farm. Thus, as the rated apparent
power of the wind installation increases, the SCR will decrease, indicating an increased relative
penetration and increased level of flicker emissions. In fact, it is well noted that the flicker level
is inversely proportional to the SCR [21]-[24]. Factors that influence the SCC at a particular node
in the distribution feeder will be discussed in the next section.
1.5.4 Distribution feeder characteristics
The inherent characteristics of a weak rural distribution feeder represent a bothersome
concern that a utility may have prior to the connection of a large embedded wind farm. The
reasoning is that the wind farms highly fluctuating power injections, associated with the
turbines mode of operation, in combination with distribution feeder parameters, may cause
significant fluctuations in the feeder voltage which may lead to objectionable flicker levels. The
relative voltage change due to a fluctuation in power flow on a distribution feeder can be
approximated using eqn. (1.2).
8/9/2019 Voltage Flicker Assessment in Distribution Feeders With Large Wind Farms
http://slidepdf.com/reader/full/voltage-flicker-assessment-in-distribution-feeders-with-large-wind-farms 23/97
Chapter 1: Introduction
9 | P a g e
Substation
Zgrid = RL + jXL
WTGLine Impedance
VgVs
Pg + jQ g
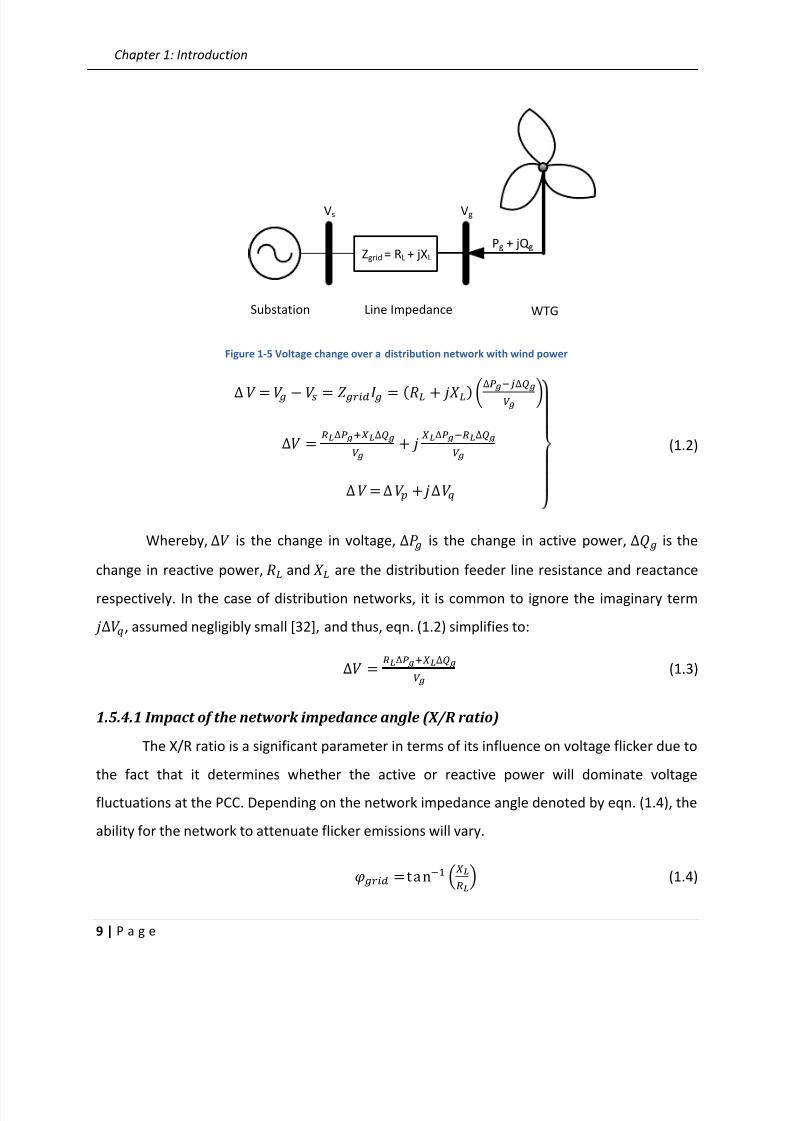
Figure 1-5 Voltage change over a distribution network with wind power
(1.2)
Whereby, is the change in voltage, is the change in active power, is the
change in reactive power,
and
are the distribution feeder line resistance and reactance
respectively. In the case of distribution networks, it is common to ignore the imaginary term , assumed negligibly small [32], and thus, eqn. (1.2) simplifies to:
(1.3)
1.5.4.1 Impact of the network impedance angle (X/R ratio)
The X/R ratio is a significant parameter in terms of its influence on voltage flicker due to
the fact that it determines whether the active or reactive power will dominate voltage
fluctuations at the PCC. Depending on the network impedance angle denoted by eqn. (1.4), the
ability for the network to attenuate flicker emissions will vary.
(1.4)

8/9/2019 Voltage Flicker Assessment in Distribution Feeders With Large Wind Farms
http://slidepdf.com/reader/full/voltage-flicker-assessment-in-distribution-feeders-with-large-wind-farms 24/97
Chapter 1: Introduction
10 | P a g e
The determining factor that influences the severity of flicker emissions is the difference
between grid impedance angle and the wind turbine power factor angle [24]. This can be
shown analytically with the reformulation of eqn. (1.3):
(1.5)
Usually the DFIG wind farm is set to operate at unity power factor, which implies that no
reactive power is supplied to or absorbed from the feeder [22]. In this scenario, the line
resistance, typically high for distribution feeders, is the determining factor that influences the
flicker emissions produced by the wind farm. Thus, for higher grid impedance angles, implying a
higher X/R ratio, a reduction in flicker emission is observed. When the difference between the
grid impedance angle and the power factor angle approaches 90 degrees, flicker emissions are
minimized [22],[24], as can be verified by eqn. (1.5).
1.5.4.2 Impact of network short-circuit capacity
The short circuit capacity is a relative indicator of the voltage stiffness of a particular
node in the distribution feeder. The higher the SCC, the higher the voltage stiffness of that
node, and hence, flicker levels should be relatively low. Stated otherwise, the SCC is a measure
of the feeder’s ability to absorb voltage fluctuations and although not directly a parameter of
voltage quality, has a great influence [11]. It has been noted that the flicker level is
approximately inversely proportional to the short circuit capacity at the PCC of the distributed
wind farm [24].
Distribution feeder characteristics that primarily influence the SCC at the PCC are the
voltage interconnection level and the grid impendence.
(1.6)
With reference to eqn. (1.6), the higher the interconnection voltage level and the lower
the grid impendence at PCC, the greater the SCC. The equivalent grid impedance determined by
looking back into the distribution feeder from the PCC and is dependent on multiple factors,
8/9/2019 Voltage Flicker Assessment in Distribution Feeders With Large Wind Farms
http://slidepdf.com/reader/full/voltage-flicker-assessment-in-distribution-feeders-with-large-wind-farms 25/97
Chapter 1: Introduction
11 | P a g e
including the size of the substation transformer, distribution conductor type and distance from
the substation [20],[39].
1.5.4.3 Load Type
Fluctuating industrial loads of substantial size connected to the distribution feeder can
cause severe flicker levels to other customers connected to the same feeder. Typical flicker
emitting loads consist of electric arc furnaces, electric boilers, frequently starting and stopping
induction motors, and welders [14],[33]-[36]. If these loads are connected near or at the PCC of
the distributed wind installation, the summation of flicker emissions originating from different
sources may reach to objectionable levels. Hence, the load type connected at or near the PCC
may be a serious technical limitation to the quantity of distributed wind to be installed,
especially if the occurrences of emissions are simultaneous and/or within the same frequency
range.
1.6 Flicker mitigation
Several solutions are available to mitigate the flicker emissions caused by distribution-
connected wind turbines. The most widely adopted techniques are based on reactive power
compensation; however, other methods are possible and include reducing the line impedance
and the use of an Energy Storage System (ESS).
The passive flicker mitigation measure to reduce the line impedance, with the intent to
strengthen the SCC at PCC, is not common, but can be done in the two following manners. The
reduction of the line impedance can be achieved by physically moving the PCC closer to the
substation transformer or by reinforcing the existing distribution network [20],[32]. However, it
may not always be possible to relocate the wind farm closer to the substation transformer as
these areas are typically more densely populated and may violate municipal legislation.
Moreover, the reinforcement of the distribution feeder is likely to render the wind farm project
infeasible from a financial standpoint, as the costs of re-conductoring sections of the feeder will
be fairly significant [32].
8/9/2019 Voltage Flicker Assessment in Distribution Feeders With Large Wind Farms
http://slidepdf.com/reader/full/voltage-flicker-assessment-in-distribution-feeders-with-large-wind-farms 26/97
Chapter 1: Introduction
12 | P a g e
Flicker mitigation techniques utilizing an ESS connected at the DC-link of the WTG PEC,
for power smoothing can also reduce flicker emissions. The main notion is that flicker emissions
are attenuated by storing or injecting fluctuating active power components at the DC-link of the
WTG. In ref. [37] an ESS is employed to reduce tower shadow and wind shear flicker emissions
while ref. [38] employs an ESS to suppress all flicker components. However, economic feasibility
of these approaches is questionable.
Reactive power based mitigation techniques reduce the flicker level by dispatching
reactive power in the opposite direction to that of active power fluctuations and hence,
reducing , refer to eqn. (1.3). Reactive power compensation can be employed to distributed
wind installations by conventional equipment such as a Static Var Compensator (SVC) or Static
Synchronous Compensator (STATCOM) as mentioned in ref. [20],[39],[40]. The purchase of this
additional equipment, however, raises the project cost considerably and presents an infeasible
solution for distributed-wind applications. Moreover, variable speed WTG topologies have an
inherent ability to control reactive power, therefore, the WTGs PEC can be utilized in a similar
fashion to that of a STATCOM in order to reduce flicker emissions [22]. Thus, reactive power
based, flicker mitigation techniques may be embedded within the WTG and assume the form of
either Voltage Control (VC) or Power Factor Control (PFC).
The voltage control technique involves using the difference between the voltage
measured at the WTG terminal to a reference voltage, in order to set the reactive power
needed to be absorbed or supplied by the machine. This in consequence reduces voltage
fluctuations and hence, the flicker level. However, distribution networks containing an On-Load
Tap Changing transformer (OLTC) and capacitor banks, both which are voltage control devices
will require a more sophisticated and coordinated voltage control scheme, if the voltage control
mitigation technique embedded in the WTG is employed [20],[41]. The main reasoning is such
that the multiple voltage control devices within the network are not “chasing” each other,
stimulating excessive switching occurrences, resulting in distribution equipment degradation,
particularly the OLTC and circuit breaker [41].
8/9/2019 Voltage Flicker Assessment in Distribution Feeders With Large Wind Farms
http://slidepdf.com/reader/full/voltage-flicker-assessment-in-distribution-feeders-with-large-wind-farms 27/97
Chapter 1: Introduction
13 | P a g e
The main notion of the PFC mitigation technique is based on eqn. (1.5). Essentially the
PFC technique adjusts the power factor angle , such that () is equal to 90° by
controlling the reactive power output [22],[23],[37],[38],[42]-[44]. Nevertheless, the PFC
mitigation technique shows its limitations when the grid impedance angle is low, inherent to
weak rural distribution networks which tend to be much more resistive that transmission
networks [22]. If the total reactive power required to mitigate flicker is in excess of the WTG
ratings, the flicker level may still stand at objectionable levels. Active power curtailment is one
technique applied to provision for a reactive power margin in the case when the power limits of
the converter may be exceeded in order to mitigate flicker by absorbing reactive power [31].
Yet, curtailing active power has unfavorable financial implications as the power sent to the grid
is decreased. Moreover, for weak distribution networks, the PFC mitigation technique will
require the WTG to operate at very poor power factors which may not meet local grid code
requirements and may in fact bring upon new problems to the distribution network with regard
to reactive power supply.
In a more practical scenario of the PFC implementation, manufacturers provide
electrical WTG ratings 10% in excess of their prospective active power rating [75]. This allows
the WTG to operate constantly at a slightly leading power factor, (i.e. absorbing reactive power)
and still reduce flicker emission levels without the need for active power curtailment. Although,
WTG flicker emissions may not be reduced to their minimum levels, this method provides a way to
reduce the flicker level and comply with grid codes. Yet, operating at a constant power factor, other
that unity, implies continuously absorbing significant amounts of reactive power, which comes at a
dollar cost and increases the burden on network reactive power sources.
Thus, there is a need for a reactive power based mitigation technique which directly
addresses flicker emissions, such that reactive power is used efficiently, rendering the
technique practically viable. An improved flicker mitigation technique based on reactive power
which operates within a specified power frequency band is explored in chapter 4 of this
dissertation.

8/9/2019 Voltage Flicker Assessment in Distribution Feeders With Large Wind Farms
http://slidepdf.com/reader/full/voltage-flicker-assessment-in-distribution-feeders-with-large-wind-farms 28/97
Chapter 1: Introduction
14 | P a g e
1.7 Problem statement & project description
The quantity of flicker emissions produced by a distribution-connected wind farm is a
bothersome issue for utilities. In order to make the most efficient penetration of wind energy
into rural distribution feeders without compromising EMC of the power system, the utility must
be able to assess the dependence of voltage flicker on site characteristics, wind turbine
characteristics and feeder characteristics which were all discussed in the previous section. Thus,
a set of guidelines and a rule of thumb for the design and interconnection of a large distributed
wind installation, with regard to flicker, will be of great benefit.
In order to determine if a distributed wind installation will impose technical limitations
with regard to flicker, a parametric study will be conducted, in accordance to factors that
influence flicker in order quantify and assess emissions. Flicker studies tend to be
computationally expensive, due to the 10 minute voltage sampling period and 50 simulation
time step, thus, the modeling will be oriented for a flicker study and the parameters which
influence flicker will only be tested within a logical and practical range. Moreover, based upon
these studies, a subset of factors which are deemed to greatly influence voltage flicker will be
further studied for the development of a generalized rule of thumb.
These studies will serve as guidelines on how flicker is influenced from individual
characteristics and later used to develop rule of thumb with appropriate mitigation
corresponding to flicker level, grid characteristics and applicable regional grid codes. Thus, the
overall goal of this research is to aid in the design and interconnection of a large distributed
wind installation with a certain degree of confidence, without the need for a detailed network
simulation.
8/9/2019 Voltage Flicker Assessment in Distribution Feeders With Large Wind Farms
http://slidepdf.com/reader/full/voltage-flicker-assessment-in-distribution-feeders-with-large-wind-farms 29/97
Chapter 1: Introduction
15 | P a g e
1.8 Thesis outline
The remainder of the thesis is organized as follows:
Chapter 2 details flicker evaluation, measurement and modeling. This includes a revision
of applicable standards, notably IEC 641000-4-15, IEC 61400-21 and IEC 61000-4-7 which cover
the Flickermeter instrument, flicker measurement guidelines for wind turbines, summation of
flicker originating from multiple sources as well as compatibility, planning and emission levels
for flicker in MV networks.
Chapter 3 details the level of modeling required to conduct a flicker study. This entails
assuring that factors which influence flicker are incorporated and may be adjusted in the
modeling such that emissions are well quantified. Both, the modeling requirements of the wind
speed model as well as the wind turbine model are discussed in this chapter.
Chapter 4 quantifies and analyses the behavior of wind farm flicker emissions according to
factors that are known to influence flicker. This includes the influence wind, aerodynamic and
grid parameters on DFIG induced flicker emissions. Moreover, the effectiveness of reactive
power based mitigation techniques are compared in terms of reactive power use and viability.
Chapter 5 details a flicker study conducted on a real distribution network, using the Opal-
RT® real time simulator. Varying levels of wind penetration are connected at several PCCs and
flicker behavior is studied and quantified. The interaction between flicker emitting loads and
the wind farm are also studied. Finally the effectiveness of reactive power based flicker
mitigation is tested.
Chapter 6 presents the formulated rule of thumb for flicker assessment in a pre-
connection study and summarizes the main conclusions drawn from this thesis.
8/9/2019 Voltage Flicker Assessment in Distribution Feeders With Large Wind Farms
http://slidepdf.com/reader/full/voltage-flicker-assessment-in-distribution-feeders-with-large-wind-farms 30/97
Chapter 2: Flicker Evaluation, Measurement and Modeling
16 | P a g e
Chapter 2:
Flicker Evaluation, Measurement
and Modeling
2.1 Overview
This chapter presents two methods for quantifying flicker emissions produced by a
distribution-connected wind farm during a pre-connection phase, as specified in [46]. Both
methods entail the use of the IEC Flickermeter, which is detailed. The first method involves a
detailed simulation, involving the network under study, the wind farm and the measurement of
flicker at the node of interest, using an IEC Flickermeter emulator. The second method uses
universally applicable flicker tables provided by the WTG manufacturer compliant to the IEC
61400-21 standard [47] to quantify flicker emissions at the desired PCC. Also mentioned, is how
flicker is summed when originating from multiple sources and the flicker emission limits
provided by the IEC 61000-4-7 standard [48].
2.2 Perspective, description, limitations and modeling of theIEC Flickermeter
2.2.1 Perspective and description of the IEC Flickermeter
Currently, the most prevalent and widely accepted standard for flicker is IEC 641000-4-
15, also referred to as the IEC Flickermeter. The IEC Flickermeter standard specifies the function
and design of a flicker instrument based on human perception to the luminous flux variations of
a standard 60W incandescent light bulb induced by voltage variations. The major advantage of
the IEC Flickermeter is that it automatically incorporates the contributions of numerous flicker
disturbances and non-standard (i.e. not square or sine wave) modulating waveforms [16] into
unified and comparable flicker measure, which was considered a major shortcoming of the
historical GE flicker curves [16],[40].
8/9/2019 Voltage Flicker Assessment in Distribution Feeders With Large Wind Farms
http://slidepdf.com/reader/full/voltage-flicker-assessment-in-distribution-feeders-with-large-wind-farms 31/97
Chapter 2: Flicker Evaluation, Measurement and Modeling
17 | P a g e
The IEC Flickermeter essentially processes the input voltage measurement at the node
under study and outputs two main indices, notably, the short term flicker severity, , and the
long term flicker severity,
. These two main indices are derived statistically from the level of
perceptible flicker over periods of 10 minutes and 2 hours respectively.
2.2.2 Limitations of the IEC Flickermeter instrument
The IEC Flickermeter specifies a measurement instrument based on human perception
to a 120V, 60W incandescent lamp supplied with a fluctuating voltage waveform.
Controversially, some governments are considering stronger measures to entirely remove
incandescent lamps from the market. These measures include taxation or bans on the
production of incandescent lamps that do not meet energy efficiency requirements [49]. It is
important to note, the IEC Flickermeter standard specifically states that the characteristics of
discharge lamps are totally different than incandescent lamps and that substantial
modifications to this standard would be necessary if they were taken in account. Thus, the IEC
Flickermeter has limitations with regards to accessing flicker in modern lighting which is based
on a different technology than the incandescent lamp and sought to be less sensitive to voltage
fluctuations inducing flicker. Recently, studies [11],[50]-[54] have been demonstrated that
inter-harmonics originating from the supply voltage can also cause both incandescent and
fluorescent lamps to flicker. However, the mechanisms and the involved frequency ranges, as
well as light flicker amplitudes, are quite different.
2.2.3 Modeling and implementation of the IEC Flickermeter instrument
2.2.3.1 Overview
In order to conduct a flicker study, without the use of flicker tables provided by the IEC
61400-21 standard, a flickermeter emulator must be constructed, as in [70]-[74]. Thus, a
discrete time flickermeter, compliant with ref. [15], implemented in Matlab® and to be used for
voltage flicker studies is required. The main objective is to develop a measurement tool which
will output a short term flicker severity from a 10 minute input voltage array, generated in
any simulation package. Thus, a script based flickermeter function which takes an input voltage
array , at a specified sampling frequency and specified instrument warm up time (time for
8/9/2019 Voltage Flicker Assessment in Distribution Feeders With Large Wind Farms
http://slidepdf.com/reader/full/voltage-flicker-assessment-in-distribution-feeders-with-large-wind-farms 32/97
Chapter 2: Flicker Evaluation, Measurement and Modeling
18 | P a g e
instrument to reach steady state due to the fact the embedded filters are not initialized) and
outputs the corresponding and Instantaneous Flicker Level (IFL) will be implemented. The
IFL is essentially the measured flicker emissions as a function of time from which the
is
statistically computed from.
It is important to note that a minimum sampling frequency for compliant results as
well as a minimum warm up time for the instrument filter transients to settle will need to be
reported. Respecting these two conditions will ensure correct usage of the newly developed
flickermeter emulator.
2.2.3.2 Implementation of the IEC Flickermeter Instrument
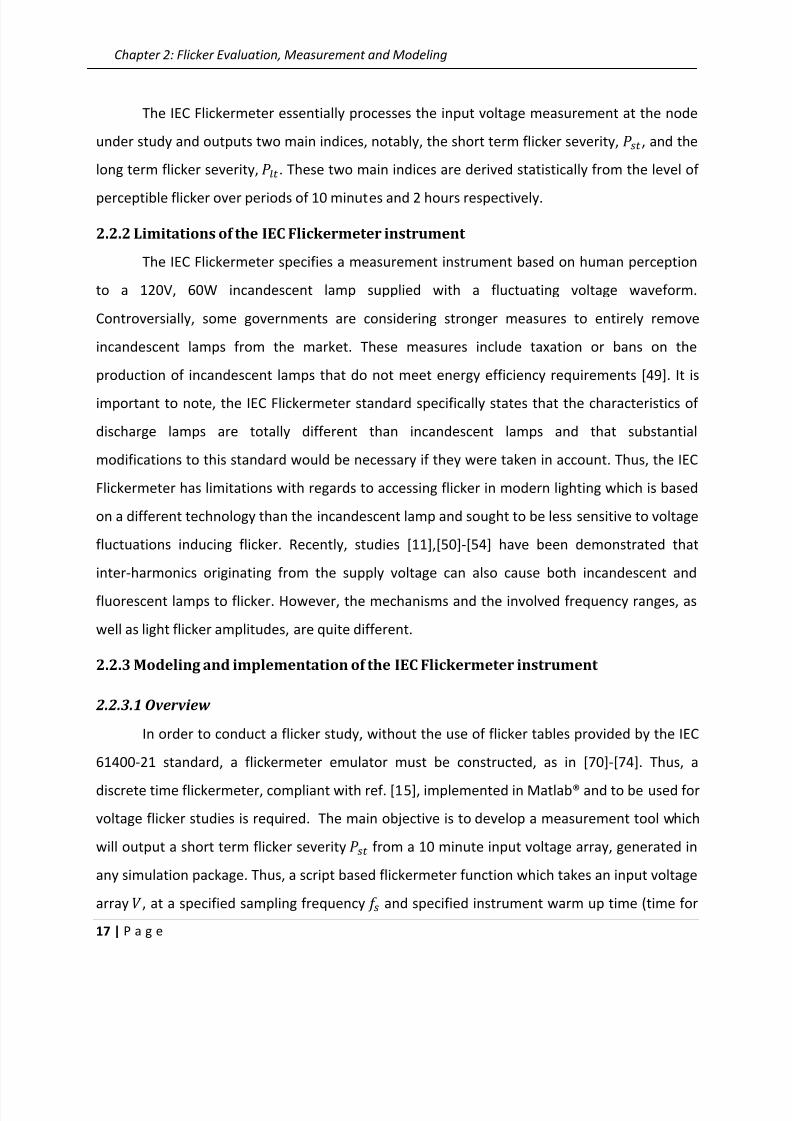
The structure of the IEC Flickermeter is shown in figure 2-1. The major steps of theflickermeter algorithm which need to be implemented are 1) input processing 2) eye-brain-
lamp response, 3) statistical analysis of the flicker signal for the computation of the level
[16].
Figure 2-1 IEC Flickermeter processing diagram [15]
Please note that ref. [15] describes a physical flickermeter device and not a flickermeter
emulator. Thus, sections regarding transformer sizing, operating temperatures etc. can be
disregarded. In addition, all filter transfer functions in the standard are in domain. To model
the filters as discrete blocks, as opposed to continuous blocks, it is necessary to express the
filter transfer functions from
domain to
domain. The bilinear transformation, also known as
the Tustin transformation is a well-known discretization method and will be employed. The
transformation is the following:
(2.1)
Whereby, is the sampling time.

8/9/2019 Voltage Flicker Assessment in Distribution Feeders With Large Wind Farms
http://slidepdf.com/reader/full/voltage-flicker-assessment-in-distribution-feeders-with-large-wind-farms 33/97
Chapter 2: Flicker Evaluation, Measurement and Modeling
19 | P a g e
Block 1: Input voltage adaptor & calibration checking circuit
The input of the first block is a 10 minute time series of the voltage and the node under
evaluation. This block contains a voltage adaptor whose objective is to scale the 1 minute mean
RMS value, updated every half cycle, down to an internal reference level. This step allows for
flicker measurements to be done independently of the input voltage supply level. The output of
this block is the normalized RMS value of the input voltage.
Block 2: Square law demodulator
The function of the second block is to recover the voltage fluctuation by squaring the
input voltage which has been scaled to an internal reference level, thus simulating the light
output behavior of an incandescent lamp which is proportional to its instantaneous power.
Block 3: Weighting filters
Block 3 is composed of a cascade of two filters. The first filter models the sensitivity of
the human eye-brain to light stimulus and incorporates a band-pass filter consisting of a 1st
order high pass filter and a 6th
order Butterworth low pass filter with cutoff frequencies at 0.05
Hz and 42 Hz respectively. The 1st
order high pass filter which eliminates the DC component is
given as follows:
(2.2)
Whereby is the filter time constant given as follows:
(2.3)
Whereby is the cut off frequency of the high pass filter having attenuation of 3dB at . The 6th
order Butterworth low pass filter transfer function can be given in
cascade form as follows: (2.4)
8/9/2019 Voltage Flicker Assessment in Distribution Feeders With Large Wind Farms
http://slidepdf.com/reader/full/voltage-flicker-assessment-in-distribution-feeders-with-large-wind-farms 34/97
Chapter 2: Flicker Evaluation, Measurement and Modeling
20 | P a g e
Whereby and . Whereby, is the cut off
frequency of the low pass filter with attenuation of 3dB at a frequency of 42 Hz.
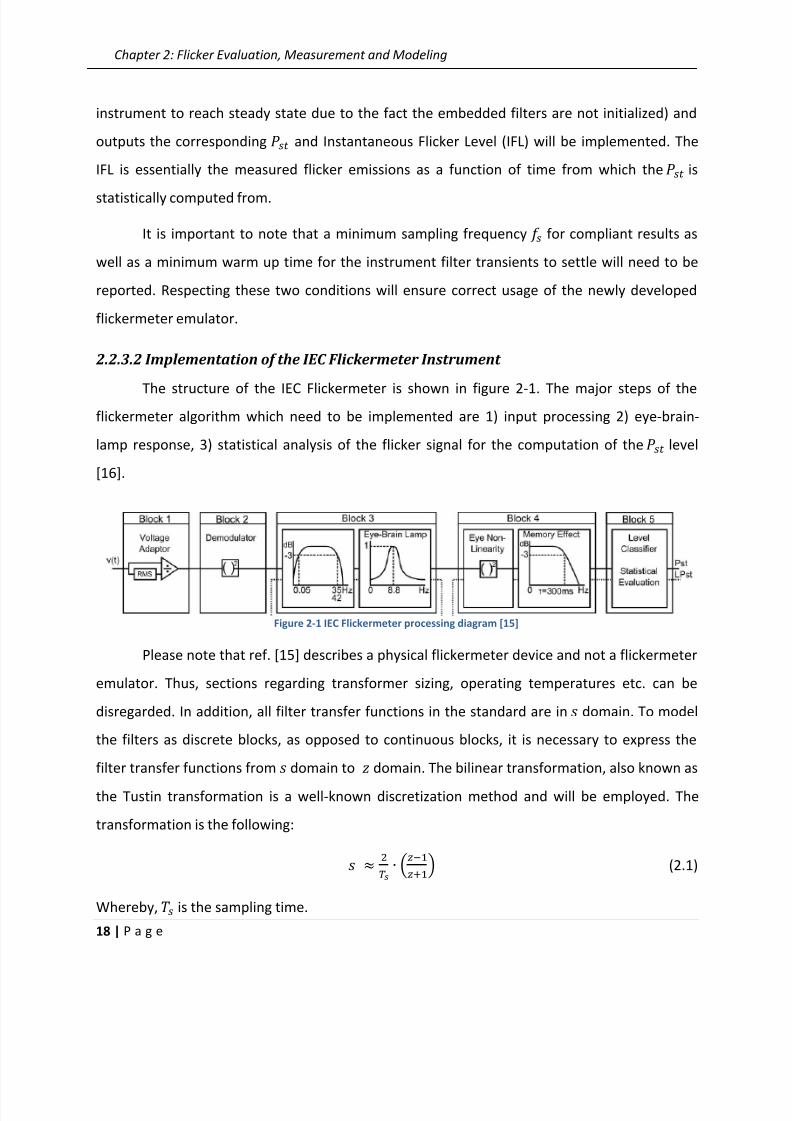
The second filter incorporates a weighting function, simulating the frequency response
of the eye-brain and lamp and peaks at a frequency of 8.8 Hz. The decomposition of the IEC
weighting curve of the eye-brain lamp model is obtained by 1) eye-brain response to flicker, 2)
the lamps response to voltage disturbance. The transfer function for the weighting filter is
defined by ref. [15] and consists of these two parts:
(2.5)
(2.6)
Whereby, the variables are listed in table 8 of ref. [15].
For illustrative and validation purposes, figure 2-2 plots the frequency response of the
weighting filter for both 50 Hz and 60 Hz systems. As expected, the filter response peaks at
8.8Hz.
Figure 2-2 Weighting filter frequency response
0 5 10 15 20 25 30 35 400
0.1
0.2
0.3
0.4
0.5
0.6
0.7
0.8
0.9
1
Frequency (Hz)
M a g n i t u d e
Weighting Filter 50Hz
Weighting Filter 60Hz

8/9/2019 Voltage Flicker Assessment in Distribution Feeders With Large Wind Farms
http://slidepdf.com/reader/full/voltage-flicker-assessment-in-distribution-feeders-with-large-wind-farms 35/97
Chapter 2: Flicker Evaluation, Measurement and Modeling
21 | P a g e
Block 4: Squaring & smoothing
Block 4 is composed of a squaring multiplier, first order low-pass filter and a calibration
gain and outputs the IFL. In the first two sub-blocks, the flicker signal is squared and then is
filtered to simulate the memory effect in the brain using the first order low-pass filter with
following transfer function:
(2.7)
Whereby is the time constant of the brains memory effect to light stimulus and is equal to .
Once again, for illustrative and validation purposes, figure 2-3 plots the frequency
responses of all the filters incorporated in the implementation of the flickermeter for 60 Hz
systems.
Figure 2-3 Filter frequency responses
The third sub-block takes the filtered signal and then normalizes it. This is done by using
a calibration gain factor to give a maximum value of , for a given modulation frequency
and depth given by ref. [15]. The Flickermeter standard specifically indicates to calibrate the
flicker instrument using a sine wave, modulated input signal with fundamental frequency
, a modulation frequency and a modulation depth .
0 5 10 15 20 25 30 35 400
0.1
0.2
0.3
0.4
0.5
0.6
0.7
0.8
0.9
1
Frequency (Hz)
M
a g n i t u d e
High Pass Filter
Low Pass Butterworth Filter
Weighting Filter
Low Pass Memory Filter
8/9/2019 Voltage Flicker Assessment in Distribution Feeders With Large Wind Farms
http://slidepdf.com/reader/full/voltage-flicker-assessment-in-distribution-feeders-with-large-wind-farms 36/97
Chapter 2: Flicker Evaluation, Measurement and Modeling
22 | P a g e
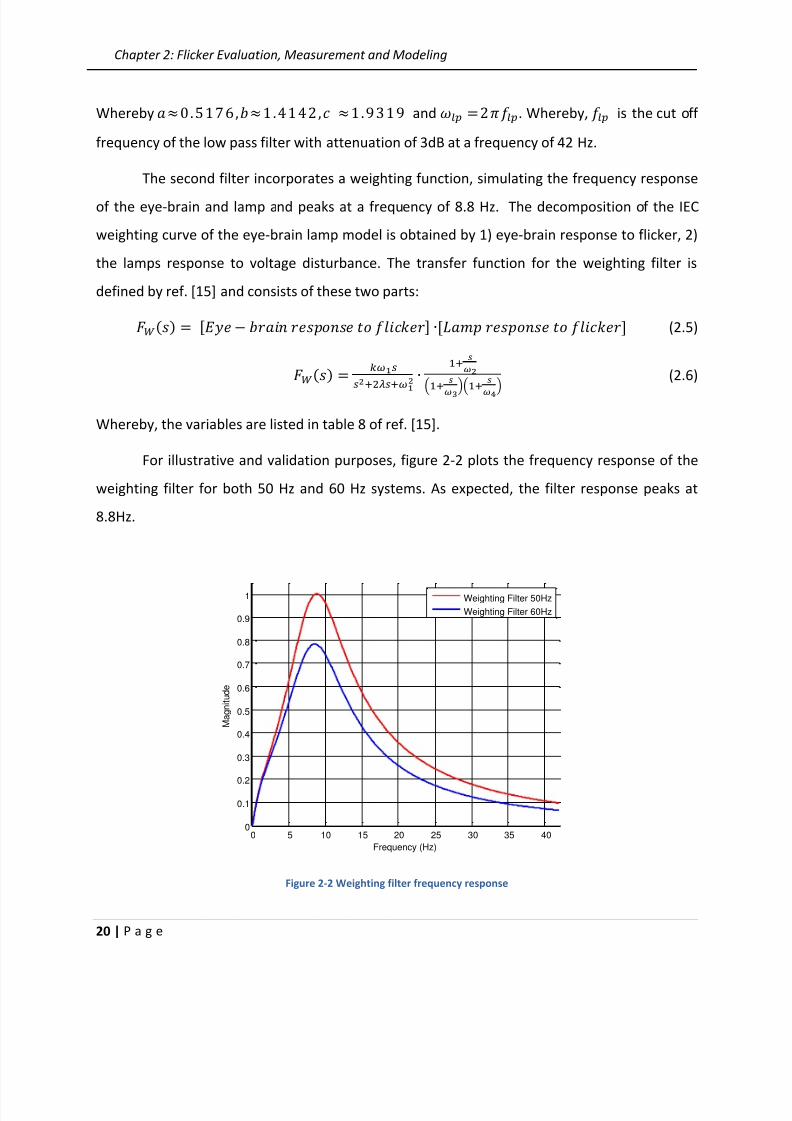
Figure 2-4 illustrates the with respect to time for the above mentioned case. As was
previously noted, there is an initial filter transient at the start of the simulation due to the long
time constants of the filters. Thus, part of the voltage signal, which includes the F lickermeter’s
filter start transients must be removed in order to yield correct measurements. The specified
warm up time determined graphically is 15 seconds.
Figure 2-4 Calibration of flicker instrument & removal of filter start transient
Block 5: Statistical analysis
The function of Block 5 is to evaluate the annoyance to the human eye produced by
fluctuations in luminous flux. This block calculates by performing a statistical classification of
IFL signal over 10 minutes. First, the IFL is classified within an adequate number of classes as
defined by [15]. From this classification, the Cumulative Distribution Function (CDF) of the IFL is
calculated. The process is visually illustrated in figure 2-5 [17].
0 5 10 15 200
2000
4000
6000
8000
Time (s)
I n s t a n t a n e o u s F l i c k e r L e v e l
IFL: With Transient, Ps t = 5.9295
0 5 10 15 200
0.5
1
1.5
Time (s)
I n s t a n t a n e o u s F l i c k e r L e v e l
IFL: Without Transient, Pst = 0.7139
0 5 10 15 200
0.5
1
1.5
2
2.5
3
3.5
4
4.5
5
Time (s)
I n s t a n t a n e o u s F l i c k e r
L e v e l
IFL: With Transient, Zoomed In
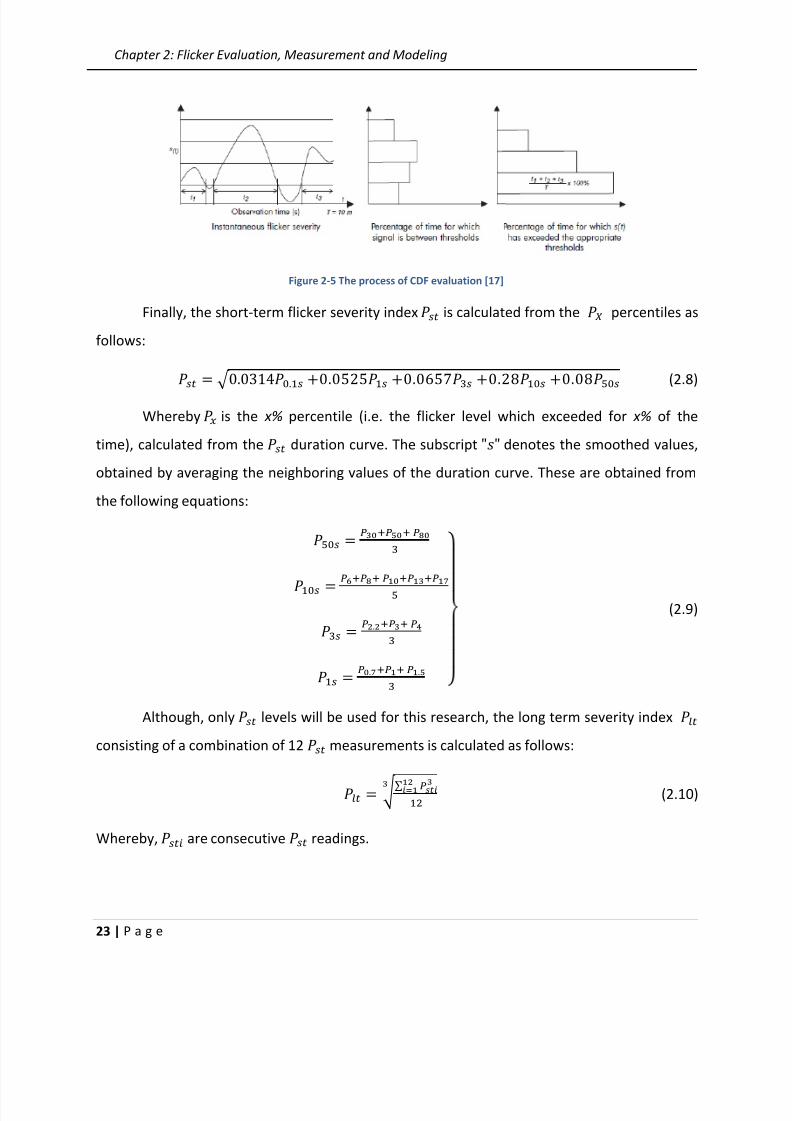
8/9/2019 Voltage Flicker Assessment in Distribution Feeders With Large Wind Farms
http://slidepdf.com/reader/full/voltage-flicker-assessment-in-distribution-feeders-with-large-wind-farms 37/97
Chapter 2: Flicker Evaluation, Measurement and Modeling
23 | P a g e
Figure 2-5 The process of CDF evaluation [17]
Finally, the short-term flicker severity index is calculated from the percentiles as
follows:
(2.8)
Whereby is the x% percentile (i.e. the flicker level which exceeded for x% of the
time), calculated from the duration curve. The subscript denotes the smoothed values,
obtained by averaging the neighboring values of the duration curve. These are obtained from
the following equations:
(2.9)
Although, only levels will be used for this research, the long term severity index
consisting of a combination of 12 measurements is calculated as follows:
∑ (2.10)
Whereby, are consecutive readings.
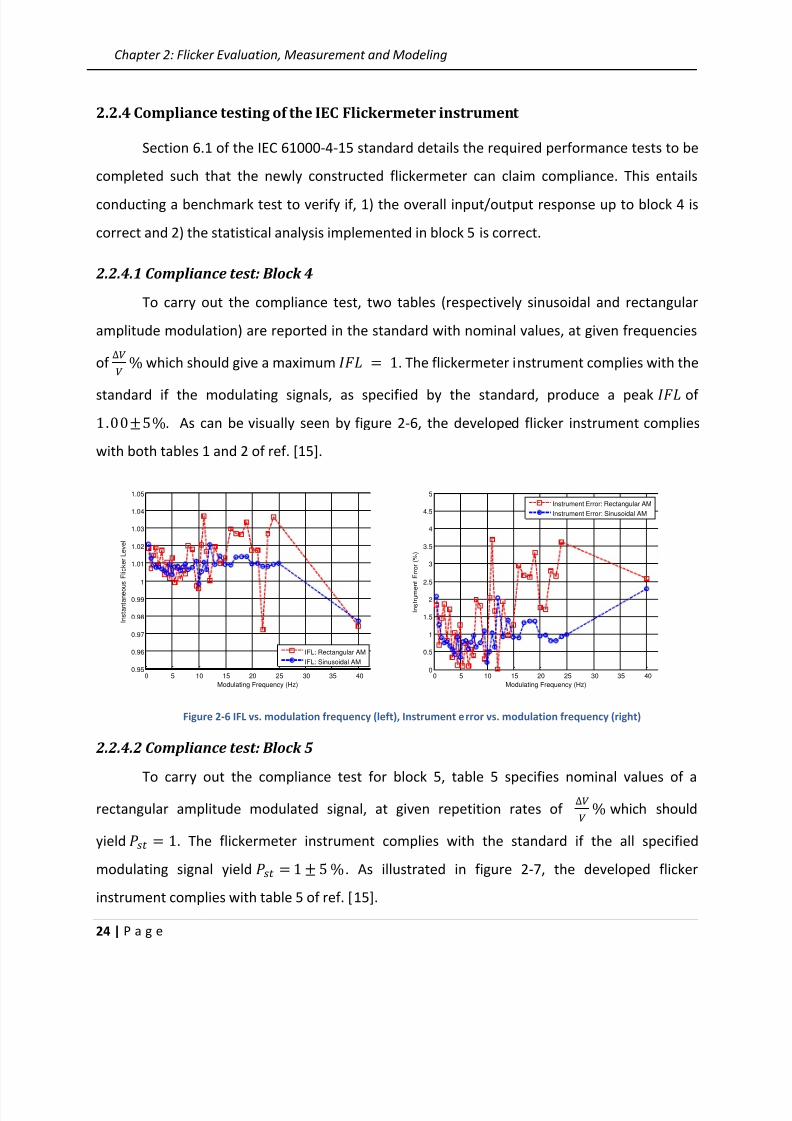
8/9/2019 Voltage Flicker Assessment in Distribution Feeders With Large Wind Farms
http://slidepdf.com/reader/full/voltage-flicker-assessment-in-distribution-feeders-with-large-wind-farms 38/97
Chapter 2: Flicker Evaluation, Measurement and Modeling
24 | P a g e
2.2.4 Compliance testing of the IEC Flickermeter instrument
Section 6.1 of the IEC 61000-4-15 standard details the required performance tests to be
completed such that the newly constructed flickermeter can claim compliance. This entails
conducting a benchmark test to verify if, 1) the overall input/output response up to block 4 is
correct and 2) the statistical analysis implemented in block 5 is correct.
2.2.4.1 Compliance test: Block 4
To carry out the compliance test, two tables (respectively sinusoidal and rectangular
amplitude modulation) are reported in the standard with nominal values, at given frequencies
of which should give a maximum . The flickermeter instrument complies with the
standard if the modulating signals, as specified by the standard, produce a peak of. As can be visually seen by figure 2-6, the developed flicker instrument complies
with both tables 1 and 2 of ref. [15].
Figure 2-6 IFL vs. modulation frequency (left), Instrument error vs. modulation frequency (right)
2.2.4.2 Compliance test: Block 5
To carry out the compliance test for block 5, table 5 specifies nominal values of a
rectangular amplitude modulated signal, at given repetition rates of which should
yield . The flickermeter instrument complies with the standard if the all specified
modulating signal yield . As illustrated in figure 2-7, the developed flicker
instrument complies with table 5 of ref. [15].
0 5 10 15 20 25 30 35 400.95
0.96
0.97
0.98
0.99
1
1.01
1.02
1.03
1.04
1.05
Modulating Frequency (Hz)
I n s t a n t a n e o u s F l i c k e r L e v e l
IFL: Rectangular AM
IFL: Sinusoidal AM
0 5 10 15 20 25 30 35 400
0.5
1
1.5
2
2.5
3
3.5
4
4.5
5
Modulating Frequency (Hz)
I n s t r u m e
n t E r r o r ( % )
Instrument Error: Rectangular AM
Instrument Error: Sinusoidal AM
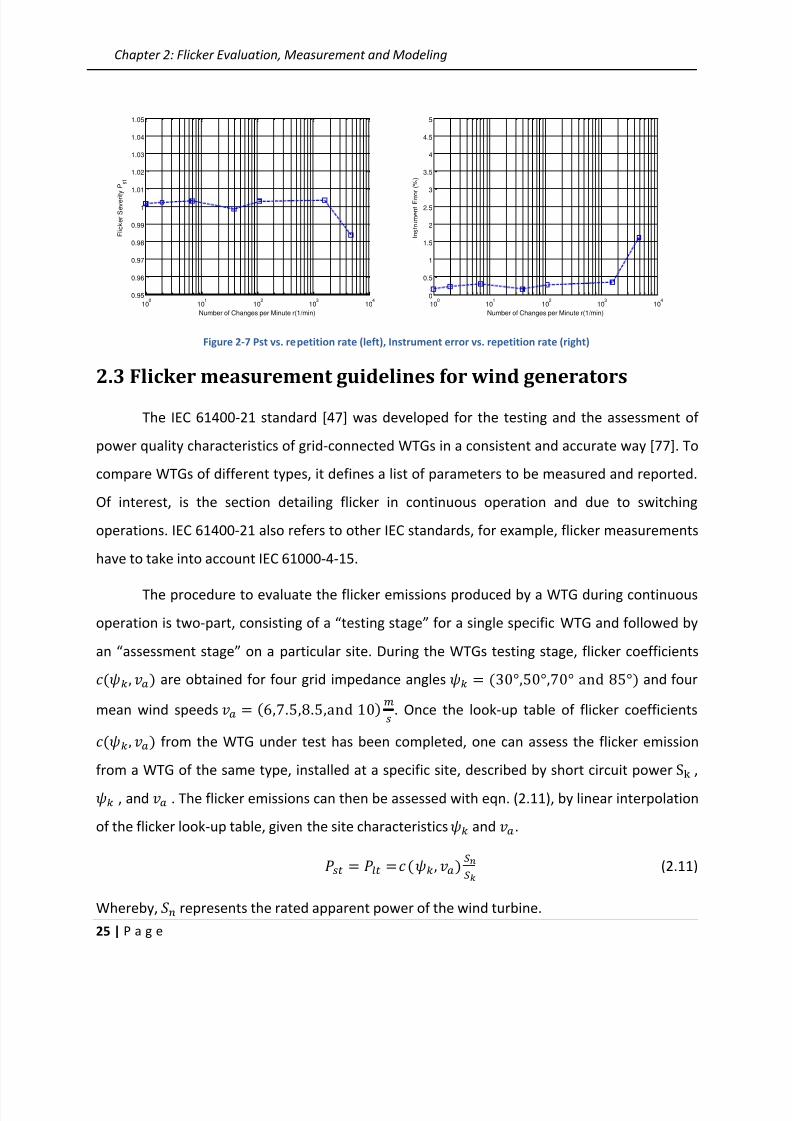
8/9/2019 Voltage Flicker Assessment in Distribution Feeders With Large Wind Farms
http://slidepdf.com/reader/full/voltage-flicker-assessment-in-distribution-feeders-with-large-wind-farms 39/97
Chapter 2: Flicker Evaluation, Measurement and Modeling
25 | P a g e
Figure 2-7 Pst vs. repetition rate (left), Instrument error vs. repetition rate (right)
2.3 Flicker measurement guidelines for wind generators
The IEC 61400-21 standard [47] was developed for the testing and the assessment of
power quality characteristics of grid-connected WTGs in a consistent and accurate way [77]. To
compare WTGs of different types, it defines a list of parameters to be measured and reported.
Of interest, is the section detailing flicker in continuous operation and due to switching
operations. IEC 61400-21 also refers to other IEC standards, for example, flicker measurements
have to take into account IEC 61000-4-15.
The procedure to evaluate the flicker emissions produced by a WTG during continuous
operation is two-part, consisting of a “testing stage” for a single specific WTG and followed by
an “assessment stage” on a particular site. During the WTGs testing stage, flicker coefficients are obtained for four grid impedance angles and four
mean wind speeds . Once the look-up table of flicker coefficients
from the WTG under test has been completed, one can assess the flicker emission
from a WTG of the same type, installed at a specific site, described by short circuit power
,
, and . The flicker emissions can then be assessed with eqn. (2.11), by linear interpolation
of the flicker look-up table, given the site characteristics and .
(2.11)
Whereby, represents the rated apparent power of the wind turbine.
100
101
102
103
104
0.95
0.96
0.97
0.98
0.99
1
1.01
1.02
1.03
1.04
1.05
Number of Changes per Minute r(1/min)
F l i c k e r S e v e r i t y P s t
100
101
102
103
104
0
0.5
1
1.5
2
2.5
3
3.5
4
4.5
5
Number of Changes per Minute r(1/min)
I n s t r u m e n t E r r o r ( % )

8/9/2019 Voltage Flicker Assessment in Distribution Feeders With Large Wind Farms
http://slidepdf.com/reader/full/voltage-flicker-assessment-in-distribution-feeders-with-large-wind-farms 40/97
Chapter 2: Flicker Evaluation, Measurement and Modeling
26 | P a g e
Moreover, the above mentioned IEC standard defines a method for assessing the flicker
emissions from a number of wind turbines based on the measurements on a single wind
turbine. The flicker emission from a wind farm can be assessed as follows:
∑ ( ) (2.12)
Whereby, corresponds to the total number of wind turbines at the PCC and
corresponds to the rated apparent power of the individual wind turbine. If all wind turbines are
identical, eqn. (2.12) equates to:
(2.13)
2.4 Summation law of flicker originating from multiple sourcesIEC 61000-3-7 [48] provides rules of thumb to consider the summation effect of flicker
emissions produced by multiple flicker sources. The resulting from several fluctuating
installations operating simultaneously can be obtained from the following expression:
∑ (2.13)
Whereby
are the individual flicker levels emitted by each of the flicker sources. The
value of the coefficient depends upon how the fluctuating load or generator is characterized.
Generally is classed into the following four categories:
o = 4: This value is used uniquely for the summation of flicker when coincident
fluctuations are very unlikely.
o = 3: This value used is when the probability of coincident voltage fluctuations are
small. The majority of the studies combining the effect of unrelated flicker sources
belong to this category.
o = 2: This value is used when there is coincident voltage fluctuations are likely to occur.
o = 1: This value must be used when there is a high probability of coincident voltage
fluctuations.

8/9/2019 Voltage Flicker Assessment in Distribution Feeders With Large Wind Farms
http://slidepdf.com/reader/full/voltage-flicker-assessment-in-distribution-feeders-with-large-wind-farms 41/97
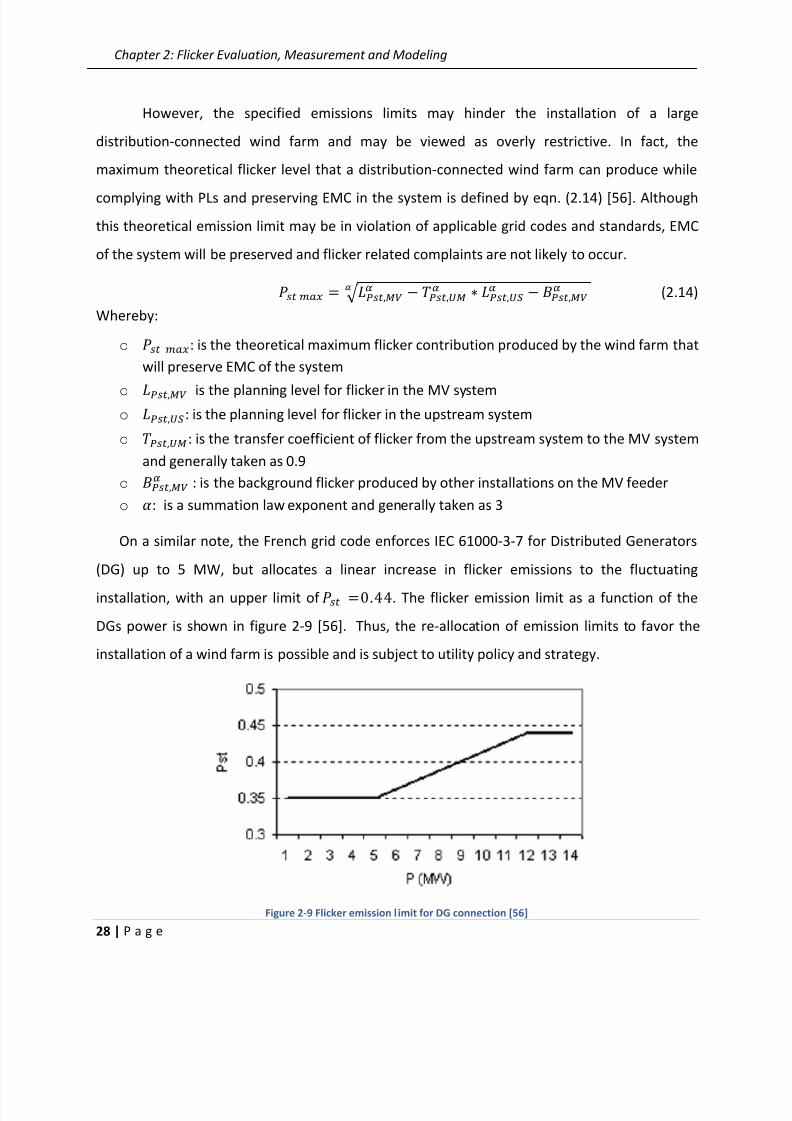
8/9/2019 Voltage Flicker Assessment in Distribution Feeders With Large Wind Farms
http://slidepdf.com/reader/full/voltage-flicker-assessment-in-distribution-feeders-with-large-wind-farms 42/97
Chapter 2: Flicker Evaluation, Measurement and Modeling
28 | P a g e
However, the specified emissions limits may hinder the installation of a large
distribution-connected wind farm and may be viewed as overly restrictive. In fact, the
maximum theoretical flicker level that a distribution-connected wind farm can produce while
complying with PLs and preserving EMC in the system is defined by eqn. (2.14) [56]. Although
this theoretical emission limit may be in violation of applicable grid codes and standards, EMC
of the system will be preserved and flicker related complaints are not likely to occur.
(2.14)
Whereby:
o : is the theoretical maximum flicker contribution produced by the wind farm that
will preserve EMC of the system
o is the planning level for flicker in the MV system o : is the planning level for flicker in the upstream system
o : is the transfer coefficient of flicker from the upstream system to the MV system
and generally taken as 0.9
o : is the background flicker produced by other installations on the MV feeder
o : is a summation law exponent and generally taken as 3
On a similar note, the French grid code enforces IEC 61000-3-7 for Distributed Generators
(DG) up to 5 MW, but allocates a linear increase in flicker emissions to the fluctuating
installation, with an upper limit of . The flicker emission limit as a function of the
DGs power is shown in figure 2-9 [56]. Thus, the re-allocation of emission limits to favor the
installation of a wind farm is possible and is subject to utility policy and strategy.
Figure 2-9 Flicker emission l imit for DG connection [56]

8/9/2019 Voltage Flicker Assessment in Distribution Feeders With Large Wind Farms
http://slidepdf.com/reader/full/voltage-flicker-assessment-in-distribution-feeders-with-large-wind-farms 43/97
Chapter 3: Flicker Oriented Modeling
29 | P a g e
Chapter 3:
Flicker Oriented Modeling3.1 Overview
The goal of this chapter is to detail the level of modeling required to conduct a flicker
study. This entails assuring that factors which influence flicker are incorporated in the modeling
such that emissions are well quantified. Both, the modeling requirements of the wind speed
model as well as the wind turbine model are discussed in this chapter.
3.2 Wind speed modeling
3.2.1 Description of the equivalent wind speed model
The modeling of the wind resource is imperative in order to simulate and obtain
representative power fluctuations produced by a wind farm. Thus, an appropriate
representation of the wind resource must be used. Typically, when performing large time scale
studies in the range of days, weeks and years, the wind is normally modeled to fit a Weibull or
Rayleigh (simplification of Weibull) distribution in order to take into account the long term
seasonal components of the wind [57]. However, when performing studies in the range of
minutes, such as in the case of a flicker study, long term components are irrelevant and only
short term wind speed fluctuations are of particular interest. These short term fluctuations are
typically described by a Power Spectral Density (PSD). Both, Von Karmon and Kaimal spectrum
models, refer to eqn. (3.1) are commonly used to simulate the stochastic behavior of the wind
[58], which are then superimposed onto a mean wind speed assumed constant on the scale of
the 10 minute flicker measurement timeframe.
(3.1)
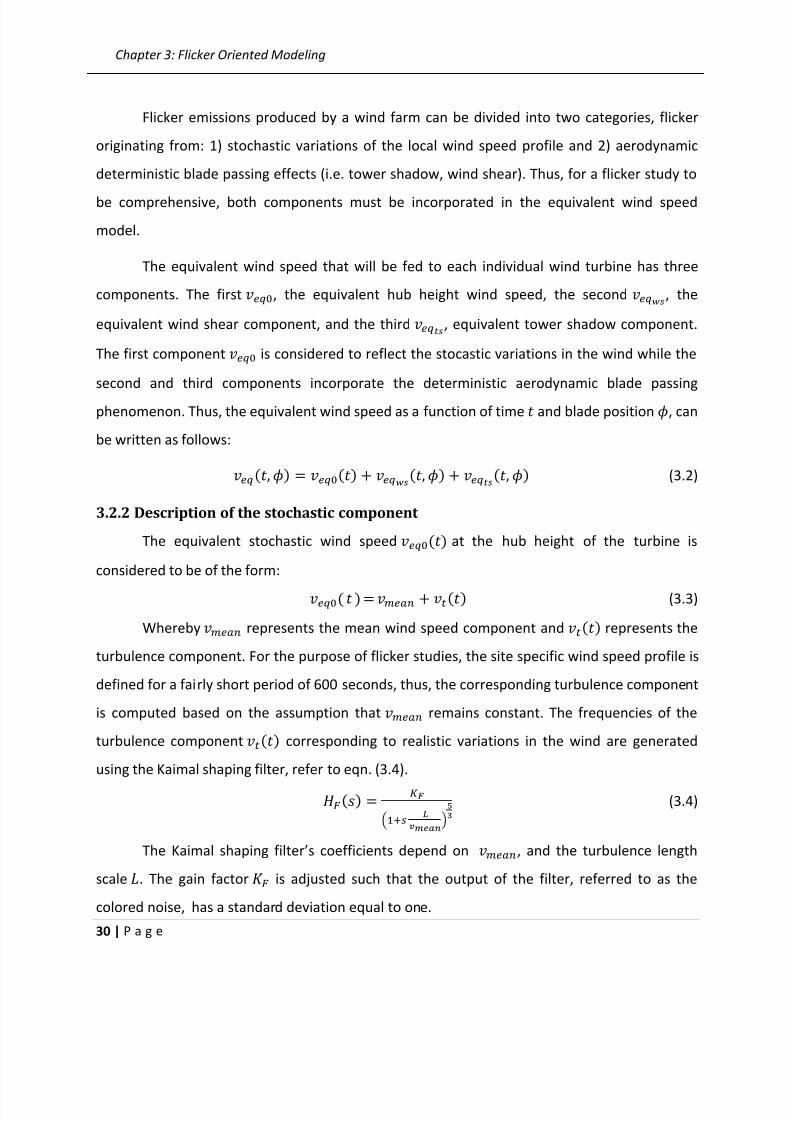
8/9/2019 Voltage Flicker Assessment in Distribution Feeders With Large Wind Farms
http://slidepdf.com/reader/full/voltage-flicker-assessment-in-distribution-feeders-with-large-wind-farms 44/97
Chapter 3: Flicker Oriented Modeling
30 | P a g e
Flicker emissions produced by a wind farm can be divided into two categories, flicker
originating from: 1) stochastic variations of the local wind speed profile and 2) aerodynamic
deterministic blade passing effects (i.e. tower shadow, wind shear). Thus, for a flicker study to
be comprehensive, both components must be incorporated in the equivalent wind speed
model.
The equivalent wind speed that will be fed to each individual wind turbine has three
components. The first , the equivalent hub height wind speed, the second , the
equivalent wind shear component, and the third , equivalent tower shadow component.
The first component is considered to reflect the stocastic variations in the wind while the
second and third components incorporate the deterministic aerodynamic blade passing
phenomenon. Thus, the equivalent wind speed as a function of time and blade position , can
be written as follows:
(3.2)
3.2.2 Description of the stochastic component
The equivalent stochastic wind speed at the hub height of the turbine is
considered to be of the form:
(3.3)
Whereby represents the mean wind speed component and represents the
turbulence component. For the purpose of flicker studies, the site specific wind speed profile is
defined for a fairly short period of 600 seconds, thus, the corresponding turbulence component
is computed based on the assumption that remains constant. The frequencies of the
turbulence component corresponding to realistic variations in the wind are generated
using the Kaimal shaping filter, refer to eqn. (3.4).
(3.4)
The Kaimal shaping filter’s coefficients depend on , and the turbulence length
scale . The gain factor is adjusted such that the output of the filter, referred to as the
colored noise, has a standard deviation equal to one.
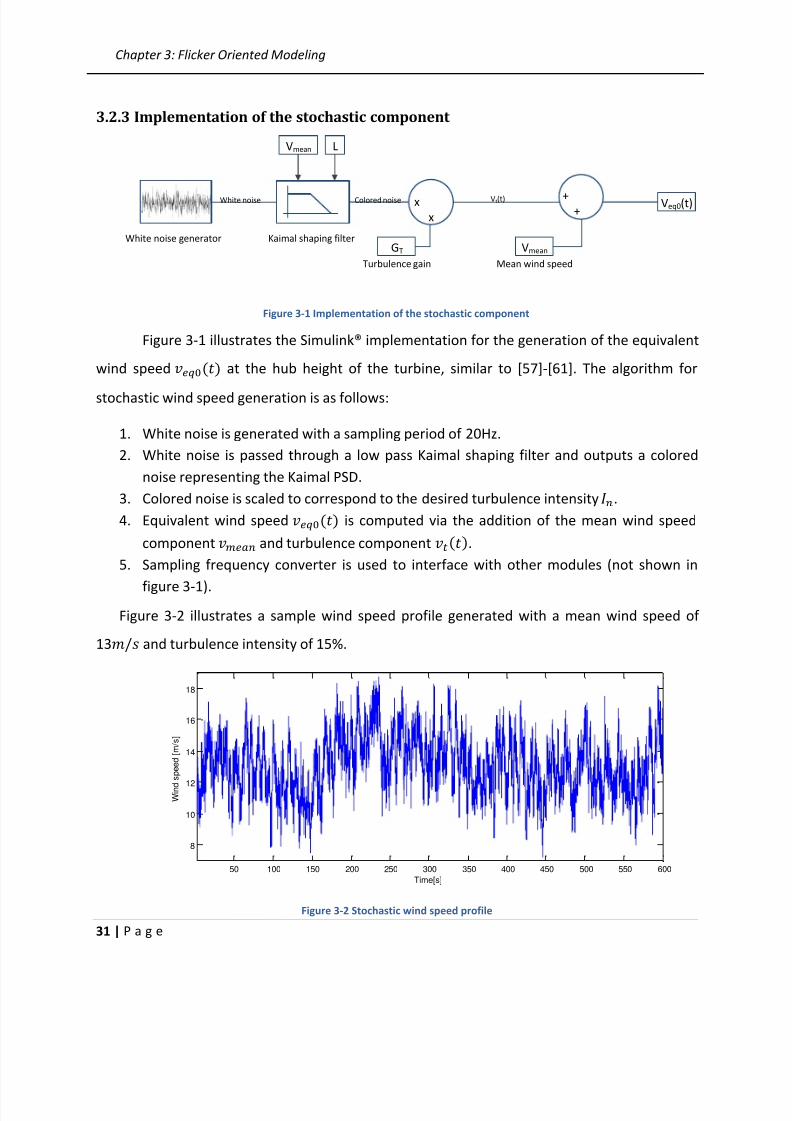
8/9/2019 Voltage Flicker Assessment in Distribution Feeders With Large Wind Farms
http://slidepdf.com/reader/full/voltage-flicker-assessment-in-distribution-feeders-with-large-wind-farms 45/97
Chapter 3: Flicker Oriented Modeling
31 | P a g e
3.2.3 Implementation of the stochastic component
Veq0(t)
L
GT
+ +
Vmean
Vmean
White noise generator Kaimal shaping filter
Mean wind speed
Vt(t)Colored noiseWhite noise
Turbulence gain
x
x
Figure 3-1 Implementation of the stochastic component
Figure 3-1 illustrates the Simulink® implementation for the generation of the equivalent
wind speed
at the hub height of the turbine, similar to [57]-[61]. The algorithm for
stochastic wind speed generation is as follows:
1. White noise is generated with a sampling period of 20Hz.
2. White noise is passed through a low pass Kaimal shaping filter and outputs a colored
noise representing the Kaimal PSD.
3. Colored noise is scaled to correspond to the desired turbulence intensity .
4. Equivalent wind speed is computed via the addition of the mean wind speed
component and turbulence component .
5. Sampling frequency converter is used to interface with other modules (not shown in
figure 3-1).
Figure 3-2 illustrates a sample wind speed profile generated with a mean wind speed of
13 and turbulence intensity of 15%.
Figure 3-2 Stochastic wind speed profile
50 100 150 200 250 300 350 400 450 500 550 600
8
10
12
14
16
18
Time[s]
W i n d
s p e e d [ m / s ]
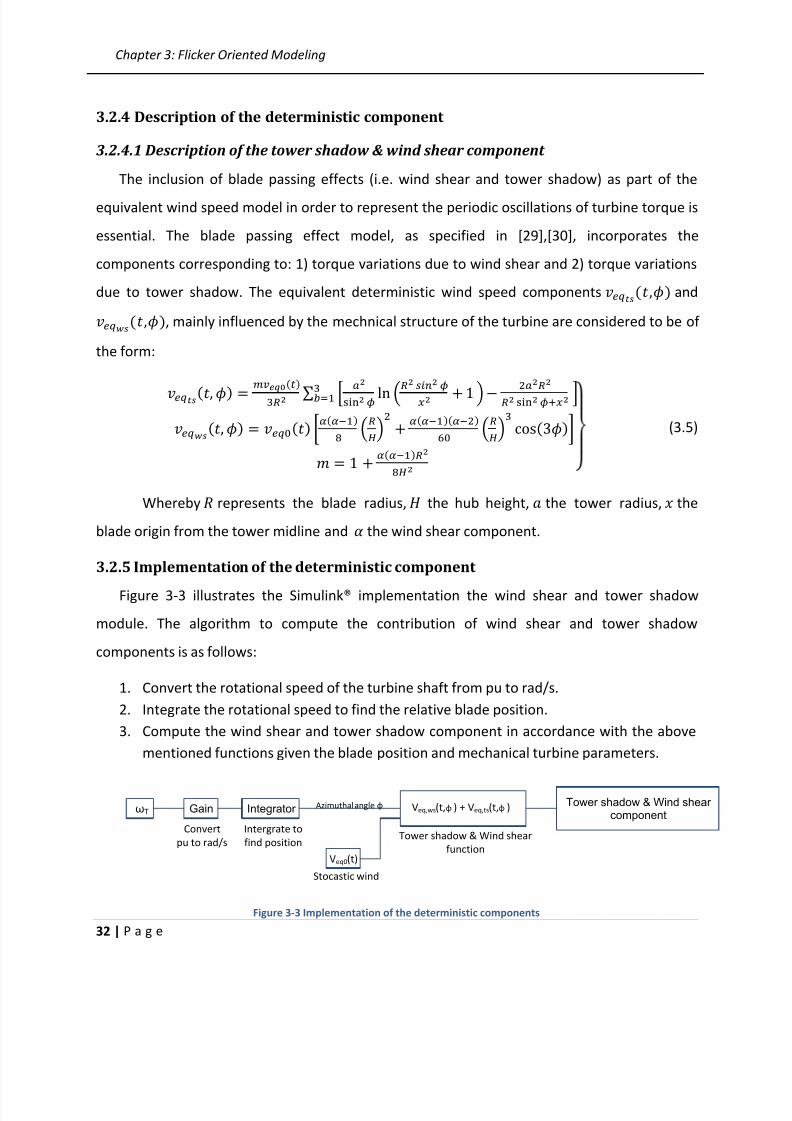
8/9/2019 Voltage Flicker Assessment in Distribution Feeders With Large Wind Farms
http://slidepdf.com/reader/full/voltage-flicker-assessment-in-distribution-feeders-with-large-wind-farms 46/97
Chapter 3: Flicker Oriented Modeling
32 | P a g e
3.2.4 Description of the deterministic component
3.2.4.1 Description of the tower shadow & wind shear component
The inclusion of blade passing effects (i.e. wind shear and tower shadow) as part of the
equivalent wind speed model in order to represent the periodic oscillations of turbine torque is
essential. The blade passing effect model, as specified in [29],[30], incorporates the
components corresponding to: 1) torque variations due to wind shear and 2) torque variations
due to tower shadow. The equivalent deterministic wind speed components and, mainly influenced by the mechnical structure of the turbine are considered to be of
the form:
∑ [ ]
(3.5)
Whereby represents the blade radius, the hub height, the tower radius, the
blade origin from the tower midline and the wind shear component.
3.2.5 Implementation of the deterministic component
Figure 3-3 illustrates the Simulink® implementation the wind shear and tower shadow
module. The algorithm to compute the contribution of wind shear and tower shadow
components is as follows:
1. Convert the rotational speed of the turbine shaft from pu to rad/s.
2. Integrate the rotational speed to find the relative blade position.
3. Compute the wind shear and tower shadow component in accordance with the above
mentioned functions given the blade position and mechanical turbine parameters.
ωT Gain Integrator Veq,ws(t,φ ) + Veq,ts(t,φ ) Tower shadow & Wind shearcomponent
Convert
pu to rad/s
Intergrate to
find positionTower shadow & Wind shear
function
Azimuthal angle φ
Veq0(t)
Stocastic wind
Figure 3-3 Implementation of the deterministic components

8/9/2019 Voltage Flicker Assessment in Distribution Feeders With Large Wind Farms
http://slidepdf.com/reader/full/voltage-flicker-assessment-in-distribution-feeders-with-large-wind-farms 47/97
Chapter 3: Flicker Oriented Modeling
33 | P a g e
As illustrated in figure 3-4, the wind shear and tower shadow components oscillate 3
times per cycle. Thus, every 120° there is a drop in the relative wind speed. Note that the tower
shadow component is much more pronounced that the negligibly small wind shear component.
Figure 3-4 Blade passing effect components
Figure 3-5 demonstrates the effective torque and power oscillations that are resultant
from a dip in wind speed 3 times per turbine shaft rotation given a fixed wind speed of 12.2 .
It is clear that this module produces oscillations at approximately 1.2 Hz which is the equivalent
3p frequency of this turbine. On another note, although the oscillations are pronounced in the
turbine torque, the converter control and large machine inertia greatly damps the resulting
fluctuations in the output power of the turbine.
Figure 3-5 Resulting torque and power fluctuations
50 100 150 200 250 300 350
-14
-12
-10
-8
-6
-4
-2
0
2
Azimuthal angle [degrees]
B l a d e p a s s i n g e f f e c t c o m p o n e n t [ % ]
Tower shadow
Wind shear
Tower shadow + Wind shear
95 95.5 96 96.5 97 97.5 98 98.5 99 99.5 1000.5
0.6
0.7
0.8
0.9
1
Time[s]
R e s u l t i n g t o r q u e [ p u ] a n d p o w e r [ p u ]
Torque oscillations
Power oscillations
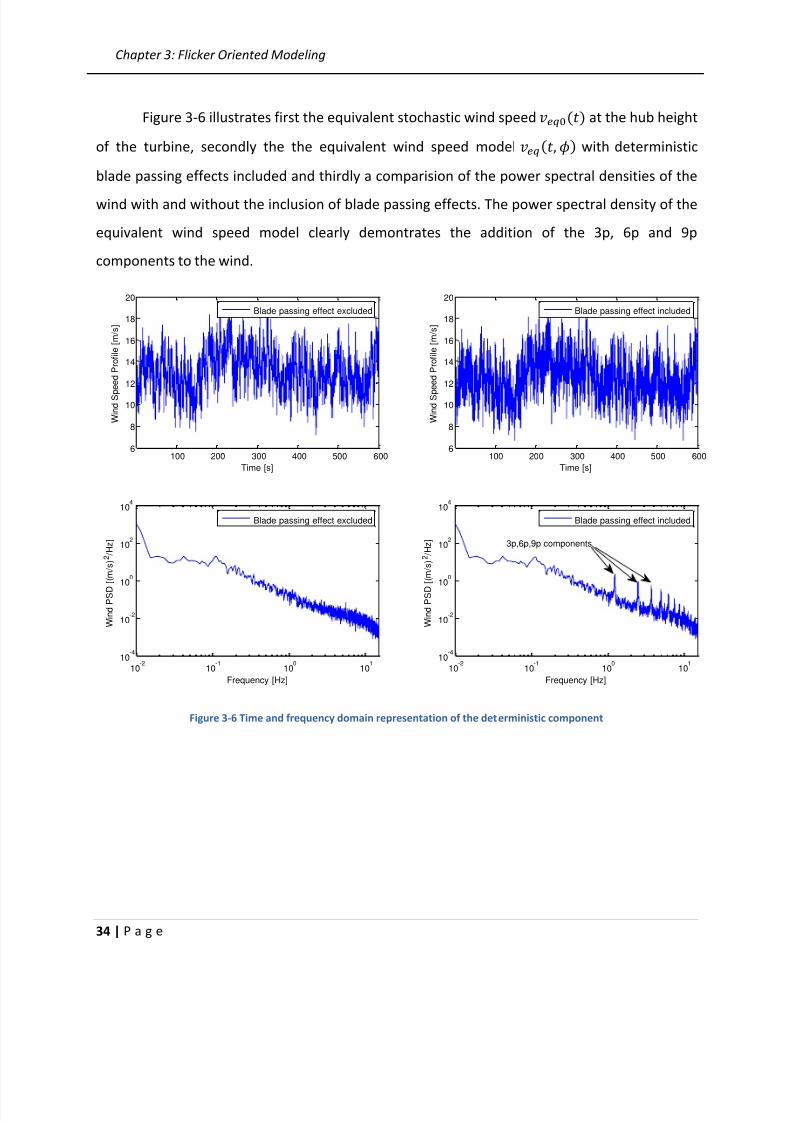
8/9/2019 Voltage Flicker Assessment in Distribution Feeders With Large Wind Farms
http://slidepdf.com/reader/full/voltage-flicker-assessment-in-distribution-feeders-with-large-wind-farms 48/97
Chapter 3: Flicker Oriented Modeling
34 | P a g e
Figure 3-6 illustrates first the equivalent stochastic wind speed at the hub height
of the turbine, secondly the the equivalent wind speed model with deterministic
blade passing effects included and thirdly a comparision of the power spectral densities of the
wind with and without the inclusion of blade passing effects. The power spectral density of the
equivalent wind speed model clearly demontrates the addition of the 3p, 6p and 9p
components to the wind.
Figure 3-6 Time and frequency domain representation of the deterministic component
100 200 300 400 500 6006
8
10
12
14
16
18
20
Time [s]
W i n d S p
e e d P r o f i l e [ m / s ]
100 200 300 400 500 600
6
8
10
12
14
16
18
20
Time [s]
W i n d S p
e e d P r o f i l e [ m / s ]
10-2
10-1
100
101
10-4
10-2
100
102
104
Frequency [Hz]
W i n d P S D
[ ( m / s ) 2 / H z ]
10
-210
-110
010
110
-4
10-2
100
102
104
Frequency [Hz]
W i n d P S D
[ ( m / s ) 2 / H z ]
Blade passing effect excluded
Blade passing effect excluded
Blade passing effect included
Blade passing effect included
3p,6p,9p components
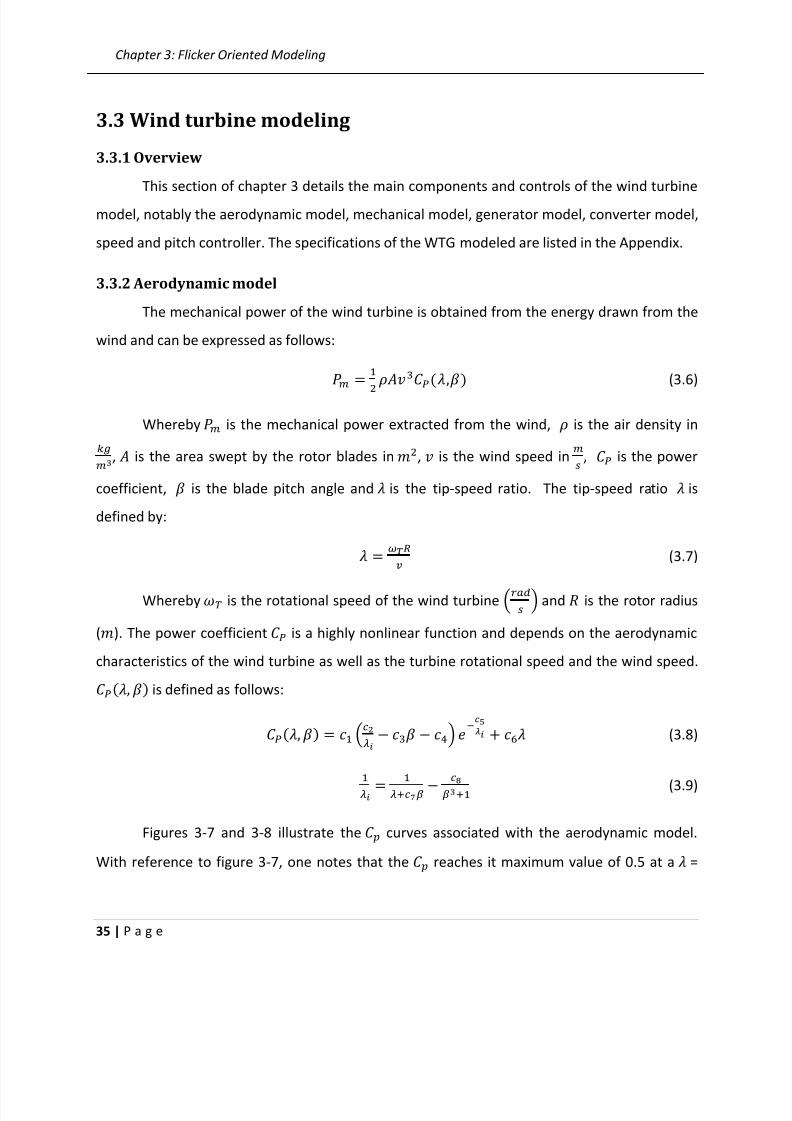
8/9/2019 Voltage Flicker Assessment in Distribution Feeders With Large Wind Farms
http://slidepdf.com/reader/full/voltage-flicker-assessment-in-distribution-feeders-with-large-wind-farms 49/97
Chapter 3: Flicker Oriented Modeling
35 | P a g e
3.3 Wind turbine modeling
3.3.1 Overview
This section of chapter 3 details the main components and controls of the wind turbine
model, notably the aerodynamic model, mechanical model, generator model, converter model,
speed and pitch controller. The specifications of the WTG modeled are listed in the Appendix.
3.3.2 Aerodynamic model
The mechanical power of the wind turbine is obtained from the energy drawn from the
wind and can be expressed as follows:
(3.6)
Whereby is the mechanical power extracted from the wind, is the air density in
, is the area swept by the rotor blades in , is the wind speed in , is the power
coefficient, is the blade pitch angle and is the tip-speed ratio. The tip-speed ratio is
defined by:
(3.7)
Whereby is the rotational speed of the wind turbine and is the rotor radius
(). The power coefficient is a highly nonlinear function and depends on the aerodynamic
characteristics of the wind turbine as well as the turbine rotational speed and the wind speed. is defined as follows:
(3.8)
(3.9)
Figures 3-7 and 3-8 illustrate the curves associated with the aerodynamic model.
With reference to figure 3-7, one notes that the reaches it maximum value of 0.5 at a =
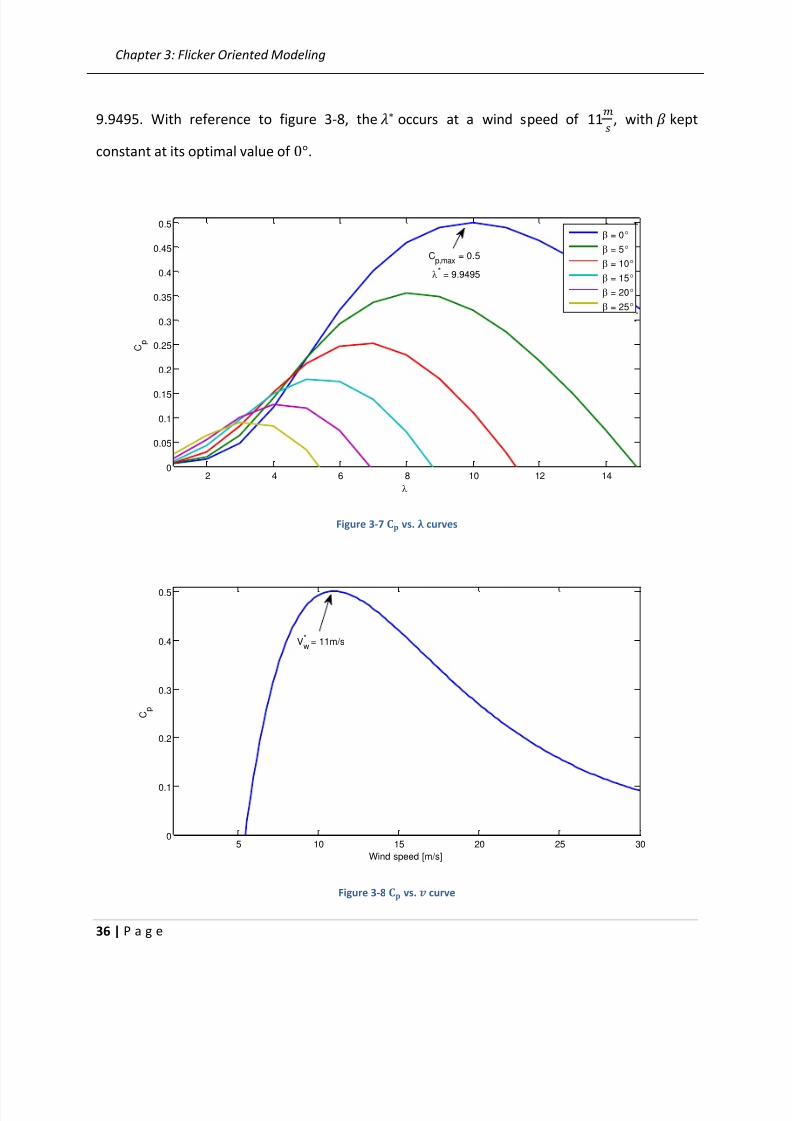
8/9/2019 Voltage Flicker Assessment in Distribution Feeders With Large Wind Farms
http://slidepdf.com/reader/full/voltage-flicker-assessment-in-distribution-feeders-with-large-wind-farms 50/97
Chapter 3: Flicker Oriented Modeling
36 | P a g e
9.9495. With reference to figure 3-8, the occurs at a wind speed of 11 , with kept
constant at its optimal value of .
Figure 3-7 vs. curves
Figure 3-8 vs. curve
2 4 6 8 10 12 140
0.05
0.1
0.15
0.2
0.25
0.3
0.35
0.4
0.45
0.5
C p
= 0
= 5
= 10
= 15
= 20
= 25
Cp,max
= 0.5
* = 9.9495
5 10 15 20 25 300
0.1
0.2
0.3
0.4
0.5
Wind speed [m/s]
C p
Vw* = 11m/s
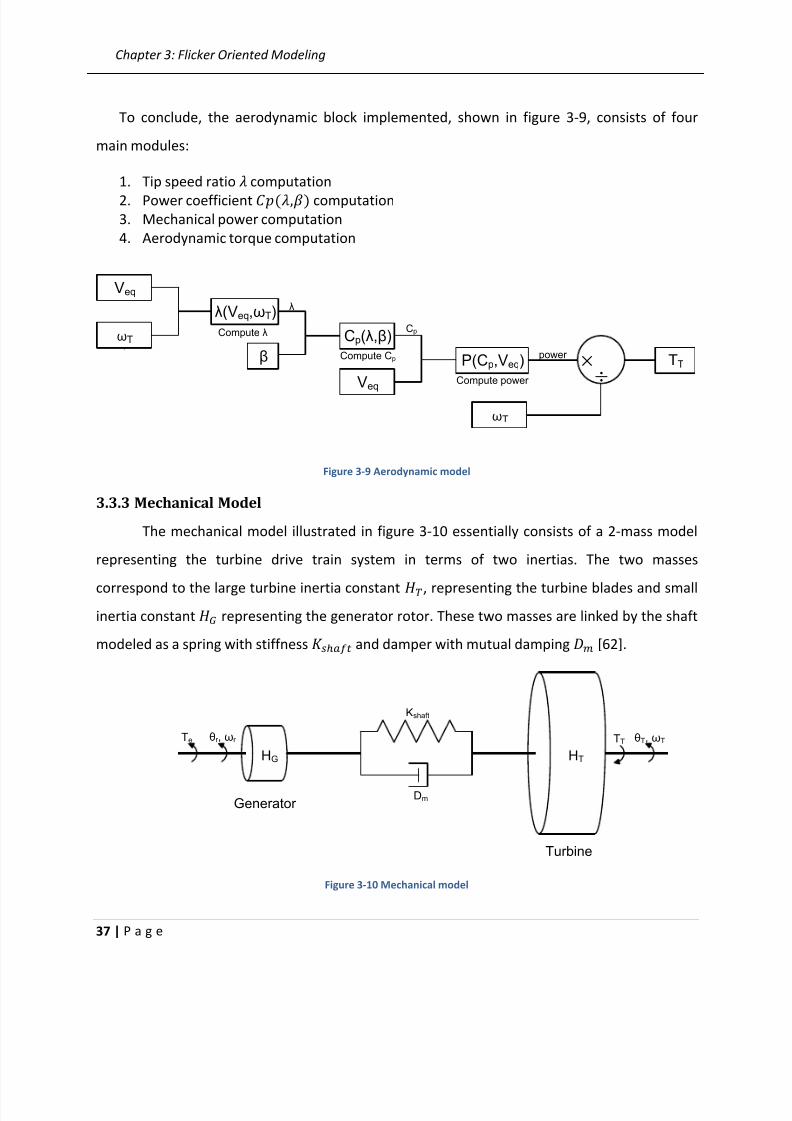
8/9/2019 Voltage Flicker Assessment in Distribution Feeders With Large Wind Farms
http://slidepdf.com/reader/full/voltage-flicker-assessment-in-distribution-feeders-with-large-wind-farms 51/97
Chapter 3: Flicker Oriented Modeling
37 | P a g e
To conclude, the aerodynamic block implemented, shown in figure 3-9, consists of four
main modules:
1. Tip speed ratio
computation
2.
Power coefficient computation3. Mechanical power computation
4. Aerodynamic torque computation
Veq
ωT
λ(Veq,ωT)
β
Cp(λ,β)
P(Cp,Veq)
TT
λ
Cp
power
Compute λ
Compute Cp
Compute power Veq
ωT
Figure 3-9 Aerodynamic model
3.3.3 Mechanical Model
The mechanical model illustrated in figure 3-10 essentially consists of a 2-mass model
representing the turbine drive train system in terms of two inertias. The two masses
correspond to the large turbine inertia constant , representing the turbine blades and small
inertia constant representing the generator rotor. These two masses are linked by the shaft
modeled as a spring with stiffness and damper with mutual damping [62].
Te θr , ωr θT, ωTTT
HTHG
Kshaft
DmGenerator
Turbine
Figure 3-10 Mechanical model
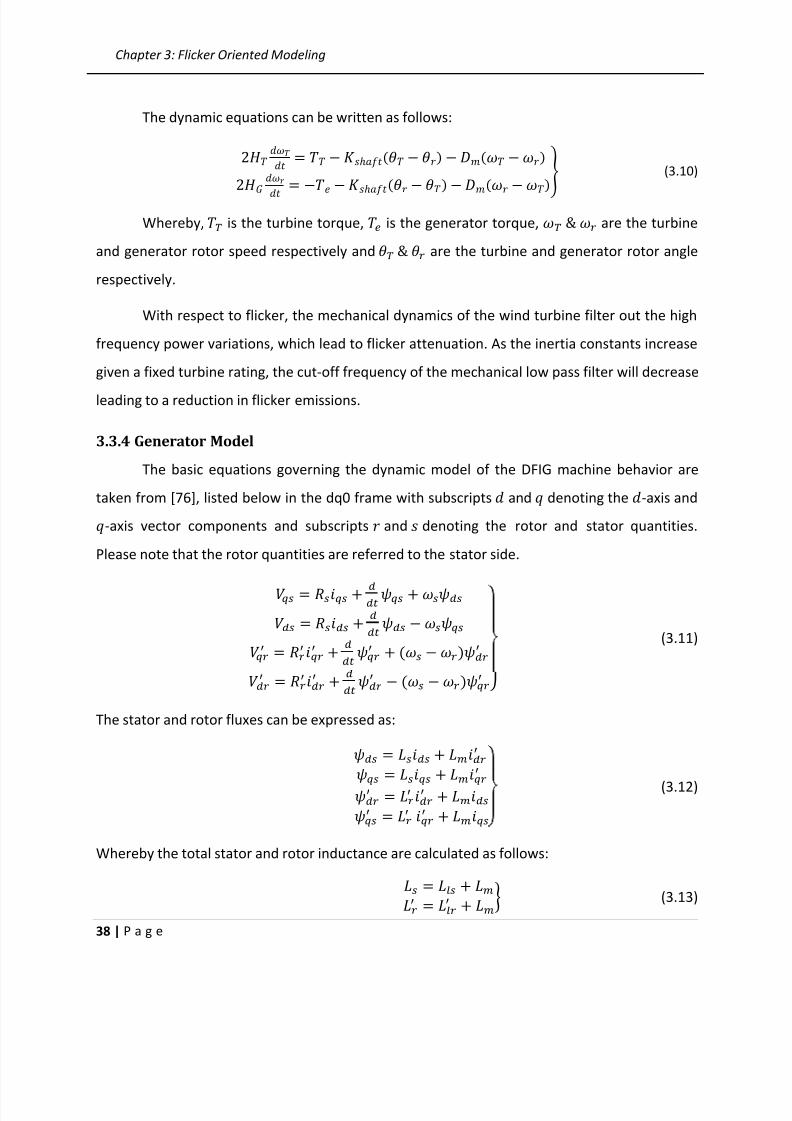
8/9/2019 Voltage Flicker Assessment in Distribution Feeders With Large Wind Farms
http://slidepdf.com/reader/full/voltage-flicker-assessment-in-distribution-feeders-with-large-wind-farms 52/97
Chapter 3: Flicker Oriented Modeling
38 | P a g e
The dynamic equations can be written as follows:
(3.10)
Whereby, is the turbine torque, is the generator torque, are the turbine
and generator rotor speed respectively and are the turbine and generator rotor angle
respectively.
With respect to flicker, the mechanical dynamics of the wind turbine filter out the high
frequency power variations, which lead to flicker attenuation. As the inertia constants increase
given a fixed turbine rating, the cut-off frequency of the mechanical low pass filter will decrease
leading to a reduction in flicker emissions.
3.3.4 Generator Model
The basic equations governing the dynamic model of the DFIG machine behavior are
taken from [76], listed below in the dq0 frame with subscripts and denoting the -axis and-axis vector components and subscripts and denoting the rotor and stator quantities.
Please note that the rotor quantities are referred to the stator side.
}
(3.11)
The stator and rotor fluxes can be expressed as:
(3.12)
Whereby the total stator and rotor inductance are calculated as follows:
(3.13)
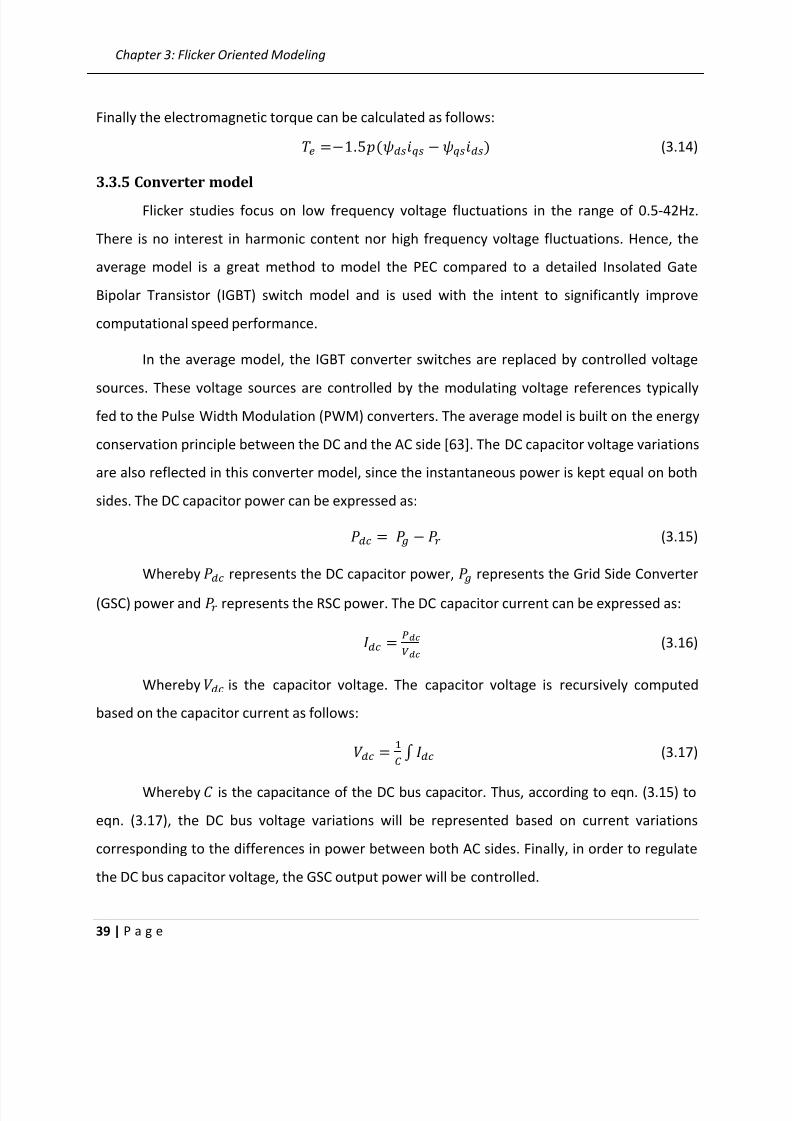
8/9/2019 Voltage Flicker Assessment in Distribution Feeders With Large Wind Farms
http://slidepdf.com/reader/full/voltage-flicker-assessment-in-distribution-feeders-with-large-wind-farms 53/97
Chapter 3: Flicker Oriented Modeling
39 | P a g e
Finally the electromagnetic torque can be calculated as follows: (3.14)
3.3.5 Converter model
Flicker studies focus on low frequency voltage fluctuations in the range of 0.5-42Hz.
There is no interest in harmonic content nor high frequency voltage fluctuations. Hence, the
average model is a great method to model the PEC compared to a detailed Insolated Gate
Bipolar Transistor (IGBT) switch model and is used with the intent to significantly improve
computational speed performance.
In the average model, the IGBT converter switches are replaced by controlled voltage
sources. These voltage sources are controlled by the modulating voltage references typicallyfed to the Pulse Width Modulation (PWM) converters. The average model is built on the energy
conservation principle between the DC and the AC side [63]. The DC capacitor voltage variations
are also reflected in this converter model, since the instantaneous power is kept equal on both
sides. The DC capacitor power can be expressed as:
(3.15)
Whereby
represents the DC capacitor power,
represents the Grid Side Converter
(GSC) power and represents the RSC power. The DC capacitor current can be expressed as:
(3.16)
Whereby is the capacitor voltage. The capacitor voltage is recursively computed
based on the capacitor current as follows:
∫ (3.17)
Whereby is the capacitance of the DC bus capacitor. Thus, according to eqn. (3.15) to
eqn. (3.17), the DC bus voltage variations will be represented based on current variations
corresponding to the differences in power between both AC sides. Finally, in order to regulate
the DC bus capacitor voltage, the GSC output power will be controlled.
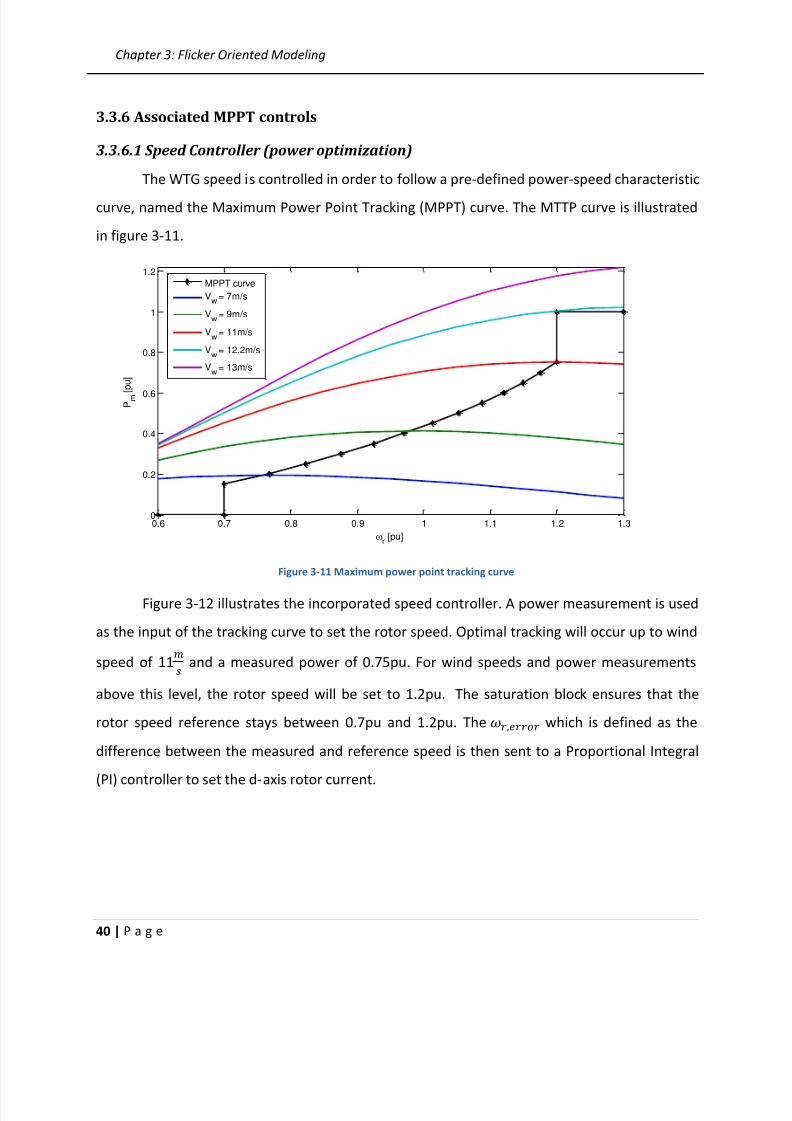
8/9/2019 Voltage Flicker Assessment in Distribution Feeders With Large Wind Farms
http://slidepdf.com/reader/full/voltage-flicker-assessment-in-distribution-feeders-with-large-wind-farms 54/97
Chapter 3: Flicker Oriented Modeling
40 | P a g e
3.3.6 Associated MPPT controls
3.3.6.1 Speed Controller (power optimization)
The WTG speed is controlled in order to follow a pre-defined power-speed characteristic
curve, named the Maximum Power Point Tracking (MPPT) curve. The MTTP curve is illustrated
in figure 3-11.
Figure 3-11 Maximum power point tracking curve
Figure 3-12 illustrates the incorporated speed controller. A power measurement is used
as the input of the tracking curve to set the rotor speed. Optimal tracking will occur up to wind
speed of 11 and a measured power of 0.75pu. For wind speeds and power measurements
above this level, the rotor speed will be set to 1.2pu. The saturation block ensures that the
rotor speed reference stays between 0.7pu and 1.2pu. The which is defined as the
difference between the measured and reference speed is then sent to a Proportional Integral
(PI) controller to set the d-axis rotor current.
0.6 0.7 0.8 0.9 1 1.1 1.2 1.30
0.2
0.4
0.6
0.8
1
1.2
r [pu]
P m
[ p u ]
MPPT curve
Vw
= 7m/s
Vw
= 9m/s
Vw
= 11m/s
Vw
= 12.2m/s
Vw
= 13m/s
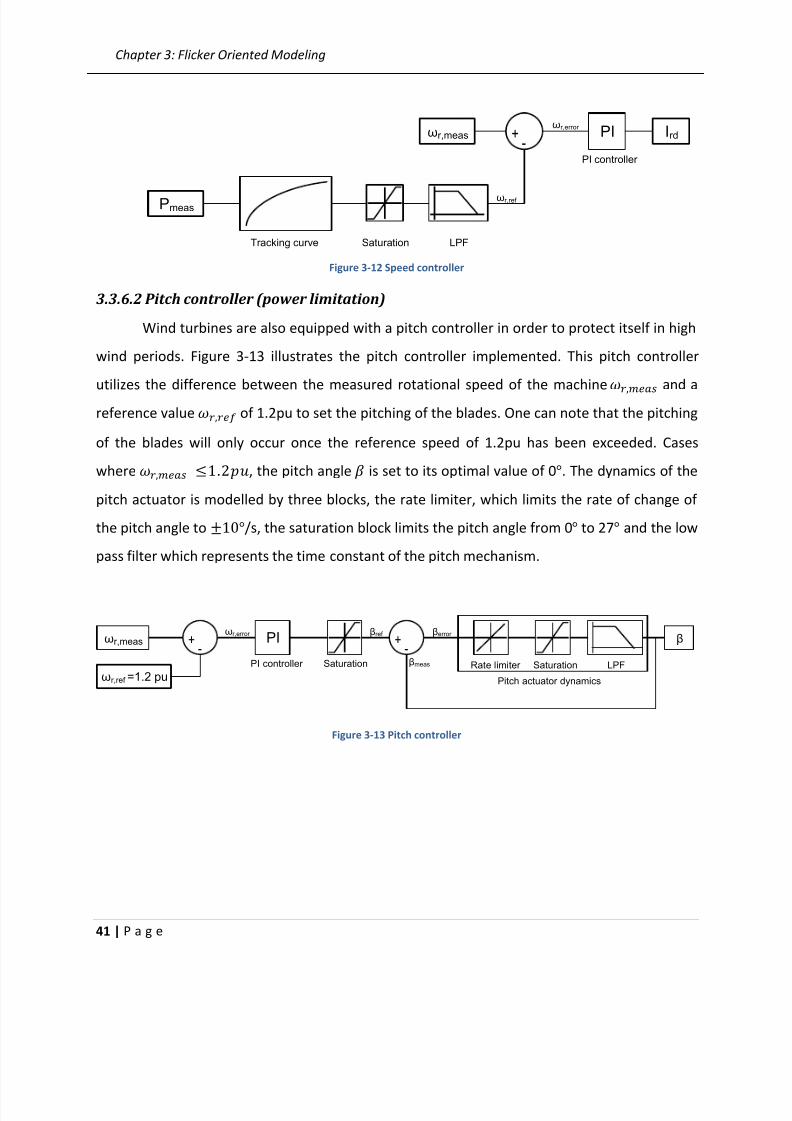
8/9/2019 Voltage Flicker Assessment in Distribution Feeders With Large Wind Farms
http://slidepdf.com/reader/full/voltage-flicker-assessment-in-distribution-feeders-with-large-wind-farms 55/97
Chapter 3: Flicker Oriented Modeling
41 | P a g e
Pmeas
+ -
PI Irdωr,meas
Tracking curve Saturation LPF
ωr,ref
PI controller
ωr,error
Figure 3-12 Speed controller
3.3.6.2 Pitch controller (power limitation)
Wind turbines are also equipped with a pitch controller in order to protect itself in high
wind periods. Figure 3-13 illustrates the pitch controller implemented. This pitch controller
utilizes the difference between the measured rotational speed of the machine
and a
reference value of 1.2pu to set the pitching of the blades. One can note that the pitching
of the blades will only occur once the reference speed of 1.2pu has been exceeded. Cases
where , the pitch angle is set to its optimal value of 0. The dynamics of the
pitch actuator is modelled by three blocks, the rate limiter, which limits the rate of change of
the pitch angle to /s, the saturation block limits the pitch angle from 0 to 27 and the low
pass filter which represents the time constant of the pitch mechanism.
ωr,meas
ωr,ref =1.2 pu
+ -
ωr,error PI
PI controller
β
+ -
βref
Pitch actuator dynamics
Saturation SaturationRate limiter LPF
βerror
βmeas
Figure 3-13 Pitch controller

8/9/2019 Voltage Flicker Assessment in Distribution Feeders With Large Wind Farms
http://slidepdf.com/reader/full/voltage-flicker-assessment-in-distribution-feeders-with-large-wind-farms 56/97
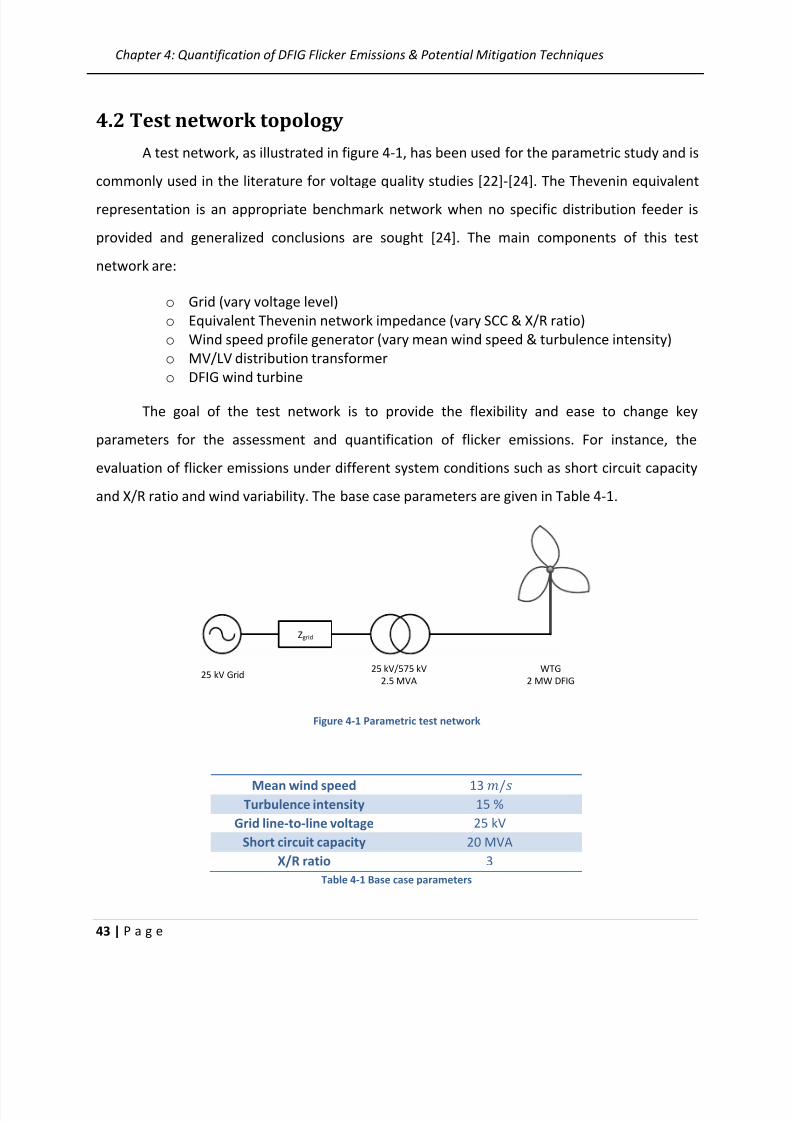
8/9/2019 Voltage Flicker Assessment in Distribution Feeders With Large Wind Farms
http://slidepdf.com/reader/full/voltage-flicker-assessment-in-distribution-feeders-with-large-wind-farms 57/97
Chapter 4: Quantification of DFIG Flicker Emissions & Potential Mitigation Techniques
43 | P a g e
4.2 Test network topology
A test network, as illustrated in figure 4-1, has been used for the parametric study and is
commonly used in the literature for voltage quality studies [22]-[24]. The Thevenin equivalent
representation is an appropriate benchmark network when no specific distribution feeder is
provided and generalized conclusions are sought [24]. The main components of this test
network are:
o Grid (vary voltage level)
o Equivalent Thevenin network impedance (vary SCC & X/R ratio)
o Wind speed profile generator (vary mean wind speed & turbulence intensity)
o MV/LV distribution transformer
o DFIG wind turbine
The goal of the test network is to provide the flexibility and ease to change key
parameters for the assessment and quantification of flicker emissions. For instance, the
evaluation of flicker emissions under different system conditions such as short circuit capacity
and X/R ratio and wind variability. The base case parameters are given in Table 4-1.
25 kV Grid25 kV/575 kV
2.5 MVA
Zgrid
WTG
2 MW DFIG
Figure 4-1 Parametric test network
Mean wind speed 13 Turbulence intensity 15 %
Grid line-to-line voltage 25 kV
Short circuit capacity 20 MVA
X/R ratio 3
Table 4-1 Base case parameters
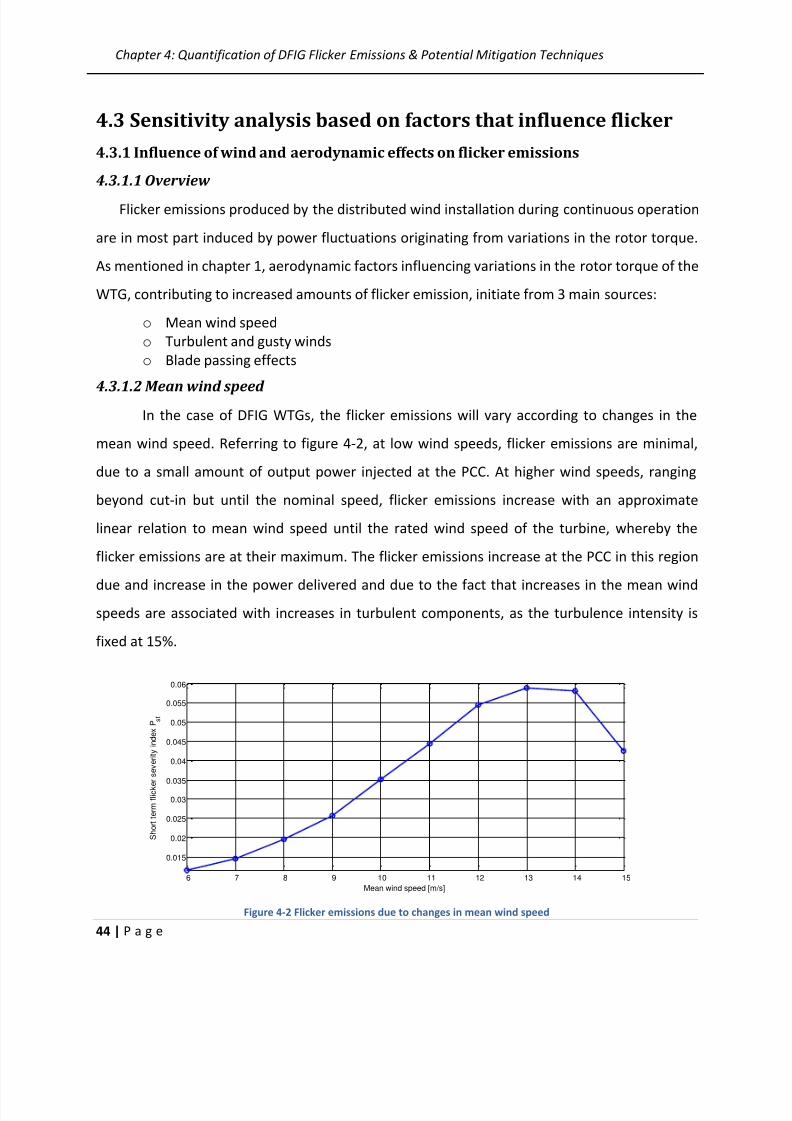
8/9/2019 Voltage Flicker Assessment in Distribution Feeders With Large Wind Farms
http://slidepdf.com/reader/full/voltage-flicker-assessment-in-distribution-feeders-with-large-wind-farms 58/97
Chapter 4: Quantification of DFIG Flicker Emissions & Potential Mitigation Techniques
44 | P a g e
4.3 Sensitivity analysis based on factors that influence flicker
4.3.1 Influence of wind and aerodynamic effects on flicker emissions
4.3.1.1 Overview
Flicker emissions produced by the distributed wind installation during continuous operation
are in most part induced by power fluctuations originating from variations in the rotor torque.
As mentioned in chapter 1, aerodynamic factors influencing variations in the rotor torque of the
WTG, contributing to increased amounts of flicker emission, initiate from 3 main sources:
o Mean wind speed
o Turbulent and gusty winds
o Blade passing effects
4.3.1.2 Mean wind speedIn the case of DFIG WTGs, the flicker emissions will vary according to changes in the
mean wind speed. Referring to figure 4-2, at low wind speeds, flicker emissions are minimal,
due to a small amount of output power injected at the PCC. At higher wind speeds, ranging
beyond cut-in but until the nominal speed, flicker emissions increase with an approximate
linear relation to mean wind speed until the rated wind speed of the turbine, whereby the
flicker emissions are at their maximum. The flicker emissions increase at the PCC in this region
due and increase in the power delivered and due to the fact that increases in the mean wind
speeds are associated with increases in turbulent components, as the turbulence intensity is
fixed at 15%.
Figure 4-2 Flicker emissions due to changes in mean wind speed
6 7 8 9 10 11 12 13 14 15
0.015
0.02
0.025
0.03
0.035
0.04
0.045
0.05
0.055
0.06
Mean wind speed [m/s]
S h o r t t e r m f l i c k e
r s e v e r i t y i n d e x P s t
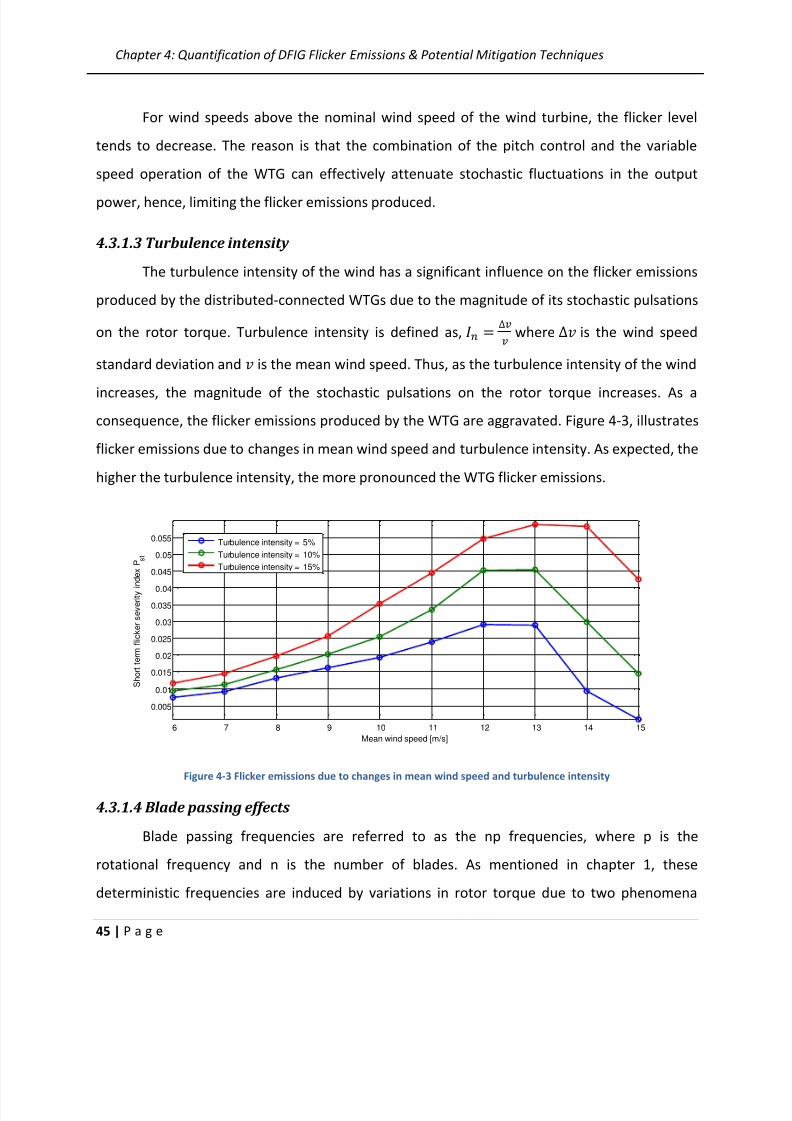
8/9/2019 Voltage Flicker Assessment in Distribution Feeders With Large Wind Farms
http://slidepdf.com/reader/full/voltage-flicker-assessment-in-distribution-feeders-with-large-wind-farms 59/97
Chapter 4: Quantification of DFIG Flicker Emissions & Potential Mitigation Techniques
45 | P a g e
For wind speeds above the nominal wind speed of the wind turbine, the flicker level
tends to decrease. The reason is that the combination of the pitch control and the variable
speed operation of the WTG can effectively attenuate stochastic fluctuations in the output
power, hence, limiting the flicker emissions produced.
4.3.1.3 Turbulence intensity
The turbulence intensity of the wind has a significant influence on the flicker emissions
produced by the distributed-connected WTGs due to the magnitude of its stochastic pulsations
on the rotor torque. Turbulence intensity is defined as, where is the wind speed
standard deviation and
is the mean wind speed. Thus, as the turbulence intensity of the wind
increases, the magnitude of the stochastic pulsations on the rotor torque increases. As a
consequence, the flicker emissions produced by the WTG are aggravated. Figure 4-3, illustrates
flicker emissions due to changes in mean wind speed and turbulence intensity. As expected, the
higher the turbulence intensity, the more pronounced the WTG flicker emissions.
Figure 4-3 Flicker emissions due to changes in mean wind speed and turbulence intensity
4.3.1.4 Blade passing effects
Blade passing frequencies are referred to as the np frequencies, where p is the
rotational frequency and n is the number of blades. As mentioned in chapter 1, these
deterministic frequencies are induced by variations in rotor torque due to two phenomena
6 7 8 9 10 11 12 13 14 15
0.005
0.01
0.015
0.02
0.025
0.03
0.035
0.04
0.045
0.05
0.055
Mean wind speed [m/s]
S h o r t t e r m f l i c k e r s e v e r i t y i n d e x P
s t
Turbulence intensity = 5%
Turbulence intensity = 10%
Turbulence intensity = 15%

8/9/2019 Voltage Flicker Assessment in Distribution Feeders With Large Wind Farms
http://slidepdf.com/reader/full/voltage-flicker-assessment-in-distribution-feeders-with-large-wind-farms 60/97
Chapter 4: Quantification of DFIG Flicker Emissions & Potential Mitigation Techniques
46 | P a g e
known as wind shear and tower shadow. Consequently, these 3p frequencies result in the
addition of periodic components to the feeder’s voltage at the PCC of the WTG and contribute
to the total flicker level. Figure 4-4 illustrates the contribution of flicker emissions, with and
without blade passing effects over a range of wind speeds. Flicker emissions originating from
blade passing effects account for roughly 10% to 15% of the total flicker level produced by the
WTG.
Figure 4-4 Flicker emissions due to changes in mean wind speed and the inclusion of deterministic blade passing effects
4.3.1.5 Mode of operation
The wind turbine has two main modes of operation: 1) power optimization mode and 2)
power limitation mode. It would be interesting to assess flicker emissions from the turbines
mode of operation and thus the IFL measurement is deemed to be more appropriate for this
test. With reference to figure 4-5 once can note that in the power limitation mode, the IFL is
greatly reduced. Also, one can note that gust components, characterized by rapid changes in
wind speed generate spikes in the IFL chart.
6 7 8 9 10 11 12 13 14 15
0.015
0.02
0.025
0.03
0.035
0.04
0.045
0.05
0.055
0.06
Mean wind speed [m/s]
S h o r t t e r m f l i c k e r
s e v e r i t y i n d e x P
s t
Blade passing effect included
Blade passing effect excluded
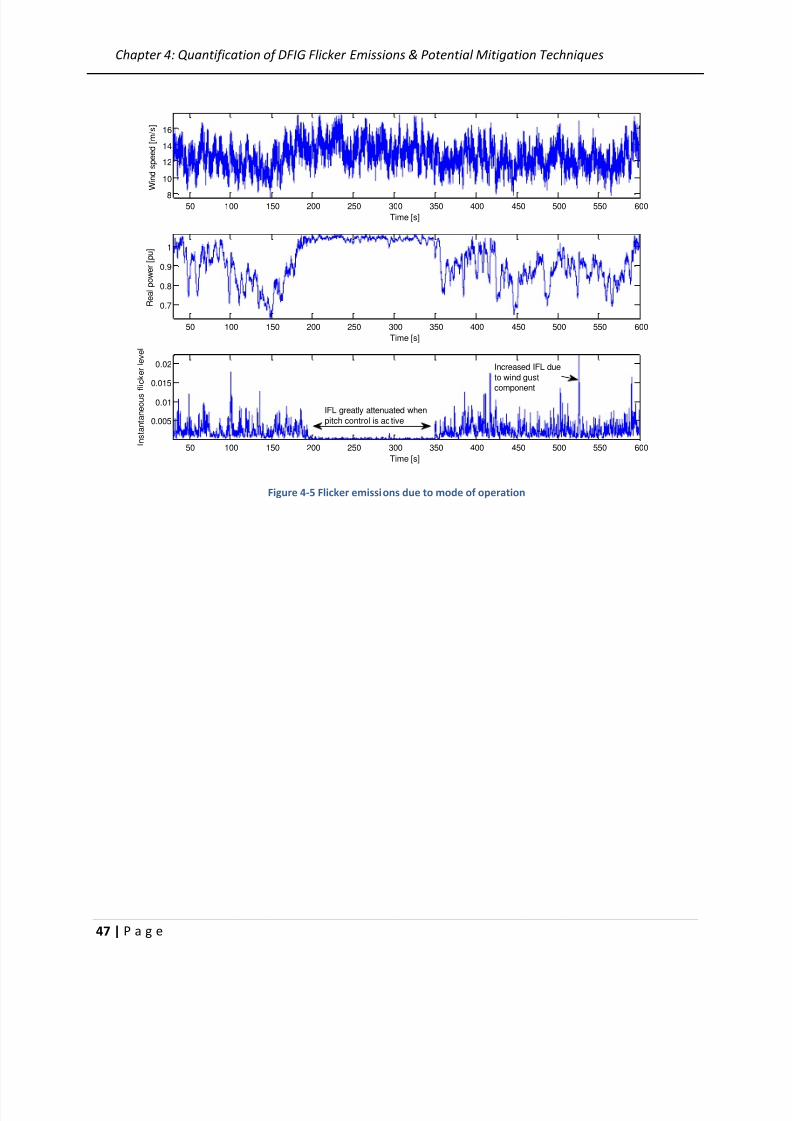
8/9/2019 Voltage Flicker Assessment in Distribution Feeders With Large Wind Farms
http://slidepdf.com/reader/full/voltage-flicker-assessment-in-distribution-feeders-with-large-wind-farms 61/97
Chapter 4: Quantification of DFIG Flicker Emissions & Potential Mitigation Techniques
47 | P a g e
Figure 4-5 Flicker emissions due to mode of operation
50 100 150 200 250 300 350 400 450 500 550 6008
10
12
14
16
Time [s]
W i n d s p e e d [ m / s ]
50 100 150 200 250 300 350 400 450 500 550 600
0.7
0.8
0.9
1
Time [s]
R e a l p o w e r [ p u ]
50 100 150 200 250 300 350 400 450 500 550 600
0.005
0.01
0.015
0.02
Time [s]
I n s t a n t a n e o u s
f l i c k e r l e v e l
IFL greatly attenuated when
pitch control is ac tive
Increased IFL due
to wind gust
component
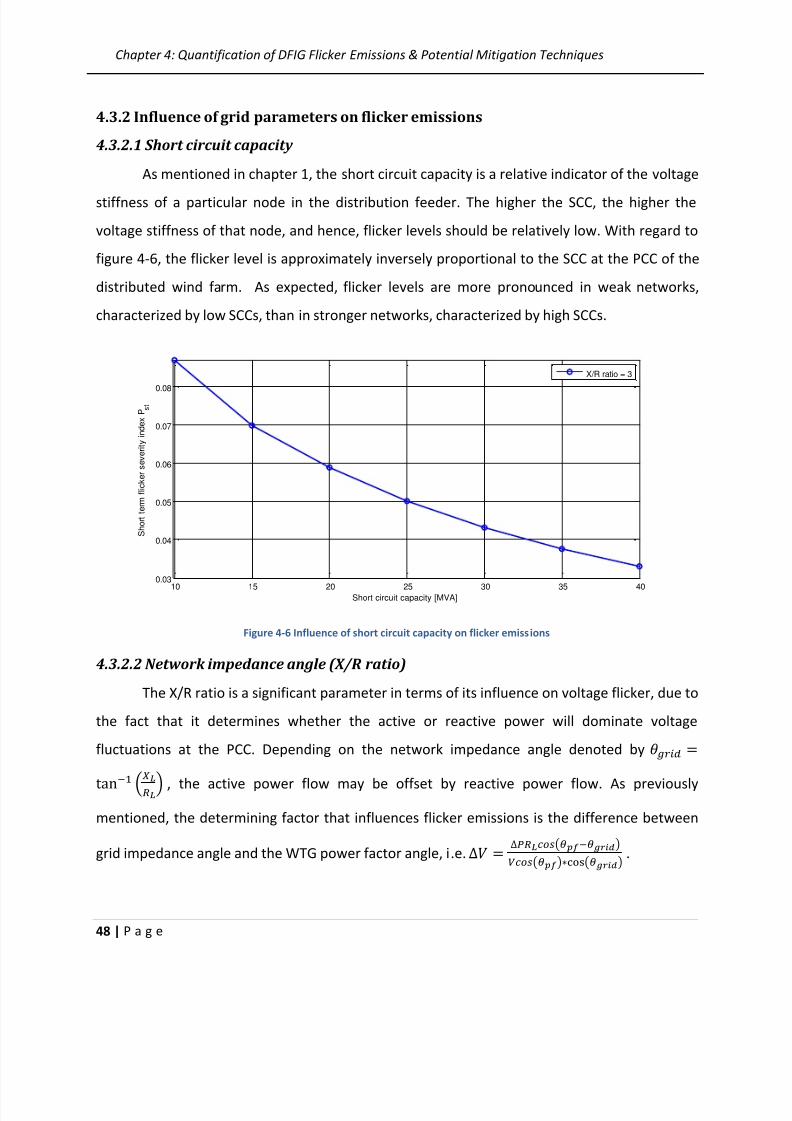
8/9/2019 Voltage Flicker Assessment in Distribution Feeders With Large Wind Farms
http://slidepdf.com/reader/full/voltage-flicker-assessment-in-distribution-feeders-with-large-wind-farms 62/97
Chapter 4: Quantification of DFIG Flicker Emissions & Potential Mitigation Techniques
48 | P a g e
4.3.2 Influence of grid parameters on flicker emissions
4.3.2.1 Short circuit capacity
As mentioned in chapter 1, the short circuit capacity is a relative indicator of the voltage
stiffness of a particular node in the distribution feeder. The higher the SCC, the higher the
voltage stiffness of that node, and hence, flicker levels should be relatively low. With regard to
figure 4-6, the flicker level is approximately inversely proportional to the SCC at the PCC of the
distributed wind farm. As expected, flicker levels are more pronounced in weak networks,
characterized by low SCCs, than in stronger networks, characterized by high SCCs.
Figure 4-6 Influence of short circuit capacity on flicker emissions
4.3.2.2 Network impedance angle (X/R ratio)
The X/R ratio is a significant parameter in terms of its influence on voltage flicker, due to
the fact that it determines whether the active or reactive power will dominate voltage
fluctuations at the PCC. Depending on the network impedance angle denoted by , the active power flow may be offset by reactive power flow. As previously
mentioned, the determining factor that influences flicker emissions is the difference between
grid impedance angle and the WTG power factor angle, i.e. ()()() .
10 15 20 25 30 35 40
0.03
0.04
0.05
0.06
0.07
0.08
Short circuit capacity [MVA]
S h o r t t e r m f l i c k e r s e v e r i t y i n d e x P s t
X/R ratio = 3
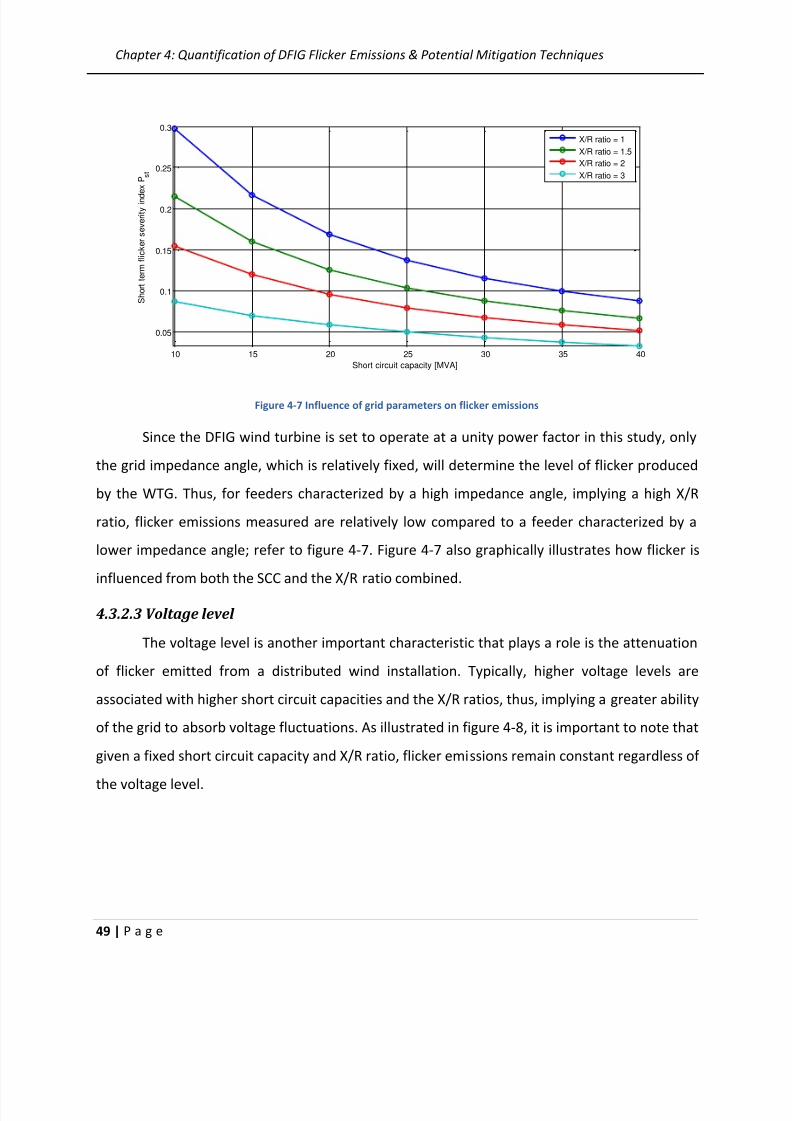
8/9/2019 Voltage Flicker Assessment in Distribution Feeders With Large Wind Farms
http://slidepdf.com/reader/full/voltage-flicker-assessment-in-distribution-feeders-with-large-wind-farms 63/97
Chapter 4: Quantification of DFIG Flicker Emissions & Potential Mitigation Techniques
49 | P a g e
Figure 4-7 Influence of grid parameters on flicker emissions
Since the DFIG wind turbine is set to operate at a unity power factor in this study, only
the grid impedance angle, which is relatively fixed, will determine the level of flicker produced
by the WTG. Thus, for feeders characterized by a high impedance angle, implying a high X/R
ratio, flicker emissions measured are relatively low compared to a feeder characterized by a
lower impedance angle; refer to figure 4-7. Figure 4-7 also graphically illustrates how flicker is
influenced from both the SCC and the X/R ratio combined.
4.3.2.3 Voltage level
The voltage level is another important characteristic that plays a role is the attenuation
of flicker emitted from a distributed wind installation. Typically, higher voltage levels are
associated with higher short circuit capacities and the X/R ratios, thus, implying a greater ability
of the grid to absorb voltage fluctuations. As illustrated in figure 4-8, it is important to note that
given a fixed short circuit capacity and X/R ratio, flicker emissions remain constant regardless of
the voltage level.
10 15 20 25 30 35 40
0.05
0.1
0.15
0.2
0.25
0.3
Short circuit capacity [MVA]
S h o r t t e r m f l i c k e r s e v e r i t y i n d
e x P
s t
X/R ratio = 1
X/R ratio = 1.5
X/R ratio = 2
X/R ratio = 3

8/9/2019 Voltage Flicker Assessment in Distribution Feeders With Large Wind Farms
http://slidepdf.com/reader/full/voltage-flicker-assessment-in-distribution-feeders-with-large-wind-farms 64/97
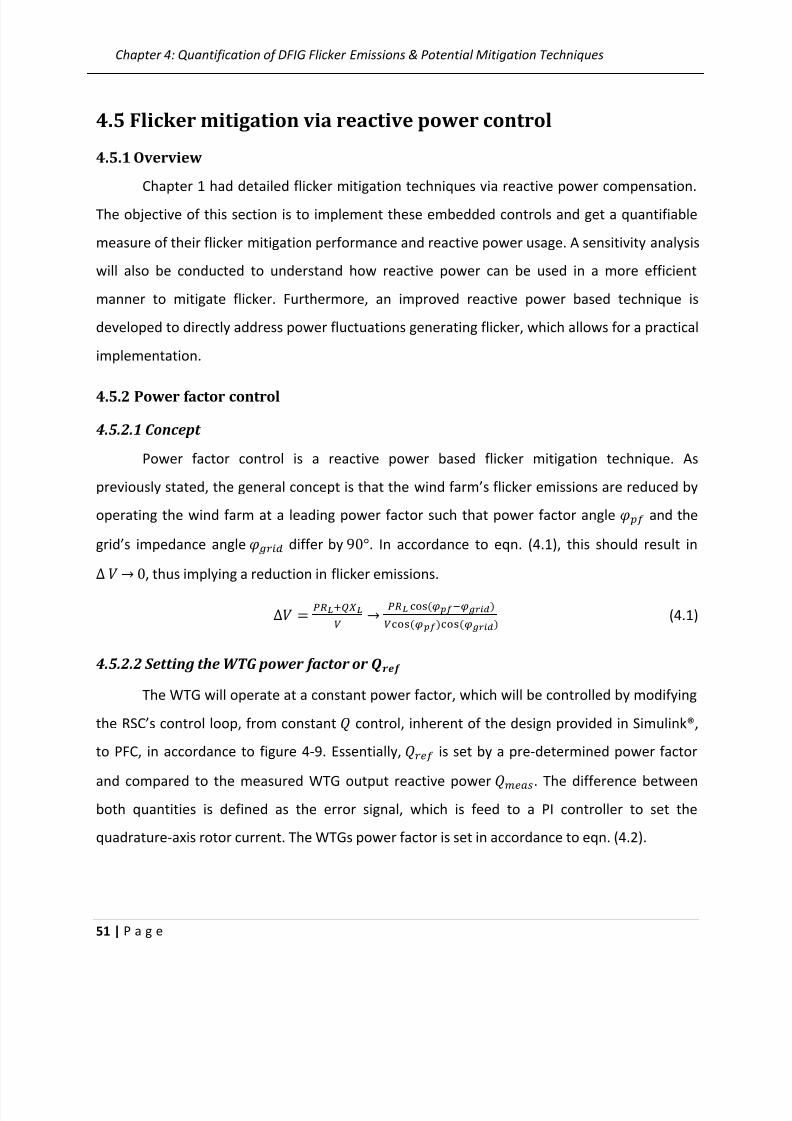
8/9/2019 Voltage Flicker Assessment in Distribution Feeders With Large Wind Farms
http://slidepdf.com/reader/full/voltage-flicker-assessment-in-distribution-feeders-with-large-wind-farms 65/97
Chapter 4: Quantification of DFIG Flicker Emissions & Potential Mitigation Techniques
51 | P a g e
4.5 Flicker mitigation via reactive power control
4.5.1 Overview
Chapter 1 had detailed flicker mitigation techniques via reactive power compensation.
The objective of this section is to implement these embedded controls and get a quantifiable
measure of their flicker mitigation performance and reactive power usage. A sensitivity analysis
will also be conducted to understand how reactive power can be used in a more efficient
manner to mitigate flicker. Furthermore, an improved reactive power based technique is
developed to directly address power fluctuations generating flicker, which allows for a practical
implementation.
4.5.2 Power factor control
4.5.2.1 Concept
Power factor control is a reactive power based flicker mitigation technique. As
previously stated, the general concept is that the wind farm’s flicker emissions are reduced by
operating the wind farm at a leading power factor such that power factor angle and the
grid’s impedance angle differ by . In accordance to eqn. (4.1), this should result in
, thus implying a reduction in flicker emissions.
(4.1)
4.5.2.2 Setting the WTG power factor or
The WTG will operate at a constant power factor, which will be controlled by modifying
the RSC’s control loop, from constant control, inherent of the design provided in Simulink®,
to PFC, in accordance to figure 4-9. Essentially, is set by a pre-determined power factor
and compared to the measured WTG output reactive power . The difference betweenboth quantities is defined as the error signal, which is feed to a PI controller to set the
quadrature-axis rotor current. The WTGs power factor is set in accordance to eqn. (4.2).

8/9/2019 Voltage Flicker Assessment in Distribution Feeders With Large Wind Farms
http://slidepdf.com/reader/full/voltage-flicker-assessment-in-distribution-feeders-with-large-wind-farms 66/97
Chapter 4: Quantification of DFIG Flicker Emissions & Potential Mitigation Techniques
52 | P a g e
Pmeas -sqrt(1/PF2-1) -
+
Q meas
Q ref PI Iqrref
Figure 4-9 Power factor angle controller, version 1
( ) (4.2)
Figure 4-10 illustrates a similar controller applying the identical concept based on eqn.
(4.1). In this controller, is set by eqn. (4.3). Both controls will yield identical results since is the equal in both cases.
Pmeas -RL/XL -
+
Q meas
Q ref PI Iqrref
Figure 4-10 Power factor angle controller, version 2
(4.3)
4.5.2.3 Example
Test network
The test network, illustrated in figure 4-1, utilizes a Thevenin equivalent network with
feeder characteristics listed in table 4-2. The wind speed profile feed to the WTG will be
characterized by a Kaimal PSD with a mean wind speed of 13 and a turbulence intensity of
15%, as described in chapter 3. This network will serve as a benchmark to observe the
effectiveness of the flicker mitigation technique.
Short circuit capacity 20MVA
X/R ratio 3
Grid impedance angle
Table 4-2 Test network properties
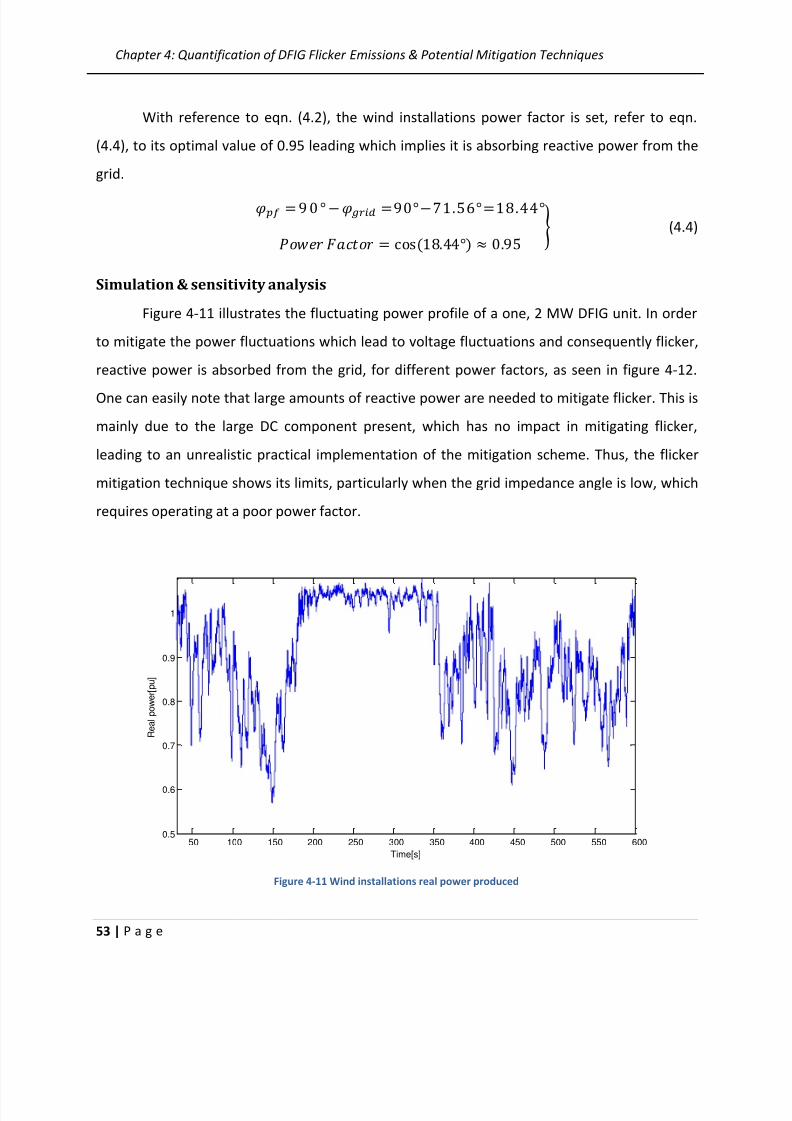
8/9/2019 Voltage Flicker Assessment in Distribution Feeders With Large Wind Farms
http://slidepdf.com/reader/full/voltage-flicker-assessment-in-distribution-feeders-with-large-wind-farms 67/97
Chapter 4: Quantification of DFIG Flicker Emissions & Potential Mitigation Techniques
53 | P a g e
With reference to eqn. (4.2), the wind installations power factor is set, refer to eqn.
(4.4), to its optimal value of 0.95 leading which implies it is absorbing reactive power from the
grid.
(4.4)
Simulation & sensitivity analysis
Figure 4-11 illustrates the fluctuating power profile of a one, 2 MW DFIG unit. In order
to mitigate the power fluctuations which lead to voltage fluctuations and consequently flicker,
reactive power is absorbed from the grid, for different power factors, as seen in figure 4-12.
One can easily note that large amounts of reactive power are needed to mitigate flicker. This is
mainly due to the large DC component present, which has no impact in mitigating flicker,
leading to an unrealistic practical implementation of the mitigation scheme. Thus, the flicker
mitigation technique shows its limits, particularly when the grid impedance angle is low, which
requires operating at a poor power factor.
Figure 4-11 Wind installations real power produced
50 100 150 200 250 300 350 400 450 500 550 6000.5
0.6
0.7
0.8
0.9
1
Time[s]
R e a l p o w e r [ p u ]

8/9/2019 Voltage Flicker Assessment in Distribution Feeders With Large Wind Farms
http://slidepdf.com/reader/full/voltage-flicker-assessment-in-distribution-feeders-with-large-wind-farms 68/97
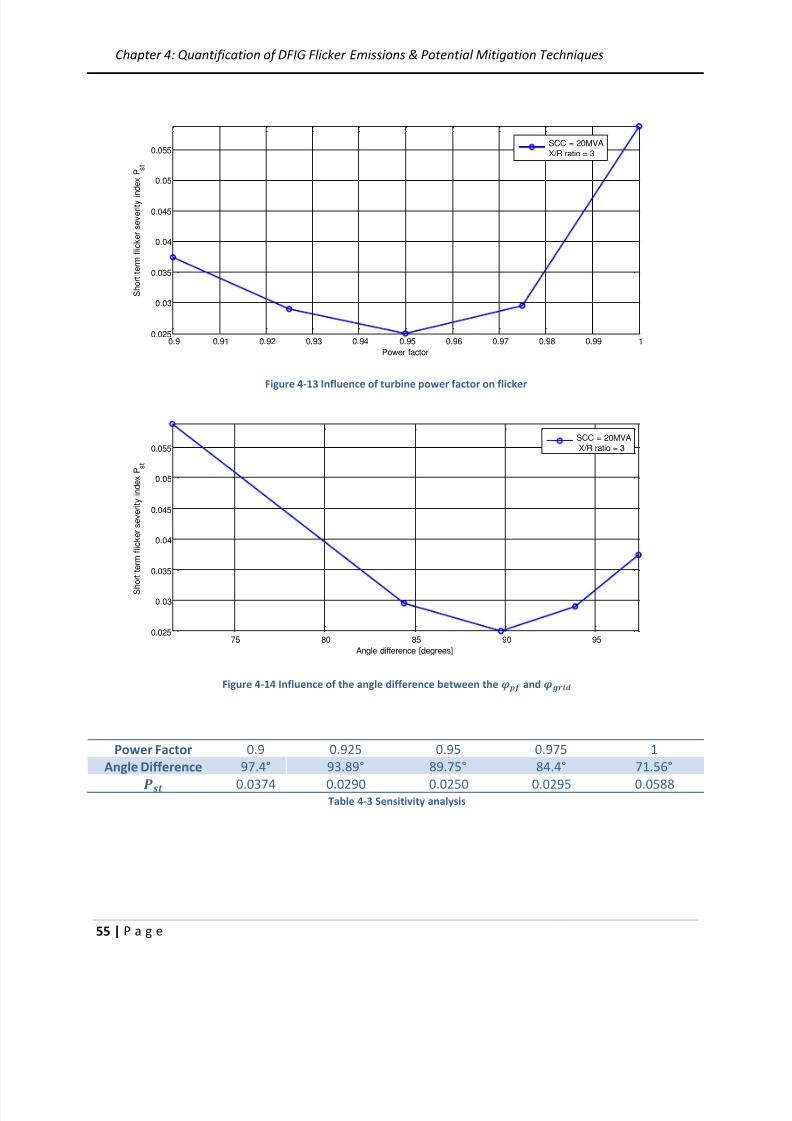
8/9/2019 Voltage Flicker Assessment in Distribution Feeders With Large Wind Farms
http://slidepdf.com/reader/full/voltage-flicker-assessment-in-distribution-feeders-with-large-wind-farms 69/97
Chapter 4: Quantification of DFIG Flicker Emissions & Potential Mitigation Techniques
55 | P a g e
Figure 4-13 Influence of turbine power factor on flicker
Figure 4-14 Influence of the angle difference between the and
Power Factor 0.9 0.925 0.95 0.975 1
Angle Difference 97.4° 93.89° 89.75° 84.4° 71.56°
0.0374 0.0290 0.0250 0.0295 0.0588Table 4-3 Sensitivity analysis
0.9 0.91 0.92 0.93 0.94 0.95 0.96 0.97 0.98 0.99 10.025
0.03
0.035
0.04
0.045
0.05
0.055
Power factor
S h o r t t e r m f l i c k e r s e v e r i t y i n d e x P
s t
SCC = 20MVA
X/R ratio = 3
75 80 85 90 950.025
0.03
0.035
0.04
0.045
0.05
0.055
Angle difference [degrees]
S h o r t t e r m f l i c k e r s e v e r i t y i n d e x P
s t
SCC = 20MVA
X/R ratio = 3
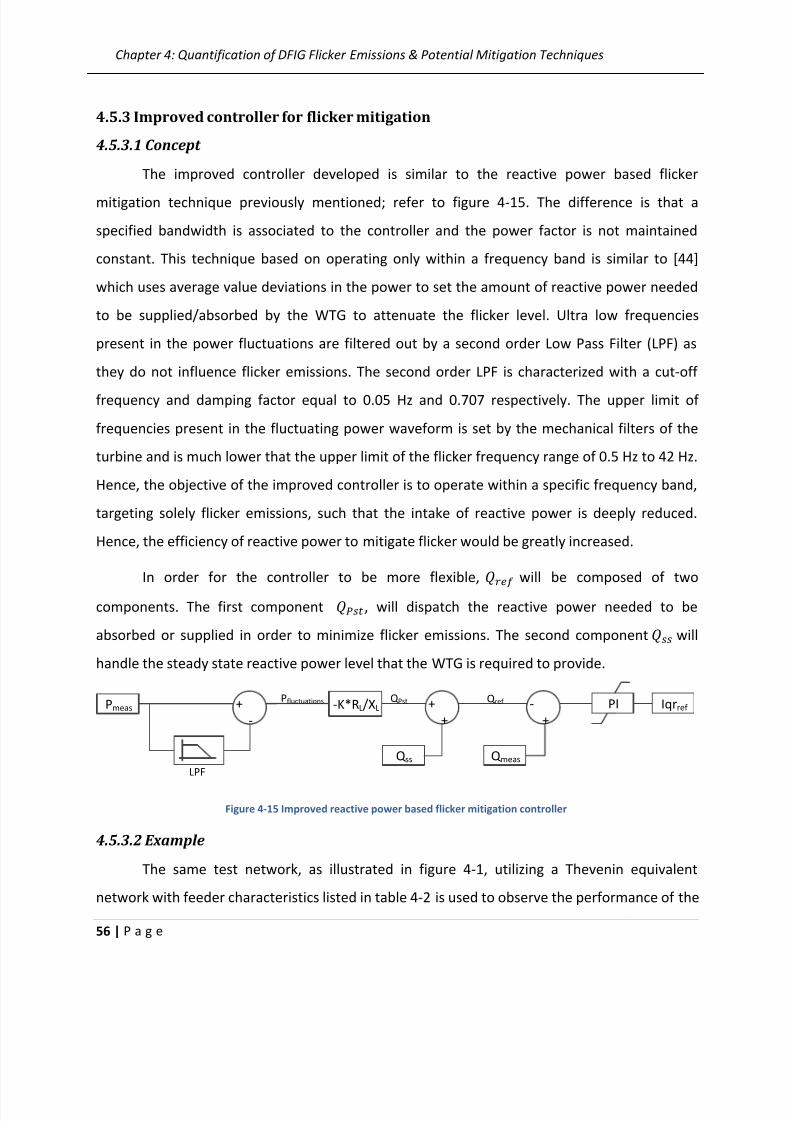
8/9/2019 Voltage Flicker Assessment in Distribution Feeders With Large Wind Farms
http://slidepdf.com/reader/full/voltage-flicker-assessment-in-distribution-feeders-with-large-wind-farms 70/97
Chapter 4: Quantification of DFIG Flicker Emissions & Potential Mitigation Techniques
56 | P a g e
4.5.3 Improved controller for flicker mitigation
4.5.3.1 Concept
The improved controller developed is similar to the reactive power based flicker
mitigation technique previously mentioned; refer to figure 4-15. The difference is that a
specified bandwidth is associated to the controller and the power factor is not maintained
constant. This technique based on operating only within a frequency band is similar to [44]
which uses average value deviations in the power to set the amount of reactive power needed
to be supplied/absorbed by the WTG to attenuate the flicker level. Ultra low frequencies
present in the power fluctuations are filtered out by a second order Low Pass Filter (LPF) as
they do not influence flicker emissions. The second order LPF is characterized with a cut-off
frequency and damping factor equal to 0.05 Hz and 0.707 respectively. The upper limit of
frequencies present in the fluctuating power waveform is set by the mechanical filters of the
turbine and is much lower that the upper limit of the flicker frequency range of 0.5 Hz to 42 Hz.
Hence, the objective of the improved controller is to operate within a specific frequency band,
targeting solely flicker emissions, such that the intake of reactive power is deeply reduced.
Hence, the efficiency of reactive power to mitigate flicker would be greatly increased.
In order for the controller to be more flexible,
will be composed of two
components. The first component , will dispatch the reactive power needed to be
absorbed or supplied in order to minimize flicker emissions. The second component will
handle the steady state reactive power level that the WTG is required to provide.
Pmeas -K*RL/XL+
-
+
+
-
+
Q meas
Q ref
Q ss
Q Pst PI Iqrref Pfluctuations
LPF
Figure 4-15 Improved reactive power based flicker mitigation controller
4.5.3.2 Example
The same test network, as illustrated in figure 4-1, utilizing a Thevenin equivalent
network with feeder characteristics listed in table 4-2 is used to observe the performance of the
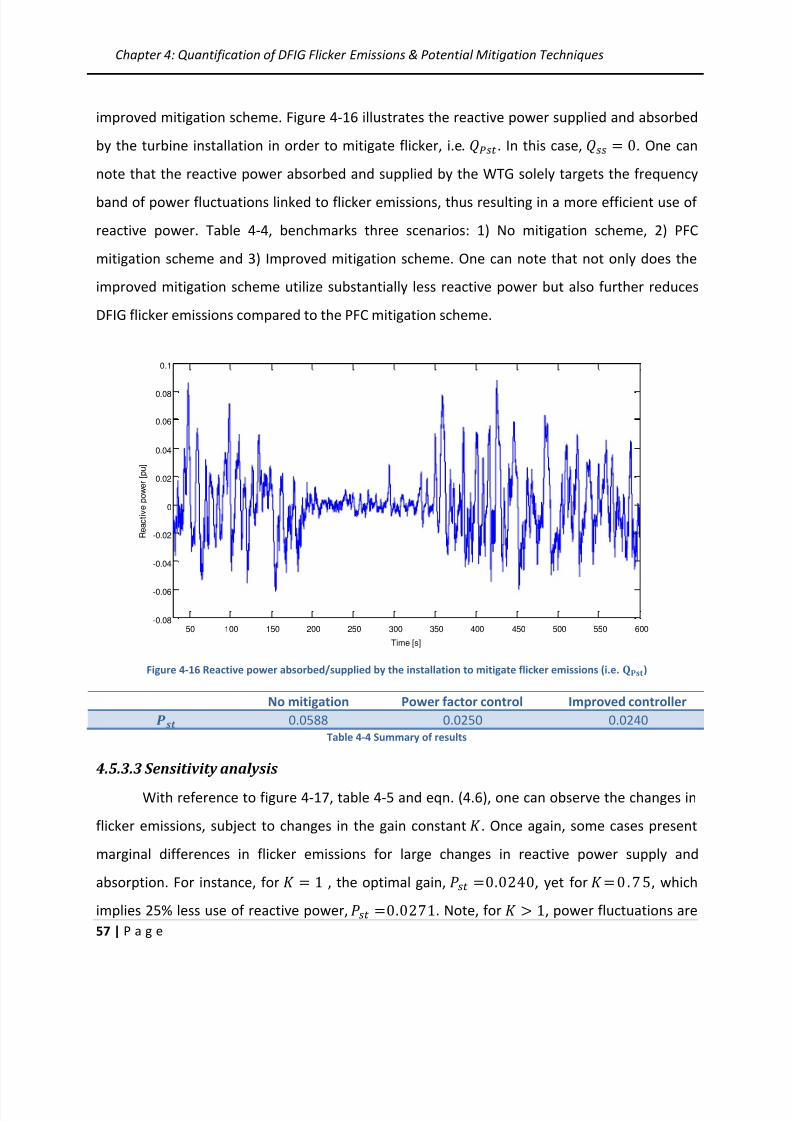
8/9/2019 Voltage Flicker Assessment in Distribution Feeders With Large Wind Farms
http://slidepdf.com/reader/full/voltage-flicker-assessment-in-distribution-feeders-with-large-wind-farms 71/97
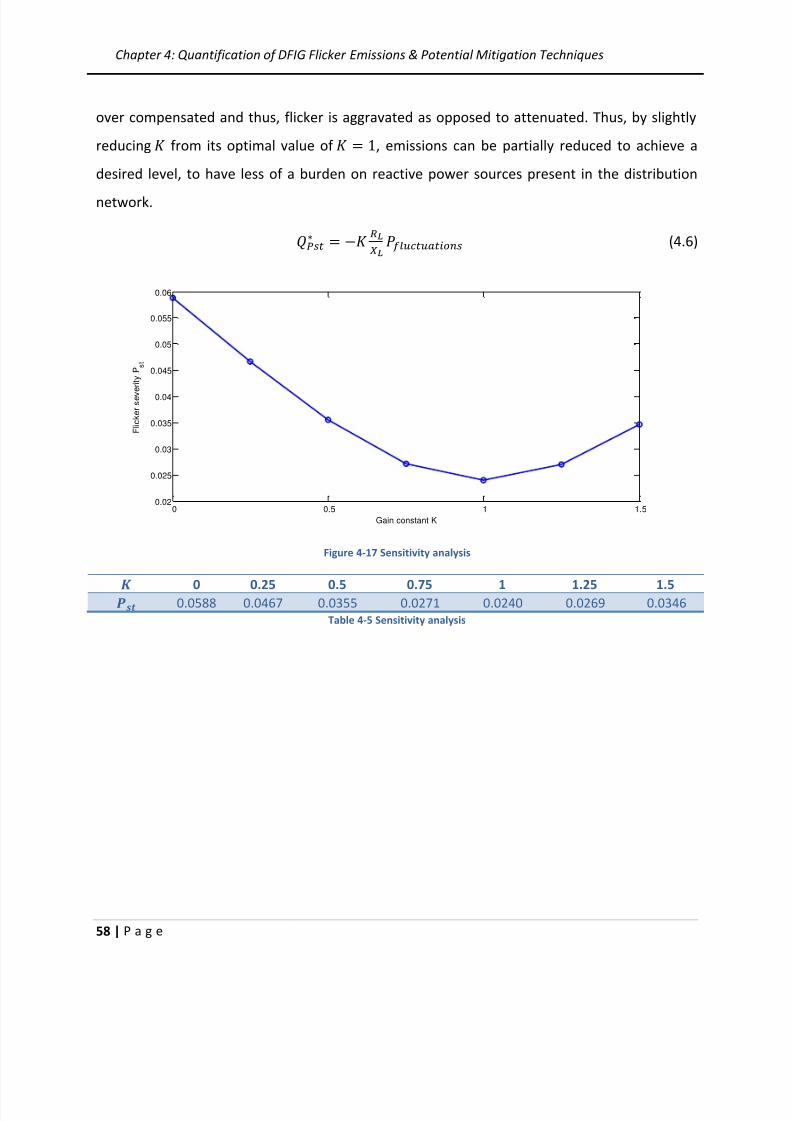
8/9/2019 Voltage Flicker Assessment in Distribution Feeders With Large Wind Farms
http://slidepdf.com/reader/full/voltage-flicker-assessment-in-distribution-feeders-with-large-wind-farms 72/97
Chapter 4: Quantification of DFIG Flicker Emissions & Potential Mitigation Techniques
58 | P a g e
over compensated and thus, flicker is aggravated as opposed to attenuated. Thus, by slightly
reducing from its optimal value of , emissions can be partially reduced to achieve a
desired level, to have less of a burden on reactive power sources present in the distribution
network.
(4.6)
Figure 4-17 Sensitivity analysis
0 0.25 0.5 0.75 1 1.25 1.5 0.0588 0.0467 0.0355 0.0271 0.0240 0.0269 0.0346
Table 4-5 Sensitivity analysis
0 0.5 1 1.50.02
0.025
0.03
0.035
0.04
0.045
0.05
0.055
0.06
Gain constant K
F l i c k e r s e v e r i t y P
s t
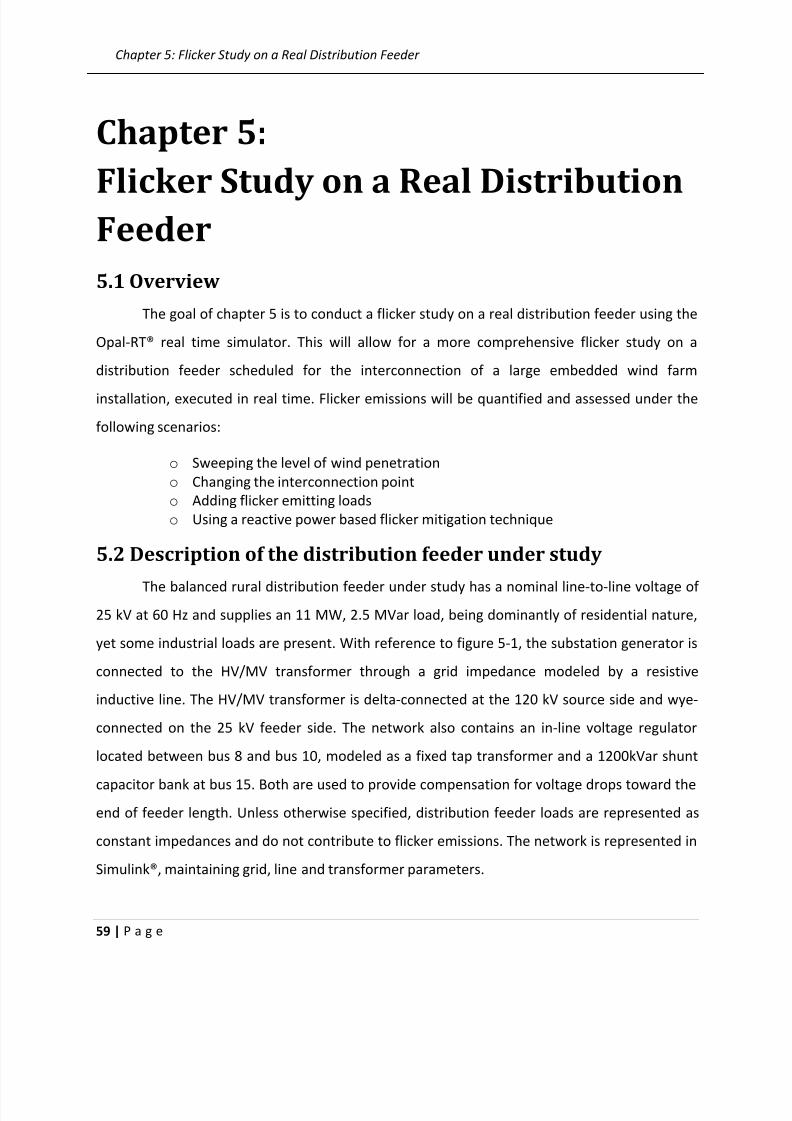
8/9/2019 Voltage Flicker Assessment in Distribution Feeders With Large Wind Farms
http://slidepdf.com/reader/full/voltage-flicker-assessment-in-distribution-feeders-with-large-wind-farms 73/97
Chapter 5: Flicker Study on a Real Distribution Feeder
59 | P a g e
Chapter 5:
Flicker Study on a Real DistributionFeeder
5.1 Overview
The goal of chapter 5 is to conduct a flicker study on a real distribution feeder using the
Opal-RT® real time simulator. This will allow for a more comprehensive flicker study on a
distribution feeder scheduled for the interconnection of a large embedded wind farm
installation, executed in real time. Flicker emissions will be quantified and assessed under the
following scenarios:
o Sweeping the level of wind penetration
o Changing the interconnection point
o Adding flicker emitting loads
o Using a reactive power based flicker mitigation technique
5.2 Description of the distribution feeder under study
The balanced rural distribution feeder under study has a nominal line-to-line voltage of
25 kV at 60 Hz and supplies an 11 MW, 2.5 MVar load, being dominantly of residential nature,
yet some industrial loads are present. With reference to figure 5-1, the substation generator is
connected to the HV/MV transformer through a grid impedance modeled by a resistive
inductive line. The HV/MV transformer is delta-connected at the 120 kV source side and wye-
connected on the 25 kV feeder side. The network also contains an in-line voltage regulator
located between bus 8 and bus 10, modeled as a fixed tap transformer and a 1200kVar shunt
capacitor bank at bus 15. Both are used to provide compensation for voltage drops toward the
end of feeder length. Unless otherwise specified, distribution feeder loads are represented as
constant impedances and do not contribute to flicker emissions. The network is represented in
Simulink®, maintaining grid, line and transformer parameters.
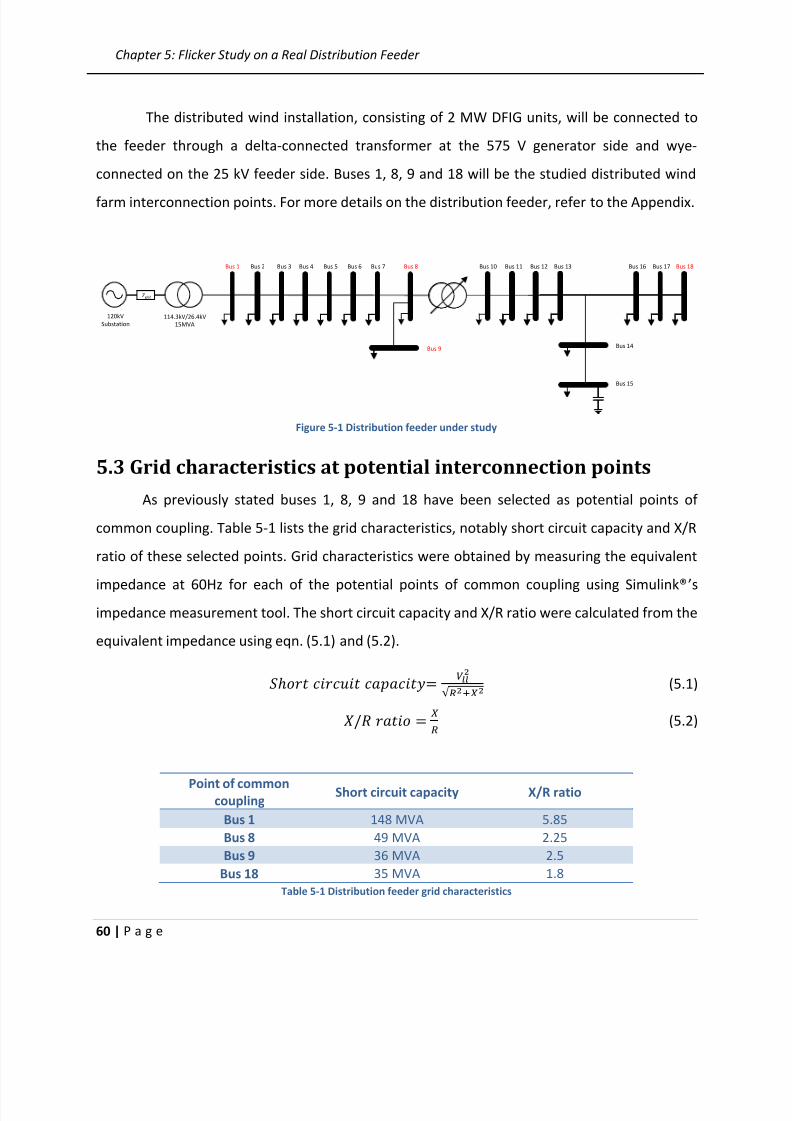
8/9/2019 Voltage Flicker Assessment in Distribution Feeders With Large Wind Farms
http://slidepdf.com/reader/full/voltage-flicker-assessment-in-distribution-feeders-with-large-wind-farms 74/97
Chapter 5: Flicker Study on a Real Distribution Feeder
60 | P a g e
The distributed wind installation, consisting of 2 MW DFIG units, will be connected to
the feeder through a delta-connected transformer at the 575 V generator side and wye-
connected on the 25 kV feeder side. Buses 1, 8, 9 and 18 will be the studied distributed wind
farm interconnection points. For more details on the distribution feeder, refer to the Appendix.
Zgrid
120kV
Substation114.3kV/26.4kV
15MVA
Bus 1 Bus 2 Bus 3 Bus 4 Bus 5 Bus 6 Bus 7 Bus 10 Bus 11 Bus 12 Bus 13 Bus 16 Bus 17 Bus 18
Bus 14
Bus 15
Bus 9
Zgrid
Bus 8
Figure 5-1 Distribution feeder under study
5.3 Grid characteristics at potential interconnection points
As previously stated buses 1, 8, 9 and 18 have been selected as potential points of
common coupling. Table 5-1 lists the grid characteristics, notably short circuit capacity and X/R
ratio of these selected points. Grid characteristics were obtained by measuring the equivalent
impedance at 60Hz for each of the potential points of common coupling using Simulink® ’simpedance measurement tool. The short circuit capacity and X/R ratio were calculated from the
equivalent impedance using eqn. (5.1) and (5.2).
√ (5.1)
(5.2)
Point of commoncoupling
Short circuit capacity X/R ratio
Bus 1 148 MVA 5.85
Bus 8 49 MVA 2.25
Bus 9 36 MVA 2.5
Bus 18 35 MVA 1.8
Table 5-1 Distribution feeder grid characteristics

8/9/2019 Voltage Flicker Assessment in Distribution Feeders With Large Wind Farms
http://slidepdf.com/reader/full/voltage-flicker-assessment-in-distribution-feeders-with-large-wind-farms 75/97
Chapter 5: Flicker Study on a Real Distribution Feeder
61 | P a g e
5.4 Decoupling of the distribution feeder using RT-LABThe Opal-RT® real time simulator allows for a distribution feeder model to be
distributed over a cluster of processors running in parallel to achieve a significant improvement
in computational speed performance. RT-LAB® is Opal-RT®’s software application that allows
one to readily convert Matlab®/SPS models to a real-time model to be distributed over a cluster
of processors. In order to decouple a distribution feeder into sub-networks, one must use the
provided ARTEMiS® library line blocks (i.e. stublines). The stubline block permits the decoupling
of state-space system equations of the feeder on both sides where the stubline is inserted.
Essentially, this method takes advantage of the natural propagation delay of the line to buffer
the communication time required between two processors. Consequently, it is possible to
distribute smaller portions of the large impedance matrix pertaining to the feeder amongst a
cluster of processors, to be solved in parallel [79]. Solving a reduced impedance matrix as
opposed to a large impedance matrix greatly decreases the computational effort allowing for a
significant improvement in simulation speed. However, in order to permit the insertion of a
stubline, the following condition must hold: √ [80]. Whereby, is the simulation time
step and & are the line inductance and capacitance respectively.
With reference to figure 5-2 the distribution feeder under study is separated into three
sub-networks. Each sub-network runs on a dedicated processor allowing computational speed-
ups via parallel processing. These three networks are connected by two stubline blocks which
are located between bus 7 and 8 and between bus 8 and 9 and are represented by green lines.
Zgrid
120kV
Substation114.3kV/26.4kV
15MVA
Bus 1 Bus 2 Bus 3 Bus 4 Bus 5 Bus 6 Bus 7 Bus 10 Bus 11 Bus 12 Bus 13 Bus 16 Bus 17 Bus 18
Bus 14
Bus 15
Bus 9
Zgrid
575V/24.94kV
2.5*Nunits MVA
B575V
Distributed Wind Installation
2MW DFIG Units
Bus 8
Sub-network 3
Sub-network 2
Sub-network 1
Figure 5-2 Decoupled distribution feeder
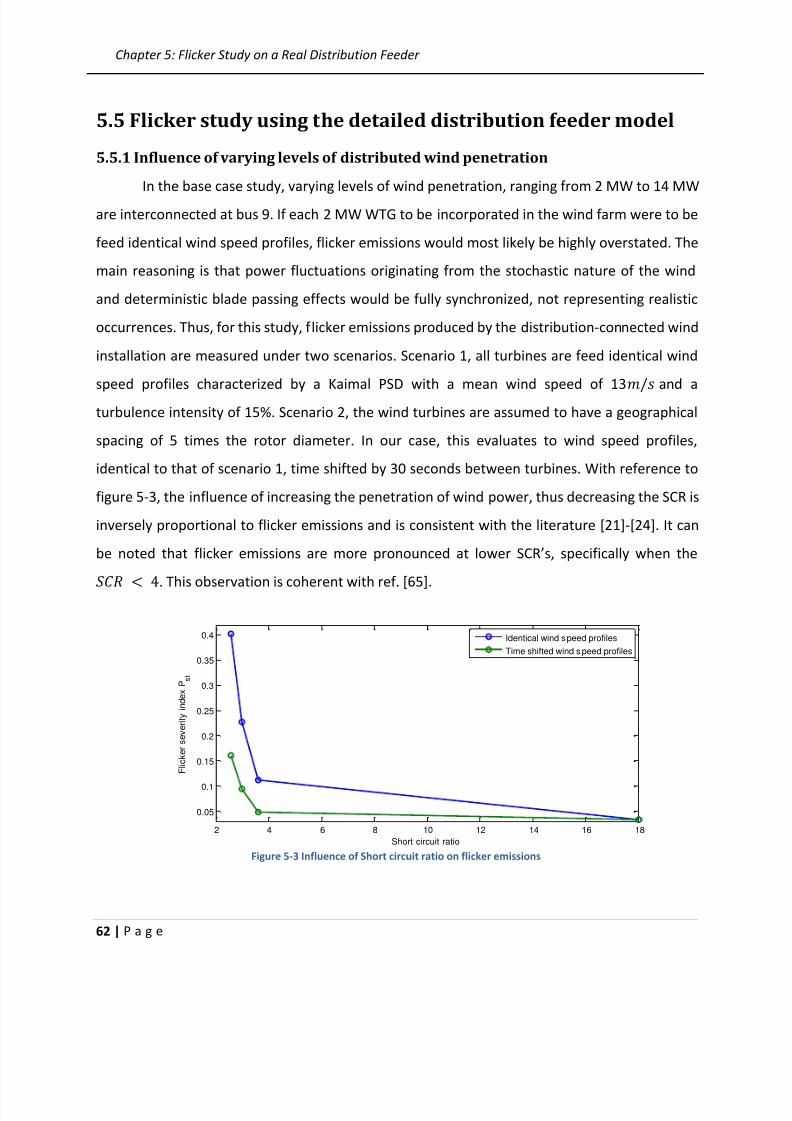
8/9/2019 Voltage Flicker Assessment in Distribution Feeders With Large Wind Farms
http://slidepdf.com/reader/full/voltage-flicker-assessment-in-distribution-feeders-with-large-wind-farms 76/97
Chapter 5: Flicker Study on a Real Distribution Feeder
62 | P a g e
5.5 Flicker study using the detailed distribution feeder model
5.5.1 Influence of varying levels of distributed wind penetration
In the base case study, varying levels of wind penetration, ranging from 2 MW to 14 MW
are interconnected at bus 9. If each 2 MW WTG to be incorporated in the wind farm were to be
feed identical wind speed profiles, flicker emissions would most likely be highly overstated. The
main reasoning is that power fluctuations originating from the stochastic nature of the wind
and deterministic blade passing effects would be fully synchronized, not representing realistic
occurrences. Thus, for this study, flicker emissions produced by the distribution-connected wind
installation are measured under two scenarios. Scenario 1, all turbines are feed identical wind
speed profiles characterized by a Kaimal PSD with a mean wind speed of 13
and a
turbulence intensity of 15%. Scenario 2, the wind turbines are assumed to have a geographical
spacing of 5 times the rotor diameter. In our case, this evaluates to wind speed profiles,
identical to that of scenario 1, time shifted by 30 seconds between turbines. With reference to
figure 5-3, the influence of increasing the penetration of wind power, thus decreasing the SCR is
inversely proportional to flicker emissions and is consistent with the literature [21]-[24]. It can
be noted that flicker emissions are more pronounced at lower SCR’s, specifically when the
. This observation is coherent with ref. [65].
Figure 5-3 Influence of Short circuit ratio on flicker emissions
2 4 6 8 10 12 14 16 18
0.05
0.1
0.15
0.2
0.25
0.3
0.35
0.4
Short circuit ratio
F l i c k e r s e v e r i t y i n d e x P
s t
Identical wind speed profiles
Time shifted wind speed profiles

8/9/2019 Voltage Flicker Assessment in Distribution Feeders With Large Wind Farms
http://slidepdf.com/reader/full/voltage-flicker-assessment-in-distribution-feeders-with-large-wind-farms 77/97
Chapter 5: Flicker Study on a Real Distribution Feeder
63 | P a g e
With reference to figures 5-3 and 5-4, by time shifting the wind speed profiles, power
fluctuations are unsynchronized, which results in a more realistic wind farm flicker emission
measurement.
Figure 5-4 Time shifted wind speed profiles and associated output power waveforms
5.5.2 Influence of changing the interconnection point
Given the choice of four potential interconnection points, notably bus 1, 8, 9 and 18,
flicker emissions for different wind penetration levels ranging from 10MW to 14MW are
measured. Each turbine in the wind farm is represented and feed a time shifted wind speed
profile identical to the previous section. With reference to figure 5-5 and table 5-2, given the
grid characteristics at each of the potential points of common coupling, one can note that
stiffer connections points characterized by a bus 1 and 8 result in much lower flicker emissions
0 100 200 300 400 500 6005
10
15
20
0 100 200 300 400 500 6005
10
15
20
0 100 200 300 400 500 6005
10
15
20
0 100 200 300 400 500 6005
10
15
20
W i n d s p e e d p r o f i l e [ m / s ]
0 100 200 300 400 500 6005
10
15
20
0 100 200 300 400 500 6005
10
15
20
0 100 200 300 400 500 6005
10
15
20
Time [s]
0 100 200 300 400 500 600
0.5
1
0 100 200 300 400 500 600
0.5
1
0 100 200 300 400 500 600
0.5
1
0 100 200 300 400 500 600
0.5
1
R e a l p o w e r [ p u ]
0 100 200 300 400 500 600
0.5
1
0 100 200 300 400 500 600
0.5
1
0 100 200 300 400 500 600
0.5
1
Time [s]
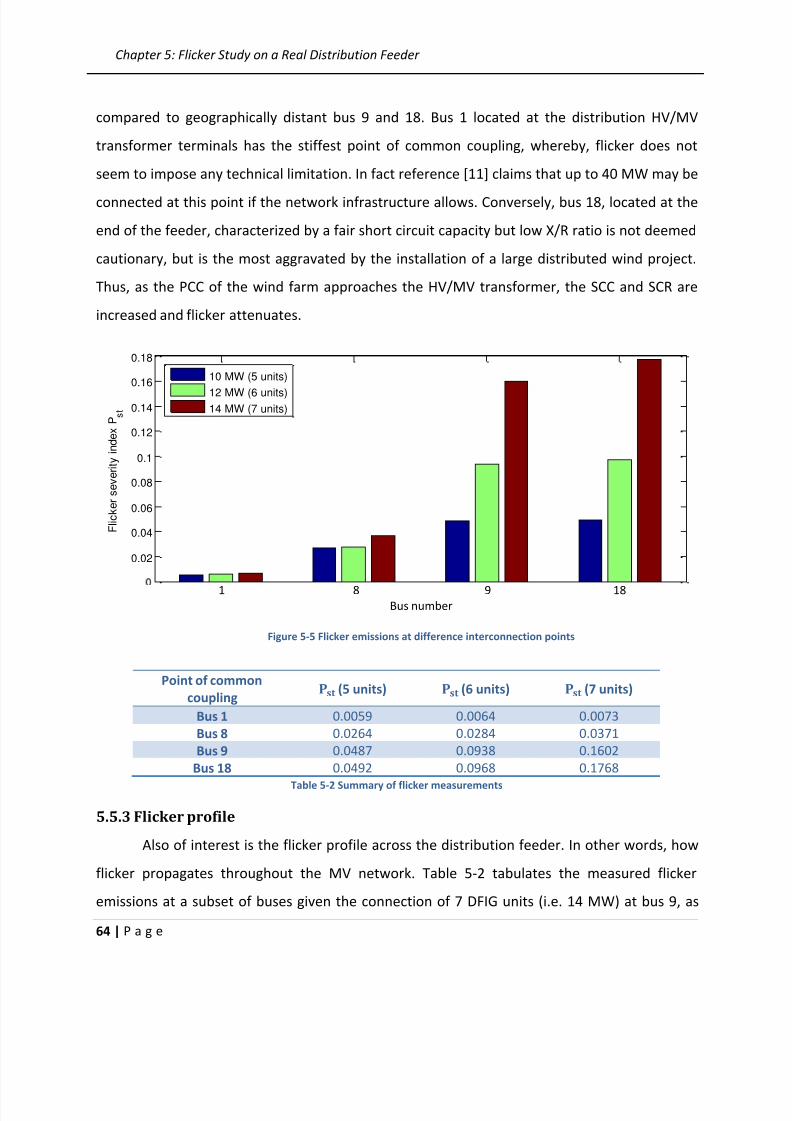
8/9/2019 Voltage Flicker Assessment in Distribution Feeders With Large Wind Farms
http://slidepdf.com/reader/full/voltage-flicker-assessment-in-distribution-feeders-with-large-wind-farms 78/97
Chapter 5: Flicker Study on a Real Distribution Feeder
64 | P a g e
1 8 9 18Bus number
Figure 5-5 Flicker emissions at difference interconnection points
compared to geographically distant bus 9 and 18. Bus 1 located at the distribution HV/MV
transformer terminals has the stiffest point of common coupling, whereby, flicker does not
seem to impose any technical limitation. In fact reference [11] claims that up to 40 MW may be
connected at this point if the network infrastructure allows. Conversely, bus 18, located at the
end of the feeder, characterized by a fair short circuit capacity but low X/R ratio is not deemed
cautionary, but is the most aggravated by the installation of a large distributed wind project.
Thus, as the PCC of the wind farm approaches the HV/MV transformer, the SCC and SCR are
increased and flicker attenuates.
Point of common
coupling (5 units) (6 units) (7 units)
Bus 1 0.0059 0.0064 0.0073
Bus 8 0.0264 0.0284 0.0371
Bus 9 0.0487 0.0938 0.1602
Bus 18 0.0492 0.0968 0.1768
Table 5-2 Summary of flicker measurements
5.5.3 Flicker profile
Also of interest is the flicker profile across the distribution feeder. In other words, how
flicker propagates throughout the MV network. Table 5-2 tabulates the measured flicker
emissions at a subset of buses given the connection of 7 DFIG units (i.e. 14 MW) at bus 9, as
0.02
0.04
0.06
0.08
0.1
0.12
0.14
0.16
0.18
F l i c k e r s e v e r i t y i n d e x P
s t
10 MW (5 units)
12 MW (6 units)14 MW (7 units)
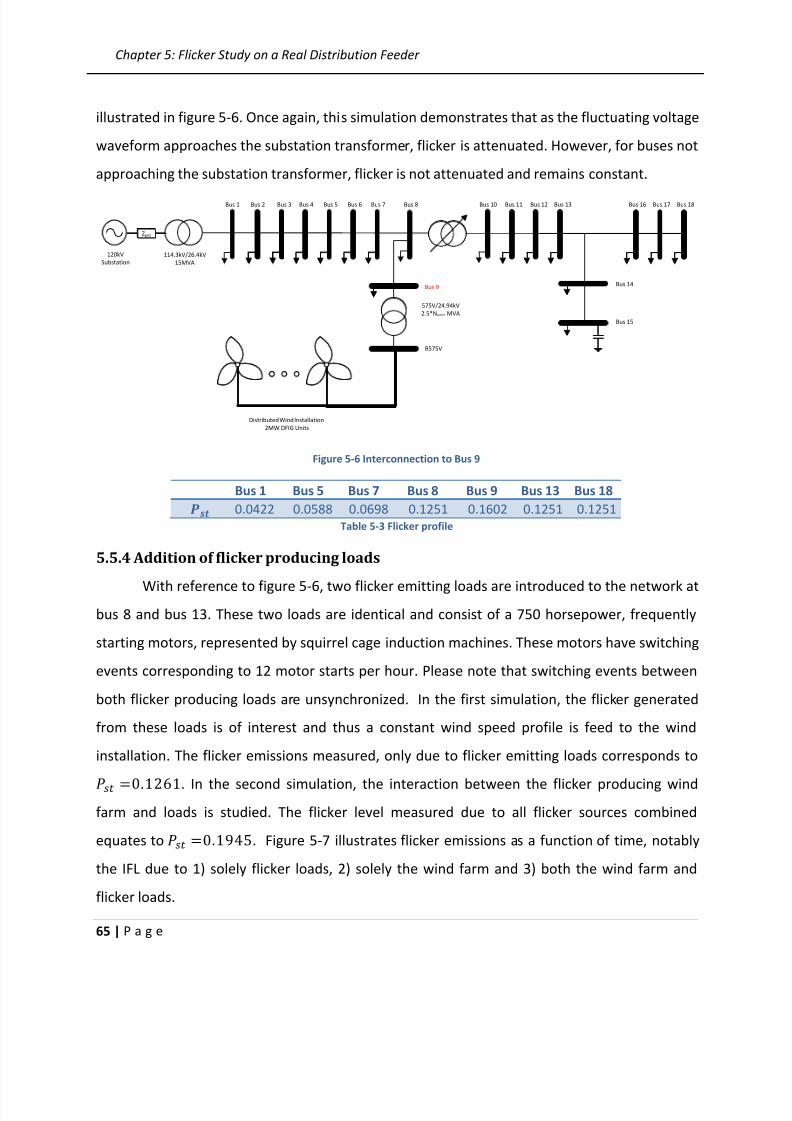
8/9/2019 Voltage Flicker Assessment in Distribution Feeders With Large Wind Farms
http://slidepdf.com/reader/full/voltage-flicker-assessment-in-distribution-feeders-with-large-wind-farms 79/97
Chapter 5: Flicker Study on a Real Distribution Feeder
65 | P a g e
illustrated in figure 5-6. Once again, this simulation demonstrates that as the fluctuating voltage
waveform approaches the substation transformer, flicker is attenuated. However, for buses not
approaching the substation transformer, flicker is not attenuated and remains constant.
Zgrid
120kV
Substation
114.3kV/26.4kV
15MVA
Bus 1 Bus 2 Bus 3 Bus 4 Bus 5 Bus 6 Bus 7 Bus 10 Bus 11 Bus 12 Bus 13 Bus 16 Bus 17 Bus 18
Bus 14
Bus 15
Bus 9
Zgrid
575V/24.94kV
2.5*Nunits MVA
B575V
Distributed Wind Installation
2MW DFIG Units
Bus 8
Figure 5-6 Interconnection to Bus 9
Bus 1 Bus 5 Bus 7 Bus 8 Bus 9 Bus 13 Bus 18 0.0422 0.0588 0.0698 0.1251 0.1602 0.1251 0.1251
Table 5-3 Flicker profile
5.5.4 Addition of flicker producing loads
With reference to figure 5-6, two flicker emitting loads are introduced to the network at
bus 8 and bus 13. These two loads are identical and consist of a 750 horsepower, frequently
starting motors, represented by squirrel cage induction machines. These motors have switching
events corresponding to 12 motor starts per hour. Please note that switching events between
both flicker producing loads are unsynchronized. In the first simulation, the flicker generated
from these loads is of interest and thus a constant wind speed profile is feed to the wind
installation. The flicker emissions measured, only due to flicker emitting loads corresponds to
. In the second simulation, the interaction between the flicker producing wind
farm and loads is studied. The flicker level measured due to all flicker sources combined
equates to . Figure 5-7 illustrates flicker emissions as a function of time, notably
the IFL due to 1) solely flicker loads, 2) solely the wind farm and 3) both the wind farm and
flicker loads.

8/9/2019 Voltage Flicker Assessment in Distribution Feeders With Large Wind Farms
http://slidepdf.com/reader/full/voltage-flicker-assessment-in-distribution-feeders-with-large-wind-farms 80/97
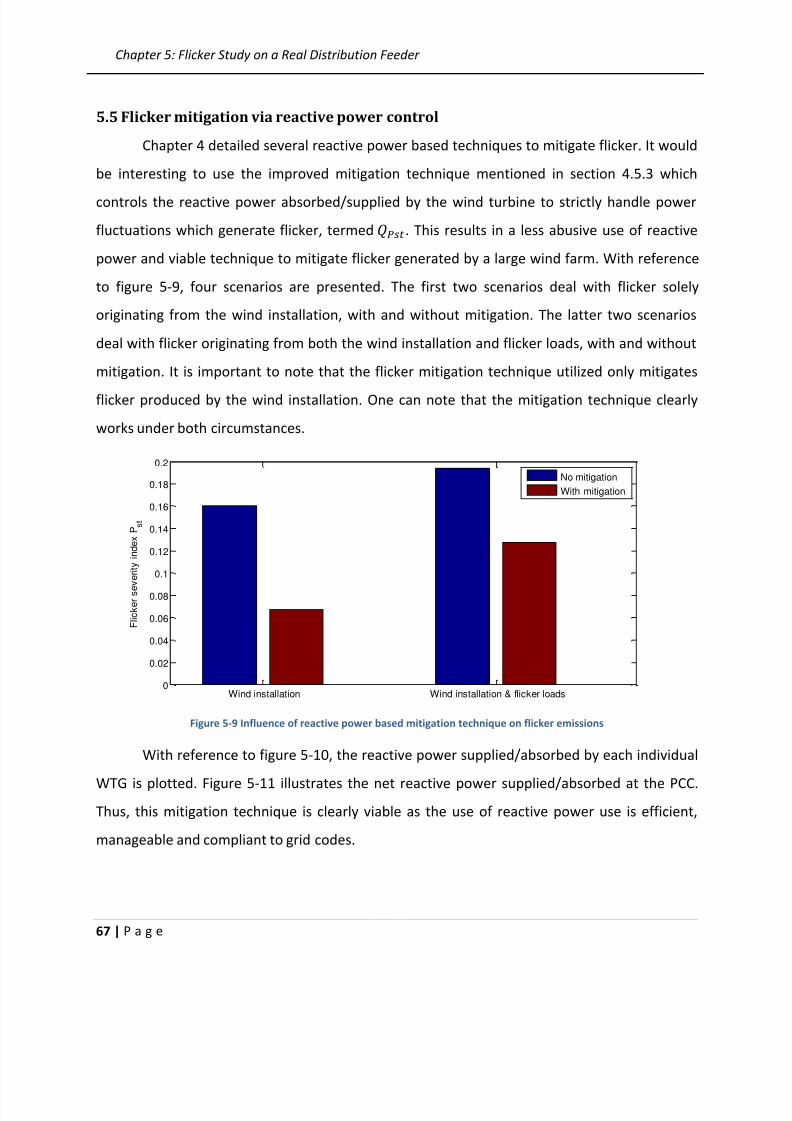
8/9/2019 Voltage Flicker Assessment in Distribution Feeders With Large Wind Farms
http://slidepdf.com/reader/full/voltage-flicker-assessment-in-distribution-feeders-with-large-wind-farms 81/97
Chapter 5: Flicker Study on a Real Distribution Feeder
67 | P a g e
5.5 Flicker mitigation via reactive power control
Chapter 4 detailed several reactive power based techniques to mitigate flicker. It would
be interesting to use the improved mitigation technique mentioned in section 4.5.3 which
controls the reactive power absorbed/supplied by the wind turbine to strictly handle power
fluctuations which generate flicker, termed . This results in a less abusive use of reactive
power and viable technique to mitigate flicker generated by a large wind farm. With reference
to figure 5-9, four scenarios are presented. The first two scenarios deal with flicker solely
originating from the wind installation, with and without mitigation. The latter two scenarios
deal with flicker originating from both the wind installation and flicker loads, with and without
mitigation. It is important to note that the flicker mitigation technique utilized only mitigates
flicker produced by the wind installation. One can note that the mitigation technique clearly
works under both circumstances.
Figure 5-9 Influence of reactive power based mitigation technique on flicker emissions
With reference to figure 5-10, the reactive power supplied/absorbed by each individual
WTG is plotted. Figure 5-11 illustrates the net reactive power supplied/absorbed at the PCC.
Thus, this mitigation technique is clearly viable as the use of reactive power use is efficient,
manageable and compliant to grid codes.
Wind installation Wind installation & flicker loads0
0.02
0.04
0.06
0.08
0.1
0.12
0.14
0.16
0.18
0.2
F l i c k e r s e
v e r i t y i n d e x P
s t
No mitigation
With mitigation
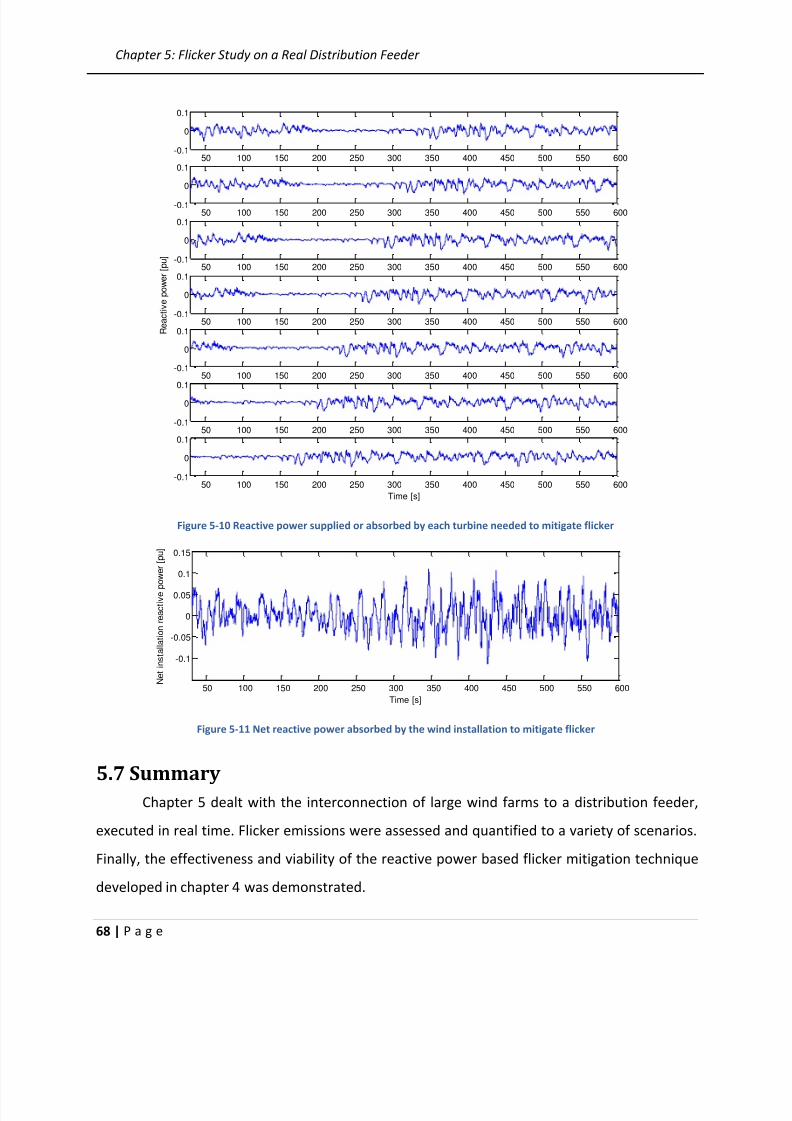
8/9/2019 Voltage Flicker Assessment in Distribution Feeders With Large Wind Farms
http://slidepdf.com/reader/full/voltage-flicker-assessment-in-distribution-feeders-with-large-wind-farms 82/97
Chapter 5: Flicker Study on a Real Distribution Feeder
68 | P a g e
Figure 5-10 Reactive power supplied or absorbed by each turbine needed to mitigate flicker
Figure 5-11 Net reactive power absorbed by the wind installation to mitigate flicker
5.7 Summary
Chapter 5 dealt with the interconnection of large wind farms to a distribution feeder,
executed in real time. Flicker emissions were assessed and quantified to a variety of scenarios.
Finally, the effectiveness and viability of the reactive power based flicker mitigation technique
developed in chapter 4 was demonstrated.
50 100 150 200 250 300 350 400 450 500 550 600-0.1
0
0.1
50 100 150 200 250 300 350 400 450 500 550 600-0.1
0
0.1
50 100 150 200 250 300 350 400 450 500 550 600-0.1
0
0.1
50 100 150 200 250 300 350 400 450 500 550 600-0.1
0
0.1
R e a c t i v e p o w e r [ p u ]
50 100 150 200 250 300 350 400 450 500 550 600-0.1
0
0.1
50 100 150 200 250 300 350 400 450 500 550 600-0.1
0
0.1
50 100 150 200 250 300 350 400 450 500 550 600-0.1
0
0.1
Time [s]
50 100 150 200 250 300 350 400 450 500 550 600
-0.1
-0.05
0
0.05
0.1
0.15
Time [s]
N e t i n s t a l l a t i o n r e a c t i v e p o w e r [ p u ]

8/9/2019 Voltage Flicker Assessment in Distribution Feeders With Large Wind Farms
http://slidepdf.com/reader/full/voltage-flicker-assessment-in-distribution-feeders-with-large-wind-farms 83/97
Chapter 6: Conclusions & Recommendations for Future Work
69 | P a g e
Chapter 6:
Conclusions & Recommendationsfor Future Work6.1 Presentation of the Rule of Thumb
The quantity of flicker emissions produced by a distribution-connected wind farm is
likely to be the limiting factor which determines the greatest level of wind penetration possible.
In order to make the most efficient penetration of wind energy into distribution feeders,
without violating flicker limits and the need for detailed studies, a rule of thumb has been
developed based on figure 6-1 and is presented in figure 6-2. Essentially, figure 6-1 quantifies
the flicker emissions produced by DFIG wind turbines connected to a parametric network, as in
chapter 4, feed identical wind speed profiles characterized by , and
benchmarks the flicker emissions produced to an emission limit. Events which result in wind
farm emissions above the green plane, notably the emission limit, are in violation of emissions
limits, whereas events resulting in wind farm emissions below the green plane are in
compliance to emission limits.
Figure 6-1 Wind farms flicker emission plane with reference to the emission limit
22.5
33.5
4 11.5
22.5
33.5
4
0.1
0.2
0.3
0.4
0.5
0.6
0.7
0.8
i
SCR
F l i c k e r s e v e r i t y i n d e x P s t
Wind farm emissions
Emission limit: Pst
= 0.35
X/R ratio
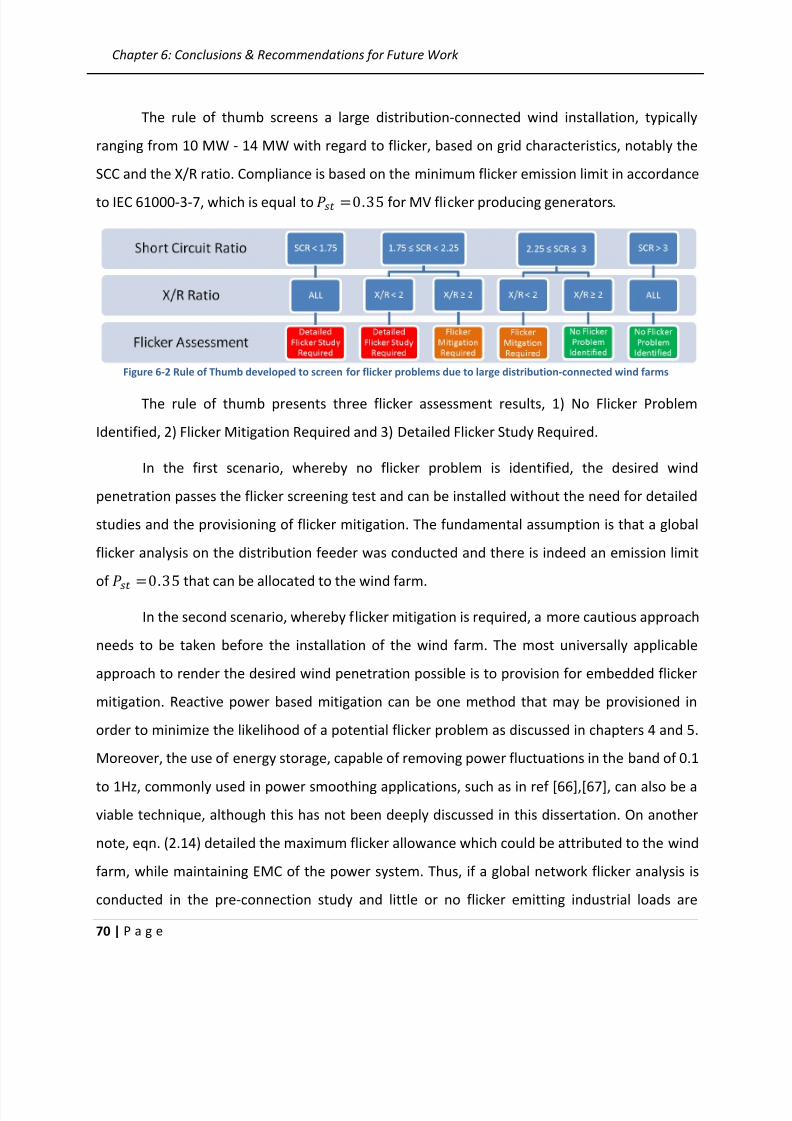
8/9/2019 Voltage Flicker Assessment in Distribution Feeders With Large Wind Farms
http://slidepdf.com/reader/full/voltage-flicker-assessment-in-distribution-feeders-with-large-wind-farms 84/97
Chapter 6: Conclusions & Recommendations for Future Work
70 | P a g e
The rule of thumb screens a large distribution-connected wind installation, typically
ranging from 10 MW - 14 MW with regard to flicker, based on grid characteristics, notably the
SCC and the X/R ratio. Compliance is based on the minimum flicker emission limit in accordance
to IEC 61000-3-7, which is equal to for MV flicker producing generators.
Figure 6-2 Rule of Thumb developed to screen for flicker problems due to large distribution-connected wind farms
The rule of thumb presents three flicker assessment results, 1) No Flicker Problem
Identified, 2) Flicker Mitigation Required and 3) Detailed Flicker Study Required.
In the first scenario, whereby no flicker problem is identified, the desired wind
penetration passes the flicker screening test and can be installed without the need for detailed
studies and the provisioning of flicker mitigation. The fundamental assumption is that a global
flicker analysis on the distribution feeder was conducted and there is indeed an emission limit
of
that can be allocated to the wind farm.
In the second scenario, whereby flicker mitigation is required, a more cautious approach
needs to be taken before the installation of the wind farm. The most universally applicable
approach to render the desired wind penetration possible is to provision for embedded flicker
mitigation. Reactive power based mitigation can be one method that may be provisioned in
order to minimize the likelihood of a potential flicker problem as discussed in chapters 4 and 5.
Moreover, the use of energy storage, capable of removing power fluctuations in the band of 0.1
to 1Hz, commonly used in power smoothing applications, such as in ref [66],[67], can also be a
viable technique, although this has not been deeply discussed in this dissertation. On another
note, eqn. (2.14) detailed the maximum flicker allowance which could be attributed to the wind
farm, while maintaining EMC of the power system. Thus, if a global network flicker analysis is
conducted in the pre-connection study and little or no flicker emitting industrial loads are
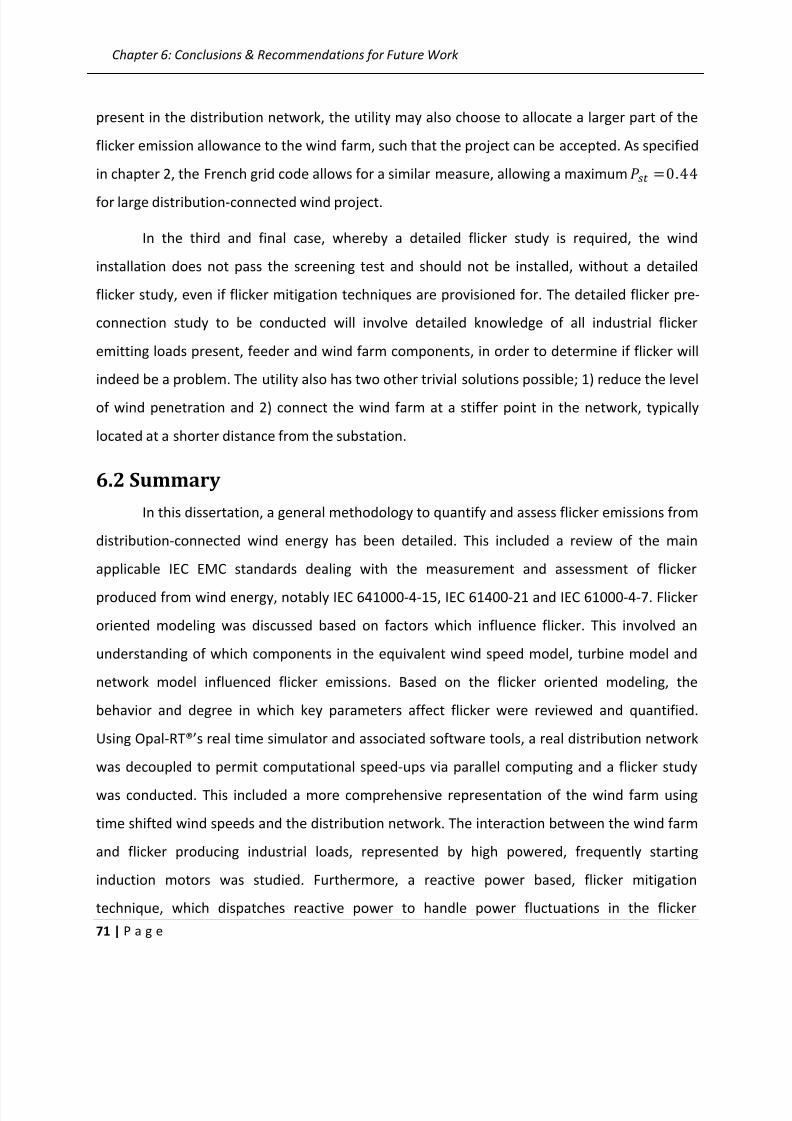
8/9/2019 Voltage Flicker Assessment in Distribution Feeders With Large Wind Farms
http://slidepdf.com/reader/full/voltage-flicker-assessment-in-distribution-feeders-with-large-wind-farms 85/97
Chapter 6: Conclusions & Recommendations for Future Work
71 | P a g e
present in the distribution network, the utility may also choose to allocate a larger part of the
flicker emission allowance to the wind farm, such that the project can be accepted. As specified
in chapter 2, the French grid code allows for a similar measure, allowing a maximum
for large distribution-connected wind project.
In the third and final case, whereby a detailed flicker study is required, the wind
installation does not pass the screening test and should not be installed, without a detailed
flicker study, even if flicker mitigation techniques are provisioned for. The detailed flicker pre-
connection study to be conducted will involve detailed knowledge of all industrial flicker
emitting loads present, feeder and wind farm components, in order to determine if flicker will
indeed be a problem. The utility also has two other trivial solutions possible; 1) reduce the level
of wind penetration and 2) connect the wind farm at a stiffer point in the network, typically
located at a shorter distance from the substation.
6.2 Summary
In this dissertation, a general methodology to quantify and assess flicker emissions from
distribution-connected wind energy has been detailed. This included a review of the main
applicable IEC EMC standards dealing with the measurement and assessment of flicker
produced from wind energy, notably IEC 641000-4-15, IEC 61400-21 and IEC 61000-4-7. Flicker
oriented modeling was discussed based on factors which influence flicker. This involved an
understanding of which components in the equivalent wind speed model, turbine model and
network model influenced flicker emissions. Based on the flicker oriented modeling, the
behavior and degree in which key parameters affect flicker were reviewed and quantified.
Using Opal-RT®’s real time simulator and associated software tools, a real distribution network
was decoupled to permit computational speed-ups via parallel computing and a flicker study
was conducted. This included a more comprehensive representation of the wind farm using
time shifted wind speeds and the distribution network. The interaction between the wind farm
and flicker producing industrial loads, represented by high powered, frequently starting
induction motors was studied. Furthermore, a reactive power based, flicker mitigation
technique, which dispatches reactive power to handle power fluctuations in the flicker

8/9/2019 Voltage Flicker Assessment in Distribution Feeders With Large Wind Farms
http://slidepdf.com/reader/full/voltage-flicker-assessment-in-distribution-feeders-with-large-wind-farms 86/97
Chapter 6: Conclusions & Recommendations for Future Work
72 | P a g e
frequency range was tested and proven to be potentially be a viable solution. Lastly a rule of
thumb to be used as a flicker screening technique, during a pre-connection study was
formulated.
6.3 Conclusion
Large, distribution-connected wind farms may result in a voltage flicker problem and
thus, limit the greatest level of wind penetration possible. Flicker emissions from a modern day
Type 3 or Type 4 WTG are mainly influenced by turbulent and gusty winds and network
characteristics. In situations where the severity of flicker emissions is anticipated to exceed the
allocated emission limits, the provisioning of flicker mitigation techniques and emission
coordination become essential. Thus, pre-connection studies are required to determine if
flicker amongst other issues will be a limiting technical factor hindering the implementation of a
wind project. The rule of thumb developed for flicker assessment is one tool utilities can now
use to analyze large distribution-connected wind projects.
6.4 Recommendations for further work
Despite the research effort conducted in quantifying and assessing flicker emissions
from distribution-connected wind farms, more work is required to keep up with future revisions
of the IEC Flickermeter instrument, that may eventually consider modern lighting, revised
flicker emission limits provided by emerging grid codes and economically viable flicker
mitigation techniques. This section enumerates some ideas for extending the scope of the
work.
6.4.1 Adaptable reactive power based flicker mitigation technique
There is no need for a flicker mitigation technique to operate and dispatch reactive
power continuously. Flicker emissions from a distribution-connected wind farm will only exceed
emission limits during certain time periods categorized by highly turbulent and gusty winds.
Hence, there are significant opportunities in operating flicker mitigation scheme in an “only
when needed” basis, (i.e. when emission limits allocated to the fluctuation installation are
surpassed). This type of strategy would lead a more efficient use of reactive power. Figure 6-3

8/9/2019 Voltage Flicker Assessment in Distribution Feeders With Large Wind Farms
http://slidepdf.com/reader/full/voltage-flicker-assessment-in-distribution-feeders-with-large-wind-farms 87/97
Chapter 6: Conclusions & Recommendations for Future Work
73 | P a g e
present a modification to the controller presented in section 4.5.3. Essentially, is set to when flicker emissions are not deemed a problem and set to
when flicker emissions are deemed a problem.
Pmeas -K*R/X+
-
+
+
-
+
Q meas
Q ref
Q ss
Q Pst PI Iqrref Pfluctuations
LPF, f cut-off =0.05Hz
0
Mode selection
Relay
Supplementary control
Figure 6-3 Controller diagram
Normal state
Mode selection: Q Pst = 0
Sliding 10 minute Pst measurement > Normal state threshold
YesNo
Flicker mitigation state
Mode selection: Q Pst
= -K*R/X*Pfluctuations
Sliding 10 minute Pst measurement > Flicker mitigation state threshold
YesNo
Figure 6-4 Supplementary control algorithm
Figure 6-4 describes the algorithm which will select which mode the turbine will operate
in. The first mode, called the “Normal state” does not involve any flicker mitigation. The second
mode, called “Flicker mitigation state” activates the flicker mitigation scheme. The trigger,
which would determine the WTGs operating mode would be a 10 minute sliding flicker
measurement taken at the PCC compared to a flicker emission threshold. There would also be
one threshold associated with each state. Thus, in the normal state with no flicker mitigation,
8/9/2019 Voltage Flicker Assessment in Distribution Feeders With Large Wind Farms
http://slidepdf.com/reader/full/voltage-flicker-assessment-in-distribution-feeders-with-large-wind-farms 88/97
Chapter 6: Conclusions & Recommendations for Future Work
74 | P a g e
flicker would need to be above a certain emission threshold to activate the flicker mitigation
scheme and once the flicker mitigation scheme was activated, emissions would need to be
below a second smaller emission threshold for the turbine to return to its normal state. These
emission thresholds would need to be tuned on a case by case basis in accordance to the
distribution feeder under study and emission limits granted. The implementation and benefits
of the adaptable mitigation scheme would need to be tested for a much longer time frame,
over a range of grid and wind conditions.
6.4.2 Flicker mitigation via energy storage
Recommendations for further work can also be with flicker mitigation techniques
involving the use of ESSs. Currently, energy storage has been mostly used for power smoothing
applications as in [66]-[69]. It would be interesting to investigate the level in which energy
storage can attenuate flicker emissions and if it can be optimally sized to be practically viable.
Hence, this research would involve the design of an embedded ESS, of optimal size to reduce
WTG flicker emissions.

8/9/2019 Voltage Flicker Assessment in Distribution Feeders With Large Wind Farms
http://slidepdf.com/reader/full/voltage-flicker-assessment-in-distribution-feeders-with-large-wind-farms 89/97
Appendix
75 | P a g e
Appendix
Appendix A
Parameter Value
Rated power 2 MW
Rated frequency 60 Hz
Rated voltage 0.575 kV
Rated speed 16.7 r/min
Stator resistance 0.023 pu
Stator reactance 0.18 pu
Rotor resistance 0.016 pu
Rotor reactance 0.016 pu
Pole pairs 3
Generator inertia () 0.8 s
Turbine inertia () 4.2 s
Shaft stiffness () 1.52 pu
Shaft mutual damping () 3.4 pu
Rotor radius () 35 m
Hub height () 80 m
Tower radius () 2 m
Distance from blade origin to tower midline () 3 m
Empirical wind shear exponent () 0.3
Lambda opt
9.9495
Power coefficient () 0.5Coefficients ( )
0.6450
116
0.4
5
21
0.00912
0.08
0.035
Air density (
) 1.29 Kg/m3
Parameters of the DFIG WTG
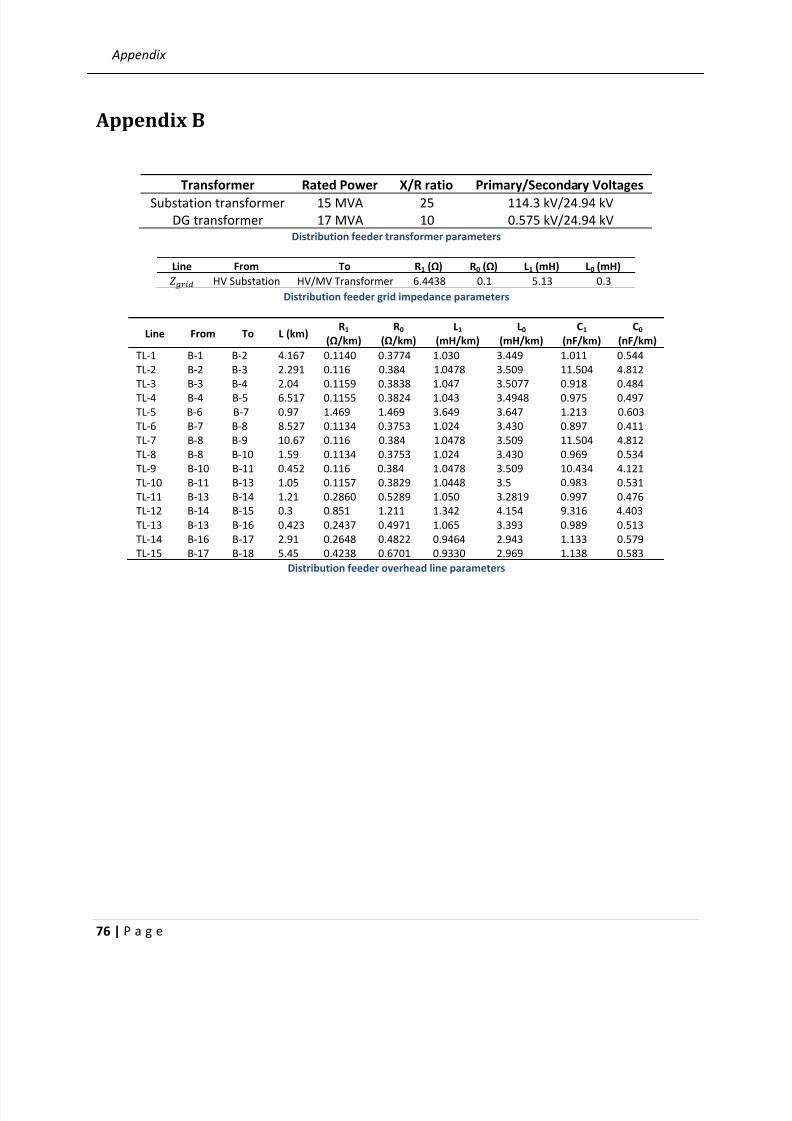
8/9/2019 Voltage Flicker Assessment in Distribution Feeders With Large Wind Farms
http://slidepdf.com/reader/full/voltage-flicker-assessment-in-distribution-feeders-with-large-wind-farms 90/97
Appendix
76 | P a g e
Appendix B
Transformer Rated Power X/R ratio Primary/Secondary Voltages
Substation transformer 15 MVA 25 114.3 kV/24.94 kV
DG transformer 17 MVA 10 0.575 kV/24.94 kVDistribution feeder transformer parameters
Line From To R1 (Ω) R0 (Ω) L1 (mH) L0 (mH) HV Substation HV/MV Transformer 6.4438 0.1 5.13 0.3
Distribution feeder grid impedance parameters
Line From To L (km)R1
(Ω/km)
R0
(Ω/km)
L1
(mH/km)
L0
(mH/km)
C1
(nF/km)
C0
(nF/km)
TL-1 B-1 B-2 4.167 0.1140 0.3774 1.030 3.449 1.011 0.544
TL-2 B-2 B-3 2.291 0.116 0.384 1.0478 3.509 11.504 4.812
TL-3 B-3 B-4 2.04 0.1159 0.3838 1.047 3.5077 0.918 0.484
TL-4 B-4 B-5 6.517 0.1155 0.3824 1.043 3.4948 0.975 0.497
TL-5 B-6 B-7 0.97 1.469 1.469 3.649 3.647 1.213 0.603
TL-6 B-7 B-8 8.527 0.1134 0.3753 1.024 3.430 0.897 0.411
TL-7 B-8 B-9 10.67 0.116 0.384 1.0478 3.509 11.504 4.812
TL-8 B-8 B-10 1.59 0.1134 0.3753 1.024 3.430 0.969 0.534
TL-9 B-10 B-11 0.452 0.116 0.384 1.0478 3.509 10.434 4.121
TL-10 B-11 B-13 1.05 0.1157 0.3829 1.0448 3.5 0.983 0.531
TL-11 B-13 B-14 1.21 0.2860 0.5289 1.050 3.2819 0.997 0.476
TL-12 B-14 B-15 0.3 0.851 1.211 1.342 4.154 9.316 4.403
TL-13 B-13 B-16 0.423 0.2437 0.4971 1.065 3.393 0.989 0.513
TL-14 B-16 B-17 2.91 0.2648 0.4822 0.9464 2.943 1.133 0.579
TL-15 B-17 B-18 5.45 0.4238 0.6701 0.9330 2.969 1.138 0.583
Distribution feeder overhead line parameters

8/9/2019 Voltage Flicker Assessment in Distribution Feeders With Large Wind Farms
http://slidepdf.com/reader/full/voltage-flicker-assessment-in-distribution-feeders-with-large-wind-farms 91/97
References
77 | P a g e
References
[1]
Global Wind Energy Council (2012, February). Global Wind Statistics 2011. [Online].
Available:http://www.gwec.net/fileadmin/images/News/Press/GWEC_-
Global_Wind_Statistics_2011.pdf
[2] Global Wind Energy Council (2012, March). Global Wind Report. [Online].
Available:http://www.gwec.net/fileadmin/documents/NewsDocuments/Annual_report_2
011_lowres.pdf
[3] Hydro Québec (2009, August). Strategic Plan 2009-2013. [Online].Available:
http://www.hydroquebec.com/publications/en/strategic_plan/pdf/plan-strategique-
2009-2013.pdf
[4] T. Ackerman, G. Anderson, and L. Soder, “Distributed generation: a definition,” Electric
Power System Research, vol. 57, pp. 195 –204, 2001.[5] Quebec Government Department of Natural Resources and Wildlife (2005, June). Hydro-
Québec Integrated Network Integration Capability with Respect to the Addition of Wind
Energy Generation. [Online]. Available:
http://www.mrnf.gouv.qc.ca/english/publications/energy/capacite-integration-version-
anglaise-RSW.pdf
[6] Li, H.; Chen, Z.; , "Overview of different wind generator systems and their comparisons,"
Renewable Power Generation, IET , vol.2, no.2, pp.123-138, June 2008
[7] Polinder, H.; , "Overview of and trends in wind turbine generator systems," Power and
Energy Society General Meeting, 2011 IEEE , vol., no., pp.1-8, 24-29 July 2011
[8]
A. D. Hansen, F. Iov, F. Blaabjerg, and L. H. Hansen, “Review of contemporary windturbine concepts and their market penetration,” Wind Engineering, vol. 28, no. 3, pp. 247-
263, 2004.
[9] T. Xu and P. Taylor, “Voltage control techniques for electrical distribution networks
including distributed generation,” presented at the Proc. 17th World Congress The
International Federation of Automatic Control,Seoul, 2008.
[10] Stavros A. Papathanassiou, A technical evaluation framework for the connection of DG to
the distribution network, Electric Power Systems Research, Volume 77, Issue 1, Pages 24-
34, January 2007.
[11] Deutsches Windenergie-Institut GmbH in Germany; Tech-wise A/S in Denmark and DM
Energy in United Kingdom: “Wind Turbine Grid Connection and Interaction”, 2001.
[12] BC Hydro, “Power Quality: A guide to voltage fluctuation and light flicker,” March 2005
[Online]. Available:
http://www.bchydro.com/etc/medialib/internet/documents/psbusiness/pdf/power_qual
ity_a_guide_to_voltage_fluctuation_and_light_fl.Par.0001.File.power_quality_a_guide_t
o_voltage_fluctuation_and_light_fl.pdf
http://www.mrnf.gouv.qc.ca/english/publications/energy/capacite-integration-version-anglaise-RSW.pdf
http://www.mrnf.gouv.qc.ca/english/publications/energy/capacite-integration-version-anglaise-RSW.pdf
http://www.mrnf.gouv.qc.ca/english/publications/energy/capacite-integration-version-anglaise-RSW.pdf

8/9/2019 Voltage Flicker Assessment in Distribution Feeders With Large Wind Farms
http://slidepdf.com/reader/full/voltage-flicker-assessment-in-distribution-feeders-with-large-wind-farms 92/97
References
78 | P a g e
[13] Owen, E.L.; , "Power disturbance and quality: light flicker voltage requirements ," Industry
Applications Magazine, IEEE , vol.2, no.1, pp.20-27, Jan/Feb 1996
[14] Bayo, A. H. (2008) Voltage Fluctuations and Flicker, in Handbook of Power Quality (ed A.
Baggini), John Wiley & Sons, Ltd, Chichester, UK.
[15]
IEC 61000-4-15:2003, Electromagnetic Compatibility (EMC)—Part 4: Testing and
measurement techniques—Section 15: Flickermeter—Functional and design
specifications.
[16] Halpin, S.M.; Bergeron, R.; Blooming, T.M.; Burch, R.F.; Conrad, L.E.; Key, T.S.; , "Voltage
and lamp flicker issues: should the IEEE adopt the IEC approach?," Power Delivery, IEEE
Transactions on , vol.18, no.3, pp. 1088- 1097, July 2003
[17] Cooper Development Association (2005, October). Voltage Disturbances: Flicker
Measurement. [Online]. Available: http://www.copperinfo.co.uk/power-
quality/downloads/pqug/523-flicker-measurement.pdf
[18] De Lange H., “Eye’s response at flicker fusion to square -wave modulation of a test field
surrounded by a large steady field of equal mean luminance,” Journal of the Optical
Society of America, vol. 51, pp. 415 –421, 1961
[19] Rashbass C., “The visibility of transient changes of luminance,” Journal of Physiology, vol.
210, pp. 165 –186, 1970
[20] "IEEE Application Guide for IEEE Std 1547, IEEE Standard for Interconnecting Distributed
Resources with Electric Power Systems," IEEE Std 1547.2-2008 , vol., no., pp.1-207, April
15 2009.
[21] Larsson, A.; , "Flicker Emission of Wind Turbines during Continuous Operation," Power
Engineering Review, IEEE , vol.22, no.2, pp.59, Feb. 2002
[22] Tao Sun; Zhe Chen; Blaabjerg, F.; , "Flicker study on variable speed wind turbines with
doubly fed induction generators," Energy Conversion, IEEE Transactions on , vol.20, no.4,
pp. 896- 905, Dec. 2005
[23] Weihao Hu; Zhe Chen; Yue Wang; Zhaoan Wang; , "Flicker study on variable speed wind
turbines with permanent magnet synchronous generator," Power Electronics and Motion
Control Conference, 2008. EPE-PEMC 2008. 13th , vol., no., pp.2325-2330, 1-3 Sept. 2008
[24]
Papadopoulos, M.P.; Papathanassiou, S.A.; Tentzerakis, S.T.; Boulaxis, N.G.; ,
"Investigation of the flicker emission by grid connected wind turbines," Harmonics and
Quality of Power Proceedings, 1998. Proceedings. 8th International Conference On , vol.2,
no., pp.1152-1157 vol.2, 14-18 Oct 1998
[25]
Chun Wei; Minxiao Han; Wenli Yan; , "Voltage fluctuation and flicker assessment of a
weak system integrated wind farm," Power and Energy Society General Meeting, 2011
IEEE , vol., no., pp.1-5, 24-29 July 2011
[26] Thiringer, T.; Petru, T.; Lundberg, S.; , "Flicker contribution from wind turbine
installations," Energy Conversion, IEEE Transactions on , vol.19, no.1, pp. 157- 163, March
2004
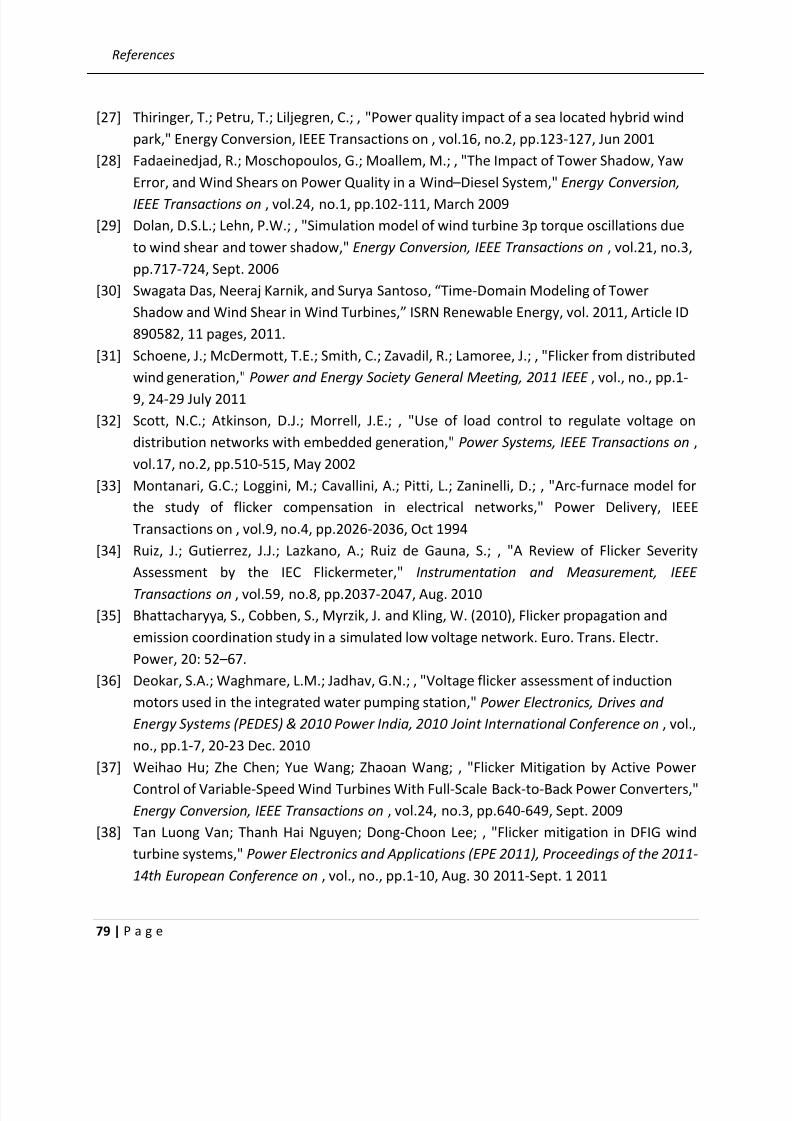
8/9/2019 Voltage Flicker Assessment in Distribution Feeders With Large Wind Farms
http://slidepdf.com/reader/full/voltage-flicker-assessment-in-distribution-feeders-with-large-wind-farms 93/97
References
79 | P a g e
[27] Thiringer, T.; Petru, T.; Liljegren, C.; , "Power quality impact of a sea located hybrid wind
park," Energy Conversion, IEEE Transactions on , vol.16, no.2, pp.123-127, Jun 2001
[28] Fadaeinedjad, R.; Moschopoulos, G.; Moallem, M.; , "The Impact of Tower Shadow, Yaw
Error, and Wind Shears on Power Quality in a Wind –Diesel System," Energy Conversion,
IEEE Transactions on , vol.24, no.1, pp.102-111, March 2009
[29] Dolan, D.S.L.; Lehn, P.W.; , "Simulation model of wind turbine 3p torque oscillations due
to wind shear and tower shadow," Energy Conversion, IEEE Transactions on , vol.21, no.3,
pp.717-724, Sept. 2006
[30] Swagata Das, Neeraj Karnik, and Surya Santoso, “Time-Domain Modeling of Tower
Shadow and Wind Shear in Wind Turbines,” ISRN Renewable Energy, vol. 2011, Article ID
890582, 11 pages, 2011.
[31] Schoene, J.; McDermott, T.E.; Smith, C.; Zavadil, R.; Lamoree, J.; , "Flicker from distributed
wind generation," Power and Energy Society General Meeting, 2011 IEEE , vol., no., pp.1-
9, 24-29 July 2011
[32] Scott, N.C.; Atkinson, D.J.; Morrell, J.E.; , "Use of load control to regulate voltage on
distribution networks with embedded generation," Power Systems, IEEE Transactions on ,
vol.17, no.2, pp.510-515, May 2002
[33] Montanari, G.C.; Loggini, M.; Cavallini, A.; Pitti, L.; Zaninelli, D.; , "Arc-furnace model for
the study of flicker compensation in electrical networks," Power Delivery, IEEE
Transactions on , vol.9, no.4, pp.2026-2036, Oct 1994
[34] Ruiz, J.; Gutierrez, J.J.; Lazkano, A.; Ruiz de Gauna, S.; , "A Review of Flicker Severity
Assessment by the IEC Flickermeter," Instrumentation and Measurement, IEEE
Transactions on , vol.59, no.8, pp.2037-2047, Aug. 2010
[35] Bhattacharyya, S., Cobben, S., Myrzik, J. and Kling, W. (2010), Flicker propagation and
emission coordination study in a simulated low voltage network. Euro. Trans. Electr.
Power, 20: 52 –67.
[36] Deokar, S.A.; Waghmare, L.M.; Jadhav, G.N.; , "Voltage flicker assessment of induction
motors used in the integrated water pumping station," Power Electronics, Drives and
Energy Systems (PEDES) & 2010 Power India, 2010 Joint International Conference on , vol.,
no., pp.1-7, 20-23 Dec. 2010
[37] Weihao Hu; Zhe Chen; Yue Wang; Zhaoan Wang; , "Flicker Mitigation by Active Power
Control of Variable-Speed Wind Turbines With Full-Scale Back-to-Back Power Converters,"
Energy Conversion, IEEE Transactions on , vol.24, no.3, pp.640-649, Sept. 2009
[38] Tan Luong Van; Thanh Hai Nguyen; Dong-Choon Lee; , "Flicker mitigation in DFIG wind
turbine systems," Power Electronics and Applications (EPE 2011), Proceedings of the 2011-
14th European Conference on , vol., no., pp.1-10, Aug. 30 2011-Sept. 1 2011
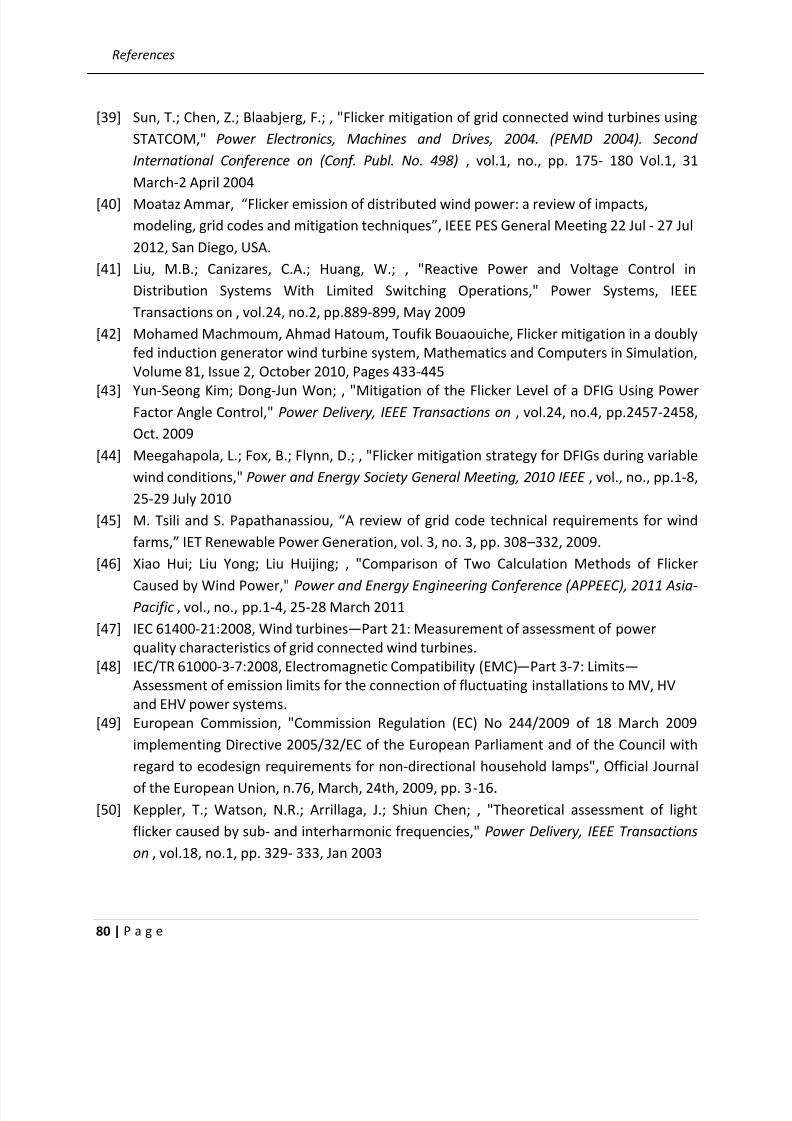
8/9/2019 Voltage Flicker Assessment in Distribution Feeders With Large Wind Farms
http://slidepdf.com/reader/full/voltage-flicker-assessment-in-distribution-feeders-with-large-wind-farms 94/97
References
80 | P a g e
[39] Sun, T.; Chen, Z.; Blaabjerg, F.; , "Flicker mitigation of grid connected wind turbines using
STATCOM," Power Electronics, Machines and Drives, 2004. (PEMD 2004). Second
International Conference on (Conf. Publ. No. 498) , vol.1, no., pp. 175- 180 Vol.1, 31
March-2 April 2004
[40]
Moataz Ammar, “Flicker emission of distributed wind power: a review of impacts,
modeling, grid codes and mitigation techniques”, IEEE PES General Meeting 22 Jul - 27 Jul
2012, San Diego, USA.
[41] Liu, M.B.; Canizares, C.A.; Huang, W.; , "Reactive Power and Voltage Control in
Distribution Systems With Limited Switching Operations," Power Systems, IEEE
Transactions on , vol.24, no.2, pp.889-899, May 2009
[42] Mohamed Machmoum, Ahmad Hatoum, Toufik Bouaouiche, Flicker mitigation in a doubly
fed induction generator wind turbine system, Mathematics and Computers in Simulation,
Volume 81, Issue 2, October 2010, Pages 433-445
[43]
Yun-Seong Kim; Dong-Jun Won; , "Mitigation of the Flicker Level of a DFIG Using PowerFactor Angle Control," Power Delivery, IEEE Transactions on , vol.24, no.4, pp.2457-2458,
Oct. 2009
[44] Meegahapola, L.; Fox, B.; Flynn, D.; , "Flicker mitigation strategy for DFIGs during variable
wind conditions," Power and Energy Society General Meeting, 2010 IEEE , vol., no., pp.1-8,
25-29 July 2010
[45]
M. Tsili and S. Papathanassiou, “A review of grid code technical requirements for wind
farms,” IET Renewable Power Generation, vol. 3, no. 3, pp. 308 –332, 2009.
[46] Xiao Hui; Liu Yong; Liu Huijing; , "Comparison of Two Calculation Methods of Flicker
Caused by Wind Power," Power and Energy Engineering Conference (APPEEC), 2011 Asia-Pacific , vol., no., pp.1-4, 25-28 March 2011
[47] IEC 61400-21:2008, Wind turbines—Part 21: Measurement of assessment of power
quality characteristics of grid connected wind turbines.
[48] IEC/TR 61000-3-7:2008, Electromagnetic Compatibility (EMC)—Part 3-7: Limits—
Assessment of emission limits for the connection of fluctuating installations to MV, HV
and EHV power systems.
[49] European Commission, "Commission Regulation (EC) No 244/2009 of 18 March 2009
implementing Directive 2005/32/EC of the European Parliament and of the Council with
regard to ecodesign requirements for non-directional household lamps", Official Journal
of the European Union, n.76, March, 24th, 2009, pp. 3-16.
[50] Keppler, T.; Watson, N.R.; Arrillaga, J.; Shiun Chen; , "Theoretical assessment of light
flicker caused by sub- and interharmonic frequencies," Power Delivery, IEEE Transactions
on , vol.18, no.1, pp. 329- 333, Jan 2003
8/9/2019 Voltage Flicker Assessment in Distribution Feeders With Large Wind Farms
http://slidepdf.com/reader/full/voltage-flicker-assessment-in-distribution-feeders-with-large-wind-farms 95/97
References
81 | P a g e
[51] Xu, W.; , "Deficiency of the IEC flicker meter for measuring interharmonic-caused voltage
flickers," Power Engineering Society General Meeting, 2005. IEEE , vol., no., pp. 2326-
2329 Vol. 3, 12-16 June 2005
[52] Drapela, J.; Toman, P.; , "Interharmonic - Flicker Curves of Lamps and Compatibility Lever
for Interharmonic Voltages," Power Tech, 2007 IEEE Lausanne , vol., no., pp.1552-1557, 1-
5 July 2007
[53] Chen, S.; Lo, C.M.; Foo, M.K.; How, K.T.; , "Testing of fluorescent lamps for its flickering
susceptibility towards interharmonic voltages," Power Engineering Conference, 2007. IPEC
2007. International , vol., no., pp.326-331, 3-6 Dec. 2007
[54] Emanuel, A.E.; Peretto, L.; , "The response of fluorescent lamp with magnetic ballast to
voltage distortion," Power Delivery, IEEE Transactions on , vol.12, no.1, pp.289-295, Jan
1997
[55] De Jaeger, Emmanuel; , "Disturbance emission level assessment techniques (CIGRE-CIRED
joint working group C4.109)," Electricity Distribution - Part 2, 2009. CIRED 2009. The 20th
International Conference and Exhibition on , vol., no., pp.1-2, 8-11 June 2009
[56] Yang, X.; Gauthier, J.; , "How can flicker level be determined before a customer is
connected to the electric grid," Power & Energy Society General Meeting, 2009. PES '09.
IEEE , vol., no., pp.1-6, 26-30 July 2009
[57] E. Welfonder, R. Neifer, M. Spanner, Development and experimental identification of
dynamic models for wind turbines, Control Engineering Practice, Volume 5, Issue 1, Pages
63-73, January 1997
[58] Liu Yanjie; Wang Jun; , "A large time scale wind velocity simulation method," Computer
Design and Applications (ICCDA), 2010 International Conference on , vol.4, no., pp.V4-282-
V4-286, 25-27 June 2010
[59] Poul Sørensen, Anca D. Hansen, Pedro André Carvalho Rosas, Wind models for simulation
of power fluctuations from wind farms, Journal of Wind Engineering and Industrial
Aerodynamics, Volume 90, Issues 12 –15, Pages 1381-1402, December 2002
[60] Amadou D. Diop, Emil Ceanga, Jean-Louis Rétiveau, Jean-François Méthot, Adrian Ilinca,
Real-time three-dimensional wind simulation for windmill rig tests, Renewable Energy,
Volume 32, Issue 13, Pages 2268-2290, October 2007
[61] Nichita, C.; Luca, D.; Dakyo, B.; Ceanga, E.; , "Large band simulation of the wind speed for
real time windturbine simulators," Energy Conversion, IEEE Transactions on , vol.17, no.4,
pp. 523- 529, Dec 2002
[62] Petru, T.; Thiringer, T.; , "Modeling of wind turbines for power system studies," Power
Systems, IEEE Transactions on , vol.17, no.4, pp. 1132- 1139, Nov 2002
8/9/2019 Voltage Flicker Assessment in Distribution Feeders With Large Wind Farms
http://slidepdf.com/reader/full/voltage-flicker-assessment-in-distribution-feeders-with-large-wind-farms 96/97
References
82 | P a g e
[63] Ming Yin; Gengyin Li; Ming Zhou; Guoping Liu; Chengyong Zhao; , "Study on the control of
DFIG and its responses to grid disturbances," Power Engineering Society General Meeting,
2006. IEEE , vol., no., pp.6 pp.,
[64] Moataz Ammar, Geza Joos, “Combined active/reactive power control for flicker
mitigation in distributed wind power”, 2012 IEEE Energy Conversion Congress and
Exposition (ECCE), Raleigh, North Carolina.
[65] Moataz Ammar, Philippe Venne, Chad Abbey, Geza Joos, A methodology for assessing
the impact of distributed wind power on voltage flicker”, Cigre International Symposium
on the Electric Power System of the Future, 13-15 September 2011, Bologna, Italy.
[66] Wei Li; Joos, G.; Abbey, C.; , "Attenuation of Wind Power Fluctuations in Wind Turbine
Generators using a DC Bus Capacitor Based Filtering Control Scheme," Industry
Applications Conference, 2006. 41st IAS Annual Meeting. Conference Record of the 2006
IEEE , vol.1, no., pp.216-221, 8-12 Oct. 2006
[67]
Wei Li; Joos, G.; Abbey, C.; , "Wind Power Impact on System Frequency Deviation and anESS based Power Filtering Algorithm Solution," Power Systems Conference and Exposition,
2006. PSCE '06. 2006 IEEE PES , vol., no., pp.2077-2084, Oct. 29 2006-Nov. 1 2006
[68] Shajari, S.; Key Pour, R.; , "Reduction of battery size and charge-discharge for active
power smoothing of DFIG," Environment and Electrical Engineering (EEEIC), 2012 11th
International Conference on , vol., no., pp.112-114, 18-25 May 2012
[69]
Aghatehrani, R.; Kavasseri, R.; Thapa, R.C.; , "Power smoothing of the DFIG wind turbine
using a small energy storage device," Power and Energy Society General Meeting, 2010
IEEE , vol., no., pp.1-6, 25-29 July 2010
[70]
White, L.W.; Bhattacharya, S.; , "A Discrete Matlab –Simulink Flickermeter Model forPower Quality Studies," Instrumentation and Measurement, IEEE Transactions on , vol.59,
no.3, pp.527-533, March 2010
[71] Soo-Hwan Cho, Jae-Ahn Jung, Gilsoo Jan, Sae-Hyuk Kwon and Moon-Ho Kang;,
“Development of Matlab/Simulink Module for Voltage Flicker Simulationin Distribution
Power Systems,” Journal of Electrical Engineering & Technology, Vol. 3, No. 3, pp. 314-
319, 2008
[72] Bertola, A.; Lazaroiu, G.C.; Roscia, M.; Zaninelli, D.; , "A Matlab-Simulink flickermeter
model for power quality studies," Harmonics and Quality of Power, 2004. 11th
International Conference on , vol., no., pp. 734- 738, 12-15 Sept. 2004[73] Mombauer, W.; , "Flicker-simulation and minimization," Electricity Distribution, 1989.
CIRED 1989. 10th International Conference on, vol., no., pp.102-106 vol.2, 8-12 May 1989
[74] Drapela, J., Slezingr, J. A Light-flickermeter – Part I: Design.Proceedings of the 11th
Conference Electric Power Engineering 2010.Brno University of Technology, 2010, pp.453-
458

8/9/2019 Voltage Flicker Assessment in Distribution Feeders With Large Wind Farms
http://slidepdf.com/reader/full/voltage-flicker-assessment-in-distribution-feeders-with-large-wind-farms 97/97
References
[75] Miller, N.W.; Sanchez-Gasca, J.J.; Price, W.W.; Delmerico, R.W.; , "Dynamic modeling of
GE 1.5 and 3.6 MW wind turbine-generators for stability simulations," Power Engineering
Society General Meeting, 2003, IEEE , vol.3, no., pp. 1977- 1983 Vol. 3, 13-17 July 2003
[76] P. C. Krause, O.Wasynczuk, and S. D. Sudhoff, Analysis of Electric Machinery , IEEE Press,
1995.
[77] Emanuel, H.; Schellschmidt, M.; Wachtel, S.; Adloff, S.; , "Power quality measurements of
wind energy converters with full-scale converter according to IEC 61400-21," Electrical
Power Quality and Utilisation, 2009. EPQU 2009. 10th International Conference on , vol.,
no., pp.1-7, 15-17 Sept. 2009
[78] Stavros A. Papathanassiou, Spyros J. Kiartzis, Michael P.Papadopoulos, Antonios G. Kladas,
“Wind Turbine Flicker Calculation using Neural Networks,” Wind Engineering, vol. 24, no.
5, pp. 317-335, 2000.
[79] Gagnon, R.; Fecteau, M.; Prud'Homme, P.; Lemieux, E.; Turmel, G.; Pare, D.; Duong, F.; ,
"Hydro-Québec Strategy to Evaluate Electrical Transients Following Wind Power Plant
Integration in the Gaspésie Transmission System," Sustainable Energy, IEEE Transactions
on , vol.3, no.4, pp.880-889, Oct. 2012
[80] C. Larose, R. Gagnon, G. Turmel, P. Giroux, J. Brochu, D. McNabb, and D. Lefebvre, “Large
wind power plant modeling techniques for power system simulation studies,” in Proc. 8th
Int. Workshop Large-Scale Integration of Wind Power Into Power Systems, Bremen,
Germany, Oct. 2009, pp. 472 –478.