volatile compounds as quality indicators in chilled fish - Skemman
249
Thesis for the Degree of Doctor of Philosophy VOLATILE COMPOUNDS AS QUALITY INDICATORS IN CHILLED FISH: EVALUATION OF MICROBIAL METABOLITES BY AN ELECTRONIC NOSE Guðrún Ólafsdóttir Faculty of Science University of Iceland and Icelandic Fisheries Laboratories Reykjavík 2005
Transcript of volatile compounds as quality indicators in chilled fish - Skemman

Thesis for the Degree of Doctor of Philosophy
VOLATILE COMPOUNDS AS QUALITY INDICATORS IN
CHILLED FISH: EVALUATION OF MICROBIAL
METABOLITES BY AN ELECTRONIC NOSE
Guðrún Ólafsdóttir
Faculty of Science
University of Iceland
and
Icelandic Fisheries Laboratories
Reykjavík 2005

ii
Academic Dissertation
University of Iceland, Faculty of Science,
Department of Food Science and Nutrition, Reykjavik, Iceland
and Icelandic Fisheries Laboratories, Reykjavik, Iceland
Supervised by
Dr. Kristberg Kristbergsson, Department of Food Science and Nutrition, University of Iceland
Ph D Committee
Dr. Jörg Oehlenschläger, Federal Research Centre for Fisheries (FRCF), Germany
Dr. Joop B. Luten, Netherlands Institute for Fisheries Research (RIVO), The Netherlands
Dr. Rögnvaldur Ólafsson University of Iceland
Dr. Ágústa Guðmundsdóttir, University of Iceland
Opponents
Dr. Ragnar L. Olsen, Norwegian College of Fishery Science, Norway
Dr. Saverio Mannino, Università degli Studi di Milano, Italy
Volatile compounds as quality indicators of fish
© Guðrún Ólafsdottir, 2005
Printed in Iceland by Gutenberg, Reykjavik, 2005
ISBN 9979-70-052-1

iii
VOLATILE COMPOUNDS AS QUALITY INDICATORS IN CHILLED FISH: EVALUATION OF MICROBIAL METABOLITES BY AN ELECTRONIC NOSE
Guðrún Ólafsdóttir Department of Food Science and Nutrition, University of Iceland
Icelandic Fisheries Laboratories, Reykjavík, Iceland ABSTRACT
Key determinants of chilled fish quality are characteristic odor changes caused by the formation of
volatile compounds, like alcohols, aldehydes, ketones, esters, sulfur compounds and amines, by
specific spoilage organisms (SSO). The objective of this thesis was to explore the potential use of
electronic nose as a rapid technique to detect volatile compounds related to quality changes during
chilled storage of different species of fish and fish products (capelin, cod, haddock, red fish and cold
smoked salmon). The influence of various storage conditions (-1.5 to 15 °C) on the proliferation of
SSO was studied and their spoilage potential was evaluated by electronic nose, chemical analysis of
TVB-N and TMA and sensory analysis.
The results of measurements with electrochemical sensors (CO, NH3, H2S and SO2), sensitive to the
main classes of microbially produced compounds, demonstrated the spoilage potential of the SSO.
The increased CO sensor response during early storage in all fish species, suggested the formation of
alcohols, aldehydes and esters and the role of Pseudomonas spp. in the incipient spoilage changes.
The response of the NH3, H2S and SO2 sensors, sensitive to amines and sulfur compounds,
respectively, indicated the importance of S. putrefaciens as a late spoiler in whole fish and in fillets
stored under abusive temperature conditions. Production of ketones in high levels, contributed mainly
by 3-hydroxy-2-butanone as identified by GC-MS, was associated with the active growth of
Photobacterium phosphoreum. This bacterium was identified as the dominating SSO based on its
growth and production of TMA as reflected by high levels of TVB-N in chilled cod and haddock
fillets packed in styrofoam boxes.
Multivariate PCA and PLSR based models were used to predict the quality of the fish. Multiple
quality indices based on the electronic nose sensors, SSOs and TVB-N were needed for classification
or prediction of the complex quality changes of fish stored under different temperature conditions.
However, when applying models adapted for each storage condition the ability of the electronic nose
to classify samples was improved. For products like capelin with high concentration of volatile
spoilage compounds a single sensor (NH3) was sufficient to predict the TVB-N value by fitting a
generalized linear model to the data and estimating parameters for each storage condition. Addition of
sensors for the detection of ketones and increased sensitivity of sensors for TMA is suggested to
improve the performance of the electronic nose to predict the quality of fish fillets.
KEYWORDS: Volatile compounds; quality indicators; electronic nose; gas chromatography;
SSO; capelin, cod, haddock, red fish, cold smoked salmon, chilled, superchilled, MA

iv
ROKGJÖRN EFNI SEM GÆÐAVÍSAR Í KÆLDUM FISKI:
MAT Á NIÐURBROTSEFNUM ÖRVERA MEÐ RAFNEFI
Guðrún Ólafsdóttir Matvæla og næringarfræðiskor Háskóla Íslands
Rannsóknastofnun fiskiðnaðarins, Reykjavík ÁGRIP
Ákvörðun gæða á kældum fiski tengjast lyktarbreytingum vegna myndunar á rokgjörnum efnum eins
og alkóhólum, aldehýðum, ketónum, esterum, brennisteinsefnum og amínum af völdum sértækra
skemmdarörvera (SSÖ). Markmið verkefnisins var að kanna mögulega notkun rafnefs, sem
fljótvirkrar mæliaðferðar, til að mæla rokgjörn efni sem tengjast gæðabreytingum í mismunandi
tegundum af fiski og fiskafurðum (loðnu, þorski, ýsu, karfa og reyktum laxi) við geymslu í kæli. Áhrif
mismunandi hitastigs (-1.5 - 15 °C) og geymsluaðferða á vöxt SSÖ voru könnuð og skemmdarvirkni
þeirra metin með rafnefi, TVB-N og TMA efnamælingum og skynmati.
Rafnef, sem þróað hefur verið hérlendis, var útbúið með raflausnanemum sem skynja helstu
efnaflokka sem myndast við skemmd í fiski. CO nemi rafnefsins reyndist næmastur til að greina
skemmdir á byrjunarstigi í öllum fisktegundum, vegna myndunar á alkóhólum, aldehýðum og
esterum, af völdum SSÖ einkum Pseudomonas tegunda. Aukning í svörun NH3, H2S og SO2 nema,
sem greina amín og brennisteinsefni á síðari hluta skemmdarferils fisks benti til að S. putrefaciens
væri virk skemmdarörvera í lok geymslutíma í heilum fiski (karfa og þorski) og í þorsk og ýsuflökum
sem geymd voru við hátt hitastig eða urðu fyrir hitasveiflum á geymslutímanum. Myndun ketóna
aðallega 3-hydroxy-2-bútanons, sem greint var með gasgreini, tengdist örum vexti
skemmdarörverunnar Photobacterium phosphoreum. Þessi örvera reyndist vera helsti
skemmdarvaldurinn vegna mikillar TMA myndunar, sem var einkennandi fyrir kæld þorsk og ýsuflök
í frauðplastkössum.
Fjölbreytulíkön byggð á höfuðþáttagreiningum (PCA) og PLSR voru notuð til að spá fyrir um gæði
fisks. Nauðsynlegt reyndist að nota fjölgæðavísa samsetta af örverutalningum, TVB-N og
rafnefsmælingum til að flokka eða spá fyrir um þær margvíslegu gæðabreytingar sem verða í fiski við
geymslu við mismunandi hitastig. Hinsvegar reyndust líkön, sem byggð voru eingöngu á rafnefi, hæf
til að flokka afurðir eftir gæðum ef líkanið var aðlagað að hverri afurð og geymsluhitastigi. Fyrir
gæðamat á loðnu til bræðslu reyndist NH3 neminn gefa besta mat á TVB-N gildi með því að nota
línulega aðhvarfsgreiningu og ákvarða stuðla til að taka tillit til einkennandi skemmdarferils við
mismunandi geymsluaðstæður. Niðurstöðurnar benda til þess að sértækir nemar fyrir ketón og næmari
skynjun á TMA myndi auka hæfni rafnefsins til að meta gæði fiskflaka
LYKILORÐ: rokgjörn efni, gæðavísar, rafnef, gasgreining, skemmdarörverur, loðna, þorskur,
ýsa, karfi, kaldreyktur lax, kæling, undirkæling, loftskiptar pakkningar

v
LIST OF PUBLICATIONS
This thesis is based on the following papers, referred to in the text by their respective
Roman numerals
I. Guðrún Ólafsdóttir, Áslaug Högnadóttir, Emilía Martinsdóttir, Helga Jónsdóttir, 2000. Application of an Electronic Nose to Predict Total Volatile Bases in Capelin (Mallotus villosus) for Fishmeal Production, J. Agric. Food Chem. 48 ,6, 2353- 2359.
II. Corrado Di Natale, Guðrún Ólafsdóttir, Sigurdur Einarsson, Alessandro Mantini, Eugenio Martinelli, Roberto Paolesse, Christian Falconi, Arnaldo D’Amico, 2001. Comparison and integration of different electronic noses for the evaluation of freshness of cod fish fillets. Sensors and Actuators B77, 572- 578.
III. Guðrún Ólafsdóttir, Xiuchen Li, Hélène L. Lauzon, Rósa Jónsdóttir. 2002. Precision and application of electronic nose measurements for freshness monitoring of redfish (Sebastes marinus) stored in ice and modified atmosphere bulk storage. JAFP 11, 3/4, 229-249.
IV. Guðrún Ólafsdóttir, Hélène Lauzon, Emilía Martinsdóttir, Kristberg Kristbergsson. Influence of storage temperature on microbial spoilage characteristics of haddock fillets (Melanogrammus aeglefinus) evaluated by multivariate quality prediction. Submitted.
V. Guðrún Ólafsdóttir, Hélène L. Lauzon, Emilia Martinsdottir, Joerg Oehlenschläger, Kristberg Kristbergsson. Shelf-life extension of superchilled cod (Gadus morhua) fillets and influence of temperature fluctuations on microbial growth and metabolites. Submitted.
VI. Guðrún Ólafsdóttir, Rósa Jónsdóttir, Hélène L. Lauzon, Joop Luten and Kristberg Kristbergsson. Characterization of Volatile Compounds in Chilled Cod (Gadus morhua) Fillets by Gas Chromatography and Rapid Detection of Quality Indicators by an Electronic Nose. Submitted.
VII. Guðrún Ólafsdóttir, Eric Chanie, Frank Westad, Rósa Jónsdóttir, Claudia R. Thalmann, Sandrine Bazzo, Saïd Labreche, Pauline Marcq, Frank Lundby, John-Erik Haugen, 2005. Prediction of Microbial and Sensory Quality of Cold Smoked Atlantic Salmon (Salmo salar) by Electronic Nose. Accepted for publication in J Food Sci
vi
ABBREVIATIONS
ANOVA analysis of variance
ATD automated thermal desorber
ATP adenosine triphosphate;
CBC contact blast cooling
GC-MS gas chromatography-mass spectrometry
GC-O gas chromatography-olfactometry
Hx hypoxhanthin
NPN non-protein nitrogen containing compounds
OU odor unit
PAR peak area ratio
PCA principle component analysis
PLSR partial least squares regression
PUFA polyunsaturated fatty acids
QIM Quality Index Method
QDA Quantitative descriptive analysis
RI retention index
SIMCA soft independent modeling of class analogy
SSO specific spoilage organisms
TMA trimethylamine
TMAO trimethylamine oxide
TVB-N total volatile basic nitrogen
TVC total viable count

vii
TABLE OF CONTENTS 1. INTRODUCTION....................................................................................................................... 1 OBJECTIVES ............................................................................................................................. 3 2. BACKGROUND......................................................................................................................... 4
2.1. Quality evaluation of fish .................................................................................................... 4 2.1.1. Post mortem changes in fish influencing quality ......................................................... 6 2.1.2. Instrumental techniques to evaluate quality................................................................. 9 2.1.3. Quality monitoring and labeling - View of the fish sector......................................... 12
2.2. Volatile compound as indicators of fish quality - Classification of fish odors.................. 14 2.2.1. Species related fresh fish odor ................................................................................... 17 2.2.2. Microbial spoilage odor ............................................................................................. 19 2.2.3. Oxidized odors ........................................................................................................... 28 2.2.4. Processing odors ........................................................................................................ 29 2.2.5. Environmental odor.................................................................................................... 31
2.3. Analysis of volatile compounds......................................................................................... 32 2.4. Development of the electronic nose technique: ................................................................. 34
2.4.1. Electronic noses: key principles................................................................................. 35 2.4.2. Sensor technologies ................................................................................................... 36 2.4.3. Sampling systems....................................................................................................... 38 2.4.4. Data analysis .............................................................................................................. 41
2.5. Application of electronic noses for fish ............................................................................. 42 2.5.1. Selection of sensors to detect quality indicator compounds ...................................... 43 2.5.2. Quality indicators – volatile compounds in the highest amount ................................ 44 2.5.3. Selection of reference methods for freshness quality of fish ..................................... 47 2.5.4. Seasonal variation and influence of processing (whole fish and fillets) .................... 48
2.6. Predictive models for shelf-life of fish .............................................................................. 52 3. OVERVIEW OF THE STORAGE STUDIES .......................................................................... 54 4. MATERIAL & METHODS...................................................................................................... 56
4.1. Storage experiments........................................................................................................... 56 4.2. Electronic nose measurements........................................................................................... 56 4.3. Sensory analysis................................................................................................................. 58 4.4. TVB-N, TMA and pH measurements................................................................................ 59 4.5. Microbial analysis.............................................................................................................. 59 4.6. Gas chromatography analysis ............................................................................................ 59 4.7. Data analysis...................................................................................................................... 60
5. RESULTS & DISCUSSION ..................................................................................................... 62 5.1. Presicion of the electronic nose measurements ................................................................. 62 5.2. Overall trend in electronic nose measurements to chilled fish during storage .................. 63 5.3. Specific spoilage organisms (SSO) and analysis of microbial metabolites ....................... 64 5.4. Correlation of reference methods and electronic nose....................................................... 67 5.5. Establishment of quality criteria for chilled fish ............................................................... 69 5.6. Application of multivariate models to classify or predict the quality of fish .................... 71 5.7. GC analysis of volatile compounds in cod fillets .............................................................. 74
5.7.1. Characterization of the spoilage potential of the SSO in cod fillets .......................... 75 5.7.2. Volatile compounds as quality indicators in different seafood products ................... 78
6. CONCLUSIONS....................................................................................................................... 80 7. FUTURE PERSPECTIVES ...................................................................................................... 82 8. ACKNOWLEDGEMENTS ...................................................................................................... 86 9. REFERENCES.......................................................................................................................... 88

1
1. INTRODUCTION
Currently, there is an increasing demand for traceability of food products in relation to
the quality and safety of these products for the consumers. Techniques to verify the
quality of food are essential to gain consumer trust and will facilitate the marketability of
food products. The possibility to use rapid instrumental techniques like electronic noses
to detect volatile compounds associated with odor and quality is in particular of interest
for perishable products like fish.
Gas sensors commonly used in electronic noses are non-selective towards individual
compounds, but show sensitivity towards certain classes of compounds. This property
induces their potential for monitoring quality and the onset of spoilage associated with
varying levels of different classes of volatile compounds produced in fish during storage.
The main classes of compounds that are present in spoilage are similar for the different
fish species stored under chilled conditions. However, the concentration of individual
compounds varies depending on the dominant microflora in the products, causing
different types of spoilage odors. The classification of fish odors according to main
classes of compounds produced is useful to facilitate the interpretation of rapid
measurements of the total headspace of fish using electronic noses. Characterization of
the spoilage changes and the spoilage domain of the specific spoilage organisms (SSOs)
based on their growth and ability to produce off odors is needed to determine which
quality indicators are relevant for monitoring quality changes during storage under
different conditions.
The overall objective of the project was to study the formation of volatile compounds in
fish stored under chilled conditions and the influence of various storage conditions on the
growth of the SSO contributing to the production off odors. The innovative approach in
the research was to study simultaneously the proliferation of the microflora and its
spoilage potential by analysing microbial metabolites contributing to the spoilage odors.
The study gives a better understanding and explains the contribution of the different
microflora to the spoilage odor development in naturally spoiling fish. Many of the
earlier studies on the spoilage potential of the microflora have focused on inoculating
bacteria strains into sterile fish extract or fish muscle. All the experiments in this study
were performed on naturally spoiled products.
2
The study covers extensive storage trials of different fish species and products. The
influence of different processing, packaging and storage conditions on the spoilage
pattern of the fish products was studied and various temperature conditions selected, that
typically occur during storage and transport of these products.
• Capelin stored whole in ice, chilled seawater and with and added acid as a
preservative at 0 and 5 °C
• Redfish stored whole in ice and packed in vacuum and under modified
atmospheres at 0 °C
• Cod stored whole in ice at 0 °C
• Haddock stored as fillets in Styrofoam boxes at 0°C and under abusive and
fluctuating temperatures (0, 7 and 15 °C)
• Cod stored as fillets in Styrofoam boxes at 0°C and processed and stored under
superchilling conditions (-1,5)
• Cold smoked salmon vacuum packed and stored at 5 and 10 °C
Based on gas chromatography analysis, quality indicators related to odor for the different
fish species and fish products have been identified. Electronic noses based on different
sensor technologies were applied in the studies and used as rapid techniques to monitor
the volatile compounds during storage of fish. The performance of models based on e-
nose data of fish and fish products stored under different conditions to predict the quality
or classify products according to microbial, sensory and chemical criteria were evaluated.
The electronic nose is a multisensor approach since it is composed of different types of
sensors of different selectivity and sensitivity detecting simultaneously several classes of
compounds related to quality and freshness of fish. Therefore, the electronic nose can
possibly give more information about the complex spoilage changes than the traditional
methods based on detecting one single indicator like total volatile bases. Moreover, the
electronic nose measurements are more rapid and have the potential to be used as a less
costly alternative than the traditional methods for quality checks in the industry. The
information gained is of practical value for the fish industry and can be used to select
appropriate storage conditions to extend the shelf life of fish products by preventing or
minimizing the development of the spoilage flora.

3
OBJECTIVES
The objectives of the thesis were to explore the potential use of electronic noses to
monitor quality changes related to the formation of volatile microbial metabolites during
chilled storage of fish and to achieve better understanding of the spoilage of fish. The
following aims were established for the thesis work:
• To apply electronic noses based on different sensor technologies as rapid
techniques to monitor the volatile compounds during storage of various fish
species stored and processed under different conditions.
• To study the proliferation of specific spoilage organisms (SSO) and evaluate their
spoilage potential by simultaneous analysis of microbial metabolites contributing
to the spoilage odors.
• To explore the correlation of e-nose data and the reference methods and apply
multivariate models to predict the quality or classify products according to
microbial, sensory and chemical criteria.
• To monitor volatile compounds in fish during chilled storage and screen potential
quality indicators by gas chromatography analysis.
The background chapter of the thesis is based on the following publications:
Olafsdottir G, Kristbergsson K. Electronic-Nose Technology: Application for Quality Evaluation in the Fish Industry. In: Nicolay, X. editor. Air Pollution Control: Odours Treatment in the Food Industry. Springer, NY, NY. (in print)
Olafsdottir G, Nesvadba P, Di Natale C, Careche M, Oehlenschläger J, Tryggvadóttir SV, Schubring R, Kroeger M, Heia K, Esaiassen M, Macagnano A., Jørgensen BM, 2004. Multisensor for fish quality determination. Trends Food Sci Technol 15:86-93.
Olafsdottir G. 2003. Developing rapid olfaction arrays for determining fish quality. In: Tothill IE, editor. Rapid and on-line instrumentation for food quality assurance. Cambridge, England: Woodhead Publishing Ltd. p 339-60.
Olafsdottir G, Fleurence J. 1998. Evaluation of fish freshness using volatile compounds - Classification of volatile compounds in fish. In: Olafsdottir G, Luten J, Dalgaard P, Careche M, Verrez-Bagnis V, Martinsdóttir E, Heia K, editors. Methods to Determine the Freshness of Fish in Research and Industry. Proceedings of the Final meeting of the Concerted Action "Evaluation of Fish Freshness" AIR3 CT94 2283. Paris: International Institute of Refrigeration. p 55-69.
Olafsdottir G, Martinsdóttir E, Oehlenschläger J, Dalgaard P, Jensen B, Undeland I, Mackie IM, Henehan G, Nielsen J, Nilsen H. 1997. Methods to evaluate fish freshness in research and industry. Trends Food Sci Technol 8:258-65.

4
2. BACKGROUND
2.1. Quality evaluation of fish
Quality assurance in the fish sector involves monitoring and documenting defined quality
criteria as required by regulations (Anon., 1996), product specifications and consumer
demands. These requirements may be of different importance to the various parts of the
supply and distribution chains for fish, which vary greatly between countries and for
different types of products. With the developments taking place in food law and in the
marketing of food, the commercial participants are increasingly demanding a full range of
information relating to fish quality and traceability of the products. Selection and
supplement of relevant information, including parameters describing quality of fish is
thus needed.
Fish quality is a complex concept involving a whole range of factors which for the
consumer include for example: safety, nutritional quality, availability, convenience and
integrity, freshness, eating quality and the obvious physical attributes of the species, size
and product type (Bisogni et al., 1987; Botta, 1995; Olafsdottir et al., 1997a;
Oehlenschläger and Sörensen, 1998; Bremner, 2000). Information about handling,
processing and storage techniques, including time/temperature histories, which can affect
the freshness and quality of the products, is very important for the partners in the chain.
Additionally, seasonal condition, the effects of fishing grounds and catching methods and
the occurrence of various quality defects influence the overall quality. One of the most
unique characteristics of fish as food is that it is a highly perishable commodity.
Consequently, time passed after catch and the temperature ‘history’ of fish is very often
the key factor determining the final quality characteristics of a fish product.
It is well documented that packed fillets spoil more rapidly and have different spoilage
pattern than whole fish (Lindsay et al., 1986; Jørgensen et al., 1988; Huss, 1995; Lauzon
et al., 2002). The interest of the industry is to maintain the freshness of the fish fillets, by
optimal handling and transport conditions to ensure the high quality of the products on
the market. Temperature control during all stages of the production and in the distribution
chain is emphasized in guidelines on good manufacturing practices.

5
-2
0
2
4
6
8
10
0 10 20 30 40 50 60
Time (hours)
Tem
pera
ture
°C
AIRFREIGHTCATCHING PROCESSING
Deskinning
Slush ice
Filleting
Landing
Packaging and shipping
Unloading and storage
Information Boat, fishing gear, catching area, fishing date, landing port and date,days in ice
Quality checksSensory analysis, temperaturebloodspots, bones, parasites
Freshness quality ??
InformationSpecies, filletsprocessor, production date
Figure 1. Typical temperature profile for the production of fillets and transport via air freight.
However, temperature fluctuations can occur in the production or in the distribution chain
because of unforeseeable events such as improper icing of the raw material or delays in
transport (Figure 1). In this case the rate of the deteriorative changes occurring in fish
caused by microbial growth and oxidative changes will be influenced and therefore, the
information on storage days or days from catch will not be reliable to determine the
actual quality (Huss, 1995; Olafsdottir et al., 2003a). Sensory assessment has always
played a key role in quality and freshness evaluation in the fish industry. The various
sensory characteristics, such as outer appearance, odor and color are still very important
in quality control. Parameters related to origin, handling and defects are also considered
important in the quality systems in the fish processing industry. Sensory inspection of
processed fish is used in the fish industry to find defects that have occurred during
handling and processing (Oehlenschläger, 1998).
Evaluation of the quality of whole wet fish: The evaluation of the raw material is done at
the moment of landing, at fish auctions or in the reception area in the fish processing
plants. Information about species, catching area and catching day has to be provided.
Batches are evaluated by looking at handling practices on board: weight of fish and ice,
how the fish is aligned in the tub, washing and icing, i.e. fish-ice layers and ice/fish ratio.

6
Evaluation of freshness is done at this stage using sensory assessment. For whole fish the
EU quality grading scheme (Howgate et al., 1992), is used as required by EU regulation
(Anon., 1996) but some initiatives have been taken to implement a new sensory method
called the Quality Index Method (QIM) to standardize sensory assessment for each
species (Bremner, 1985; Bremner et al., 1986; Larsen et al., 1992; Luten and
Martinsdóttir, 1998; Martinsdóttir et al., 2003).
Evaluation of the quality of fillets: For the evaluation of fillets in fish processing, samples
are taken randomly after trimming and checked for defects. Defects can be related to the
condition of the fish flesh (e.g. gaping, watery), appearance, which includes color defects
(bruises, bloodspots) and dehydration (frozen storage defects). Other defects such as
improper packaging and cutting and trimming faults and oversights (remaining bones,
parasites, foreign matters, skin and black membrane) are related to workmanship.
Evaluation of defects is widely used in control of processes and to grade fish for selling
or buying purposes.
For freshness determination of raw fillets, color and smell are evaluated, but for cooked
fish schemes like the Torry scheme (Shewan et al., 1953) are in use. In many companies,
however, sensory schemes tailor made for their special purposes have been developed.
Evaluation of raw fillets is also done in secondary processing before further processing
and in retail before packaging (e.g. MAP) and labeling for sale. Sensory evaluation of
raw fillets is difficult and therefore, it is likely that the fish industry would welcome a
reliable and easy to use multi-sensor device for the evaluation.
2.1.1. Post mortem changes in fish influencing quality
Odor is one of the most important parameters to evaluate fish freshness. The progression
of characteristic odors in fish during chilled storage caused by microbial growth is well
documented (Castell and Greenough, 1957; Shewan et al., 1953). The sensory descriptors
for the progression of odor changes during storage of fish were described by Elliot (1947)
as FRESH → FLAT → SWEET → STALE → PUTRID. The odor changes have been
associated with the formation of volatile compounds produced by the main spoilage
organisms (Miller et al., 1973a; b; c; Herbert and Shewan, 1976).
Complicated post mortem processes in the fish are responsible for the loss of freshness
and the onset of spoilage. A combination of chemical, biochemical and microbiological

7
interactions occur which are species dependant and additionally various extrinsic factors
such as handling and different storage conditions will further influence the spoilage
pattern and the development of spoilage odors.
The post mortem changes in fish are initially dominated by autolytic activity, including
degradation of nucleotides, formation of taste active inosine and accumulation of
hypoxhanthin (Hx), lowering of pH and endogenous enzyme activity followed by the
proliferation of the specific spoilage organisms (SSO) and development of volatile
compounds contributing to spoilage changes and thus influencing the freshness and
quality of the end product (Huss, 1995; Botta, 1995).
More knowledge is needed on the chemical characterization of spoilage processes of
muscle food and the correlation with sensory and microbiological changes (Dainty,
1996). The post mortem changes influencing the development of odors in chilled fish are
generalized in Figure 2. It is well established that enzyme mediated conversions of
polyunsaturated fatty acids (PUFA) to volatile aroma compounds initiates the formation
fresh fish odor compounds exhibiting fresh-plant-like aroma (Josephson et al., 1983;
1984; Hsieh et al., 1988). Further conversion and degradation of muscle constituents like
sarcoplasmic proteins and membrane bound phospolipids by endogenous enzyme
activity, autoxidation and microbial growth contributes to the changes in the aroma
profile of fish during storage. The pool of components that are degraded and cause off
flavors because of microbial growth and metabolism include soluble substances in the
muscle, mostly composed of the various non protein nitrogenous components (NPN),
including small peptides like carnosine and anserine, amino acids, guanidine compounds
like creatine, TMAO and nucleotides (Ikeda, 1980). Some of these compounds influence
the taste of fish like anserine giving “mouth satisfaction” (Jones, 1967) and the individual
amino acids glycine, valine, alanine and glutamic acid are known to contribute to taste
together with the the degredation components of the nucleotides like inosine.
Multi-compound indices based on gas chromatography analysis of the main volatile
compounds produced by bacteria during spoilage have been suggested to evaluate the
formation of spoilage odors occurring in fish products stored under different conditions
(Lindsay et al., 1986; Olafsdottir and Fleurence, 1998; Jørgensen et al., 2000; 2001).

8
Protein → peptides→ amino acids →Free fatty acids → → →→ volatile compounds
(pro- and antioxidants)soluble substances in the muscle →..... sarcoplasmic proteins, →...nucelotides..... NPN.... TMAO →
Glycolysis pH↓, Lactic acid↑
Rigor mortis ATP→→→Inosine →Hx → →Urea
Autolysis (cathepsin, calpain) → texture changes
LipoxygenaseLipids → PUFA →→volatile compounds
Endogenous enzymes
SSO
Oxidation
Fresh odor
Spoilage odor
Protein → peptides→ amino acids →Free fatty acids → → →→ volatile compounds
(pro- and antioxidants)soluble substances in the muscle →..... sarcoplasmic proteins, →...nucelotides..... NPN.... TMAO →
Glycolysis pH↓, Lactic acid↑
Rigor mortis ATP→→→Inosine →Hx → →Urea
Autolysis (cathepsin, calpain) → texture changes
LipoxygenaseLipids → PUFA →→volatile compounds
Endogenous enzymes
SSO
Oxidation
Fresh odor
Protein → peptides→ amino acids →Free fatty acids → → →→ volatile compounds
(pro- and antioxidants)soluble substances in the muscle →..... sarcoplasmic proteins, →...nucelotides..... NPN.... TMAO →
Glycolysis pH↓, Lactic acid↑
Rigor mortis ATP→→→Inosine →Hx → →Urea
Autolysis (cathepsin, calpain) → texture changes
LipoxygenaseLipids → PUFA →→volatile compounds
Endogenous enzymes
SSO
Oxidation
Fresh odorFresh odor
Spoilage odorSpoilage odor
Figure 2. Overview of post mortem changes in fish influencing the development of odors (SSO: specific
spoilage organisms, PUFA: plyunsaturated fatty acids; ATP: adenosinetriphosphate; Hx: hypoxhanthin;
NPN: non-protein nitrogen containing compounds, TMAO: trimethylamineoxide)
Various pro- and antioxidants influence the stability of the muscle and have been studied
in relation to the oxidative stability of phosopholipids (Hultin, 1994). Phospholipids are
the main membrane bound lipids and because of their high unsaturation they are in
particular sensitive to oxidation which is further enhanced by pre-processing and storage
of the fish. Oxidative processes occurring during storage of fish will result in the
accumulation of both saturated and unsaturated aldehydes that contribute to the
development of rancid cold store flavors (McGill et al., 1974; Aro et al., 2003).
The role of antioxidants (α-tocopherol, ascorbic acid and glutathion peroxidase) and
aqueous pro-oxidants in fish muscle including blood components like inorganic metals
(iron (Fe) and copper (Cu)) have been studied to understand better the mechanisms of the
oxidation in the muscle (Hultin and Kelleher, 2000; Undeland et al., 1999). Monitoring of
the levels of pro- and antioxidants along with the traditional primary, secondary and
tertiary degradation compounds of lipid oxidation in the muscle have been suggested as
potential quality indicators for fish (Bandarra et al., 1998; Undeland, 1998).

9
Proteolysis plays a critical role in post mortem changes resulting in undesirable texture
changes in fish. Endogenous enzyme activity influences the deterioration of fish muscle
including calpains (neutral calcium-dependent proteases) and cathepsins (lysosomal
proteases). The understanding of the mechanism of these reactions is still not clear but
active research in this area is currently ongoing (Delbarre-Ladrat et al., 2004).
2.1.2. Instrumental techniques to evaluate quality
Various instrumental techniques to detect post mortem quality changes in muscle food
have been developed (Olafsdottir et al., 1997a; 2004; Pau and Olafsson; 1997; Ellis and
Goodacre, 2001). The state of freshness can be described by a variety of definite
properties of the fish which can be assessed by different indicators (Bremner and
Sakaguchi, 2000). Rapid, inexpensive and accurate instrumental and sensory methods
have been developed, that can be correlated with time after catch or attributes related to
fish freshness (Botta, 1995; Connell, 1995; Olafsdottir et al., 1997a). An estimate of
freshness can be obtained by defining criteria related to changes in sensory attributes like
appearance, odor, color and texture, which can be measured and quantified by sensory or
instrumental methods. The future aims for fish freshness evaluation were established as
the conclusions of the EU project "Evaluation of Fish Freshness" in the year 1997
(Olafsdottir et al., 1998a) and reflect the ongoing research in this area today (see Box 1).
For accurate evaluation of quality no single index can encompass all the complex changes
occurring during spoilage of fish (Martin et al., 1978). One means of achieving this is by
developing an instrument which measures a set of attributes that together can give a
better estimation of freshness or quality than with one technique alone (Olafsdottir et al.,
1997a).
The possibility to develop a multi-sensor device to measure and/or estimate fish freshness
with a combination of instrumental techniques (electronic noses, spectroscopic methods,
texture-meters, image analyzers, color meters and devices measuring electrical
properties) was investigated in a EU project called "Development of Multi-Sensor
Techniques for Monitoring the Quality of Fish" (Nesvadba, 2003; Olafsdottir et al.,
2004).

10
Box 1. Conclusions - Future aim for fish freshness evaluation
⇒ Sensory evaluation is the most important method today for freshness evaluation in the fish
sector. The trend is to standardize sensory evaluation by improving methodologies and
training of panels to make sensory evaluation an objective measurement.
⇒ It is suggested to develop microbial methods for evaluation of fish freshness together with
mathematical models expressing the effect of storage conditions (temperature and atmosphere)
on growth of the relevant spoilage microorganisms.
⇒ Rapid assessment of volatile compounds in fish using gas sensors to determine freshness is of
increasing interest.
⇒ At the moment there are no rapid methods of determining changes in muscle proteins during
post mortem storage.
⇒ Most of the techniques described to monitor lipid oxidation are only used in research, and
very few are routinely applied in the fish industry. To monitor the progression of lipid
oxidation, it is important to use more than one method especially when comparing various
types of fish products
⇒ The use of ATP metabolites as freshness indices is a research technique not widely used in
industry. The future trend is the development of rapid techniques for ATP metabolites.
⇒ The following physical measurements give information on parameters related to fish
freshness. None of these methods however, give a unique and unambiguous answer to whether
the fish is fresh or not.
∗ It is likely that time / temperature indicators will be gradually introduced into the
wholesale and retail food chain, starting with temperature sensitive high value foods
such as fish.
∗ Texture measurements of fish have been compared to sensory analysis and some
results have shown good correlation
∗ Changes of microstructure of the fish muscle have been related to postmortem
tenderization and liquid holding capacity of fish muscle.
∗ Changes in fish freshness can be measured by the electrical properties of the fish
muscle. The advantage of electrical testers is their immediate response, the field use and
the use without previous experience.
∗ Color measurements can be related to changes in fresh fish.
∗ Spectroscopic methods have recently gained importance in evaluation of food quality
parameters.
From: Olafsdottir et al. (1997a) "Evaluation of Fish Freshness" (AIR3 CT94 2283)
11
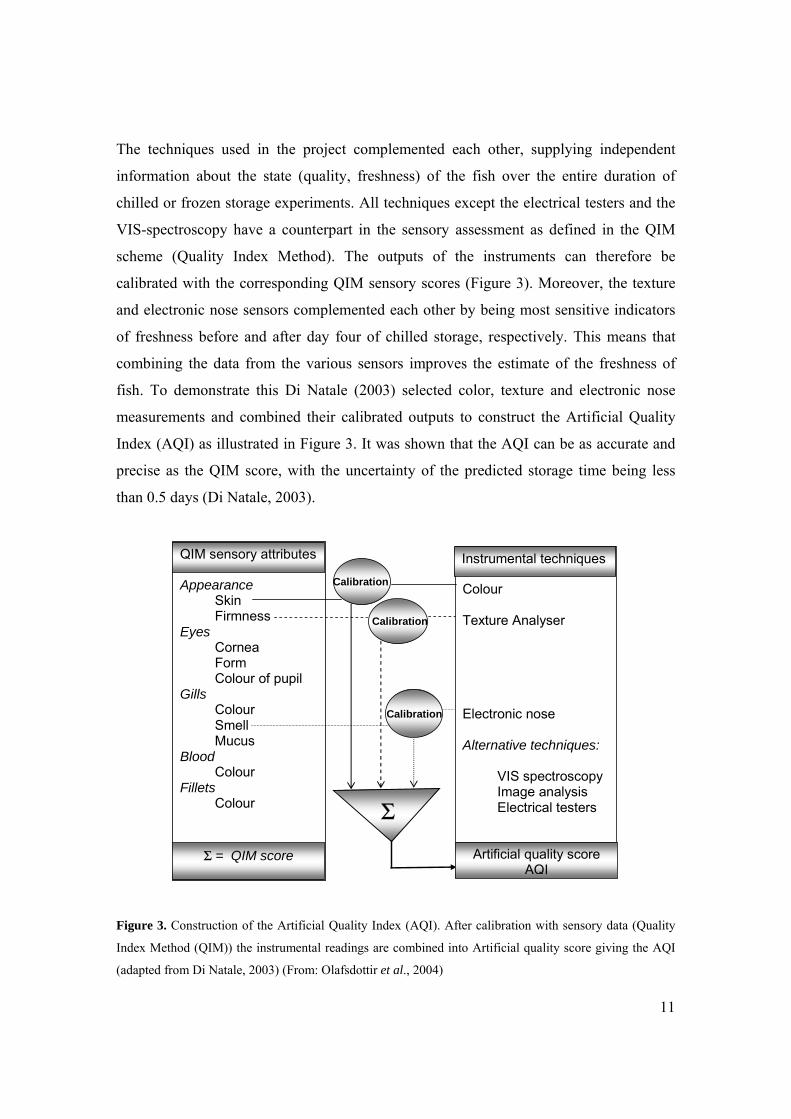
The techniques used in the project complemented each other, supplying independent
information about the state (quality, freshness) of the fish over the entire duration of
chilled or frozen storage experiments. All techniques except the electrical testers and the
VIS-spectroscopy have a counterpart in the sensory assessment as defined in the QIM
scheme (Quality Index Method). The outputs of the instruments can therefore be
calibrated with the corresponding QIM sensory scores (Figure 3). Moreover, the texture
and electronic nose sensors complemented each other by being most sensitive indicators
of freshness before and after day four of chilled storage, respectively. This means that
combining the data from the various sensors improves the estimate of the freshness of
fish. To demonstrate this Di Natale (2003) selected color, texture and electronic nose
measurements and combined their calibrated outputs to construct the Artificial Quality
Index (AQI) as illustrated in Figure 3. It was shown that the AQI can be as accurate and
precise as the QIM score, with the uncertainty of the predicted storage time being less
than 0.5 days (Di Natale, 2003).
Colour Texture Analyser Electronic nose Alternative techniques:
VIS spectroscopy Image analysis Electrical testers
Instrumental techniques
Σ
Appearance
Skin Firmness Eyes Cornea
Form Colour of pupil
Gills Colour Smell Mucus
Blood Colour
Fillets Colour
Calibration
Calibration
Calibration
QIM sensory attributes
Σ = QIM score
Artificial quality score AQI
Figure 3. Construction of the Artificial Quality Index (AQI). After calibration with sensory data (Quality
Index Method (QIM)) the instrumental readings are combined into Artificial quality score giving the AQI
(adapted from Di Natale, 2003) (From: Olafsdottir et al., 2004)
12
The costs of labor and training of assessors are likely to increase and the cost of
instrumentation such as the image analysis is set to decrease dramatically. Consumer and
governmental pressures for better description of quality and traceability of fish products
will also increase. All of these factors will increase the importance of instrumental
techniques of monitoring the quality of fish.
The development of biosensors for fish quality was reviewed by Venugopal (2002). The
main focus for biosensor development has been on measuring the nucleotide
concentration which is a good indicator for the initial loss of freshness expressed as K
value as suggested Saito (1959). Enzyme sensor systems based on detecting nucleotides
in fish have been developed (Okuma and Watanabe, 2002). Commercial devices based on
nucleotide degradation based on soluble enzymes and an oxygen electrode like "KV-101"
and "Microfresh" and test kits for ammonia and ethanol are available for industrial use
(Huss 1995). The development of "smart packaging" has received attention recently. The
potential use of sensors based on pH sensitive films for monitoring spoilage volatiles
released into packaged fish headspace were described by Byrne et al. (2003). The sensors
were based on cresol red entrapped within a plasticized cellulose acetate matrix and a
simple illumination source The TVB-N levels released from orange roughy and black
scabbard, deepwater fish were monitored by color changes in the sensors.
2.1.3. Quality monitoring and labeling - View of the fish sector
A survey was done to gauge the European fish sector´s view on the importance of various
quality attributes of fish and methods of measuring them. This survey also covered the
attitudes of the fish industry towards the need of multi-sensor devices that can be used in
quality monitoring and control (Jørgensen et al., 2003).
Sensory attributes influencing the freshness and quality of fish related to appearance,
texture, smell, color, defects and handling were all considered very important. However,
the views regarding the importance of instrumental techniques to measure these
properties were contradictory. Instruments based on a single technique to measure
individual properties were not considered important, but there was an agreement on the
importance of the needs for rapid instrumental methods to measure the overall concepts
freshness and quality (Jørgensen et al., 2003). The fish sector may have the perception

13
that complex concepts like freshness or quality cannot be quantified by single attribute
measurements.
The long time tradition in the fish industry to have experienced people with many years
of practice in control functions, performing sensory evaluation, is changing. Guidelines
and reliable tools to perform the evaluation are now required, since personnel in fish
industry is changing and new staff and younger people with little or no experience in
evaluating fish quality come into fish business advice. Sensory schemes and instrumental
methods to evaluate quality are therefore needed for use in the fish industry. However,
the implementation of new sensory methods and instrumental methods which measure
attributes related to freshness and quality has been very slow in the fish industry. The
reason for the reluctance to use monitoring methods for freshness and quality may be that
the fish industry is not familiar with the new sensory methods and instruments already
commercially available. Perhaps there is no economical incentive for the industry to
measure the quality because the demand for fish is greater than supplies and therefore all
fish is sold at a high price despite of different quality. Another reason may be that in
many cases the fish processors own the fishing vessels and are well informed about the
quality of the catch. All information about origin, catching time and handling are well
documented and the traceability of the products is assured giving the confidence that the
quality is also known.
To maximize the value of seafood products, proper quality labeling and monitoring
systems must be in place, which should be based on the pro-active attitude from the
industry aiming at the development of self-regulation. This was the general view of the
participants of the the EU project "Fish Quality Labeling and Monitoring", intergrating
the opinion of both scientists and representatives from the fishery chain (fishermen, port
auctions, processors, wholesalers, retailers) (Luten et al., 2003). A need for basic GMP
guidelines on board of vessels was emphazised along with accessible information about
the freshness of fish (expressed as storage time in ice, day of catch or best before date) to
be implemented in a quality label. Lot of information of fish deriving from the fishery
chain is available but it should be kept simple for the consumers. Quality standards based
on well defined critera to evaluate freshness like the QIM method are well established in
Europe and are expected to be implemented in the fish industry and expanded by the
strategic alliance QIM Eurofish (Luten, 2003).

14
2.2. Volatile compound as indicators of fish quality - Classification of fish odors
The odor of fresh fish is one of the most important quality parameter used to determine
whether fish is acceptable for consumption. The composition of volatile compounds in
fish contributing to the characteristic odors can be determined and related to the quality.
Characteristic odor and the progression of odor in fish during storage has been associated
with varying levels of different volatile compounds present in the headspace of fish
which can be measured to evaluate the freshness of fish. (Lindsay et al., 1986; Josephson
et al., 1986; Lindsay, 1990; Kawai, 1996)
Fish odor can be classified as species related fresh fish odor, microbial spoilage odor,
oxidized odor, processing odor and environmentally derived odor, based on the origin of
the volatile compounds (Table 1). Kawai (1996) grouped fish based on their species
related flavor and origin into three groups; saltwater fish, which are nearly odorless;
freshwater fish that give off pyrrolidine an earthy-odor compound; and euryhaline fish
which have a variety of unsaturated carbonyls and alcohols derived from enzymatic and
non-enzymatic oxidation of polyunsaturated fatty acids (Figure 4).
FISH ODOUR
MICROBIAL SPOILAGEODOUR
Sweet, fruity, ammoniacalsulfury, and putrid odours
SWEET, STALE andPUTRID odours
OXIDISEDODOURCod liver-oil,
paint-like
STALE andSTORED odours
PROCESSINGODOUR
Anchovy ripeningMalty flavor in
herringPotato-like odour in
boiled troutSPECIES RELATED FRESH
FISH ODOURPlanty, cucumber and mushroom like
odours (Euryhaline species)Earthy, odours (Freshwater species)Salty sea air and iodine-like odours
(Saltwater species)
FRESH and FLAT odours
ENVIRONMENTALLYDERIVED ODOUR
Petroleum odours
OFF odours
Figure 4. Classification of fish odors (From Olafsdottir and Fleurence, 1998)

15
Table 1. Classes of odors in fish and examples of compounds contributing to the odor. (From: Olafsdottir and Fleurence, 1998)
Fish odour Class of chemical species
Examples of compounds Aroma description Odour threshold in water
SPECIES RELATED FRESH FISH ODOUR
C6-C9 alcohols and carbonyls
Hexanal / t-2-hexenal, 1-octen-3-ol, /1-octen-3-one 1,5-octadiene-3-ol 1,5-octadiene-3-one 2,6-nonadienal 3,6-nonadienol
Green, aldehyde-like Mushroom Heavy earthy, mushrooms Geranium Cucumber Cucumber, melon-like
4,5ppb / 17ppb1 10ppb/ 0,009ppb1 10ppb1 0,001ppb1 0,001ppb1 10ppb1
Bromophenols 2,6-dibromophenol 2,4,6-tribromophenol 2-bromophenol
iodine- and shrimp-like saltwater fish, brine-like. Sea, marine-like flavour
0,0005μg/kg2 0,6μg/kg2
N-cyclic
compounds
Pyrrolidine Piperidine
Earthy
Short chain alcohols
ethanol, propanol, butanol, 3-methyl-1-butanol
solvent like
1-100 ppm3
MICROBIAL SPOILAGE ODOUR
Short chain carbonyls
acetone, butanone ethanal, propanal 3-methylbutanal 2-methylbutanal
solvent like malty malty
0,06ppm4
0,04ppm4
Amines ammonia, ammoniacal 110 ppm3 TMA
DMA fishy, ammoniacal 30 ppm3
0,6 ppm3 histamine,
putrecine, cadeverine
putrid, rotten
Sulphur compounds
hydrogen sulphide
sulphury, boiled eggs
5-40 ppb5
methylmercaptan methyl sulphide
rotten, cabbage cabbage-like
0,05 ppb5
0,9μg/kg6 dimethyl disulphide
dimethyl trisulphide bis-methylthio methane thioesters
putrid, onion-like putrid, cabbage and onion- garlic like
12 ppb7 0.01ppb7 0,3 μg/kg6
Aromatics N-cyclic compounds
phenethyl alcohol phenol, p-cresol indole skatole
old roses phenolic, pigpen-odours , horse manuremoth ball or faecal like
2 ppm 300 μg/kg6
Acids
acetic acid, butyric acid isobutyric acid
Sour, rotten, old socks
34,2ppm3 32,8ppm3
OXIDIZED ODOUR
Unsaturated aldehydes
hexanal c4-heptenal 2,4-heptadienal, 2,4,7-decatrienal,
green, planty cardboard-like, potato-like fishy oxidised flavour burnt, fishy, cod-liver oil-like
4,5ppb6 0,04ppb8
PROCESSING ODOURS
2,4-heptadienal and 3,5-octadien-2-one methional 2-methyl-3-furanthiol
ripened anchovies boiled potato - like odour meaty odour in canned tuna
ENVIRONMENTAL ODOURS
methyl sulphide geosmin 2-methyl-iso-borneol
petroleum odours earthy, muddy odours
1Josephson (1991); 2Whitfield et al. (1988); 3Kawai (1996); 4Sheldon et al. (1971); 5Fazzalari (1978); 6Whitfield and Tindale (1984); 7Buttery et al. (1976); 8McGill et al. (1974)

16
Josephson et al. (1986) monitored the overall volatile pattern of whitefish during storage
and grouped individual compounds into classes according to general odor quality and
structural characteristics. The classes were fresh long chain alcohols and fresh long chain
carbonyls (C6-C9) to index freshness and short chain alcohols and carbonyls, sulfur
compounds, amines, sweet esters, aromatics and dienals were suggested as indicators of
spoilage. By monitoring concentrations of different classes of compounds, they were able
to make comparative assessments of the importance of the compounds during each phase
of spoilage and were also able to select the components that are the most characteristic
for the loss of freshness and onset of spoilage. Similar classification has been suggested
for volatile compounds in beef to achieve better understanding of the spoilage odors
(Stutz et al., 1991).
Rapid analysis of volatile compounds by electronic nose as a tool to monitor freshness or
quality of various foods has gained increasing interest. The concept to classify
compounds based on their structural and odor characteristics is the basis for the
interpretation of electronic nose measurements. The gas sensors array can be designed
based on the selectivity and sensitivity of the sensors to the quality indicating
compounds. To facilitate and guide the future development of suitable sensors to monitor
fish freshness and quality, examples of compounds belonging to the main classes of fish
odors will be given herein.
Species related fresh fish odors, microbial spoilage odors and oxidized odors are most
important to monitor freshness and spoilage of fish, however, to cover the range of
different odors in fish the additional categories of odor will be mentioned also, but these
are derived or processing odors and environmentally derived odors or flavors (Lindsay,
1990). While most of the research on spoilage compounds in fish has focused on fish
stored in ice, recently researchers have also studied volatile compounds in boiled and
processed fish products such as as smoked salmon and ripened products. Considerable
efforts have also been on characterizing the volatile compounds in shellfish (Pan and
Kuo, 1994). Numerous volatiles derived from amino acids degradation, contributing to
seafood aromas, have been identified in spiny lobster (Cadwallader et al., 1995) and in
cooked blue crab (Chung and Cadwallader, 1994; 1995).

17
2.2.1. Species related fresh fish odor
Fish odors are complex and the characteristic overall odor develops in accordance with
the changes of the individual volatile compounds present in fish. Each species has a
characteristic aroma and the changes of the aroma depend on various factors.
Concentration of influential compounds and their odor thresholds along with combination
of different components in the headspace are important factors, since some of the
components in the headspace may exhibit synergistic effects and influence the overall
odor quality. Some components are desirable at low levels but if their concentration
increase they may contribute to off odors like the enzymically derived long chain
alcohols and ketones that exhibit characteristic fresh- plant like notes to fresh fish but
when accumulated in higher levels because of autooxidation they contribute to oxidized
and fishy odors (Josephson, 1991).
Difference in the odor of saltwater, freshwater and euryhaline species appears to be
because of various enzymatic activities (Kawai, 1996). Lipoxygenase enzyme activity has
been found on the skin and gills of both freshwater and marine species (rainbow trout,
river trout and sardines) and initiates the formation of the odorous volatiles contributing
to green, pleasant aromas of fish (German and Kinsella, 1985; German et al., 1986; Hsieh
et al., 1988; Hsieh and Kinsella, 1989; Zhang et al., 1992). The compounds that
contribute to the characteristic plant-, cucumber-, melon- and mushroom- like odors, are
unsaturated carbonyl compounds and alcohols with six, eight or nine carbon atoms which
are present in low levels in the headspace above fish (ppb) (Josephson et al., 1983; 1984;
Hirano et al., 1992; Milo and Grosch, 1993). In freshwater and euryhaline species the
enzymic activity appears to be more than in saltwater species, resulting in characteristic
green, plant-like odors of these species.
Fresh marine fish is nearly odorless, because it contains low levels of volatile
compounds. Josephson et al. (1984) summarized the occurrences of volatile compounds
in freshwater and saltwater species and concluded that the four common compounds
found in saltwater species hexanal, 1-octen-3-ol, 1,5-octadien-3-ol and 2,5-ocatadien 1-ol
were responsible for the moderate, faint odor of saltwater species. On the other hand the
unsaturated C9 carbonyl compounds such as 2,6-nonadienal, which have potent green,
plant-like, cucumber and melon-like odors were characteristic for freshwater and
euryhaline fish. The odor threshold of the C8 alcohols common in the saltwater species is

18
much higher (1-10 ppb) than for the typical C9 compounds characteristic of the
freshwater and euryhaline species like 2,6-nonadienal that has an odor threshold of 0.001
ppb and a strong cucumber like odor (Table1).
Bromophenols have been associated with the iodine like off-flavor in prawns (Whitfield
et al., 1988), however Boyle et al. (1992a) found that bromophenols in nominal
concentrations contributed to natural sea-, iodine, and marine-like flavors of seafood.
Analysis of a few species of freshwater fish revealed that bromophenols were not present.
The distribution of bromophenols in marine fish and seafood is probably linked to the
feed chain (Boyle et al., 1993). It was suggested that by supplementing the feed of
aquacultured fish, it might be possible to obtain flavor profiles of wild species. Attempts
have been made to produce prawn feed with high bromophenol content and results
indicate that direct addition of these components to the unprocessed feed is not successful
and further studies on encapsulation are under investigation (Whitfield et al., 1997).
Considerable variability in concentration and type of bromophenols has been found in
seafood. Several studies on the odor character of bromophenols indicate that when
evaluated in water the chemical, iodine or phenol-like flavor persists. However, when
incorporated into fish, shrimp or triglyceride oils they exhibited different flavor
characteristics, depending on isomers. 2,6-dibromophenol exhibited iodine- and shrimp-
like notes while 2,4,6-tribromophenol was perceived as saltwater fish- and brine-like. 2-
bromophenol generally enhanced rich marine seafood flavor quality. Fish-like flavors
were perceived by sensory panellist when isomers were incorporated into vegetable oil,
but when evaluated in deodorized menhaden oil, marine, herring-like oil flavor
characteristics were perceived (Boyle et al., 1992b). Bromophenols are not present in
high enough levels in the headspace of fish to be detected as part of the total headspace
using available electronic nose techniques. The bromophenols are more important in
influencing the "by mouth" or retronasal flavor perception of fish rather than influencing
the nasal odor perception.
Environmental conditions and spawning can influence the odor quality of fish. The
volatile pattern changes in mature salmon when migrating from the sea for spawning. C9
lipoxygenase derived compounds have been found in higher levels in spawning
euryhaline and freshwater fish (Josephson et al., 1984). Capelin a saltwater species which
belongs to osmeridae, has a very characteristic cucumber odor and 2,6-nonadienal was

19
found to be the most characteristic compound for the cucumber-like capelin odor, which
was found in spawning capelin (Olafsdottir et al., 1997c).
Many species residing in ponds have characteristic earthy odor that has been associated
with piperidine and its reaction products but the knowledge of the formation of these
compounds is obscure. Piperdine levels have been reported to increase in spawning
salmon and contribute to off odors (Yamanaka, 1989). The formation of pyrrolidine and
piperidine has been linked with the presence of 1,4-diaminobutane (putrescine) and 1,5-
diaminopentane (cadeverine) respectively but these compounds are only present in very
low levels in fresh fish and can therefore not be expected to have great influence on the
fresh odor (Kawai, 1996). Piperidine was tentatively identified in chilled cod fillets
(Olafsdottir et al., VI) and Alasalvar et al., (2005) suggested using piperidine along with
other compounds showing increasing concentration with time as quality indicator of sea
bream.
Oxidation of carotenoids also appears to generate characteristic aroma to fresh-like
seafood flavor especially in algae (Josephson, 1991). β-ionone and β-cyclocitral were the
most common compounds associated with algal blooms (Jüttner, 1981). 6-methyl-5-
heptene-2-one derived from carotenoids was detected in chilled cod during storage and
was described as spicy and flowery by GC-O and suggested to contribute along with
other ketones and aldehydes to the characteristic sweet like odor of cod fillets (Olafsdottir
et al., VI).
In general species related odor compounds in fresh fish are present in very low levels
(ppb) in the headspace. Some of these compounds have very low odor thresholds and
even though they are present in very low levels (ppb) they still affect the aroma of the
fish and changes in their concentrations drastically affect the overall aroma (Josephson et
al., 1986). However, it is not likely that the electronic nose techniques will detect these
compounds in the total headspace of fish during storage.
2.2.2. Microbial spoilage odor
Microbial degradation of fish components mainly amino acids results in the formation of
spoilage odors of fish. Ammonia, trimethylamine (TMA), ethanol, hydrogen sulfide,
methyl mercaptan and sulfides are typical spoilage compounds that exhibit odors such as
20
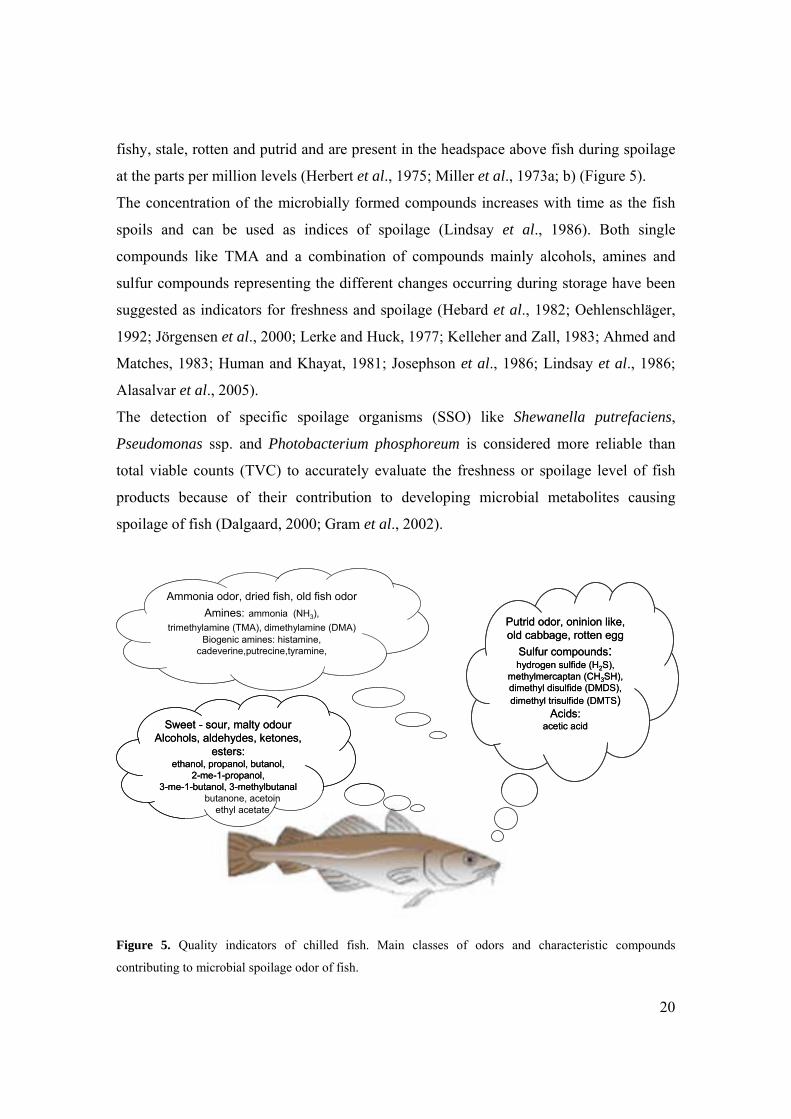
fishy, stale, rotten and putrid and are present in the headspace above fish during spoilage
at the parts per million levels (Herbert et al., 1975; Miller et al., 1973a; b) (Figure 5).
The concentration of the microbially formed compounds increases with time as the fish
spoils and can be used as indices of spoilage (Lindsay et al., 1986). Both single
compounds like TMA and a combination of compounds mainly alcohols, amines and
sulfur compounds representing the different changes occurring during storage have been
suggested as indicators for freshness and spoilage (Hebard et al., 1982; Oehlenschläger,
1992; Jörgensen et al., 2000; Lerke and Huck, 1977; Kelleher and Zall, 1983; Ahmed and
Matches, 1983; Human and Khayat, 1981; Josephson et al., 1986; Lindsay et al., 1986;
Alasalvar et al., 2005).
The detection of specific spoilage organisms (SSO) like Shewanella putrefaciens,
Pseudomonas ssp. and Photobacterium phosphoreum is considered more reliable than
total viable counts (TVC) to accurately evaluate the freshness or spoilage level of fish
products because of their contribution to developing microbial metabolites causing
spoilage of fish (Dalgaard, 2000; Gram et al., 2002).
Ammonia odor, dried fish, old fish odorAmines: ammonia (NH3),
trimethylamine (TMA), dimethylamine (DMA)Biogenic amines: histamine,
cadeverine,putrecine,tyramine,
Putrid odor, oninion like, old cabbage, rotten egg
Sulfur compounds: hydrogen sulfide (H2S),
methylmercaptan (CH3SH), dimethyl disulfide (DMDS), dimethyl trisulfide (DMTS)
Acids: acetic acidSweet - sour, malty odour
Alcohols, aldehydes, ketones, esters:
ethanol, propanol, butanol, 2-me-1-propanol,
3-me-1-butanol, 3-methylbutanalbutanone, acetoin
ethyl acetate
Figure 5. Quality indicators of chilled fish. Main classes of odors and characteristic compounds
contributing to microbial spoilage odor of fish.

21
Short chain alcohols, carbonyls and esters accumulate in high concentration (ppm) in
fish during chilled storage because of microbial growth. Ethanol has been suggested as an
indicator of quality for canned fish (Lerke and Huck, 1977; Kelleher and Zall, 1983) and
for raw tuna (Human and Khayat, 1981). Lindsay et al. (1986) suggested using short
chain alcohols like ethanol, butanol and 3-methyl-1-butanol as potential indices of
refrigerated fish spoilage. Propanol was suggested as a potential indicator when using
modified atmosphere packaging techniques.
The initial production of ethanol in spoilage of fish has been related to the utilization of
carbohydrate sources, while the formation of branched-chain alcohols and aldehydes like
2-methyl-1-propanol, 3-methyl-1-butanol and 3-methyl-butanal probably originate from
degradation of valine and leucine, respectively. The branched chain aldehyde, 3-methyl
butanal, is characterized by a malty and caramel like odors (Sheldon et al., 1971), which
was perceived as a sweet, caramel and fish fillet like odor by GC-O in packed cod fillets
(Olafsdottir et al., VI). The malty flavor of 3-methyl butanal was suggested to be mainly
responsible for the malty off flavor defect of boiled cod by Milo and Grosch (1996). The
corresponding alcohol 3-methyl-1-butanol, and 2-methyl-1-propanol which exhibit
alcoholic and fruity odors were found to increase during storage of cod fillets (Olafsdottir
et al., VI).
The formation of acetoin (3-hydroxy-2-butanone) was characteristic for the spoilage of
chilled cod fillets packed in styrofoam boxes and was attributed to the growtn of P.
phosphoreum (Olafsdottir et al., VI). Levels of acetoin increased earlier than TMA and
therefore, it is more useful to monitor the loss of freshness as an early indicator of
spoilage. The concentration of acetoin was much higher than the other lipid derived
ketones detected like 2-butanone, 3-pentanone and the carotenoid derived 6-methyl-5-
heptene-2-one that were present in cod fillets throughout storage but no obvious increase
occurred until at the end of shelf-life and during continued storage. Ketones can influence
the overall odor because of their typical odors and their low odor thresholds (Table 1).
In cultured and wild sea bream stored in ice for 23 days TMA, 3-methyl-1-butanol, 1-
penten3-ol, piperidine, methanethiol, dimethyl disulfide, dimethyl trisulfide, and acetic
acid were identified as spoilage indicators (Alasalvar et al., 2005).
Earlier studies on the formation of odorous degradation compounds in fish (cod, haddock
and rockfish) from the North Atlantic area showed that pseudomonads, in particular P.

22
fragi, were responsible for quality changes and development of sweet, fruity off-odors in
chilled fish (Castell and Greenough, 1957; Castell et al., 1959; Miller et al., 1973a).
Amines, sulfides ketones and esters were the main classes of volatile compounds
associated with the growth of Pseudomas fragi and S. putrefaciens in prawns
(Chinivasagam et al., 1998). Pseudomonas species have also been found responsible for
the formation of volatile sulfides, alcohols (3-methyl-1-butanol, 1-penten-3-ol) and
ketones (2-butanone) contributing to the stale and putrid off odors in fish because of
amino acid and lipid degradation (Miller et al., 1973b; c). More recently the importance
of pseudomonads in spoilage in fish species from the Mediterranean Sea (Koutsoumanis
and Nychas, 1999; Koutsoumanis and Nychas, 2000) and American plaice (Lauzon,
2000) has been reported.
Alcohols, aldehydes and ketons in smoked salmon: Microbially produced ketones,
aldehydes and alcohols are abundant in the headspace of cold smoked salmon products
during storage (Jørgensen et al., 2001; Joffraud et al., 2001). Number of volatile
compounds have been identified in vacuum-packed cold smoked salmon (Salmo salar),
during cold storage at 5°C (Jørgensen et al., 2001). A multiple compound quality index
based on 1-propanol, 2-butanone, and 2-furancarboxaldehyde was developed. 2-Butanone
was the only ketone that increased during storage in cold smoked salmon. A few of the
volatile compounds produced during spoilage of cold-smoked salmon contributed to the
spoilage off-flavor of cold-smoked salmon as confirmed by gas chromatography-
olfactometry. These were trimethylamine, 3-methyl butanal, 2-methyl-1-butanol, 3-
methyl-1-butanol, 1-penten-3-ol, and 1-propanol ( Jørgensen et al., 2001). Semi-
quantification of the main components detected in smoked salmon by GC-MS showed
that compounds developed because of spoilage related processes (i.e. microbial growth
and oxidation) were present in lower concentrations than compounds derived from the
smoking process (Jónsdóttir et al., Forthcoming). Short chain alcohols, aldehydes and
ketones were the main classes of compounds contributing to spoilage. 3-hydroxy 2-
butanone was detected in high levels in all of the samples at the end of the storage time,
even though some of them had no spoilage characteristics and low microbial counts
(Jónsdóttir et al., Forthcoming). The role of 2-hydroxy butanone in smoked salmon
products appears to be related to its contribution to the characteristic pleasant "butter"

23
like odor of the product but it is not considered important as contributing to the spoilage
odor. Lactic acid bacteria were predominant throughout the storage in the smoked salmon
products and may contribute to the formation of this compound. This supports what
others have reported that lactic acid bacteria do not appear to be involved in the formation
of spoilage off odors (Leroi et al., 1998; Paludan-Muller et al., 1998).
Stohr et al. (2001) studied the spoilage potential of various bacterial groups by
inoculating pure cultures into sterile products. These conditions do not reflect the actual
conditions when the various microbial groups may be competing, however, the results
gave interesting information about the potential of each species to contribute to the
sulfurous, acidic, rancid, rubbery, cheesy and acidic off-odors in spoiled smoked salmon.
Amines: The development of amines during fish spoilage is well known and
measurements of the very volatile amines such as TMA or total volatile bases (TVB-N)
have been used in the fish industry as indicators of quality for fish and fish products.
Development of ammonia-like and ‘fishy’ off-flavors has been related to fish spoilage
bacteria like Shewanella putrefaciens and P. phosphoreum that can reduce TMAO to
TMA (Jørgensen and Huss, 1989; Dalgaard, 1995a).
Photobacterium phosphoreum originating from the intestines of fish was identified as an
important TMA producer in iced cod and in cod fillets (Van Spreekens, 1974; Van
Spreekens and Toepoel, 1981) and has been suggested as the main spoilage organism in
packed cod fillets, although this bacterium does not produce intensive off-odors
(Dalgaard et al., 1993; Dalgaard, 1995a). Other well known spoilage bacteria like
Pseudomonas spp. do not produce TMA from TMAO (Castell et al., 1959).
Studies of haddock and cod fillets packed in styrofoam boxes during chilled storage
showed that P. phosphoreum dominated the spoilage microflora and high levels of TMA
and TVB-N were found at sensory rejection, suggesting that this bacterium contributed
considerably to the overall spoilage of aerobically packed cod and haddock fillets
(Olafsdottir et al., IV, V).
Enzymically produced DMA (dimethylamine), which forms very early after harvest of
fish, has been suggested as a freshness indicator along with its precursor TMAO
(trimethylamine oxide) (Oehlenschläger, 1992). TMA and TVB-N values are only useful

24
for advanced spoilage because they only begin to increase at later stages of storage
(Oehlenschläger, 1998; Baixas-Nogueras et al., 2003).
It has been pointed out that TVB-N and TMA often give ambiguous information about
the quality of the products as their levels are influenced by the storage method like in
modified atmosphere packaging (Davis, 1990; Dalgaard et al., 1993; Debevere and
Boskou, 1996; Lauzon et al., 2002) and in pre-frozen chilled fillets (Magnússon and
Martinsdóttir, 1995; Guldager et al., 1998).
TMA is characteristic for the spoilage odors of fish, while DMA may influence the
overall fresh flavor of fish in combination with the C8 unsaturated carbonyls and alcohols
in marine fish. TMA has been noted for intensifying fishiness by a synergistic action with
certain volatile unsaturated aldehydes derived from autoxidation of polyunsaturated fatty
acids (Karahadian and Lindsay, 1989).
High levels of ammonia which are present in saltwater species contribute little to the odor
but affect the pH. The pH can influence the odor character of some compounds and also
their reactivity (Kawai, 1996). Basic environment influences the formation of aldehydes
and when hydrogen sulfide is present these components can react to produce more
complex flavor components such as S,N-heterocycles (Kawai, 1996).
Odor of saltwater species has often been related to the odor of TMA, however, the
combination of TMA and other amines, acids and sulfur compounds (such as ammonia,
DMA, acetic, formic and propionic acids, hydrogen sulfide and methyl mercaptan)
contribute as well to saltwater fish spoilage odor rather than TMA alone.
Sulfur compounds: The volatile sulfur compounds, hydrogen sulfide, methyl mercaptan,
methyl sulfide and dimethyl disulfide have been suggested as the main cause of putrid
spoilage aromas in fish (Herbert et al., 1971). Dimethyl trisulfide has also been
associated with spoilage in fish (Miller et al., 1973a; b; Lindsay et al., 1986), and it is
responsible for a distinctive unpleasant onion flavor in prawns (Whitfield and Tindale,
1984). Milo and Grosch (1995) evaluated the headspace of boiled cod by gas
chromatography olfactometry (GCO) and found that dimethyl trisulfide was the most
potent odorant contributing to off-odors in cod formed when the raw material was
inappropriately stored. During advanced spoilage of fish the concentration of the
microbially produced sulfur compounds increases. The volatile sulfur compounds have

25
very low odor threshold (Table 1) and because of their odor characteristic they tend to
predominate the putrid spoilage aroma, although the amines, acids and aromatics in
addition, give the complete putrid spoilage aromas of fish. Shewan (1976) reported that
the odor of methyl mercaptan varied from a pleasant odor below 0.05 ppb to a sour odor
(0.5 ppb) to a cabbage water-onion like (50 ppb) and a metallic cooked meat odor (100
ppb).
The potential of H2S-producing organisms, like Shewanella putrefaciens, to develop
sulfur compounds contributing to off flavor described as onion, cabbage and putrid
spoilage odors at advanced stages of storage in fish is well known (Miller et al., 1973a;
Herbert et al., 1975). Shewanella putrefaciens has been identified as the main SSO in
whole cod (Herbert and Shewan, 1976; Jørgensen et al., 1988) as well as in aerobically
stored haddock fillets (Levin, 1968; Chai et al., 1971).
The origin of the sulfur compounds is from microbial degradation of cysteine and
methionine to form hydrogen sulfide and methyl mercaptan respectively (Herbert et al.,
1975). The proposed mechanism for forming oxidized volatile sulfur compounds includes
the fast air oxidation of methyl mercaptan to form dimethyl disulfide (Kadota and Ishida,
1972; Miller et al., 1973a) and further oxidation of dimethyl disulfide and the
incorporation of hydrogen sulfide yields dimethyl trisulfide (Miller et al., 1973b).
Strachan and Nicholson (1992) developed a method using Gastec detector tubes for the
selective analysis of amines, hydrogen sulfide (H2S) and ammonia in the headspace of
gills and found that H2S analysis gave the best result to predict storage period.
Acids: Some acids such as acetic, formic and propionic acids which are formed from
amino acids or degradation of lipids are also involved in fish flavor. According to Kawai
(1996), the acids with a short aliphatic chain (i.e. formic, acetic and propionic acids) can
be associated with freshness flavor for several species like bonito (Sarda sarda), Spanish
mackerel (Scombrus japonicus) and sea bream (Pristimoides sieboldi). Other authors,
have reported that the production of volatile acids such as formic and acetic acids in tuna
were associated with the spoilage (Hillig, 1956; Quaranta et al., 1984). Acetic acid was
detected in increasing concentrations in cod fillets during chilled storage (Olafsdottir et
al., VI). The presence of acids in fish alters the odor quality of TMA and with increasing
acid the volatility of TMA decreases and the odor quality changes.

26
Aromatics: Phenol and phenethanol have been found as the major high boiling volatile
compounds in haddock during storage (Chen et al., 1974) derived from phenylalanine.
Various benzene derivatives have been reported as a part of the total volatiles in chilled
fish (Alasalvar et al., 2005), in thermally processed crab (Cha et al., 1993) and in
fermented anchovy (Cha et al., 1997). Their origin is not well understood but has been
associated with environmental sources or oxidative processes. When studying volatiles in
cod fillets styrene and chloroform were most abundant of the aromatics detected and were
found to increase with storage (Olafsdottir et al., VI). Styrene was also identified in wild
and cultured sea bream packed in polystyrene boxes during chilled storage (Alasalvar et
al., 2005). The odor of styrene is described as kerosene like and has been associated with
off odors in surimi based products related to the growth of yeasts (Koide et al. 1992).
Miscellaneous compounds: Although alcohols, aldehydes, ketones, acids, sulfur
compounds, esters and acids are primarily of interest as spoilage indicators of fish, other
classes of compounds may also have an impact when measuring the total headspace with
electronic noses. The concentration of the straight chain alkanes (nonane, decane and
undecane) appeared to be similar throughout storage in chilled cod fillets (Olafsdottir et
al., VI). Additionally, numerous branched chain alkanes were detected. The alkanes will
not influence the responses of the electrochemical sensors of the electronic nose and are
not considered of interest as quality indicators since they are not aroma active.
Several terpene derivatives have been identified in fish like limonene which was detected
in sea bream during storage (Alasavar et al., 2005). The origin of limonene in fish was
related to the diet derived from algae or plant source. Limonene has low odor threshold
and a fresh lemon odor was detected by GC-O analysis of cod suggesting that it may have
an impact on the overall odor of fish fillets (Olafsdottir et al., VI).
Malodors from fishmeal factories, fish drying and fish waste: During advanced
spoilage of fish more complex spoilage odors are formed. This often causes odor
pollution especially during summer in the neighborhood of fishmeal factories. The
combination of acids, phenol, p-cresol, indole, skatole, sulfur compounds and amines
contributes to the overall offensive odor of spoiled fish (Kamiya and Ose, 1984). Bulk
stored capelin with high contents of feed degrades quickly because of high proteolytic

27
activity in the gut (Aksnes and Brekken, 1988). This results in liberation of peptides and
free amino acids, which bacteria utilise for their energy demand resulting in the formation
of bad smelling microbial metabolites. The amines, cadeverine, histamine and putrecine
which are formed from lysine, histidine and arginine respectively are examples of such
microbial metabolites. Sulfur compounds derived from cysteine and methionine also
contribute to the offensive odors because of their low odor thresholds like dimethyl
trisulfide with an odor threshold of 0.01 ppb (Table 1). Various thioester will also
influence the overall putrid aroma.
Aromatics resulting from degradation of aromatic amino acids are typically present as the
main contributing compounds in the characteristic malodors from animal waste and are
also important in fish during advanced stages of spoilage (Kamiya and Ose, 1984). This
type of odor is of concern in fishmeal factories and contributes to the air pollution in their
neighborhood. Both indole and skatole which are formed during advanced spoilage of
fish are very tenacious odorants, which tend to cling to clothing and other articles and to
persist for long periods (Miner, 1977). Indole (2,3-benzopyrrole) with a mothball-like,
burnt odor and skatole (3-methyl-1H-indole) exhibiting a mothball-like and faecal
character (Acree, 1997) are found in animal waste and manure derived from
tryphtophane. Similarly p-cresol derived from tyrosine contributes to pigpen odor. In
animal waste and manure these compounds are presumed to be products of anaerobic
microbial degradation constituents. Naphtalene has also been associated with similar
offensive off odors which can cause odor taints in water and may originate from
industrial and municipal sewage effluents or from biological activities of algae and
micro-organisms. Studies of ventilation air of swine confinement buildings have shown
that the components that cause the most offensive odors like indole and skatole are
present in low concentrations because of their low vapor pressure. The sulfur compounds
like hydrogen sulfide and methyl mercaptan which have high vapor pressure are on the
other hand decomposed or oxidized, so they are not measured in high concentration in the
ventilation air (Schaefer, 1977).
28
2.2.3. Oxidized odors
Unsaturated aldehydes: The fishy, cod liver oil-like, flavor in fish has been shown to be
caused by two isomers of 2,4,7-decatrienal which are autoxidatively formed from long-
chain polyunsaturated n-3 fatty acids in fish. In addition autoxidizing fish oils contain
many other carbonyl compounds that contribute oxidized, painty and rancid aroma notes.
The occurrence of c4-heptenal has been associated with the "cold storage flavor" of cod
(McGill et al., 1974), however, some confusion exists about the role of c4-heptenal as the
"cold-storage compound" (Lindsay, 1990). In fact, this aldehyde does not exhibit a fishy-
type aroma by itself, but it rather participates in the expression of the overall fishy odor.
Its odor has been described both as cardboardy, paint-like (Hardy et al., 1979) as well as
boiled potato-like (Josephson and Lindsay, 1987a; b) and it has been found to potentiate
the stale, burnt/fishy, cod liver oil-like flavor character of oxidizing oil that is caused
primarily by 2,4,7-decatrienal (Karahadian and Lindsay, 1989).
Josephson et al. (1987) suggested a pathway that yields acetaldehyde and propanal via
two sequential retro-aldol condensations of 2,4-heptadienal and 2-pentenal, respectively.
During free radical oxidation of fish lipids 2,4-heptadienal can be formed along with 3,5-
octadien-2-one from eicosapentaenoic acid. However, it is likely that most of the
propanal in fish lipids results from a direct n-3/n-4 carbon chain scission during free
radical oxidation of n-3 fatty acids. The level of the C7, C8 and C10 autoxidatively
produced unsaturated carbonyls in the headspace of fish is typically low or at the ppb
level. In spite of this low level, they influence the overall aroma as stated before since
their odor threshold is low (see Table 1).
Pre-concentration techniques are necessary for the analysis of the unsaturated aldehydes,
which is not practical for rapid determination of oxidation. On the other hand it is
possible to detect the most volatile oxidation products like propanal and hexanal by rapid,
static heasdpace sampling methods.
These compounds can be used as indicator compounds for oxidation as demonstrated by
Boyd et al. (1992). They showed that direct analysis of propanal can provide a quick and
economical method for the determination of oxidation of n-3 fatty acids and pentane and
hexanal analysis can give an indication of the oxidation of linoleic acid.

29
2.2.4. Processing odors
Processing odors have been studied in various products such as ripened, pickled, cooked,
smoked and hydrolyzed products like seafood flavorants. Volatile compounds
characteristic for processed seafood odors like alkyl-pyrazines and sulfur-containing
compounds have been found in cooked crustaceans, and furans have been found in spray-
dried shrimp powder and shrimp hydrolysate (Pan and Kuo, 1994). Thermally generated
aroma-active compounds via the Maillard reaction like pyrazines are characteristic for
enzymatically hydrolyzed seafood products like crayfish processing byproducts (Baek
and Cadwallader, 1996).
Josephson et al. (1987) have shown that reductions in intensity of the fresh fish flavor in
pickled fish correlates with lower levels of fresh fish alcohols and carbonyls. The
remaining fresh fish alcohols and carbonyls contribute to the mild but distinct flavor of
pickled fish.
Ripening odor: Various proteolytic and lipolytic reactions influence the development of
desirable flavor and texture of ripened products (Toldrá, 1998; Toldrá et al., 2000). The
formation of the flavor is due to a complex combination of enzymatic or chemical
reactions including lipid oxidation, Maillard reactions and Strecker degradation.
Numerous volatile compounds have been detected in ripened products like dry cured
ham, most of them generated from chemical or enzymatic oxidation of unsaturated fatty
acids and further interactions with proteins, peptides and free amino acids. During the
processing an intensive lipolysis has been observed. Free fatty acids are generated as a
result of phospholipid hydrolysis, indicating a major role of phospholipases while the
triglycerides remain almost intact. The free fatty acids accumulate during the process
because of oxidative processes and volatile compounds such as hydrocarbons, aldehydes,
alcohols and ketones are formed (Toldrá, 1998). The activity of proteases during the
processing of raw ham leads to the formation of small peptides and free amino acids that
can contribute to the taste (Toldrá and Flores, 1999). Free amino acids can also act as
substrates for Strecker degradations and Maillard reactions with sugars (Toldrá, 1998).
Similar processes have been reported in ripened seafood products where methional
derived from methionine and 2,6-nonadienal from fatty acid oxidation were the main
odorants in sugar salted ripend roe products (Jónsdóttir et al., 2004). Similarily, Triqui

30
and Reineccius (1995) found that 2,4-heptadienal and 3,5-octadien-2-one were associated
with the development of typical flavor obtained after anchovy ripening and thus
suggested that lipid autoxidation during ripening was primarily responsible for aroma
development. However, manufacturers of ripened products have observed that some
degree of proteolysis is necessary before flavor can develop. Methional and (Z)-
1,5-octadien-3-one were also identified as potent odorants in ripened anchovy (Triqui and
Guth, 1997) and aldehydes such as acetaldehyde, 2-methylpropanal and 3-methylbutanal
were the key, highly volatile components of ripened anchovy, probably originating from
amino acids.
The presence of malty flavor as a desirable characteristic in salt-ripened herring has been
noted (Gudmundsdóttir and Stefánsson, 1997). The origin of this flavor in herring is not
known, but in many foodstuffs the occurrence of branched chain aldehydes with low odor
threshold has been associated with breakdown of amino acids (Amoore et al., 1976).
Isobutyraldehyde that contributes a characteristic malty flavor is derived from valine by
microbial action. Even though microbial action has not been given a major role in the
ripening process of herring, it is however likely that degradation compounds from free
amino acid may affect the ripening flavor.
Smoke odor: The typical smoke flavor results from a number of compounds originating
in smoke, but is mostly attributed to the phenols (Miler and Sikorski, 1990). Phenolic
compounds are important for preservation and flavor properties of smoked products.
They are mainly produced by pyrolysis of lignin. The content of phenolic compounds in
these products depends on the nature of wood (Rozum, 1992). Guaiacol and
4-methylguaiacol have been identified as the main phenolic compounds in smoked fillets
of herring (Clupea harengus) fillets regardless of the smoke process used (Sérot et al.,
2004).
During studies on the application of electronic nose to detect the quality of smoked fish
products (Olafsdottir et al., VII) samples of different quality were selected to study both
the characteristic volatiles related to the smoking and the development of the microbially
produced volatiles by gas chromatography. The main classes of compounds and the
individual compounds were identified and quantified to give an idea of the contribution
of the respective classes to the total headspace in cold smoked salmon. Guaiacol

31
(2-methoxy phenol) was identified as the main compound contributing to the
characteristic smokehouse odor. Furfural was also identified in high levels in some of the
products (Jónsdóttir et al., Forthcoming). Furfural is a weak odorant and does therefore
not contribute to characteristic smoked aroma.
Cooked odor: Various reactions occurring during heat treatment of muscle food have
been related to the formation of meaty flavors and the involvement of ribose, amino acids
and lipids in the formation of heat generated flavors have been reported (Lindsay, 1990).
2-methyl-3-furanthiol which exhibits a strong meaty character has been identified in tuna
and is responsible for the characteristic meaty flavor in canned tuna (Withycombe and
Mussinan, 1988).
Autoxidatively produced unsaturated carbonyl compounds were the most abundant
components in boiled and canned fish, especially in trout and sulfur compounds are also
present and contribute to off odors. In boiled trout methional with a characteristic boiled
potato-like odor dominated the odor of the aldehyde fraction of the headspace volatiles
(Milo and Grosch, 1993). On the basis of odor evaluation 3-methyl-butanal in
combination with acetaldehyde, methional, (Z)-1,5-octadien-3-one, (E,Z)-2,6-
nonadieanal and (E, E)-2,4-decadienal were determined as character impact odorants of
boiled cod (Milo and Grosch, 1996).
2.2.5. Environmental odor
Environmental flavor taint in fish is for example petroleum type off odor resulting from
high levels of methyl sulfide in canned salmon (Motohiro, 1962), mackerel, (Ackman et
al., 1972) and Baltic herring, (Granroth and Hattula, 1976). The taint has been associated
with high levels of dimethyl-β-propiothetin originating from the food plankton in the
foods of fish, which has been suggested as the precursor for methyl sulfide. Shiomi et al.
(1982) attributed off flavor in flat head (Calliuricthys doryssus) to microbially formed
hydrogen sulfide and methyl mercaptan found in high levels on the skin. In contrast, they
found methyl sulfide in higher levels in tissue than on skin. Therefore, methyl sulfide was
associated with the precursor occurring in the stomach content or in the tissue.
The types of aromas associated with sulfur compounds are complex and dependent upon
concentration. Volatile sulfides present in food in low concentrations are often

32
responsible for desirable odors i.e. methyl sulfide in low levels contributes to the
characteristic aroma of fresh oysters (Ronald and Thomson, 1964) and soft-shell clams
(Brooke et al., 1968). Methyl sulfide was also detected in fresh haddock and was present
in similar levels throughout storage suggesting that this compound was not produced by
microbial activity (Olafsdottir, 2003). Similarly, methyl sulfide was detected in fresh cod
and was not found in samples during continued storage (Olafsdottir et al., VI).
Geosmin and 2-methyl-iso-borneol have been associated with the earthy odor of
freshwater species (Yurkowski and Tabacheck, 1980; Lovell, 1983). The formation of
these compounds is related to mould-like bacteria (actinomycets) and blue green algae,
which produce large quantities of these compounds in polluted freshwaters. Geosmin has
a very low flavor threshold of 0.01 ppb in water and many freshwater fishes may contain
low levels of these compounds as their characteristic flavor compounds. When present in
high levels these compounds contribute to off odors in freshwater fish (Kawai, 1996).
2.3. Analysis of volatile compounds
Extensive literature on methods for sampling volatile compounds for gas
chromatographic analysis from different kind of food is available (Jensen et al., 1998). In
general it can be stated that it depends on the volatility (vapor pressure) of the
components to be analyzed, what sampling methods are most suitable for their detection.
Application of different sampling techniques is often necessary for the detection of the
widest possible spectrum of volatile substances.
When detecting volatile compounds the general rule is that the sampling methods should
be as mild as possible so the sample will represent the actual composition of the original
sample. The benefits of using direct headspace analysis is the short time and simple
equipment involved in sampling, also artefacts caused by heat and contact with solvent
and sampling equipment are avoided and in addition the volatiles are collected in
concentrations which represent their actual vapor pressure in the sample. Temperature
has a direct influence on the volatility of the headspace components and sampling
conditions should be chosen so that artefacts induced by temperature will be minimized.
Sampling techniques for volatile compounds can in fact be used to select the components
in the headspace based on their volatility (Viehweg et al., 1989). Both static and dynamic

33
headspace sampling systems have been used for the rapid detection of volatile
compounds with electronic noses. Lengthy sampling procedures involved in the
concentration of components present in low levels in foodstuffs are not considered
practical for rapid measurement techniques. The use of gas chromatography to analyze
volatile compounds requires laboratory equipment and trained personnel and is not
suitable for industrial settings. The increased demand for rapid practical methods for
industrial application has brought attention to the development of electronic noses.
Monitoring changes of fresh odor compounds as a part of the total headspace with an
electronic nose is not possible using static headspace techniques. The fresh odor
compounds are present in very low levels (ppb) and pre-concentration techniques are
necessary to sample them in adequate concentrations for detection by the sensors.
Concentration techniques are often time consuming, which is not practical for rapid
analysis.
Moreover, because of the non-selective nature of electronic noses in general, it is likely
that when analyzing total headspace of fish during storage, the changes in fresh odor
compounds would not be noticed. The detection of low molecular weight, very volatile
spoilage compounds such as amines (TMA), sulfur compounds and short chain alcohols
that are present in much higher concentrations (ppm) in the headspace during storage of
fish would overpower the fresh fish compounds.
Therefore, it can not be assumed that the gas sensors are measuring the overall odor, but
rather detecting the components that are in the highest concentration in the headspace
which can be of both odorous and non odorous nature. In some cases the compounds may
have little or no effect on the human olfactory system, but they may be detected by the
gas sensors.
Future research should focus on developing rapid concentration techniques for odorous
components that are present in very low levels and development of selective sensors to
use in electronic noses for their rapid detection.
Some of the influential odor compounds that have very low odor thresholds are often
present in low levels and these are difficult to detect by rapid techniques. An alternative
is to use instead indicator compounds, which are present in higher levels and can be
detected by rapid methods. This is only possible if the pattern of the volatile compounds
34
is known and a connection has been verified between the indicator compound and the
compounds that are responsible for the odors.
Classification of the volatile compounds occurring in fish, based on their structural
characteristics is useful to guide future development and selection of gas sensors for fish
applications. Information on the identity and quantity of the volatile compounds
contributing to the spoilage pattern of each species will facilitate interpretation of
measurements with electronic noses. Rapid measurements of volatile compounds with an
electronic nose can thus detect rapidly the freshness stage of fish.
2.4. Development of the electronic nose technique:
The rapid detection of the quality of food has been one of the main application areas for
the newly developed electronic nose technique. In the early nineties commercial
instruments were launched on the market for this purpose, but some drawbacks to their
immediate use in the industry occurred. The main reason was that the instruments were
not fully developed and problems because of their sensitivities to humidity and
environmental conditions led to misinterpretation of their performances. Active research
in this area has since focused on characterizing better the overall technique.
Improvements of the selectivity, sensitivity and reproducibility of the gas sensors have
been the key issues. Identification of other important factors not directly related to the
development of the sensor technologies have been brought into focus This includes
sampling techniques and data analysis which are essential parts of the overall technique
(Haugen and Kvaal, 1998; Haugen, 2001; Mielle,1996. Mielle and Marquis, 1999;
Gardner and Bartlett, 1999).
Electronic noses have been suggested for various applications related to quality
evaluation of different food like monitoring freshness and the onset of spoilage or
bioprocesses of food. Many of these applications are based on detecting volatile
compounds produced because of the growth of fungi, moulds or microbes or changes
occurring in food because of oxidation (Olafsson et al., 1992; Jonsson et al., 1997;
Namdev et al., 1998; Schnürer et al., 1999; Olsson et al., 2002; Keshri et al., 2002;
McEntegart et al., 2000; Boothe and Arnold, 2002). Recently electronic nose technology
has been used for quality assessment and monitoring ripening of Danish Blue Cheese

35
(Trihaas and Nielsen, 2005; Trihaas et al., 2005). Other application areas for electronic
noses include medical applications, pharmaceutical industry applications, cosmetics,
environmental monitoring, flavor and fragrances and monitoring tainting in packaging
materials.
2.4.1. Electronic noses: key principles
The key principles involved in the electronic nose concept, is the transfer of the total
headspace of a sample to a sensor array that detects the presence of volatile compounds in
the headspace and a pattern of signals is provided that are dependent on the sensors´
selectivity and sensitivity and the characteristics of the volatile compounds in the
headspace (Gardner and Bartlett, 1999). Feature extraction and pre-processing of the data
are essential steps before applying pattern recognition techniques that are required to
interpret the sensors signals characterizing the samples.
Qualitative discrimination power of the electronic nose technique has a resemblance to
the subjective discrimination of odors by the human nose. The common approach in the
multipurpose commercial electronic noses is to characterize odors by generating patterns
with a sensor array using numerous sensors with partly overlapping selectivity. Another
approach is the use of highly selective sensors for specific indicator compounds. For both
approaches basic understanding of the composition and chemistry of the volatile
compounds being measured is a key factor to ensure meaningful evaluation of the sensor
responses.
More than 10,000 odorous compounds are known to exist in nature but only a few of
these are likely to be important in solving any discrimination task by an electronic nose.
Many studies have stressed the importance of comparing the electronic nose techniques
to traditional analysis of volatile compounds by gas chromatography and obtain
information about the most abundant volatiles in the headspace. This knowledge can be
used further to select sensors in an array that are sensitive to some key indicator
compounds in the headspace. For quantitative analysis a few sensors from the array can
give adequate information, given that the selectivity of the sensors covers the different
classes of compounds relevant for the particular application. It is unlikely that a universal
electronic nose instrument, able to solve all odor detection problems will become a
commercial reality, particularly since creating sensor diversity within an instrument is

36
expensive and most instruments are dedicated to certain applications. Numerous
electronic nose instruments based on different types of sensors, sampling systems and
data analysis procedures have been developed. Active research in the past years on
different types of sensors has resulted in commercial gas sensors instruments with
dedicated approaches for a wide range of applications from quality control of various
food products to medical diagnosis (Craven et al., 1996; Pearce et al., 2003).
The leading companies manufacturing electronic nose instruments are from Europe,
USA, and Japan. Instruments frequently used for food application in the scientific
literature are from Alpha M.O.S. (France ), Cyrano Science (USA), Neotronic Scientific,
Inc (USA), Lennartz Electronic, Germany, Univ. Rome Tor Vergata, Italy, Nordic Sensor
Technologies and S-SENCE, Sweden. Following review papers on the electronic nose
technique are recommended for further reading Bartlett et al. (1997), Schaller et al.
(1998), Gardner and Bartlett (1999), Harper (2001), Haugen (2001), Jurs et al. (2002),
Garcia -González and Aparicio (2002). Information on the website of The NOSE II 2nd
Network on Artificial Olfactory Sensing has the aim to stimulate information exchange
between scientists, manufacturers, and end-users in Europe in order to develop synergy in
the sensor community, improve the efficiency of R&D, encourage interdisciplinary
research, and promote application of new ideas (http://www.nose-network.org/).
2.4.2. Sensor technologies
A comprehensive overview of the electronic nose technique was given by Gardner and
Bartlett (1999), including sensor technology, data analysis and selected applications. A
brief summary will be given here to introduce the different sensor technologies used in
electronic noses.
Metal Oxide Semiconductors (MOS): A commercially available device called the Tagushi
sensor is based on tinoxide (SnO2) sensors which are doped with precious metals to alter
the response characteristics of the semiconductor. The gas analytes interact with surface
absorbed oxygen and the conductivity of the tinoxide film changes. Typical operating
temperatures are high (around 300-400°C) to ensure that the surface reactions are rapid
and to decrease the chance that chemisorbed water will interfere. The Fishnose developed
by AlphaMOS (Toulouse, France) for quality evaluation of smoked salmon discussed in
paper VII is based on MOS sensors.

37
Metal Oxide Semiconducting Field Effect Transistors (MOSFETs) are related to the MOS
sensors but the output signal derives from the change in potential when the gas molecules
react at the catalytic surface. The operating temperature is 100-200°C.
Quartz Crystal Microbalance (QCM) devices measure the mass of molecules adsorbed on
the sensor surface. The active element is piezoelectric crystal with a fundamental
resonant frequency which decreases when mass is added to it. Bulk acoustic wave
(BAW) sensors and thickness shear mode resonators are common types of these devices.
They are operated at room temperature and have high stability over time. The Libra Nose
developed by University of Rome (Tor Vergata) in Rome used in paper II is based on
thickness shear mode resonators coated with various kinds of metalloporphyrins.
Surface Acoustic Wave (SAW) sensors have interdigitated electrodes on a piezoelectric
substrate and a thin coating of a selective absorbing material on the surface. Different
coatings include polymers, lipids, Langmuir –Blodgett films and self –assembled
monolayers. A radio frequency voltage is applied which changes when molecules are
absorbed on the surface. SAW sensors have higher sensitivities and faster response times
than QCM devices and can be mass produced at low cost. They have good
reproducibility, but their main limitation as for many types of sensors is their sensitivity
to humidity.
Conduction Polymers (CP) chemiresistors are based on measurements of the resistance of
a thin polymer film most often made from polypyrrole which has a conjugated π-
electrone system. The sensors are made by electropolymerizing a thin polymer film
across a narrow electrode gap. The devices can be operated at room temperature and the
sorption of gas molecules changes the conductivity of the polymer.
Optical Sensors are based on a light source that excites for example the gas analyte and
the signal measured is the resulting absobrance, reflectance, fluorescence or
chemiluminescence
Electrochemical sensors contain electrodes and an electrolyte. The responses generated
are dependent on the electrochemical characteristics of the molecules that will be
oxidized or reduced at the working electrode and the opposite reaction will take place at
the counter electrode. The output signal is the measured voltage between the electrodes
generated by changes in current because of the reactions. Their advantages include long
term stability, insensitivities to humidity and linear dependence on gas concentrations.

38
The electronic nose FreshSense based on commercial electrochemical gas sensors (CO,
SO2, H2S and NH3) was developed by IFL and the company Bodvaki-Maritech (Iceland).
This instrument was mainly used in the study as described in papers I-VI
The inability to provide absolute calibration and reproducible result for gas sensors is
often accounted for because of drift in sensor responses with time. This is of concern
when renewing sensors in an array or when compiling data from different instruments
with the same sensor array. Attempts have been made to compensate for sensor drifts
using mathematical methods (Holmberg et al., 1996; Balaban et al., 2000; Tomic et al.,
2002).
2.4.3. Sampling systems
Sampling in electronic nose systems involves the transfer of headspace from the sample
to the sensor array. In general it depends on the volatility of the components to be
analyzed, what sampling methods are most suitable. Closed sampling compartments are
commonly used to allow the headspace to equilibrate and become enriched with the
volatiles. Temperature directly influences the composition of volatiles in the headspace
above the food sample and their concentration is also dependent on the sample size, in
particular the exposed surface area of the sample and the ratio of sample to headspace in
the sampling container.
Static headspace sampling methods are simple and low-cost. The benefit of using simple
sampling systems and static headspace analysis is the short time and simple equipment
involved in sampling. In addition the volatiles are collected in concentrations which
represent their actual vapor pressure in the sample which allows more meaningful
comparison to sensory methods.
Mielle and Marquis (1999) compared five different transfer methods irrelevant of the
sensor techniques and concluded that the transfer techniques considerably influenced the
system performance. Use of a carrier gas to transfer volatiles is common in electronic
nose systems. The introduction of a carrier gas to transfer the headspace will result in
lower concentration of volatiles reaching the sensors and less sensitive detection.
Flushing of sensors with inert gas is often necessary to clean the sensors and speed up
their recovery after exposure to samples.

39
Pre-concentration techniques: Solid-phase microextraction (SPME) and other more
complicated pre-concentration sampling techniques commonly used in gas
chromatography analysis have been used to increase the concentration of components that
are present in low levels to allow detection by electronic noses. Marsili (2001) used an
alternative electronic nose technique by using SPME, mass spectrometry (MS) and
multivariate anlysis for assessing oxidation off-flavors in foods. By selecting peaks that
contributed directly to the oxidation flavor and ignoring unimportant background
chemicals it was possible to improve PCA groupings. They claimed that this technique
was more robust than the new chemical sensor technologies currently used in e-nose
instruments because of proven track record of mass spectrometry detectors.
Influence of sampling temperature: For improved performance of current e-nose systems
it would be useful to take into account the equilibration kinetics of the headspace (Mielle
and Marquis, 1999). The most important factor is the control of the sample temperature.
Many of the commercial instruments today are equipped with automatic sampling
systems and temperature controls.
The influence of temperature on the repeatability of measurements and discrimination
efficiency of SnO2 sensors has been studied by Roussel et al. (1999). They quantified the
influence of the temperature of the headspace, the measurement cell and the way of
injecting samples and concluded that for each application of aroma classification it is
necessary to perform an optimization of the experimental conditions. For the
experimental conditions studied "static" injection proved to be more discriminative and
repeatable than the "dynamic" one for wine off-flavor volatiles. The lower temperature of
the headspace studied (35°C) proved to be more discriminative for the headspace
generated than the higher temperature (60°C) although the volatiles were more
concentrated at higher temperature.
The temperature of the sample will influence the composition of the volatile compounds
in the headspace. To increase the amount of volatiles in the headspace higher
temperatures can be used, but at the same time the warming up of samples is often the
time limiting factor in the analysis. At low temperatures, only very volatile compounds
are present and slight changes in sample temperature will influence the vapor pressure of
the volatiles and the headspace composition.
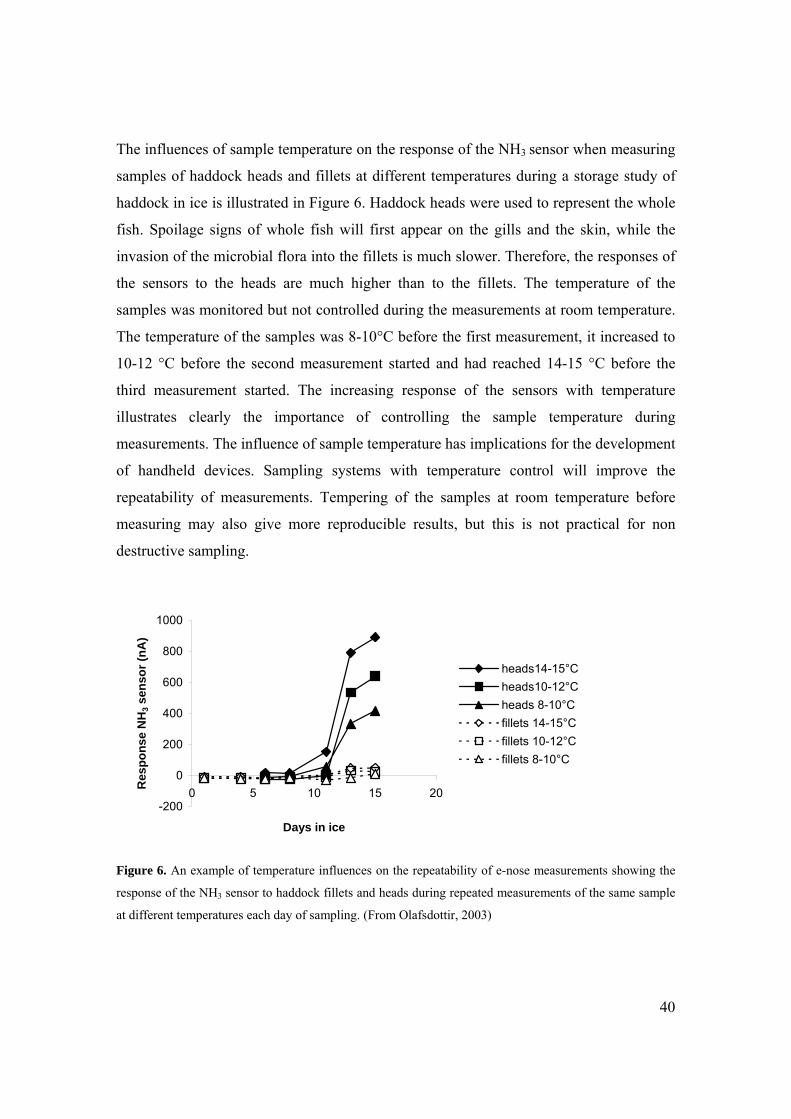
40
The influences of sample temperature on the response of the NH3 sensor when measuring
samples of haddock heads and fillets at different temperatures during a storage study of
haddock in ice is illustrated in Figure 6. Haddock heads were used to represent the whole
fish. Spoilage signs of whole fish will first appear on the gills and the skin, while the
invasion of the microbial flora into the fillets is much slower. Therefore, the responses of
the sensors to the heads are much higher than to the fillets. The temperature of the
samples was monitored but not controlled during the measurements at room temperature.
The temperature of the samples was 8-10°C before the first measurement, it increased to
10-12 °C before the second measurement started and had reached 14-15 °C before the
third measurement started. The increasing response of the sensors with temperature
illustrates clearly the importance of controlling the sample temperature during
measurements. The influence of sample temperature has implications for the development
of handheld devices. Sampling systems with temperature control will improve the
repeatability of measurements. Tempering of the samples at room temperature before
measuring may also give more reproducible results, but this is not practical for non
destructive sampling.
-200
0
200
400
600
800
1000
0 5 10 15 20
Days in ice
Res
pons
e N
H3 s
enso
r (nA
)
heads14-15°Cheads10-12°Cheads 8-10°Cfillets 14-15°Cfillets 10-12°Cfillets 8-10°C
Figure 6. An example of temperature influences on the repeatability of e-nose measurements showing the
response of the NH3 sensor to haddock fillets and heads during repeated measurements of the same sample
at different temperatures each day of sampling. (From Olafsdottir, 2003)

41
2.4.4. Data analysis
Jurs et al. (2000) give an excellent overview of methods for analysis of data from
electronic noses including multivariate methods and neural networks. The first step is the
assembling of the data set of the sensor array responses for the analyte of interest.
Secondly, they describe the use of data pre-processing and normalization to provide more
useful input for the mathematical tools like principal components analysis or neural
networks selected for the data analysis. Thirdly, is the selection of the features to be used
for the recognition of the pattern. This is often the steady – state response from each
sensor as the input, but no general guidelines exist and it is necessary to explore different
strategies for each application and sensor array. The fourth step is performing the data
analysis and the techniques used can be categorized as statistical techniques or neural
network based approaches. These various approaches can be used for classification while
others can be used for quantification. The fifth step is the validation of the models
preferably using data not used in creating the models.
The methods most often used for electronic noses are linear discriminant analysis (LDA),
principle component analysis (PCA), principle component regression (PCR), partial least
squares (PLS), cluster analysis and artificial neural networks (NN).
LDA has been used successfully to classify samples based on formulating boundaries
between components of different classes and thus separate the samples in for example
"good" and "bad" lots.
PCA is an efficient approach to reduce the dimensionality of a data set. Often two or three
principle components provide an adequate representation of the data for a graphical
output. Visual examination of the data can thus provide useful information about both
samples and sensors. Loading plots can determine which sensors are providing similar
information and which are providing unique information and can thus form a basis for
selecting the useful sensors in an array. PC plots describe data variation and may or may
not provide class separation. PCA is sometimes used to obtain quantitative information
but normalisation of the sample responses may remove the concentration effects from the
responses.
PCR provides a link between the response information and the concentration information
and is especially useful for sensors with linear responses. The calibration information can
42
be used to find approximation to the regression coefficients and can be used to obtain
quantitative estimates for analytes in the calibration samples.
PLS gives similar information as PCA and PCR and is frequently used for quantitative
prediction of analytes based on sensor responses.
Cluster analysis requires a large number of training data and is used as an exploratory or
a pattern recognition technique often associated with evaluating the performance of a
sensor array to correctly cluster various analytes.
Artificial neural network techniques are popular for electronic nose data processing
because of their ability to analyze complex and non-linear data. Various methods exists
including feed forward neural networks and self organizing maps that apply various
algorithms to adjust the weights and biases of the computational processes involved in the
training to achieve pattern recognition.
2.5. Application of electronic noses for fish
In recent years attempts to use electronic nose technology to track the spoilage processes
occurring in fish have been reported in numerous papers. Most of these are feasibility
studies, showing the ability of the electronic nose to discriminate between different
spoilage levels or storage time of samples.
Electronic nose instruments based on various sensor technologies have been used for fish
applications and compared with different reference methods like sensory analysis,
chemical measurements of volatile compounds like TVN or TMA and microbial analysis.
Instruments based on different sensor technologies have been used like metal-oxide
chemoresistor sensors (Ólafsson et al., 1992; Egashira et al., 1990; Ohashi et al., 1991),
MOSFET sensors (Haugen and Undeland, 2003), amperometric sensors (Schweizer-
Berberich et al., 1994; Olafsdottir et al., 1997b; c; 1998; 2000; 2002; Högnadóttir, 1999;
Jónsdóttir et al., 2005), conducting polymer sensors (Du et al., 2001; 2002; Luzuriaga
and Balaban 1999a; b; Newman et al., 1999) and quartz microbalance sensors (Di Natale
et al., 1996; 2001; Zhao et al., 2002).

43
2.5.1. Selection of sensors to detect quality indicator compounds
The general approach when using electronic nose, is to analyze the total headspace of the
sample without prior separation of individual compounds as is done in gas
chromatography. The discrimination power of the electronic nose is based on utilizing an
array of a large number of sensors of different but often overlapping selectivity and the
interpretation of the data requires the use of pattern recognition techniques. Gas sensors
that are currently used in electronic noses are non-selective towards individual
compounds, but some of them are selective towards certain classes of compounds.
For quantitative analysis a few sensors from the array can give adequate information,
given that the selectivity of the sensors cover the different classes of compounds relevant
for the particular application (Di Natale et al., 1996).
When designing a sensor array for a dedicated application it is important to select a
combination of sensors that are sensitive to the key components of interest and ideally the
detection limit for each compound of interest should be specified as in any other
analytical task. Adding a sensor with no sensitivity to the compounds of interest but with
a significant noise will potentially degrade the performance of the array as a whole.
Research efforts have focused on developing membranes for selective detection of
important quality indicating compounds like sensors aimed specifically at the detection of
compounds contributing to freshness odors of fish (Deng et al., 1996). Many researchers
have developed sensors for the selective detection of microbial metabolites like TMA
(Storey et al., 1984; Egashira et al., 1990; Saja et al., 1999; Zhao et al., 2002). Ohashi et
al. (1991) evaluated the performance of a semiconductive trimethylamine gas sensor
(In2O3 -MgO) to detect the freshness of cod, sardine and yellow tail stored at 10 and
27°C. The same group reported further that even a single gas sensor was quite useful to
monitor fish freshness by the selective detection of TMA, DMA and ammonia (Egashira
et al., 1994). Volatiles associated with safety of fish products like histamine causing
scombroid poisoning is the leading cause of finfish-borne illness. Histamine has
traditionally been used as an indicator for safety. Selective detection of bioamines has
been suggested using an amperometric detection of histamine with a methylamine
dehydrogenase polypyrrole-based sensor (Zeng et al., 2000).
To determine the spoilage of capelin, quantitative analysis of the changes of volatile
compounds in the headspace was done using only three gas sensors from an array of nine

44
electrochemical sensors in the electronic nose "FreshSense" (Olafsdottir et al., 1997b).
The gas sensors were selected on basis of their sensitivity towards three classes of
compounds that typically form during storage of fish, namely alcohols, sulfur compounds
and nitrogen containing compounds. Analysis of standard compounds, namely ethanol,
dimethyldisulfide and TMA showed that the gas sensors selected in the electronic nose
"FreshSense" were selective and sensitive for their detection. FreshSense measurements,
in particular the NH3 sensor was found to be comparable to traditional TVB-N analysis to
detect the spoilage of capelin (Olafsdottir et al., 1997c). Furthermore, the FreshSense
instrument was applied to monitor changes in the headspace of herring and shrimp during
storage at 0 °C and to measure sugar salted roe and fishmeal of different quality
(Olafsdottir et al., 1998b). The development of ammonia is characteristic for shrimp
during storage and the NH3 sensor appeared to be promising to monitor changes in
shrimp quality. The NH3 sensor correlated well with sensory analysis (Olafsdottir et al.,
1998b) and TMA measurements in shrimp (Zeng et al., 2005).
2.5.2. Quality indicators – volatile compounds in the highest amount
A study of haddock fillets kept in cold storage (0-2°C) for 3, 7, 10 and 14 days was
performed to obtain more detailed information about the identity and the level of the most
abundant volatile compounds present in the headspace during storage of fish (Table 2)
Analyzes of the headspace volatiles were conducted using air pump headspace sampling
and collection of volatiles by a TENAX pre-concentration technique and analysis by gas
chromatography (GC-MS) (Olafsdottir, 2003). The main classes of compounds identified
in packed haddock fillets during storage were alcohols, aldehydes, esters, ketones, sulfur
compounds and amines (Table 2). The quantitative GC-MS results of the main classes of
spoilage compounds were compared to the responses of the FreshSense electronic nose
sensors which are sensitive to the respective classes (Figure 7).
The sum of the GC responses of individual compounds belonging to each class of
compounds like the alcohols, aldehydes and esters corresponded to the CO sensor
responses of the electronic nose. The sum of the amines and the sulfur compounds
detected by GC-MS corresponded to the responses of the NH3 and SO2 sensors,
respectively. The response of the CO sensor was the highest and increased early in the
storage while the responses of the NH3 sensor and the SO2 sensors increased later in

45
storage. Because of breakthrough of small polar, molecules on the TENAX traps the
technique is not suitable for the quantification of compounds like ammonia, hydrogen
sulfide, methyl mercaptan, and ethanol that are known to be present in abundance in the
headspace of spoiled fish. However, the electrochemical sensors can detect these
compounds and therefore the slopes and shapes of the curves are slightly different.
Table 2. Headspace volatiles of packed haddock fillets during storage at 0 °C collected by an air pump on a
Tenax trap followed by thermal desorption, separation and detection by GC-MS. (From : Olafsdottir, 2003)
RI DB-5msa 3 days 7 days 10 days 14days Alcohols ethanol <173 2-methyl-1-propanol 227 ++ ++ +++ 1-penten-3-ol 263 + 3-methyl-1-butanol 312 + ++ ++ +++ 2-methyl-1-butanol 314 ++ 2,3-butandiol 357 + Aldehydes acetaldehyde <173 + + 3-methyl-butanal 245 + ++ hexanal 376 + heptanal 494 + nonanal 703 ++ ++ ++ ++ decanal 803 + + + + Esters ethyl acetate 209 ++ ++ ++ +++ propanoicacid-2-methyl,ethylester 333 ++ acetic acid, 2-methylpropyl ester 348 + butanoic acid, ethyl ester 381 ++ +++ 2-butenoic acid,ethyl ester 428 + butanoic acid, 2-methyl, ethylester 433 ++ butanoic acid, 3-methyl, ethylester 439 ++ hexanoic acid, ethyl ester 595 ++ Ketones 2,3-butandione 207 ++ 3-pentanone 273 + + + 3-hydroxy-2-butanone 282 +++ +++ +++ Sulfur compounds dimethyl sulfide 182 ++ ++ ++ ++ dimethyl disulfide 319 ++ dimehtyl trisulfide 562 + Amines TMA 174 ++ ++ +++ +++ aCalculated ethyl ester retention index on DB-5ms capillary column

46
0 5 10 15Days
Arbi
trary
uni
ts
Alcohols, aldehydes and esters
Amines (TMA)
Sulfur compounds
a)
0
400
800
1200
0 5 10 15Days R
espo
nse
sens
ors
(nA)
CO
SO2
NH3
b)
Figure 7. Sum of the peak areas of compounds representing the three different classes of compounds
detected by GC in the headspace of haddock fillets during storage in ice (a) and responses of the CO, SO2
and NH3 sensors towards haddock fillets during storage in ice (b) (From: Olafsdottir, 2003)
TMA, 2-methyl-1-propanol, 3-methyl -1-butanol, 3-hydroxy- butanone, ethyl acetate and
butanoic acid ethyl ester were found in the highest amount and increased with storage of
haddock fillets. Dimethyl disulfide and dimethyl trisulfide were detected at the end of the
storage time when the samples were spoiled, while dimethyl sulfide was detected in all
samples and probably contributes to the typical potent odor of haddock fillets often
described as innard-like.
Increasing concentrations of spoilage indicator compounds with storage time resulted in
the development of characteristic odors and simultaneously increased responses of the
electronic nose sensors were observed. On day 3 the odor of the fresh fillet was very little
or neutral and low responses of the sensors were observed. The first spoilage odors of the
fillets were sweet like odors that were contributed by the alcohols which give sweet,
solvent like odors in combination with aldehydes giving sweet, rancid-like odors (day 7).
The amines contributed to salted fish or stock fish odor and in combination with the
sulfur compounds, cheesy and foul odors developed and the fillets became stale on day
10. Finally, esters were analyzed in high levels on day 14 giving characteristic sweet,
fruity odors. When these sweet odors were mixed with the foul smell of sulfur
compounds and ammonia- like stockfish character of the amines the odor of the fillet
becomes TMA / ammonia-like and sour / putrid – like, signaling the overt spoilage
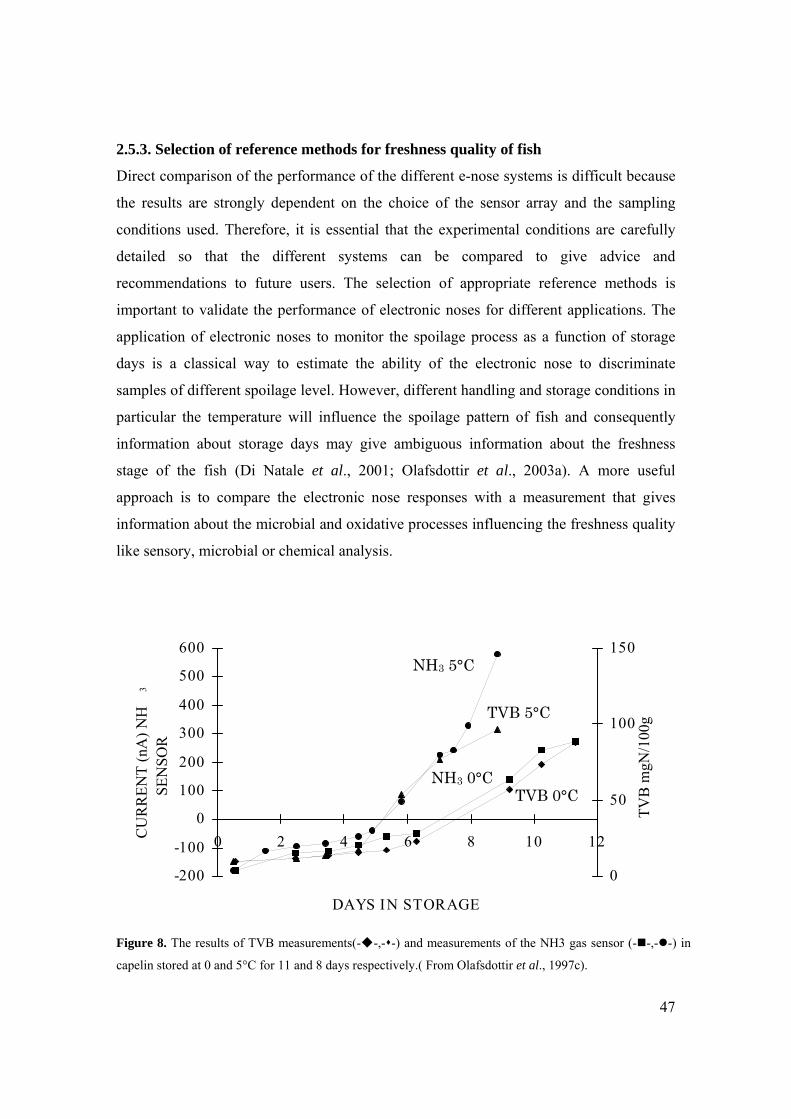
47
2.5.3. Selection of reference methods for freshness quality of fish
Direct comparison of the performance of the different e-nose systems is difficult because
the results are strongly dependent on the choice of the sensor array and the sampling
conditions used. Therefore, it is essential that the experimental conditions are carefully
detailed so that the different systems can be compared to give advice and
recommendations to future users. The selection of appropriate reference methods is
important to validate the performance of electronic noses for different applications. The
application of electronic noses to monitor the spoilage process as a function of storage
days is a classical way to estimate the ability of the electronic nose to discriminate
samples of different spoilage level. However, different handling and storage conditions in
particular the temperature will influence the spoilage pattern of fish and consequently
information about storage days may give ambiguous information about the freshness
stage of the fish (Di Natale et al., 2001; Olafsdottir et al., 2003a). A more useful
approach is to compare the electronic nose responses with a measurement that gives
information about the microbial and oxidative processes influencing the freshness quality
like sensory, microbial or chemical analysis.
Figure 8. The results of TVB measurements(- -,- -) and measurements of the NH3 gas sensor (- -,- -) in
capelin stored at 0 and 5°C for 11 and 8 days respectively.( From Olafsdottir et al., 1997c).
-200
-100
0
100
200
300
400
500
600
0 2 4 6 8 10 12
DAYS IN STORAGE
CU
RR
ENT
(nA
) NH
3
SEN
SOR
0
50
100
150TV
B m
gN/1
00g
TVB 5°C
TVB 0°C NH3 0°C
NH3 5°C
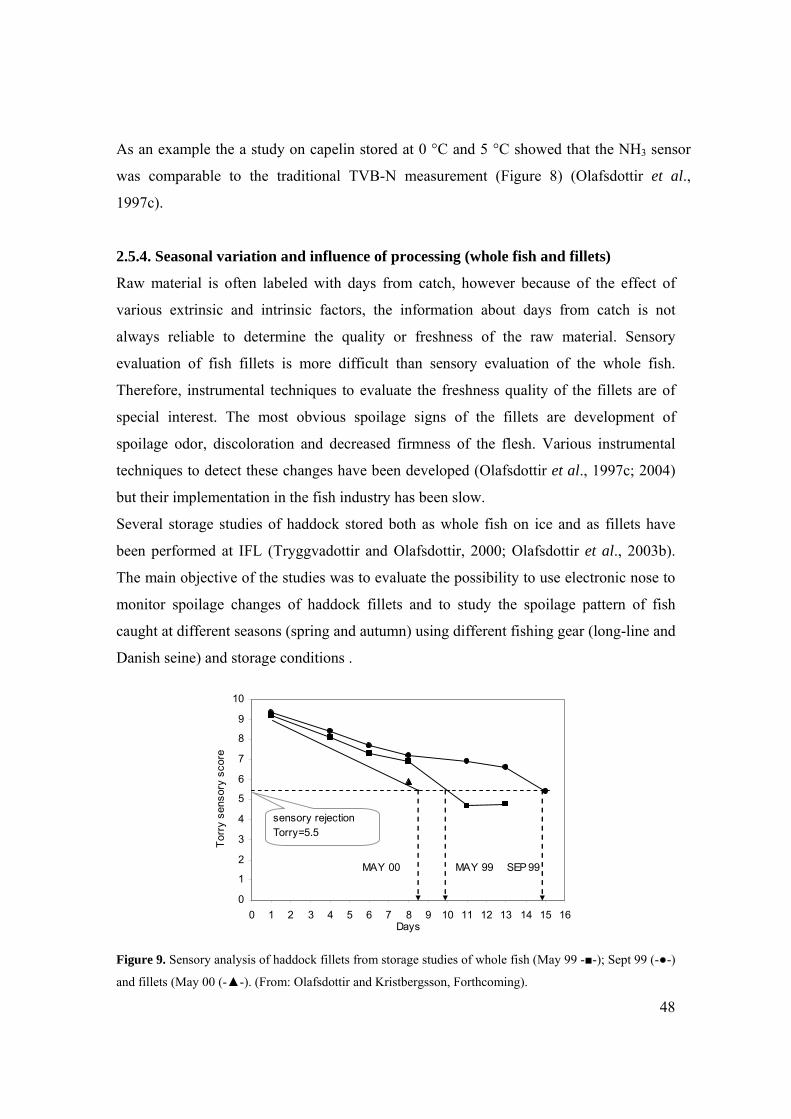
48
As an example the a study on capelin stored at 0 °C and 5 °C showed that the NH3 sensor
was comparable to the traditional TVB-N measurement (Figure 8) (Olafsdottir et al.,
1997c).
2.5.4. Seasonal variation and influence of processing (whole fish and fillets)
Raw material is often labeled with days from catch, however because of the effect of
various extrinsic and intrinsic factors, the information about days from catch is not
always reliable to determine the quality or freshness of the raw material. Sensory
evaluation of fish fillets is more difficult than sensory evaluation of the whole fish.
Therefore, instrumental techniques to evaluate the freshness quality of the fillets are of
special interest. The most obvious spoilage signs of the fillets are development of
spoilage odor, discoloration and decreased firmness of the flesh. Various instrumental
techniques to detect these changes have been developed (Olafsdottir et al., 1997c; 2004)
but their implementation in the fish industry has been slow.
Several storage studies of haddock stored both as whole fish on ice and as fillets have
been performed at IFL (Tryggvadottir and Olafsdottir, 2000; Olafsdottir et al., 2003b).
The main objective of the studies was to evaluate the possibility to use electronic nose to
monitor spoilage changes of haddock fillets and to study the spoilage pattern of fish
caught at different seasons (spring and autumn) using different fishing gear (long-line and
Danish seine) and storage conditions .
0
1
2
3
4
5
6
7
8
9
10
0 1 2 3 4 5 6 7 8 9 10 11 12 13 14 15 16Days
Torr
y se
nsor
y sc
ore
MAY 00 MAY 99 SEP 99
sensory rejection Torry=5.5
Figure 9. Sensory analysis of haddock fillets from storage studies of whole fish (May 99 -■-); Sept 99 (-●-)
and fillets (May 00 (-▲-). (From: Olafsdottir and Kristbergsson, Forthcoming).

49
The fish was stored whole in ice during the first two experiments (MAY99 and SEP99),
but in the third one (MAY00) the fish was stored as fillets in styrofoam boxes in cold
room (0-2°C). Changes of various properties related to freshness quality of haddock
stored in ice were monitored by the electronic nose FreshSense and compared to
traditional chemical (total volatile bases (TVB-N)), sensory (Torry scheme) and
microbial methods (total aerobic viable count (TVC) and texture measurements.
Measurements were performed on fillets on days 1, 4, 6, 8,11,13 and 15 counted from the
day of catch.
Sensory analysis of the fillets using evaluation of cooked fillets according to the Torry
scheme showed that the spoilage pattern was different in the three studies (Figure 9). The
limit of shelf life was defined as Torry score = 5.5. Fillets spoil faster than whole fish as
expected and seasonal variation influenced the spoilage rate. Recently spawned fish
caught by Danish seine and stored as whole fish in ice from the spring (MAY 99) had
shorter shelf life in ice (10 days) than whole fish caught by long-line from the autumn
season (SEP 99) (14-15 days). Fish stored as fillets at 0-2°C (MAY 00) spoiled faster
than whole fish and had a shelf-life of only 8-9 days. The results of the electronic nose
measurements and the microbial and chemical analysis were mostly in agreement with
the sensory analysis (Figures 10 and 11).
0
1
2
3
4
5
6
7
8
9
0 5 10 15 20
Days
TVC
log
cfu/
g
MAY 00
MAY 99
SEP 99
0
100
200
300
400
500
600
700
800
900
0 5 10 15 20Days
Res
pons
e C
O s
enso
r (n
A)
MAY 00
MAY 99
SEP 99
Figure 10. Microbial analysis (TVC) and electronic nose measurements (CO sensor) of haddock fillets
from storage studies at 0-2 °C for up to 15 days of whole fish May 99 (-■-); Sept 99 (-●-) and fillets May
00 (-▲-).(From: Olafsdottir and Kristbergsson, Forthcoming)

50
0
10
20
30
40
50
60
70
0 5 10 15 20Days
TVB-
N m
g N
/100
g
MAY 00
MAY 99
SEP 99
0
10
20
30
40
50
60
70
80
90
100
0 5 10 15 20Days
Res
pons
e N
H3 s
enso
r (n
A)
MAY 00
MAY 99
SEP 99
Figure 11. Chemical measurements of total volatile bases (TVB-N) and electronic nose measurements
(NH3 sensor) of haddock fillets stored at 0-2 °C for up to 15 days, from storage studies of whole fish May
99 (-■-); Sept 99 (-●-) and fillets May 00 (-▲-).(From: Olafsdottir and Kristbergsson, Forthcoming)
The traditional microbial analysis (TVC) and electronic nose measurements (CO sensor)
showed a similar overall trend in the storage studies of whole fish (May 99 and Sept 99)
and fillets (May 00) (Figure 10) and likewise the results of TVN chemical measurements
and the NH3 electronic nose sensor showed similar overall trend (Figure 11).
The electronic nose measurements showed that the responses of the sensors were highest
for the (MAY00) samples indicating the most rapid spoilage for fish stored as fillets The
results from sensory analysis, TVN (total volatile bases) measurements and the NH3
sensor showed that recently spawned fish from the spring season (May 1999), stored as
whole fish, had higher spoilage rate than fish from the autumn season (SEP 1999).
Contradictory to these results the TVC and CO measurements indicated that the spoilage
rate appeared to be higher in the fall (SEP99) than in the spring (MAY99). However,
based on the results of sensory analysis it appears that the spoilage potential of the
microflora was greater in the spring, probably because of the condition of the raw
material favoring their growth. This emphasizes the role of the specific spoilage
organisms and their spoilage potential suggesting the validity of TVC measurement may
be questionable as has been suggested by other researchers (Gram et al., 2002).
At sensory rejection, increased responses of the NH3, H2S and SO2 sensors detecting
microbially produced amines and sulfur compounds was observed in all experiments.
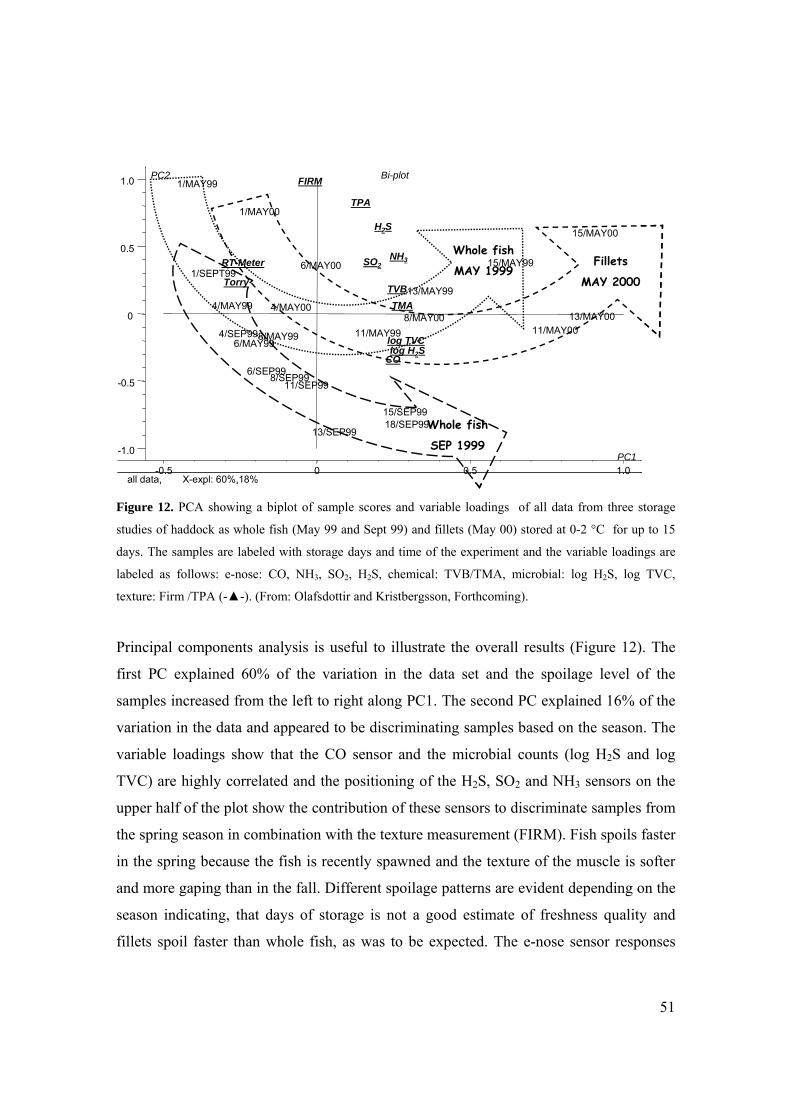
51
-1.0
-0.5
0
0.5
1.0
-0.5 0 0.5 1.0all data, X-expl: 60%,18%
1/MAY99
4/MAY99
6/MAY998/MAY99 11/MAY99
13/MAY99
15/MAY991/SEPT99
4/SEP99
6/SEP998/SEP9911/SEP99
13/SEP99
15/SEP9918/SEP99
1/MAY00
4/MAY00
6/MAY00
8/MAY0011/MAY00
13/MAY00
15/MAY00
CO
H2S
SO2NH3
log H2Slog TVC
Torry
TMATVB
RT-Meter
TPA
FIRM
PC1
PC2 Bi-plot
Fillets
MAY 2000
Whole fish
MAY 1999
Whole fish
SEP 1999-1.0
-0.5
0
0.5
1.0
-0.5 0 0.5 1.0all data, X-expl: 60%,18%
1/MAY99
4/MAY99
6/MAY998/MAY99 11/MAY99
13/MAY99
15/MAY991/SEPT99
4/SEP99
6/SEP998/SEP9911/SEP99
13/SEP99
15/SEP9918/SEP99
1/MAY00
4/MAY00
6/MAY00
8/MAY0011/MAY00
13/MAY00
15/MAY00
CO
H2S
SO2NH3
log H2Slog TVC
Torry
TMATVB
RT-Meter
TPA
FIRM
PC1
PC2 Bi-plot
Fillets
MAY 2000
Whole fish
MAY 1999
Whole fish
SEP 1999
Figure 12. PCA showing a biplot of sample scores and variable loadings of all data from three storage
studies of haddock as whole fish (May 99 and Sept 99) and fillets (May 00) stored at 0-2 °C for up to 15
days. The samples are labeled with storage days and time of the experiment and the variable loadings are
labeled as follows: e-nose: CO, NH3, SO2, H2S, chemical: TVB/TMA, microbial: log H2S, log TVC,
texture: Firm /TPA (-▲-). (From: Olafsdottir and Kristbergsson, Forthcoming).
Principal components analysis is useful to illustrate the overall results (Figure 12). The
first PC explained 60% of the variation in the data set and the spoilage level of the
samples increased from the left to right along PC1. The second PC explained 16% of the
variation in the data and appeared to be discriminating samples based on the season. The
variable loadings show that the CO sensor and the microbial counts (log H2S and log
TVC) are highly correlated and the positioning of the H2S, SO2 and NH3 sensors on the
upper half of the plot show the contribution of these sensors to discriminate samples from
the spring season in combination with the texture measurement (FIRM). Fish spoils faster
in the spring because the fish is recently spawned and the texture of the muscle is softer
and more gaping than in the fall. Different spoilage patterns are evident depending on the
season indicating, that days of storage is not a good estimate of freshness quality and
fillets spoil faster than whole fish, as was to be expected. The e-nose sensor responses

52
appear to give information on the quality of fish related to sensory scores, microbial
growth (TVC) and spoilage indicators like TVB-N.
2.6. Predictive models for shelf-life of fish
The development of models for shelf-life prediction of seafood has been based on various
approaches like kinetic models to estimate relative rates of spoilage (RRS). Modeling of
microbial growth requires that samples have to be taken frequently to make sure to detect
the characteristic growth profile. Model studies using liquid media have therefore been
used extensively to provide data for the development of models, because these are less
costly and allow better control of the experimental conditions than studies done with
naturally spoiling products. A few models to predict shelf-life have been developed that
rely on data of naturally spoiling products (Koutsoumanis, 2001; Einarsson, 1992).
Predictive microbiology as a tool to study the microbial ecology in food has gained
considerable interest (Ross and McMeekin, 1994) and recently models based on
enumeration of specific spoilage organisms (SSO) to determine the remaining shelf-life
of fish products have been developed (Dalgaard, 1995b; Dalgaard et al., 1997;
Koutsoumanis and Nychas, 2000; Koutsoumanis, 2001; Dalgaard, 2002). Because of the
complexity of seafood spoilage, practical shelf-life models should take into accounts the
different conditions and factors influencing the spoilage of each product (Dalgaard et al.,
2002). The web enabled Seafood Spoilage and Safety Predictor (SSSP) software
(http://www.dfu.min.dk/micro/sssp/) is based on kinetic models for growth of specific
spoilage organisms and empirical RRS secondary models (Dalgaard et al., 2002). The
software allows the practical use and validation of shelf-life models based on growth of S.
putrefaciens and P. phosphoreum. The SSSP model is based on the initial concentration
of the SSO in the product and it is only valid within a certain temperature range. As
clearly explained by Dalgaard (2002) several assumptions are made regarding the growth
of the SSO. For example it is assumed that other bacteria present in the microflora will
not influence the growth of the SSO and that the SSO will grow without a lag phase and
produce metabolites responsible for spoilage. It is also assumed that the SSO has to reach
a minimal spoilage level (107 CFU/g) when the product is rejected by sensory analysis
and micro-organisms other than the SSO should be of no importance for spoilage. SSSP

53
models have been found to predict SL of naturally contaminated seafood with an
accuracy of 25% (Dalgaard et al., 2002). The SSSP model was used for predicting the
shelf-life of haddock fillets based on the growth of S. putrefaciens but a high prediction
error (0 to 46 %) was found (Olafsdottir et al., IV). This was explained by the fact that S.
putrefaciens was not the dominating SSO in the haddock fillets and had not reached a
minimum spoilage level (107 CFU/g) when the fillets were rejected by sensory analysis.
Therefore, this emphasizes the importance of identifying the SSOs and their spoilage
domain in the respective products before applying a model based on only one SSO for
shelf-life prediction. The drawback to the use of models based on enumeration of bacteria
is that the microbial methods are lengthy, hence not very suitable for shelf-life prediction
of perishable food products. However, efforts have been made to develop more rapid
detection techniques (Dalgaard et al,. 1996; Koutsoumanis and Nychas, 2000; Skjerdal et
al., 2005) and it is foreseeable that rapid PCR based technologies may be applied for the
selective detection of spoilage bacteria.
Comparison of the chemical profiles of spoiled seafoods and of the metabolites produced
by potential spoilage organisms has only been used to a limited extent for
characterization of SSOs (Gram and Dalgaard, 2002). Detection of microbial metabolites
by rapid electronic nose analysis would be useful as an alternative or supporting
information to microbial enumeration along with the detailed time and temperature
history of the products to use in models for a more rapid evaluation of the quality and
shelf-life of fish products.

54
3. OVERVIEW OF THE STORAGE STUDIES
The thesis includes extensive storage studies of different species of fish and fish products
(capelin, cod, haddock, red fish and cold smoked salmon). The aim was to apply
electronic noses based on different sensor technologies as rapid techniques to monitor
spoilage changes in fish and study the influence of preservation techniques and
temperature conditions that would typically occur during storage and transport of these
products. Different catching methods, handling and storage conditions, in particular the
temperature, influence the spoilage pattern of fish and consequently information about
storage time may give ambiguous information about the freshness stage of the fish
Therefore, a more useful approach is to compare the electronic nose responses with
reference measurements that give information about the microbial and oxidative
processes influencing the freshness quality. Different sensory, chemical and microbial
methods were selected in the studies based on the traditional techniques commonly
applied for the different products. The innovative approach in the research was to study
simultaneously the proliferation of the microflora and its spoilage potential by
simultaneous analysis of the microbial metabolites contributing to the spoilage odors and
in this way achieve better understanding of the spoilage processes.
Paper I An electronic nose was used as a rapid technique to monitor changes in the
headspace of capelin (Mallotus villosus) during storage at 0°C and 5°C. At both
temperatures, refrigeration was compared with ice/seawater cooling system. At 5°C, the
effect of added 0.2% acetic acid was also tested. Electronic nose measurements were
compared to measurements of total volatile bases (TVB-N), gas chromatography of
volatile compounds and sensory analysis.
Paper II Freshness of cod (Gadus morhua) during storage in ice was measured with two
electronic noses based on different sensor technologies and sampling systems. The
LibraNose with TSMR (thickness shear mode resonators) sensors with metalloporphyrin
coatings was based on sampling with a small metal capsule that is placed directly on the
surface of the fish. The FreshSense has six electrochemical sensors and sampling is based
on putting the whole fillet into a sampling container. The changes during storage of cod

55
expressed as storage days were measured and compared with trimethylamine (TMA) and
total volatile bases nitrogen (TVB-N) as reference methods.
Paper III The aim of the study was to use an electronic nose with electrochemical gas
sensors to monitor microbial metabolites produced during storage of redfish (Sebastes
marinus) in ice and under MA (modified atmosphere) bulk storage and compare the
results to traditional microbial, chemical and sensory methods. The precision of the
electronic nose measurements was determined using standard compounds.
Paper IV Two storage experiments of haddock fillets were performed in the years 2001
and 2003. The objective was to characterize spoilage in haddock fillets and determine the
spoilage domain of the specific spoilage organisms (SSO) by studying their growth and
production of spoilage metabolites under a range of temperature abusive conditions (0, 7,
and 15 °C) and temperature fluctuations.
Paper V The aim of the experiments was to study the spoilage characteristics of
Combined Blast and Cooling (CBC)-processed cod fillets compared to traditionally
processed fillets stored under superchilled (-1.5 °C) and/or chilled conditions (0.5 °C) and
the effect of abusive temperature.
Paper VI The aim of the study was to screen the most abundant volatile compounds
produced by SSOs that could be used as quality indicators for chilled fillets. Gas
chromatography analysis of cod fillets stored in Styrofoam boxes under chilled conditions
(0.5 °C) were performed and comparison was made with electronic nose analysis, TVB-N
and pH measurements
Paper VII A prototype instrument called FishNose was developed and adapted for the
measurements of smoked salmon. Storage studies were done at 5 and 10 °C to compare
the microbial and sensory changes with the FishNose responses. The main objective of
the studies was to select quality indicators related to microbial counts and sensory odor
attributes and to establish quality criteria to use in models based on the FishNose
responses to classify cold smoked salmon of different quality.

56
4. MATERIAL & METHODS
4.1. Storage experiments
• Capelin stored whole in ice, chilled seawater and added acid as a preservative at 0
and 5 °C (I).
• Cod stored whole in ice at 0 °C (II)
• Redfish (Sebastes marinus) stored whole in ice and packed in vacuum and under
modified atmospheres at 0 °C (III)
• Haddock stored as fillets in Styrofoam boxes at 0°C and under abusive (7 and 15
°C) and fluctuating temperatures (IV)
• Cod (Gadus morhua) stored as fillets in Styrofoam boxes at 0°C (V, VI) and high
fluctuating temperatures and processed and stored under superchilling conditions
(-1,5) (V)
• Cold smoked salmon vacuum packed and stored at 5 and 10 °C (VII)
4.2. Electronic nose measurements
Three different types of electronic noses were used to monitor volatile compounds during
storage of the different fish species and products. FreshSense developed in Iceland based
on three to four electrochemical sensors (I – VI), FishNose from Alpha MOS in France
based on six metal oxide sensors (VII) and LibraNose developed by University of Rome
(Tor Vergata) based on eight Thickness Shear Mode Resonators with sensitive coating:
tetrapyrrolics macrocycles (porphyrins sensors) (II). The sampling was based on static
sampling systems and no sample preparation was needed. A pump was used in all cases
to transfer the volatiles to the sensors.
The electronic nose FreshSense was developed by the Icelandic Fisheries Laboratories
and the company Bodvaki-Maritech, Kopavogur (Iceland) (Figure 13).

57
The instrument consists of an array of
electrochemical gas sensors (CO, H2S, SO2
(Dräger, Lübeck, Germany) and NH3 (City
Technology, Portsmouth, Britain)), a glass
container (2.3 L) closed with a plastic lid and
a PC with a Labview measurement software.
Although the sensors are designed to detect
simple gases they are also able to detect other
compounds that have similar electrical
properties and are volatile enough to reach
the sensors. The instrument has a closed
sampling system to allow the sample to
equilibrate and the volatiles to accumulate in the headspace. The headspace is then
transported to the measurement chamber by using a pump. The measurement takes about
5 min. No sample preparation is needed. (I-VI)
The GEMINI electronic nose (Alpha M.O.S,
Toulouse, France) equipped with 6 metal
oxide semiconductors (MOS) sensors (PA/2,
P10/1, P40/2, P40/1, LY2/G, LY2/LG) was
used for monitoring quality of cold smoked
salmon (Figure 15). A prototype sampling
unit developed by OPTOTEK (Slovenia) was
connected to the sensor unit GEMINI. The
sampling unit has a 10 mL sample loop, a
heated inlet tube (55°C) and a pump (flow
rate 200 ml/min). The sampling was
performed by inserting the inlet tube into a
bell shaped unit (10 cm diameter) that was placed on the fillets. Samples were covered
with a 7 cm diameter pierced aluminum paper to prevent cross contamination of samples.
Aluminum was used because of its inert property. Sampling temperature (headspace
generation temperature) was 5 °C and loading time of 7 s was used. (VII)
Figure 14. FishNose system from AlphaMOS
(France) equipped with a sampling unit (10
mL) with a heated inlet tube and a pump (VII)
Figure 13. FreshSense electronic nose
(Iceland) based on electrochemical sensors with
a large sampling container (2.3L) and a pump
to transfer the headspace to the sensors (1-VI).

58
LibraNose is an instrument designed and
fabricated at the University of Rome Tor
Vergata in co-operation with the company
Technobiochip (Figure 15). It is based on
an array of Thickness Shear Mode
Resonators (TSMR) also known as Quartz
Microbalance sensors. The chemical
sensitivity is given by a molecular film of
metalloporphyrins and similar compounds.
In the current configuration up to eight
sensors are used (D’Amico et al., 1998).
Measurements of cod fillets were done
using a metallic capsule with an internal volume of 10 ml approximately equal to the
volume of the sensor chamber. The capsule is endowed with a series of small orifices for
air refilling. It works in contact with the fish fillet, a stable and reproducible (from the
point of view of sensors response) headspace is established in five minutes. (II)
4.3. Sensory analysis
The Icelandic Fisheries Laboratories sensory panel participated in the sensory
assessments. They were all selected and trained according to international standards (ISO
1993). Different sensory methods were used in the studies. A sensory classification
scheme based on 5 categories was used for the capelin (I).The QIM (Quality Index
Method) was used for evaluation of redfish (II) (Martinsdóttir and Arnason, 1992). The
Torry scheme for cooked fish (Shewan et al., 1953) was applied for both haddock (IV)
and cod (V). The smoked salmon quality was evaluated by QDA (Quantitative
Descriptive Analysis) (Stone and Sidel, 1985) using a scheme based on 19 different
attributes of appearance taste, odor, flavor and texture developed in the study (VII).
Figure 15. LibraNose (University of Rome,
Tor Vergata) equipped with a small sampling
capsule of metal, with an internal volume of 10
ml, and small holes for air refill. (II)

59
4.4. TVB-N, TMA and pH measurements
Total volatile basic nitrogen content (TVB-N) was measured by Struer steam distillation
unit as described by Malle and Poumeyrol (1989) (IV,V)
Evaluation of TMA content was done by flow injection gas diffusion (FIGD) as described
by Ruiz-Capillas and Horner (1999) (II, III)
The pH was measured in 5 grams of mince moistened with 5 mL of deionized water.
4.5. Microbial analysis
Total viable psychrotrophic counts (TVC, 15 °C) were evaluated in redfish, cod, haddock
and smoked salmon by spread-plating aliquots onto modified Long & Hammer's medium
(III, IV, V, VII); counts of H2S-producing bacteria and presumptive pseudomonads (III,
IV, V) were evaluated in redfish, cod and haddock on spread-plated Iron Agar (15 °C)
and modified CFC medium (22 °C), respectively (Lauzon et al., 2002).
Counts of Photobacterium phosphoreum were estimated in cod and haddock fillets by
using the PPDM-Malthus conductance method (Dalgaard et al., 1996), as described by
Lauzon (2003) (IV, V).
Analysis of lactic acid bacteria (LAB) counts was done in smoked salmon using NAP
(Nitrite Actidione-Polymyxin) medium slightly modified (Davidson and Cronin, 1973)
(VII).
4.6. Gas chromatography analysis
Three different sampling methods were used for collection of the volatiles in whole
capelin and cod fillets prior to gas chromatographic analysis based on different detectors.
A static headspace sampling using a gas tight syringe to withdraw samples from sampling
bags was used for analysis of volatile sulfur compounds in capelin (I) and separation by a
GC-FPD (flame photometric detector ). Sampling for GC-MS (gas chromatography mass
spectrometry) and GC-O (gas chromatography – olfactometry) of cod fillets was based on

60
pre-concentration of the headspace samples onto TENAX traps (VI). The headspace was
collected by an air pump sampling (ALPIN-2, Air sampler, METEK) by sweeping
volatiles from the surface of the fillets, followed by thermal desorption of volatiles (ATD
400, Perkin-Elmer, Buchinghamshire, UK) from the sampling tubes prior to separation on
a DB-5ms column (30 m × 0.25 mm i.d. × 0.25 µm, J&W Scientific, Folsom, CA, USA)
using a GC-MS (HP G1800C GCD, Hewlett-Packard, Palo Alto, CA, USA). A purge and
trap technique described by Olafsdottir et al. (1985) using Tenax in a Pasteur pipette and
ether extraction prior to separation by a the same type of column where the end was split
1:1 between flame ionization detector (FID) and an ODO-1 olfactory detector outlet
Measurements were performed on a GC (HP 5890, Hewlett-Packard, Palo Alto, CA)
Description of each odor and its duration in time was recorded and the intensity evaluated
using a category scale with a description of intensity of odor at each score (47-48); 0
none; 0.5 thresholds or just detectable; 1 slight; 2 little; 3 moderate; 4 strong and 5 very
strong.
4.7. Data analysis
Microsoft Excel 97 was used for data processing, to calculate means and standard
deviations for all multiple measurements and to generate graphs. Analysis of variance
(ANOVA) was applied to the sensory, chemical and electronic nose data using the
Number Cruncher Statistical Software (NCSS 2000). Significant differences were
determined by One way ANOVA and Duncan’s Multiple-Comparison Test was used to
determine the statistical difference between samples. An effect was considered significant
at the 5% level (p<0.05).
Multivariate analysis was performed by the Unscrambler (version 7.8 and 9.2, CAMO
A/S, Trondheim, Norway). The main variances in the data sets were studied using
Principal Component Analysis (PCA) (III). The relationships between sensory, microbial,
chemical and electronic nose measurements were explored by Partial Least Squares
Regression (PLSR) (I). PLSR was performed on the data using average values of
replicates standardized to equal variance (weighting with 1/standard deviation). The Jack-
knife method (Martens and Martens, 1999) was used to determine significant variables in
X with a significance level of 5% (p<0.05). Outlier detection is built into the

61
Unscrambler software and detects samples that are badly described by the models. All
models were calculated with full-leave one-out cross validation (I, IV, V, VII).
Soft independent modeling of class analogy (SIMCA), a pattern recognition method
relying on independent modeling of defined classes by means of PCA (Wold, 1976) was
used to classify samples according to sensory quality (Torry score) based on the sensor
responses, microbial and chemical data (V, VII).
Partial least square discriminant analysis (PLS-DA) was carried out using Matlab 5.0 to
compare the performance of the FreshSense and the LibraNose and to combine their
outputs to achieve class separation based on storage days of cod. PLS-DA is a supervised
classification method where the search for optimal discriminant directions is performed
using PLS. PLS-DA provides both a quantitative estimation of class discrimination and
score and loading plots for a visual inspection of data separation and the contribution of
single sensors to the array (II).

62
5. RESULTS & DISCUSSION
The results herein showed that electronic nose can be applied to monitor quality changes
related to the formation of volatile microbial metabolites during chilled storage of fish
and better understanding of the spoilage of fish was achieved.
5.1. Presicion of the electronic nose measurements
Electronic noses based on different sensor technologies were applied as rapid techniques
to monitor the volatile compounds during chilled storage of fish. The electronic nose
FreshSense was used in all the storage trials (I –IV) except for evaluating the quality of
smoked salmon where the Fishnose was applied (VII). The LibraNose was applied in a
storage study of cod along with the FreshSense (II).
The electrochemical sensors in the FreshSense instrument were selected based on their
selectivity and sensitivity to the main classes of volatile compounds contributing to the
spoilage odors in fish, like amines, sulfur compounds, alcohols, aldehydes and esters.
Results from PLSR (partial least squares regression) analysis showed that models using
only three gas sensors gave similar or better results than when using nine sensors to
predict the quality of capelin as TVB-N value (I). Therefore, only three or four sensors
out of nine initially were used in the continued studies with the FreshSense. The
performance of the FreshSense was evaluated by measuring standard compounds
representing the main classes of volatile spoilage compounds in fish (III). The
repeatability for the standards selected (ethanol, acetaldehyde, TMA and
dimethyldisulfide) evaluated measuring the same sample on the same day showed
coeffiecent of variability (%CV) around 10%. The results of reproducibility
measurements using the CO sensor responses to different concentrations of ethanol over
one year period showed that the %CV was less than 30% (Olafsdottir et al., 2002) (III).
The high variation of the electronic nose measurements can be explained by the influence
of temperature during sampling and variation in sample size related to the surface area
exposed (Olafsdottir, 2003).
Improvements were made in the sampling system for the Fishnose instrument (VII). A
sampling unit with a heated inlet tube (55°C) and a pump was developed and sampling

63
was performed at 5 °C. Sensor readings of repeated measurements of calibration samples
showed a repeatability for the 6 sensors of the array of 6.4 % (± 1.4%), and for repeated
measurements of fish samples the repeatability was 4.3 % (± 2.6%) without purge of the
system between the measurements (Olafsdottir et al, 2005a; Haugen et al., Forthcoming).
5.2. Overall trend in electronic nose measurements to chilled fish during storage
The electronic nose FreshSense showed a similar overall trend for the development of
volatile spoilage compounds when monitoring changes during storage of capelin, redfish,
haddock and cod that were handled and stored under different conditions (Olafsdottir et
al., 2000; 2002; DiNatale et al., 2001) (I, II, III, IV, V).
The results indicated that the rapid electronic nose measurements give more information
about the quality of the fish than each of the individual classical measurements like
sensory evaluation, microbial counts and TMA/TVB-N analysis. This is based on the
partial selectivity of the sensors towards the different classes of compounds produced by
the dominating specific spoilage bacteria.
The electronic nose´s sensors appeared to give similar information as the traditional
measurement techniques (QIM scores and TMA) as illustrated in Figure 16 for redfish as
an example. The responses of all the sensors, microbial counts, and TMA production
were higher in ice storage than in modified atmosphere storage (MA) of redfish
indicating the hindering effect of MA on the spoilage microflora (Figure 16).
The CO sensor was most sensitive of the sensors showing increased responses earlier
than the other sensors in all the studies and correlated well with sensory, chemical and
microbial methods for redfish, haddock and cod (III, IV, V).
During ice storage of redfish the response of the CO sensor appeared to decline after 16
days of storage. The leveling off in the response of the CO sensor at the end of storage
period in ice may be reflecting the depletion of certain substrates that the microflora
utilizes (Lindsay et al., 1986; Gram and Huss, 1996). Responses of the NH3, H2S and SO2
increased during late storage for capelin, redfish and cod that were stored whole on ice.
These sensors are sensitive to amines and sulfur compounds, respectively, that typically
form at the end of the storage when the fish is spoiled

64
0
100
200
300
400
0 5 10 15 20 25
Days in ICE
Res
pons
e se
nsor
s (n
A)
0
5
10
15
20
QI s
core
s an
d TM
A (m
gN/1
00g)
ICE
0
100
200
300
400
0 5 10 15 20 25
Days in MA
Res
pons
e se
nsor
s (n
A)
0
5
10
15
20
QI s
core
s an
d TM
A (m
gN/1
00g)
MA
Figure 16. Electronic nose (FreshSense) measurements (◆CO, ∎SO2, ▲ NH3, x H2S), TMA (-△-), and QI scores (-◇ -) of redfish stored for 22 days in (a) ICE; (b) MA; Shelf life 20.5 days in ice and 22 days in MA. (From Olafsdottir et al., 2002) (III).
The responses of the the NH3, H2S and SO2 sensors towards cod and haddock fillets were
generally low and no increase in responses of these sensors was detected in MA-stored
fish (Figure 16).
5.3. Specific spoilage organisms (SSO) and analysis of microbial metabolites
The proliferation of the SSO (Photobacterium phosphoreum, Pseudomonas spp. and H2S-
producers) and evaluation of their spoilage potential by simultaneous analysis of
microbial metabolites contributing to the spoilage changes showed that the response of
the electronic nose sensors appeared to reflect the production of microbial metabolites. At
the same time as the increasing responses were observed for the CO sensor in iced redfish
(Figure 16), indicating production of alcohols, aldehydes and esters, a continuous
increase was seen in the growth of Pseudomonas sp. throughout storage (Figure 17).

65
0
1
2
3
4
5
6
7
0 5 10 15 20 25Days in ICE
log
cfu
0
1
2
3
4
5
6
7
0 5 10 15 20 25Days in MA
log
cfu
Figure 17. Microbial counts (∎Pseud., ◆H2S-prod. and ▲ TVC-15°C) of redfish stored for 22 days in Ice (left); MA(right) (From Olafsdottir et al., 2002) (III) The low response of the sensors to MA-stored redfish corresponded to the slow
development of the microflora under these conditions and a different spoilage profile
appeared to develop in MA-stored fish (Figure 17).
The increased TMA production after day 16 coincided with the increased response
observed for NH3 sensor. Higher responses of the H2S and SO2 sensors were also noticed
coinciding with the later development of H2S-producers (Figure 17), possibly S.
putrefaciens, which has been suggested as a late spoiler in iced stored fish (Lauzon,
2000).
The proportion of Pseudomonas sp. in iced redfish was about 9% of the total microflora
on day 19, while that of H2S-producers was 2.5% indicating the importance of
Pseudomonas sp. in aerobically stored fish as has been reported previously (Lauzon,
2000). Based on the results of earlier studies on MA packed fish, higher levels of TMA
were expected as a result of the growth of Photobacterium phosphoreum, which has been
found to be an intensive TMA producer and the main SSO in MAP fish (Dalgaard,
1995a). Direct counts of P. phosphoreum were not obtained in the study of the redfish.
On the other hand studies on the proliferation of P. phosphoreum as well as Pseudomonas
spp and H2S-producers were included when studying the spoilage potential of the SSO in
haddock and cod fillets packed in styrofoam boxes and stored under different conditions
(IV, V). The different temperature conditions during storage (0, 7 15 °C) and temperature
fluctuations were selected to study the influence of abusive conditions on the

66
proliferation of the microflora in haddock fillets. The effect of superchilled process and
superchilled storage (-1.5°) compared to 0.5 °C storage and temperature abusive
conditions were studied in cod fillets. The results showed that P. phosphoreum appeared
to be very important based on their counts and growth rate in the spoilage of both fresh
haddock and cod fillets packed in bulk (approximately 5 kg) under aerobic conditions in
styrofoam boxes. High counts of P. phosphoreum coincided with high TVB-N values
(IV, V). P. phosphoreum and Pseudomonas spp. were dominating under temperature
abusive conditions in haddock fillets (IV). Pseudomonas spp. was suggested to contribute
to the characteristic sweet, fruity spoilage odors of haddock fillets associated with high
response of the CO sensor indicating the production of alcohols, aldehydes and esters
(IV). Microbial metabolites were produced more rapidly and were detected in higher
levels with increasing storage temperature as shown by the response of the electronic
nose CO sensor and the TVB-N values at sensory rejection (Figure 18). Sensory rejection
was on the following days: 4.5d (15 °C); 6.5d (7 °C); 9d (0 °C+abuse), 11.5d (0 °Ca) and
13.5d (0°C).
0
10
20
30
40
50
60
70
80
90
100
110
120
0 2 4 6 8 10 12 14 16Days from catch
TVB-
N m
g N
/100
g
0°C0°C a0°C+ abuse7°C15°C
(a)
0
100
200
300
400
500
600
700
800
900
1000
0 2 4 6 8 10 12 14 16
Res
pons
e C
O s
enso
r (nA
)
0°C0°C a0°C + abuse7°C15°C
(b)
Figure 18. a) TVB-N values and b)CO sensor response in haddock fillets stored in styrofoam boxes at 0 °C
(-■-), 7 °C (-♦-) and 15 °C (-x-) from experiment in 2001 and at 0 °C a (-▲-) (traditional process) and 0 °C
+abuse (-∆-) (traditional process and temperature abuse) in 2003. (IV).

67
5.4. Correlation of reference methods and electronic nose
Partial least squares regression (PLSR) models were used to explore the spoilage
potential of the microflora by studying the correlation of the SSOs, volatile compounds
measured by an electronic nose, TVB-N and sensory analysis. The correlation loading
plot (Figure 19) for all the data from the haddock experiments showed that, microbial
counts, TVB-N, pH and the CO sensor as response variables contributed significantly to
the modeling of the Torry score as predictor variable. This indicates that these variables
were measuring parameters related to spoilage as determined by sensory analysis. The
SO2 sensor did not contribute to the modeling of the data as seen by its location in the
middle of the plot. The CO sensor was useful to detect incipient spoilage and
characteristic spoilage of fillets stored at low temperatures while the H2S and NH3
sensors detected advanced spoilage and the influence of temperature abuse (7 °C and 15
°C) (IV).
Figure 19. PLSR correlation loadings based on all the measured variables: microbial (TVC,
pseudomonads, H2S counts, Photobacterium phosphoreum (PP), chemical (TVB-N, pH) and electronic
nose (CO, NH3, SO2 and H2S sensors) and Tacc as predictors for the Torry scores as a response variable for
the haddock samples stored at different temperatures. The outer and the inner ellipses indicate 100% and
50% explained variance, respectively. Significant variables are symbolized with small circles.(IV)

68
Figure 20. PLSR correlation loadings based on all the measured variables: TVC, pseudomonads, H2S
counts, Photobacterium phosphoreum (PP), TVB-N, pH, Tacc and electronic nose sensors (CO, NH3, SO2
and H2S) as predictors (X) for the Torry scores as a response variable (Y) for the cod samples stored at
different temperatures. (V)
All the SSO´s appeared to be of importance in cod fillets during storage under the
different temperature conditions. PLSR correlation loadings based on all the measured
variables showed that the spoilage characteristics of superchilled as well as chilled and
temperature abused cod fillets were mainly explained by the SSO, TVB-N content and
the CO sensor response. Because of the low response of the other sensors (NH3, H2S and
SO2) to chilled and superchilled fillets, they did not contribute to the modeling of data as
seen by their location in the middle of the correlation loadings plot (Figure 20). (V)
The potential ability of the most important quality indicators, the CO sensor, TVB-N and
all the SSO (Figure 20) to predict the Torry score was studied further by PLSR. The
resulting PLSR model (r2 = 0.97 and RMSEP = 0.30) showed that the overall spoilage
pattern of the differently treated samples was similar, despite the differences in the
spoilage rate of the groups of cod fillets as explained by the influence of the different
temperature conditions and initial handling on the dominating SSO in the samples
(Olafsdottir et al., V). Superchilled samples were described by H2S-producer counts
while Pseudomonas spp. characterized the spoilage of traditionally processed groups
from one producer. Traditionally processed groups which had the highest temperature
during storage had high Photobacterium counts and high values of the TVB-N and the
CO sensor. The complexity of the dynamic spoilage changes reflected by the growth and

69
the spoilage potential of the dominating SSO can be explained by the interaction of the
microorganisms as influenced by storage temperature, packaging and the inherent
composition of available nutrients in the fish in agreement with other studies (Gram and
Melchiorsen, 1996; Gram et al., 2002). Therefore, it appears that a multi-quality indicator
based on the different SSO, TVB-N and the CO sensor response is necessary when using
a global model to classify both traditionally processed and superchilled fish fillets (V).
5.5. Establishment of quality criteria for chilled fish
The complexity of the spoilage processes was obvious as seen by the different values
observed for TVB-N, the sensor responses and the ratio of the different SSO to TVC at
sensory rejection (Table 3). Although a similar spoilage pattern was observed for the
differently treated products, the range of values observed for the quality indicators
indicated differences depending on the dominating bacteria
The results from the various studies demonstrated that no single quality criteria for cod
and haddock fillets can give adequate information about the quality of the products.
Moreover, it appears that fixed values to determine the end of shelf-life or the quality of
fish fillets based on electronic nose responses or values for the microbial and TVB-N
reference methods will have to be developed for each product and the respective storage
conditions. The need to establish relevant quality indices for products stored or processed
using new preservation techniques has been emphasized. As a result of delayed or altered
microbial growth the traditional spoilage signs may become distorted and therefore the
commonly used quality indices may be of questionable value (Lindsay et al., 1986).
The storage temperature directly influenced the shelf-life of the packed cod and haddock
fillets (Table 3). Superchilling of cod fillets with the new superchilling process (CBC
contact blast cooling) was most effective in extending the shelf-life in particular when
combined with superchilled storage (-1.5 °C) (V). Under superchilling conditions the
growth rate of all the bacterial groups was slower and lower CO sensor response was
observed compared to traditionally processed fillets stored at 0 °C (V). However, higher
levels of TVB-N were observed at sensory rejection for superchilled fillets stored under
chilled conditions (>0 °C) compared to the traditionally processed groups (Table 3).

70
Table 3. Overview of storage temperature, shelf-life estimation (based on Torry sensory score of 5.5) and
experimental data showing ranges of values measured at or near sensory rejection for all experimental
groups of cod and haddock fillets stored in styrofoam boxes at different temperatures (IV, V).
Cod 0°C Cod abused Cod superchilled Haddock 0 °C Haddock abused
Average temperature of fillets during storage 0.4 - 1.9 1.9 - 3.9 -1.3 - 0.9 0.2 1.7 - 12
Estimated shelf-life (days) 12 - 13.5 8-11.5 12.5 - >15 11.5 -13.5 4.5 -9
% H2S-producers / TVC 7 -12.9% 1.4 - 3.7 % 1.0 - 36.3% 0.6 - 2.4 % 0.4 - 0.8%
% Pseudomonas spp. / TVC 4.9 - 37.5 % 0.04 - 25.4 % 0.2 - 2.9% 6.3 - 15.1% 1.6 - 15.2%
% P. phosphoreum / TVC 12.6 - 17.2 % 12.7 -24.0 % 0.9 -6.7% 79.4 - 100% 50.2 - 100%
TVB-N (mg N / 100 g) 27 - 49 34 - 94 38 - 55 27 - 45 45 - 77
CO sensor (nA) 98 - 366 215 -439 136 - 300 280 -370 470 - 570
It has been pointed out earlier that TVB-N and TMA often give ambiguous information
about the quality of the products as their levels are influenced by the storage method like
in modified atmosphere packaging (Dalgaard et al., 1993; Lauzon et al., 2002). Similar
total microbial counts were observed at sensory rejection in samples stored at different
temperatures. However, the levels of the SSOs were different and the microbial
metabolites were produced in higher levels with increasing storage temperature as shown
by the increasing responses of the electronic nose sensors and increased TVB-N values at
sensory rejection
The importance of Photobacterium phosphoreum in the packed fillets is especially of
interest reaching high counts and being the dominating bacteria in haddock and cod
stored at 0 °C and under temperature abusive conditions. Under superchilling conditions
the P. phosphoreum became dominating in one group, but the dominance of H2S-
producers in the other groups was related to the initial handling of the raw material. (V).
Improper icing and handling of raw material, leading to higher temperature of the cod
fillets, especially influenced the development of P. phosphoreum, but growth of H2S-
producing bacteria was also accelerated at higher temperatures contributing to a shorter
shelf-life of temperature abused cod fillets (V).
The results emphasize the importance of studies performed with natural products and
processes to accumulate information about spoilage domain of SSOs under actual
conditions. The origin of the raw material, the initial handling and conditions in the
processing factories including the time after catch before processing influenced the shelf-
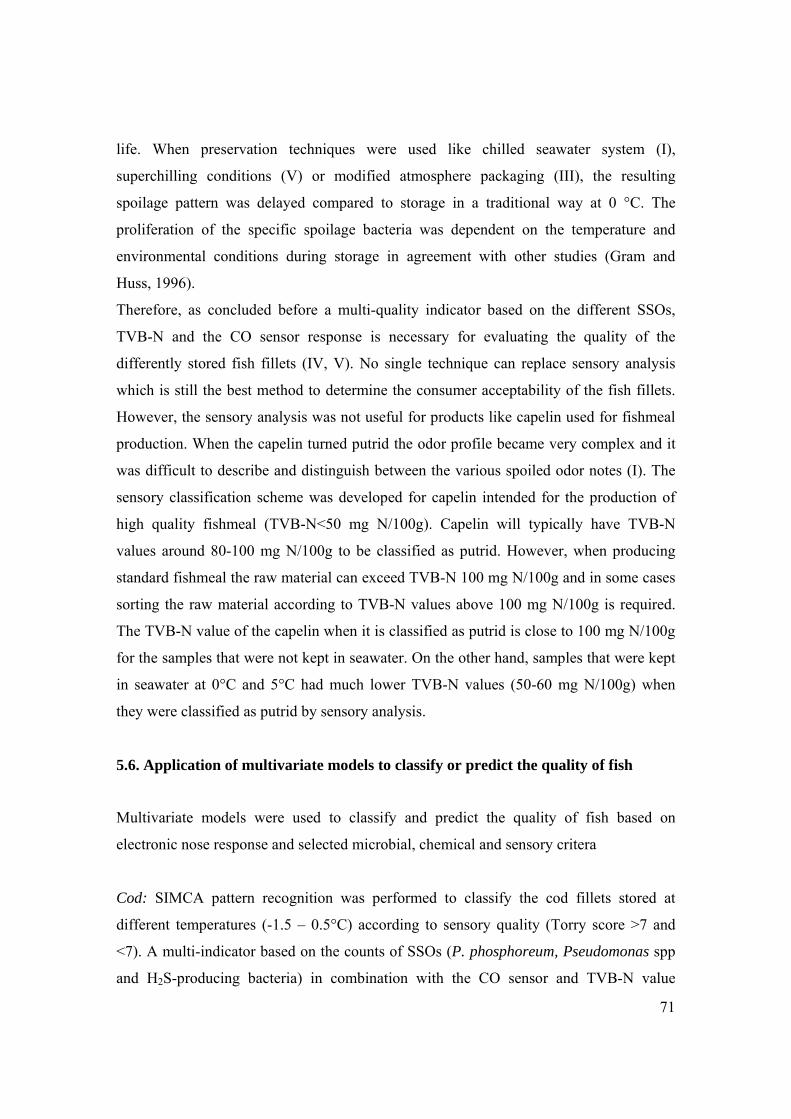
71
life. When preservation techniques were used like chilled seawater system (I),
superchilling conditions (V) or modified atmosphere packaging (III), the resulting
spoilage pattern was delayed compared to storage in a traditional way at 0 °C. The
proliferation of the specific spoilage bacteria was dependent on the temperature and
environmental conditions during storage in agreement with other studies (Gram and
Huss, 1996).
Therefore, as concluded before a multi-quality indicator based on the different SSOs,
TVB-N and the CO sensor response is necessary for evaluating the quality of the
differently stored fish fillets (IV, V). No single technique can replace sensory analysis
which is still the best method to determine the consumer acceptability of the fish fillets.
However, the sensory analysis was not useful for products like capelin used for fishmeal
production. When the capelin turned putrid the odor profile became very complex and it
was difficult to describe and distinguish between the various spoiled odor notes (I). The
sensory classification scheme was developed for capelin intended for the production of
high quality fishmeal (TVB-N<50 mg N/100g). Capelin will typically have TVB-N
values around 80-100 mg N/100g to be classified as putrid. However, when producing
standard fishmeal the raw material can exceed TVB-N 100 mg N/100g and in some cases
sorting the raw material according to TVB-N values above 100 mg N/100g is required.
The TVB-N value of the capelin when it is classified as putrid is close to 100 mg N/100g
for the samples that were not kept in seawater. On the other hand, samples that were kept
in seawater at 0°C and 5°C had much lower TVB-N values (50-60 mg N/100g) when
they were classified as putrid by sensory analysis.
5.6. Application of multivariate models to classify or predict the quality of fish
Multivariate models were used to classify and predict the quality of fish based on
electronic nose response and selected microbial, chemical and sensory critera
Cod: SIMCA pattern recognition was performed to classify the cod fillets stored at
different temperatures (-1.5 – 0.5°C) according to sensory quality (Torry score >7 and
<7). A multi-indicator based on the counts of SSOs (P. phosphoreum, Pseudomonas spp
and H2S-producing bacteria) in combination with the CO sensor and TVB-N value

72
resulted in 85% correct classification. The samples that were wrongly classified had
sensory scores close to 7. This indicated that the combined quality indicators SSOs, TVB-
N and CO sensor, were not sensitive enough to detect the incipient spoilage but they
could discriminate fresh samples from spoiled samples (V).
Intergrating data from two electronic nose instruments LibraNose and FreshSense,
improved the performance of a PLS-DA to classify cod based on storage days in ice (II).
In this study the sensors correlated well with the results of TMA and TVB-N and
interestingly the misclassification of samples based on the e-noses could be related to the
fact that three batches were used in the design of the experiment. It was evident that the
second batch had slower spoilage rate than the first batch, which was explained by
slightly different initial handling of the batches. Therefore, it was concluded that
information about storage days is not reliable to estimate the freshness quality. (II).
Haddock: Exploration of different PLSR models for haddock fillets stored at different
temperatures (0.5 – 15°C) based on the FreshSense electronic nose data and the SSO´s as
predictors and the Torry sensory scores as the response variable demonstrated that the
spoilage characteristics of haddock fillets were best described by the pseudomonads
counts in combination with the electronic nose responses (CO, NH3 and H2S sensors).
Validation of the model based on a subset of the data showed an average of 4.8%
difference between the predicted and the experimental data (IV).
Cold smoked salmon: When monitoring the spoilage of cold smoked salmon by the
FishNose with metaloxide sensors the spoilage changes of the respective products where
characterized by microbial and sensory methods. The quality indicators sweet/sour, off
and rancid odor were selected from fourteen sensory attributes based on their ability to
predict microbial quality (log TVC) using PLSR (Figure 21) (VII). The spoilage odors
were directly related to the sensor responses, since the sensors in the FishNose were
sensitive to spoilage related compounds like butanone contributing to the off odors, but
they were not sensitive to the characteristic smoke flavor compounds like guaiacol which
was detected in high levels in smoked salmon (Olafsdottir et al., 2005; Haugen et al.,
Forthcoming).
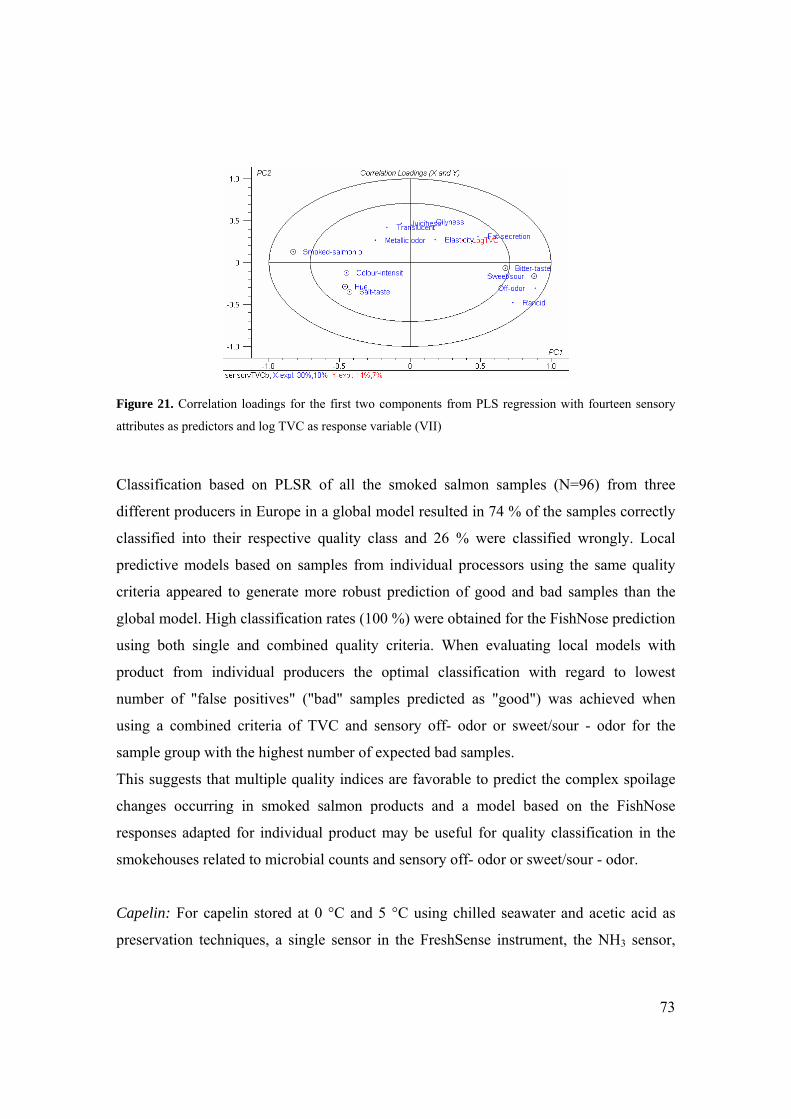
73
Figure 21. Correlation loadings for the first two components from PLS regression with fourteen sensory
attributes as predictors and log TVC as response variable (VII)
Classification based on PLSR of all the smoked salmon samples (N=96) from three
different producers in Europe in a global model resulted in 74 % of the samples correctly
classified into their respective quality class and 26 % were classified wrongly. Local
predictive models based on samples from individual processors using the same quality
criteria appeared to generate more robust prediction of good and bad samples than the
global model. High classification rates (100 %) were obtained for the FishNose prediction
using both single and combined quality criteria. When evaluating local models with
product from individual producers the optimal classification with regard to lowest
number of "false positives" ("bad" samples predicted as "good") was achieved when
using a combined criteria of TVC and sensory off- odor or sweet/sour - odor for the
sample group with the highest number of expected bad samples.
This suggests that multiple quality indices are favorable to predict the complex spoilage
changes occurring in smoked salmon products and a model based on the FishNose
responses adapted for individual product may be useful for quality classification in the
smokehouses related to microbial counts and sensory off- odor or sweet/sour - odor.
Capelin: For capelin stored at 0 °C and 5 °C using chilled seawater and acetic acid as
preservation techniques, a single sensor in the FreshSense instrument, the NH3 sensor,

74
appeared to be promising to predict the TVB-N value (Olafsdottir et al., 2000) (I). A
generalized linear model with normal error was fitted to the data. (I).
TVB i = α i + β 1 NH3 + β 2 (NH3 )2 + ε i
Where α i represents the intercept for condition level i, with i = storage conditions (0°C and 5°C; 0°C+sea
and 5°C+sea; 5°C+acid) and ε i the error term. α i , β 1 and β 2 are parameters to be estimated for each storage
condition (I).
Capelin is a pelagic species that is often used for fishmeal production and the level of
spoilage was much higher than for the gadoid species (cod and haddock). TVB-N values
for the packed fillets in the storage studies of haddock (IV) and cod (V) at sensory
rejection were around 30-50 mgN/100g while the TVB-N values for capelin reached 100
mgN/100g at the end of the storage time (1).
5.7. GC analysis of volatile compounds in cod fillets
Volatile compounds in cod fillets were monitored by gas chromatography analysis to
screen potential quality indicators during chilled storage. Identification of volatile
compounds based on GC-MS analysis and quantification of the main classes of
compounds based on the sum of the PAR for respective compounds in each class was
done for cod fillets packed in styrofoam boxes during chilled storage (0.5 °C). The results
showed that ketones were detected in the highest level (33 %), followed by amines
(TMA) (29%), alcohols (15%), acids (4%), aldehydes (3%) and a low level of esters
(<1%) on day 12 when the fillets were rejected by sensory analysis (Figure 22) (VI).
Selective sensors for the detection of ketones, amines (TMA), alcohols, aldehydes, acids
and esters are suggested for monitoring quality changes of cod fillets during storage. The
detection of sulfur compounds would be useful only when the products are spoiled. None
of the sensors in the electronic nose FreshSense was sensitive to ketones and acids and
therefore selective sensors for these components should be included in the instrument to
monitor spoilage of cod fillets in addition to a more sensitive sensor for the detection of
TMA.

75
0
10
20
30
40
50
60
70
80
90
100
110
120
Ketones TMA Alcohols Acids Aldehydes Esters Sulfurcompounds
PAR
Day 4 Day 7 Day 10 Day 12
Figure 22. GC-MS analysis of volatile compounds showing changes in the levels (PAR: peak area ratio) of
the main classes of compounds contributing to spoilage in cod fillets packed in styrofoam boxes during
storage at 0.5 °C until sensory rejection on day 12.
5.7.1. Characterization of the spoilage potential of the SSO in cod fillets
At sensory rejection the spoilage microflora is composed of microorganisms that have
contributed to the spoilage and others that have not caused unpleasant changes (Gram et
al., 2002). Quantitative evaluation of the spoilage is based on determining the cell count
of the SSO and the metabolites causing off odors (Jørgensen and Huss, 1989; Dalgaard et
al., 1993; Dalgaard, 1995a; Koutsoumanis and Nychas, 2000). P. phosphoreum was
identified as the main SSO in the cod fillets based on its high counts throughout the
storage time, reaching counts of log 7.2 CFU/g at sensory rejection (12.6 %).
Pseudomonas spp. and H2S-producing bacteria represented 4.9 % (log 6.6 CFU/g) and
7% (log 7 CFU/g), respectively, of the total microflora at sensory rejection (Figure 23).
P. phosphoreum appears to be the main contributor to the production of the ketones and
amines detected in the highest level during storage. Acetoin (3-hydroxy-2-butanone) was
the most abundant of the ketones detected in high levels throughout the storage (Figures
22 and 23).

76
0
50
100
150
200
250
300
350
400
450
0 2 4 6 8 10 12 14 16Days from catch
PAR
- TV
B-N
- se
nsor
s
6.2
6.3
6.4
6.5
6.6
6.7
6.8
6.9
7.0
pH
TMATVB-NCO sensorNH3 sensoracetoinpH
1
2
3
4
5
6
7
8
9
0 2 4 6 8 10 12 14 16Days from catch
log
CFU
/g
TVC
H2S counts
Pseud
Pp
Figure 23. Response of the electronic nose CO and NH3 sensor GC-MS analysis of TMA and acetoin
(PAR), TVB-N and pH (left) and microbial counts (TVC, H2S-producers, Pseudomonas spp. and P.
phosphoerum) (right) in chilled cod fillets packed in styrofoam boxes during storage at 0.5 °C (Adapted
from V, VI)
The formation of high levels of acetoin and TMA (VI) coincided with the growth of P.
phosphoreum which was identified as the dominating SSO in the cod fillets (V) (Figure
23). TMA and acetoin have earlier been associated with dominating P. phosphoreum
growth (Van Spreekens and Toepoel, 1981; Dalgaard, 1995a). Levels of acetoin
increased earlier than TMA and acetoin is therefore more useful to monitor the loss of
freshness as an early indicator of spoilage. TMA is a potent odorant with a characteristic
fishy, dried fish, ammonia-like odor as detected by GC-O and received high odor scores
(Table 4). The odor of acetoin has been described as butter- cream like (Acree, 1997), but
a mild, sweet-sour like odor was detected by GC-O (Table 4).
Other compounds detected on day 12 at sensory rejection also contributed to the overall
aroma. Lipid derived aldehydes, like hexanal, nonanal and decanal were detected in
similar levels throughout the storage time and contributed to the overall sweet odors of
cod fillets in combination with other carbonyls (3-hydroxy-2-butanone, acetaldehyde, 2-
butanone, 3-pentanone and 6-methyl-5-heptene-2-one) (Table 4).
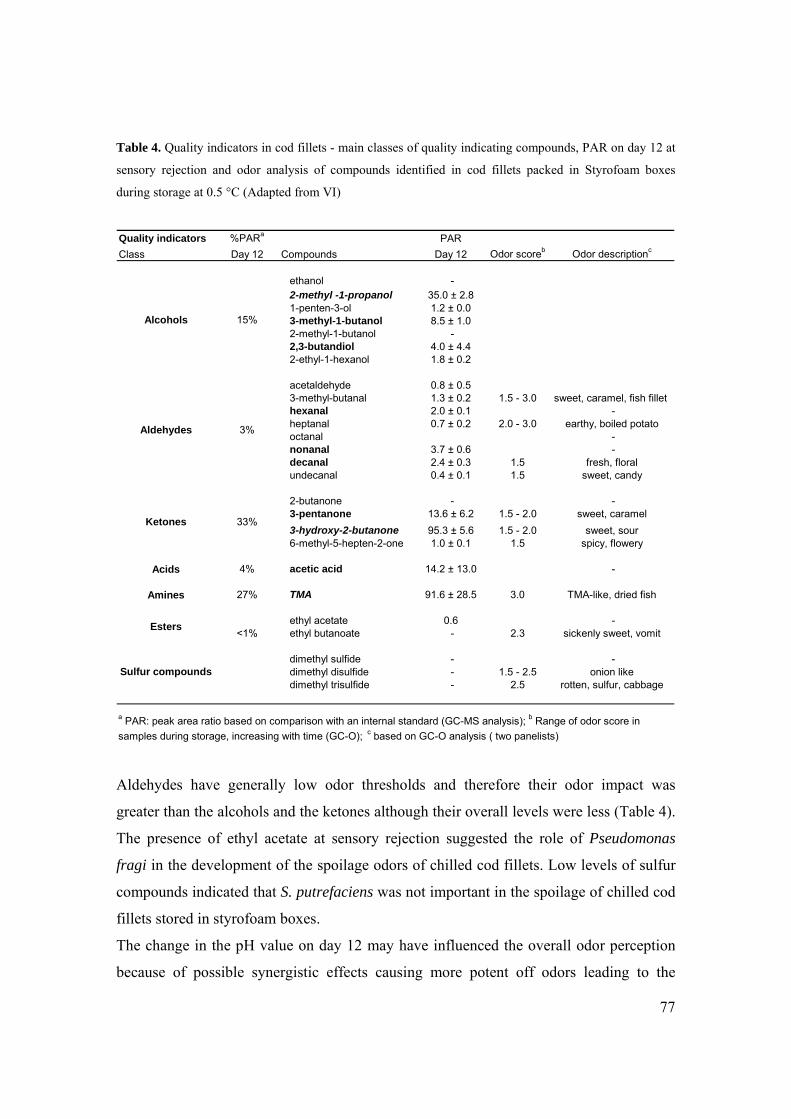
77
Table 4. Quality indicators in cod fillets - main classes of quality indicating compounds, PAR on day 12 at
sensory rejection and odor analysis of compounds identified in cod fillets packed in Styrofoam boxes
during storage at 0.5 °C (Adapted from VI)
Quality indicators %PARa PARClass Day 12 Compounds Day 12 Odor scoreb Odor descriptionc
ethanol -2-methyl -1-propanol 35.0 ± 2.81-penten-3-ol 1.2 ± 0.03-methyl-1-butanol 8.5 ± 1.02-methyl-1-butanol -2,3-butandiol 4.0 ± 4.42-ethyl-1-hexanol 1.8 ± 0.2
acetaldehyde 0.8 ± 0.53-methyl-butanal 1.3 ± 0.2 1.5 - 3.0 sweet, caramel, fish fillet hexanal 2.0 ± 0.1 -heptanal 0.7 ± 0.2 2.0 - 3.0 earthy, boiled potatooctanal -nonanal 3.7 ± 0.6 -decanal 2.4 ± 0.3 1.5 fresh, floralundecanal 0.4 ± 0.1 1.5 sweet, candy
2-butanone - -3-pentanone 13.6 ± 6.2 1.5 - 2.0 sweet, caramel3-hydroxy-2-butanone 95.3 ± 5.6 1.5 - 2.0 sweet, sour6-methyl-5-hepten-2-one 1.0 ± 0.1 1.5 spicy, flowery
Acids 4% acetic acid 14.2 ± 13.0 -
Amines 27% TMA 91.6 ± 28.5 3.0 TMA-like, dried fish
ethyl acetate 0.6 -<1% ethyl butanoate - 2.3 sickenly sweet, vomit
dimethyl sulfide - -dimethyl disulfide - 1.5 - 2.5 onion likedimethyl trisulfide - 2.5 rotten, sulfur, cabbage
a PAR: peak area ratio based on comparison with an internal standard (GC-MS analysis); b Range of odor score in samples during storage, increasing with time (GC-O); c based on GC-O analysis ( two panelists)
Aldehydes
15%
3%
33%
Sulfur compounds
Alcohols
Ketones
Esters
Aldehydes have generally low odor thresholds and therefore their odor impact was
greater than the alcohols and the ketones although their overall levels were less (Table 4).
The presence of ethyl acetate at sensory rejection suggested the role of Pseudomonas
fragi in the development of the spoilage odors of chilled cod fillets. Low levels of sulfur
compounds indicated that S. putrefaciens was not important in the spoilage of chilled cod
fillets stored in styrofoam boxes.
The change in the pH value on day 12 may have influenced the overall odor perception
because of possible synergistic effects causing more potent off odors leading to the

78
sensory rejection of the fillets. TMA has been noted for intensifying fishiness by a
synergistic action with certain volatile unsaturated aldehydes derived from autoxidation
of polyunsaturated fatty acids (Karahadian and Lindsay, 1989). The possible influence of
other aroma active compounds present in lower levels like the unsaturated autoxidatively
derived aldehydes (2,4-heptadienal and 2,4,7-decatrienal) should not be overlooked, but
the sampling techniques used were not sensitive enough to allow detection of these
compounds.
The CO sensor was useful for detecting incipient spoilage since its levels increased
significantly between days 7 and 10 and was found to increase rapidly parallel to the
increase in the pH value after day 10 of storage (Figure 23). The increasing response of
the electronic nose’s CO sensor was explained by the increasing level of alcohols during
storage like ethanol, 2-methyl-1-propanol, 3-methyl-1-butanol and 2,3-butandiol in
addition to the presence of aldehydes and the formation of esters at the end of the shelf-
life (Table 4).
The early detection of alcohols by the CO sensor is of importance for monitoring
incipient changes in quality during storage. The flavor thresholds of the alcohols are high
compared with the carbonyls and they did not contribute to the odor of the fillets as
evaluated by GC-O (Table 4).
5.7.2. Volatile compounds as quality indicators in different seafood products
It is of interest to compare the composition of the headspace of different fish products
during storage. Similar volatile compounds as found in the cod fillets were identified in
an earlier study of chilled haddock fillets stored in styrofoam boxes TMA, 2-methyl-1-
propanol, 3-methyl -1-butanol, 3-hydroxy- butanone, ethyl acetate and butanoic acid
ethyl ester were found in the highest amount and increased with storage of haddock
fillets. Dimethyl disulfide and dimethyl trisulfide were detected at the end of the storage
time when the samples were spoiled, while dimethyl sulfide was detected initially and
throughout storage (Olafsdottir, 2003). Amines, sulfides ketones and esters were the main
classes of volatile compounds in prawns associated with the growth of Pseudomas fragi
and and S. putrefaciens (Chinivasagam et al., 1998). Microbially produced ketones,
aldehydes and alcohols were abundant in the headspace of cold smoked salmon products
during storage (Joffraud et al., 2001; Jörgensen et al., 2001). A few compounds mainly

79
alcohols were associated with the spoilage off-flavor as confirmed by gas
chromatography-olfactometry. These were trimethylamine, 3-methyl butanal, 2-methyl-1-
butanol, 3-methyl-1-butanol, 1-penten-3-ol, and 1-propanol (Jörgensen et al., 2001).
A similar set of sensors with selectivity and sensitivity towards the main quality
indicating classes of compounds like ketones, amines, alcohols, aldehydes, acids, esters
and sulfur compounds can be used for a variety of fish species that are stored and
processed by different techniques.

80
6. CONCLUSIONS
The studies provided better understanding and explained the contribution of the different
microflora to the spoilage odor development in naturally spoiling fish. The electronic
nose sensors with sensitivity towards the main classes of compounds produced during
storage showed that the CO sensor was most sensitive to detect incipient spoilage in all
fish species. This indicated the formation of volatile alcohols, aldehydes and esters
coinciding with the growth of Pseudomonas spp. The increasing response during
advanced storage of the NH3, H2S and SO2 sensors, sensitive to amines and sulfur
compounds, suggested the importance of S. putrefaciens as a late spoiler in whole redfish
and cod, and in cod and haddock fillets stored under temperature abusive conditions (7 °C
and 15 °C). These sensors are therefore useful for detecting the spoilage indicator
compounds like sulfur compounds and amines which are only present in detectable
amounts when products are overtly spoiled. No increase in the responses of these sensors
was observed in MA-stored redfish, chilled haddock and superchilled cod fillets before
the end of the sensory shelf-life, verifying that the spoilage process was slower or altered
under these conditions. Only the CO sensor showed increasing responses in these
products and appears to be a promising indicator of fish quality when stored under
different conditions (III, IV, V). More studies are needed to characterize better the
spoilage changes leading to sensory rejection of superchilled and MA packed fillets.
Quantitative evaluation of the spoilage potential based on determining the cell count of
the specific spoilage organisms (SSO) and the quantity of metabolites causing off odors
showed that P. phosphoreum appeared to be very important in the spoilage of both fresh
haddock and cod fillets packed under aerobic conditions in styrofoam boxes. High counts
of P. phosphoreum coincided with high TVB-N values at sensory rejection and P.
phosphoreum appeared to be the main contributor to the formation of off odors based on
its ability to produce TMA and 3-hydroxy-2-butanone (acetoin) which were detected by
GC-MS in the highest concentration at sensory rejection. Levels of acetoin increased
earlier than TMA and acetoin is therefore more useful to monitor the loss of freshness as
an early indicator of spoilage, but high levels of TMA were detected at sensory rejection
(VI). This is of importance when selecting sensitive sensors for the rapid detection of fish
freshness.

81
The results of gas chromatography analysis showed that ketones, amines (TMA),
alcohols, aldehydes, acids and esters were present in the highest concentration during
chilled storage of fish fillets (VI). Therefore, selective sensors for the detection of these
classes of compound are suggested in particular additional sensors are needed for ketones
and acids when monitoring quality changes during storage of cod and haddock fillets.
Increased sensitivity of sensors is required for monitoring the incipient quality
deterioration and the early detection of compounds indicative of quality loss, including a
more sensitive sensor for the detection of TMA.
Rapid measurements of volatile compounds in fish with an electronic nose appear to have
a potential to detect the freshness or quality, if the sensor array can detect the respective
indicator compounds that truly represent the condition of the fish. The studies showed
that an overall similar pattern was observed in the electronic nose measurements of
chilled fish indicating that similar volatile compounds were present during storage of
different products (I –VI). This indicates that the same array of sensors with selectivity
and sensitivity towards the main quality indicating classes of compounds of fish could be
used for a variety of fish species and fish products processed by different techniques and
stored under chilled condition. However, the studies clearly demonstrated that fixed
values to determine the end of shelf-life or the quality of fish based on electronic nose
responses or values for the microbial and TVB-N reference methods will have to be
developed for each product and the respective storage conditions.
The extensive storage studies that have been performed on different fish species
demonstrated the complexity of the spoilage changes caused by the diversity of the
microflora and their different spoilage potential under the different temperature
conditions. The microbial, sensory, chemical and electronic nose data including details on
handling, processing and time and temperature history of the products provides a
valueable overview of spoilage changes of chilled fish (I –VII). This data is important for
recommendations on the validity of the reference methods implied in regulations like
TVB-N and TVC when new preservation techniques like superchilling and MA
packaging are used (V, III).
Classification of chilled fish fillets according to sensory criteria using multiple indices of
quality (electronic nose; SSOs, TVB-N) gave 85% correct classification. The

82
misclassified samples were all samples of marginal quality. This indicated that the
combined quality indicators SSOs, TVB-N and CO sensor, were not sensitive enough to
detect the incipient spoilage, but they could clearly discriminate fresh samples from
spoiled samples (V). Multivariate models adapted for individual products based on an
electronic nose with metaloxide sensors gave up to 100% correct classification for cold
smoked salmon according to microbial and sensory off- odor or sweet/sour -odor criteria
(VII). The NH3 sensor gave the best prediction of the TVB-N value in capelin intended
for fish meal production by fitting a generalized linear model to the data and estimating
parameters for each storage condition (I). Models based on electronic nose
measurements, as well as any other technique to predict quality of fish products, have to
be adapted for individual products and the respective storage conditions
The information gained is of practical value for the fish industry and can be used to select
appropriate storage conditions to extend the shelf-life of fish products by preventing or
minimizing the development of the spoilage flora. The studies showed that low
temperature throughout the whole process from catch to the delivery of products to
consumers is of utmost importance to preserve the quality of the products. Temperature
fluctuations in the chain influenced the spoilage rate of the products and shortened the
shelf-life (IV, V). Preservation techniques like MA and superchilling process combined
with superchilled storage were effective in extending the shelf-life of fish products (III,
V).
7. FUTURE PERSPECTIVES
The benefit of the electronic nose technique is the speed of analysis because of limited
sample preparation and the fast data generation and data interpretation. The electronic
nose technique provides a rapid detection of the volatiles in the headspace and the
resulting pattern of the sensor responses gives qualitative or quantitative information
about the headspace composition. Both sophisticated laboratory instruments and
application specific simple instruments with selective sensors will find applications in the
future for quality and safety monitoring in the food industry. The studies in the thesis
showed that the electronic nose can be used to detect volatile compounds associated with
microbial growth and can be used to classify or predict quality of fish products.

83
The information gained on the key quality indicating compounds like alcohols, ketones
acids and esters can be exploited for the development of "smart" sensor technologies for
example using microchips with imprinted sensors to include into the packaging to
monitor the quality of fish products. The use of pH sensitive films or selective detection
of TMA and ammonia are examples of techniques that have been suggested to include
into the packaging for monitoring the quality fish. The criteria are that the tools should be
readily implemented in the industry to monitor the freshness and quality of fish products
to ensure high quality and safe products for consumers.
Development of a sampling system for the FishNose instrument (VII) improved its
performance for at-line use in the smoked fish industry and stressed the importance of
carefully controlling sampling conditions. On-line monitoring or continuous monitoring
of food products is an interesting possibility that requires automated sampling options.
For implementation of the electronic nose technique for monitoring quality of fish
products in the industry, it is important to select temperature conditions to ensure
reproducible sampling and prevent the possible interference of background air and
contaminants by using closed sampling compartments. The fast development of sensor
technologies and data processing techniques will improve the possibility of specific
applications for quality monitoring in the food industry. More selective and sensitive
sensors to detect the different quality indicators will improve the performance of the
electronic noses.
The speed of the analysis of the electronic nose measurement and fast data generation
opens up the possibility to use the data in predictive shelf-life models along with data on
the time temperature history of the products. The studies on cod and haddock fillets
showed that for accurate prediction of sensory quality and shelf-life of fish fillets a
combined criteria of the SSOs and their metabolites is needed (IV, V). Additionally, the
information on the time from catch, the handling and processing conditions and the
temperature history is essential for accurate estimation of quality It is foreseeable that
rapid PCR based techniques will become available in the near future for the detection of
the different SSOs. Therefore, the information gained on the characteristic spoilage
processes of the different products should stimulate continued studies on the
characterization of spoilage processes of different fish species and products stored under

84
different conditions to further guide the development of the appropriate detection
techniques to evaluate the quality.
Further research is needed on the possible involvement of other SSOs than have been
studied here and also the role of endogenous enzyme activity and oxidation causing
degradation of muscle components and the loss of quality. The degredation of the muscle
results in more available nutrients for microbial growth leading to the formation of
volatile compounds causing off odors. Future studies should include more sensitive
detection of the volatile compounds causing off odors in fish. This includes the detection
of ketones and other microbially, oxidatively or enzymically derived degradation
compounds that possibly contribute to the sensory rejection of chilled, superchilled and
MA packed fillets.
The sensitivity of the electronic nose sensors towards the very volatile degradation
compounds like esters, sulfur compounds and amines signaling overt spoilage suggests
that the e-nose may be promising for environmental monitoring of malodors. High
concentration of these compounds often causes odor pollution from fish and animal waste
and when processing fish meal or dried products when the raw material is not of optimal
freshness.
The development of the liquid counterpart of electronic noses, namely array of sensors
working in solution (the so-called electronic tongue) may be used in combination with the
electronic nose for better characterization of the flavor of food (Winquist et al., 1999).
Similarly, the simultaneous use of instrumental devices as counterparts of other sensory
attributes like texture and appearance contributing to overall quality (to some extent
mimicking the human senses) is a powerful approach for obtaining robust estimates of
freshness and quality.
The results from the studies showed that multiple quality indices were favorable to
predict the complex spoilage changes occurring in fish products. The development of
sensors and instrumental techniques and advances in statistical and mathematical
analyzes of the data, especially multivariate analysis and multi-sensor data fusion of
instrumental results and correlation with the results of sensory analysis will give a more
precise estimation of the quality of food. Sensory analysis was used in the studies as the
main reference method and the ideal indicator of consumer acceptance of the products.

85
Sensory analysis is in fact a multidisciplinary approach taking into account various
attributes like odor, taste, appearance and texture. Therefore, it can be expected that no
single instrument relying on one attribute will encompass all the changes occurring in fish
during storage. However, volatile compounds can give information about different
degradation processes in the fish. Therefore, the electronic nose composed of selective
sensors for detecting compounds characteristic for the growth of specific spoilage
organism or oxidative processes is a multi-indicator device and has the potential to give
more information than a single reference measurement for example TVB-N.

86
8. ACKNOWLEDGEMENTS
The background chapter in the thesis is based on book chapters and review papers which
were the outcome of three European projects; Evaluation of Fish Freshness, MUSTEC
and FQLM. The collaboration of my colleagues and friends in WEFTA in these projects
and the participation in all the meetings in different locations throughout Europe has
provided the necessary scientific and social stimulus to encourage me to complete this
thesis. Participation in courses and workshops organized by the NOSE Network has been
invaluable to keep up with the fast developing field of the electronic nose technology and
to have the chance to meet my good colleagues in the NOSE community.
In particular I acknowledge the following:
Kristberg Kristbergsson my supervisor for believing in my work and providing support
and guidance especially during the most challenging part in the end.
Doctoral Committee members: Joop Luten and Joerg Oehlenschläger for their friendship
and for having continuously given me opportunities, guidance and encouragement
throughout the years, Rögnvaldur Ólafsson for initiating the e-nose activities for fish
applications and giving valuable comments to the thesis and Ágústa Guðmundsdóttir for
support and encouragements. Also, Inga Þórsdóttir for her enthusiasm and support in
planning the thesis work.
John Erik Haugen, Eric Chaine and other colleagues in the Fishnose project for good
collaborations leading to the nomination of the Göpel Award at the ISOEN2005 meeting.
Corrado Di Natale and other MUSTEC friends for the long and fruitful ''work-ins ''.
Icelandic Fisheries Laboratories for providing the opportunity to carry on the work and
Sjöfn Sigurgísladóttir and Helga Gunnlaugsdóttir for the motivation to finish the thesis.
The staff at IFL is thanked for their valued contribution in chemical, microbial and
sensory analysis and for being good friends and problem solvers in all areas. Special
thanks are due to Emilía for her everlasting interest in “aroma” and for pushing me
forward and giving me support for many years, Rosa for her skilful way to master the
puzzle of the GC data, Hélene for being the best organizer of storage studies and for her
scientific discipline when it comes to microbiology and data interpretation, Soffia for all
the joint experiments in the MUSTEC and for listening and sharing quality time and

87
Birna for always being there when needed and for inspiring me with her genuine interest
in ''cleaning and hygiene '' especially during our visit in Vietnam.
Collaborations with students in the United Nations University Fisheries Training Program
have been invaluable and given me insight to the world beyond Europe.
Jón Bæring Hauksson at Maritech for technical expertise and development of the
electronic nose FreshSense.
Personnel at the participating companies Tros, Reykofninn, Tangi, SR-mjöl and Skaginn
for their support.
Finally, my family Magnús, Siggi, Óli Torfi, Helga and Tommi for being around and
sharing all the emotions involved in writing this thesis. Special thanks to Helga for
carefully reviewing the reference list and helping with data handling.
Funding of the following research projects and network activities contributing to papers
and background chapter of this thesis is acknowledged:
The Icelandic Centre for Research
• Notkun lyktarnema við mat á gæðum hráefnis í fiskimjölsiðnaði: Application of gas
sensors for quality evaluation of capelin for fishmeal production (I)
• Nálkvæm geymsluþolsspálíkön: Precise predictive models to determine the shelflife of
fish and fish products (IV, V, VI)
The Icelandic Centre for Research /AVS research fund of the Ministry of Fisheries
• Áhrif roðkælingar á gæði fiskflaka; The influence of the CBC superchilling process on
the quality of fish fillets (V)
European Commission
• Implementation on board of systems of atmospheres with variable composition applied to
fresh fish. Continuation on shore of the modified atmosphere chain. FAIR CT98-3833
(III)
• Development of multi-sensor techniques for monitoring the quality of fish FAIR4-4076
MUSTEC (II, Background)
• FishNose - Development of an electronic nose system for the automated quality control
of smoked fish QLK1-CT-2002-71304 (VII)
• Fish Quality Labeling and Monitoring FAIR 4-4174 FQLM (Background)
• Evaluation of Fish Freshness AIR3 CT94 2283 (Background)
• NOSE I and NOSE II – Network on Artificial Olfactory Sensing / IST (Background)

88
9. REFERENCES
Ackman RG, Hingley J, MacKay KT. 1972. Demethyl sulfide as an odor component in Nova Scotia Fall
Mackerel. J Fish Res Bd Can 29(7):1085–8.
Acree T, Arn H. 1997. Flavornet, http://www.nysaes.cornell.edu/fst/faculty/acree/flavornet/index.html,
Cornell University.
Ahmed A, Matches JR. 1983. Alcohol production by fish spoilage bacteria. J Food Prot 46:1055-9.
Aksnes A, Brekken B. 1988. Tissue degradation, amino acid liberation and bacterial decomposition of
bulk stored capelin. J Sci Food Agric 45:53-60.
Alasalvar C, Taylor KDA, Shahidi F. 2005. Comparison of volatiles of cultured and wild sea bream
(Sparus aurata) during storage in ice by dynamic headspace analysis gas chromatography mass
spectrometry. J Agric Food Chem 53:2616-22.
Amoore JE, Forrester LJ, Pelosi P. 1976. Specific Anosmia to Isobutyraldehyde: The Malty Primary Odor.
Chemical Senses and Flavor 2:17-25.
Anonymous 1996. Council regulation (EC) No. 2406/96 of 26 November laying down common marketing
standards for certain fishery products. Official Journal of European Communities No. L334/1-14,
23.12.96.
Aro T, Tahvonen R, Koskinen L, Kallio H. 2003. Volatile compounds of Baltic herring analysed by
dynamic headspace sampling-gas chromatography-mass spectrometry. Eur Food Res Technol 216:483-
8.
Baek HH, Cadwallader KR. 1996. Volatile compounds in flavor concentrates produced from crayfish-
processing byproducts with and without protease treatment. J Agric Food Chem 44:3262-67.
Baixas-Nogueras S, Bover-Cid S, Veciana-Nogues MT, Vidal-Carou MC. 2003. Suitability of Volatile
Amines as Freshness Indexes for Iced Mediterranean Hake. J Food Sci 68:1607-10.
Balaban MO, Korel F, Odabasi AZ, Folkes G. 2000. Transportability of data between elcetronic noses:
mathematical methods. Sens Act B-Chem 71(3):203-11.
Bandarra NM, Undeland I, Nunes ML, Batista I, Empis JM. 1998. Lipid oxidation indices to evaluate
sardine freshness. In: Olafsdottir G, Luten J, Dalgaard P, Careche M, Verrez-Bagnis V, Martinsdóttir E,
Heia K, editors. Methods to Determine the Freshness of Fish in Research and Industry. Proceedings of
the Final meeting of the Concerted Action "Evaluation of Fish Freshness" AIR3 CT94 2283. Paris:
International Institute of Refrigeration. p 263-5.
Bartlett HN, Elliott JM, Gardner JW. 1997. Electronic noses and their application in the food industry.
Food Technol. 51(12): 44-48
Bisogni CA, Ryan GJ, Regenstein JM. 1987. What is fish quality? Can we incorporate consumer
perceptions? In: Kramer DE, Liston J, editors. Seafood Quality Determination. Amsterdam: Elsevier
Science Publishers BV. p 547-63
Boothe AAJ, Arnold JW. 2002. Electronic nose analysis of volatile compoounds from poultry meat
samples, fresh and after refrigerated storage. J Sci Food Agric 82(3):315-22.

89
Botta JR. 1995. Evaluation of seafood freshness quality. New York: VCH Publishers Inc. p. 1-67.
Boyd LC, King MF, Sheldon B. 1992. A rapid method for determining the oxidation of n-3 fatty acids. J
Am Oil Chem Soc 69(4):325-30.
Boyle JL, Lindsay RC, Stuiber DA. 1992a. Bromophenol Distribution in Salmon and Selected Seafoods of
Fresh and Saltwater Origin. J Food Sci 57(4):918-22.
Boyle JL, Lindsay RC, Stuiber DA. 1992b. Contributions of Bromophenos to Marine-Associated Flavors
of Fish and Seafood. J Aquat Food Prod Technol 1(3/4):43-63.
Boyle JL, Lindsay RC, Stuiber DA. 1993. Occurrence and Properties of Flavor-Related Bromophenols
Found in the Marine Environment: A review. J Aquat Food Prod Technol 2(2):75-112.
Bremner HA. 1985. A convenient easy-to-use system for estimating the quality of chilled seafoods. In:
Scott DN, Summers G, editors. Proceedings of the fish processing conference, Nelson, 23-25 April
1985. Fish Processing Bulletin, 7. Wellington: DSIR. ISSN 0112-4633. p 59-70.
Bremner HA, Olley J, Vail AMA. 1986. Estimating time-temperature effects by a rapid systematic sensory
method. In: Kramer DE, Liston J, editors. Seafood quality determination. Proceedings of an
international symposium coordinated by the University of Alaska Sea Grant College Program.
Amsterdam: Elsevier. p 413-35
Bremner HA. 2000. Toward practical definitions of quality for food science. Crit Rev Food Sci Nutr
40(1):83-90.
Bremner HA, Sakaguchi M. 2000. A critical look at whether 'freshness' can be determined. J Aquat Food
Prod Technol 9(3):5-25.
Brooke RO, Mendelsohn JM, King FJ. 1968. Significance of dimethyl sulfide to the odor of soft-shell
clams. J Fish Res Bd Can 25:2453-60.
Buttery RG, Guadagni DG, Ling LC, Seifert RM, Lipton W. 1976. Additional volatile components of
cabbage, broccoli and cauliflower. J Agric Food Chem 24(4):829-32.
Byrne L, Lau KT, Diamond D. 2003. Development of pH sensitive films for monitoring spoilage volatiles
released into packaged fish headspace. Irish J Agric Food Res 42(1):119-29.
Cadwallader KR, Tan Q, Chen F, Meyers SP. 1995. Evaluation of the aroma of cooked spiny lobster tail
meat by aroma extract dilution analysis. J Agric Food Chem 43:2432-7.
Castell CH, Greenough MF. 1957. The action of Pseudomonas on fish muscle: 1. Organisms responsible
for odour produced during incipient spoilage of chilled fish muscle. J Fish Res Board Can 12(4):617-25.
Castell CH, Greenough F, Dale J. 1959. The action of Pseudomonas on fish muscle: 3. Identification of
organisms producing fruity and oniony odours. J Fish Res Board Can 16(1):13-9.
Cha YJ, Baek HH, Cadwallader KR. 1993. Volatile flavor components in snow crab cooker effluent and
effluent concentrate. J Food Sci 58: 525-30.
Cha YJ, Lee GH, Cadwallader KR. 1997. Aroma-active compounds in salt-fermented anchovy. In: Shahidi
F, Cadwallader KR, editors. Flavor and Lipid Chemistry of Seafoods. ACS Symp Series No. 674.
Washington, D.C.: American Chemical Society. p 131-47.

90
Chai T, Chien C, Rosen A, Levin RE. 1971. Detection and incidence of specific species of spoilage
bacteria on fish. Appl Microbiol 16(11):1738–41.
Chen TC, Nawar WW, Levin RE. 1974. Identification of major high-boiling volatile compounds produced
during refrigerated storage of haddock fillets. Appl Microbiol 28(4):679-80.
Chinivasagam HN, Bremner HA, Wood AF, Nottingham SM. 1998. Volatile components associated with
bacterial spoilage of tropical prawns. Int J Food Microbiol 42:45-55.
Chung HY, Cadwallader KR. 1994. Aroma extract dilution analysis of blue crab claw meat volatiles. J
Agric Food Chem 42:2867-70.
Chung HY, Cadwallader KR. 1995. Cooked blue crab claw meat aroma compared with lump meat. J Food
Sci 60:289-91.
Connell JJ. 1995. Control of Fish Quality. 4th ed. Oxford: Fishing News Books. 245 p.
Craven MA, Gardner JW, Bartlett PN. 1996. Electronic noses development and future prospects. Trends
Anal Chem 15(9):486-93.
D’Amico A, Di Natale C, Macagnano A, Davide F, Mantini A, Tarizzo E, Paolesse R, Boschi T. 1998.
Technologies and tools for mimicking olfaction: status of the Rome ''Tor Vergata'' electronic nose.
Biosensors and bioelectronics 13(6):711-21.
Dainty RH. 1996. Chemical/biochemical detection of spoilage. Int J Food Microbiol 33(1):19-33
Dalgaard P, Gram L, Huss HH. 1993. Spoilage and shelf life of cod fillets packed in vacuum or modified
atmosphere. Int J Food Microbiol 19:283-94
Dalgaard P. 1995a. Qualitative and quantitative characterization of spoilage bacteria from packed fish. Int
J Food Microbiol 26:319-33
Dalgaard P. 1995b. Modelling of microbial activity and prediction of shelf life for packed fresh fish. Int J
Food Microbiol 26:305-317
Dalgaard P, Mejlholm O, Huss HH. 1996. Conductance method for quantitative determination of
Photobacterium phosphoreum in fish products. J Appl Bacteriol 81:57-64.
Dalgaard P, Mejlholm O, Huss HH. 1997. Application of an iterative approach for development of a
microbial model predicting the shelf-life of packed fish. Int J Food Microbiol 38:169-79.
Dalgaard P. 2000. Fresh and lightly preserved seafood. In: Man CMD, Jones AA, editors. Shelf life
evaluation of foods. 2nd ed. Maryland, USA: Aspen Publishing Inc. p 110-39.
Dalgaard P, Buch P, Silberg S. 2002. Seafood Spoilage Predictor—development and distribution of a
product specific application software. Int J Food Microbiol 73:343–9.
Dalgaard P. 2002. Modelling and predicting the shelf-life of seafood. Chapter 12. In: Bremner HA, editor.
Safety and quality issues in fish processing. Cambridge, England: Woodhead Publishing Ltd. p 191-
219.
Davidson AP, Cronin F. 1973. Medium for the selective enumeration of lactic acid bacteria in foods. Appl
Microbiol 26(3):439-40.

91
Davis HK. 1990. Some effects of modified atmosphere packaging gases on fish and chemical tests for
spoilage. Chilling and Freezing of New Fish Products, International Institute of Refrigeration,
Commission C2, Aberdeen 1990-3. p 201-7.
Debevere J, Boskou G. 1996. Effect of modified atmosphere packaging on the TVB/TMA-producing
microflora of cod fillets. Int J Food Microbiol 31:221-9.
Delbarre-Ladrat C, Verrez-Bagnis V, Noël J, Fleurence J. 2004. Relative contribution of calpain and
cathepsins to protein degradation in muscle of sea bass (Dicentrarchus labrax). Food Chem 88:389–95.
Deng Z, Stone DC, Thompson M. 1996. Selective detection of aroma components by acoustic wave
sensors coated with conducting polymer films. Analyst 121:671-9.
Di Natale C, Brunink JAJ, Bungaro F, Davide F, d´Amico A, Paolesse R, Boschi T, Faccio M, Ferri G.
1996. Recognition of fish storage time by a metalloporphyrins-coated QMB sensor array. Meas Sci
Technol 7:1103-14.
Di Natale C, Olafsdottir G, Einarsson S, Mantini A, Martinelli E, Paolesse R, Falconi C, D’Amico A.
2001. Comparison and integration of different electronic noses for the evaluation of freshness of cod
fish fillets. Sens Act B77:572-8. (II)
Di Natale C. 2003. Data Fusion in MUSTEC: Towards the Definition of an Artificial Quality Index. In:
Luten JB, Oehlenschlager J, Olafsdottir G, editors, Quality of Fish from Catch to Consumer: Labeling,
Monitoring and Traceability. The Netherlands: Wageningen Academic Publishers. p 273-80.
Du WX, Kim J, Huang TS, Marshall MR, Wei CI. 2001. Microbiological, sensory, and electronic nose
evaluations of yellowfin tuna under various storage conditions. J Food Prot 64(12):2027-36.
Du WX, Lin CM, Huang TS, Kim J, Marshall MR, Wei CL. 2002. Potential application of the electronic
nose for quality assessment of salmon fillets under various storage conditions. J Food Sci 67(1):307-13.
Egashira M, Shimizu Y, Takao Y. 1990. Trimethylamine sensor based on semiconductive metal-oxides for
detection of fish freshness. Sens Act B-Chem 1(1-6):108-12.
Egashira M, Shimizu Y, Takao Y. 1994. Fish Freshness detection by semiconductor gas sensors, Olfaction
and Taste XI. Proc Int Sym 11:715-9.
Einarsson H. 1992. Predicting the shelf life of cod (Gadus morhua) fillets stored in air and modified
temperatures between -4 °C and +16 °C. In: Huss HH, Jacobsen M, Liston J, editors. Quality Assurance
in the Fish Industry. Amsterdam, The Netherlands: Elsevier Science Publishers BV. p 479-88.
Elliot RP. 1947. Evaluation of surface pH as a freshness index for fish fillets. Food Research 12(2):87-91.
Ellis DI, Goodacre R. 2001. Rapid and quantitative detection of the microbial spoilage of muscle foods:
current status and future trends. Trends Food Sci Technol 12:414-24.
Fazzalari FA. 1978. Compilation of Odor and Taste Threshold Value Data. Philadelphia, PA: American
Society for Testing and Materials.
Gacrcía- González DL, Aparicio R. 2002. Sensors: From biosensors to the electronic nose. Grasas y
Aceites, 53:96-114.
Gardner JW, Bartlett PN. 1999. Electronic noses. Principles and applications. Oxford, England: Oxford
University Press.

92
German JB, Kinsella JE. 1985. Lipid oxidation in fish tissue. Enzymatic initiation via lipoxygenase. J
Agric Food Chem 33:680-3.
German JB, Buckner GB, Kinsella JE. 1986. Lipoxygenase in trout gill tissue acting on arachidonic,
eicosapentaenoic and docosahexaenoic acids. Biochim Biophys Acta 875:12-20.
Gram L, Melchiorsen J. 1996. Interaction between fish spoilage bacteria Pseudomonas sp. and Shewanella
putrefaciens in fish extracts and on fish tissue. J Appl Bacteriol 80:589-95.
Gram L, Huss HH. 1996. Microbiological spoilage of fish and fish products. Int J Food Microbiol 33:121-
37.
Gram L, Dalgaard P. 2002. Fish spoilage bacteria – problems and solutions. Current Opinion in
Biotechnology 13:262-6.
Gram L, Ravn L, Rasch M, Bruhn JB, Christensen AB, Givskov M. 2002. Food spoilage - interactions
between food spoilage bacteria. Int J Food Microbiol 78(1-2):79-97.
Granroth B, Hattula T. 1976. Formation of dimethyl sulfide by brackish water algae and its possible
implication for the flavor of Baltic herring. Finn Chem Lett 148-50.
Gudmundsdóttir G, Stefánsson G. 1997. Sensory and chemical changes in spice-salted herring as affected
by handling. J Food Sci 62(4):894-987.
Guldager HS, Bøknæs N, Østerberg C, Nielsen J, Dalgaard P. 1998. Thawed cod fillets spoil less rapidly
than unfrozen fillets when stored under modified atmosphere at 2 °C. J Food Prot 61:1129-36.
Hardy R, McGill AS, Gunstone FD. 1979. Lipid and autoxidative changes in cold stored cod (Gadus
morhua). J Sci Food Agric 28:999.
Harper WJ. 2001. Strengths and weaknesses of the electronic nose. In: Rouseff and Cadwallader editors.
Headspace Analysis of Food and Flavors: Theory and Practice. New York: Kluwer Academic / Plenium
Publishers. p 59-71.
Haugen JE, Kvaal K. 1998. Electronic nose and artificial neural network. Meat Science 49:273-86.
Haugen JE. 2001. Electronic noses in food analysis. In: Rouseff RL, Cadwallader KR, editors. Headspace
Analysis of Food and Flavors: Theory and Practice. New York: Kluwer Academic / Plenium Publishers.
p 43-57.
Haugen JE, Undeland I. 2003. Lipid oxidation in herring fillets (Clupea harengus) during ice storage
measured by a commercial hybrid gas-sensor array system. J Agric Food Chem 51(3):752-9.
Haugen JE, Chanie E, Westad F, Jonsdottir R, Bazzo S, Labreche S, Marcq P, Lundby F, Olafsdottir G.
Rapid control of smoked Atlantic salmon quality by electronic nose: correlation with classical
evaluation methods. Forthcoming Sens Act.
Hebard CE, Flick GJ, Martin RE. 1982. Occurrence and significance of trimethylamine oxide and its
derivatives in fish and shellfish. In: Martin RE, editor. Chemistry and Biochemistry of Marine Food
Products. Westport: AVI Publishing Co., Inc. p 149–304.
Herbert RA, Hendrie MS, Gibson DM, Shewan JM. 1971. Bacteria active in the spoilage of certain
seafoods. J Appl Bacteriol 34:41-50.

93
Herbert RA, Ellis JR, Shewan JM. 1975. Isolation and identification of the volatile sulphides produced
during chill-storage of North Sea Cod (Gadus morhua). J Sci Food Agric 26:1195-202.
Herbert RA, Shewan JM. 1976. Roles played by bacterial and autolytic enzymes in the production of
volatile sulphides in spoiling North Sea cod (Gadus morhua). J Sci Food Agric 27:89-94.
Hillig F. 1956. Volatile acids, succinic acid and histamine as indice of decomposition in tuna. Association
of Official Agricultural Chemists. 39:773-800.
Hirano T, Zhang Chao-Hua, Morishita A, Suzuki T, Shirai T. 1992. Identification of volatile compounds in
ayu fish and its feeds. Nippon Suisan Gakkaishi 58(3):547-57.
Högnadóttir, Á. 1999. Application of an electronic nose in the fish industry. MS thesis. Department of
Food Science, University of Iceland
Holmberg M, Winquist F, Lundström I, Davide F, Di Natale C, D´Amico A. 1996. Drift counteraction for
an electronic nose. Sens Act 35-36:528-35
Howgate P, Johnston A, Whittle KJ. 1992. Multilingual guide to EC freshness grades for fishery products.
Torry Research Station, Food Safety Directorate, Ministry of Agriculture, Fisheries and Food,
Aberdeen, Scotland, 32 p.
Hsieh RJ, German JB, Kinsella JE. 1988. Lipoxygenase in fish tissue: some properties of the 12-
lipoxygenase from trout gill. J Agric Food Chem 36:680-5.
Hsieh RJ, Kinsella JE. 1989. Lipoxygenase generation of specific volatile flavor carbonyl compounds in
fish tissue. J Agric Food Chem 37(2):279-86.
Hultin HO. 1994. Oxidation of lipids in seafoods. In: Seafoods: Chemistry, processing technology and
quality. Shahidi F, Botta JF, editors. Glasgow: Blackie Academic and Professional. p 49-74.
Hultin HO, Kelleher SD. 2000. Surimi Processing from Dark Muscle Fish. In: Park JW, editor. Surimi and
Surimi Seafood. New York: Marcel Dekker, Inc. p 59-78.
Human J, Khayat A. 1981. Quality Evaluation of Raw Tuna by Gas Chromatography and Sensory
Methods. J Food Sci 46:868-73.
Huss HH. 1995. Quality and quality changes in fresh fish. FAO Fisheries Technical Paper, No.348, FAO,
Rome
Ikeda S. 1980. Other organic components and inorganic components. In: Connell JJ, editor. Fish Science
and Technology. Farnham, Surrey, England: Fishing News Books Ltd. p 111-23.
ISO 1993. Sensory analysis - general guidance for the selection, training and monitoring of assessors. Part
1: Selected assessors, 8586-1. Geneva, Switzerland: The International Organization for Standardization.
p 1-10.
Jensen B, Refsgaard HH, Olafsdottir G. 1998. Headspace and extraction methods for analysis of volatile
and semivolatile compounds in fish - Chemical and sensory assessment of lipid- derived volatiles. In:
Olafsdottir G, Luten J, Dalgaard P, Careche M, Verrez-Bagnis V, Martinsdóttir E, Heia K, editors.
Methods to determine the freshness of fish in research and industry. Proceedings of the Final Meeting of
the concerted action "Evaluation of Fish Freshness"AIR3 CT94 2283. Paris: International Institute of
Refrigeration. p 70-91.

94
Joffraud JJ, Leroi F, Roy C, Berdagué JL. 2001. Characterisation of volatile compounds produced by
bacteria isolated from the spoilage flora of cold-smoked salmon. Int J Food Microbiol 66(3):175-84.
Jónsdóttir R, Olafsdottir G, Martinsdottir E, Stefansson G. 2004. Flavor Characterization of Ripened Cod
Roe by Gas Chromatography, Sensory Analysis and Electronic Nose. J Agric Food Chem 52:6250-6.
Jónsdóttir R, Olafsdottir G, Chanie E, Haugen JE. Variation in the Occurence of Volatile Compounds in
Cold Smoked Salmon (Salmo salar) during Storage. Forthcoming.
Jones NR, 1967. Fish flavors. Schultz HW, Day EA, Libbey LM, editors. Symposium on food: The
Chemisty and Physiology of Flavors. Westport, Connecticut: The AVI Publishing Co. p 267-95.
Jonsson A, Winquist F, Schnürer J, Sundgren H, Lundström I. 1997. Electronic nose for microbial quality
classification of grains. Int J Food Microbiol 35:187-93.
Jørgensen BR, Gibson DM, Huss HH. 1988. Microbiological quality and shelf life prediction of chilled
fish. Int J Food Microbiol 6:295-307.
Jørgensen BR, Huss HH. 1989. Growth and activtiy of Shewanella putrefaciens isolated from spoiling
fish. Int J Food Microbiol 9:51-62.
Jørgensen LV, Dalgaard P, Huss HH. 2000. Multiple compound quality index for cold-smoked salmon
(Salmo salar) developed by multivariate regression of biogenic amines and pH. J Agric Food Chem
48:2448-53.
Jørgensen LV, Huss HH, Dalgaard P. 2001. Significance of volatile compounds produced by spoilage
bacteria in vacuum-packed cold-smoked salmon (Salmo salar) analyzed by GC-MS and multivariate
regression. J Agric Food Chem 49:2376-81.
Jørgensen BM, Oehlenschläger J, Olafsdottir G, Tryggvadóttir SV, Careche M, Heia K, Nesvadba P,
Nunes ML, Poli BM, Di Natale C, Pérez-Villarreal B, Ballo H, Luten JB, Smelt A, Denton W, Bossier
P, Hattula T, Åkesson G. 2003. A study of the attitudes of the European fish sector towards quality
monitoring and labelling. In: Luten JB, Oehlenschlager J, Olafsdottir G, editors. Quality of Fish from
Catch to Consumer: Labeling, Monitoring and Traceability. The Netherlands: Wageningen Academic
Publishers. p 57-71.
Josephson DB, Lindsay RC, Stuiber DC. 1983. Identification of compounds characterizing the aroma of
fresh Whitefish (Coregonus Clupeaformis). J Agric Food Chem 31:326-30.
Josephson DB, Lindsay RC, Stuiber DC. 1984. Variations in the occurrences of enzymically derived
volatile aroma compounds in salt- and freshwater fish. J Agric Food Chem 32:1344-7.
Josephson DB, Lindsay RC, Olafsdottir G. 1986. Measurement of Volatile Aroma Constituents as a Means
for Following Sensory Deterioration of Fresh Fish and Fishery Products. In: Kramer DE, Liston J,
editors. Proceedings of an International Symposium on Quality Determinations sponsored by the
University of Alaska Sea Grant Program, Anchorage, Alaska, U.S.A. Amsterdam: Elsevier Science
Publishers BV. p 27-47.
Josephson DB, Lindsay RC, Stuiber DA. 1987. Influence of processing on the volatile compounds
characterizing the flavor of pickled fish. J Food Sci 52:10-14.

95
Josephson DB, Lindsay RC. 1987a. Retro-aldol degradations of unsaturated aldehydes: Role in the
formation of c4-heptenal from t2,c6-nonadienal in fish, oyster, and other flavours. J Food Sci 64:1186-
90.
Josephson DB, Lindsay RC. 1987b. c4-heptenal: An influential volatile compound in boiled potato flavor.
J Food Sci 52:328-31.
Josephson DB. 1991. Seafood. In: Maarse H, editor. Volatile compounds in foods and beverages. New
York: Marcel Dekker. p 179-202.
Jurs PC, Bakken GA, McClelland HE. 2000. Computational Methods for the Analysis of Chemical Sensor
Array Data from Volatile Analytes. Chem Rev 100:2649-78.
Kadota H, Ishida Y. 1972. Production of volatile sulphur compounds by microorganisms. Ann Rev
Microbiol 26:127-38.
Kamiya A, Ose Y. 1984. Study of the odorous compounds produced by putrefaction of foods. V. Fatty
acids, sulphur compounds and amines. J Chromat 292:383-91.
Karahadian C, Lindsay RC. 1989. Evaluation of compounds characterizing fishy flavors in fish oils. J
Amer Oil Chem Soc 66:953-7.
Kawai T. 1996. Fish flavor. Crit Rev Food Sci Nutr 36(3):257-98.
Kelleher SD, Zall RR. 1983. Ethanol accumulation in muscle tissue as a chemical indicator of fish
spoilage. J Food Biochem 7:87-91.
Keshri G, Voysey P, Magan N. 2002. Early detection of spoilage moulds in Keshri bread using volatile
production patterns and quantitative enzyme assays. J Appl Microbiol 92:165-72.
Koide K, Yanagisawa I, Ozawa A, Satake M, Fujita T. 1992. Studies on the kerosene-like off-flavour
producing yeast in surimi-based products. Bull Jap Soc Sci Fish 58: 1925-30.
Koutsoumanis K, Nychas GJE. 1999. Chemical and Sensory Changes Associated with Microbial Flora of
Mediterranean Boque (Boops boops) Stored Aerobically at 0, 3, 7, and 10°C. Appl Env Microbiol
65(2):698–706.
Koutsoumanis K, Nychas GJE. 2000. Application of a systematic experimental procedure to develop a
microbial model for rapid fish shelf life predictions. Int J Food Microbiol 60:171–84.
Koutsoumanis K. 2001. Predictive modeling of the shelf life of fish under nonisothermal conditions. Appl
Env Microbiol 67(4):1821-9.
Larsen E, Heldbo J, Jespersen CM, Nielsen J. 1992. Development of a method for quality assessment of
fish for human consumption based on sensory evaluation. In Huss HH, Jakobsen M, Liston J, editors.
Quality assurance in the fish industry. Developments in Food Science, 30. Amsterdam: Elsevier. p 351-
8.
Lauzon HL. 2000. Shelf-life and bacteriological spoilage of American plaice (Hippoglossoides
platessoides). In: Shahidi F, editor. Seafood in Health and Nutrition, Transformation in Fisheries and
Aquaculture: Global Perspectives. NF, Canada: A Science Tech. Book, St. John´s. p 327-54

96
Lauzon HL, Stefánsson G, Jónsson GP, Sveinsdóttir K. 2002. Sensory quality and shelf life of MAP
redfish (Sebastes marinus) fillets as affected by previous bulk storage of whole fish. J Aquat Food Prod
Technol 11(3/4):251-73.
Lauzon HL. 2003. Notkun Malthus leiðnitækni til hraðvirkra örverumælinga. IFL project report 30-03, 30p
(in Icelandic).
Lerke P, Huck RW. 1977. Objective determination of canned tuna quality: Identification of ethanol as a
potentially useful index. J Food Sci 42(3):755-758.
Leroi F, Joffraud JJ, Chevalier F, Cardinal M. 1998. Study of the microbial ecology of cold-smoked
salmon during storage at 8°C. Int J Food Microbiol 39(1/2):111-21.
Levin RE. 1968. Detection and incidence of specific species of spoilage bacteria on fish. Appl Microbiol
16(11):1734-7.
Lindsay RC, Josephson DB, Ólafsdόttir G. 1986. Chemical and biochemical indices for assessing the
quality of fish packaged in controlled atmospheres. In: Kramer DE, Liston J, editors. Proceedings of an
International Symposium; University of Alaska Sea Grant Program, Anchorage, AK. Amsterdam, The
Netherlands: Elsevier Science Publishers. p 221-34.
Lindsay RC. 1990. Fish Flavors. Food Rev Int 6(4):437-55.
Lovell RT. 1983. New off-flavors in pond-cultured channel catfish. Aquaculture 30:329-34.
Luten JB, Martinsdóttir E. 1998. QIM: a European tool for fish freshness evaluation in the fishery chain.
In: Olafsdottir G, Luten J, Dalgaard P, Careche M, Verrez-Bagnis V, Martinsdóttir E, Heia K, editors.
Methods to determine the freshness of fish in research and industry. Proceedings of the Final Meeting of
the concerted action "Evaluation of Fish Freshness" AIR3 CT94 2283. Paris: International Institute of
Refrigeration. p 287-96.
Luten JB, 2003. Introduction and outcome of the Concerted Action “Fish Quality Labelling and
Monitoring” FAIR 98-4174). In: Luten JB, Oehlenschlager J, Olafsdottir G, editors.. Quality of Fish
from Catch to Consumer: Labelling, Monitoring and Traceability. The Netherlands: Wageningen
Academic Publishers. p 33-42.
Luten JB, Oehlenschlager J, Olafsdottir G, editors. 2003. Quality of Fish from Catch to Consumer:
Labelling, Monitoring and Traceability. The Netherlands: Wageningen Academic Publishers. 456p.
Luzuriaga DA, Balaban MO. 1999a. Evaluation of Odor Decomposition in Raw and Cooked Shrimp:
Correlation of Electronic Nose Readings, Odor Sensory Evaluation and Ammonia Levels. In: Hurst WJ,
editor. Electronic nose and sensor array based system, Design and Applications. Proceedings of the 5th
International Symposium on Olfaction and the Electronic Nose. USA: Technomic Publ. Co., Inc. p 177-
84.
Luzuriaga DA, Balaban MO. 1999b. Electronic nose odor evaluation of salmon fillets stored at different
temperatures In: Hurst WJ, editor. Electronic nose and sensor array based system, Design and
Applications. Proceedings of the 5th International Symposium on Olfaction and the Electronic Nose.
USA: Technomic Publ. Co., Inc. p 162-9.

97
Magnússon H, Martinsdóttir E. 1995. Storage quality of fresh and frozen-thawed fish in ice. J Food Sci
60:273-8.
Malle P, Poumeyrol M. 1989. A new chemical criterion for the quality control of fish: Trimetylamine /
total volatile basic nitrogen (%). J Food Protect 52:419-23.
Marsili RT. 2001. SPMS-MS-MVA as a rapid technique for assessing oxidation off-flavors in foods. In:
Rouseff RL, Cadwallader KR, editors. Headspace Analysis of Food and Flavors: Theory and Practice.
New York: KluwerAcademic / Plenium Publishers. p 89-100.
Martens H, Martens M. 1999. Modified Jack-knife estimation of parameter uncertainty in bilinear
modelling by partial least squares regression (PLSR). Food Qual Pref 11:5-16.
Martin RE, Gray RJH, Pierson MD. 1978. Quality assessment of fresh fish and the role of the naturally
occurring microflora. Food Technol 5:188-92.
Martinsdόttir E, Arnason H. 1992. Redfish. In: Nordic Industrial Fund, Quality Standards for Fish. Final
Report Phase II. p 21-35.
Martinsdóttir E, Luten J, Schelvis R, Hyldig G. 2003. Scientific developments of QIM: past and future. In:
Luten JB, Oehlenschlager J, Olafsdottir G, editors. Quality of fish from catch to consumer: Labelling,
monitoring and traceability. The Netherlands: Wageningen Academic Publishers. p 265-72.
McEntegart CM, Penrose WR, Strathmann S, Stetter JR. 2000. Detection and discrimination of coliform
bacteria with gas sensor arrays. Sens Act B70:170-6.
McGill AS, Hardy T, Burt RJ, Gunstone FD. 1974. Hept-cis-4-enal and its contribution to the off-flavor of
cold-stored cod. J Sci Food Agric 25:1477-81.
Mielle P.1996. Electronic noses: towards the objective instrumental characterisation of food aroma. Trends
Food Sci Technol 7:432-8
Mielle P, Marquis F. 1999. An alternative way to improve the sensitivity of electronic olfactometers. Sens
Act B58:526-35
Miler KBM, Sikorski ZE. 1990. Smoking. Florida: CRC Press. p 163-180.
Miller III A, Scanlan RA, Lee JS, Libbey LM. 1973a. Identification of the volatile compounds produced in
sterile fish muscle (Sebastes melanops) by Pseudomonas fragi. Appl Microbiol 25(6):952-5.
Miller III A, Scanlan RA, Lee JS, Libbey LM, 1973b. Volatile compounds produced by Pseudomonas
putrefaciens, Pseudomonas fluorescens and an Achromobacter Species. Appl Microbiol 26:18–21.
Miller III A, Scanlan RA, Lee JS, Libbey LM, Morgan ME. 1973c. Volatile compounds produced in
sterile fish muscle (Sebastes melanops) by Pseudomonas perolens. Appl Microbiol 25:257-61.
Milo C, Grosch W. 1993. Changes in the Odourants of Boiled Trout (Salmo Fario) as Affected by the
Storage of the Raw Material. J Agric Food Chem 41:2076-81.
Milo C, Grosch W. 1995. Detection of Defects in Boiled Cod and Trout by Gas Chromatography-
Olfactometry of Headspace Samples. J Agric Food Chem 43:459-62.
Milo C, Grosch W. 1996. Changes in the odorants of boiled salmon and cod as affected by the storage of
the raw material. J Agric Food Chem 44:2366-71.
Miner JR. 1977. Characterization of odors and other volatile emissions. Agric Environm 3:129-37.

98
Motohiro T. 1962. Studies on the petroleum odor in canned chum salmon. Mem Fac Fish, Hokkaido Univ.
10:1-65.
Namdev PK, Alroy Y, Singh V 1998. Sniffing out trouble: Use of an electronic nose in bioprocesses.
Biotechnol Prog 14:75-8.
Nesvadba P. 2003. Introduction and outcomes of the project "Multi-sensor techniques for monitoring the
quality of fish". In: Luten JB, Oehlenschlager J, Olafsdottir G, editors. Quality of fish from catch to
consumer: Labelling, monitoring and traceability. The Netherlands: Wageningen Academic Publishers.
p 175-187.
Newman DJ, Luzuriaga DA, Balaban MO. 1999. Odor and Microbiological Evaluation of Raw Tuna:
Correlation of Sensory and Electronic Nose Data. In: Hurst WJ, editor. Electronic nose and sensor array
based system, Design and Applications. Proceedings of the 5th International Symposium on Olfaction
and the Electronic Nose. USA: Technomic Publication Company, Inc. p 170-6.
Oehlenschläger J. 1992. Evaluation of some well established and some underrated indices for the
determination of freshness and/or spoilage of ice stored wet fish. In: Huss HH, Jakobsen M, Liston J,
editors. Quality Assurance in the Fish Industry. Amsterdam: Elsevier Science Publisher. p 339-50.
Oehlenschläger J. 1998. Sensory evaluation in inspection. In: Olafsdottir G, Luten J, Dalgaard P, Careche
M, Verrez-Bagnis V, Martinsdóttir E, Heia K, editors. Methods to determine the freshness of fish in
research and industry. Proceedings of the Final Meeting of the concerted action "Evaluation of Fish
Freshness" AIR3 CT94 2283. Paris: International Institute of Refrigeration. p 339-44.
Oehlenschläger J, Sörensen NK. 1998. Criteria of seafood freshness and quality aspects. In: Olafsdottir G,
Luten J, Dalgaard P, Careche M, Verrez-Bagnis V, Martinsdóttir E, Heia K, editors. Methods to
determine the freshness of fish in research and industry. Proceedings of the final meeting of the
concerted action "Evaluation of Fish Freshness" AIR3 CT94 2283. Paris: International Institute of
Refrigeration. p 30-5.
Ohashi E, Takao Y, Fujita T, Shimizu Y, Egashira M. 1991. Semiconductive trimethylamine gas sensor for
detecting fish freshness. J Food Sci 56(5):1275-8.
Okuma H, Watanabe E. 2002. Flow system for fish freshness determinatio based on double multi-enzyme
reactor electrodes. Biosens Bioelectron 17:367-72.
Olafsdottir G, Steinke JA, Lindsay RC. 1985. Quantitative Performance of a Simple Tenax-GC Adsorption
Method For Use in the Analysis of Aroma Volatiles. J Food Sci 50:1431-6.
Olafsdottir G, Martinsdóttir E, Oehlenschläger J, Dalgaard P, Jensen B, Undeland I, Mackie IM, Henehan
G, Nielsen J, Nilsen H. 1997a. Methods to evaluate fish freshness in research and industry. Trends Food
Sci Technol 8:258-65.
Olafsdottir G, Martinsdóttir E, Jónsson EH, 1997b. Rapid gas sensor measurements to predict the
freshness of capelin (Mallotus villosus). J Agric Food Chem 45(7):2654-9.
Olafsdottir G, Martinsdóttir E, Jónsson EH. 1997c. Gas sensor and GC measurements of volatile
compounds in capelin (Mallotus villosus). In: Luten JB, Börresen T, Oehlenschläger J, editors. Seafood
from Producer to Consumer, Integrated Approach to Quality. Amsterdam: Elsevier. p 507-20.
99
Olafsdottir G, Fleurence J. 1998. Evaluation of fish freshness using volatile compounds- classification of
volatile compounds in fish. In: Olafsdottir G, Luten J, Dalgaard P, Careche M, Verrez-Bagnis V,
Martinsdóttir E, Heia K, editors. Methods to Determine the Freshness of Fish in Research and Industry.
Proceedings of the final meeting of the concerted action "Evaluation of Fish Freshness" AIR3 CT94
2283. Paris: International Institute of Refrigeration. p 55-69
Olafsdottir G, Luten J, Dalgaard P, Careche M, Verrez-Bagnis V, Martinsdóttir E, Heia K, editors. 1998a.
Methods to Determine the Freshness of Fish in Research and Industry, Proceedings of the Final meeting
of the Concerted Action "Evaluation of Fish Freshness" AIR3 CT94 2283. Paris: International Institute
of Refrigeration 396p.
Olafsdottir, G.,. Högnadóttir, Á., Martinsdóttir, E. 1998b. Application of gas sensors to evaluate freshness
and spoilage of various seafoods. In: Olafsdottir G, Luten J, Dalgaard P, Careche M, Verrez-Bagnis V,
Martinsdóttir E, Heia K, editors. Methods to Determine the Freshness of Fish in Research and Industry,
Proceedings of the Final meeting of the Concerted Action "Evaluation of Fish Freshness" AIR3 CT94
2283. Paris: International Institute of Refrigeration. p 100-9.
Olafsdottir G, Högnadóttir Á, Martinsdόttir E, Jónsdóttir H. 2000. Application of an electronic nose to
predict total volatile bases in capelin (Mallotus villosus) for fishmeal production. J Agric Food Chem.
48(6):2353-9 (I)
Olafsdottir G, Li X, Lauzon HL, Jonsdottir R. 2002. Precision and application of electronic nose
measurements for freshness monitoring of redfish (Sebastes marinus) stored in ice and modified
atmosphere bulk storage. J Aquat Food Prod Technol 11(3/4):229-49. (III)
Olafsdottir G. 2003. Developing rapid olfaction arrays for determining fish quality. In Tothill IE, editor.
Rapid and on-line instrumentation for food quality assurance. Cambridge, England: Woodhead
Publishing Ltd. p 339-60.
Olafsdottir G, Di Natale C, Macagnano A. 2003a. Measurements of quality of fish by electronic noses. In:
Luten JB, Oehlenschlager J, Olafsdottir G, editors. Quality of Fish from Catch to Consumer: Labelling,
Monitoring and Traceability. The Netherlands: Wageningen Academic Publishers. p 225-234.
Olafsdottir G, Jonsdottir R, Tryggvadottir SV, Einarsson S, Lauzon HL. 2003b. Prediction of freshness
quality of haddock fillets using electronic nose, texture and TVN measurements First Joint Trans-
Atlantic Fisheries Technology Conference (TAFT) 33rd WEFTA Meeting and 48th Atlantic Fisheries
Technology Conference, 11-14 June 2003, Reykjavik - Iceland 2003 p 148-150.
(http://vefur.rf.is/TAFT2003/).
Olafsdottir G, Nesvadba P, Di Natale C, Careche M, Oehlenschläger J, Tryggvadóttir SV, Schubring R,
Kroeger M, Heia K, Esaiassen M, Macagnano A, Jørgensen BM. 2004. Multisensor for fish quality
determination. Trends Food Sci Technol 15:86-93
Olafsdottir G, Chanie E, Westad F, Jonsdottir R, Bazzo S, Labreche S, Marcq P, Lundby F, Haugen JE.
2005. Rapid Control of Smoked Atlantic Salmon Quality by Electronic Nose: Correlation with Classical
Evaluation Methods. In: Marco S, Montoliu I, editors. Proceedings of the 11th International Symposium

100
on Olfaction and Electronic Nose, ISOEN2005, Electronic Department, Physics Faculty, Barcelona
University, Barcelona, Spain. p 110-4.
Olafsdottir G, Lauzon H, Martinsdottir E, Kristbergsson K. Influence of storage temperature on microbial
spoilage characteristics of haddock fillets (Melanogrammus aeglefinus) evaluated by multivariate
quality prediction. Submitted (IV)
Olafsdottir G, Lauzon H, Martinsdottir E, Kristbergsson K. Shelf-life extension of superchilled cod (Gadus
morhua) fillets and influence of temperature fluctuations on microbial growth and metabolites.
Submitted (V)
Olafsdottir G, Jonsdottir R, Lauzon HL, Luten J, Kristbergsson K. Characterization of Volatile
Compounds in Chilled Cod (Gadus morhua) Fillets by Gas Chromatography and Rapid Detection of
Quality Indicators by an Electronic Nose. Submitted (VI)
Olafsdottir G, Chanie E, Westad F, Jonsdottir R, Thalman C, Bazzo S, Labreche S, Marcq P, Lundby F,
Haugen JE. 2005. Prediction of Microbial and Sensory Quality of Cold Smoked Atlantic Salmon
(Salmo salar) by Electronic Nose. Accepted for publication J Food Sci (VII)
Olafsdottir G, Kristbergsson K. Electronic-Nose Technology: Application for Quality Evaluation in the
Fish Industry. In: Nicolay, X. editor. Air Pollution Control: Odours Treatment in the Food Industry.
Springer, NY, NY. (Forthcoming)
Ólafsson R, Martinsdόttir E, Ólafsdόttir G, Sigfússon TI, Gardner JW. 1992. Monitoring of fish freshness
using tin oxide sensors. In: Gardner JW, Bartlett PN, editors. Sensors and Sensory Systems for an
Electronic Nose. Dordrecht, The Netherlands: Kluwer. p 257-72
Olsson J, Börjesson T, Lundstedt T, Schnürer J. 2002. Detection and quantification of ochratoxin A and
deoxyinvalenol in barley grains by GC-MS and electronic nose. Int J Food Microb 72:203-14.
Paludan-Muller C, Dalgaard P, Huss HH, Gram L. 1998. Evaluation of the role of Carnobacterium
piscicola in spoilage of vacuum- and modified-atmosphere-packed cold-smoked salmon stored at 5 °C.
Int J Food Microbiol 39(3):155-66.
Pan BS, Kuo JM. 1994. Flavour of shellfish and kamaboko flavorants. In: Shahidi F, Botta JR., editors.
Seafoods: Chemistry, Processing, Technology and Quality. Glasgow UK: Blackie Academic and
Professional. p 85-114.
Pau LF, Olafsson R. editors. 1997. Fish quality control by computer vision., NY: Marcel Dekker Inc.
Pearce TC, Schiffman SS, Nagle HT, Gardner J.W Editors. 2003. Handbook of Machine Olfaction:
Electronic Nose Technology. Weinheim: Wiley-VCH. ISBN: 3-527-30358-8, 592 p
Quaranta HO, Piccini JL, Perez S. 1984. Volatile acids content of irradiated tuna loins as a criterion of
freshness. Dtsch Lebens Rundsch 4:106-7.
Ronald AP, Thomson WAB. 1964. The volatile sulfur compounds of oysters. J Fish Res Bd Can 21:1481-
7.
Ross T, McMeekin TA. 1994. Predictive Microbiology. Int J Food Microbiol 23:241-64.
Roussel S, Forsberg G, Grenier P, Bellon-Maurel V. 1999. Optimisation of electronic nose measurements.
Part II: Influence of experimental parameters. J Food Eng 39:9-15.

101
Rozum J. 1992. Smoke flavouring in processed meats, 2nd edtion ed. London, UK: Blackie academic and
professional. p 342-353.
Ruiz-Capillas C, Horner WFA. 1999. Determination of trimethylamine-nitrogen and total volatile basic
nitrogen in fresh fish by flow injection analysis. J Food Sci Agric 79:1982-6.
Saja Rde, Souto J, Rodriguez-Mendez ML, de Saja JA. 1999. Array of lutetium bisphthalocyanine sensors
for the detection of trimethylamine. Materials Science & Engineering C-Biomimetic and
Supramolecular Systemes 8-9:565-8.
Saito T, Ari K, Matsuyoshi M. 1959. A new method for estimating the freshness of fish. Bull Jpn Soc Sci
Fish 24:749-53.
Schaefer J.1977. Sampling, characterisation and analysis of malodours. Agricult Environ 3:121-7.
Schaller E, Bosse JO, Escher F. 1998. 'Electronic noses' and their application to food', Lebensm-Wiss
Technol 31(4):305-16.
Schnürer J, Olsson J, Börjesson T. 1999. Fungal volatiles as indicators of food and feeds spoilage. Fungal
Genetics and Biology 27:209-17.
Schweizer-Berberich PM, Vaihinger S, Göpel W. 1994. Characterisation of food freshness with sensor
arrays. Sens Act 18-19:282-290
Sérot T, Baron R, Knockaert C, Vallet JL. 2004. Effect of smoke processes on the content of 10 major
phenolic compounds in smoked fillets of herring (Cuplea harengus). Food Chem 85:111-20.
Sheldon RM, Lindsay RC, Libbey LM, Morgan ME. 1971. Chemical nature of malty flavour and aroma
produced by streptococcus lactis. Appl Microbiol. 22:263-6.
Shewan JM, Mackintosh RG, Tucher CG, Ehrenberg ASC. 1953. The development of a numerical scoring
system for the sensory assessment of the spoilage of wet white fish stored in ice. J Sci Agric 6:183-9.
Shewan JM. 1976. The Biochemistry and Microbiology of Low Temperature spoilage. Food Tech
Australia 11:409-10.
Shiomi K, Noguchi A, Yamnaka H, Kikuchi T, Iida H. 1982. Volatile sulfur compounds responsible for an
offensive odor of the flat-head, Calliurichthys doryssus. Comp Biochem Physio 71B:29.
Skjerdal OT, Lorentzena G, Tryland I, Berg JC. 2004. New method for rapid and sensitive quantification of
sulphide-producing bacteria in fish from arctic and temperate waters. Int J Food Microbiol 93(3). 325-33.
Stohr V, Joffraud JJ, Cardinal M, Leroi F. 2001. Spoilage potential and sensory profile associated with
bacteria isolated from cold-smoked salmon. Food Res Int 34:797-806.
Stone H, Sidel JL. 1985. Sensory evaluation practices. Orlando FL: Academic Press, Inc. p 311.
Storey RM, Davis K, Owen D, Moore L. 1984. Rapid approximate estimation of volatiel amines in fish. J
Food Technol 19:1-10.
Strachan NJC, Nicholson FJ. 1992. Gill air analysis as an indicator of cod freshness and spoilage. Int J
Food Sci Technol 27:261-9.
Stutz HK, Silverman GJ, Angelini P, Levin RE. 1991. Bacteria and Volatile Compounds Associated with
Ground Beef Spoilage. J Food Sci 56(6):1147-53.

102
Toldrá F. 1998. Proteolysis and lipolysis in flavour development of dry-cured meat products. Meat Science
49:101-10.
Toldrá F, Flores M. 1999. The role of muscle proteases and lipases in flavor development during the
processing of dry-cured ham. Crit Rev Food Sci 38:331-52.
Toldrá F, Aristoy MC, Flores M. 2000. Contribution of muscle aminopeptidases to flavor development in
dry-cured ham. Food Res Int 33:181-5.
Tomic O, Ulmer H, Haugen JE. 2002. Standardization methods for handling instrument related signal shift
in gas-sensor array measurement data. Anal Chim Acta 474:99-111.
Trihaas J, Nielsen PV. 2005. Electronic Nose Technology in Quality Assessment: Monitoring the Ripening
Process of Danish Blue Cheese. J Food Sci 70(1):E44-9.
Trihaas J, van den Tempel T, Nielsen PV. 2005. Electronic Nose Technology in Quality Assessment:
Predicting Volatile Composition of Danish Blue Cheese During Ripening. J Food Sci 70(6):E392-400.
Triqui R, Reineccius GA. 1995. Changes in Flavor Profiles with Ripening of Anchovy (Engraulis
encrasicholus). J Agric Food Chem 43:1883-9.
Triqui R, Guth H. 1997. Determination of potent odorants in ripened anchovy (Engraulis encrasicholus L.)
by aroma extract dilution analysis and by gas chromatography-olfactometry of headspace samples. In:
Shahidi F, Cadwallader KR, editors. Flavour and Lipid Chemisty of Seafoods. Washington, DC: ACS
Symposium Series 674 American Chemical Society. p 31-8.
Tryggvadottir SV, Olafsdottir G. 2000. Multisensor for fish: Questionnaire on quality attributes and
control methods -Texture and electronic nose to evaluate fish freshness. Project report for European
Commission (MUSTEC CT-98-4076). RF report 04-00.
Undeland I. 1998. Lipid oxidation in fish – causes, changes and measurements. In: Olafsdottir G, Luten J,
Dalgaard P, Careche M, Verrez-Bagnis V, Martinsdóttir E, Heia K, editors. Methods to Determine the
Freshness of Fish in Research and Industry, Proceedings of the Final meeting of the Concerted Action
"Evaluation of Fish Freshness" AIR3 CT94 2283. Paris: International Institute of Refrigeration. p 241-
57.
Undeland I, Hall G, Lingnert H. 1999. Lipid oxidation in fillets of herring (Clupea harengus) during ice
storage. J Agric Food Chem 47(2):524-32
Van Spreekens KJA. 1974. The suitability of Long & Hammer's medium for the enumeration of more
fastidious bacteria from fresh fishery products. Arch Lebensmitt 25(10):213-9.
Van Spreekens KJA, Toepoel L. 1981. Quality of fishery products in connection with the psychrophilic
and psychrotrophic bacterial flora. In: Roberts TA, Hobbs G, Christian JHB, Skovgaard N, editors.
Psychrotrophic microorganisms in spoilage and pathogenicity. London, UK: Academic Press. p 283-94.
Venugopal V. 2002. Review. Biosensors in fish production and quality control. Biosens Bioelectron
17:147-57.
Viehweg SH, Schmitt RE, Schmidt-Lorenz W. 1989. Microbial Spoilage of Refrigerated Fresh Broilers.
Part V. Evaluation of Suitable Methods for the Detection of the Volatile Aroma Compounds. Lebensm-
Wiss Technol 22:334-45.

103
Whitfield FB, Tindale CR. 1984. The role of microbial metabolites in food off-flavours. Food Technol
Australia 36:204-13.
Whitfield FB, Shaw KJ, Tindale CR. 1988. 2,6-dibromophenol: The cause of an iodoform-like off-flavour
in some Australian crustacea. J Sci Food Agric 46:29-42.
Whitfield FB, Helidoniotis F, Shaw KJ, Svoronos D. 1997. Distribution of Bromophenols in Australian
Wild-Harvested and Cultivated Prawns (Shrimp). J Agric Food Chem 45:4398-405.
Winquist F, Lundstrom I, Wide P. 1999. The combination of an electronic tongue and an electronic nose.
Sens Act B-CHEM 58(1-3):512-7.
Withycombe DA, Mussinan CJ. 1988. Identification of 2-Methyl-3-furanthiol in steam distillates from
canned tuna. J Food Sci 53:658.
Wold S. 1976. Pattern recognition by means of disjoint principal components models. Pattern recognition
8(3):127-39
Yamanaka H. 1989. Offensive odour of fish and shellfish. In: Koizumi C, editor. Odour of Marine
Products. Tokyo: Koseisha-Koseikaku. p 53.
Yurkowski M, Tabachek JAL. 1980. Geosmin and 2-methylisoborneol implicated as a cause of muddy
odor and flavor in commercial fish from Cedar Lake, Manitoba. Can J Fish Aquat Sci 37:1449-50.
Zeng K, Tachikawa H, Zhu ZY, Davidson VL. 2000. Amperometric detection of histamine with a
methylamine dehydrogenase polypyrrole-based sensor. Anal Chem 10:2211-5.
Zeng QZ, Thorarinsdottir KA, Olafsdottir G. 2005. Quality Changes of Shrimp (Pandalus borealis) Stored
under Different Cooling Conditions. J Food Sci Forthcoming
Zhang Chao-Hua, Hirano T, Suzuki T, Shirai T. 1992. Enzymatically generated specific volatile
compounds in ayu tissues. Nippon Suisan Gakkaishi 58(3):559-65.
Zhao CZ, Pan YZ, Ma LZ, Tang ZN, Zhao GL, Wang LD. 2002. Assay of fish freshness using
trimethylamine vapor probe based on a sensitive membrane on piezoelectric quartz crystal. Sens Act B-
CHEM 81(2-3):218-222.

___________________________________________________________________
PAPER I ___________________________________________________________________ Application of an Electronic Nose to Predict Total Volatile Bases in Capelin (Mallotus villosus) for Fishmeal Production Guðrún Ólafsdóttir, Áslaug Högnadóttir, Emilía Martinsdóttir, Helga Jónsdóttir ___________________________________________________________________ Published in: J. Agric. Food Chem. 48, 6 (2000) 2353- 2359 ©2000American Chemical Society Reproduced with permission from J. Agric. Food Chem.
I


___________________________________________________________________
PAPER II
___________________________________________________________________ Comparison and integration of different electronic noses for the evaluation of freshness of cod fish fillets Corrado Di Natale, Guðrún Ólafsdóttir, Sigurdur Einarsson, Alessandro Mantini, Eugenio Martinelli, Roberto Paolesse, Christian Falconi, Arnaldo D’Amico ___________________________________________________________________ Published in: Sensors and Actuators B77, (2001) 572- 578 ©2001 Elsevier Science Publishers. Reprinted with permission
II

������� � ���� ����( /�� ���������� �� �����
��������� ������� )��� ���� �� ��� ��� ������� ��� ����
�� ����� ��� ���� ��� �� �������� �� ������ � 506(
����� ������� �� ����� �� �� ���������� &���� ��
��������� �����'� �� �� �� ��� �������� �� ���� � ����
������� �� ���� �7����� 5>6( ��� �� ��� �� � ����� ��
�������� ������� ������ � ��� �������� � �� ��� ����
���� ���% ���� %�������% ��� �� ��� ������� �� ���
�������� ���� � �� ����� �� ����� �� �� �� �������
)��� � ������������ ��������( /��� �� � �%����� ���������
��� ����������� )���� � ����� �� ������ �����������
� ��������% ��������������� ��� ������� �� �� � +����������
���%��� �� �������(
�������� ��������� ���� ���� ��� ������ �� ��� �����
��� �� ��� ��������( ,������� ������� ���� ��� ������
)��� ������� ����� ������� ��� ���� �� �������7��
����������� �� ������ 5A�:6� ��������������� ������
5@6 � ����*��� ����� ��� +����8 ��������� 5.6( $���
�������� ������ )��� ���� �������� ���� ��������7��
������������ ������� %� )��� ������� ����������% �
���������% ��)��� ������� ���� �� �����%����� �
/�" 5<6(
, ���� ������ ��� ���������� �� �)� ������� ���������
����� ���� � ������� ������ ��������� � �����
������� ��� �� �������( /�� ������ ���� ��� ������� ��
������� ��� ��������� �7������ �� ����� � �%�� �� �
����� �� ������� �� �� ������(
"� � �������� ������ /�" � ����� �������� �����
���� � &/32' ���� ��� ������� � ��� ���� �������
5?6( ���� ��������� ��� ��� ���) � ������ )�% �� �������%
��� ���� � ����������� ��� �� ��� ��������� �� ������� ��
������� ����� � ������( /�� ��� ����� �� ���� ��� ������
���� ������� ��� ����������� �� ��� �� �� ���������
� )��� �� �������� �� ����� )��� �7��������� ������� �
���� �����(
� ������������
�7�������� )��� �������� �� ��� ,������ $��������
F��������% � �%*G���* ���� -: �� 01 �������� -???(
/���� ������� �� "������ �� )��� �������� ��� ��� �7�����
���( $��� )�� ������ ���� ����� ����� ���� � �%�
*G��� &,����'� )���� ��� � ������ ���� � $�7�H�I��
������)��� �� ,����(
$��� )�� ��� �� )��� �� ���� ���� � ��� ������
����% ����� ����� � ���� �� �� ��� ,������ $��������
F����������� ��� �����)� �%( $��� )�� *��� �� 1�� ��������� ���%��( ������� )��� ������ � ��*�� ����� ��
������� � ��� �����)� ����� � �%�= -;A� .� ?� --� -:�
� -.(
�� �� ������� ��� ���� ����� � �% )��� ������� � �����
.0 �����( /�� ����������� )��� �������� � ������( $��
���� ��� ��� �� �� ��� ����� )�� �������� � ��� ����� ���
������� ��� �7�������� �� ������� ����( $������ )���
������� ����� - � ������ ��� ���%��� � )��� ��� ���
�����% � � ������ ���� �������( /)� ������� ��������
�� ���� ���� ��� �������= F�������� � $��������(
F�������� �� � �������� ��� � � ��������� �� ���
J�������% �� ��� &/�� 3�� ���' � ���������� )��� ���
/����������� �����%(
/�� �������� �� ���� � � ����% �� �� �� ����*���
����� ��� ��������� ����� )��� ������� *�� �� ������
�������%���( ������� ����� ��� �������� ���� ��� ����
������% �������� 5-16( $��� ���� ����������� ���� ���
�� ��� � �������% ��� � ��� ���� �������( ,� �� �
�������� ������� )��� � ������ ������ �� -1 �� �����7��
�����% �+��� �� ��� ������ �� ��� ����� �������( /��
������� �� ��)� )��� � ������ �� ����� ������� ��� ���
������ ( ,� )��*� � ������ )��� ��� ��� ������ � ������ �
����������� &���� ��� ���� �� ���) �� ������ �������'
�������� �� ���������� � : ��( $� ( - ���)� � �%����� ��
)��� �)� ���������� �����������(
���� ��� �7�������� ��� ��� ��� �� ��� �� �� ������
)��� ������� ��� ���� ���( /�� ����������� �� ��� �����
�������� ������� ��� ��� ����������� ����� ���� . ��
-1��� � � ���������� �� ����� �������� )��� ��� ���������������� ��� ��� �������(
$�������� ��������� ��� �� ������� � ���������
�% ��� �����% �������2���*� &,����' 5@6( ,� �� ����
� ��� ��������������� ������ ���� ������ ��)��� �
������ ��= ��� K0�� ��� ��0� � �K>( /�� ���� ����
������ ��� ���� ���L �� &�����%' � ��� ���� �� �� ����
���% /������ % &JM'( /�� ������ � � �����������
����� ��� �� ��� ��� �� �� ��� ������ ������� ����
������� �� � ���� ������ &> �'( ���� ����� &�����7������%
>11;:11 ' )�� ����� � ��� ���� ������ � �����������
)�� ������� ������ ����� ( /�� ���������� �����+�� ��
���� � ������ �������� ������ � ���%�� ������% ���
�������� �� ��� )���� ����������� � ��� ����� ����
������� ��� ����������� �� ���� �����������( ����
�������� )��� ��*� ����% -1 � ��� -1 ��( , ��� ���
���%���� ��� ������� ����� &������' �� ��� ����� � �� ���
���� ����� ����������� �� ��� -1 ����������� �%��� 5@6(
/�" � /32��� �7������ ���� ��� �������� )���
������� ��� � ��������� NNH�) �G����� ���%��� 9
�� ������� �����## 5--6( ��������� ���� ��� ���� ���
���%�� �% ������� ����� �+���� ��������� ���%��� &!F��
�"'( "�� ����������� ���� ��� ������ ��� � ������ :(1(
!F���" �� � ��������� ������������ ������ )���� ���
������ ��� ������� ��������� �������� �� ��������
��� !F�( ����� ���������� �� ���������% ���������
)��� � �������� ��������% ���� ( �����%� ��� %�����*
� !F� ������ � ����� �� ��������� �+��� �� ��� ����� ��
������� � ��� ���������� �� � �� �� ��� �� �7������
����� �� �� ��� ��������� �������� � �� 8��� ��� ���
������( " �*�) ������ �� ���� � ��� �� ��� �����
)���� ������ �� �� ��� ��� ��� ������( /��� �������� ��
����� )�� +���������� ������ ���������� ��� ��������
���� �� ����� ��)��*�(
!F���" ������� ���� � +���������� ��������� �� �����
����������� � ����� � ���� ����� ��� � ������
)1 �� -����� �� ��1 2 #����� ��� 3 �%���� 4 55 �6���� 7568759 :.>

�������� �� ��� ��������� � ��� ���������� �� �� ��
������ �� ��� ����%( /�� ���� �� ����� ����� �� �������
���� ����� ������ �% � �������� ������� ���%���� �
���� ���� ��� ����� ��������� ��� ������� � � ���������
�������� ���� �� ���� ��� ������ ����� ����������( ��
����� ��� �� ��� ����� ���� �� ��� ���� �)� ����� ���������
��% ���) ����� ��������� � ��� �������% �� ��� ��� �����
��������� �� ������� � ����� ���������( ����������� �����
����� ������ ��� ����� ���G����� ���� ���� ������ ���
�������� �� ��� ���������� �� ��� � ��� ����� �����( "
$� ( -( �%���� �������� �� ��� �� �� ��� ��� F�������� ���������� ��� ��� ���� ���� �������(
$� ( 0( !��� �� ��� ����� �)� ����� ��������� �� ��� !F���" ��� ��� F�������� ���( ��%� -;> ��� ��������� )���� �%� A;--;-. � .;?;-: ����� �����
��������(
:.A )1 �� -����� �� ��1 2 #����� ��� 3 �%���� 4 55 �6���� 7568759
��������� �� ��� ������������ ���������� �� ��� ����������
��������� ���� �� �� ������ ����� � � ����� �
�������� �������� ��� ��� ������������ ��������
�����+��(
� ������� �� ���������
���� �������� )��� ��� �)� ��������� ���� ���� ���
���%�� ���������% � ���� �� ���% ��� ��������� �� ����
����� ����%� � ��� ���% ���� ��� ���� �� ����� ��
������ ��� � �������� ���������� �� ��� ����� �������
�����(
$� ( 0 ���)� ��� F�������� ��� ������ � � �����
������ �% ��� ���� �)� ����� ���������( ������� �����
�� �� > �%� ��� ������% ������ � ����� ��������� ��� ������
�% �� ��������� )��� �%� -- � -.� )���� ��� �%� .� ?�
� -: ��� ���� ��������� ( /��� ����% �� ������� ��� ����
�%� �� ����� � )��� ��� ���� �%�� ����%� ��� ����% ��
������ ��� �� �)� ���% ������� ��� �� �� ����� � )��� ��
���) �� �� �������� � ���� �7�������( K���� )� ���� ��
*��� � �� ���� ����� )��� ����� ������� �� ��� �
������% ����� )�� � ��� �� �������� � ��� ������ � ����
�� ��� ������� �������( /���� ��% ���� ��� ��� �� ������
���� � ���� ��� ��� ���� 0A � ����� ����� ������� �
������� ������ � ���� �� ��� �������( /�� ������� �� �����%
���%��� &��� �� ���) ����' ����� ���� ������ � � ����
��� ������ � ���� �� ��� ���� ����� ������� �� �� ���)��
��� ��� ���� ��( /� ������%� �%� -;A ��� ���� ��� ����
������ �%� .� ? � -- ��� ���� ��� ���� ����� � ����%
�%� -: � -. ��� ���� ��� ����� �����(
����� ���������� �� ���) � /���� - �� � �������
�����7( /�� �������� ��� ��� �������� � ��� )���� ���
���� ���� ��� ������������ �������� �����+�� ��� ���
���( ������ ��� ���������% ��)� ��� ���� ������� ���� �
� �� ����� � �%� ���� . �� -: ��� �������� �� ���� � ��
��� ���� �%( /�� ����� �� +�����������% �� � �� ����(
$� ( > ���)� ��� ���� ����������� �������� ��� ���
$�������� �������� ���( , ���� ����� ��� ����� ���� ���
�� ���) � �� ��������� �� ��� ���� �%� �� ��� ����� �� ���
������ ��� ��� ����� � �%� ��� �������� ���� ��� ����( /��
����� ���� ���)� ���� ��� ���� ���� ���� �% - �� -.
������ � ����� ������� �� �%� ? � -- ���� ���*� ��
���� ���* ��)��� �%� > � A( !����� ��� ��� � �
������� ������ ��������� �% ��� ���� ����� ���������
��� ��������� �� ���� ���� ���* ������ �� �� ������(
/�� ������� �����7 ��� $�������� �� ���) �
/���� -&�'( ������ ��� +�����������% ������ ������� ��
��� F��������� ���� ���� ���� ������� ��� )�� �%
��������� ��� +�����������% ��� ������ ��� ���� �H������(
, ����������� ��% �)� ������� ����� ��� ���� ��� . �%�
��� �������� �� ���� � �� ��� ���� �%( " ������%
����*� � ������ ��� ������ ��)�%� � ������������� ��
����� � �%�( /��� ����� � �������� � ������������� ��
��� ����� ���� �� ��� ������( F�������� ������� � ���
������%� ��� �� ����������� ��� ����� � �%�(
���� )�� ��)�%� ��������� &8��� ��� � �����%
�������' � ��� ��� !F���" ����������( $� ( A ���)� ���
!F���" ����� ���� ��� � G��� ������� �������� ������
���� �� ����� ��� �)� ����� ����%� � � ��+�� ����%( /��
����� ���� �� ������� �� ���� �� ��� �� �� ���������� ���
���� ���* ������ �� ��� ������� �� ����� ������ � ���
������� �� �%� -: � -. ��� ������% �������� ���� ���
������( /�� ������� �����7 ���� � ������ ����� ��
����������� ������� &AO ������� )��� ?O �� F��������
� >>O �� $��������'( 2��� ��� ��) ������ ������
+�����������% �� � ��� ������ �� ������ �� . � ? �%�
�������� �� -(
" ������������ �� ����� +�����������% �� � �� ����
������ �� �� ������ ������� ��� ������ �� /�"
� /32��( $� ( : ���)� ��� ������� ������ �� �����
�)� �������� ��������( "� ������� � ��� ����������� /�"
������ ������ ���������% ������� ���� 8��� ��% ����� ?
�%� �� ����� �( P����� /32�� ���)� � ������� � �
��������� ��������� )��� ����( "� ��� �� �� ��
����� � /32�� �������� �� ����� � ��7���� ����� A �%�
�����7������%� ��� �� ������� ����� . �%� ��� ���� ������ ��
/���� -
������� �������� �� ��� F��������� $��������� � ��� �)� ��� �
����
- 0 > A . ? -- -: -.
&�' F��������
- <
0 . -
> <
A <
. - .
? 0 : -
-- <
-: - . -
-. <
&�' $��������
- . -
0 0 > 0 -
> > 0 0 -
A <
. - - - A -
? . -
-- - @ -
-: - <
-. 0 @
&�' F�������� � $��������
- <
0 <
> <
A <
. - .
? 0 @
-- <
-: <
-. <
� ������������� )�� ��������� )��� � !F���" ����� )��� � ������
������ �������� �����+��( ����� ��������� �� ���) ��� ��� ������
� ��� ���� ������� � ��� ��)�(
)1 �� -����� �� ��1 2 #����� ��� 3 �%���� 4 55 �6���� 7568759 :.:

$� ( >( !��� �� ��� ����� �)� ����� ��������� �� ��� !F���" ��� ��� $�������� ���( /�� �������� �������� ���� ��� �% - �� . ���� ��� � ���� ���* ������
��� �%� ? � -- �� ���� ���)(
$� ( A( /�� ��������� �� ��� �)� ��������� �� ���) ����� � ��� ���� �� ��� ����� �)� ����� ��������� �� ��� !F���"( $������� �� ���� ��� ��������� ���
��������( $�� ������� ��� �������� �� �% - &���� F��������'� ��� ��������� �� �%� -: � -. &���� $��������' � ��� ���� ���* ������(
:.@ )1 �� -����� �� ��1 2 #����� ��� 3 �%���� 4 55 �6���� 7568759

��� ���% ����� ��� � ��� �� �������� �����)� ���
��������� �� /�"(
$� ( @ ���)� ��� ���� �� /�" ������ /32��� � �� ;��
����� ��� ��� ����� � ���� �� ���� ��� ������� ������
��� �� ��� �)� ��������( /�� ���� ���) ��������% ���
���� ���������� �7������ �% ��� ��������� ��� �%������
����%� � ����� �� �������� ���� �%� - �� A � �
���� ���* ���� . �� -- � ��� � �� ��������� ��
��� ���� �%�(
,� �� )���� �� ����� ���� ��� ���������% �� ��� �� ;�� ����
)��� ��� ��������� ��� ����� ���� &��� $� �( 0;A' �� ����
���� � �� �������� ����������� ���)�� ����� ������� �
�������� ���������� ����� �7���� ��� ��� ������ ����
�������( /�� ������� �� /�" � /32�� ���) ����
��� ������ ��� �����% ��������� )��� ����� �)� �����������
� ���� �� ��� ���� ��� �������� �� ��� �������� ��������
��� &+���������� � +����������' ��� �� ������ � ����� ���
���)�� ������� �� ��� �������� ��������� �� ����� �
�%�( /��� ��% �� �7����� �% ��� ���% ������� ������ �
���� �� ��� ����� ������� ���� ������ ���� �%� �� ����� �
��% �� ��� ��� ���� ��������� ����� ��� �������� ������
�� ��� ��� )�� ������� ������� �� ��� ��� �������(
� �����������
$������� �� ������ ������ ��� ��� ������� )��� �)�
��������� ���� ���� � ������� ������ ������� ��� �
������ �%�����( 2��� ��� ��������� ���) ���������% ��
��� �������� ��������� �� ��� ��������( ����������� ���
�)� ��������� �7������ ������� ���������( /�� F�����
����� ���� � /�� ������ )��� ��������������� �����
� �� ���� ���� �� �� ��� ��������� ��� ��� ���� ��� �� ��
��������� )���� ��� $��������� ���� � ���������������
������� ���)� �� ��� ��������� �� ��� � �� ��� ��������
�������(
/�� �)� �%����� ���� ��� ��������% G��� �� ����� ��
���� � ��+�� ����� ����%( /�� ��� � ��������� ���
���)� ������� ������������ ������������ ����� ���
����� �� ����������� ������� �� AO( � ��� ����� ���
���� ����� ����� ������ +�����������% �� � �� ����� �������
������� �� �%� .;? ��� �������� �� ������� �� �% -( /���
�� �����% �� �7����� �% ��� ���� ���� ������� ������� ��
��� ��% ���� ��� ���% ������� ������ � ����( �����������
�� /�" � /32�� ��� ��� ������ ���� ���� ��������� ��
������ �� ��� �������� ���������� �� �� ������� ���� ���
������ �� ����� �� ���� �� ������( "/�"������ /32�� ����
�������� ��� ���� ����� ���������� ��� �% ��� �������
��������� ���� � ����� ���������(
/�� ������� ���� ���������� ����� ���� ��������� ���
�%����� ���� � ������� ����� ������� ��� ������%
������� ��� ����������� )��� ������� �� � �� �� �������
� %( , ���� ����� ��� ������ ������ � �� ��� )���� ������ �
��������� ��� ��� �������( ,� ��� ���� �� �� ��� ���� ��
�������% � ��� �������� ���������� �������� ��� ������
����� �� ��� ��������������� ������(
�������� �������
/�� )��* ��� ��� �������� � ��� ����� �� ��� ����
���� !��G��� NN��������� �� ����������� �����+��� ���
������� ��� +�����% �� ���## $", �/?<�A1.@(
$� ( :( ������� �� /�" � /32�� � ��� �������( /�" �������
�������� ����� �% --� /32�� ���)� � ��������� ��������� ���
��� ����� ���� �� ��� ��������( , ���� ��� ������ ��� ���������� ��������
��)� )��� ��� ����� � �%�(
$� ( @( /�� ���� �� /32�� ��( /�" ������� � ����� ���������� ���%
������� �� ���� ������� �% ��� ��������� ����( /��� ������ ������� ����
��� ����� ��������� &� ���� �� ���� ���* ������' ��% �� ������� ��
������� �� ��� �7���� �������( , ���� �� ��� � ������ ��� �������
������� � �� ;�� ���� ��� ��� �������(
)1 �� -����� �� ��1 2 #����� ��� 3 �%���� 4 55 �6���� 7568759 :..

����������
5-6 �( �Q �����Q����� �( ������������ R( ����������L ��� !( ��� ���� 2(
R���� ,( J���� ,( ���*��� �( K����� R( ������� K( ������
������ �� �������� ���� �������� � �������� � �����%� /��
$�� ���( /�����( < &-??.' 0:<;0@:(
506 �(2( R�������� (�( F���%� �( �Q �����Q����� ���������� ��
�������� ����� ���������� �� � ���� ��� �����)� �����%
����������� �� ����� ���� � ������% �������� �= �($( M������ F(
F���� &��('� ������ S�����% ����������� �%�������� -1;-A
�������� -?<@� ��������� "�������� -?<@(
5>6 �( �Q �����Q����� R( $�������� ��������� �� ���� �������� ���
�������� ������� 9 ������������� �� �������� ������� � �����
�= ������ �� �������� ��� $������� �� $��� � ������� �
,�������� !������ � �� ��� $��� ����� �� ��� ������� "����
&��������� �� $��� $�������'� ", >�/?A�00<>� ������ $�����
-0;-A �������� -??.� ,������� ,��������� � $���� !����������
!����� -??.(
5A6 ( �������� �( ������������ �( ����������� /(,( �� ������ R(P(
������ ������� �� ���� �������� ��� �� ��7�� ������� �= R(
������ !( 2������� &��('� ������ � �����% �%����� ��� �
��������� ����� M��)�� "������ !���������� ��������� /��
���������� -??0(
5:6 �( ���)��8���2��������� �( 3��� ��� P( ��L���� ��������������� ��
��� �������� )��� ����� ����%� ���( "�����( 2 -<C-? &-??A' 0<0;0?1(
5@6 �( �Q �����Q����� �( �������Q����� �(K( R�Q���� ��� �� �����
����������� �� ������ ��� �������� �� ������ &,����%� �����%�'�
R( " ���( $�� ����( A: &-??.' 0@:A;0@:?(
5.6 �( �� ������� R("(R( 2���*� $( 2� ���� $( ������ "( �#"����� (
!�������� /( 2������ �( $������ �( $����� ��� ���� �� ���� ����� �
���� �% � �������������%��� ����� S�2 ����� ����%� ����( ���(
/�����( . &-??@' --1>;---A(
5<6 T( /�*��� �( ��*������ /( M�)� ����� T( �����8�� �( � �������
����������� �����%����� �� ������ )��� �� � ���������% �
����������%� ���( "�����( 2 0: &-??:' ><1;><0(
5?6 R( ����������L ��� ����������% �� ��������� �����%��������
�������%�������� �������%����� �7������ � ����� �������� �����
���� � �� �������� �������� � �������� �= ������ ��
�������� ��� $������� �� $��� � ������� � ,��������
!������ � �� ��� $��� ����� �� ��� ������� "����
&��������� �� $��� $�������'� ", >�/?A�00<>� ������ $�����
-0;-A �������� -??.� ,������� ,��������� � $���� !����������
!����� -??.(
5-16 "( �#"����� �( �� ������� "( ���� ��� $( ������ "( ������ �(
/���88�� ( !�������� /( 2������ /������ % � ����� ��� �����*�
��������= ������ �� ��� ��� /�� 3�� ��� ��������� ���� 2�����(
2���������( -> &-??<' .--;.0-(
5--6 �( ���*� ( J ��)� �( K��)���� ����������� �� �������%�����
�7�� � ���)���� � ����� ������� �� ������ ������ ��� ���)
�G����� ���%���� "��( ����( "��� >>A &-??@' 0.?;0<:(
:.< )1 �� -����� �� ��1 2 #����� ��� 3 �%���� 4 55 �6���� 7568759

___________________________________________________________________
PAPER III ___________________________________________________________________ Precision and application of electronic nose measurements for freshness monitoring of redfish (Sebastes marinus) stored in ice and modified atmosphere bulk storage Guðrún Ólafsdóttir, Xiuchen Li, Hélène L. Lauzon, Rósa Jónsdóttir ___________________________________________________________________ Published in: JAFP 11, 3/4 (2002) 229-249 ©2001 The Haworth Press Inc. Reprinted with permission
III


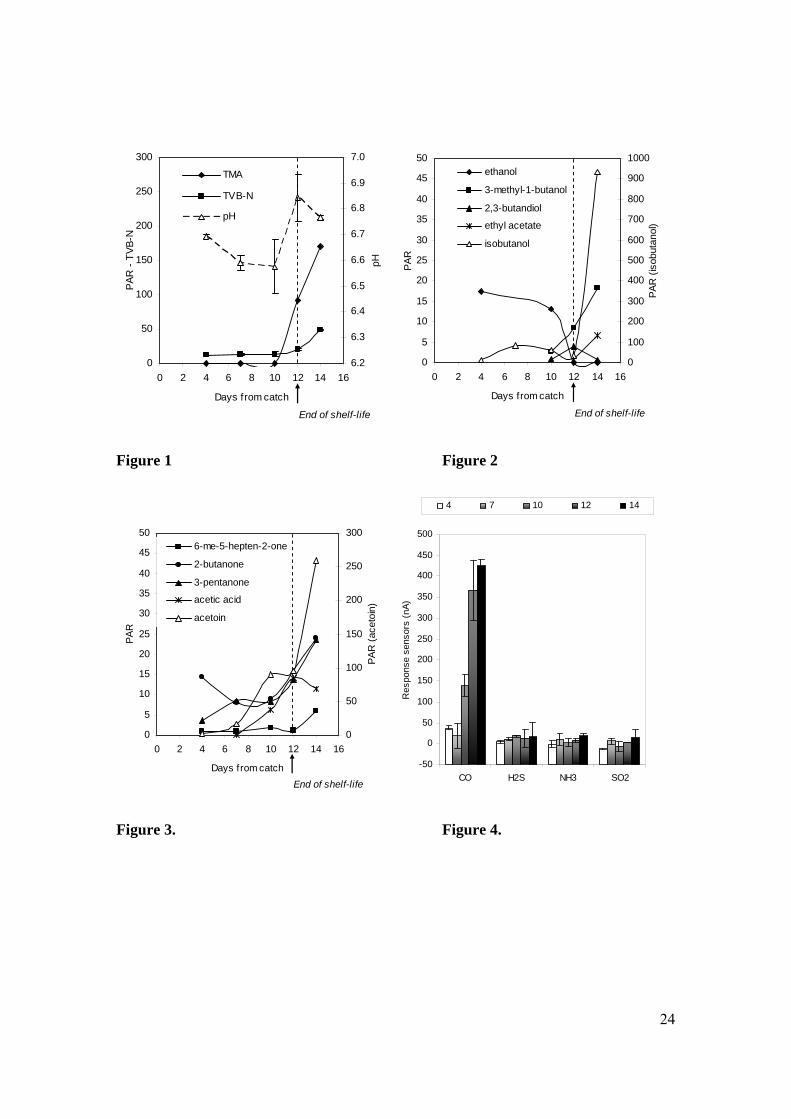

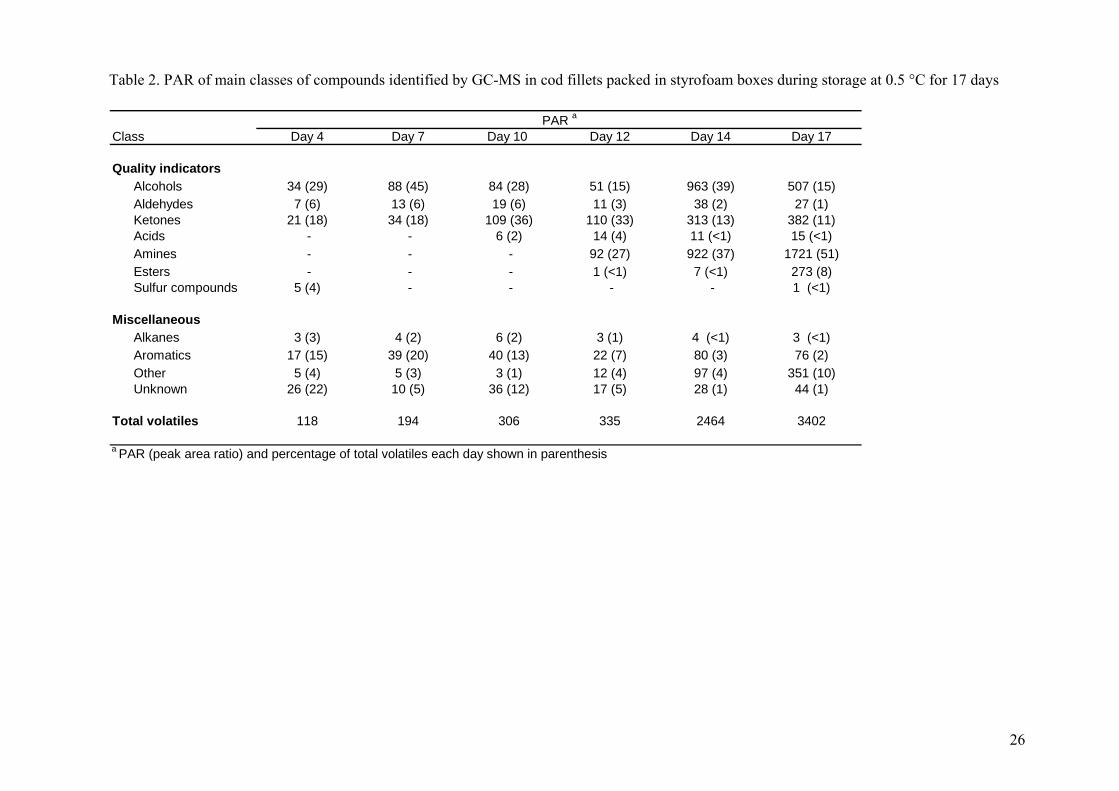


___________________________________________________________________
PAPER IV ___________________________________________________________________ Influence of storage temperature on microbial spoilage characteristics of haddock fillets (Melanogrammus aeglefinus) evaluated by multivariate quality prediction Guðrún Ólafsdóttir, Hélène L. Lauzon, Emilía Martinsdóttir, Kristberg Kristbergsson
___________________________________________________________________ Submitted for publication
IV

1
Characterization of Volatile Compounds in
Chilled Cod (Gadus morhua) Fillets by Gas
Chromatography and Rapid Detection of Quality
Indicators by an Electronic Nose
Gudrun Olafsdottir∗ψ, Rosa Jonsdottirψ , Hélène L. Lauzonψ, Joop Lutenδ and Kristberg
Kristbergssonϒ
ψIcelandic Fisheries Laboratories, Skulagata 4, 101 Reykjavík, Iceland
δ Norwegian Institute of Fisheries and Aquaculture Research, Muninbakken 9-13, 9291
Tromsö, Norway
ϒ cDepartment of Food Science, University of Iceland, Hjardarhagi 2 - 6, 107 Reykjavik,
Iceland
TITLE RUNNING HEAD: Volatile compounds as quality indicators for cod fillets
∗ To whom correspondence should be addressed. E-mail: [email protected]. Tel.: +354
5308600, Fax: +354 5308601

2
ABSTRACT
Volatile compounds in cod fillets packed in styrofoam boxes were analyzed during
chilled storage (0.5 °C) by GC-MS and GC-O to screen potential quality indicators
present in concentrations high enough for detection by an electronic nose. On day 12
when the fillets were rejected by sensory analysis, ketones, mainly 3-hydroxy-2-
butanone, were detected in the highest level (33 %), followed by amines (TMA) (29%),
alcohols (15%), acids (4%), aldehydes (3%) and a low level of esters (<1%). The
electronic nose’s CO sensor showed increasing response with storage time coinciding
with the production of ethanol and 2-methyl-1-propanol that were produced early in the
storage, followed by the production of 3-methyl-1-butanol, 3-methyl-butanal, 2,3-
butandiol and ethyl acetate. Lipid derived aldehydes, like hexanal and decanal were
detected in similar levels throughout the storage time and contributed to the overall sweet
odors of cod fillets in combination with other carbonyls (3-hydroxy-2-butanone,
acetaldehyde, 2-butanone, 3-pentanone and 6-methyl-5-heptene-2-one).
KEYWORDS: Volatile compounds; quality indicators; gas chromatography; electronic
nose; cod fillets

3
INTRODUCTION
The use of electronic nose based on different sensor technologies has been suggested for
the rapid detection of quality related volatile compounds for various food products (1-3)
including monitoring the quality and spoilage processes in fish (4-12). Gas sensors that
are commonly used in electronic noses are non-selective towards individual compounds,
but show sensitivity towards certain classes of compounds. This property induces their
potential for monitoring quality and the onset of spoilage associated with varying levels
of different classes of volatile compounds produced in fish during storage (13-14). The
progression of characteristic odors in fish during chilled storage caused by microbial
growth is well documented (15-17) and has been associated with the formation of volatile
compounds produced by the main spoilage organisms (18-21). Both single compounds
and a combination of compounds representing the different changes occurring during
storage have been suggested as indicators for freshness and spoilage (22-31).
Alcohols, aldehydes, ketones, amines and sulfur compounds have been identified in
different seafood products during chilled storage and related to the growth of specific
spoilage organisms (SSOs) (32-34). However, because of the interaction of the
microorganisms (35-36) and the complexity of the dynamic spoilage changes the levels
of the volatile compounds may vary and they are often not detected until the products are
overtly spoiled. Storage temperature, packaging and the inherent composition of
available nutrients in the fish influence the growth and spoilage potential of the
dominating SSO. The SSO in chilled fish are mainly Gram-negative, psychrotrophic
bacteria like Pseudomonas spp. and Shewanella spp. (37). Pseudomonads typically cause
sweet, malty, fruity, and onion like odors contributed by alcohols, carbonyls, esters and
sulfur compounds (18,19), while S. putrefaciens can produce more potent odors related to
high levels of sulfur compounds and fishy odors because of reduction of TMAO to TMA
(38,21). Photobacterium phosphoreum, is also of interest as SSO in chilled fish and has
been identified as an active TMA producer in iced cod, and in cod fillets (39-40) and
more recently in modified atmosphere packed fish (41-43). Oxidative processes occurring
during storage of fish will also result in the accumulation of both saturated and
unsaturated aldehydes that contribute to the development of rancid cold store flavors (44-
45).
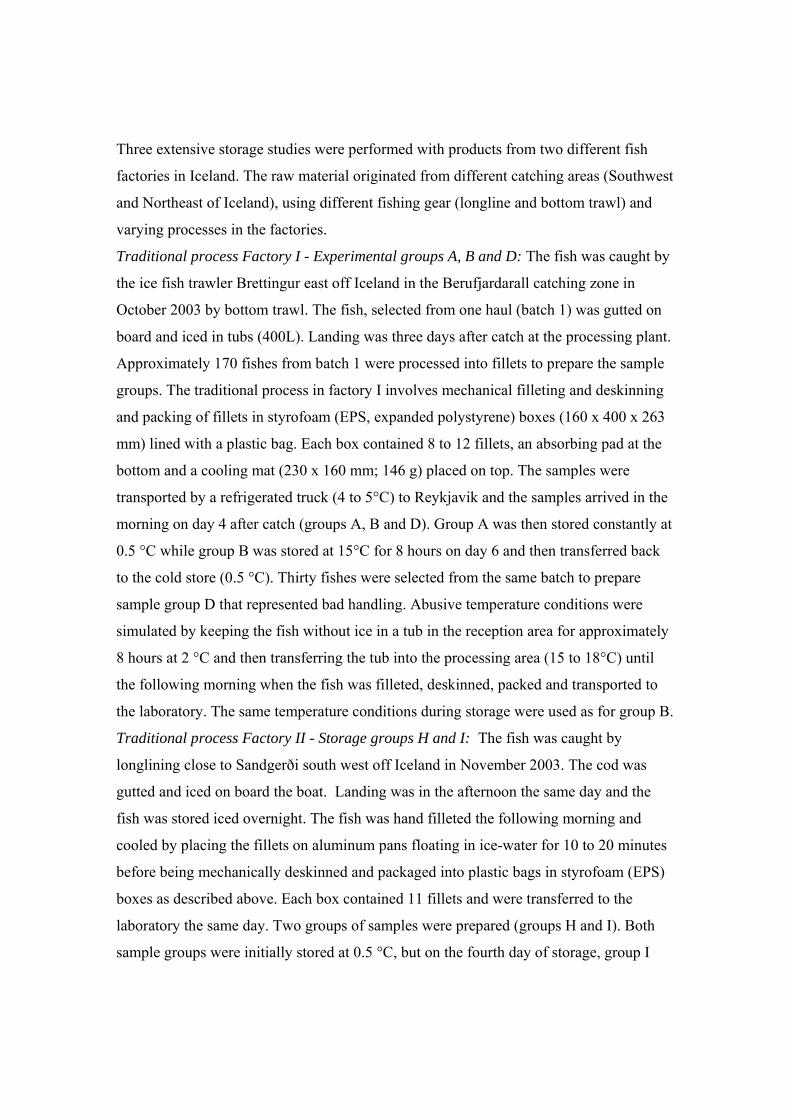
4
The information on the identity and quantity of volatile compounds present in the
headspace during storage of fish is essential when selecting sensors in an array for quality
monitoring of fish (14). It should be clearly stated that in many cases, the most abundant
volatiles may have minimal odor significance. However, they may be indicative for the
degradation processes occurring in the products like the production of metabolites by the
SSOs. Therefore, the potential ability of the electronic nose to monitor quality is not
necessarily directly related to detecting the most influential aroma active compounds
contributing to off odors, since these may be present in too low concentrations.
The aim of the study was to screen the most abundant volatile compounds produced by
SSOs that could be used as quality indicators for chilled fillets. This study was done in
parallel to extensive storage studies on cod fillets (46) where the SSOs were monitored
and the sensory shelf-life was determined. Herein are the results from gas
chromatography analysis of cod fillets stored in Styrofoam boxes under chilled
conditions (0.5 °C) and comparison was made with electronic nose analysis, TVB-N and
pH measurements. The results obtained will be useful to characterize the spoilage
potential of the SSO and to guide the future development of the electronic nose technique
based on selecting sensors that are sensitive to the indicator compounds identified in
chilled cod fillets.
MATERIALS AND METHODS
The fish was processed by a conventional process three days after catch as described
earlier (46). The process includes mechanical filleting, deskinning and packing of fillets
in styrofoam (EPS, expanded polystyrene) boxes (160 x 400 x 263 mm) lined with a
plastic bag. The fillets were stored at 0.5 °C until analyzed. Gas chromatography analysis
(GC-MS and GC-O), electronic nose, TVB-N and pH measurements were performed on
days 4, 7, 10, 12 and 14 after catch
GC-MS measurements. The headspace from approximately 500 g of fish (1-2 fillets)
in a glass container (2.3L, Ø 17 cm) was collected by an air pump sampling (ALPIN-2,
Air sampler, METEK) by sweeping volatiles from the surface of the fish. Aqueous
heptanoic acid ethyl ester solution (10 µL/L) was used as an external standard, using an
amount of 1 mL in a 25 mL beaker (Ø 3.5 cm) located in the glass sampling container.

5
Quantification of volatiles PAR (peak area ratio) was based on comparison of peak area
to the peak area of the external standard. Sampling time was 2 hours at room temperature
(RT) (20 to 22 °C) using a flow rate of approximately 100 mL/min. Duplicate headspace
samples were collected on 250 mg Tenax 60/80 (Alltech, IL) in stainless steel tubes
(Perkin-Elmer, Buchinghamshire, UK). Volatiles were thermally desorbed (ATD 400,
Perkin-Elmer, Buchinghamshire, UK) from the sampling tubes prior to separation on a
DB-5ms column (30 m × 0.25 mm i.d. × 0.25 µm, J&W Scientific, Folsom, CA, USA)
using a GC-MS (HP G1800C GCD, Hewlett-Packard, Palo Alto, CA, USA). Helium was
used as a carrier gas and the following temperature program was used: 50°C for 7 min,
50°C to 120°C at 5°C/min and from 120°C to 220°C at 10°C/min. The injector
temperature was 250°C and the detector temperature was 280°C. The mass detector ion
range was 35-300 m/z.
GC-O measurements. Samples were prepared by weighing 100 ± 2 g of fish fillets
and 100 ± 5 g of saturated aqueous solution of NaCl into a 250 mL and blended manually
in a round bottom flask. Saturated NaCl solution (200 ± 5 g) was prepared as a reference
sample. Heptanoic acid ethyl ester was added as an internal standard to all samples by
adding 1 mL of 10 µL/L aqueous solution of the standard to the 200 g fish and NaClsat
solution to evaluate the extraction based on the FID response. The sample was purged at
RT with nitrogen at about 100 mL/min for 2.5 hours. Volatiles were collected on 150 mg
Tenax in a Pasteur pipette. Each sample was prepared in duplicate. Volatiles were
extracted from the Tenax traps with 1 mL diethyl ether. The sample was concentrated by
passing nitrogen over the solution leaving a small amount of sample (20-30 µL) and 1µL
was then injected splitless onto the column. Measurements were performed on a GC (HP
5890, Hewlett-Packard, Palo Alto, CA) with the same type of column and the same
conditions as for the GC-MS measurements. The end of the column was split 1:1 between
flame ionization detector (FID) and an ODO-1 olfactory detector outlet (SGE
International Pty. Ltd, Australia). Nitrogen bubbled through water to add moisture was
used to drive the sample to the sniffer port. Two trained panelist with former experience
in describing seafood odor sniffed the effluent. Description of each odor and its duration
in time was recorded and the intensity evaluated using a category scale with a description
of intensity of odor at each score (47-48); 0 none; 0.5 thresholds or just detectable; 1

6
slight; 2 little; 3 moderate; 4 strong and 5 very strong. GC-O analysis were done on days
4, 10 and 17.
Identification of volatiles was done by matching retention indices (RI) of ethyl esters
and mass spectra of samples with authentic standards (Sigma-Aldrich Chemical Co. St.
Louis, MO, USA). Tentative identifications were based on the MS library data in the HP
GCD ChemStation software (Hewlett Packard Co, 1997) and manually checked against
literature sources and the database Flavornet (49).
Electronic nose measurements The electronic nose instrument (FreshSense, Bodvaki-
Maritech, Kópavogur, Iceland) is based on four electrochemical gas sensors: CO, H2S,
SO2 (Dräger, Luebeck, Germany); NH3 (City Technology, Portsmouth, Britain). The
measurements were performed at room temperature as described earlier (9).
Approximately 500g of fish fillets were weighted and tempered for 30 minutes in the
sampling container (2.3 L, Ø 17 cm). Measurement time was 5 minutes and temperature
of fillets reached 8 to 12°C before measurements started. All measurements were done in
duplicate.
TVB-N and pH measurements. Total volatile basic nitrogen content (TVB-N) was
measured by the steam distillation method described by Malle and Poumeyrol (50). The
pH was measured in 5 grams of mince moistened with 5 mL of deionized water. The pH
meter was calibrated using buffer solutions of pH 7.00 ± 0.01 and 4.01 ± 0.01 (25°C)
(Radiometer Analytical A/S, Bagsvaerd, Denmark).
Data analysis. Statistical analysis was carried out with the Number Cruncher
Statistical Software (NCSS) 2000, using ANOVA. In case of statistical significance, the
Duncan's multiple range was performed. An effect was considered significant at the 5%
level.
RESULTS AND DISCUSSION
Volatile compounds in cod fillets analyzed by GC – potential quality indicators
Volatile compounds detected in the highest level by GC-MS and dominating SSO:
TMA, 2-methyl-1-propanol (isobutanol) and 3-hydroxy-butanone (acetoin) were detected
in the highest amount in cod fillets and their levels increased with storage time (Table 1).

7
However, dynamic changes in their level were noticed, which could be related to the
growth of the spoilage bacteria. An initial decline of the pH (Fig. 1) could be explained
by the post mortem changes in chilled fish which are initially dominated by autolytic
activity, including degradation of nucleotides, accumulation of hypoxhanthin, lowering
of pH and endogenous enzyme activity (51). Proliferation of the microflora follows these
changes and development of microbial metaboliltes contributing to spoilage changes as
seen by increased pH value coinciding with the detection of trimethylamine (TMA) and
higher TVB-N values on day 12 (Fig. 1). TMA has been suggested as a spoilage indicator
since its level increases at later stages of storage (29), while DMA (dimethylamine)
which forms enzymically very early after harvest of fish has been suggested as a
freshness indicator along with its precursor TMAO (trimethylamine oxide) (24).
In the parallel study on sensory and microbiological changes of packed cod fillets (46)
the shelf-life was determined as 12 days by sensory analysis using the Torry scheme (16).
TMA and acetoin which were present in the highest concentration on day 12 (Table 1)
have earlier been associated with dominating P. phosphoreum growth (40). Increasing
levels of acetoin were detected on day 7 coinciding with a rapid P. phosphoreum growth
reaching counts of log 7.2 CFU/g at sensory rejection. P. phosphoreum was identified as
the main SSO in the cod fillets based on its high counts throughout the storage time and
was found in the highest levels (12.6 %) at the end of shelf-life, while Pseudomonas spp.
and H2S-producing bacteria represented 4.9 % (log 6.6 CFU/g) and 7% (log 7 CFU/g),
respectively, of the total microflora at sensory rejection. (46).
The variation in GC analysis for duplicate samples was high for the very volatile
compounds like TMA and ethanol (Table 1), most likely because of their high
breakthrough volume on the Tenax and also the fact that in some cases compounds with
RI<173 coeluted and made both identification and quantification difficult. This was the
case for ethanol, TMA and dimethyl sulfide as well as 2-methyl-1-propanol which was
also identified as pentane in the MS library database (Table 1).
Characteristic odor of cod fillets: The overall odor of the fillets was observed as a
mild and sweet odor that became sour, fruity and stale during storage and much less
potent odors developed on the fillets than are generally observed on whole fish.
Characteristic odor development during storage of the fillets could be explained by the
odor description and odor scores for the individual compounds analyzed by GC-O (Table

8
1). The odor impact of the different compounds was also evaluated based on their amount
in the samples measured by GC-MS and the reported odor threshold (OU (Odor Unit) =
PAR / odor threshold x 1000) to determine the potential contribution of the individual
compounds at sensory rejection on day 12. The GC-O scores were generally low but
increased with storage time in agreement with the increased level of the compounds
measured by GC-MS. The values and ranges of the GC-O odor scores detected on days 4,
10 and 17 are shown in Table 1. The most potent odor described as spicy, flowery, sweet,
onion and mushroom-like, was detected at RI 457 in all samples during storage, with
increasing odor scores with time of 3 (moderate) to 4.8 (very strong). This complex odor
is most likely contributed by coeluting compounds in low concentrations which were not
detected by GC-MS. Aldehydes appeared to influence the characteristic odors of the fresh
fillets throughout the whole storage time and decanal had the highest odor impact as
evaluated by OU (1200-24000), but 3-methyl-butanal and heptanal, probably in
combination with methional and 2-heptenal that are known to coelute at the same
retention time (12), received the highest odor scores of the aldehydes by GC-O (Table 1).
TMA is a potent odorant with a characteristic fishy, dried fish, ammonia-like odor as
detected by GC-O and received high odor scores. The odors of esters and sulfur
compounds were detected by GC-O at advanced spoilage on day 17.
The calculated odor unit values for the volatiles detected by GC-MS on day 12 when
the end of shelf-life was determined by sensory analysis are shown in Table 1. The
reported odor threshold of TMA varies but values as low as 0.3 ppb have been reported
(52) (Table 1). The calculated OU based on the different odor thresholds showed that
TMA had by far the highest odor impact on day 12 with two to three orders of magnitude
higher OU than the straight chain aldehydes (nonanal and decanal) that appeared to have
a high odor impact as well, based on their odor threshold values. The high levels of
acetoin suggested that this compound could contribute to the onset of spoilage odors in
cod fillets (Table 1). The odor of acetoin has been described as butter- cream like (49),
but a mild, sweet-sour like odor was detected by GC-O (Table 1). However, acetoin
appeared to have less odor impact (OU=119) than the aldehydes (decanal and nonanal)
because of its higher odor threshold (800 ppb), even though it was present in much higher
levels. Aldehydes have generally low odor thresholds (~ 0.1 to 4.5 ppb) and therefore
their odor impact was greater than the alcohols (odor thresholds range 0.4 to 270 ppm)

9
and the ketones (odor thresholds range 0.05 to 70 ppm) although their overall levels were
less (Table 1). It appears that even though the alcohols like 2-methyl-1-propanol and
aldehydes like decanal were detected in lower levels on day 12 than on day 10 (p<0.05),
the presence of the more potent odorants like TMA on day 12 overpowered the odor and
contributed to the sensory rejection of the fillets. Ethyl acetate was first detected on day
12 and probably also influenced the overall spoilage odor development based on its OU
value (0.1-120) in combination with the other compounds detected on day 12.
Additionally, the change in the pH value on day 12 may have influenced the overall odor
perception and synergistic effects may have occurred. For example, TMA has been noted
for intensifying fishiness by a synergistic action with certain volatile unsaturated
aldehydes derived from autoxidation of polyunsaturated fatty acids (53). The possible
influence of other compounds present in lower levels like the unsaturated autoxidatively
derived aldehydes should not be overlooked, but the sampling techniques used in our
study were not sensitive enough to allow detection of these compounds. The main aim
was to detect the compounds present in the highest concentration in the headspace for
evaluation of potential quality indicators for electronic nose detection.
Alcohols, carbonyls, esters and acids. The dynamic changes in the levels of the most
abundant alcohols, esters, acids and carbonyls are demonstrated in Figs. 2 and 3. Ethanol
was detected in high levels initially, followed by an increase in 2-methyl-1-propanol, 3-
methyl-1-butanol, 2,3-butandiol, 3-methyl-butanal, and ethyl acetate (Fig. 2). The early
detection of the ethanol and 2-methyl-1-propanol is of interest to monitor the initial
changes related to the loss of freshness before the obvious spoilage signs appear.
However, their levels did not increase continuously with time.
The initial production of ethanol in spoilage of fish has been related to the utilization
of carbohydrate sources, while the formation of branched-chain alcohols and aldehydes
like 2-methyl-1-propanol, 3-methylbutanol and 3-methyl-butanal probably originate from
degradation of valine and leucine, respectively (28). The branched chain aldehyde, 3-
methyl butanal, is characterized by a malty and caramel like odors (54), which was
perceived as a sweet, caramel and fish fillet like odor by GC-O (Table 1). The
corresponding alcohol 3-methyl-1-butanol, and 2-methyl-1-propanol exhibit alcoholic
and fruity odours. 3-methyl -1-butanol was first detected on day 10 and significant
continuous increases (p<0.05) were seen with time. Levels of 2-methyl-l-propanol were

10
much higher but as discussed above its level fluctuated with time. The flavor thresholds
of the alcohols are high compared with the carbonyls and their odors were not detected
by GC-O and therefore they probably did not contribute much to the overall odor of the
fillets as seen by the low OU value on day 12 (Table 1). On the basis of odor evaluation
3-methyl-butanal in combination with acetaldehyde, methional, 1,5-octadiene-3-one, 2,6-
nonadienal and 2,4-decadienal were determined as character impact odorants of boiled
cod and the malty flavour of 3-methyl butanal was suggested to be mainly responsible for
the malty off flavor defect of boiled cod by Milo and Grosch (55).
The formation of acetic acid and a decline in the ethanol level were observed on day
10 followed by the detection of ethyl acetate at the end of the shelf-life on day 12 and a
sickenly sweet odor detected by GC-O on day 17 and identified as ethyl butanoate. The
formation of esters suggested the activity of Pseudomonas fragi (18). At the end of the
shelf-life on day 12 the counts of Pseudomonas spp. reached log 6.6 CFU/g (data from
the parallel study) (46) and increasing level of ethyl acetate was seen on day 14 and much
higher levels on day 17 at overt spoilage (Table 1). Esters have low odor thresholds and
are known to contribute to sweet and fruity spoilage odors at advanced stages of spoilage.
Similarly, ethanol, 3-methyl-1-butanol, 2-methyl-1-propanol, 3-hydroxy-2-butanone,
ethyl acetate and butanoic acid ethyl ester were the most abundant volatiles in the
headspace of haddock stored in ice associated with the growth of Pseudomonas spp. in an
earlier study on packed haddock fillets stored under chilled conditions (56).
Pseudomonas species have also been found responsible for the formation of volatile
sulfides, alcohols (3-methyl-1-butanol, 1-penten-3-ol) and ketones (2-butanone)
contributing to the stale and putrid off odors in fish because of amino acid and lipid
degradation (18, 19).
Much higher levels of 3-methyl-1-butanol, 2,3-butandiol, 2-methyl-1-propanol, TMA,
ethyl acetate and acetoin were detected on days 14 and 17 compared to day 12 when the
end of sensory shelf-life was reached (Table 1). The late development of the spoilage
indicators is in agreement with studies on spoilage indicators for cultured and wild sea
bream stored in ice for 23 days (31). TMA, 3-methyl-1-butanol, 1-penten3-ol, piperidine,
methanethiol, dimethyl disulfide, dimethyl trisulfide, and acetic acid were suggested as
spoilage indicators and the increase in the levels of most of the compounds were detected

11
around day 10 of storage, however, methyl mercaptan and dimethyl trisulfide appeared to
accumulate later when the products were already spoiled.
Ketones: The formation of microbially derived acetoin was characteristic for the
spoilage of chilled cod fillets as discussed above. Levels of acetoin increased earlier than
TMA and therefore, it is more useful to monitor the loss of freshness as an early indicator
of spoilage. Acetoin can be formed from carbohydrate sources via pyruvate and diacetyl,
however the mechanism of its formation in fish is not well known but acetoin and
diacetyl have been suggested as early indicators of spoilage in beef (57). The
concentration of acetoin was much higher than the other lipid derived ketones detected
like 2-butanone and 3-pentanone and carotenoid derived 6-methyl-5-heptene-2-one (Fig
3) that were present in cod fillets throughout storage but no obvious increase occurred
until at the end of shelf-life and during continued storage (Fig. 3). Ketones can influence
the overall odor because of their typical odors and their low odor thresholds (Table 1).
Butanone has a butterscotch odor and pentanone a sweet fruity odor (58), but a sweet,
caramel like odor was detected by GC-O for 3-pentanone (Table 1).
Aldehydes: The straight chain lipid derived aldehydes, hexanal, heptanal, nonanal,
decanal and undecanal were detected in the cod fillets throughout the storage time. Their
levels did not appear to increase until after the end of shelf life was reached (Table 1).
Therefore, they did not appear to be useful as indicators of spoilage during chilled storage
of the cod fillets, but aldehydes have been suggested as indicators of spoilage in fatty
species (45). These compounds exhibit green, fatty, soapy, tallowy odors and hexanal is
characterized by green odor (58). The aldehydes most likely contributed to the overall
mild and sweet odors of the fillets since their odor threshold is low and therefore they are
likely to have high odor impact as seen by the high odor unit for these compounds (Table
1). Based on the GC-O it is suggested that the lipid derived ketones in combination with
3-methyl-butanal and aldehydes like hexanal, nonanal and decanal, contributed to the
characteristic sweet, caramel, and flowery odor of the cod fillets. Oxidation of fatty acids
contributes to the rancid odors of fish with the formation of aldehydes like hexanal, 2,7-
heptadienal, and 2,4,7-decadienal (44, 59). The unsaturated aldehydes were not detected
by GC-MS in this study using the surface stripping sampling of the volatiles.
Odor of fresh cod fillets is typically characterized by a very mild and pleasant, marine
like odor and aroma active compounds contributing to the fresh fish odors are present in

12
very low concentrations (14). Species specific odors of fresh fish are contributed by long
chain alcohols and carbonyl compounds like 1,5-octadien-3-ol and 2,6-nonadienal,
respectively, that are derived from polyunsaturated fatty acids (60). These compounds are
more pronounced on the skin than in the muscle and were not detected in the fillets using
the sampling conditions herein. However, an earthy and potato-like odor was detected by
GC-O at the same retention time as heptanal which is most likely caused by low levels of
methional and 4-heptenal eluting at the same retention time (12). These compounds were
identified earlier as the most potent odorants in boiled cod (55).
Electronic nose and GC-MS analysis of the main classes of compounds in cod
fillets during storage
Quality indicators: The sum of the peak area ratio (PAR) for all the volatile
compounds detected in cod fillets by GC-MS showed that the total amount of volatiles
increased with storage and alcohols, ketones and TMA (amines) were present in the
highest amount (Table 2). On day 4 the alcohols were the most abundant of the volatiles
(29%), mainly contributed by ethanol. Again on day 7 the alcohols were still the most
abundant volatiles (45%) and 2-methyl-1-propanol was detected in the highest level. The
ketones (36%) increased considerably on day 10 with the development of acetoin and
acid (2%) was first detected on day 10. At sensory rejection on day 12 the ketones were
detected in the highest level (33 %) followed by amines (TMA) (29%), alcohols (15%),
acids (4%), aldehydes (3%) and low level of esters (ethyl acetate) (<1%). Esters and
acids were not detected during early storage and sulfur compounds were only detected in
low levels (Table 2) as expected since these compounds are typically produced at
advanced spoilage of seafood (18-20, 27, 14, 32). TMA was the most abundant volatile
compound at advanced spoilage on day 17 and alcohols and ketones were also in high
levels but in addition the level of esters had increased considerably comprising 8% of the
total PAR (Table 1).
Miscellaneous classes of compounds: Although alcohols, aldehydes, ketones, acids,
sulfur compounds, esters and acids are primarily of interest as spoilage indicators of fish,
other classes of compounds were also present in the headspace, which may have an
impact when measuring the total headspace with electronic noses. The concentration of
the straight chain alkanes (nonane, decane and undecane) appeared to be similar
throughout storage. Additionally, numerous branched chain alkanes were identified by

13
the MS library database, but their RIs (retention indices) were not confirmed and
therefore, they were classified with the group “unknown” which represented compounds
that remained unidentified. The alkanes will not influence the responses of the
electrochemical sensors of the electronic nose and are not considered of interest as
quality indicators since they are not aroma active.
Compounds classified as “others” appeared to increase with storage time. Among
these compounds were some odorous compounds like piperidine which was tentatively
identified. Piperidine has been reported earlier in low levels in fish and has been
associated with 1,5-diaminopentane (cadeverine) (61). Piperidine was earlier suggested
as quality indicator of sea bream (31). The terpene derivative limonene was also
classified with “other” compounds but did not show an increasing trend with time. The
origin of limonene in fish has been related to the diet derived from plant sources (31).
Limonene has low odor threshold and a fresh lemon odor was detected by GC-O analysis,
suggesting that it may have an impact on the overall odor of fish fillets (Table 1).
The aromatics detected were mainly benzene derivatives. Styrene and chloroform
were most abundant and were found to increase with storage. Styrene was also identified
in wild and cultured sea bream packed in polystyrene boxes during chilled storage (31).
The odor of styrene is described as kerosene like and has been associated with off odors
in surimi based products related to the growth of yeasts (62). However, it is speculated
that both styrene and chloroform could be originating from the Styrofoam boxes,
however this was not confirmed. Tainting from the packaging may be of concern when
monitoring spoilage changes with an electronic nose, if the sensors are sensitive to the
respective compounds. Therefore, it is very important to analyze the total headspace by
gas chromatography and understand the origin of the suggested quality indicating
compounds prior to the selection of suitable sensors for monitoring the relevant spoilage
changes.
Electronic nose measurements: The results of the electronic nose measurements
showed that the response of the CO sensor was much higher than the other sensors’
responses (H2S, SO2 and NH3) and significant increase (p<0.05) was first observed
between days 7 and 10, and thereafter a continuous increase occurred (Fig. 4). Earlier
studies have shown that the main classes of spoilage indicator compounds present in the
headspace of fish can be estimated based on the individual sensor responses (63, 9).

14
Selected standard compounds representing the main classes of compounds causing
spoilage odors showed that the CO sensor is sensitive to alcohols, aldehydes and esters.
The NH3 sensor is sensitive to amines and the H2S and SO2 sensors can detect sulfur
compounds. The comparison of the electronic nose measurements and the GC analysis
has some drawbacks related to the different sampling techniques used. Therefore, the
results are only a semiquantitative approach to screen the major changes in the
composition of the volatiles and the electronic nose responses can be partly explained by
comparison to the compounds identified in the highest concentration by the GC-MS.
Based on the electronic nose responses it appears that only the CO sensor was useful
to monitor the changes in volatiles during storage. The increasing PAR for alcohols,
aldehydes and esters (Table 2) could explain the increasing CO sensor response with time
based on its sensitivity towards these classes of compounds. It is of interest that much
higher responses were observed for the CO sensor in an earlier study of haddock fillets
stored under identical conditions as the cod fillets at the end of shelf-life. This can be
explained by higher levels of alcohols and esters produced by the SSO in the haddock
fillets (56). Although P. phosphoreum was also identified as the main SSO in the
haddock fillets, high counts of Pseudomonas spp were observed at sensory rejection. The
pseudomonads are not able to reduce TMAO to TMA (64) and therefore, they may have
contributed to the higher levels of alcohols because of their metabolism and need for
hydrogen acceptors, hence favouring the production of alcohols. Therefore, the dynamic
spoilage changes and development of volatiles are dependent on the combination of the
dominating SSO.
The detection of the high level of acetoin produced in cod fillets was not achieved by
the electronic nose since none of the sensors is sensitive to ketones. The ketones, mainly
acetoin, increased continuously with storage (Fig. 3) and appeared to be promising
indicators for cod fillets packed in styrofoam boxes. Improvements should be made to
include selective sensors in the electronic nose for the detection of ketones.
The NH3 sensor’s response increased first on day 14 although not significantly
because of the high standard deviation. The high standard deviations for replicate
samples for both the electronic nose and GC analysis, was partly caused by the influence
of the temperature on the very volatile compounds during sampling (56, 65). Although
high levels of TMA were detected by GC–MS on day 12 in agreement with high TVB-N

15
level (48.5 mgN/100g), the NH3 sensor was not sensitive enough to detect this. Higher
responses for the NH3 sensor were observed in earlier studies for both shrimp and capelin
but in these products TVB-N levels were higher than in cod fillets (66-67, 63, 8, 68).
The low response of the H2S and SO2 sensors suggested that the H2S-producing
bacteria were not important in the development of spoilage odors in packed cod fillets in
agreement with the GC-MS analysis. Dimethyl sulfide was detected on day 4 suggesting
that this compounds was most likely not associated with microbial spoilage but rather
reflected the feeding conditions as has been suggested by others (69). Sulfur compounds
like hydrogen sulfide and methylmercaptan, which are produced by microbial
degradation of fish constituents (70-71) were not detected, but GC-O analysis on day 17
indicated that dimethyl trisulfide was present in the spoiled fillets (Table 2). Sulfur
compounds contribute to potent spoilage odors because of their low odor thresholds
(Table 2). Earlier studies using the FreshSense electronic nose have shown increasing
response of the H2S and SO2 sensors at advanced spoilage of whole capelin and redfish
(66, 8-9), but response to fillets of cod and haddock is generally low (56, 72).
CONCLUSION
Analysis of volatile compounds during storage of packed cod fillets by gas
chromatography showed that acetoin and TMA were produced in the highest and
increasing amounts coinciding with the growth of P. phosphoreum which was identified
as the dominating SSO in the parallel study. The response of the electronic nose’s CO
sensor was explained by the increasing level of alcohols during storage like ethanol, 2-
methyl-1-propanol and 3-methyl-1-butanol in addition to the presence of aldehydes and
the formation of esters at the end of the shelf-life. At sensory rejection of the packed cod
fillets on day 12, the ketones were detected in the highest level (33 %) followed by
amines (TMA) (29%), alcohols (15%), acids (4%), aldehydes (3%) and a low level of
esters (ethyl acetate) (<1%). It is suggested that selective sensors for the detection of
these classes of compounds could be used for monitoring spoilage changes in different
fish products because similar volatile compounds emerge in the products. The CO sensor
is useful for detecting incipient spoilage since its levels increased significantly between
days 7 and 10. None of the sensors in the electronic nose was sensitive to ketones and
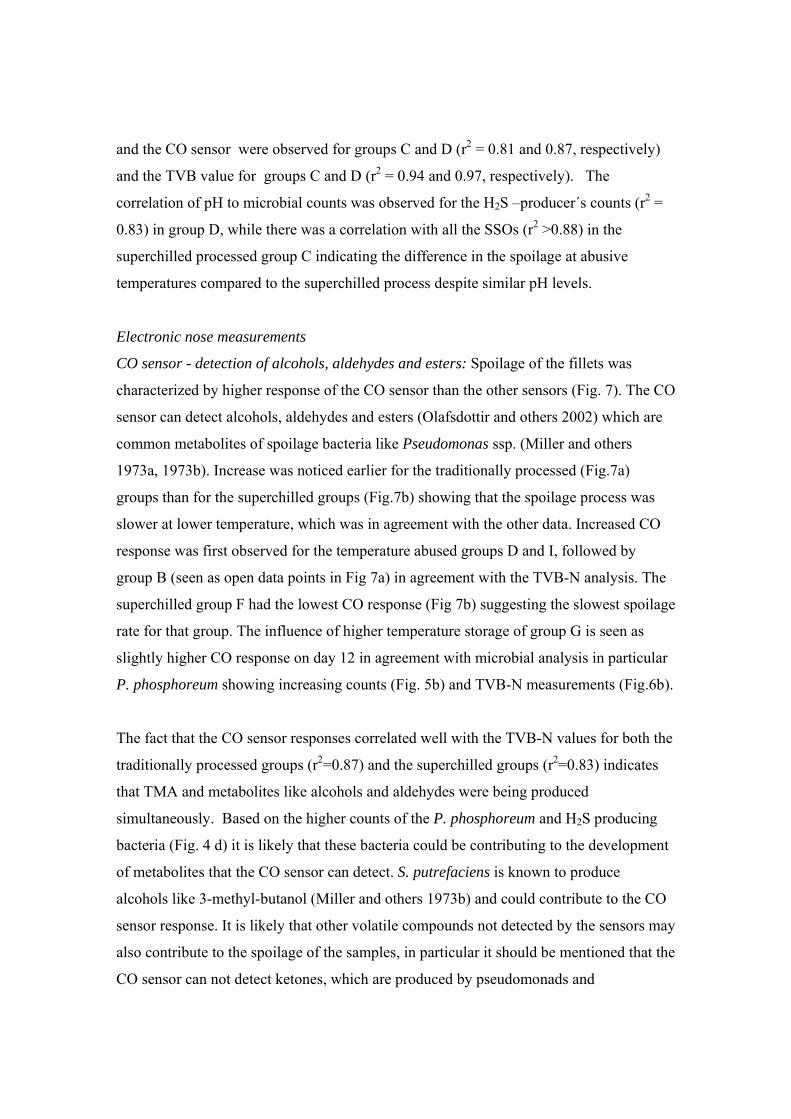
16
acids and therefore selective sensors for these components would be useful to monitor
spoilage of cod fillets in addition to a more sensitive sensor for the detection of TMA.
Increased sensitivity of existing methods is required for monitoring of quality
deterioration and the early detection of microbially produced compounds. Low levels of
sulfur compounds in the cod fillets suggested that S. putrefaciens was not very important
in the spoilage of chilled cod fillets stored in styrofoam boxes.
However, because of the complexity of the spoilage processes caused by the diversity
of the microflora and their different spoilage potential, it is likely that fixed values to
determine the end of shelf-life or the quality of fish fillets based on electronic nose
responses or amount of the main classes of compounds will have to be developed for
each product and the respective storage conditions.
ABBREVIATIONS USED
GC-MS, gas chromatography-mass spectrometry; GC-O, gas
chromatography-olfactometry; IFL, Icelandic Fisheries Laboratories; ATD, automated
thermal desorber; RI, retention index; TMA, trimethyl amine; TVB-N, total volatile basic
nitrogen; OU, odor unit; PAR, peak area ratio; SSO, specific spoilage organisms.
ACKNOWLEDGMENT
The authors thank The Icelandic Centre for Research for partly financing the project.
The staff of IFL is thanked for their valued contribution in chemical, microbial and
sensory analysis of samples.

17
REFERENCES
(1) Schaller, E.; Bosse, J.O.; Escher, F. 'Electronic noses' and their application to food. Lebensm.-Wiss.
Technol. 1998, 31, 305-316.
(2) Gardner, J.W., Bartlett, P.N. Electronic noses. Principles and applications, Oxford University Press:
Oxford, England, 1999.
(3) Haugen, J.E. Electronic noses in food analysis. In Headspace Analysis of Food and Flavors: Theory
and Practice; Rouseff, R.L., Cadwallader, K.R., Eds.; Kluwer Academic / Plenum Publishers: New
York, 2001; pp. 43-57.
(4) Ólafsson, R.; Martinsdóttir, E.; Ólafsdóttir, G.; Sigfússon, Þ.I.; Gardner, J.W. Monitoring of fish
freshness using tin oxide sensors. In Sensors and Sensory Systems for an Electronic Nose; Gardner,
J.W., Bartlett, P.N., Eds.; Kluwer Academic Publ.: Amsterdam, The Netherlands, 1992; pp. 257-272.
(5) Schweizer-Berberich, M.; Vahinger, S.; Göpel, W. Characterization of food freshness with sensor
array, Sens. Act. 1994, B, 18-19, 282-290.
(6) Di Natale, C.; Brunink, J.A.J.; Bungaro, F.; Davide, F.; d´Amico, A.; Paolesse, R.; Boschi, T.;
Faccio, M.; Ferri, G. Recognition of fish storage time by a metalloporphyrins-coated QMB sensor
array. Meas. Sci. Technol. 1996, 7, 1103-1114.
(7) Di Natale, C.; Olafsdottir, G.; Einarsson, S.; Mantini, A.; Martinelli, E.; Paolesse, R.; Falconi, C.;
D’Amico, A. Comparison and integration of different electronic noses for the evaluation of freshness
of cod fish fillets. Sens. Act. 2001, B77, 572-578.
(8) Olafsdottir, G.; Högnadottir, A.; Martinsdottir, E.; Jonsdottir, H. Application of an electronic nose to
predict total volatile bases in capelin (Mallotus villosus) for fishmeal production. J. Agric. Food
Chem. 2000, 48, 2353-2359.
(9) Olafsdottir, G.; Xiuchen, L.; Lauzon, H.; Jonsdottir, R. Precision and application of electronic nose
for freshness monitoring of whole redfish stored in ice and modified atmosphere bulk storage. J.
Aquat. Food Prod. Technol. 2002, 11, 229-249.
(10) Zhao, C.Z.; Pan, Y.Z.; Ma, L.Z.; Tang, Z.N.; Zhao, G.L.; Wang, L.D. Assay of fish freshness using
trimethylamine vapor probe based on a sensitive membrane on piezoelectric quartz crystal. Sens.
Act. 2002, B81, 218-222.
(11) Haugen, J.E.; Undeland, I. Lipid oxidation in herring fillets (Clupea harengus) during ice storage
measured by a commercial hybrid gas-sensor array system. J. Agric. Food Chem. 2003, 51, 752-759.
(12) Jonsdottir, R.; Olafsdottir, G.; Martinsdottir, E.; Stefansson, G. Flavor Characterization of Ripened
Cod Roe by Gas Chromatography, Sensory Analysis and Electronic Nose. J. Agric. Food Chem.
2004, 52, 6250-6256.

18
(13) Lindsay, R.C. Fish flavors. Food Rev. Int. 1990, 6, 437-455.
(14) Olafsdottir, G.; Fleurence, J. Evaluation of fish freshness using volatile compounds - Classification
of volatile compounds in fish. In Methods to Determine the Freshness of Fish in Research and
Industry; Olafsdottir, G., Luten, J., Dalgaard, P., Careche, M., Verrez-Bagnis, V., Martinsdottir, E.,
Heia, K., Eds.; International Institute of Refrigeration: Paris, France, 1998; pp. 55-69.
(15) Elliot, R.P. Evaluation of surface pH as a freshness index for fish fillets. Food Research. 1947, 12
(2), 87-98.
(16) Shewan, J.M.; Macintosh, R.G.; Tucker, C.G.; Ehrenberg, A.S.C. The development of a numeric
scoring system for the sensory assessment of the spoilage of wet white fish stored in ice. J. Sci. Food
Agric. 1953. 4, 283-298.
(17) Castell, C.H.; Greenough, M.F. The action of Pseudomonas on fish muscle: 1. Organisms
responsible for odour produced during incipient spoilage of chilled fish muscle. J. Fish. Res. Board
Can. 1957, 12, 617-625.
(18) Miller III, A.; Scanlan, R.A.; Lee, J.S.; Libbey, L.M. Identification of the Volatile Compounds
Produced in Sterile Fish Muscle (Sebastes melanops) by Pseudomonas fragi. Appl. Microbiol. 1973,
25, 952-955.
(19) Miller III, A.; Scanlan, R.A.; Lee, J.S.; Libbey, L.M. Volatile compounds produced in sterile fish
muscle (Sebastes melanops) by Pseudomonas putrifaciens, Pseudomonas fluorescens, and an
Achromobacter species. Appl. Microbiol. 1973, 26, 18-21.
(20) Miller III, A.; Scanlan, R.A.; Lee, J.S.; Libbey, L.M.; Morgan, M.E. Volatile compounds produced
in sterile fish muscle (Sebastes melanops) by Pseudomonas perolens. Appl. Microbiol. 1973, 25,
257-261.
(21) Herbert, R.A.; Shewan, J.M. Roles played by bacterial and autolytic enzymes in the production of
volatile sulphides in spoiling North Sea cod (Gadus morhua). J. Sci. Food Agric. 1976, 27, 89-94.
(22) Lerke, P.; Huck, R.W. Objective determination of canned tuna quality: Identification of ethanol as a
potentially useful index. J. Food Sci. 1977, 42, 755-758.
(23) Human, J.; Khayat, A. Quality Evaluation of Raw Tuna by Gas Chromatography and Sensory
Methods. J. Food Sci. 1981, 46, 868-873.
(24) Hebard, C.E.; Flick, G.J.; Martin, R.E. Occurrence and significance of trimethylamine oxide and its
derivatives in fish and shellfish. In Chemistry and Biochemistry of Marine Food Products; Martin,
R.E., Ed.; AVI Publishing Co., Inc.: Westport, Connecticut, 1982; pp. 149–304.
(25) Kelleher, S.D.; Zall, R.R. Ethanol accumulation in muscle tissue as a chemical indicator of fish
spoilage. J. Food Biochem. 1983, 7, 87-91.

19
(26) Ahmed, A.; Matches, J.R. Alcohol production by fish spoilage bacteria. J. Food Prot. 1983, 46,
1055-1059.
(27) Josephson, D.B.; Lindsay, R.C.; Olafsdottir, G. Measurement of Volatile Aroma Constituents as a
Means for Following Sensory Deterioration of Fresh Fish and Fishery Products. In Seafood Quality
Determination, Proceedings of an International Symposium, University of Alaska Sea Grant
Program, Anchorage, Alaska, U.S.A Kramer D.E.; Liston J. Eds.; Elsevier Science Publishers:
Amsterdam, The Netherlands, 1986; pp. 27-47.
(28) Lindsay, R.C.; Josephson, D.B.; Olafsdottir, G. Chemical and biochemical indices for assessing the
quality of fish packaged in controlled atmospheres. In Seafood Quality Determination, Proceedings
of an International Symposium, University of Alaska Sea Grant Program, Anchorage, Alaska,
U.S.A. Kramer D.E.; Liston J. Eds.; Elsevier Science Publishers: Amsterdam, The Netherlands,
1986; pp. 221-234.
(29) Oehlenschläger, J. Evaluation of some well established and some underrated indices for the
determination of freshness and/or spoilage of ice stored wet fish. In Quality Assurance in the Fish
Industry; Huss, H.H., Jakobsen, M., Liston, J.; Eds.; Elsevier Science Publisher: Amsterdam, The
Netherlands, 1992; pp 339-350.
(30) Jørgensen, L.V.; Dalgaard, P.; Huss, H.H. Multiple compound quality index for cold-smoked salmon
(Salmo salar) developed by multivariate regression of biogenic amines and pH. J. Agric. Food
Chem. 2000, 48, 2448-2453.
(31) Alasalvar, C.; Taylor, K.D.A.; Shahidi, F. Comparison of volatiles of cultured and wild sea bream
(Sparus aurata) during storage in ice by dynamic headspace analysis gas chromatography mass
spectrometry. J. Agric. Food Chem. 2005, 53, 2616-2622.
(32) Chinivasagam, H.N.; Bremner, H.A.; Wood, A.F.; Nottingham, S.M. Volatile components
associated with bacterial spoilage of tropical prawns. Int. J. Food Microbiol. 1998, 42, 45-55.
(33) Joffraud, J.J.; Leroi, F.; Roy, C.; Berdague, J.L. Characterisation of volatile compounds produced by
bacteria isolated from the spoilage flora of cold-smoked salmon. Int. J. Food Microbiol. 2001, 66
(3), 175-184.
(34) Jørgensen, L.V.; Huss, H.H.; Dalgaard, P. Significance of volatile compounds produced by spoilage
bacteria in vacuum-packed cold-smoked salmon (Salmo salar) analyzed by GC-MS and multivariate
regression. J. Agric. Food Chem. 2001, 49, 2376-2381.
(35) Gram, L.; Melchiorsen, J. Interaction between fish spoilage bacteria Pseudomonas sp. and S.
putrefaciens in fish extracts and on fish tissue. J. Appl. Bacteriol. 1996, 80, 589-595.
(36) Gram, L.; Ravn, L.; Rasch, M.; Bruhn, J.B.; Christensen, A.B.; Givskov, M. Food spoilage –
interactions between food spoilage bacteria. Int. J. Food Microbiol. 2002, 78, 79-97.

20
(37) Huss, H.H.; Dalgaard, P.; Gram, L. Microbiology of fish and fish products. In Seafood from
producer to consumer; intergrated approach to quality; Luten, J.B., Börresen, T., Oehlenschlager,
J., Eds.; Elsevier: Amsterdam, The Netherlands, 1997; pp. 413-430.
(38) Shewan, J.M. The bacteriology of fresh and spoiling fish and some related chemical changes. In
Recent Advances in Food Science; Hawthorn, J., Leitch, J.M., Eds.; Butterworths: London, 1962; 1,
167-193.
(39) Van Spreekens, K.J.A. The suitability of Long & Hammer's medium for the enumeration of more
fastidious bacteria from fresh fishery products. Arch. Lebensmitt. 1974, 25 (10), 213-219.
(40) Van Spreekens, K.J.A.; Toepoel, L. Quality of fishery products in connection with the psychrophilic
and psychrotrophic bacterial flora. In Psychrotrophic microorganisms in spoilage and pathogenicity;
Roberts, T.A., Hobbs, G., Christian, J.H.B., Skovgaard, N., Eds.; Academic Press: London, UK,
1981; pp. 283-294.
(41) Dalgaard, P.; Gram, L.; Huss, H.H. Spoilage and shelf life of cod fillets packed in vacuum or
modified atmospheres. Int. J. Food Microbiol. 1993, 19, 283-294.
(42) Dalgaard, P.; Mejlholm, O.; Christiansen, T.J.; Huss, H.H. Importance of Photobacterium
phosphoreum in relation to spoilage of modified atmosphere-packed fish products. Lett. Appl.
Microbiol. 1997, 24, 373-378.
(43) Dalgaard, P. Qualitative and quantitative characterization of spoilage bacteria from packed fish. Int.
J. Food Microbiol. 1995, 26, 319-333.
(44) McGill, A.S.; Hardy, R.; Burt, J.R. Hept-cis-4-enal and its contribution to the off-flavour in cold
stored cod. J. Sci. Food Agric. 1974, 25, 1477-1489.
(45) Aro, T.; Tahvonen, R.; Koskinen, L.; Kallio, H. Volatile compounds of Baltic herring analysed by
dynamic headspace sampling-gas chromatography-mass spectrometry. Eur. Food Res. Technol.
2003, 216, 483-488.
(46) Olafsdottir, G.; Lauzon, H.L.; Martinsdóttir, E.; Oehlenschläger, J.; Kristbergsson, K. Shelf-life
extension of superchilled cod (Gadus morhua) fillets and influence of temperature fluctuations on
microbial growth and metabolites. In press.
(47) ISO 1985. Sensory analysis – methodology - genereral guidance. ISO 6658. Geneva, Switzerland:
The International Organization for Standardization. 14 p.
(48) ISO 1987. Sensory analysis – methodology – evaluation of food products by methods using scales.
ISO 5124. Geneva, Switzerland: The International Organization for Standardization. 7 p.
(49) Acree T.;Arn, H. http://www.flavornet.org/flavornet.html; Flavornet, Cornell University, 1997.
(50) Malle, P.; Poumeyrol, M. A New Chemical Criterion for the Quality Control of Fish:
Trimethylamine/Total Volatile Basic Nitrogen (%). J. Food Prot. 1989, 52(6), 419-423.

21
(51) Huss, H.H. Quality and quality changes in fresh fish. FAO Fisheries Technical Papers - T348.
Rome: Food & Agriculture Organisation of the United Nations & Danish International Development
Agency (FAO/DANIDA). 1995; 195 p.
(52) Fazzalari, F.A., Ed. Compilation of Odor and Taste Threshold Data, ASTM Data Series DS 48A,
1978, Philadelphia, PA.
(53) Karahadian, C., Lindsay, R.C. Evaluation of compounds contributing characterizing fishy flavors in
fish oils. J. Am. Oil Chem. Soc. 1989, 66, 953-960.
(54) Sheldon, R.M.; Lindsay, R.C.; Libbey, L.M.; Morgan, M.E. Chemical nature of malty flavour and
aroma produced by streptococcus lactis. Appl. Microbiol. 1971, 22, 263-266.
(55) Milo, C.; Grosch, W. Changes in the odorants of boiled salmon and cod as affected by the storage of
the raw material. J. Agric. Food Chem. 1996, 44, 2366-2371.
(56) Olafsdottir G. Developing rapid olfaction arrays for determining fish quality. In Rapid and On-Line
Instrumentation for Food Quality Assurance; Tothill, I.E., Ed.; Woodhead Publishing Ltd:
Cambridge, England, 2003; pp. 339-360
(57) Dainty, R.H.; Edwards, R.A.; Hibbard, C.M. Time course of volatile compound formation during
refrigerated storage of naturally contaminated beef in air. J. Appl. Bacteriol. 1985, 59, 303-309.
(58) Curioni, P.M.G.; Bosset, J.O. Key odorants in various cheese types as determined by gas
chromatography-olfactometry. Int. Dairy J. 2002, 12, 959-984.
(59) Hardy, R.; McGill, A.S.; Gunstone, F.D. Lipid and autoxidative changes in cold stored cod (Gadus
morhua). J. Sci. Food Agric. 1979, 30, 999-1006.
(60) Josephson, D.B.; Lindsay, R.C.; Stuiber, D.A. Variations in the occurrences of enzymically derived
volatile aroma compounds in salt- and freshwater fish. J. Agric. Food Chem. 1984, 32, 1344-1347.
(61) Kawai T. Fish flavor. Crit. Rev. Food Sci. Nutr. 1996, 36, 3, 257-298.
(62) Koide, K.; Yanagisawa, I.; Ozawa, A.; Satake, M.; Fujita, T. Studies on the kerosene-like off-
flavour producing yeast in surimi-based products. Bull. Jap. Soc. Sci. Fish. 1992, 58, 1925-1930.
(63) Olafsdottir, G.; Högnadottir, A.; Martinsdottir, E. Application of gas sensors to evaluate freshness
and spoilage of various seafoods. In Methods to Determine the Freshness of Fish in Research and
Industry; Olafsdottir, G., Luten, J., Dalgaard, P., Careche, M., Verrez-Bagnis, V., Martinsdottir, E.,
Heia, K., Eds.; International Institute of Refrigeration: Paris, France, 1998; pp 100-109.
(64) Castell, C.H.; Greenough, F.; Dale, J. The action of Pseudomonas on fish muscle: 3. Identification of
organisms producing fruity and oniony odours. J. Fish. Res. Board Can. 1959, 16, 13-19.
(65) Mielle, P.; Marqui, F. An alternative way to improve the sensitivity of electronic olfactometers.
Sensors and Actuators 1999, B-Chemical 58(1-3), 526-535.

22
(66) Olafsdottir, G.; Martinsdottir, E.; Jonsson, E.H. Rapid gas sensor measurements to predict the
freshness of capelin (Mallotus villosus). J. Agric. Food Chem. 1997, 45, 2654-2659.
(67) Olafsdottir, G.; Martinsdóttir, E.; Oehlenschläger, J.; Dalgaard, P.; Jensen, B.; Undeland, I.; Mackie,
I.M.; Henehan, G.; Nielsen, J.; Nilsen, H. Methods to evaluate fish freshness in research and
industry. Trends Food Sci. Technol. 1997, 8, 258- 265.
(68) Zeng, Q.Z.; Thorarinsdottir, K.A.; Olafsdottir, G. Quality changes of shrimp (Pandalus borealis)
stored under different cooling conditions. In press J. Food Sci. 2005, accepted for publication.
(69) Ackman, R.G.; Hingley, J. Dimethyl sulfide as an odor component in Nova Scotia fall mackerel. J.
Fish. Res. Board Can. 1972, 29, 1085-1088.
(70) Herbert, R.A.; Ellis, J.R.; Shewan, J.M. Isolation and identifiaction of the volatile sulphides
produced during chill-storage of North Sea cod (Gadus morhua). J. Sci. Food Agric. 1975, 26, 1187-
1194.
(71) Kamiya, A.; Ose, Y. Study of the odorous compounds produced by putrefaction of foods. V. Fatty
acids, sulphur compounds and amines. J. Chromat. 1984, 292, 383-391.
(72) Tryggvadóttir, S.V.; Olafsdottir, G.; Einarsson, S. Multisensor for fish: Storage studies of cod in
Reykjavik and Tromsö. Texture, electronic nose (FreshSense), FIGD analysis, RT-Freshmeter and
sensory analysis. RF report 02-01. 2001; pp 19-24.
(73) Buttery, R.G.; Guadagni, D.G.; Ling, L.C.; Seifert, R.M.; Lipton, W. Additional volatile components
of cabbage, broccoli and cauliflower. J. Agric. Food Chem. 1976, 24, 829-832.
(74) Buttery, R.G.; Turnbaugh, J.G.; Ling, L.C. Contribution of volatiles to rice aroma. J. Agric. Food
Chem. 1988, 36, 1006-1009.
(75) Sheldon, R.M.; Lindsay, R.C.; Libbey, L.M.; Morgan, M.E. Chemical nature of malty flavour and
aroma produced by streptococcus lactis. Appl. Microbiol. 1971, 22, 263-266.
(76) Whitfield, F.B.; Tindale, C.R. The role of microbial metabolites in food off-flavours. Food Technol.
Australia, 1984, 36, 204-213.
(77) Buttery, R.G.; Teranishi, R.; Ling, L.C.; Turnbaugh, J.G. Quantitative and sensory studies on tomato
paste volatiles. J. Agric. Food Chem. 1990, 38, 336-340.

23
FIGURE CAPTIONS
Figure 1. Changes in pH (--∆--), development of TMA (-♦-) measured by GC-MS (PAR:
peak area ratio) and TVB-N (mgN/100g) (-■-) in cod fillets packed in styrofoam boxes
during storage at 0.5 °C. Vertical line indicates the end of shelf-life determined by
sensory analysis.
Figure 2. PAR (peak area ratio) for alcohols (ethanol (-♦-), 3-methyl-1-butanol (-■-),
2,3-butandiol (-▲-) and isobutanol (-∆-) detected in highest concentration and ethyl
acetate (-x-)-in cod fillets packed in styrofoam boxes during storage at 0.5 °C. Vertical
line indicates the end of shelf-life determined by sensory analysis.
Figure 3. PAR (peak area ratio) for ketones (6-methyl-5-hepten-2-one (-■-), 2-butanone
(-●-), 3-pentanone (-▲-), acetoin (-∆-)) and acetic acid (-x-) in cod fillets packed in
styrofoam boxes during storage at 0.5 °C. Vertical line indicates the end of shelf-life
determined by sensory analysis.
Figure 4. Response of the electronic nose sensors (CO, H2S, NH3 and SO2) towards cod
fillets during storage in styrofoam boxes at 0.5 °C on days 4, 7, 10, 12, and 14 after catch.

24
0
50
100
150
200
250
300
0 2 4 6 8 10 12 14 16
Days from catch
PAR
- TV
B-N
6.2
6.3
6.4
6.5
6.6
6.7
6.8
6.9
7.0
pH
TMA
TVB-N
pH
End of shelf-life
0
5
10
15
20
25
30
35
40
45
50
0 2 4 6 8 10 12 14 16
Days from catchPA
R
0
100
200
300
400
500
600
700
800
900
1000
PAR
(iso
buta
nol)
ethanol
3-methyl-1-butanol
2,3-butandiol
ethyl acetate
isobutanol
End of shelf-life
Figure 1 Figure 2
0
5
10
15
20
25
30
35
40
45
50
0 2 4 6 8 10 12 14 16
Days from catch
PAR
0
50
100
150
200
250
300
PAR
(ace
toin
)
6-me-5-hepten-2-one
2-butanone
3-pentanone
acetic acid
acetoin
End of shelf-life
-50
0
50
100
150
200
250
300
350
400
450
500
CO H2S NH3 SO2
Res
pons
e se
nsor
s (n
A)
4 7 10 12 14
Figure 3. Figure 4.

25
Table 1. Volatile compounds associated with spoilage in cod fillets during storage in styrofoam boxes at 0.5 °C for 17 days. PAR (peak area ratio) of compounds analyzed by GC-MS, odor descriptions and odor scores based on GC-O analysis and OU (odor unit) value of potent odorants at sensory rejection on day 12.
Compounds RIa Odor descriptionc Odor scored OUe Odor thresholdf ID meansg
Day 4 Day 7 Day 10 Day 12 Day 14 Day 17 Day 12 in waterAlcohols
ethanol <173 17.4 ± 20.7 - 13.1 ± 3.8 - - - - 100000 ppb [1] MS, RI2-methyl -1-propanol/ pentaneh <173 14.0 ± 1.4 85.4 ± 36.5 64.4 ± 13.2 35.0 ± 2.8 934.6 ± 1096.8 451.9 - 5 7000 ppb [1] MS, RI1-penten-3-ol 245 2.3 0.4 0.8 ± 0.1 1.2 ± 0.0 2.5 ± 1.7 - - 3 400 ppb [1] MS, RI3-methyl-1-butanol 300 - - 2.7 ± 2.4 8.5 ± 1.0 18.3 ± 6.2 31.6 ± 5.6 - 28-34 250-300 ppb [2] MS, RI2-methyl-1-butanol 306 - - - - 5.3 ± 2.7 - - MS, RI2,3-butandiol 359 - - 0.9 ± 1.2 4.0 ± 4.4 0.7 21.3 ± 30.1 - MS, RI2-ethyl-1-hexanol 633 - 2.0 ± 2.1 2.3 ± 1.0 1.8 ± 0.2 1.4 2.5 ± 1.1 - 270000 ppb [1] MS, RI
Aldehydesacetaldehyde <173 2.8 ± 0.8 1.4 ± 0.4 0.9 ± 0.6 0.8 ± 0.5 5.8 ± 4.4 7.5 ± 6.4 - 7-160 15-120 ppb [4] MS, RI3-methyl-butanal 227 - - 1.7 1.3 ± 0.2 2.6 1.2 sweet, caramel, fish fillet 1.5 - 3.0 22 60 ppb [5] MS, RI, GC-Ohexanal 378 1.9 2.1 ± 2.0 3.2 ± 1.2 2.0 ± 0.1 8.7 ± 6.2 - - 444 4.5ppb [6] MS, RIheptanal 501 - 2.4 1.7 ± 0.8 0.7 ± 0.2 2.9 ± 2.2 3.5 ± 1.8 earthy, boiled potato 2.0 - 3.0 233 3 ppb [1] MS, RI, GC-Ooctanal 606 - - 1.4 ± 0.6 - - - 0.7 ppb [1] MS, RInonanal 710 - 4.3 ± 3.7 6.3 ± 1.1 3.7 ± 0.6 10.2 ± 4.4 - - 3700 1 ppb [1] MS, RIdecanal 807 2.3 ± 0.2 2.5 ± 1.9 3.5 ± 0.4 2.4 ± 0.3 8.0 ± 4.2 14.9 ± 5.7 fresh, floral 1.5 1200 - 24000 0.1-2 ppb [1] MS, RI, GC-Oundecanal 910 - 0.6 ± 0.1 0.6 ± 0.1 0.4 ± 0.1 - 2.0 ± 1.1 sweet, candy 1.5 100 4 ppb [1] MS, RI, GC-O
Ketones2-butanone 191 14.3 ± 10.2 8.1 ± 1.1 9.0 - 24.0 ± 13.9 - - 50000 ppb [1] MS, RI3-pentanone 255 3.7 ± 3.2 8.5 ± 5.2 8.2 ± 3.9 13.6 ± 6.2 23.5 ± 17.7 34.6 ± 18.0 sweet, caramel 1.5 - 2.0 0.2 70000 ppb [1] MS, RI, GC-O3-hydroxy-2-butanone 273 2.6 ± 1.3 16.8 ± 20.8 90.3 ± 51.6 95.3 ± 5.6 259.2 ± 177.5 341.8 ± 129.3 sweet, sour 1.5 - 2.0 119 800 ppb [7] MS, RI, GC-O6-methyl-5-hepten-2-one 588 0.8 ± 0.2 0.9 ± 0.2 1.9 ± 0.4 1.0 ± 0.1 6.1 ± 4.1 5.4 ± 1.8 spicy, flowery 1.5 20 50 ppb [2] MS, RI, GC-O
Acidsacetic acid 191 - - 6.3 ± 4.2 14.2 ± 13.0 11.4 ± 4.3 15.5 - 0.4 34200ppb[3] MS, RI
AminesTMA <173 - - - 91.6 ± 28.5 922.2 ± 1064.2 1721.4 ± 47.6 TMA-like, dried fish 3.0 91600-305333 0.3-1 ppb [1] MS, RI, GC-O
Estersethyl acetate 200 - - - 0.6 6.6 ± 1.4 258.9 ± 330.0 - 0.1-120 5-5000ppb [1] MS, RIethyl butanoate 377 - - - - - 13.9 ± 2.2 sickenly sweet, vomit 2.3 MS, RI, GC-O
Sulfur compoundsdimethyl sulfide 173 4.5 - - - - - - 900 ppb [6] MS, RIdimethyl disulfide 312 - - - - - 1.2 onion like 1.5 - 2.5 12 ppb [2] MS, RI, GC-Odimethyl trisulfide 564 - - - - - - rotten, sulfur, cabbage 2.5 0.01ppb [2] GC-O
Unknown 457 - - - - - -spicy, fish, flowery, sweet, onion, mushroom 3.0 -4.8 GC-O
PARb
aRI: calculated retention index on DB-5ms capillary column; bPAR: peak area ratio, average of duplicate analysis ± standard deviation when detected in both samples or " - " if not detected; codor evaluated by GC-O; dGC-O odor scores (average value of two panelists) giving the range of scores on days 4, 10 and 17; eOU: odor unit calculated by dividing the PAR by the odor threshold value x 1000; fodor thresholds from literature: 1. Fazzalari, 1978 (52); 2. Buttery et al., 1976 (73); 3. Kawai 1996 (61); 4. Buttery et al., 1988 (74); 5. Sheldon et al., 1971 (75); 6. Whitfield and Tindale, 1984 (76); 7. Buttery et al., 1990 (77); gidentification on the basis of MS database,retention index and odor evaluation; hcoeluting peaks.
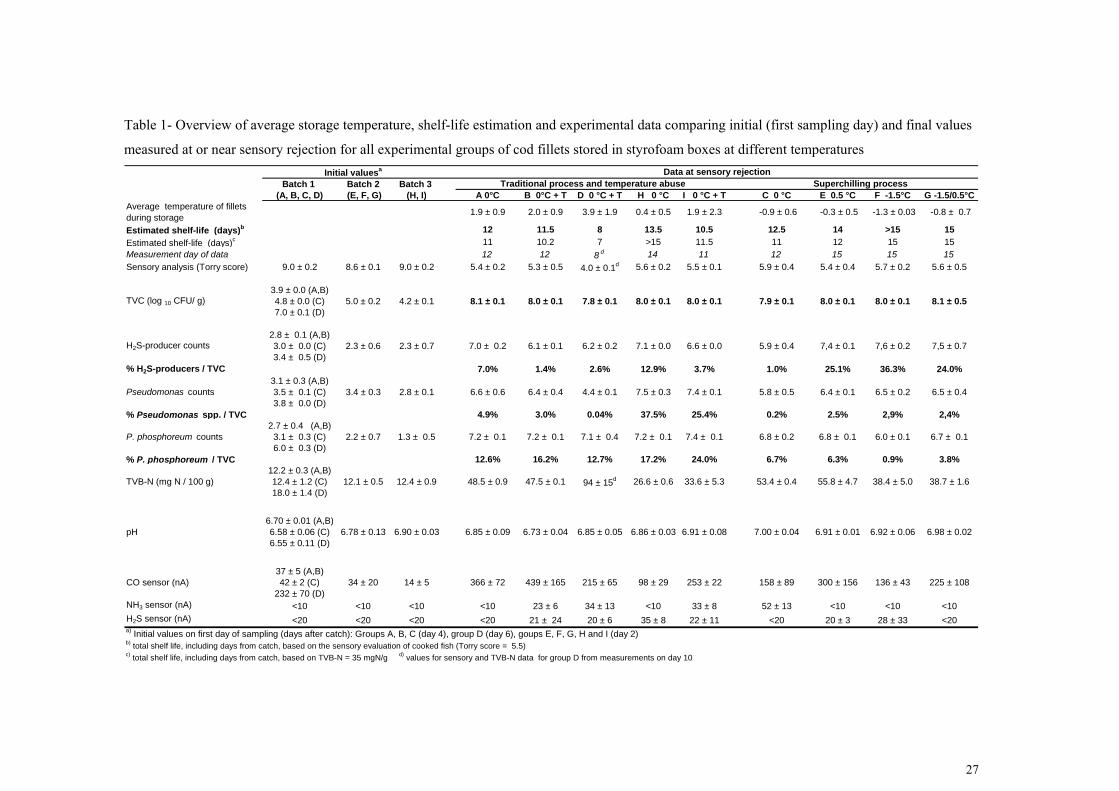
26
Table 2. PAR of main classes of compounds identified by GC-MS in cod fillets packed in styrofoam boxes during storage at 0.5 °C for 17 days
Class Day 4 Day 7 Day 10 Day 12 Day 14 Day 17
Quality indicatorsAlcohols 34 (29) 88 (45) 84 (28) 51 (15) 963 (39) 507 (15)Aldehydes 7 (6) 13 (6) 19 (6) 11 (3) 38 (2) 27 (1)Ketones 21 (18) 34 (18) 109 (36) 110 (33) 313 (13) 382 (11)Acids - - 6 (2) 14 (4) 11 (<1) 15 (<1)Amines - - - 92 (27) 922 (37) 1721 (51)Esters - - - 1 (<1) 7 (<1) 273 (8)Sulfur compounds 5 (4) - - - - 1 (<1)
MiscellaneousAlkanes 3 (3) 4 (2) 6 (2) 3 (1) 4 (<1) 3 (<1)Aromatics 17 (15) 39 (20) 40 (13) 22 (7) 80 (3) 76 (2)Other 5 (4) 5 (3) 3 (1) 12 (4) 97 (4) 351 (10)Unknown 26 (22) 10 (5) 36 (12) 17 (5) 28 (1) 44 (1)
Total volatiles 118 194 306 335 2464 3402
a PAR (peak area ratio) and percentage of total volatiles each day shown in parenthesis
PAR a
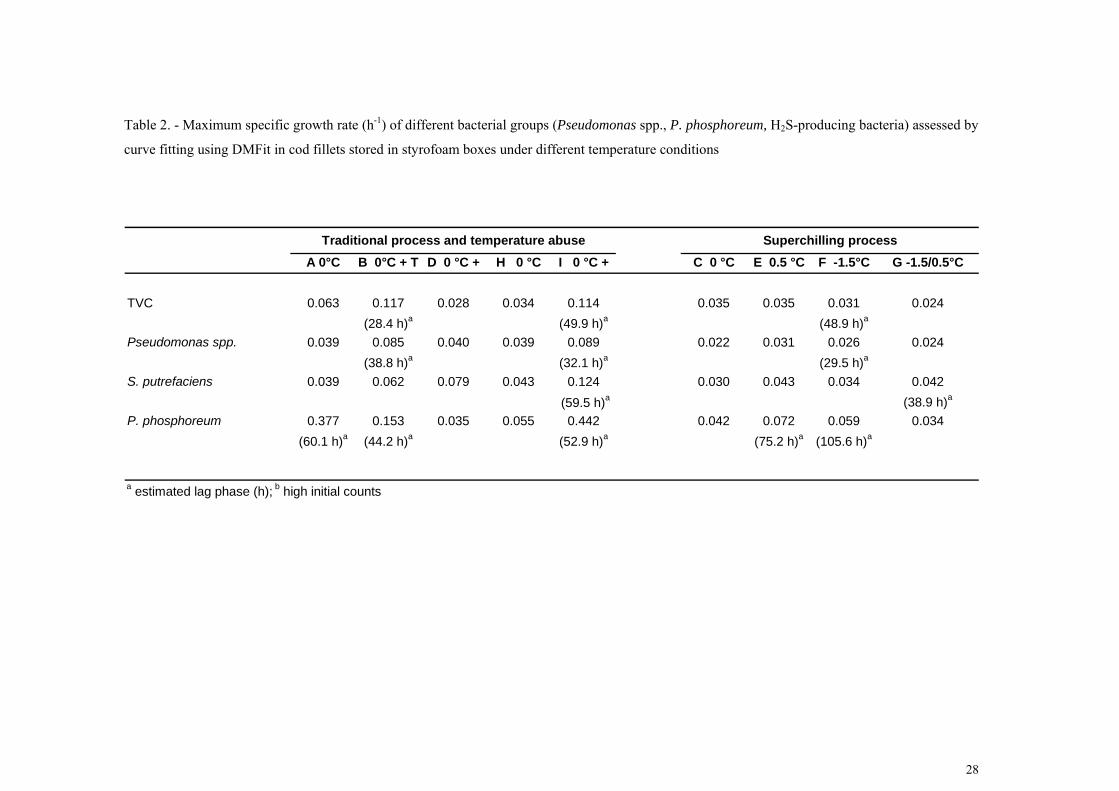
___________________________________________________________________
PAPER V ___________________________________________________________________ Shelf-life extension of superchilled cod (Gadus morhua) fillets and influence of temperature fluctuations on microbial growth and metabolites Guðrún Ólafsdóttir, Hélène L. Lauzon, Emilia Martinsdóttir, Joerg Oehlenschläger, Kristberg Kristbergsson ___________________________________________________________________ Submitted for publication
V

Shelf-life extension of superchilled cod (Gadus morhua) fillets and influence of
temperature fluctuations on microbial growth and metabolites
Gudrun Olafsdottir a,c, Hélène L. Lauzon a, Emilía Martinsdóttir a, Joerg Oehlenschläger b
Kristberg Kristbergsson c
aIcelandic Fisheries Laboratories, Skulagata 4, 101 Reykjavik, Iceland
b Federal Research Centre for Nutrition and Food, Department for Fish Quality (FRCNF),
Palmaille 9, D-22767 Hamburg, Germany cDepartment of Food Science, University of
Iceland, Hjardarhagi 2 - 6, 107 Reykjavik, Iceland
Contact information for Corresponding Author:
Gudrun Olafsdottir
Icelandic Fisheries Laboratories, Skulagata 4, 101 Reykjavik, Iceland
Fax: +354 530 8601, Phone: +354 530 8600, [email protected]

ABSTRACT
Quality changes of aerobically packed cod fillets stored under different temperature
conditions were characterized by the growth of specific spoilage organisms (SSO) and
the production of microbial metabolites measured by an electronic nose along with
traditional sensory and chemical analysis (TVB-N, pH). A new process based on quick
contact freezing and cold air blasting was used to achieve superchilling of fillets, prior to
chilled (0.5 °C) or superchilled (-1.5 °C) storage. Additionally, the effect of temporarily
storing conventionally processed chilled cod at higher temperatures to imitate possible
scenarios of abusive conditions during initial handling and transport were studied.
Photobacterium phosphoreum dominated under temperature abusive conditions
coinciding with high levels of TVB-N and increased electronic nose responses at sensory
rejection. CO sensor responses indicated that alcohols and aldehydes contributed to the
spoilage odors under all storage conditions. Pseudomonas spp. was dominating when
chilling of fillets was employed in the process and longer shelf-life was achieved. The
superchilling process followed by superchilled storage (-1.5 °C) extended the sensory
shelf-life of the fillets for at least 3 days compared to traditional process, resulting in a
shelf-life of 15 days. Microbial growth and traditional spoilage signs were delayed or
altered under superchilled conditions. In particular high content of TVB-N was observed
in superchilled fillets at sensory rejection. P. phosphoreum counts were lower under
superchilling conditions (log 6 to 6.8 CFU/g), compared to the traditionally processed
chilled fillets (log 7.2 CFU/g). However, H2S- producing bacteria appeared to grow
steadily under superchilling conditions reaching counts higher than 107 CFU/g at sensory
rejection.
Keywords: superchilling, cod fillets, sensory analysis, specific spoilage organisms,
electronic nose
Introduction
The extension of shelf-life of chilled fish fillets is of importance to allow the transport of
products to distant markets at lower cost. Superchilling has proven to effectively delay
bacterial growth and prolong the shelf-life of chilled fish (Huss 1995; Chang and others
1998). Various types of cooling systems have been used for superchilling (-4 to 0°C) of

seafood products including chilled and refrigerated seawater (Smith and others 1980;
Shaw and Botta 1975; Olafsdottir and others 2000), liquid-ice and brine solutions (Lee
and Toledo 1984; Huidobro and others 2002), flake ice or slurry ice (Losada and others
2004; Zeng and others 2005), subzero temperatures during storage (-2 and -3) (Riaz-
Fatima and others 1988; Sivertsvik and others 2003) and the use of cooling agents like
CO2 snow (LeBlanc and LeBlanc 1992; Jeyasekaran and others 2004). Chilling of fillets
is traditionally done in the fish industry by immersing the fillets in ice/water or brine
solutions (Lee and Toledo 1984). Subsequent chilling in a freezer after packaging has
proven useful to store refrigerating capacity into the product (Magnussen and others
1998). However, slow freezing can occur causing undesirable ice crystal formation,
inducing tissue damage. By using quick freezing, less damage may result (Fennema and
others 1973). A new technique, “Combined Blast and Cooling” (CBC) (Skaginn,
Iceland), is based on superchilling by lowering the temperature of the fillets quickly to -1
°C thus allowing initial phase transition to occur. The liquid phase becomes viscous and
cooling of the fillets is then based on the cooling capacity stored in the skin side surface
layer thus minimizing ice crystal formation.
The rate of freezing and the size of ice crystals are important factors influencing the
survival of microorganisms. Gram-negative bacteria, which include many of the specific
spoilage organisms (SSO) in fish, are considerably more sensitive to freezing conditions
(Ingram and Mackey 1976; Olson and Nottingham 1980).
The SSO concept is an approach to find the most important microorganism among the
total microflora that reaches a high cell count and causes spoilage before it is inhibited by
the dominating microflora (Dalgaard 2000). Shewanella putrefaciens and Pseudomonas
spp. are well established as the main SSO in fresh chilled aerobically stored fish caught in
temperate waters (Shewan 1962; Herbert and Shewan 1976; Jørgensen and Huss 1989;
Huss and others 1997; Koutsoumanis and Nychas 2000). The influence of high
temperature during storage on the proliferation of the SSOs in fish model system have
shown the importance of S. putrefaciens at high temperature and as a late spoiler (Lauzon
2000). Photobacterium phosphoreum the main SSO in packaged cod fillets (Dalgaard
and others 1993; Dalgaard 1995) originates from the intestines (Van Spreekens 1974) and
was earlier identified as an important TMA producer in iced cod, and in cod fillets (Van
Spreekens and Toepoel, 1981; Larsen and others 2003). Recently, P. phosphoreum was

identified as the dominating microorganism in aerobically packaged haddock fillets and
was along with Pseudomonas spp. suggested as the main SSO in haddock fillets stored
under chilled and temperature abusive conditions (Olafsdottir and others Forthcoming).
The knowledge on the effect of superchilled storage on the proliferation of SSOs and
their production of metabolites in cod fillets is limited. Generally, an initial reduction in
microbial load has been observed after the first day of chilled or superchilled storage as a
result of a cold shock of the microorganisms (Ingram 1951; Ingram and Mackey 1976;
Lakshmanan and others 2002). The resulting spoilage pattern and proliferation of the
specific spoilage bacteria depend on the temperature and environmental conditions during
further storage (Gram and Huss 1996). As a result of delayed or altered microbial growth
when preservation techniques are used the traditional spoilage signs may become
distorted and therefore the commonly used quality indices may be of questionable value
(Lindsay and others 1986). Detection of the main classes of volatile degradation
compounds (alcohols, aldehydes, esters, sulfur compounds and amines) produced during
chilled storage of fish by an electronic nose has proven useful to determine the spoilage
level of different fish species (Olafsdottir and others 1997, 2000, 2002; Di Natale and
others 2001). The rapid detection of microbial metabolites related to odor or quality
changes is therefore ideal for characterization of the spoilage activity of the dominating
SSOs.
The aim of the experiments reported herein was to study the spoilage characteristics of
CBC-processed cod fillets compared to traditionally processed fillets stored under
superchilled and/or chilled conditions and the effect of abusive temperature on the
proliferation of specific spoilage organisms and their metabolites. Spoilage changes were
monitored by sensory, microbial and chemical analyses and by an electronic nose.
Characterization of the spoilage changes and the spoilage domain of the SSOs in
superchilled cod fillets is needed to determine which quality indicators are relevant for
monitoring quality changes of cod fillets stored under superchilled and temperature
abusive conditions. Furthermore the knowledge can be applied to optimize the chilling
conditions to extend the shelf-life of cod fillets.
Materials and Methods
Preparation of samples

Three extensive storage studies were performed with products from two different fish
factories in Iceland. The raw material originated from different catching areas (Southwest
and Northeast of Iceland), using different fishing gear (longline and bottom trawl) and
varying processes in the factories.
Traditional process Factory I - Experimental groups A, B and D: The fish was caught by
the ice fish trawler Brettingur east off Iceland in the Berufjardarall catching zone in
October 2003 by bottom trawl. The fish, selected from one haul (batch 1) was gutted on
board and iced in tubs (400L). Landing was three days after catch at the processing plant.
Approximately 170 fishes from batch 1 were processed into fillets to prepare the sample
groups. The traditional process in factory I involves mechanical filleting and deskinning
and packing of fillets in styrofoam (EPS, expanded polystyrene) boxes (160 x 400 x 263
mm) lined with a plastic bag. Each box contained 8 to 12 fillets, an absorbing pad at the
bottom and a cooling mat (230 x 160 mm; 146 g) placed on top. The samples were
transported by a refrigerated truck (4 to 5°C) to Reykjavik and the samples arrived in the
morning on day 4 after catch (groups A, B and D). Group A was then stored constantly at
0.5 °C while group B was stored at 15°C for 8 hours on day 6 and then transferred back
to the cold store (0.5 °C). Thirty fishes were selected from the same batch to prepare
sample group D that represented bad handling. Abusive temperature conditions were
simulated by keeping the fish without ice in a tub in the reception area for approximately
8 hours at 2 °C and then transferring the tub into the processing area (15 to 18°C) until
the following morning when the fish was filleted, deskinned, packed and transported to
the laboratory. The same temperature conditions during storage were used as for group B.
Traditional process Factory II - Storage groups H and I: The fish was caught by
longlining close to Sandgerði south west off Iceland in November 2003. The cod was
gutted and iced on board the boat. Landing was in the afternoon the same day and the
fish was stored iced overnight. The fish was hand filleted the following morning and
cooled by placing the fillets on aluminum pans floating in ice-water for 10 to 20 minutes
before being mechanically deskinned and packaged into plastic bags in styrofoam (EPS)
boxes as described above. Each box contained 11 fillets and were transferred to the
laboratory the same day. Two groups of samples were prepared (groups H and I). Both
sample groups were initially stored at 0.5 °C, but on the fourth day of storage, group I

was removed from the cooler and stored overnight (16 hours) at room temperature (RT)
and then moved back to the cooler.
Superchilling process Factory I - Experimental groups C, E, F and G: Group C was
prepared from batch 1 in October 2003 (labeled “C new” indicating that this was the first
trial with the new superchilling technique). After filleting, eighty fillets were immersed in
an ice-water cooling solution containing 0.85% NaCl for 45 minutes until further
processed with a new superchilling CBC (Combined Blast and Contact) cooling
technique (Skaginn, Iceland). The CBS technique involves superchilling of the surface of
the skin side of the fillets by moving them through a freezing tunnel on a teflon covered
aluminum conveyor belt (- 35 til – 40°C) and simultaneously blasting cold air over the
fillets. The superchilling process facilitates handling of the fillets, in particular the
removal of the skin and effective cooling of the fillets results in a temperature around – 1
°C when packed. Group C was stored at 0.5 °C at the laboratory.
The second trial with the new superchilling technique was done in December 2003. Three
experimental groups (E, F and G) were prepared from about 190 fishes (batch 2). The fish
was caught by the same trawler as batch 1, but ice slurry was used on board for cooling.
Landing and processing were on day 1 after catch.
The fish was hand filleted and the fillets were cooled in ice water (0.85% NaCl) for 20
min before being superchilled and deskinned by the new technique. Nine to eleven fillets
were packed in each styrofoam box (160 x 400 x 263 mm; Borgarplast, Iceland) and a
cooling mat put on top (230 x 160 mm; 146 g). The samples were transported by a
refrigerated truck (4 to 5°C) to the laboratory and arrived the following morning on day 3
post catch. The sample groups were stored under different conditions, group E at 0.5 °C,
group F at -1.5 °C and group G was initially stored at – 1.5 °C but transferred to 0.5 °C
on day 8 post catch.
Sampling
At each day of sampling one box containing 11 to 12 fillets was used for the various
analyses. Three or four fillets were used for sensory analysis. Other four fillets were
pooled into 2 samples and used for microbial analysis (TVC and SSO counts), chemical
analysis of total volatile bases nitrogen (TVB-N) and pH. Four fillets were then used for
the analysis of volatile compounds with the electronic nose. The first samples were

measured on the day following processing and duplicate samples were analyzed regularly
until sensory rejection.
Temperature monitoring.
Selected boxes contained automatic temperature data loggers (Stow Away®, Onset
Computer Corporation, USA) to monitor the temperature of fillets during storage.
Temperature was recorded at 5 minutes intervals. The loggers were inserted underneath,
in between and above the fillets in one box for each temperature treatment, as well as on
top of the box to follow the environmental temperature. Data are only shown from
loggers located underneath the fillets.
Sensory analysis
The Icelandic Fisheries Laboratories (IFL) sensory panel evaluated the freshness of the
fillets to determine the shelf-life of differently treated products. The sensory panel was
trained according to international standards (ISO 1993), including detection and
recognition of tastes and odors and training in the use of scales. Sensory assessments
were carried out by eight to twelve assessors (age range 30 to 55). Fish from each
treatment was portioned into an aluminum box and cooked in a steam oven (98 to 100 °C
for 5 min). Each treatment was assessed in duplicate and the samples were anonymously
coded. A computerized system (FIZZ, Version 2.0, 1994-2000, Biosystèmes, France) was
used for data recording of cooked samples and further data processing. Average scores
were calculated for each treatment and significant differences between corresponding
treatments evaluated.
The Torry scheme (Shewan and others 1953) was used to assess the freshness (odor and
flavor) of cooked pieces. The scheme ranges from 10 = very fresh to 3 = very spoiled,
with a rejection level at 5.5.
Microbial analysis
Fillets were aseptically minced, assessing 2 pooled fillets for each sample. Minced flesh
(25 g) was mixed with 225 mL of cooled Maximum Recovery Diluent (MRD, Oxoid) in
a stomacher for 1 minute. Successive 10-fold dilutions were done as required. Total
viable psychrotrophic counts (TVC, 15 °C) were evaluated by spread-plating aliquots

onto modified Long & Hammer's medium; counts of H2S-producing bacteria and
presumptive pseudomonads were evaluated on spread-plated Iron Agar (15 °C) and
modified CFC medium (22 °C), respectively (Lauzon and others 2002).
Counts of Photobacterium phosphoreum were estimated by using the PPDM-Malthus
conductance method (Dalgaard and others 1996), as described by Lauzon (2003).
TVB-N and pH measurements
Total volatile basic nitrogen content (TVB-N) was measured by the steam distillation
method described by Malle and Poumeyrol (1989). The pH was measured in 5 grams of
mince moistened with 5 mL of deionised water. The pH meter was calibrated using the
buffer solutions of pH 7.00 ± 0.01 and 4.01 ± 0.01 (25°C) (Radiometer Analytical A/S,
Bagsvaerd, Denmark).
Electronic nose
Electronic nose measurements were performed using a gas sensor instrument called
FreshSense (Maritech, Kópavogur, Iceland). The instrument is based on four
electrochemical gas sensors: CO, H2S, SO2 (Dräger, Germany) and NH3 (City
Technology, Britain). The measurements were performed using a static headspace
sampling as described earlier (Olafsdottir and others 2002). Duplicate analyses were done
using approximately 500g of fish fillets. The samples were tempered at RT for
approximately 30 minutes until the temperature of the fillets reached 8 to 12°C before
recording the sensors’ responses for 5 minutes.
Data analysis
Multivariate analysis was performed using the Unscrambler Version 9.1 (CAMO Process,
Trondheim, Norway). The main variance in the data set was studied using Principal
Component Analysis (PCA). Partial Least Squares Regression models (PLSR) were used
to explore the correlation of the sensory, microbial, TVB-N, pH and electronic nose
variables. The effect of temperature of fillets and time was also included as an
independent variable by calculating, for all samples at each sampling day, the
accumulative influence of temperature (T) and time (t): Taccumulative = ∑ (T - Tmin) x dt;
Tmin was defined as the minimum temperature of fillets in storage.

Soft independent modeling of class analogy (SIMCA), a pattern recognition method
relying on independent modeling of defined classes by means of PCA (Wold 1976) was
used to classify samples according to sensory quality (Torry score) based on the sensor
responses, microbial and chemical data. Average scores of assessors were used for the
sensory data and average of sample replicates for each sample. Values were standardized
to equal variance. Full leave-one-out cross validation was used in the validation method.
The Jack-knife method (Martens and Martens 1999) was used to determine significant
variables in X with a significance level of 5% (p<0.05).
Microsoft Excel 97 was used to calculate means and standard deviations for all multiple
measurements and to generate graphs.
Analysis of variance (ANOVA) was applied to the data using the Number Cruncher
Statistical Software (NCSS 2000). Significant differences were determined by One way
ANOVA and Duncan’s Multiple-Comparison Test was used to determine the statistical
difference between samples. An effect was considered significant at the 5% level
(p<0.05).
The bacterial growth data collected were fitted to determine maximum specific growth
rates (h-1) by using DMFit (http://www.ifr.ac.uk/safety/DMFit/), an in-house program of
IFR (UK) which is based on a reparameterized version of the model of Baranyi and
Roberts (1994). DMFit is an Excel add-in program to fit curves where a linear phase is
preceded and followed by a stationary phase.
Results and Discussion
Effect of handling and temperature on shelf-life determined by sensory analysis
Initial average temperature of the fillets varied based on the processing practice used
(Fig. 1). In a conventional process the temperature of fillets will typically increase during
filleting, skinning and trimming. The process in factory I (batch 1) was a conventional
process that did not include cooling of the fillets before packaging, resulting in a much
higher initial temperature of the fillets (4 to 6 °C for groups A and B) than in factory II
where cooling of the fillets was applied (0.5 °C for groups H and I) (Fig. 1). The
temperature fluctuations of the fillets that were simulated firstly by storing the raw
material without ice until processed (group D) as seen by the highest initial temperature

and secondly, by exposing the fillets to temperature fluctuations during storage to
simulate possible scenarios of abusive conditions during transport (groups B, D and I) are
shown in Fig. 2a. The superchilling process effectively cooled the fillets and much lower
initial temperature was observed (-1.0 to -1.4°C) than for the traditionally processed
groups (Fig. 1).
The shelf-life determined by estimating the day of sensory rejection (Torry score of 5.5).
from the sensory data (Fig. 2b and 3b) was much shorter for the traditionally processed
groups that were severely temperature abused (8 and 10.5 days for groups D and I,
respectively), compared to the corresponding groups (A and H from batches 1 and 3)
stored continuously at the same temperature with a shelf-life of 12 and 13.5 days,
respectively (Fig. 1). The extended shelf-life of group H was due to the lower initial
temperature of batch 3 (Fig. 1) compared to batch 1 because of the initial cooling of the
fillets. It should also be pointed out that the processes differed in the initial handling since
batch 3 was processed one day after catch, while batch 1 had been stored whole on ice for
three days onboard the trawler prior to processing. The average storage temperature of
groups A and B was similar, but the temperature abuse of group B (15 °C for 8h) (Fig 2a)
resulted in its slightly more rapid quality deterioration, as seen by a lower Torry score
(p<0.05) on day 7 compared to group A (7.6 and 8.0, respectively). However, the
resulting shelf-life was similar (11.5 to 12 days) for both groups (Fig. 2b). Similar shelf-
life of 10 to 12 days was reported in an earlier study on conventionally processed cod
fillets, filleted one day after catch or a total shelf-life of 11 to 13 days post catch
(Magnússon and Martinsdóttir 1995).
The superchilling process (CBC) extended the shelf-life of batch 1 slightly by 0.5 day
(12.5 d for group C), while the second trial (batch 2: groups E, F and G) demonstrated
that further storage of CBC-processed fillets under superchilled conditions (-1.5 °C) was
most effective in prolonging shelf-life, resulting in a shelf-life of groups G and F of about
15 days compared to groups C and E with shelf-life of 12.5 and 14.5 days, respectively
(Fig. 1). Additional sensory analysis was performed (data not shown) to evaluate the
texture of the superchilled fillets. Only little difference was observed between groups
except on day 8 when the fillets stored at -1.5 °C (group F) exhibited softer texture
(p<0.05) than fillets stored at 0.5 °C (group E).

Extension of marketable shelf-life and effect of processing and storage techniques
It is of interest to compare the actual storage time of the fillets when the sensory score
was 7, because this score is more realistic to evaluate the marketability of the fillets
(Figs.2b and 3b). At this stage the fillets are described as neutral in odor and taste and
have lost their characteristic initial fresh, sweet taste. Shelf-life extension of fresh fish can
be reached by different processing and/or storage methods, but usually the neutral phase
is extended rather than the earlier stage where freshness characteristics are important. It is
therefore important to evaluate whether superchilling processing and storage is extending
this earlier phase, since this would provide an improved market value. For batches 1 and
3, the traditionally processed fillets had reached score 7 on day 9 (groups A and H) while
the CBC-processed fillets (group C) reached this score after 11 days. For batch 2 (CBC-
processed), group E (0.5 °C) reached this score on day 11, but groups F and G
(superchilled storage) after 13 days. This shows that CBC-processed fillets will have an
extended marketable shelf-life. Furthermore, storage under superchilled conditions (-1.5
°C) will prolong the time of marketability for at least two days. This could contribute to
improved quality of fillets for consumers in distant markets
Microbial analysis
The initial microbiological quality of the raw material of the different batches varied
when evaluated on the first sampling day, one day after packing in styrofoam boxes
(Table 1). The initial total viable psychrothrophic counts (TVC) were lowest (log 3.9
CFU/g) for traditionally processed fillets (batch 1, Factory I) and highest for the CBC-
processed fillets in batch 2 (log 5 CFU/g). A higher TVC (log 4.8 CFU /g) was also
observed for CBC-processed fillets (group C) from batch 1 compared to traditionally
processed groups which could be related to poorer hygienic handling of the former
(contaminated chilling brine or processing equipment) as well as to the fact that the
traditionally prepared fillets underwent a rinsing step while being deskinned
mechanically, hence slightly decontaminated. Also, a high TVC was observed for batch 2
despite the fact that the raw material was processed one day after catch while batch 1 was
processed 3 days after catch. It should be pointed out that because of the continuing
process in the factory, an older batch had been processed earlier the same day as the
experiment was carried out with batch 2. Apparently, the processing lines were not

cleaned appropriately before the experimental groups were processed and therefore cross-
contamination from the older raw material may have occurred. This was unfortunate, but
emphasizes the need for thorough cleaning procedures between processing different
batches. This may have influenced the outcome of the study, resulting in a shorter shelf-
life of the superchilled experimental groups than could have been obtained if hygienic
conditions would have been optimal.
Initial counts of SSOs showed that slightly higher levels of H2S-producing bacteria and
P. phosphoreum (Pp) were found in batch 1 (3 days post catch) than batch 2 (1 day post
catch) and that batch 3 (1 day post catch) had the lowest counts of all (Table 1).
Pseudomonads counts were found in highest numbers on the first sampling day for all
batches. Comparison of bacterial development under normal chilled conditions (Figs.
4a,b) explains the shorter shelf-life of group A than group H, as best demonstrated by the
maximum specific growth rate (μmax) of Pp being higher for A (0.377 h-1 after a lag phase
of 60h) than H (0.055 h-1) (Table 2), probably due to higher initial Pp load (Fig. 4b) and
higher temperature of processed fillets for batch 1 (Fig.2a). Abusive temperature
conditions (groups B, D and I) triggered all SSOs evaluated, but post-processing
temperature abuse usually led to a lag phase (32 to 60h) of SSOs before rapid growth
(Table 2). It is quite clear that such undesirable environmental conditions will affect the
physiological state of bacterial groups since lag phases were observed under abused
temperatures for most groups. This behavior could be attributed to the fact that bacteria
need to readjust to current environmental conditions, independent to how beneficial these
are to their development. Under abusive conditions (8 and 16 h at RT), Pp was the fastest
developing SSO (groups B and I: 0.153 and 0.442 h-1) and the longer abusive treatment
(I) affected its growth rate tremendously. Similarly, the maximum specific growth rate of
H2S-producing bacteria was much higher after having undergone the longer treatment,
doubling in value (groups B and I: 0.062 and 0.124 h-1). However, similar growth rates
were observed for pseudomonads following either treatment (groups B and I: 0.085 and
0.089 h-1). Dominance of Pp (log 7.2 to 7.8/g) over other SSOs was usually observed
under chilled and abused conditions, representing 12.6 to 17.2% (A and H) and 16.2, 24.0
and 12.7% of the total microflora (B, I and D, respectively). Pp load was considerable in
group D (log 6.0/g, representing about 10% of microflora) on the first sampling day (day
6) compared to that of group B (log 2.7/g) analysed on day4 (Table 1). The apparent

slower growth rate observed for group D, reflected the declining growth during late
exponential growth phase while approaching the stationary phase (Table 1). This
indicates that unproper icing and handling of raw material, leading to higher temperature
of the fillets, may especially influence the development of Pp in the raw material.
However, extreme temperature abuse (groups I and D) obviously stimulated H2S-
producing bacteria over pseudomonads, as seen by a faster growth rate and the levels
reached by the former (log 6.2/g) compared to the latter (log 4.4/g) on the last sampling
day (group D). Interestingly, dominance of pseudomonads was only observed in spoiled
fillets originating from the factory II (groups H and I, batch 3) where cod was caught in
the Southwest of Iceland. High counts of pseudomonads in fillets from batch 3 are in
agreement with recent studies on haddock fillets from the same factory (Olafsdottir and
others Forthcoming). In that study, Pp was the predominant SSO based on their counts,
but the characteristic sweet, fruity spoilage odors were associated with the growth of
Pseudomonas spp. The study of Jørgensen and others (1989) showed on the contrary that
H2S-producers were the main SSO in aerobically stored cod fillets from different origin,
but this can be explained by the different conditions in the factories, since the origin of
the H2S-producers is mainly from the filleting plants (Van Spreekens and Toepoel 1981).
The CBC-superchilling process was efficient in cooling the newly processed fillets
(groups C, E, F and G) (Fig. 3a), resulting in slower bacterial development (Figs. 5; Table
2) which was further decreased under superchilled storage (groups F and G). The total
superchilling effect of each group, ranking the most to the least as F, G, C, E is illustrated
in Fig. 1 and reflected by the corresponding Pp growth rates of 0.059 (lag phase of
105.6h), 0.034, 0.042, 0.072 h-1 (lag phase of 75.2h), respectively (Table 2), exemplifying
the slower growth of Pp caused by the degree of superchilling. Pp had therefore reached
much lower counts (log 6 to 6.8/g) than in traditionally processed fillets (log 7.2/g) at
sensory rejection (Table 1). This difference is probably explained by the sensitivity of
this bacterium to sudden cooling/freezing, which can lead to a cold shock, damaging the
cells and resulting in slower initial growth. Pseudomonads had the slowest growth rates
(Table 2) and reached similarly low levels at sensory rejection (Table 1), indicating their
sensitivity to superchilled conditions. H2S-producing bacteria grew quite steadily in fillets
from batch 2 (Fig. 5d) and dominated (24-36%) over other SSOs (Table 1). However, it
cannot be confirmed whether this was due to the effect of the superchilling process on

other SSOs which may have decreased competition for H2S-producing bacteria or to the
cross-contamination from the older raw material occurring during processing. H2S-
producing bacteria were found at lower levels (log 5.9/g) in superchilled fillets of batch 1
(group C). Nevertheless H2S-producing bacteria seemed to tolerate better the
superchilling conditions.
TVB-N analysis
The formation of TVB-N was delayed in the superchilled groups (Fig. 6b) compared to
the traditionally processed groups (Fig. 6a). At sensory rejection different levels of TVB-
N were found in the experimental groups (38-55 mgN/100g) (Table 1). The highest TVB-
N value (94 mgN/100g) was measured for the severely abused group D (Table 1), but this
value is overestimated since the measurement was performed on day 10 while the
estimated value at sensory rejection (day 8) seen in Fig 6a is about 35 mgN/100g. The
influence of temperature abuse was seen in a more rapid production of TVB-N for groups
B and I compared to groups A and H, respectively, stored at constantly low temperature
(Fig. 6a).
The highest TVB-N values at sensory rejection for the superchilled groups (Fig. 6b) were
observed in groups C and E that were stored at 0.5 °C (53 and 56 mg N/100g,
respectively). Both H2S-producing bacteria and P. phosphoreum are known to be able to
produce TMA (Van Spreekens 1974; Jørgensen and others 1988; Dalgaard 1995). The
higher levels and more rapid growth of P. phosphoreum in groups C and E compared to
groups G and F stored at -1.5 °C (Fig.5b) suggest their importance in contributing to high
TVB-N values throughout the storage time for groups C and E (Fig. 6b). It is likley that
both H2S-producing bacteria and P. phosphoreum were actively producing TMA in group
E based on their highest counts in that group. Although the growth rate of these bacteria
was slower in groups F and G, high levels of TVB-N ( ~38 mg/100 g) were formed and
an increased growth rate of P. phosphoreum was observed for group G between days 10
and 12 after the group had been transferred to higher storage temperature (Fig. 5b). The
influence of low temperature on overall decreased growth rate of H2S-producing bacteria
and P. phosphoreum appears not to hinder their ability to produce TMA under
superchilling conditions.

Based on the findings of Dalgaard (1995) that P. phosphoreum was a 30 times more
active TMA producer than S. putrefaciens and cell counts of 107 CFU/g of P.
phosphoreum corresponded to 30 mgN/100g TMA in packed cod fillets, it is likely that
P. phosphoreum is very important in the formation of TVB-N at least in the traditionally
processed groups where P. phosphoreum dominated and reached the highest counts of
>107 CFU/g at sensory rejection. However, based on their lower counts in the
superchilled groups (log 6.0 to 6,8) (Table 1) the role of the H2S-producers in
contributing to TVB-N can not be overlooked since their counts reached >107 CFU/g in
the groups E, F and G. According to Jørgensen and Huss (1989) in a study with fish juice
inoculated with S. putrefaciens and Dalgaard (1995) who studied TMA production in
packed cod, TMA was detected when counts of S. putrefaciens were about 107 CFU/g
and off odours when counts reached 108 CFU/g. Similarily, Koutsoumanis and Nychas
(2000) reported that higher counts (108 CFU/g) were observed in sterile fish inoculated
with S. putrefaciens when TVB-N started to increase, followed by off odors detected by
the sensory panel. Therefore, based on the H2S-producers count (>107 CFU/g) it is likely
that they could contribute to some of the TVB-N levels found in this study, but most
likely in combination with P. phosphoreum to account for the high levels measured in the
superchilled groups (38 to 55 mgN/100g).
It has been pointed out that TVB-N and TMA often give ambiguous information about
the quality of the products and levels only increase at late storage when spoilage signs are
obvious (Oehlenschläger 1997, 1998). Varying levels of TVB-N have been found at
sensory rejection in whole cod and vacuum packed fillets (Jørgensen and others 1988).
TVB-N levels are also influenced by the storage method (Dalgaard and others 1993;
Magnússon and Martinsdóttir 1995; Debevere and Boskou 1996; Guldager and others
1998; Lauzon and others 2002).
Despite this controversy, fixed TVB-N limit (35 mg N/100 g) for acceptability of
consumption for gadoids as a confirmation of a prior sensory assessment have been set in
EU regulations (Anon 1995). Based on these limit the shelf-life of the experimental
groups was evaluated (Fig. 6). A slightly shorter shelf-life was estimated, than when
using the sensory Torry score criteria of 5.5, for the traditionally processed and
temperature abused experimental groups A, B, D from batch 1 and the superchilled
groups C and E. The estimated shelf-life based on TVB-N criteria for the superchilled
groups F and G was in agreement with shelf-life according to the sensory rejection limit
(Table 1). On the other hand longer shelf-life was estimated for sample groups H and I
processed from batch 3 and they had not exceeded the TVB-N limit of 35 mgN/100g at
sensory rejection. Interestingly, the predominance of Pseudomonas spp. (log 7.4 to 7.5
CFU/g) in these groups may explain the lower level of TVB-N because pseudomonads do
not produce TMA (Castell and Greenough 1959). However, considerable levels of TVB-
N (27 to 34 mgN/100g) were found at sensory rejection which can be accounted for by
the high levels of P. phosphoreum or 17 to 24% of the pyschrotophic counts, although the
pseudomonads were dominating (25 to 38 %). Koutsoumanis and Nychas (2000)
suggested pseudomonads level of 107 CFU/g as a limit for the end of shelf-life coinciding
with a TVB-N level of about 26 mg N/g in a Mediterranean species.
pH measurements
The effect of the different catching techniques and time elapsed from catching until
processing is seen by the difference in the initial pH value (Table 1). Higher pH value
(p<0.05) was observed for batch 3 than batch 1 initially (6.85 and 6.70, respectively), this
may be explained by the different catching methods, longline and bottom trawl,
respectively. Similar difference in pH for cod was observed for longline and gillnet by
Esaiassen and others (2004). The age of the raw material when processed can also explain
the difference in initial pH measured, because of the autolytic post mortem changes (Huss
1995). Therefore, the lower pH value for batch 1 (6.70) can also be related to the fact that
it was processed 3 days post catch while batch 3 was processed one day post catch
(6.85). The difference in the initial pH value because of the effect of different chatching
methods is a drawback when using pH to monitor quality. However, changes are seen
with time in some groups although the end value is not the same at sensory rejection.
Increase in pH values (p<0.05) were noticed with storage time for sample groups A, D,
the superchilled group C from batch 1 and sample group G from batch 3 (Table 1). The
initial pH value of group D measured on day 6 post catch was the lowest (6.55) possibly
because of the extent of the autolytic changes under high temperature storage (Huss
1995). A lower initial pH for group C (6.58) compared to the traditionally processed
groups may be related to the chilling process. The highest increase in pH with storage
time was observed for groups C and D with the lowest inital pH. High correlation of pH

and the CO sensor were observed for groups C and D (r2 = 0.81 and 0.87, respectively)
and the TVB value for groups C and D (r2 = 0.94 and 0.97, respectively). The
correlation of pH to microbial counts was observed for the H2S –producer´s counts (r2 =
0.83) in group D, while there was a correlation with all the SSOs (r2 >0.88) in the
superchilled processed group C indicating the difference in the spoilage at abusive
temperatures compared to the superchilled process despite similar pH levels.
Electronic nose measurements
CO sensor - detection of alcohols, aldehydes and esters: Spoilage of the fillets was
characterized by higher response of the CO sensor than the other sensors (Fig. 7). The CO
sensor can detect alcohols, aldehydes and esters (Olafsdottir and others 2002) which are
common metabolites of spoilage bacteria like Pseudomonas ssp. (Miller and others
1973a, 1973b). Increase was noticed earlier for the traditionally processed (Fig.7a)
groups than for the superchilled groups (Fig.7b) showing that the spoilage process was
slower at lower temperature, which was in agreement with the other data. Increased CO
response was first observed for the temperature abused groups D and I, followed by
group B (seen as open data points in Fig 7a) in agreement with the TVB-N analysis. The
superchilled group F had the lowest CO response (Fig 7b) suggesting the slowest spoilage
rate for that group. The influence of higher temperature storage of group G is seen as
slightly higher CO response on day 12 in agreement with microbial analysis in particular
P. phosphoreum showing increasing counts (Fig. 5b) and TVB-N measurements (Fig.6b).
The fact that the CO sensor responses correlated well with the TVB-N values for both the
traditionally processed groups (r2=0.87) and the superchilled groups (r2=0.83) indicates
that TMA and metabolites like alcohols and aldehydes were being produced
simultaneously. Based on the higher counts of the P. phosphoreum and H2S producing
bacteria (Fig. 4 d) it is likely that these bacteria could be contributing to the development
of metabolites that the CO sensor can detect. S. putrefaciens is known to produce
alcohols like 3-methyl-butanol (Miller and others 1973b) and could contribute to the CO
sensor response. It is likely that other volatile compounds not detected by the sensors may
also contribute to the spoilage of the samples, in particular it should be mentioned that the
CO sensor can not detect ketones, which are produced by pseudomonads and

Photobacterium in fish during storage (Miller and others 1973c; Van Spreekens and
Toepoel 1981) and may also contribute to the spoilage odors.
Large standard deviation observed for the CO sensor is explained by the effect of the
varying temperature (8-12 °C) during measurements of samples influencing the volatility
of the compounds measured and causing deviations. Better control of temperature during
sampling would improve the performance of the system (Olafsdottir 2003).
NH3 sensor – detection of TMA and NH3: At the end of the storage time, increasing
response was observed for the NH3 sensor for sample groups B, D, and I stored under
abusive temperature conditions and the superchilled group C (Table 1). The response of
the NH3 sensor was higher (p<0.05) for the superchilled group C than the traditionally
processed group A from the same batch, although the overall spoilage appeared to be
slower in C. As discussed before it is likely that P. phosphoreum which is known to be an
active TMA producer (Van Spreekens, 1974; Dalgaard 1995) may be contributing to the
high TVB-N content and NH3 sensor response under superchilled conditions. Offensive
ammonia-like, dried fish odor was observed at sensory rejection of the superchilled
fillets, but when tasted the spoilage was less noticeable indicating that odor and volatile
compounds were probably limiting their shelf-life.
H2S and SO2 sensors – detection of sulfur compounds: Very low response of the H2S and
SO2 sensors were observed in all samples but slight increase was observed for the H2S
sensor at the end of the storage time for traditionally processed and abused sample groups
B, D, H and I although not significant (Table 1). This suggests the influence of H2S-
producing bacteria under abusive temperature conditions as reported by Lauzon (2000).
Slightly higher H2S sensor values were also noticed in the superchilled groups E and F
which can be explained by dominance of the H2S -producers in these groups (25% and
36%, respectively) (Table 1). At advanced spoilage of fish, onion-like, sulfide and rotten
vegetable-like, putrid spoilage odors develop because of microbially produced sulfur
compounds (Herbert and others 1975; Shewan and others 1953; Miller 1973a). Earlier
studies using the FreshSense electronic nose have shown increasing response of H2S and
SO2 sensors at advanced spoilage of whole capelin and redfish (Olafsdottir and others
1997, 2000, 2002), but response to fillets of cod and haddock is generally low
(Olafsdottir 2003; Tryggvadóttir and others 2001). The overall insignificant response of

the SO2 sensor indicated that sulfides were not present or in very low levels in the
samples, below the detection limit of the sensors (data not shown). Based on the low
responses of the H2S and SO2 sensors in this study, it appears that volatile sulfur
compounds do not contribute significantly to the development of off odors of fillets at
sensory rejection.
Correlation of microbial counts, TVB-N, pH and electronic nose sensors and prediction
of sensory quality
Partial least squares regression (PLSR) was used to study the correlation of the variables
and their contribution to predict the Torry sensory score (Fig. 8). A PLSR model based on
all the samples (N = 41) and all the measured variables had a high correlation (r2 = 0.97)
with a RMSEP of 0.29 (Table 3). Because of the low responses of the NH3, H2S and SO2
sensors they explained less of the variance in the data than the other variables, as seen by
their location in the middle of the plot (Fig 8). The same was observed for pH, since the
influence of the different initial pH values of the samples precludes the use of pH as a
spoilage indicator as explained above. The contribution of the significant (p<0.05)
variables (TVC, SSO, TVB-N and CO sensor) to predict the sensory score was studied
further by exploring different PLSR models (Table 3). A model based on the microbial
variables had high correlation (r2 = 0.96) and low prediction error (RMSEP = 0.32)
indicating that microbial counts were well suited to predict the sensory quality of the
overall data set. This was expected since the growth of the SSO characterized the
spoilage pattern of the samples. A model based on the classical spoilage indicators TVC,
TVB-N and pH had a lower correlation (r2 = 0.92) and higher error (RMSEP = 0.41),
indicating that the SSO gave better information about the sensory quality. PLSR model
based on the electronic nose variables was inferior with much lower correlation (r2 =
0.70) and higher error (RMSEP = 0.80).
Because of the significance of the CO sensor variable to predict the Torry score and the
importance of TVB-N (Fig 8) it was of interest to study further a model including these
variables in combination with the SSOs. The resulting PLSR model (r2 = 0.97 and
RMSEP = 0.30) showed that the overall spoilage pattern of the differently treated
samples was similar as indicated by the arrow, tracking the increasing spoilage level of
samples along PC 1 from right to left (Fig 9). The second PC explained the influence of

the temperature conditions on the spoilage pattern in the different experimental groups.
The superchilled samples E, F and G tended to be located lowest on the plot and were
best described by the H2S-producer counts. The traditionally processed groups H and I
were placed in the middle and described by the Pseudomonas spp. while the traditionally
processed groups with the highest temperature during storage were situated on the upper
half of the plot showing that the temperature abused samples D6 and D7 were most
affected and described by high Photobacterium counts and high values of the TVB-N and
the CO sensor Despite the differences in the spoilage rate of the groups explained by the
influence of the different temperature conditions and initial handling on the dominating
SSO in the samples (PC2), the main changes in their spoilage level was explained by
their different location along PC 1. Therefore, it appears that these quality indicators
could be used to classify both the traditionally processed and the superchilled samples.
Classification based on sensory criteria
Classification of the differently treated samples based on sensory criteria (Torry score >7
and Torry score < 7) using five selected variables (TVB-N, CO sensor, H2S-producers,
pseudomonads and P. phosphoreum) was studied using SIMCA. The Torry score of 7
was selected because at this point the samples are at the last stage of acceptable
marketable quality and it is of interest to determine if samples are still acceptable for
distribution. The results showed that 85% of the samples were correctly classified into
respective classes (34 samples) while 15% were identified in both classes (6 samples).
The samples that were wrongly classified in both classes were samples A10, C10, D7,
H9, E10 and F12 that were located in the middle of the plot and not well described by the
variables (Fig 9). All these samples had sensory scores close to 7. For example, the
superchilled samples (E10 and F12) with Torry scores <7 had at this point low values for
the quality variables suggesting that other indicators are needed to describe better their
sensory characteristics. The role of endogenous enzymatic degradation in the fillets may
explain partly the quality deterioration (Ashie and others 1996) and should be studied
further in particular in relation to superchilled conditions when microbial growth is
delayed.

Conclusions
The spoilage characteristics of cod fillets were influenced by the dominating bacteria
during storage in the experimental groups. The results emphasize the importance of
studies performed with natural products and processes to accumulate information about
spoilage domain of SSOs under actual conditions. The origin of the raw material, the
initial handling and conditions in the processing factories including the time after catch
before processing influenced the shelf-life. Improper icing and handling of raw material,
leading to higher temperature of the fillets, especially influenced the development of P.
phosphoreum, but growth of H2S-producing bacteria was also accelerated at higher
temperatures contributing to a shorter shelf-life of temperature abused cod fillets. Initial
cooling of the traditionally processed fillets resulted in a lower average temperature of the
fillets during storage and Pseudomonas spp. were dominating under these conditions
resulting in less offensive odors and longer shelf-life. Under superchilling conditions the
growth rate of all the bacterial groups was slower, however, higher levels of TVB-N were
observed at sensory rejection for superchilled fillets stored under chilled conditions (>0
°C). The importance of the H2S-producing bacteria in one batch of superchilled fillets
was related to the initial contamination of the raw material in the processing while P.
phosphoreum was dominating in superchilled fillets produced from another batch. The
spoilage characteristics of superchilled as well as chilled and temperature abused fillets
were mainly explained by high TVB-N content as well as metabolites that the CO sensor
could detect, most likely short chain alcohols, aldehydes and esters. Classification of all
the samples according to sensory quality (Torry score >7 and <7) using the counts of P.
phosphoreum, Pseudomonas spp and H2S-producing bacteria in combination with the
CO sensor and TVB-N value gave 85% correct classification, indicating that these quality
indicators do not adequately describe the quality changes of the samples. Further studies
should include more sensitive detection of the microbial metabolites, including detection
of ketones and other oxidatively or enzymically derived degradation compounds
contributing to the sensory rejection of chilled and superchilled fillets. Superchilling with
the new CBC technique and storage at 0.5 °C resulted in an overall sensory shelf life of
12.5 to 14 days. When combined with superchilled storage at -1.5 °C an extension in
shelf-life to at least 15 days was achieved. Comparing the marketable shelf-life (Torry

score=7) of all the groups tested revealed that the CBC-process increased the shelf-life,
by 2 days, while further storage of such fillets under superchilled conditions gave an
additional 2 days extension.. Such gain in shelf-life is of high economical value since it
would allow the distant transportation of fresh fillets by ship or truck, which is less costly
compared to air freight.
Acknowledgments
The authors thank The Icelandic Centre for Research and the AVS research fund of the
Ministry of Fisheries for partly financing the project. The staff at IFL is thanked for their
valued contribution in chemical, microbial and sensory analysis of samples as well as the
personnel at the participating companies Tangi, Tros and Skaginn for their support.
References
Anonymous 1995. Decision of the European Commission to fix TVB-N limits for certain categories of
fishery products (95/149/EEC) of March 28, 1995.
Ashie IN, Smith JP, Simpson BK. 1996. Spoilage and shelf-life extension of fresh fish and shellfish. Crit
Rev Food Sci Nutr 36(1-2):87-121.
Baranyi J, Roberts TA. 1994. A dynamic approach to predicting bacterial growth in food. Int J Food
Microbiol 23: 277-94.
Castell CH, Greenough F, Dale J. 1959. The action of Pseudomonas on fish muscle: 3. Identification of
organisms producing fruity and oniony odours. J Fish Res Board Can 16(1):13-9.
Chang KLB, Chang JJ, Shiau CY, Pan BS. 1998. Biochemical microbiological and sensory changes of sea
bass (Lateolabrax japonicus) under partial freezing and refrigerated storage. J Agric Food Chem
46(2):682-6.
Dalgaard P, Gram L, Huss HH. 1993. Spoilage and shelf life of cod fillets packed in vacuum or modified
atmospheres. Int J Food Microbiol 19:283-94.
Dalgaard P. 1995. Qualitative and quantitative characterization of spoilage bacteria from packed fish. Int J
Food Microbiol 26:319-33.
Dalgaard P, Mejlholm O, Huss HH. 1996. Conductance method for quantitative determination of
Photobacterium phosphoreum in fish products. J Appl Bacteriol 81:57-64.
Dalgaard P. 2000. Fresh and lightly preserved seafood. In: Man CMD, Jones AA, editors. Shelf life
evaluation of foods. 2nd ed. Maryland, USA: Aspen Publishing Inc. p 110-39.
Debevere J, Boskou G. 1996. Effect of modified atmosphere packaging on the TVB/TMA-producing
microflora of cod fillets. Int J Food Microbiol 31:221-9.
Di Natale C, Olafsdottir G, Einarsson S, Mantin A, Martinelli E, Paolesse R, Falconi C, D’Amico A. 2001.
Comparison and integration of different electronic noses for the evaluation of freshness of cod fish
fillets. Sens Act B77 572-8.
Esaiassen M., Nilsen H, Joensen S, Skjerdal T, Carlehog M, Eilertsen G, Gundersen B, Elvevoll E. 2004.
Effects of catching methods on quality changes during storage of cod (Gadus morhua). Lebensm-Wiss
Technol 37:643–8.
Fennema OR, Powrie WD, Marth EH. 1973. 4-6.2 Kinetics of enzymic reactions in the frozen state. In:
Low-temperature preservation of foods and living matter. New York: Marcel Dekker INC. p 217-39.
Gram L, Huss HH. 1996. Microbiological spoilage of fish and fish products. Int J Food Microbiol 33:121-
37.
Guldager HS, Bøknæs N, Österberg C, Nielsen J, Dalgaard P. 1998. Thawed cod fillets spoil less rapidly
than unfrozen fillets when stored under modified atmosphere at 2°C. J Food Prot 61:1129-36.
Herbert RA, Ellis JR, Shewan JM. 1975. Isolation and identifiaction of the volatile sulphides produced
during chill-storage of North Sea cod (Gadus morhua). J Sci Food Agric 26:1187-94.
Herbert RA, Shewan JM. 1976. Roles played by bacterial and autolytic enzymes in the production of
volatile sulphides in spoiling North Sea cod (Gadus morhua). J Sci Food Agric 27:89-94.
Huidobro A, Lopez-Caballero ME, Mendes R. 2002. Onboard processing of deepwater pink shrimp
(Parapenaeus longirostris) with liquid ice: Effect on quality. Eur Food Res Techn 214:469-75.
Huss HH, Dalgaard P, Gram L. 1997. Microbiology of fish and fish products. In: Luten JB, Börresen T,
Oehlenschlager J, editors. Seafood from producer to consumer; intergrated approach to quality.
Amsterdam, The Netherlands: Elsevier. p 413-30.
Huss HH. 1995. Quality and quality changes in fresh fish. FAO Fisheries Technical Papers - T348. Rome:
Food & Agriculture Organisation of the United Nations & Danish International Development Agency
(FAO/DANIDA). 195 p.
Ingram M, Mackey BM. 1976. Inactivation by cold. In: Skinner FA, Hugo WB, editors. Inhibition and
inactivation of vegetative microbes. London: Academic Press. p 111-151.
Ingram M. 1951. The effect of cold on microorganisms in relation to food. Prot Soc Appl Bacteriol 14:243-
9.
ISO 1993. Sensory analysis - general guidance for the selection, training and monitoring of assessors. Part
1: Selected assessors, 8586-1. Geneva, Switzerland: The International Organization for Standardization.
p 1-10.
Jeyasekaran G, Ganesan P, Jeya Shakila R, Maheswari K, Sukumar D. 2004. Dry ice as a novel chilling
medium along with water ice for short-term preservation of fish Emperor breams, lethrinus (Lethrinus
miniatus). Innov Food Sci Emerg Technol 5:485–93.
Jørgensen BR, Gibson DM, Huss HH.1988. Microbiological quality and shelf life prediction of chilled fish.
Int J Food Microbiol 6:295- 07.

Jørgensen BR, Huss HH. 1989. Growth and activtiy of Shewanella putrefaciens isolated from spoiling fish.
Int J Food Microbiol 9:51-62.
Koutsoumanis K, Nychas GJE. 2000. Application of a systematic experimental procedure to develop a
microbial model for rapid fish shelf life predictions. Int J Food Microbiol 60:171–84.
Lakshmanan R, Jeya SR, Jeyasekaran G. 2002. Survival of amine-forming bacteria during the ice storage of
fish and shrimp. Food Microbiol 19:617-25.
Larsen E, Hyldig G, Dalgaard P, Bech AC, Österberg C. 2003. Consumers and experts responses to fresh
cod fillets. In: Luten JB, Oehlenschläger J, Olafsdottir G, editors. Quality of Fish form Catch to
Consumer. Wageningen, The Netherlands: Wageningen Academic Publishers 2003. p 345-60.
Lauzon HL. 2000. Shelf-life and bacteriological spoilage of American plaice (Hippoglossoides
platessoides). In: Shahidi F, editor. Seafood in health and nutrition, transformation in fisheries and
aquaculture: global perspectives. NF, Canada: A Science Tech. Book, St. John´s. p 327-54.
Lauzon HL, Stefánsson G, Jónsson GP, Sveinsdóttir K. 2002. Sensory quality and shelf life of MAP redfish
(Sebastes marinus) fillets as affected by previous bulk storage of whole fish. J Aquat Food Prod
Technol 11(3/4):251-73.
Lauzon HL. 2003. Notkun Malthus leiðnitækni til hraðvirkra örverumælinga. IFL project report 30-03, 30p
(in Icelandic).
LeBlanc RJ, LeBlanc EL. 1992. The effect of superchilling with CO2 snow on the quality of commercially
processed cod (Gadus morhua) and winter flounder (Pseudopleuronectes americanus) fillets. In: Huss
HH, Jakobsen M, Liston J, editors. Quality Assurance in the Fish Industry. Amsterdam, The
Netherlands: Elsev Sci Pub B.V. p 115-23.
Lee CM, Toledo RT. 1984. Comparison of shelf life and quality of mullet stored at zero and subzero
temperature. J Food Sci 49:317-22.
Lindsay RC, Josephson DB, Olafsdottir G. 1986. Chemical and biochemical indices for assessing the
quality of fish packaged in controlled atmospheres. In: Kramer DE, Liston J, editors. Proceedings of an
International Symposium, University of Alaska Sea Grant Program, Anchorage, Alaska, USA.
Amsterdam, The Netherlands: Elsev Sci Pub B.V. p 221-34.
Losada V, Piňeiro C, Barros-Velásques J, Aubourg SP. 2004. Effect of slurry ice on chemical changes
related to quality loss during European hake (Merluccius merluccius) chilled storage. Eur Food Res
Technol 219:27-31.
Magnussen OM, Nordtvedt TS, Torstveit AK. 1998. Use of partial freezing in the cold chain. In: IIR
Proceeding Series “Refrigeration Science and Technolgy” 1998/6. Paris, France: Intl. Inst. of
Refrigeration. p 363-70.
Magnússon H, Martinsdóttir E. 1995. Storage Quality of fresh and frozen-thawed fish in ice. J Food Sci
60:273-8.
Malle P, Poumeyrol M. 1989. A new chemical criterion for the quality control of fish: Trimetylamine / total
volatile basic nitrogen (%). J Food Protect 52:419-23.

Martens H, Martens M. 1999. Modified Jack-knife estimation of parameter uncertainty in bilinear
modelling by partial least squares regression (PLSR). Food Qual Pref 11:5-16.
Miller III A, Scanlan RA, Lee JS, Libbey, LM. 1973a. Volatile compounds produced in sterile fish muscle
(Sebastes melanops) by Pseudomonas putrifaciens, Pseudomonas fluorescens, and an Achromobacter
species. Appl Microbiol 26 (1):18-21.
Miller III A, Scanlan RA, Lee JS, Libbey LM. 1973b. Identification of the volatile compounds produced in
sterile fish muscle (Sebastes melanops) by Pseudomonas fragi. Appl Microbiol 25 (6):952-5.
Miller III A, Scanlan RA, Lee JS, Libbey LM, Morgan ME. 1973c. Volatile compounds produced in sterile
fish muscle (Sebastes melanops) by Pseudomonas perolens. Appl Microbiol 25:257-61
Oehlenschläger J. 1997. Volatile amines as freshness/spoilage indicators. A literature review. In: Luten J,
Börresen T, Oehlenschläger J, editors. Seafood from producer to consumer, integrated approach to
quality. Amsterdam: Elsevier p 571-88.
Oehlenschläger J. 1998. Suitability of ammonia-N, dimethylamine-N, trimethylamine-N, trimethylamine
oside-N and total volatile basic nitrogen as freshness indicators in seafoods. In: Olafsdottir G, Luten J,
Dalgaard P, Careche M, Verrez-Bagnis V, Martinsdóttir E, Heia K, editors. Methods to determine the
freshness of fish in research and industry. Paris: International Institute of Refrigeration. p 92-9.
Olafsdottir G, Hognadottir A, Martinsdottir E, Jonsdottir H. 2000. Application of an electronic nose to
predict total volatile bases in capelin (Mallotus villosus) for fishmeal production. J Agric Food Chem
48:2353-9.
Olafsdottir G, Martinsdottir E, Jonsson EH. 1997. Rapid gas sensor measurement to determine spoilage of
capelin (Mallotus villosus). J Agric Food Chem 45:2654-9.
Olafsdottir G, Xiuchen L, Lauzon H, Jonsdottir R. 2002. Precision and application of electronic nose for
freshness monitoring of whole redfish stored in ice and modified atmosphere bulk storage. J Aquat
Food Prod Technol 11:229-49.
Olafsdottir G. 2003. Developing rapid olfaction arrays for determining fish quality. In: Tothill IE, editor.
Rapid and on-line instrumentation for food quality assurance. Cambridge, England: Woodhead
Publishing Ltd. p 339-60.
Olafsdottir G, Lauzon H, Martinsdottir E, Kristbergsson K. Influence of storage temperature on microbial
spoilage characteristics of haddock fillets (Melanogrammus aeglefinus) evaluated by multivariate
quality prediction. Forthcoming.
Olson JC, Nottingham PM. 1980. Temperature. In: ICMSF Editorial Committee (J.H. Silliker (chairman)).
Microbial Ecology of Foods. Vol. I. ICMSF. New York: Academic Press. 1-37.
Riaz-Fatima R, Khan MA, Qadri RB. 1988. Shelf life of shrimp (Penaeus merguiensis) stored in ice (0°C)
and partially frozen (-3°C). J Sci Food Agric 42:235-47.
Shaw DH, Botta JR. 1975. Preservation of inshore male capelin (Mallotus villosus) stored in refrigerated
sea water. J Fish Res Board Can 32: 2047-53.
Shewan JM, 1962. The bacteriology of fresh and spoiling fish and some related chemical changes. In:
Hawthorn J, Leitch JM, editors. Recent advances in food science 1:167-93.

Shewan JM, Macintosh RG, Tucker CG, Ehrenberg ASC. 1953. The development of a numerical scoring
system for the sensory assessment of the spoilage of wet white fish stored in ice. J Sci Food Agric
4:283-98.
Sivertsvik M, Rosnes JT, Kleiberg GH. 2003. Effect of modified atmosphere packaging and superchilled
storage on the microbial and sensory quality of Atlantic salmon (Salmo salar) fillets. J Food Sci
(4):1467-72.
Smith JSM, Hardy R, MacDonald I, Templeton J. 1980. The storage of herring (Clupea harengus) in ice,
refrigerated sea water and at ambient temperature. Chemical and sensory assessment. J Sci Food Agric
31:375-85.
Tryggvadóttir SV, Olafsdottir G, Einarsson S. 2001. Multisensor for fish: Storage studies of cod in
Reykjavik and Tromsö. Texture, electronic nose (FreshSense), FIGD analysis, RT-Freshmeter and
sensory analysis. RF report 02-01 p 19-24.
Van Spreekens KJA. 1974. The suitability of Long & Hammer's medium for the enumeration of more
fastidious bacteria from fresh fishery products. Archiv fur Lebensmittelhygiene 25 (10):213-19.
Van Spreekens KJA, Toepoel L. 1981. Quality of fishery products in connection with the psychrophilic and
psychrotrophic bacterial flora. In: Roberts TA, Hobbs G, Christian JHB, Skovgaard N, editors.
Psychrotrophic microorganisms in spoilage and pathogenicity. London, UK: Academic Press. p 283-94.
Wold S. 1976. Pattern recognition by means of disjoint principal components models. Pattern recognition
8(3):127-39
Zeng QZ, Thorarinsdottir KA, Olafsdottir G. 2005. Quality changes of shrimp (Pandalus borealis) stored
under different cooling conditions. J Food Sci Forthcoming.

27
Table 1- Overview of average storage temperature, shelf-life estimation and experimental data comparing initial (first sampling day) and final values
measured at or near sensory rejection for all experimental groups of cod fillets stored in styrofoam boxes at different temperatures
Batch 1 Batch 2 Batch 3 (A, B, C, D) (E, F, G) (H, I) A 0°C B 0°C + T D 0 °C + T H 0 °C I 0 °C + T C 0 °C E 0.5 °C F -1.5°C G -1.5/0.5°C
Average temperature of fillets during storage 1.9 ± 0.9 2.0 ± 0.9 3.9 ± 1.9 0.4 ± 0.5 1.9 ± 2.3 -0.9 ± 0.6 -0.3 ± 0.5 -1.3 ± 0.03 -0.8 ± 0.7
Estimated shelf-life (days)b 12 11.5 8 13.5 10.5 12.5 14 >15 15Estimated shelf-life (days)c 11 10.2 7 >15 11.5 11 12 15 15Measurement day of data 12 12 8 d 14 11 12 15 15 15Sensory analysis (Torry score) 9.0 ± 0.2 8.6 ± 0.1 9.0 ± 0.2 5.4 ± 0.2 5.3 ± 0.5 4.0 ± 0.1d 5.6 ± 0.2 5.5 ± 0.1 5.9 ± 0.4 5.4 ± 0.4 5.7 ± 0.2 5.6 ± 0.5
TVC (log 10 CFU/ g)3.9 ± 0.0 (A,B) 4.8 ± 0.0 (C) 7.0 ± 0.1 (D)
5.0 ± 0.2 4.2 ± 0.1 8.1 ± 0.1 8.0 ± 0.1 7.8 ± 0.1 8.0 ± 0.1 8.0 ± 0.1 7.9 ± 0.1 8.0 ± 0.1 8.0 ± 0.1 8.1 ± 0.5
H2S-producer counts2.8 ± 0.1 (A,B) 3.0 ± 0.0 (C) 3.4 ± 0.5 (D)
2.3 ± 0.6 2.3 ± 0.7 7.0 ± 0.2 6.1 ± 0.1 6.2 ± 0.2 7.1 ± 0.0 6.6 ± 0.0 5.9 ± 0.4 7,4 ± 0.1 7,6 ± 0.2 7,5 ± 0.7
% H2S-producers / TVC 7.0% 1.4% 2.6% 12.9% 3.7% 1.0% 25.1% 36.3% 24.0%
Pseudomonas counts3.1 ± 0.3 (A,B) 3.5 ± 0.1 (C) 3.8 ± 0.0 (D)
3.4 ± 0.3 2.8 ± 0.1 6.6 ± 0.6 6.4 ± 0.4 4.4 ± 0.1 7.5 ± 0.3 7.4 ± 0.1 5.8 ± 0.5 6.4 ± 0.1 6.5 ± 0.2 6.5 ± 0.4
% Pseudomonas spp. / TVC 4.9% 3.0% 0.04% 37.5% 25.4% 0.2% 2.5% 2,9% 2,4%
P. phosphoreum counts2.7 ± 0.4 (A,B)
3.1 ± 0.3 (C) 6.0 ± 0.3 (D)
2.2 ± 0.7 1.3 ± 0.5 7.2 ± 0.1 7.2 ± 0.1 7.1 ± 0.4 7.2 ± 0.1 7.4 ± 0.1 6.8 ± 0.2 6.8 ± 0.1 6.0 ± 0.1 6.7 ± 0.1
% P. phosphoreum / TVC 12.6% 16.2% 12.7% 17.2% 24.0% 6.7% 6.3% 0.9% 3.8%
TVB-N (mg N / 100 g)12.2 ± 0.3 (A,B) 12.4 ± 1.2 (C) 18.0 ± 1.4 (D)
12.1 ± 0.5 12.4 ± 0.9 48.5 ± 0.9 47.5 ± 0.1 94 ± 15d 26.6 ± 0.6 33.6 ± 5.3 53.4 ± 0.4 55.8 ± 4.7 38.4 ± 5.0 38.7 ± 1.6
pH6.70 ± 0.01 (A,B) 6.58 ± 0.06 (C) 6.55 ± 0.11 (D)
6.78 ± 0.13 6.90 ± 0.03 6.85 ± 0.09 6.73 ± 0.04 6.85 ± 0.05 6.86 ± 0.03 6.91 ± 0.08 7.00 ± 0.04 6.91 ± 0.01 6.92 ± 0.06 6.98 ± 0.02
CO sensor (nA)37 ± 5 (A,B) 42 ± 2 (C)
232 ± 70 (D) 34 ± 20 14 ± 5 366 ± 72 439 ± 165 215 ± 65 98 ± 29 253 ± 22 158 ± 89 300 ± 156 136 ± 43 225 ± 108
NH3 sensor (nA) <10 <10 <10 <10 23 ± 6 34 ± 13 <10 33 ± 8 52 ± 13 <10 <10 <10H2S sensor (nA) <20 <20 <20 <20 21 ± 24 20 ± 6 35 ± 8 22 ± 11 <20 20 ± 3 28 ± 33 <20a) Initial values on first day of sampling (days after catch): Groups A, B, C (day 4), group D (day 6), goups E, F, G, H and I (day 2)b) total shelf life, including days from catch, based on the sensory evaluation of cooked fish (Torry score = 5.5) c) total shelf life, including days from catch, based on TVB-N = 35 mgN/g d) values for sensory and TVB-N data for group D from measurements on day 10
Initial valuesa Data at sensory rejectionTraditional process and temperature abuse Superchilling process

28
Table 2. - Maximum specific growth rate (h-1) of different bacterial groups (Pseudomonas spp., P. phosphoreum, H2S-producing bacteria) assessed by
curve fitting using DMFit in cod fillets stored in styrofoam boxes under different temperature conditions
A 0°C B 0°C + T D 0 °C + H 0 °C I 0 °C + C 0 °C E 0.5 °C F -1.5°C G -1.5/0.5°C
TVC 0.063 0.117 0.028 0.034 0.114 0.035 0.035 0.031 0.024(28.4 h)a (49.9 h)a (48.9 h)a
Pseudomonas spp. 0.039 0.085 0.040 0.039 0.089 0.022 0.031 0.026 0.024(38.8 h)a (32.1 h)a (29.5 h)a
S. putrefaciens 0.039 0.062 0.079 0.043 0.124 0.030 0.043 0.034 0.042 (59.5 h)a (38.9 h)a
P. phosphoreum 0.377 0.153 0.035 0.055 0.442 0.042 0.072 0.059 0.034(60.1 h)a (44.2 h)a (52.9 h)a (75.2 h)a (105.6 h)a
a estimated lag phase (h); b high initial counts
Traditional process and temperature abuse Superchilling process

29
Table 3 - Correlation (r2) and the error of prediction (root mean square error of prediction
RMSEP) for different PLSR models based on the measured variables (X): chemical (TVB-N,
pH), microbial (TVC, Pseud, Pp, H2S counts), electronic nose (CO, NH3, H2S, SO2) to predict the
sensory Torry scores (Y) of differently treated cod fillets.
No of Correlation
X variables r2 RMSEP N
All variables measured sensors (4), microbes (4), TVB-N and pH 10 0.97 0.29 41Microbial counts TVC, Pseud, Pp, H2S counts 4 0.96 0.32 40
Electronic nose CO, NH3, H2S, SO2 4 0.70 0.80 40
Classical TVB-N, TVC, pH 3 0.92 0.45 41E-nose+ TVB-N + SSO CO, TVB, Pseud, H2S counts, Pp 5 0.97 0.30 41

30
Fig. Captions Figure 1- Influence of processes, initial average temperature (first day after packing) and
average temperature of the fillets during storage on the shelf-life of experimental groups
from different factories processed from different batches. Values next to experimental
groups labels (A, B, C, D, E, F G, H and I) indicate the sensory shelf-life (days from
catch). Temperature conditions of each group are shown in circles and abusive
temperature treatments in triangles (RT = room temperature).
Figure 2 - a) Temperature profiles and b) sensory analysis (Torry score) of cod fillets
from storage studies of traditionally processed and temperature abused experimental
groups from batch 1 in factory I (A 0 °C (-■-); B 0 °C + post processing abuse (--); D 0
°C + pre- and post processing abuse (-x-) and experimental groups from batch 3 in
factory II (H 0°C (-♦-); I 0 °C + abused (- ◊ -)). Lines indicate limit of sensory rejection
(Torry score = 5.5) and marketable shelf-life (Torry score = 7.0).
Figure 3 - a) Temperature profiles and b) sensory analysis (Torry score) of cod fillets
from superchilled experimental groups in factory I from batch 1 (C 0 °C new (--■--) and
batch 2 (E 0.5 °C (-▲-); F -1.5 °C (-●-); G – 1.5 °C / 0.5 °C (-o-)). Lines indicate limit of
sensory rejection (Torry score = 5.5) and marketable shelf-life (Torry score = 7.0).
Figure 4 - Counts of a) total viable psychrotrophic bacteria (TVC), b) P. phosphoreum
(Pp), c) presumptive Pseudomonas spp. and d) H2S-producing bacteria in traditionally
processed and temperature abused experimental groups of cod fillets stored in styrofoam
boxes: A 0 °C (-■-), B 0 °C + post processing abuse (--) and D 0 °C + pre- and post
processing abuse (-x-) from batch 1. Groups H 0°C (-♦-) and I 0 °C + abused (- ◊ -) from
batch 3.
Figure 5 - Counts of a) total psychrotrophic bacteria (TVC), b) P. phosphoreum (Pp)
counts. c) presumptive Pseudomonas spp and d) H2S-producing bacteria in superchilled
experimental groups of cod fillets stored in styrofoam boxes under different conditions: C

31
0 °C new (--■--) from batch 1 and E 0.5 °C (-▲-), F -1.5 °C (-●-)and G – 1.5 °C / 0.5
°C ( -o-) from batch 2.
Figure 6 - TVB-N values in a) traditionally processed and temperature abused
experimental groups: A 0 °C (-■-), B 0 °C + post processing abuse (--), D 0 °C + pre-
and post processing abuse (-x-), H 0°C (-♦-) and I 0 °C + abused (- ◊ -). b) superchilled
experimental groups: C 0 °C (--■--), E 0.5 °C (-▲-), F -1.5 °C ( -o-) and G – 1.5 °C / 0.5
°C (-●-). Dotted line indicates the limit of acceptability TVB-N = 35mg N/100g
Figure 7 - Electronic nose CO sensor response a) in traditionally processed and
temperature abused experimental groups: A 0 °C (-■-), B 0 °C + post processing abuse (-
-) and D 0 °C + pre- and post processing abuse (-x-) from batch 1. H 0°C (-♦-) and I 0
°C a + abused (- ◊ -) from batch 3. b) in superchilled experimental groups: C 0 °C (--■--)
from batch 1 and E 0.5 °C (-▲-), F -1.5 °C ( -o-) and G – 1.5 °C / 0.5 °C (-●-) from
batch 2.
Figure 8 - PLSR correlation loadings based on all the measured variables: TVC,
pseudomonads, H2S counts, Photobacterium phosphoreum (PP), TVB-N, pH, Tacc and
electronic nose sensors (CO, NH3, SO2 and H2S) as predictors (X) for the Torry scores as
a response variable (Y) for the cod samples stored at different temperatures. The outer
and the inner ellipses indicate 100% and 50% explained variance, respectively.
Significant variables (p<0.05) are symbolised with small circles.
Figure 9 - Biplot for the principal components of a PLSR model (r2=0.94; RMSEP=0.49)
based on all the data (N=41) of cod fillets stored at different temperatures and 5 variables:
P. phosphoreum, pseudomonads, H2S-producers, TVB-N and the electronic nose CO
sensor as predictors for the response variable (Torry score). Samples are labeled with
letters indicating storage groups (A, B, C, D, E, F,G, H and I) and storage days. The
arrow shows the spoilage trend of the samples with increasing storage time and the
samples encircled (dotted line) in the middle were badly described by the variables.

32
Figures
-2-10123456789
10
D A B C E G F I H
Ave
rage
tem
pera
ture
°C
Initial temperature Average temperature in storage
D 8d
B 11.5dA 12 d
C 12.5 d
I 10.5 d
H 13.5 d
Batch 3 (ice)
E 14.5 dG 15 d F 15+d
Batch 2 (ice slurry)
Factory I Factory II
Traditional process (no cooling)
Superchilling process
Traditional process
(cooling)
!RT 8h
-1.5°C
0.5 °C
0.5°C
!RT 8h
!RT 16h
0.5 °C
!17°C 16h
Batch 1 (ice)
0.5 °C
Days
1
2
3
4
5
6
7
8
9
10
11
12
13
14
15
Temperature of fillets in experimental groups
-2-10123456789
10
D A B C E G F I H
Ave
rage
tem
pera
ture
°C
Initial temperature Average temperature in storage
D 8d
B 11.5dA 12 d
C 12.5 d
I 10.5 d
H 13.5 d
Batch 3 (ice)
E 14.5 dG 15 d F 15+d
Batch 2 (ice slurry)
Factory I Factory II
Traditional process (no cooling)
Superchilling process
Traditional process
(cooling)
!RT 8h
!RT 8h
-1.5°C
0.5 °C0.5 °C
0.5°C
!RT 8h
!RT 8h
!RT 16h
!RT 16h
0.5 °C0.5 °C
!17°C 16h
!17°C 16h
Batch 1 (ice)
0.5 °C0.5 °C
Days
1
2
3
4
5
6
7
8
9
10
11
12
13
14
15
Days
1
2
3
4
5
6
7
8
9
10
11
12
13
14
15
Temperature of fillets in experimental groups
FIGURE 1.

33
-2
0
2
4
6
8
10
12
14
0 2 4 6 8 10 12 14Days from catch
Tem
pera
ture
°C
A
B
D
H
I
B
D
A H
I
a)
3
4
5
6
7
8
9
10
0 2 4 6 8 10 12 14 16Days from catch
Torr
y sc
ore
A 0°C B 0°C + TD 0 °C + T
H 0 °C I 0 °C + T
sensory rejection Torry = 5.5
b)
FIGURE 2.
-2
-1.5
-1
-0.5
0
0.5
1
1.5
2
2.5
3
0 2 4 6 8 10 12 14 16Days from catch
Tem
pera
ture
°C
C
E
F
G
F
C
E
G
a)
3
4
5
6
7
8
9
10
0 2 4 6 8 10 12 14 16Days from catch
Torr
y sc
ore
C 0 °C newE 0.5 °CF -1.5°CG -1.5/0.5°C
sensory rejection Torry = 5.5
b)
FIGURE 3.
34
1.0
2.0
3.0
4.0
5.0
6.0
7.0
8.0
9.0
0 2 4 6 8 10 12 14 16Days from catch
TVC
log
CFU
/g
A 0°C
B 0°C + T
D 0 °C + T
H 0 °C
I 0 °C + T
a)a)
1.0
2.0
3.0
4.0
5.0
6.0
7.0
8.0
9.0
0 2 4 6 8 10 12 14 16Days from catch
Pp lo
g C
FU/g
A 0°C
B 0°C + T
D 0 °C + T
H 0 °C
I 0 °C + T
b)
1.0
2.0
3.0
4.0
5.0
6.0
7.0
8.0
9.0
0 2 4 6 8 10 12 14 16Days from catch
Pseu
d lo
g C
FU/g
A 0°C
B 0°C + T
D 0 °C + T
H 0 °C
I 0 °C + T
c)
1
2
3
4
5
6
7
8
9
0 2 4 6 8 10 12 14 16Days from catch
H2S
cou
nts
log
CFU
/g
A 0°C B 0°C + T
D 0 °C + TH 0 °C
I 0 °C + T
d)
FIGURE 4.

35
1.0
2.0
3.0
4.0
5.0
6.0
7.0
8.0
9.0
0 2 4 6 8 10 12 14 16Days from catch
TVC
log
CFU
/g
C 0 °C new
E 0.5 °C
F -1.5°C
G -1.5/0.5°C
a)
1.0
2.0
3.0
4.0
5.0
6.0
7.0
8.0
9.0
0 2 4 6 8 10 12 14 16Days from catch
Pp lo
g C
FU/g
C 0 °C newE 0.5 °CF -1.5°CG -1.5/0.5°C
b)
1.0
2.0
3.0
4.0
5.0
6.0
7.0
8.0
9.0
0 2 4 6 8 10 12 14 16Days from catch
Pseu
d lo
g C
FU/g
C 0 °C newE 0.5 °CF -1.5°CG -1.5/0.5°C
c)
1
2
3
4
5
6
7
8
9
0 2 4 6 8 10 12 14 16Days from catch
H2S
cou
nts
log
CFU
/g
C 0 °C new
E 0.5 °C
F -1.5°C
G -1.5 / 0.5°C
d)
FIGURE 5.

36
0
10
20
30
40
50
60
70
80
90
100
0 2 4 6 8 10 12 14 16Days from catch
TVB-
N m
g N
/100
g
A 0°C B 0°C + TD 0 °C + T
H 0 °C I 0 °C + T
a)
0
10
20
30
40
50
60
70
80
90
100
0 2 4 6 8 10 12 14 16Days from catch
TVB-
N m
g N
/100
g
C 0 °C newE 0.5 °C
F -1.5°CG -1.5/0.5°C
b)
FIGURE 6.

37
0
100
200
300
400
500
600
700
800
0 2 4 6 8 10 12 14 16Days from catch
Res
pons
e C
O s
enso
r (nA
)
A 0°C B 0°C + T
D 0 °C + TH 0 °C
I 0 °C + T
a)
0
100
200
300
400
500
600
700
800
0 2 4 6 8 10 12 14 16Days from catch
Res
pons
e C
O s
enso
r (nA
)
C 0 °C new
E 0.5 °C
F -1.5°C
G -1.5 / 0.5°C
b)
FIGURE 7.

38
FIGURE 8.
FIGURE 9.
Traditional A, B, D
Superchilled C
Traditional H, I
Superchilled E, F, G

___________________________________________________________________
PAPER VI ___________________________________________________________________ Characterization of Volatile Compounds in Chilled Cod (Gadus morhua) Fillets by Gas Chromatography and Rapid Detection of Quality Indicators by an Electronic Nose Guðrún Ólafsdóttir, Rósa Jónsdóttir, Hélène L. Lauzon, Joop B. Luten and Kristberg Kristbergsson ___________________________________________________________________ Submitted for publication
VI

1
Characterization of Volatile Compounds in
Chilled Cod (Gadus morhua) Fillets by Gas
Chromatography and Rapid Detection of Quality
Indicators by an Electronic Nose
Gudrun Olafsdottir∗ψ, Rosa Jonsdottirψ , Hélène L. Lauzonψ, Joop Lutenδ and Kristberg
Kristbergssonϒ
ψIcelandic Fisheries Laboratories, Skulagata 4, 101 Reykjavík, Iceland
δ Norwegian Institute of Fisheries and Aquaculture Research, Muninbakken 9-13, 9291
Tromsö, Norway
ϒ cDepartment of Food Science, University of Iceland, Hjardarhagi 2 - 6, 107 Reykjavik,
Iceland
TITLE RUNNING HEAD: Volatile compounds as quality indicators for cod fillets
∗ To whom correspondence should be addressed. E-mail: [email protected]. Tel.: +354
5308600, Fax: +354 5308601

2
ABSTRACT
Volatile compounds in cod fillets packed in styrofoam boxes were analyzed during
chilled storage (0.5 °C) by GC-MS and GC-O to screen potential quality indicators
present in concentrations high enough for detection by an electronic nose. On day 12
when the fillets were rejected by sensory analysis, ketones, mainly 3-hydroxy-2-
butanone, were detected in the highest level (33 %), followed by amines (TMA) (29%),
alcohols (15%), acids (4%), aldehydes (3%) and a low level of esters (<1%). The
electronic nose’s CO sensor showed increasing response with storage time coinciding
with the production of ethanol and 2-methyl-1-propanol that were produced early in the
storage, followed by the production of 3-methyl-1-butanol, 3-methyl-butanal, 2,3-
butandiol and ethyl acetate. Lipid derived aldehydes, like hexanal and decanal were
detected in similar levels throughout the storage time and contributed to the overall sweet
odors of cod fillets in combination with other carbonyls (3-hydroxy-2-butanone,
acetaldehyde, 2-butanone, 3-pentanone and 6-methyl-5-heptene-2-one).
KEYWORDS: Volatile compounds; quality indicators; gas chromatography; electronic
nose; cod fillets
3
INTRODUCTION
The use of electronic nose based on different sensor technologies has been suggested for
the rapid detection of quality related volatile compounds for various food products (1-3)
including monitoring the quality and spoilage processes in fish (4-12). Gas sensors that
are commonly used in electronic noses are non-selective towards individual compounds,
but show sensitivity towards certain classes of compounds. This property induces their
potential for monitoring quality and the onset of spoilage associated with varying levels
of different classes of volatile compounds produced in fish during storage (13-14). The
progression of characteristic odors in fish during chilled storage caused by microbial
growth is well documented (15-17) and has been associated with the formation of volatile
compounds produced by the main spoilage organisms (18-21). Both single compounds
and a combination of compounds representing the different changes occurring during
storage have been suggested as indicators for freshness and spoilage (22-31).
Alcohols, aldehydes, ketones, amines and sulfur compounds have been identified in
different seafood products during chilled storage and related to the growth of specific
spoilage organisms (SSOs) (32-34). However, because of the interaction of the
microorganisms (35-36) and the complexity of the dynamic spoilage changes the levels
of the volatile compounds may vary and they are often not detected until the products are
overtly spoiled. Storage temperature, packaging and the inherent composition of
available nutrients in the fish influence the growth and spoilage potential of the
dominating SSO. The SSO in chilled fish are mainly Gram-negative, psychrotrophic
bacteria like Pseudomonas spp. and Shewanella spp. (37). Pseudomonads typically cause
sweet, malty, fruity, and onion like odors contributed by alcohols, carbonyls, esters and
sulfur compounds (18,19), while S. putrefaciens can produce more potent odors related to
high levels of sulfur compounds and fishy odors because of reduction of TMAO to TMA
(38,21). Photobacterium phosphoreum, is also of interest as SSO in chilled fish and has
been identified as an active TMA producer in iced cod, and in cod fillets (39-40) and
more recently in modified atmosphere packed fish (41-43). Oxidative processes occurring
during storage of fish will also result in the accumulation of both saturated and
unsaturated aldehydes that contribute to the development of rancid cold store flavors (44-
45).

4
The information on the identity and quantity of volatile compounds present in the
headspace during storage of fish is essential when selecting sensors in an array for quality
monitoring of fish (14). It should be clearly stated that in many cases, the most abundant
volatiles may have minimal odor significance. However, they may be indicative for the
degradation processes occurring in the products like the production of metabolites by the
SSOs. Therefore, the potential ability of the electronic nose to monitor quality is not
necessarily directly related to detecting the most influential aroma active compounds
contributing to off odors, since these may be present in too low concentrations.
The aim of the study was to screen the most abundant volatile compounds produced by
SSOs that could be used as quality indicators for chilled fillets. This study was done in
parallel to extensive storage studies on cod fillets (46) where the SSOs were monitored
and the sensory shelf-life was determined. Herein are the results from gas
chromatography analysis of cod fillets stored in Styrofoam boxes under chilled
conditions (0.5 °C) and comparison was made with electronic nose analysis, TVB-N and
pH measurements. The results obtained will be useful to characterize the spoilage
potential of the SSO and to guide the future development of the electronic nose technique
based on selecting sensors that are sensitive to the indicator compounds identified in
chilled cod fillets.
MATERIALS AND METHODS
The fish was processed by a conventional process three days after catch as described
earlier (46). The process includes mechanical filleting, deskinning and packing of fillets
in styrofoam (EPS, expanded polystyrene) boxes (160 x 400 x 263 mm) lined with a
plastic bag. The fillets were stored at 0.5 °C until analyzed. Gas chromatography analysis
(GC-MS and GC-O), electronic nose, TVB-N and pH measurements were performed on
days 4, 7, 10, 12 and 14 after catch
GC-MS measurements. The headspace from approximately 500 g of fish (1-2 fillets)
in a glass container (2.3L, Ø 17 cm) was collected by an air pump sampling (ALPIN-2,
Air sampler, METEK) by sweeping volatiles from the surface of the fish. Aqueous
heptanoic acid ethyl ester solution (10 µL/L) was used as an external standard, using an
amount of 1 mL in a 25 mL beaker (Ø 3.5 cm) located in the glass sampling container.

5
Quantification of volatiles PAR (peak area ratio) was based on comparison of peak area
to the peak area of the external standard. Sampling time was 2 hours at room temperature
(RT) (20 to 22 °C) using a flow rate of approximately 100 mL/min. Duplicate headspace
samples were collected on 250 mg Tenax 60/80 (Alltech, IL) in stainless steel tubes
(Perkin-Elmer, Buchinghamshire, UK). Volatiles were thermally desorbed (ATD 400,
Perkin-Elmer, Buchinghamshire, UK) from the sampling tubes prior to separation on a
DB-5ms column (30 m × 0.25 mm i.d. × 0.25 µm, J&W Scientific, Folsom, CA, USA)
using a GC-MS (HP G1800C GCD, Hewlett-Packard, Palo Alto, CA, USA). Helium was
used as a carrier gas and the following temperature program was used: 50°C for 7 min,
50°C to 120°C at 5°C/min and from 120°C to 220°C at 10°C/min. The injector
temperature was 250°C and the detector temperature was 280°C. The mass detector ion
range was 35-300 m/z.
GC-O measurements. Samples were prepared by weighing 100 ± 2 g of fish fillets
and 100 ± 5 g of saturated aqueous solution of NaCl into a 250 mL and blended manually
in a round bottom flask. Saturated NaCl solution (200 ± 5 g) was prepared as a reference
sample. Heptanoic acid ethyl ester was added as an internal standard to all samples by
adding 1 mL of 10 µL/L aqueous solution of the standard to the 200 g fish and NaClsat
solution to evaluate the extraction based on the FID response. The sample was purged at
RT with nitrogen at about 100 mL/min for 2.5 hours. Volatiles were collected on 150 mg
Tenax in a Pasteur pipette. Each sample was prepared in duplicate. Volatiles were
extracted from the Tenax traps with 1 mL diethyl ether. The sample was concentrated by
passing nitrogen over the solution leaving a small amount of sample (20-30 µL) and 1µL
was then injected splitless onto the column. Measurements were performed on a GC (HP
5890, Hewlett-Packard, Palo Alto, CA) with the same type of column and the same
conditions as for the GC-MS measurements. The end of the column was split 1:1 between
flame ionization detector (FID) and an ODO-1 olfactory detector outlet (SGE
International Pty. Ltd, Australia). Nitrogen bubbled through water to add moisture was
used to drive the sample to the sniffer port. Two trained panelist with former experience
in describing seafood odor sniffed the effluent. Description of each odor and its duration
in time was recorded and the intensity evaluated using a category scale with a description
of intensity of odor at each score (47-48); 0 none; 0.5 thresholds or just detectable; 1

6
slight; 2 little; 3 moderate; 4 strong and 5 very strong. GC-O analysis were done on days
4, 10 and 17.
Identification of volatiles was done by matching retention indices (RI) of ethyl esters
and mass spectra of samples with authentic standards (Sigma-Aldrich Chemical Co. St.
Louis, MO, USA). Tentative identifications were based on the MS library data in the HP
GCD ChemStation software (Hewlett Packard Co, 1997) and manually checked against
literature sources and the database Flavornet (49).
Electronic nose measurements The electronic nose instrument (FreshSense, Bodvaki-
Maritech, Kópavogur, Iceland) is based on four electrochemical gas sensors: CO, H2S,
SO2 (Dräger, Luebeck, Germany); NH3 (City Technology, Portsmouth, Britain). The
measurements were performed at room temperature as described earlier (9).
Approximately 500g of fish fillets were weighted and tempered for 30 minutes in the
sampling container (2.3 L, Ø 17 cm). Measurement time was 5 minutes and temperature
of fillets reached 8 to 12°C before measurements started. All measurements were done in
duplicate.
TVB-N and pH measurements. Total volatile basic nitrogen content (TVB-N) was
measured by the steam distillation method described by Malle and Poumeyrol (50). The
pH was measured in 5 grams of mince moistened with 5 mL of deionized water. The pH
meter was calibrated using buffer solutions of pH 7.00 ± 0.01 and 4.01 ± 0.01 (25°C)
(Radiometer Analytical A/S, Bagsvaerd, Denmark).
Data analysis. Statistical analysis was carried out with the Number Cruncher
Statistical Software (NCSS) 2000, using ANOVA. In case of statistical significance, the
Duncan's multiple range was performed. An effect was considered significant at the 5%
level.
RESULTS AND DISCUSSION
Volatile compounds in cod fillets analyzed by GC – potential quality indicators
Volatile compounds detected in the highest level by GC-MS and dominating SSO:
TMA, 2-methyl-1-propanol (isobutanol) and 3-hydroxy-butanone (acetoin) were detected
in the highest amount in cod fillets and their levels increased with storage time (Table 1).

7
However, dynamic changes in their level were noticed, which could be related to the
growth of the spoilage bacteria. An initial decline of the pH (Fig. 1) could be explained
by the post mortem changes in chilled fish which are initially dominated by autolytic
activity, including degradation of nucleotides, accumulation of hypoxhanthin, lowering
of pH and endogenous enzyme activity (51). Proliferation of the microflora follows these
changes and development of microbial metaboliltes contributing to spoilage changes as
seen by increased pH value coinciding with the detection of trimethylamine (TMA) and
higher TVB-N values on day 12 (Fig. 1). TMA has been suggested as a spoilage indicator
since its level increases at later stages of storage (29), while DMA (dimethylamine)
which forms enzymically very early after harvest of fish has been suggested as a
freshness indicator along with its precursor TMAO (trimethylamine oxide) (24).
In the parallel study on sensory and microbiological changes of packed cod fillets (46)
the shelf-life was determined as 12 days by sensory analysis using the Torry scheme (16).
TMA and acetoin which were present in the highest concentration on day 12 (Table 1)
have earlier been associated with dominating P. phosphoreum growth (40). Increasing
levels of acetoin were detected on day 7 coinciding with a rapid P. phosphoreum growth
reaching counts of log 7.2 CFU/g at sensory rejection. P. phosphoreum was identified as
the main SSO in the cod fillets based on its high counts throughout the storage time and
was found in the highest levels (12.6 %) at the end of shelf-life, while Pseudomonas spp.
and H2S-producing bacteria represented 4.9 % (log 6.6 CFU/g) and 7% (log 7 CFU/g),
respectively, of the total microflora at sensory rejection. (46).
The variation in GC analysis for duplicate samples was high for the very volatile
compounds like TMA and ethanol (Table 1), most likely because of their high
breakthrough volume on the Tenax and also the fact that in some cases compounds with
RI<173 coeluted and made both identification and quantification difficult. This was the
case for ethanol, TMA and dimethyl sulfide as well as 2-methyl-1-propanol which was
also identified as pentane in the MS library database (Table 1).
Characteristic odor of cod fillets: The overall odor of the fillets was observed as a
mild and sweet odor that became sour, fruity and stale during storage and much less
potent odors developed on the fillets than are generally observed on whole fish.
Characteristic odor development during storage of the fillets could be explained by the
odor description and odor scores for the individual compounds analyzed by GC-O (Table

8
1). The odor impact of the different compounds was also evaluated based on their amount
in the samples measured by GC-MS and the reported odor threshold (OU (Odor Unit) =
PAR / odor threshold x 1000) to determine the potential contribution of the individual
compounds at sensory rejection on day 12. The GC-O scores were generally low but
increased with storage time in agreement with the increased level of the compounds
measured by GC-MS. The values and ranges of the GC-O odor scores detected on days 4,
10 and 17 are shown in Table 1. The most potent odor described as spicy, flowery, sweet,
onion and mushroom-like, was detected at RI 457 in all samples during storage, with
increasing odor scores with time of 3 (moderate) to 4.8 (very strong). This complex odor
is most likely contributed by coeluting compounds in low concentrations which were not
detected by GC-MS. Aldehydes appeared to influence the characteristic odors of the fresh
fillets throughout the whole storage time and decanal had the highest odor impact as
evaluated by OU (1200-24000), but 3-methyl-butanal and heptanal, probably in
combination with methional and 2-heptenal that are known to coelute at the same
retention time (12), received the highest odor scores of the aldehydes by GC-O (Table 1).
TMA is a potent odorant with a characteristic fishy, dried fish, ammonia-like odor as
detected by GC-O and received high odor scores. The odors of esters and sulfur
compounds were detected by GC-O at advanced spoilage on day 17.
The calculated odor unit values for the volatiles detected by GC-MS on day 12 when
the end of shelf-life was determined by sensory analysis are shown in Table 1. The
reported odor threshold of TMA varies but values as low as 0.3 ppb have been reported
(52) (Table 1). The calculated OU based on the different odor thresholds showed that
TMA had by far the highest odor impact on day 12 with two to three orders of magnitude
higher OU than the straight chain aldehydes (nonanal and decanal) that appeared to have
a high odor impact as well, based on their odor threshold values. The high levels of
acetoin suggested that this compound could contribute to the onset of spoilage odors in
cod fillets (Table 1). The odor of acetoin has been described as butter- cream like (49),
but a mild, sweet-sour like odor was detected by GC-O (Table 1). However, acetoin
appeared to have less odor impact (OU=119) than the aldehydes (decanal and nonanal)
because of its higher odor threshold (800 ppb), even though it was present in much higher
levels. Aldehydes have generally low odor thresholds (~ 0.1 to 4.5 ppb) and therefore
their odor impact was greater than the alcohols (odor thresholds range 0.4 to 270 ppm)

9
and the ketones (odor thresholds range 0.05 to 70 ppm) although their overall levels were
less (Table 1). It appears that even though the alcohols like 2-methyl-1-propanol and
aldehydes like decanal were detected in lower levels on day 12 than on day 10 (p<0.05),
the presence of the more potent odorants like TMA on day 12 overpowered the odor and
contributed to the sensory rejection of the fillets. Ethyl acetate was first detected on day
12 and probably also influenced the overall spoilage odor development based on its OU
value (0.1-120) in combination with the other compounds detected on day 12.
Additionally, the change in the pH value on day 12 may have influenced the overall odor
perception and synergistic effects may have occurred. For example, TMA has been noted
for intensifying fishiness by a synergistic action with certain volatile unsaturated
aldehydes derived from autoxidation of polyunsaturated fatty acids (53). The possible
influence of other compounds present in lower levels like the unsaturated autoxidatively
derived aldehydes should not be overlooked, but the sampling techniques used in our
study were not sensitive enough to allow detection of these compounds. The main aim
was to detect the compounds present in the highest concentration in the headspace for
evaluation of potential quality indicators for electronic nose detection.
Alcohols, carbonyls, esters and acids. The dynamic changes in the levels of the most
abundant alcohols, esters, acids and carbonyls are demonstrated in Figs. 2 and 3. Ethanol
was detected in high levels initially, followed by an increase in 2-methyl-1-propanol, 3-
methyl-1-butanol, 2,3-butandiol, 3-methyl-butanal, and ethyl acetate (Fig. 2). The early
detection of the ethanol and 2-methyl-1-propanol is of interest to monitor the initial
changes related to the loss of freshness before the obvious spoilage signs appear.
However, their levels did not increase continuously with time.
The initial production of ethanol in spoilage of fish has been related to the utilization
of carbohydrate sources, while the formation of branched-chain alcohols and aldehydes
like 2-methyl-1-propanol, 3-methylbutanol and 3-methyl-butanal probably originate from
degradation of valine and leucine, respectively (28). The branched chain aldehyde, 3-
methyl butanal, is characterized by a malty and caramel like odors (54), which was
perceived as a sweet, caramel and fish fillet like odor by GC-O (Table 1). The
corresponding alcohol 3-methyl-1-butanol, and 2-methyl-1-propanol exhibit alcoholic
and fruity odours. 3-methyl -1-butanol was first detected on day 10 and significant
continuous increases (p<0.05) were seen with time. Levels of 2-methyl-l-propanol were

10
much higher but as discussed above its level fluctuated with time. The flavor thresholds
of the alcohols are high compared with the carbonyls and their odors were not detected
by GC-O and therefore they probably did not contribute much to the overall odor of the
fillets as seen by the low OU value on day 12 (Table 1). On the basis of odor evaluation
3-methyl-butanal in combination with acetaldehyde, methional, 1,5-octadiene-3-one, 2,6-
nonadienal and 2,4-decadienal were determined as character impact odorants of boiled
cod and the malty flavour of 3-methyl butanal was suggested to be mainly responsible for
the malty off flavor defect of boiled cod by Milo and Grosch (55).
The formation of acetic acid and a decline in the ethanol level were observed on day
10 followed by the detection of ethyl acetate at the end of the shelf-life on day 12 and a
sickenly sweet odor detected by GC-O on day 17 and identified as ethyl butanoate. The
formation of esters suggested the activity of Pseudomonas fragi (18). At the end of the
shelf-life on day 12 the counts of Pseudomonas spp. reached log 6.6 CFU/g (data from
the parallel study) (46) and increasing level of ethyl acetate was seen on day 14 and much
higher levels on day 17 at overt spoilage (Table 1). Esters have low odor thresholds and
are known to contribute to sweet and fruity spoilage odors at advanced stages of spoilage.
Similarly, ethanol, 3-methyl-1-butanol, 2-methyl-1-propanol, 3-hydroxy-2-butanone,
ethyl acetate and butanoic acid ethyl ester were the most abundant volatiles in the
headspace of haddock stored in ice associated with the growth of Pseudomonas spp. in an
earlier study on packed haddock fillets stored under chilled conditions (56).
Pseudomonas species have also been found responsible for the formation of volatile
sulfides, alcohols (3-methyl-1-butanol, 1-penten-3-ol) and ketones (2-butanone)
contributing to the stale and putrid off odors in fish because of amino acid and lipid
degradation (18, 19).
Much higher levels of 3-methyl-1-butanol, 2,3-butandiol, 2-methyl-1-propanol, TMA,
ethyl acetate and acetoin were detected on days 14 and 17 compared to day 12 when the
end of sensory shelf-life was reached (Table 1). The late development of the spoilage
indicators is in agreement with studies on spoilage indicators for cultured and wild sea
bream stored in ice for 23 days (31). TMA, 3-methyl-1-butanol, 1-penten3-ol, piperidine,
methanethiol, dimethyl disulfide, dimethyl trisulfide, and acetic acid were suggested as
spoilage indicators and the increase in the levels of most of the compounds were detected

11
around day 10 of storage, however, methyl mercaptan and dimethyl trisulfide appeared to
accumulate later when the products were already spoiled.
Ketones: The formation of microbially derived acetoin was characteristic for the
spoilage of chilled cod fillets as discussed above. Levels of acetoin increased earlier than
TMA and therefore, it is more useful to monitor the loss of freshness as an early indicator
of spoilage. Acetoin can be formed from carbohydrate sources via pyruvate and diacetyl,
however the mechanism of its formation in fish is not well known but acetoin and
diacetyl have been suggested as early indicators of spoilage in beef (57). The
concentration of acetoin was much higher than the other lipid derived ketones detected
like 2-butanone and 3-pentanone and carotenoid derived 6-methyl-5-heptene-2-one (Fig
3) that were present in cod fillets throughout storage but no obvious increase occurred
until at the end of shelf-life and during continued storage (Fig. 3). Ketones can influence
the overall odor because of their typical odors and their low odor thresholds (Table 1).
Butanone has a butterscotch odor and pentanone a sweet fruity odor (58), but a sweet,
caramel like odor was detected by GC-O for 3-pentanone (Table 1).
Aldehydes: The straight chain lipid derived aldehydes, hexanal, heptanal, nonanal,
decanal and undecanal were detected in the cod fillets throughout the storage time. Their
levels did not appear to increase until after the end of shelf life was reached (Table 1).
Therefore, they did not appear to be useful as indicators of spoilage during chilled storage
of the cod fillets, but aldehydes have been suggested as indicators of spoilage in fatty
species (45). These compounds exhibit green, fatty, soapy, tallowy odors and hexanal is
characterized by green odor (58). The aldehydes most likely contributed to the overall
mild and sweet odors of the fillets since their odor threshold is low and therefore they are
likely to have high odor impact as seen by the high odor unit for these compounds (Table
1). Based on the GC-O it is suggested that the lipid derived ketones in combination with
3-methyl-butanal and aldehydes like hexanal, nonanal and decanal, contributed to the
characteristic sweet, caramel, and flowery odor of the cod fillets. Oxidation of fatty acids
contributes to the rancid odors of fish with the formation of aldehydes like hexanal, 2,7-
heptadienal, and 2,4,7-decadienal (44, 59). The unsaturated aldehydes were not detected
by GC-MS in this study using the surface stripping sampling of the volatiles.
Odor of fresh cod fillets is typically characterized by a very mild and pleasant, marine
like odor and aroma active compounds contributing to the fresh fish odors are present in

12
very low concentrations (14). Species specific odors of fresh fish are contributed by long
chain alcohols and carbonyl compounds like 1,5-octadien-3-ol and 2,6-nonadienal,
respectively, that are derived from polyunsaturated fatty acids (60). These compounds are
more pronounced on the skin than in the muscle and were not detected in the fillets using
the sampling conditions herein. However, an earthy and potato-like odor was detected by
GC-O at the same retention time as heptanal which is most likely caused by low levels of
methional and 4-heptenal eluting at the same retention time (12). These compounds were
identified earlier as the most potent odorants in boiled cod (55).
Electronic nose and GC-MS analysis of the main classes of compounds in cod
fillets during storage
Quality indicators: The sum of the peak area ratio (PAR) for all the volatile
compounds detected in cod fillets by GC-MS showed that the total amount of volatiles
increased with storage and alcohols, ketones and TMA (amines) were present in the
highest amount (Table 2). On day 4 the alcohols were the most abundant of the volatiles
(29%), mainly contributed by ethanol. Again on day 7 the alcohols were still the most
abundant volatiles (45%) and 2-methyl-1-propanol was detected in the highest level. The
ketones (36%) increased considerably on day 10 with the development of acetoin and
acid (2%) was first detected on day 10. At sensory rejection on day 12 the ketones were
detected in the highest level (33 %) followed by amines (TMA) (29%), alcohols (15%),
acids (4%), aldehydes (3%) and low level of esters (ethyl acetate) (<1%). Esters and
acids were not detected during early storage and sulfur compounds were only detected in
low levels (Table 2) as expected since these compounds are typically produced at
advanced spoilage of seafood (18-20, 27, 14, 32). TMA was the most abundant volatile
compound at advanced spoilage on day 17 and alcohols and ketones were also in high
levels but in addition the level of esters had increased considerably comprising 8% of the
total PAR (Table 1).
Miscellaneous classes of compounds: Although alcohols, aldehydes, ketones, acids,
sulfur compounds, esters and acids are primarily of interest as spoilage indicators of fish,
other classes of compounds were also present in the headspace, which may have an
impact when measuring the total headspace with electronic noses. The concentration of
the straight chain alkanes (nonane, decane and undecane) appeared to be similar
throughout storage. Additionally, numerous branched chain alkanes were identified by

13
the MS library database, but their RIs (retention indices) were not confirmed and
therefore, they were classified with the group “unknown” which represented compounds
that remained unidentified. The alkanes will not influence the responses of the
electrochemical sensors of the electronic nose and are not considered of interest as
quality indicators since they are not aroma active.
Compounds classified as “others” appeared to increase with storage time. Among
these compounds were some odorous compounds like piperidine which was tentatively
identified. Piperidine has been reported earlier in low levels in fish and has been
associated with 1,5-diaminopentane (cadeverine) (61). Piperidine was earlier suggested
as quality indicator of sea bream (31). The terpene derivative limonene was also
classified with “other” compounds but did not show an increasing trend with time. The
origin of limonene in fish has been related to the diet derived from plant sources (31).
Limonene has low odor threshold and a fresh lemon odor was detected by GC-O analysis,
suggesting that it may have an impact on the overall odor of fish fillets (Table 1).
The aromatics detected were mainly benzene derivatives. Styrene and chloroform
were most abundant and were found to increase with storage. Styrene was also identified
in wild and cultured sea bream packed in polystyrene boxes during chilled storage (31).
The odor of styrene is described as kerosene like and has been associated with off odors
in surimi based products related to the growth of yeasts (62). However, it is speculated
that both styrene and chloroform could be originating from the Styrofoam boxes,
however this was not confirmed. Tainting from the packaging may be of concern when
monitoring spoilage changes with an electronic nose, if the sensors are sensitive to the
respective compounds. Therefore, it is very important to analyze the total headspace by
gas chromatography and understand the origin of the suggested quality indicating
compounds prior to the selection of suitable sensors for monitoring the relevant spoilage
changes.
Electronic nose measurements: The results of the electronic nose measurements
showed that the response of the CO sensor was much higher than the other sensors’
responses (H2S, SO2 and NH3) and significant increase (p<0.05) was first observed
between days 7 and 10, and thereafter a continuous increase occurred (Fig. 4). Earlier
studies have shown that the main classes of spoilage indicator compounds present in the
headspace of fish can be estimated based on the individual sensor responses (63, 9).

14
Selected standard compounds representing the main classes of compounds causing
spoilage odors showed that the CO sensor is sensitive to alcohols, aldehydes and esters.
The NH3 sensor is sensitive to amines and the H2S and SO2 sensors can detect sulfur
compounds. The comparison of the electronic nose measurements and the GC analysis
has some drawbacks related to the different sampling techniques used. Therefore, the
results are only a semiquantitative approach to screen the major changes in the
composition of the volatiles and the electronic nose responses can be partly explained by
comparison to the compounds identified in the highest concentration by the GC-MS.
Based on the electronic nose responses it appears that only the CO sensor was useful
to monitor the changes in volatiles during storage. The increasing PAR for alcohols,
aldehydes and esters (Table 2) could explain the increasing CO sensor response with time
based on its sensitivity towards these classes of compounds. It is of interest that much
higher responses were observed for the CO sensor in an earlier study of haddock fillets
stored under identical conditions as the cod fillets at the end of shelf-life. This can be
explained by higher levels of alcohols and esters produced by the SSO in the haddock
fillets (56). Although P. phosphoreum was also identified as the main SSO in the
haddock fillets, high counts of Pseudomonas spp were observed at sensory rejection. The
pseudomonads are not able to reduce TMAO to TMA (64) and therefore, they may have
contributed to the higher levels of alcohols because of their metabolism and need for
hydrogen acceptors, hence favouring the production of alcohols. Therefore, the dynamic
spoilage changes and development of volatiles are dependent on the combination of the
dominating SSO.
The detection of the high level of acetoin produced in cod fillets was not achieved by
the electronic nose since none of the sensors is sensitive to ketones. The ketones, mainly
acetoin, increased continuously with storage (Fig. 3) and appeared to be promising
indicators for cod fillets packed in styrofoam boxes. Improvements should be made to
include selective sensors in the electronic nose for the detection of ketones.
The NH3 sensor’s response increased first on day 14 although not significantly
because of the high standard deviation. The high standard deviations for replicate
samples for both the electronic nose and GC analysis, was partly caused by the influence
of the temperature on the very volatile compounds during sampling (56, 65). Although
high levels of TMA were detected by GC–MS on day 12 in agreement with high TVB-N
15
level (48.5 mgN/100g), the NH3 sensor was not sensitive enough to detect this. Higher
responses for the NH3 sensor were observed in earlier studies for both shrimp and capelin
but in these products TVB-N levels were higher than in cod fillets (66-67, 63, 8, 68).
The low response of the H2S and SO2 sensors suggested that the H2S-producing
bacteria were not important in the development of spoilage odors in packed cod fillets in
agreement with the GC-MS analysis. Dimethyl sulfide was detected on day 4 suggesting
that this compounds was most likely not associated with microbial spoilage but rather
reflected the feeding conditions as has been suggested by others (69). Sulfur compounds
like hydrogen sulfide and methylmercaptan, which are produced by microbial
degradation of fish constituents (70-71) were not detected, but GC-O analysis on day 17
indicated that dimethyl trisulfide was present in the spoiled fillets (Table 2). Sulfur
compounds contribute to potent spoilage odors because of their low odor thresholds
(Table 2). Earlier studies using the FreshSense electronic nose have shown increasing
response of the H2S and SO2 sensors at advanced spoilage of whole capelin and redfish
(66, 8-9), but response to fillets of cod and haddock is generally low (56, 72).
CONCLUSION
Analysis of volatile compounds during storage of packed cod fillets by gas
chromatography showed that acetoin and TMA were produced in the highest and
increasing amounts coinciding with the growth of P. phosphoreum which was identified
as the dominating SSO in the parallel study. The response of the electronic nose’s CO
sensor was explained by the increasing level of alcohols during storage like ethanol, 2-
methyl-1-propanol and 3-methyl-1-butanol in addition to the presence of aldehydes and
the formation of esters at the end of the shelf-life. At sensory rejection of the packed cod
fillets on day 12, the ketones were detected in the highest level (33 %) followed by
amines (TMA) (29%), alcohols (15%), acids (4%), aldehydes (3%) and a low level of
esters (ethyl acetate) (<1%). It is suggested that selective sensors for the detection of
these classes of compounds could be used for monitoring spoilage changes in different
fish products because similar volatile compounds emerge in the products. The CO sensor
is useful for detecting incipient spoilage since its levels increased significantly between
days 7 and 10. None of the sensors in the electronic nose was sensitive to ketones and

16
acids and therefore selective sensors for these components would be useful to monitor
spoilage of cod fillets in addition to a more sensitive sensor for the detection of TMA.
Increased sensitivity of existing methods is required for monitoring of quality
deterioration and the early detection of microbially produced compounds. Low levels of
sulfur compounds in the cod fillets suggested that S. putrefaciens was not very important
in the spoilage of chilled cod fillets stored in styrofoam boxes.
However, because of the complexity of the spoilage processes caused by the diversity
of the microflora and their different spoilage potential, it is likely that fixed values to
determine the end of shelf-life or the quality of fish fillets based on electronic nose
responses or amount of the main classes of compounds will have to be developed for
each product and the respective storage conditions.
ABBREVIATIONS USED
GC-MS, gas chromatography-mass spectrometry; GC-O, gas
chromatography-olfactometry; IFL, Icelandic Fisheries Laboratories; ATD, automated
thermal desorber; RI, retention index; TMA, trimethyl amine; TVB-N, total volatile basic
nitrogen; OU, odor unit; PAR, peak area ratio; SSO, specific spoilage organisms.
ACKNOWLEDGMENT
The authors thank The Icelandic Centre for Research for partly financing the project.
The staff of IFL is thanked for their valued contribution in chemical, microbial and
sensory analysis of samples.

17
REFERENCES
(1) Schaller, E.; Bosse, J.O.; Escher, F. 'Electronic noses' and their application to food. Lebensm.-Wiss.
Technol. 1998, 31, 305-316.
(2) Gardner, J.W., Bartlett, P.N. Electronic noses. Principles and applications, Oxford University Press:
Oxford, England, 1999.
(3) Haugen, J.E. Electronic noses in food analysis. In Headspace Analysis of Food and Flavors: Theory
and Practice; Rouseff, R.L., Cadwallader, K.R., Eds.; Kluwer Academic / Plenum Publishers: New
York, 2001; pp. 43-57.
(4) Ólafsson, R.; Martinsdóttir, E.; Ólafsdóttir, G.; Sigfússon, Þ.I.; Gardner, J.W. Monitoring of fish
freshness using tin oxide sensors. In Sensors and Sensory Systems for an Electronic Nose; Gardner,
J.W., Bartlett, P.N., Eds.; Kluwer Academic Publ.: Amsterdam, The Netherlands, 1992; pp. 257-272.
(5) Schweizer-Berberich, M.; Vahinger, S.; Göpel, W. Characterization of food freshness with sensor
array, Sens. Act. 1994, B, 18-19, 282-290.
(6) Di Natale, C.; Brunink, J.A.J.; Bungaro, F.; Davide, F.; d´Amico, A.; Paolesse, R.; Boschi, T.;
Faccio, M.; Ferri, G. Recognition of fish storage time by a metalloporphyrins-coated QMB sensor
array. Meas. Sci. Technol. 1996, 7, 1103-1114.
(7) Di Natale, C.; Olafsdottir, G.; Einarsson, S.; Mantini, A.; Martinelli, E.; Paolesse, R.; Falconi, C.;
D’Amico, A. Comparison and integration of different electronic noses for the evaluation of freshness
of cod fish fillets. Sens. Act. 2001, B77, 572-578.
(8) Olafsdottir, G.; Högnadottir, A.; Martinsdottir, E.; Jonsdottir, H. Application of an electronic nose to
predict total volatile bases in capelin (Mallotus villosus) for fishmeal production. J. Agric. Food
Chem. 2000, 48, 2353-2359.
(9) Olafsdottir, G.; Xiuchen, L.; Lauzon, H.; Jonsdottir, R. Precision and application of electronic nose
for freshness monitoring of whole redfish stored in ice and modified atmosphere bulk storage. J.
Aquat. Food Prod. Technol. 2002, 11, 229-249.
(10) Zhao, C.Z.; Pan, Y.Z.; Ma, L.Z.; Tang, Z.N.; Zhao, G.L.; Wang, L.D. Assay of fish freshness using
trimethylamine vapor probe based on a sensitive membrane on piezoelectric quartz crystal. Sens.
Act. 2002, B81, 218-222.
(11) Haugen, J.E.; Undeland, I. Lipid oxidation in herring fillets (Clupea harengus) during ice storage
measured by a commercial hybrid gas-sensor array system. J. Agric. Food Chem. 2003, 51, 752-759.
(12) Jonsdottir, R.; Olafsdottir, G.; Martinsdottir, E.; Stefansson, G. Flavor Characterization of Ripened
Cod Roe by Gas Chromatography, Sensory Analysis and Electronic Nose. J. Agric. Food Chem.
2004, 52, 6250-6256.

18
(13) Lindsay, R.C. Fish flavors. Food Rev. Int. 1990, 6, 437-455.
(14) Olafsdottir, G.; Fleurence, J. Evaluation of fish freshness using volatile compounds - Classification
of volatile compounds in fish. In Methods to Determine the Freshness of Fish in Research and
Industry; Olafsdottir, G., Luten, J., Dalgaard, P., Careche, M., Verrez-Bagnis, V., Martinsdottir, E.,
Heia, K., Eds.; International Institute of Refrigeration: Paris, France, 1998; pp. 55-69.
(15) Elliot, R.P. Evaluation of surface pH as a freshness index for fish fillets. Food Research. 1947, 12
(2), 87-98.
(16) Shewan, J.M.; Macintosh, R.G.; Tucker, C.G.; Ehrenberg, A.S.C. The development of a numeric
scoring system for the sensory assessment of the spoilage of wet white fish stored in ice. J. Sci. Food
Agric. 1953. 4, 283-298.
(17) Castell, C.H.; Greenough, M.F. The action of Pseudomonas on fish muscle: 1. Organisms
responsible for odour produced during incipient spoilage of chilled fish muscle. J. Fish. Res. Board
Can. 1957, 12, 617-625.
(18) Miller III, A.; Scanlan, R.A.; Lee, J.S.; Libbey, L.M. Identification of the Volatile Compounds
Produced in Sterile Fish Muscle (Sebastes melanops) by Pseudomonas fragi. Appl. Microbiol. 1973,
25, 952-955.
(19) Miller III, A.; Scanlan, R.A.; Lee, J.S.; Libbey, L.M. Volatile compounds produced in sterile fish
muscle (Sebastes melanops) by Pseudomonas putrifaciens, Pseudomonas fluorescens, and an
Achromobacter species. Appl. Microbiol. 1973, 26, 18-21.
(20) Miller III, A.; Scanlan, R.A.; Lee, J.S.; Libbey, L.M.; Morgan, M.E. Volatile compounds produced
in sterile fish muscle (Sebastes melanops) by Pseudomonas perolens. Appl. Microbiol. 1973, 25,
257-261.
(21) Herbert, R.A.; Shewan, J.M. Roles played by bacterial and autolytic enzymes in the production of
volatile sulphides in spoiling North Sea cod (Gadus morhua). J. Sci. Food Agric. 1976, 27, 89-94.
(22) Lerke, P.; Huck, R.W. Objective determination of canned tuna quality: Identification of ethanol as a
potentially useful index. J. Food Sci. 1977, 42, 755-758.
(23) Human, J.; Khayat, A. Quality Evaluation of Raw Tuna by Gas Chromatography and Sensory
Methods. J. Food Sci. 1981, 46, 868-873.
(24) Hebard, C.E.; Flick, G.J.; Martin, R.E. Occurrence and significance of trimethylamine oxide and its
derivatives in fish and shellfish. In Chemistry and Biochemistry of Marine Food Products; Martin,
R.E., Ed.; AVI Publishing Co., Inc.: Westport, Connecticut, 1982; pp. 149–304.
(25) Kelleher, S.D.; Zall, R.R. Ethanol accumulation in muscle tissue as a chemical indicator of fish
spoilage. J. Food Biochem. 1983, 7, 87-91.

19
(26) Ahmed, A.; Matches, J.R. Alcohol production by fish spoilage bacteria. J. Food Prot. 1983, 46,
1055-1059.
(27) Josephson, D.B.; Lindsay, R.C.; Olafsdottir, G. Measurement of Volatile Aroma Constituents as a
Means for Following Sensory Deterioration of Fresh Fish and Fishery Products. In Seafood Quality
Determination, Proceedings of an International Symposium, University of Alaska Sea Grant
Program, Anchorage, Alaska, U.S.A Kramer D.E.; Liston J. Eds.; Elsevier Science Publishers:
Amsterdam, The Netherlands, 1986; pp. 27-47.
(28) Lindsay, R.C.; Josephson, D.B.; Olafsdottir, G. Chemical and biochemical indices for assessing the
quality of fish packaged in controlled atmospheres. In Seafood Quality Determination, Proceedings
of an International Symposium, University of Alaska Sea Grant Program, Anchorage, Alaska,
U.S.A. Kramer D.E.; Liston J. Eds.; Elsevier Science Publishers: Amsterdam, The Netherlands,
1986; pp. 221-234.
(29) Oehlenschläger, J. Evaluation of some well established and some underrated indices for the
determination of freshness and/or spoilage of ice stored wet fish. In Quality Assurance in the Fish
Industry; Huss, H.H., Jakobsen, M., Liston, J.; Eds.; Elsevier Science Publisher: Amsterdam, The
Netherlands, 1992; pp 339-350.
(30) Jørgensen, L.V.; Dalgaard, P.; Huss, H.H. Multiple compound quality index for cold-smoked salmon
(Salmo salar) developed by multivariate regression of biogenic amines and pH. J. Agric. Food
Chem. 2000, 48, 2448-2453.
(31) Alasalvar, C.; Taylor, K.D.A.; Shahidi, F. Comparison of volatiles of cultured and wild sea bream
(Sparus aurata) during storage in ice by dynamic headspace analysis gas chromatography mass
spectrometry. J. Agric. Food Chem. 2005, 53, 2616-2622.
(32) Chinivasagam, H.N.; Bremner, H.A.; Wood, A.F.; Nottingham, S.M. Volatile components
associated with bacterial spoilage of tropical prawns. Int. J. Food Microbiol. 1998, 42, 45-55.
(33) Joffraud, J.J.; Leroi, F.; Roy, C.; Berdague, J.L. Characterisation of volatile compounds produced by
bacteria isolated from the spoilage flora of cold-smoked salmon. Int. J. Food Microbiol. 2001, 66
(3), 175-184.
(34) Jørgensen, L.V.; Huss, H.H.; Dalgaard, P. Significance of volatile compounds produced by spoilage
bacteria in vacuum-packed cold-smoked salmon (Salmo salar) analyzed by GC-MS and multivariate
regression. J. Agric. Food Chem. 2001, 49, 2376-2381.
(35) Gram, L.; Melchiorsen, J. Interaction between fish spoilage bacteria Pseudomonas sp. and S.
putrefaciens in fish extracts and on fish tissue. J. Appl. Bacteriol. 1996, 80, 589-595.
(36) Gram, L.; Ravn, L.; Rasch, M.; Bruhn, J.B.; Christensen, A.B.; Givskov, M. Food spoilage –
interactions between food spoilage bacteria. Int. J. Food Microbiol. 2002, 78, 79-97.

20
(37) Huss, H.H.; Dalgaard, P.; Gram, L. Microbiology of fish and fish products. In Seafood from
producer to consumer; intergrated approach to quality; Luten, J.B., Börresen, T., Oehlenschlager,
J., Eds.; Elsevier: Amsterdam, The Netherlands, 1997; pp. 413-430.
(38) Shewan, J.M. The bacteriology of fresh and spoiling fish and some related chemical changes. In
Recent Advances in Food Science; Hawthorn, J., Leitch, J.M., Eds.; Butterworths: London, 1962; 1,
167-193.
(39) Van Spreekens, K.J.A. The suitability of Long & Hammer's medium for the enumeration of more
fastidious bacteria from fresh fishery products. Arch. Lebensmitt. 1974, 25 (10), 213-219.
(40) Van Spreekens, K.J.A.; Toepoel, L. Quality of fishery products in connection with the psychrophilic
and psychrotrophic bacterial flora. In Psychrotrophic microorganisms in spoilage and pathogenicity;
Roberts, T.A., Hobbs, G., Christian, J.H.B., Skovgaard, N., Eds.; Academic Press: London, UK,
1981; pp. 283-294.
(41) Dalgaard, P.; Gram, L.; Huss, H.H. Spoilage and shelf life of cod fillets packed in vacuum or
modified atmospheres. Int. J. Food Microbiol. 1993, 19, 283-294.
(42) Dalgaard, P.; Mejlholm, O.; Christiansen, T.J.; Huss, H.H. Importance of Photobacterium
phosphoreum in relation to spoilage of modified atmosphere-packed fish products. Lett. Appl.
Microbiol. 1997, 24, 373-378.
(43) Dalgaard, P. Qualitative and quantitative characterization of spoilage bacteria from packed fish. Int.
J. Food Microbiol. 1995, 26, 319-333.
(44) McGill, A.S.; Hardy, R.; Burt, J.R. Hept-cis-4-enal and its contribution to the off-flavour in cold
stored cod. J. Sci. Food Agric. 1974, 25, 1477-1489.
(45) Aro, T.; Tahvonen, R.; Koskinen, L.; Kallio, H. Volatile compounds of Baltic herring analysed by
dynamic headspace sampling-gas chromatography-mass spectrometry. Eur. Food Res. Technol.
2003, 216, 483-488.
(46) Olafsdottir, G.; Lauzon, H.L.; Martinsdóttir, E.; Oehlenschläger, J.; Kristbergsson, K. Shelf-life
extension of superchilled cod (Gadus morhua) fillets and influence of temperature fluctuations on
microbial growth and metabolites. In press.
(47) ISO 1985. Sensory analysis – methodology - genereral guidance. ISO 6658. Geneva, Switzerland:
The International Organization for Standardization. 14 p.
(48) ISO 1987. Sensory analysis – methodology – evaluation of food products by methods using scales.
ISO 5124. Geneva, Switzerland: The International Organization for Standardization. 7 p.
(49) Acree T.;Arn, H. http://www.flavornet.org/flavornet.html; Flavornet, Cornell University, 1997.
(50) Malle, P.; Poumeyrol, M. A New Chemical Criterion for the Quality Control of Fish:
Trimethylamine/Total Volatile Basic Nitrogen (%). J. Food Prot. 1989, 52(6), 419-423.

21
(51) Huss, H.H. Quality and quality changes in fresh fish. FAO Fisheries Technical Papers - T348.
Rome: Food & Agriculture Organisation of the United Nations & Danish International Development
Agency (FAO/DANIDA). 1995; 195 p.
(52) Fazzalari, F.A., Ed. Compilation of Odor and Taste Threshold Data, ASTM Data Series DS 48A,
1978, Philadelphia, PA.
(53) Karahadian, C., Lindsay, R.C. Evaluation of compounds contributing characterizing fishy flavors in
fish oils. J. Am. Oil Chem. Soc. 1989, 66, 953-960.
(54) Sheldon, R.M.; Lindsay, R.C.; Libbey, L.M.; Morgan, M.E. Chemical nature of malty flavour and
aroma produced by streptococcus lactis. Appl. Microbiol. 1971, 22, 263-266.
(55) Milo, C.; Grosch, W. Changes in the odorants of boiled salmon and cod as affected by the storage of
the raw material. J. Agric. Food Chem. 1996, 44, 2366-2371.
(56) Olafsdottir G. Developing rapid olfaction arrays for determining fish quality. In Rapid and On-Line
Instrumentation for Food Quality Assurance; Tothill, I.E., Ed.; Woodhead Publishing Ltd:
Cambridge, England, 2003; pp. 339-360
(57) Dainty, R.H.; Edwards, R.A.; Hibbard, C.M. Time course of volatile compound formation during
refrigerated storage of naturally contaminated beef in air. J. Appl. Bacteriol. 1985, 59, 303-309.
(58) Curioni, P.M.G.; Bosset, J.O. Key odorants in various cheese types as determined by gas
chromatography-olfactometry. Int. Dairy J. 2002, 12, 959-984.
(59) Hardy, R.; McGill, A.S.; Gunstone, F.D. Lipid and autoxidative changes in cold stored cod (Gadus
morhua). J. Sci. Food Agric. 1979, 30, 999-1006.
(60) Josephson, D.B.; Lindsay, R.C.; Stuiber, D.A. Variations in the occurrences of enzymically derived
volatile aroma compounds in salt- and freshwater fish. J. Agric. Food Chem. 1984, 32, 1344-1347.
(61) Kawai T. Fish flavor. Crit. Rev. Food Sci. Nutr. 1996, 36, 3, 257-298.
(62) Koide, K.; Yanagisawa, I.; Ozawa, A.; Satake, M.; Fujita, T. Studies on the kerosene-like off-
flavour producing yeast in surimi-based products. Bull. Jap. Soc. Sci. Fish. 1992, 58, 1925-1930.
(63) Olafsdottir, G.; Högnadottir, A.; Martinsdottir, E. Application of gas sensors to evaluate freshness
and spoilage of various seafoods. In Methods to Determine the Freshness of Fish in Research and
Industry; Olafsdottir, G., Luten, J., Dalgaard, P., Careche, M., Verrez-Bagnis, V., Martinsdottir, E.,
Heia, K., Eds.; International Institute of Refrigeration: Paris, France, 1998; pp 100-109.
(64) Castell, C.H.; Greenough, F.; Dale, J. The action of Pseudomonas on fish muscle: 3. Identification of
organisms producing fruity and oniony odours. J. Fish. Res. Board Can. 1959, 16, 13-19.
(65) Mielle, P.; Marqui, F. An alternative way to improve the sensitivity of electronic olfactometers.
Sensors and Actuators 1999, B-Chemical 58(1-3), 526-535.
22
(66) Olafsdottir, G.; Martinsdottir, E.; Jonsson, E.H. Rapid gas sensor measurements to predict the
freshness of capelin (Mallotus villosus). J. Agric. Food Chem. 1997, 45, 2654-2659.
(67) Olafsdottir, G.; Martinsdóttir, E.; Oehlenschläger, J.; Dalgaard, P.; Jensen, B.; Undeland, I.; Mackie,
I.M.; Henehan, G.; Nielsen, J.; Nilsen, H. Methods to evaluate fish freshness in research and
industry. Trends Food Sci. Technol. 1997, 8, 258- 265.
(68) Zeng, Q.Z.; Thorarinsdottir, K.A.; Olafsdottir, G. Quality changes of shrimp (Pandalus borealis)
stored under different cooling conditions. In press J. Food Sci. 2005, accepted for publication.
(69) Ackman, R.G.; Hingley, J. Dimethyl sulfide as an odor component in Nova Scotia fall mackerel. J.
Fish. Res. Board Can. 1972, 29, 1085-1088.
(70) Herbert, R.A.; Ellis, J.R.; Shewan, J.M. Isolation and identifiaction of the volatile sulphides
produced during chill-storage of North Sea cod (Gadus morhua). J. Sci. Food Agric. 1975, 26, 1187-
1194.
(71) Kamiya, A.; Ose, Y. Study of the odorous compounds produced by putrefaction of foods. V. Fatty
acids, sulphur compounds and amines. J. Chromat. 1984, 292, 383-391.
(72) Tryggvadóttir, S.V.; Olafsdottir, G.; Einarsson, S. Multisensor for fish: Storage studies of cod in
Reykjavik and Tromsö. Texture, electronic nose (FreshSense), FIGD analysis, RT-Freshmeter and
sensory analysis. RF report 02-01. 2001; pp 19-24.
(73) Buttery, R.G.; Guadagni, D.G.; Ling, L.C.; Seifert, R.M.; Lipton, W. Additional volatile components
of cabbage, broccoli and cauliflower. J. Agric. Food Chem. 1976, 24, 829-832.
(74) Buttery, R.G.; Turnbaugh, J.G.; Ling, L.C. Contribution of volatiles to rice aroma. J. Agric. Food
Chem. 1988, 36, 1006-1009.
(75) Sheldon, R.M.; Lindsay, R.C.; Libbey, L.M.; Morgan, M.E. Chemical nature of malty flavour and
aroma produced by streptococcus lactis. Appl. Microbiol. 1971, 22, 263-266.
(76) Whitfield, F.B.; Tindale, C.R. The role of microbial metabolites in food off-flavours. Food Technol.
Australia, 1984, 36, 204-213.
(77) Buttery, R.G.; Teranishi, R.; Ling, L.C.; Turnbaugh, J.G. Quantitative and sensory studies on tomato
paste volatiles. J. Agric. Food Chem. 1990, 38, 336-340.

23
FIGURE CAPTIONS
Figure 1. Changes in pH (--∆--), development of TMA (-♦-) measured by GC-MS (PAR:
peak area ratio) and TVB-N (mgN/100g) (-■-) in cod fillets packed in styrofoam boxes
during storage at 0.5 °C. Vertical line indicates the end of shelf-life determined by
sensory analysis.
Figure 2. PAR (peak area ratio) for alcohols (ethanol (-♦-), 3-methyl-1-butanol (-■-),
2,3-butandiol (-▲-) and isobutanol (-∆-) detected in highest concentration and ethyl
acetate (-x-)-in cod fillets packed in styrofoam boxes during storage at 0.5 °C. Vertical
line indicates the end of shelf-life determined by sensory analysis.
Figure 3. PAR (peak area ratio) for ketones (6-methyl-5-hepten-2-one (-■-), 2-butanone
(-●-), 3-pentanone (-▲-), acetoin (-∆-)) and acetic acid (-x-) in cod fillets packed in
styrofoam boxes during storage at 0.5 °C. Vertical line indicates the end of shelf-life
determined by sensory analysis.
Figure 4. Response of the electronic nose sensors (CO, H2S, NH3 and SO2) towards cod
fillets during storage in styrofoam boxes at 0.5 °C on days 4, 7, 10, 12, and 14 after catch.

24
0
50
100
150
200
250
300
0 2 4 6 8 10 12 14 16
Days from catch
PAR
- TV
B-N
6.2
6.3
6.4
6.5
6.6
6.7
6.8
6.9
7.0
pH
TMA
TVB-N
pH
End of shelf-life
0
5
10
15
20
25
30
35
40
45
50
0 2 4 6 8 10 12 14 16
Days from catchPA
R
0
100
200
300
400
500
600
700
800
900
1000
PAR
(iso
buta
nol)
ethanol
3-methyl-1-butanol
2,3-butandiol
ethyl acetate
isobutanol
End of shelf-life
Figure 1 Figure 2
0
5
10
15
20
25
30
35
40
45
50
0 2 4 6 8 10 12 14 16
Days from catch
PAR
0
50
100
150
200
250
300
PAR
(ace
toin
)
6-me-5-hepten-2-one
2-butanone
3-pentanone
acetic acid
acetoin
End of shelf-life
-50
0
50
100
150
200
250
300
350
400
450
500
CO H2S NH3 SO2
Res
pons
e se
nsor
s (n
A)
4 7 10 12 14
Figure 3. Figure 4.

25
Table 1. Volatile compounds associated with spoilage in cod fillets during storage in styrofoam boxes at 0.5 °C for 17 days. PAR (peak area ratio) of compounds analyzed by GC-MS, odor descriptions and odor scores based on GC-O analysis and OU (odor unit) value of potent odorants at sensory rejection on day 12.
Compounds RIa Odor descriptionc Odor scored OUe Odor thresholdf ID meansg
Day 4 Day 7 Day 10 Day 12 Day 14 Day 17 Day 12 in waterAlcohols
ethanol <173 17.4 ± 20.7 - 13.1 ± 3.8 - - - - 100000 ppb [1] MS, RI2-methyl -1-propanol/ pentaneh <173 14.0 ± 1.4 85.4 ± 36.5 64.4 ± 13.2 35.0 ± 2.8 934.6 ± 1096.8 451.9 - 5 7000 ppb [1] MS, RI1-penten-3-ol 245 2.3 0.4 0.8 ± 0.1 1.2 ± 0.0 2.5 ± 1.7 - - 3 400 ppb [1] MS, RI3-methyl-1-butanol 300 - - 2.7 ± 2.4 8.5 ± 1.0 18.3 ± 6.2 31.6 ± 5.6 - 28-34 250-300 ppb [2] MS, RI2-methyl-1-butanol 306 - - - - 5.3 ± 2.7 - - MS, RI2,3-butandiol 359 - - 0.9 ± 1.2 4.0 ± 4.4 0.7 21.3 ± 30.1 - MS, RI2-ethyl-1-hexanol 633 - 2.0 ± 2.1 2.3 ± 1.0 1.8 ± 0.2 1.4 2.5 ± 1.1 - 270000 ppb [1] MS, RI
Aldehydesacetaldehyde <173 2.8 ± 0.8 1.4 ± 0.4 0.9 ± 0.6 0.8 ± 0.5 5.8 ± 4.4 7.5 ± 6.4 - 7-160 15-120 ppb [4] MS, RI3-methyl-butanal 227 - - 1.7 1.3 ± 0.2 2.6 1.2 sweet, caramel, fish fillet 1.5 - 3.0 22 60 ppb [5] MS, RI, GC-Ohexanal 378 1.9 2.1 ± 2.0 3.2 ± 1.2 2.0 ± 0.1 8.7 ± 6.2 - - 444 4.5ppb [6] MS, RIheptanal 501 - 2.4 1.7 ± 0.8 0.7 ± 0.2 2.9 ± 2.2 3.5 ± 1.8 earthy, boiled potato 2.0 - 3.0 233 3 ppb [1] MS, RI, GC-Ooctanal 606 - - 1.4 ± 0.6 - - - 0.7 ppb [1] MS, RInonanal 710 - 4.3 ± 3.7 6.3 ± 1.1 3.7 ± 0.6 10.2 ± 4.4 - - 3700 1 ppb [1] MS, RIdecanal 807 2.3 ± 0.2 2.5 ± 1.9 3.5 ± 0.4 2.4 ± 0.3 8.0 ± 4.2 14.9 ± 5.7 fresh, floral 1.5 1200 - 24000 0.1-2 ppb [1] MS, RI, GC-Oundecanal 910 - 0.6 ± 0.1 0.6 ± 0.1 0.4 ± 0.1 - 2.0 ± 1.1 sweet, candy 1.5 100 4 ppb [1] MS, RI, GC-O
Ketones2-butanone 191 14.3 ± 10.2 8.1 ± 1.1 9.0 - 24.0 ± 13.9 - - 50000 ppb [1] MS, RI3-pentanone 255 3.7 ± 3.2 8.5 ± 5.2 8.2 ± 3.9 13.6 ± 6.2 23.5 ± 17.7 34.6 ± 18.0 sweet, caramel 1.5 - 2.0 0.2 70000 ppb [1] MS, RI, GC-O3-hydroxy-2-butanone 273 2.6 ± 1.3 16.8 ± 20.8 90.3 ± 51.6 95.3 ± 5.6 259.2 ± 177.5 341.8 ± 129.3 sweet, sour 1.5 - 2.0 119 800 ppb [7] MS, RI, GC-O6-methyl-5-hepten-2-one 588 0.8 ± 0.2 0.9 ± 0.2 1.9 ± 0.4 1.0 ± 0.1 6.1 ± 4.1 5.4 ± 1.8 spicy, flowery 1.5 20 50 ppb [2] MS, RI, GC-O
Acidsacetic acid 191 - - 6.3 ± 4.2 14.2 ± 13.0 11.4 ± 4.3 15.5 - 0.4 34200ppb[3] MS, RI
AminesTMA <173 - - - 91.6 ± 28.5 922.2 ± 1064.2 1721.4 ± 47.6 TMA-like, dried fish 3.0 91600-305333 0.3-1 ppb [1] MS, RI, GC-O
Estersethyl acetate 200 - - - 0.6 6.6 ± 1.4 258.9 ± 330.0 - 0.1-120 5-5000ppb [1] MS, RIethyl butanoate 377 - - - - - 13.9 ± 2.2 sickenly sweet, vomit 2.3 MS, RI, GC-O
Sulfur compoundsdimethyl sulfide 173 4.5 - - - - - - 900 ppb [6] MS, RIdimethyl disulfide 312 - - - - - 1.2 onion like 1.5 - 2.5 12 ppb [2] MS, RI, GC-Odimethyl trisulfide 564 - - - - - - rotten, sulfur, cabbage 2.5 0.01ppb [2] GC-O
Unknown 457 - - - - - -spicy, fish, flowery, sweet, onion, mushroom 3.0 -4.8 GC-O
PARb
aRI: calculated retention index on DB-5ms capillary column; bPAR: peak area ratio, average of duplicate analysis ± standard deviation when detected in both samples or " - " if not detected; codor evaluated by GC-O; dGC-O odor scores (average value of two panelists) giving the range of scores on days 4, 10 and 17; eOU: odor unit calculated by dividing the PAR by the odor threshold value x 1000; fodor thresholds from literature: 1. Fazzalari, 1978 (52); 2. Buttery et al., 1976 (73); 3. Kawai 1996 (61); 4. Buttery et al., 1988 (74); 5. Sheldon et al., 1971 (75); 6. Whitfield and Tindale, 1984 (76); 7. Buttery et al., 1990 (77); gidentification on the basis of MS database,retention index and odor evaluation; hcoeluting peaks.

26
Table 2. PAR of main classes of compounds identified by GC-MS in cod fillets packed in styrofoam boxes during storage at 0.5 °C for 17 days
Class Day 4 Day 7 Day 10 Day 12 Day 14 Day 17
Quality indicatorsAlcohols 34 (29) 88 (45) 84 (28) 51 (15) 963 (39) 507 (15)Aldehydes 7 (6) 13 (6) 19 (6) 11 (3) 38 (2) 27 (1)Ketones 21 (18) 34 (18) 109 (36) 110 (33) 313 (13) 382 (11)Acids - - 6 (2) 14 (4) 11 (<1) 15 (<1)Amines - - - 92 (27) 922 (37) 1721 (51)Esters - - - 1 (<1) 7 (<1) 273 (8)Sulfur compounds 5 (4) - - - - 1 (<1)
MiscellaneousAlkanes 3 (3) 4 (2) 6 (2) 3 (1) 4 (<1) 3 (<1)Aromatics 17 (15) 39 (20) 40 (13) 22 (7) 80 (3) 76 (2)Other 5 (4) 5 (3) 3 (1) 12 (4) 97 (4) 351 (10)Unknown 26 (22) 10 (5) 36 (12) 17 (5) 28 (1) 44 (1)
Total volatiles 118 194 306 335 2464 3402
a PAR (peak area ratio) and percentage of total volatiles each day shown in parenthesis
PAR a

___________________________________________________________________
PAPER VII ___________________________________________________________________ Prediction of Microbial and Sensory Quality of Cold Smoked Atlantic Salmon (Salmo salar) by Electronic Nose. Guðrún Ólafsdóttir, Eric Chanie, Frank Westad, Rósa Jónsdóttir, Claudia R. Thalmann, Sandrine Bazzo, Saïd Labreche, Pauline Marcq, Frank Lundby, John-Erik Haugen, ___________________________________________________________________ Accepted for publication in J Food Sci. ©Copyright 2005, Institute of Food Technologists
VII

Prediction of Microbial and Sensory Quality of Cold Smoked Atlantic Salmon
(Salmo salar) by Electronic Nose
Gudrun Olafsdottir a, Eric Chanieb, Frank Westadc, Rosa Jonsdottira, Claudia R.
Thalmannd,e, Sandrine Bazzob, Said Labrecheb, Pauline Marcqb, Frank Lundbyc, John
Erik Haugenc
aIcelandic Fisheries Laboratories, Skulagata 4, 101 Reykjavik, Iceland
bAlpha-Mos 20 Av Didier DAURAT 31400, Toulouse, France cMATFORSK AS, Osloveien 1, N-1430 Ås, Norway
dttz Bremerhaven, Fischkai 1, D-27572 Bremerhaven, Germany eSENSIENT Flavors GmbH - Regulatory Affairs / Technical Information
Beim Struckenberge 1-9, D-28239 Bremen, Germany
Contact information for Corresponding Author:
Gudrun Olafsdottir
Icelandic Fisheries Laboratories, Skulagata 4, 101 Reykjavik, Iceland
Fax: +354 530 8601, Phone: +354 530 8600, [email protected]

ABSTRACT:
Quality changes of cold smoked salmon from four different smokehouses in Europe
were monitored by a prototype gas–sensor array system, the FishNose. Samples were
stored in different packaging (vacuum and MAP) for up to 4 weeks under controlled
storage conditions at 5 and 10 °C. Quality criteria based on sensory attributes
(sweet/sour-, off- and rancid odor) and total viable counts (TVC), lactic acid bacteria
counts (LAB) were established and used for classification of samples based on the
responses of the FishNose. The responses of the gas-sensors correlated well with
sensory analysis of spoilage odor and microbial counts suggesting that they can detect
volatile microbially produced compounds causing spoilage odors in cold smoked
salmon during storage. The system is therefore ideal for fast quality control related to
freshness evaluation of smoked salmon products. Partial least squares (PLS)
regression models based on samples from single producer showed better performance,
than a global model based on products from different producers to classify samples of
different quality.
Keywords: Electronic nose, cold smoked salmon, quality, descriptive sensory
analysis, microbial counts, PLSR classification

Introduction
Objective and rapid quality control system for perishable food like cold smoked
salmon are needed for the characterization of products and to supply data ready for
documentation to improve the production process reliability and reproducibility. In
recent years attempts to use electronic nose technology to track the spoilage processes
occurring in fish have been reported in numerous papers. Instruments based on
different sensor technologies have been used like metal-oxide chemoresistor sensors
(Ólafsson and others, 1992, Egashira and others 1990, Ohashi and others 1991),
MOSFET sensors (Haugen and Undeland 2003), amperometric sensors (Schweizer-
Berberich and others 1994; Olafsdottir and others 1997, 1998, 2000, 2002),
conducting polymer sensors (Du and others 2001, 2002, Luzuriaga and Balaban
1999a, 1999b, Newman and others 1999) and quartz microbalance sensors (Di Natale
and others 1996, 2001, 2003 Zhao and others 2002 ).
Microbiological methods are commonly applied for quality and safety monitoring of
cold smoked salmon products. The validity of TVC (total viable aerobic counts) has
been questioned because contradictory results have been found between sensory
changes and TVC in smoked salmon (Hansen and others 1995, Leroi and others 1998;
Dondero and others 2004). The spoilage microflora in cold smoked salmon is related
to the source of contamination for example the raw material and /or the smokehouses
rather than being specific for the product (Hansen and others 1998). The
predominance of lactic acid bacteria in vacuum-packed cold-smoked fish products at
the end of shelf life of the products is generally recognized (Becker and others 2002,
Gonzalez-Rodriguez and others 2002). Enterobacteriaceae has been identified in
cold smoked salmon products as the main contributor to spoilage, related to the in-
house flora and hygienic conditions in the smokehouses.
Quality monitoring of smoked salmon in the industry is often based on sensory
evaluation of appearance, texture, smell and taste. Desirable attributes from smoking
diminish during storage and the characteristic deterioration takes over, including
softening of the fish flesh, fading colors and unpleasant odors and flavors. Different
schemes have been used in the various studies on cold smoked salmon and sensory
descriptors for spoilage have been suggested. Sensory descriptors like sweet/sour,
bitter, fecal, ammonia and cabbage were used by Hansen and others (1998) to
describe the spoilage of vacuum packed cold smoked salmon stored at 5°C. The main

spoilage characteristics described by Leroi and others (1998) in cold smoked vacuum
packed salmon stored for 5 weeks at 8 °C were a pasty texture and pungent, acid,
rancid and sour flavors and odors. Cardinal and others (2004) identified different
quality classes based on sensory characteristics of cold smoked salmon from
supermarkets in the European market. Color, intensity of smoke related odors, amine
odors and salty perception were the main sensory characteristics discriminating
between quality classes.
Characteristic spoilage off-odors and off-flavors are caused by microbial activity. The
spoilage potential of the microflora has been studied (Stohr and others 2001, Leroi
and others 2001) and various volatile compounds produced by microbes have been
suggested as spoilage indicators (Joffraud and others 2001, Jorgensen and others
2001). In some cases, spoilage of cold smoked vacuum packed fillets occurs with low
microbial numbers indicating that shelf life of cold-smoked salmon with very low
microbial counts is caused by autolytic tissue degradation (Hansen and others 1998).
Autolytic enzymes have a major impact on the textural quality of cold smoked salmon
during the early stage of deterioration (Hansen and others 1996). Other studies have
shown that despite of high microbial counts no relevant changes in chemical or
physical parameters were observed (Bugueno and others 2003).
For rapid monitoring of spoilage of cold smoked salmon by an electronic nose it is
important to characterize the spoilage changes of the respective products and select
quality indicators that correlate with the sensors responses. The use of an electronic
nose to monitor spoilage changes in smoked products has not been reported before.
This paper presents results from a European project (QLK1-CT-2002-71304) where
the aim was to study the possibility to use an electronic nose to monitor smoked
salmon quality. A prototype instrument called FishNose was developed and adapted
for the measurements of smoked salmon. Storage studies were done to compare the
microbial and sensory changes with the FishNose responses. The main objective of
the studies was to select quality indicators related to microbial counts and sensory
odor attributes and to establish quality criteria to use in models based on the FishNose
responses to classify cold smoked salmon of different quality.

Materials and Methods
Preparation of samples
Salmon samples were obtained from smokehouses in Norway, Iceland and Germany
and storage studies were carried out in laboratories in the different countries.
Table 1 shows an overview of the samples from the different smokehouses (labeled
A1, A2, B, C and D), smoking and storage conditions and the number of samples used
for the storage studies at 5 and 10 °C. In addition samples from different production
batches (process samples) of different quality were used for the FishNose testing. The
raw material used for smoking in the different smokehouses was processed 2-3 days
after slaughtering. All the smokehouses use traditional smoking and dry salting. The
cold-smoked salmon products were sliced and vacuum packed, but one producer (B)
vacuum packed the products as whole fillets. The storage experiments were
performed with 16 freshly smoked samples delivered from each smokehouse to the
laboratories. The samples were stored at two temperatures up to 4 weeks and
sampling was done on days 0, 7, 14, and 28 of storage for samples stored at 5 °C, but
on days 0, 4, 7 and 10 of storage for samples stored at 10 °C. The A samples were all
stored at 5 °C, one sample group in vacuum packages, and the other sample group in
Modified Atmosphere Packaging (MAP).
Sampling
Chemical analysis of fat, water and salt were done to characterize the different
products. The proliferation of spoilage changes were monitored by sensory analysis,
total aerobic and lactic acid bacteria counts. For each sample two fillets were used and
the fillets were divided in the same way for the different analysis in the different
laboratories to ensure that the same part of the fillet was always used for the
respective analysis. Only the middle portion of the fillets was used and they were
divided from head to tail so that samples from sensory analysis were taken from the
head end and consecutive to the tail end in the following order: samples for the
FishNose prototype measurement, microbial analysis (TVC and LAB), and chemical
analysis (water, total fat, salt content). Duplicate samples were analyzed.
Microbial and chemical analyses were done in the participating laboratories in the
different countries on each day of sampling. Samples for electronic nose
measurements and sensory analysis were vacuum packed, frozen (-24 °C) and

transported in a Styrofoam box by courier service at the end of the experiment to
AlphaMOS and to IFL, respectively.
Chemical analysis
Analysis of water content was done by heating the sample in an oven at 103°C +/-2°C
for four hours. Water corresponds to the weight loss (ISO 6496 1999). Total fat was
determined by extraction with petroleum ether, boiling range 40-60 °C using an
extraction apparatus 2050 Soxtec Avanti Automatic System (AOCS 1998). Salt
content was measured by extracting the soluble chloride from the sample with water
containing nitric acid. The chloride content of the solution was titrated with silver
nitrate and the end point determined potentiometrically (AOAC 1995)
Microbial analysis
The microbial analysis included total psychrotrophic counts (TVC) (total viable
counts) using modified Long & Hammer's medium (LH) (Van Spreekens 1974) and
incubation at 15 °C. Analysis of lactic acid bacteria (LAB) counts was done using
NAP (Nitrite Actidione-Polymyxin) medium slightly modified (Davidson and Cronin
1973).
Sensory analysis
A sensory scheme for smoked salmon based on Quantitative Descriptive Analysis
(QDA) (Stone and Sidel 1985) was developed prior to the shelf-life studies. Nine
trained panelists (age range 30 - 55) from the Icelandic Fisheries Laboratories’
sensory panel participated in the sensory assessments. They were selected and trained
according to international standards (ISO 1993), including detection and recognition
of tastes and odors, training in the use of scales, and in the development and use of
descriptors. The members of the panel were familiar with the QDA method and
trained according to International Standards (ISO 1994) for the QDA assessment. One
1.5 h session was used for training of the panel using freshly smoked salmon samples
and samples that had been stored for 3 weeks at 5 °C. The panel adapted an already
developed QDA sensory scheme used earlier at Matforsk in Norway and evaluated the
attributes and developed the vocabulary to describe changes occurring in smoked
salmon during storage. Thereafter the panel was trained in the use of an unstructured
scale (15 cm) for the selected attributes. The scheme contained 19 descriptors of odor

/ flavor, appearance, and texture. Odor and flavor attributes were: smoked salmon
odor/flavor, metallic odor/flavor, sweet/sour fruity odor/flavor, rancid odor/flavor,
off- odor/flavor. Taste attributes included: salt and bitter taste. Appearance attributes
evaluated were: fat secretion, translucent, hue, color intensity and three texture
attributes: elasticity, oiliness, juiciness. Further training of the panel and testing of the
scheme was done in a pre-trial, using samples that were stored for 14, 28, 35 and 42
days at 5 °C.
Samples from each sampling day were kept frozen until analyzed for sensory analysis
all at once at the end of the storage time. Approximately 30 g of smoked salmon
served as slices on plastic dish were allowed to equilibrate at room temperature for 30
min before evaluation. The samples were coded with 3 random digit numbers. Each
panelist evaluated duplicates of samples from 2 to 3 different storage days. The fish
was served in a random order during 2 sessions for each day of the sensory
evaluation.
Electronic nose
The GEMINI electronic nose (Alpha M.O.S, Toulouse, France) equipped with 6 metal
oxide semiconductors (MOS) sensors (PA/2, P10/1, P40/2, P40/1, LY2/G, LY2/LG)
was used in the project. A prototype sampling unit developed by OPTOTEK
(Slovenia) was connected to the sensor unit GEMINI. The sampling unit has a 10 ml
sample loop, a heated inlet tube (55°C) and a pump (flow rate 200 ml/min). The
sampling was performed by inserting the inlet tube into a bell shaped unit (10 cm
diameter) that was placed on the fillets. Samples were covered with a 7 cm diameter
pierced aluminium paper to prevent cross contamination of samples. Aluminium was
used because of its inert property. Sampling temperature (headspace generation
temperature) was 5 °C and loading time of 7 s was used.
Validation of the performance of the system and the sensitivity of the sensors towards
selected compounds that are known to be present in the headspace of smoked salmon
was done in the project and will be published in a following paper. (Olafsdottir and
others 2005).
Data analysis
Sensory analysis of smoked salmon was performed using the software Fizz (France).
Statistical analysis was done on the sensory data using Number Cruncher Statistical

Software (NCSS 2000 and Pass Trial, Kaysville, Utah). One-Way ANOVA was done
to study if differences between sampling days of each storage group were significant
(H0= no difference between samples; significant difference p<0.05). Multivariate
analysis was performed by the Unscrambler Version 9.1(CAMO Process, Norway).
The main variance in the data set was studied using Principal Component Analysis
(PCA) and Partial Least Squares Regression models (PLSR) were used to describe the
relationship of the data and make predictions on quality of samples based on the
sensor responses and the data from the reference methods. In this context prediction
means cross-validated predictions, as there were no new independent sets of samples
present for prediction. However, cross-validation is more conservative than just
numerical fit of all samples. The quality criteria established to discriminate good
samples from bad samples were based on overall results of the analysis in this study,
taking into account commercial critical limits for total viable counts (TVC), results of
earlier studies of cold smoked salmon and sensory scores of selected attributes in this
study.
Results and Discussion
Quality indicators to use for calibration of the FishNose prototype were selected by
studying the correlation of the gas sensor responses with the chemical, microbial and
sensory data. Correlations of gas sensor responses with results of chemical
parameters (fat, water, salt) were low, but significant correlations were found for the
sensory and microbial parameters. The correlations between gas sensors and selected
sensory attributes were evaluated based on all the samples from different producers.
Except for the rancid odor significant correlations were found for the odor attributes:
sweet sour (r = 0.3 - 0.5, p < 0.005), off-odor (r = 0.2 - 0.4 p < 0.005), and smoked
odor which was negatively correlated (r = -0.4 - -0.6, p < 0.005).
Univariate correlations were found between sensor responses and bacteria numbers.
Highest correlation with the TVC and LAB numbers for the overall data set was
found for the LY2/G sensor, r = 0.35 (p < 0.005) and r = 0.44 (p < 0.005),
respectively. A high covariation between the single sensors of the array was also
observed.

The data from the FishNose sensors for all the 96 samples were analyzed by Principal
Component Analysis (PCA) (Fig 1). The two first dimensions described 99 % of the
total variance in the data set. The first PC explaining 94 % of the variation appears to
be describing the spoilage level of the samples. Most of the samples located to the
right were stored samples from producer A and a few from producer D with high
bacterial numbers and high scores in sensory odor attributes (sweet/sour and off
odors). All the samples on the left had low microbial counts and low spoilage odor
scores indicating that the majority of the samples in the experiment were of good
microbial and sensory quality. The second PC explaining 5 % of the variance in the
data appears to be discriminating the different smokehouses: The samples were
clustered together, however samples from the same producers appear to be closer
together indicating differences in the headspace of the samples from the different
smokehouses.
A “structural correlation” was defined when variables group induced a similar
structure on the samples. Individual analyses showed that when the samples of a
producer were structured that is showing changes in the measured variables, the
sensor data revealed a similar structure. This was the case for producers A and D, that
contained samples with obvious spoilage signs and these samples were located on the
right side of the plot as mentioned before. Some of the sample groups did not show a
clear indication of spoilage at the end of the storage time of the study. Therefore, no
structural correlation was found and no obvious discrimination between the samples
of the C and B sample groups was observed as seen by the location of these samples
on the left side of the plot.
To select quality indicators representative of microbial spoilage of the samples, it is of
interest to investigate how the sensory attributes are related to the microbial counts
(TVC). Therefore, all the sensory attributes, except the flavor attributes were subject
to regression analysis with log TVC the response variable. The correlation loading
plot from this analysis is shown in Figure 2. The attributes marked with small circles
were found to be significant. The big circles indicate 50 and 100 % explained
variance, respectively. Smoked salmon and sweet/sour odor contribute in modeling
TVC, although the correlation is not that high. Color intensity, hue, salt taste and
bitter taste contributed significantly to the modeling in accordance with other studies
indicating the importance of color and salty taste for smoked salmon spoilage
characteristics (Cardinal and others 2004). This is in agreement with earlier studies on

cold smoked salmon indicating the importance of spoilage organism in product shelf-
life since characteristic spoilage off-odors were only found in samples of cold smoked
salmon with high bacterial loads (Hansen and others 1996).
A PLSR regression model with gas-sensors as predictor variables and sensory
attributes as response variables was also subject to investigation (Fig 3). The results
showed a general agreement of the microbial and sensory odor parameters selected as
reference parameters for the gas sensor responses. The correlation loading plot shows
that the gas-sensors are located on the same side as off-odor and sweet/sour odor,
which concurs with their univariate correlations (data not shown).. Although these
correlations are significant, the numerical ranges for the attributes are not that high,
and the distributions are quite skewed as seen in the histograms (Fig 6 and 7).
However, based on their location on the plot it is suggested that the sensors are
detecting the volatile compounds contributing to the sweet/sour and off-odors. The
position of the rancid attribute in the middle of the plot indicates that this attribute was
not important in explaining the spoilage level in the samples.
Sensory evaluation of odor changes caused by the development of microbially
produced volatile degradation compounds is often the most reliable method to
determine the freshness or spoilage level of chilled fish (Olafsdottir and Fleurence
1998). The composition of volatile compounds in the headspace can be related to the
odor and the gas sensors are responding to volatile compounds present in the highest
concentration in the headspace. Therefore, sensory scores for odor attributes were
found most relevant to compare to the electronic nose responses. Moreover, selection
of quality indicators to use for calibration of the FishNose prototype was based on
attributes that showed increasing responses to samples in the storage study and
significant responses for the aged process samples. The parameters giving the best
correlation to the sensor responses were related to the proliferation of the micro-flora
like TVC and LAB counts, and the sensory odor attributes indicative for the
development of microbial metabolites like sweet/sour odor and off-odor.
Chemical analysis
The correlation of the chemical parameters and the gas sensors were low. Therefore,
they were not selected to calibrate the FishNose responses. However, variation in salt
content can influence the microbial growth and may explain the proliferation of
spoilage. An overview of the chemical composition (fat, water and salt) of the cold

smoked salmon samples from the different producers is shown in Table 2.
Considerable variation in fat and water content of samples was found even within
samples from the same batch. The A samples had the highest fat content and samples
from C had the lowest fat content. This variation in fat content is expected and reflects
both the age/size and feeding condition of the salmon.
Variation in salt content was also found within the samples, the highest values for D
and lowest for B. Analysis of a subset of the data showed that the size of the fish can
influence the salt content. Salt uptake appeared to be slower in the large fillets
resulting in overall lower salt content. Therefore, careful monitoring of the salting
process is necessary to ensure consistent products. Different handling procedures of
smoked products such as dry salting and brine injection influence the microbial
spoilage (Hansen and others 1996).
Microbial analysis - TVC
The limits for the end of shelflife in the industry are often set at 106 cfu/g. However,
this limit has been questioned and not in agreement with the results of sensory
panelists who estimated that samples with counts of 3 x 10⁶ cfu/g had not exceeded
the limit of shelf life (Leroi and others 1998). At sensory rejection the TVC is
typically 107 - 108 cfu/g in cold smoked products and the microflora differs depending
on the processes involved in the different smokehouses (Hansen and others 1995,
1998). Estimation of shelf life of smoked salmon products based on storage days is
not practical, because the various handling, smoking processes and the different
storage conditions influence the spoilage processes and the shelf life of the products
(Hansen and others, 1995; 1996; Dondero and others, 2004). Accordingly, the shelf
life of smoked salmon products varies considerably from about 2 weeks to 2 months
depending mostly on the temperature during storage.
Storage at 5 °C: The initial TVC numbers for the day 0 samples in the storage studies
varied from 1.5 to almost 4 in log cfu/g (Fig 4). The increase in TVC numbers with
storage time for samples stored at 5°C for 28 days is obvious for all the samples
except from smokehouse D. The D samples had very low counts (< 103 cfu/g)
throughout the study which may be explained by the high salt content (mean = 5.3%)
of those samples (see Table 2). Slow spoilage rate was also observed for samples
from smokehouse B and at the end of the study the TVC values did not exceed 106
cfu/g. Samples from smokehouse B were packaged as whole fillets, but not as slices.

This may have influenced the spoilage rate for the B samples. Other researchers have
reported longer shelf life for fillets (32 - 49 days) than for slices (21 - 36 days) of the
same product evaluated by a sensory panel (Hansen and others 1998). The initial high
counts of the A samples probably reflected the hygienic conditions in the
smokehouse. Additionally, the A samples had the highest microbial counts throughout
the study which may also be explained by the handling, salting, the smoking process
and the packaging. In particular it is of interest that the smoking time was very short
for the A samples (Table 1).
Storage at 10 °C: The microbial counts in samples stored at 10 °C for 10 days did not
show a clear trend with storage time and only 3 samples exceeded counts of 104 cfu/g.
None of the samples (B, C and D) stored at 10 °C exceeded the food safety limit for
TVC (106 cfu/g) at the end of the study. This indicated that the end of the shelf life
based on this criterion was not reached when the study finished and all the samples
were still of acceptable microbiological quality despite the high storage temperature
(10 °C).
Process samples: The TVC in samples from the process (labeled: a,b,c…h) varied
from 102 to almost 107 cfu/g. This variation is explained by the different age of the
samples. Two processors (A and C) provided fresh samples from the process, but the
others (B and D) provided both fresh and stored samples. One batch from D had been
kept for 10 days at 2 °C before delivery to the laboratory and another batch from B
was selected from old stored products (15-22 months in freezer), to obtain samples of
bad quality reflecting frozen storage conditions
Initially it was decided that a quality criterion corresponding to a 106 cfu/g for total
viable count should be applied to discriminate between accepted “good” and rejected
“bad” samples in this study, since this is the general microbiological safety guideline
applied for food quality. Only 6 samples (6 %) of the total sample set from different
production batches were of “bad” quality based on the TVC criterion 106 cfu/g. These
were samples A1 and A2 stored for 28 days and two samples from the process. It
should be mentioned that according to the specification of the A products the
indicated shelflife was only 2 weeks. Since the majority of the samples were not
spoiled based on the TVC criteria of 106cfu/g at the end of the study (Fig 4), it was
decided to use lower limits (105cfu/g) and aim at discriminating between good
samples and samples that are just starting to show spoilage signs but still of

acceptable quality. Fifteen samples exceeded values above 105 cfu/g (16 %) and 33
samples (35 %) exceeded values above 104 cfu/g.
Microbial analysis - LAB
The overall results of the lactic acid bacteria counts in Figure 5 shows that the pattern
is very similar to the TVC numbers. The LAB counts appeared to increase with
storage time at both storage temperatures (5 and 10 °C). The initial values in freshly
smoked samples on day 0 were in the range <101- 102 cfu/g and at the end of the study
three of the samples reached counts of 106 cfu /g. Comparison of the TVC and LAB
numbers during storage showed that the TVC dominated the LAB in the fresh samples
but their numbers seemed to converge with increased storage time. The highest LAB
counts were in the MAP samples (A1).
In some samples the counts of LAB exceeded the TVC value. It is expected that the
LAB will grow on the modified Long and Hammer’s medium (LH), but it may be
speculated that an additional anaerobic flora may have grown on the LAB medium
since higher LAB than TVC counts were found in some samples. It should be
specified that the LAB medium is incubated anaerobically as opposed to aerobically
for LH.
Lactic acid bacteria do not represent typical spoilage bacteria, but a high load of these
bacteria will affect the sensory quality of the product because they can produce
volatiles that contribute to the spoilage odors. Therefore, a significantly high load of
LAB will influence the headspace profile analyzed with the FishNose sensor system
and will be indicative of prolonged storage of products. A limit of 104 cfu/g was
determined as the LAB criteria to distinguish between good and bad samples.
Sensory analysis
In total 96 samples were assessed by sensory analysis, thereof 70 for both odor and
flavor attributes. Samples that had been stored at 10 °C were not tasted to avoid the
health risk for panelists associated with the growth of pathogenic bacteria.
Sensory analysis of the samples showed similar results as microbial analysis
indicating that quality changes of samples stored under these conditions were not
obvious.
Statistical evaluation of the data using one way ANOVA showed that significant
differences in the sensory attributes between storage days of samples from the same

producer within the same sample treatment were not found in the sensory attributes
for taste (salt and bitter taste), appearance (fat secretion, translucent, hue) and the
texture attributes: (elasticity, oilyness, juiciness). Significant differences (p < 0.05)
were found in odor and flavor attributes and color intensity for some sample groups
(data not shown). Since flavor was not evaluated in all the samples the odor scores
will be used for the quality criteria and data from the odor evaluation is shown herein
(Fig 6 - 9).
The descriptors used by the sensory panel for the odor and flavor attributes were the
following: smoked salmon odor/flavor, metallic odor/flavor, sweet/sour fruity
odor/flavor, rancid odor/flavor, off- odor/flavor. The scores of spoilage related
attributes (sweet/sour, rancid and off-odor) increased slightly with storage time for
both the 5 and 10 °C (Fig 6 and 7). However, significant differences in sensory scores
of samples between storage days for these attributes were only found for the A
samples. The highest scores for spoilage related odor were observed for the A1
samples stored in MAP at 5 °C. This is in agreement with high microbial counts for
these samples. On day 0 the fresh samples from producer A had sweet/sour scores
around 10, but after two weeks of storage the sweet/sour scores exceeded 20 and
increased further up to nearly 60 after 28 days of storage. Other sample groups had
much lower scores.
A similar overall trend as for the sweet/sour scores were observed for the off-odor
(Fig 7) and the rancid odor (Fig 8). The spoilage related attributes had generally
higher scores in samples stored at 10 °C than 5 °C, even though the microbial counts
were not higher at the end of the study at 10 °C. This indicates that even though the
microbial counts were lower at 10 °C, the spoilage potential of the microflora and
production of off odors appeared to be greater at the higher temperature. This is one
of the reasons why the results of microbial counts may often be misleading (Gram and
Huss, 1996; Hansen and others, 1995; Leroi and others, 1998). Oxidation may also
have been causing the off odor and rancid odor development. It has been emphasized
that no single quality criterion is adequate to explain the complex changes of spoilage
of smoked salmon products and therefore multiple quality indicies have been
suggested to assess the quality (Jörgensen and others, 2001).
The scores for the initial samples (0 days) from C and D and samples from day 4 from
B for the sample groups stored at 10 °C had already high scores for the sweet/sour,
rancid and off odor spoilage attributes in agreement with higher microbial counts for

these samples. Part of the samples from the process from D had high scores for the
spoilage attributes that can be explained because they had been stored for 10 days
before the delivery to the laboratory.
The smoked salmon odor decreased slightly with storage time at 5 °C in particular for
the A and C samples (Fig 9). The trend was not clear for samples stored at 10 °C.
When comparing the process samples, a batch to batch variation was observed for the
smoked odor, which may have been influenced by the different smoking conditions at
the smokehouses (Table 1). The smoking temperatures at producers A and D were
higher than for the other smokehouses and the smoking time was the shortest at
producer A. The short smoking time at smokehouse A may have resulted in lower
smoking odor scores and the high smoking temperature may have influenced the
proliferation of the microflora in these samples and the higher spoilage rate. Earlier
studies on cold smoked products have shown that the smoke flavor intensity and the
level of smoke related components like phenols in the final products were influenced
by the different smoking procedures in different smokehouses (Cardinal and others
2001).
FishNose measurements
The sensor responses of the FishNose prototype sensor system showed a similar
pattern for the 96 samples analyzed, suggesting covariation in their responses. Figure
10 gives an example of one the sensors PA/2 showing a pattern which is very similar
to the microbial analysis of TVC (Fig 4) and the spoilage related sensory attributes
(sweet/sour, odor off and rancid odor) (Fig 6, 7 and 8). High sensor readings
corresponded to high TVC numbers for two of the producers (A and D) in agreement
to higher sensory scores for spoilage odors in those samples.
Studies in the project on the responses of the FishNose to varying concentrations of
standard compounds selected to represent spoilage related compounds (ethanol and
butanone) and smoke related compounds (furfural and guaiacol), showed that the gas
sensors were more sensitive towards the very volatile compounds e.g. ethanol and
butanone, and were not sensitive enough to detect increasing concentrations of the
smoke related compounds, furfural and guaiacol (Olafsdottir and others 2005).
Therefore, it is likely that the gas sensors are mainly detecting changes in the very
volatile compounds present in the headspace of the samples mainly representing
microbial metabolism and oxidatively derived compounds.

Classification modeling
Global models: Different classification models were investigated for prediction of
samples of different quality. Using single numeric criteria of separate reference
parameters like TVC numbers or single sensory quality related parameters like
sweet/sour odor, rancid odor or off-odor on all the combined measurement data gave
in general low classification rates. It should be emphasized that the establisment of
quality critera in this study is aimed at detecting samples that are showing initial
spoilage signs, but not necessarily of unacceptable quality, because the sample set did
not contain many samples that were spoiled. Therefore, the sensors sensitivity is
challenged because the concentration of spoilage volatiles may be low and as a result
the classification rates may be poorer than otherwise expected if the samples were
indeed spoiled.
By using a combination of the quality parameters the classification rates were
improved, compared to using single reference parameters alone. The quality criteria
established in the storage studies (Table 3) was applied for the Partial Least Squares
Regression (PLSR) classification modeling for accepting and rejecting samples
corresponding to respectively “good” and “bad” samples.
The global PLSR discrimination model using the sensor data from all 96 samples and
the combined criteria of 4 or 5 parameters gave the classification results shown in
Table 4.
In total, 71 samples or 74 % of the samples were classified correctly into their
respective quality class and 26 % were classified wrongly (25 samples) when using
the criteria for TVC, and the three odor critera. By including also the criterion for the
LAB and using 5 criteria the overall classification was not improved as seen by fewer
samples classified correctly 57 % (55 samples) and more samples were wrongly
classified 43 % (41 samples) (Table 4). In principle, 0 % bad samples should be
classified as good ones, so the observed rate is far too high. For the fish producers it is
acceptable that 1-5 % good samples would be classified as bad, so 8 % is far too high.
Increasing or decreasing the bacterial criterion, in combination with the sensory
criteria, did not show much improvement of the number of correctly classified
samples. However, considering that the criteria are very strict and aimed at detecting
samples of marginal quality the overall classification can be justified.

The results suggested that it was difficult to apply a global prediction model based on
all the samples from the different smoked salmon producer. Moreover, the results
showed that other reference parameters like fat secretion and smoked salmon odor
(data not shown) could be useful for local classification modeling, probably due to
different fat content and smoking conditions at the different suppliers.
By inspection of the PCA plot (Fig 1), it appeared that the samples were grouped
according to the different smokehouses, indicating that local prediction models for
each supplier separately could be more suitable.
Local models: Correlation between sensor responses and the TVC, LAB counts, and
sensory odor attributes for the individual producers for samples from the storage
studies are shown in Table 5. Two of the sample groups (C and B) did not have any
structural correlations. No obvious trends or correlations for the responses of the
spoilage indicators and gas sensors were observed in those samples. On the other hand
significant correlations were found for the two producers (A and D).
The samples that showed the highest correlation with TVC numbers were the A
samples, except for the 28 days old samples, where an unexpected decrease was
observed in the sensor response signal (Fig 10). By disregarding the 28 days samples,
a correlation of r=0.92 (p<0.005) was obtained for the PA/2 and P40/2 sensors and
r=0.94 (p<0.005) for both the LY2/G and LY2/LG sensors with storage time. The low
correlation of sensor responses with LAB numbers for the D samples from the
process, but higher correlation of sensor responses with the TVC values, suggests that
other bacteria than LAB may have contributed to the TVC counts like
Enterobacteriacea. This indicates that these samples were not handled properly and
perhaps poor hygienic conditions in the factory. In a prestudy done in the project
Enterobacteriacea counts were indeed high in samples from producer D (unpublished
data).
Based on the findings above, local Partial Least Squares Regression (PLSR) models
for each producer were evaluated and validated by leave-one-out cross-validation. The
values determined for the sensory and microbial variables to establish the quality
criteria of good and bad samples were the same as for the global model. Results from
the classification based on the six FishNose sensors as the independent variables to
predict the smoked salmon quality (“good” or “bad”) are shown in Table 6. The
results are given as per cent of the number of good/bad samples predicted as good or
bad.

Local models apparently show much better performance than the global model and
the results show that both single criteria (TVC, LAB, sweet/sour odor, off odor and
rancid odor) and combined quality criteria may be successful, but the outcome is
dependent on the producer. The main concern is that no “false positives” should
occur, that is no bad samples should be predicted as good samples.
TVC critera: Correct prediction (100 %) of bad samples using TVC criteria was
obtained for C, A and B. No good sample was wrongly predicted as bad from C, but 8
- 38 % of good samples were classified as bad from the other producers. The only
producer that had wrong prediction of bad samples as good using TVC criteria was D.
Only 3 samples were expected bad and two of these were wrongly classified.
LAB criteria: Improved correct prediction of good samples was observed using the
LAB criteria compared with the TVC critieria, but wrong prediction of bad samples as
good was higher for producers A, D and C. This may possibly be explained because
the growth of the LAB may lead to the production of different volatiles than produced
by the psychrophilic spoilage flora and the gas sensors may be less sensitive to those
volatiles.
Off odor criteria: The gas sensors gave the best prediction of off-odor and sweet and
sour odor as seen in Table 6. For example a 100 % correct classification was obtained
for the D samples by using single sensory criteria that is the off-odor or sweet/sour
odor. The sensors are apparently detecting and predicting the spoilage odors caused
by the improper handling of the D samples as seen by the 100 % correct prediction of
the bad samples from D.
Sweet sour criteria: Correct prediction was obtained of bad samples for D and C and
in fact no bad samples existed according to this criterion in the B samples. One of the
expected bad A samples was classified as good, but 100 % correct prediction of the
good samples was achieved.
Rancid criteria: The prediction of rancidity by the sensors is not good and indicates
that the sensors may not able to detect the volatiles causing rancid off odor. It should
also be stated that the odor scores were very low as detected by the sensory panel and
a few of the samples had values > 10 for rancid flavor. The low values indicate that
the volatiles causing rancid odor were present in low concentration and may therefore
not be detected by the gas-sensors. In addition the odor thresholds of characteristic
compounds causing rancid odor is very low so the sensory panel may be able to detect
the odors even though these compounds are present in very low levels in the samples.

Combined criteria: The combined criteria improved the overall predictions slightly
for the A samples but not for the D samples where 8 samples were expected good and
8 bad but the combined criteria predicted all the samples as bad. The combined
criteria was not used for the other sample groups (C and B), because of a lack of
structural correlation of variables and sample groups. Moreover, a robust prediction
was achieved with the single criteria for those samples.
The developed FishNose system with the application specific sampling unit interfaced
with the sensor module was tested on-site at one of the producers location and showed
a good repeatability of the system within 5 % on real samples. Due to the fluctuating
ambient air quality at the production site during the on-site testing, correction of the
sensor readings had to be made for the reference air readings. However, the system
showed good performance with regard to quality prediction of smoked salmon and
successful classification of good and bad samples (95 to 93 %, respectively) under the
harsh environmental conditions occurring in fish production plant was achieved
(Haugen and others Forthcoming). This is encouraging for the future use of the
system as a quality classification tool in the smokehouses
Conclusions
The overall analysis of the data of fresh and stored cold smoked salmon from different
smokehouses showed a “structural correlation” between the sensory and microbial
analyses with the FishNose prototype responses. More specifically, the FishNose
sensors showed a similar pattern in their responses as microbial counts (TVC and
LAB) and sensory scores for spoilage attributes (sweet/sour odor and off odor). The
FishNose system is therefore ideal for fast quality control and freshness evaluation of
smoked salmon products related to microbially produced volatile compounds and was
able to predict “good” samples from “bad” ones based on the established microbial
and sensory criteria.
The majority of the samples in this study were of “good” quality and most of the
samples defined as “bad” were of marginal quality, since the criteria for the individual
quality attributes were set lower than the commercial rejection criteria. Only a few of
the samples would have been judged unacceptable based on commercial quality
criteria. The practical implication of this study for the smoked salmon producer is that

the FishNose system was able to discriminate samples of marginal quality from the
good samples. This allows more effective quality control of samples in the production
and could also be useful in retail and distribution. Rapid quality grading of samples is
possible before the samples are actually spoiled. Additionally, the FishNose gas
sensors appeared to group the samples according to the fish processors indicating that
there were differences in the composition of the headspace because of the different
smoking and handling processes.
When classifying samples using all the data from different producers in a global
model 74 % of the samples were classified correctly into their respective quality class
and 26 % were classified wrongly when using the criteria for TVC, and the
sweet/sour, off and rancid odor critera. Local predictive models based on samples
from individual processors using the same quality criteria appeared to generate more
robust prediction of good and bad samples than the global model. High classification
rates (100 %) were obtained for the FishNose prediction using both single and
combined quality criteria. When evaluating local models the optimal classification
with regard to lowest number of “false positives” (“bad” samples predicted as “good”)
appeared to rely on single criteria like log TVC or sensory off- odor or sweet/sour –
odor. Combined criteria gave the best overall classification for the sample group A
with the highest number of expected bad samples. This suggests that multiple quality
indices are favorable to predict the complex spoilage changes occurring in smoked
salmon products and a model based on the FishNose responses adapted for individual
product may be useful for quality classification in the smokehouses.
Further studies should include characterization of the volatile compounds contributing
to the spoilage changes including different processes used for smoked salmon
products and storage conditions. This would allow selection of suitable sensors in the
FishNose for the detection of quality related volatile compounds and help establishing
useful limits for quality criteria based on different products.
References
AOAC. 1995. 976.18 Determination of salt (chlorine as sodium chloride) in seafood potentiometric
method. Sec. 35.1.19. In: Cunniff P, editor. Official Methods of Analysis of AOAC Int.
Gaithersburg, Md: AOAC Int. 8 p

AOCS. 1998. Official method BA 3-38 and application note Tecator no. AN 301. Firestone D, editor.
Official Methods and Recommended Practices of the American Oil Chemists' Society. 5th ed.
Champaign, IL, USA: American Oil Chemists Society. 4 p.
Becker B, Schillinger U, Holzapfel WH. 2002. Microbiological quality and listeria contamination of
vacuum packaged smoked salmon. Archiev fur Lebensmittelhygiene , 53 (1): 4-7.
Bugueno G, Escriche I, Martinez-Navarrete N, Camacho MD, Chiralt A. 2003. Influence of storage
conditions on some physical and chemical properties of smoked salmon (Salmo salar) processed by
vacuum impregnation techniques. Food Chem (1): 85-0.
Cardinal M, Gunnlaugsdottir H, Bjoernevik M, Ouisse A, Vallet JL, Leroi F. 2004. Sensory
characteristics of cold-smoked Atlantic salmon (Salmo salar) from European market and
relationships with chemical, physical and microbiological measurements. Food Res Int 37(2): 181-93.
Cardinal M; Knockaert C; Torrissen O, Sigurgisladottir S; Morkore T, Thomassen M; Vallet JL. 2001.
Relation of smoking parameters to the yield, colour and sensory quality of smoked Atlantic salmon
(Salmo salar). Food Res Int 34(6): 537-50.
Davidson AP, Cronin F. 1973. Medium for the selective enumeration of lactic acid bacteria in foods.
Appl Microbiol 26 (3): 439-0.
Di Natale C. 2003. Data Fusion in MUSTEC: Towards the Definition of an Artificial Quality Index..
In: Luten JB, Oehlenschlager J, Olafsdottir G, editors. Quality of Fish from Catch to Consumer:
Labeling, Monitoring and Traceability. Wageningen, The Netherlands: Academic Publishers. p 273-
0.
Di Natale C, Brunink JAJ, Bungaro F, Davide F, D´Amico A, Paolesse R, Boschi T, Faccio M, Ferri G.
1996. Recognition of fish storage time by a metalloporphyrins-coated QMB sensor array. Meas Sci
Technol 7: 1103-14.
Di Natale C, Olafsdottir G, Einarsson S, Mantini A, Martinelli E, Paolesse R, Falconi C, D’Amico A.
2001. Comparison and integration of different electronic noses for the evaluation of freshness of cod
fish fillets. Sens Act B77: 572-8.
Dondero M, Cisternas F, Carvajal L, Simpson R. 2004. Changes in quality of vacuum-packed cold-
smoked salmon (Salmo Salar) as a function of storage temperature. Food Chem 87(4): 543-0.
Du WX, Kim J, Huang TS, Marshall MR, Wei CI. 2001. Microbiological, sensory, and electronic nose
evaluations of yellowfin tuna under various storage conditions. J Food Prot 64 (12): 2027- 36.
Du WX, Lin CM, Huang TS, Kim J, Marshall MR, Wei CL. 2002. Potential application of the
electronic nose for quality assessment of salmon fillets under various storage conditions. J Food Sci
67 (1): 307-13.
Egashira M, Shimizu Y, Takao Y. 1990. Trimethylamine sensor based on semiconductive metal-oxides
for detection of fish freshness. Sens Act B Chem 1 (1-6): 108-12 .
Gonzalez-Rodriguez MN, Sanz JJ, Santos JA, Otero A, Garcia-Lopez ML. 2002. Numbers and types
of microorganisms in vacuum-packed cold-smoked freshwater fish at the retail level. Int J Food
Microbiol 77 (1-2): 161-8
Gram L, Huss HH. 1996. Microbiological spoilage of fish and fish products. Int J Food Microbiol
33:121-37.

Hansen LT, Gill T, Huss H. 1995. Effects of salt and storage temperature on chemical, microbiological
and sensory changes in cold-smoked salmon. Food Res Int 28(2): 123-30.
Hansen LT, Gill T, Rontved SD, Huss HH. 1996. Importance of autolysis and microbiological activity
on quality of cold-smoked salmon. Food Res Int 29(2): 181-8
Hansen LT, Rontved SD, Huss HH. 1998. Microbiological quality and shelf life of cold-smoked
salmon from three different processing plants. Food Microbiol 15(2): 137- 50.
Haugen JE, Chanie E, Westad F, Jonsdottir R, Bazzo S, Labreche S, Marcq P, Lundby F, Olafsdottir G.
Rapid control of smoked Atlantic salmon quality by electronic nose: correlation with classical
evaluation methods. Forthcoming.
Haugen E, Undeland I. 2003. Lipid oxidation in herring fillets (Clupea harengus) during ice storage
measured by a commercial hybrid gas-sensor array system, J Agric Food Chem 51(3): 752-9
ISO 1983. 6496. Determination of moisture and other volatile matter content. Geneva, Switzerland:
The International Organization for Standardization. 7 p.
ISO 1993. Sensory analysis - general guidance for the selection, training and monitoring of assessors.
Part 1: Selected assessors, 8586-1. Geneva, Switzerland: The International Organization for
Standardization. p 1-10.
ISO. (1994). 11035 - Sensory analysis - identification and selection of descriptors for establishing a
sensory profile by a multidimensional approach. Geneva, Switzerland: The International Organization
for Standardization.
Joffraud JJ; Leroi F; Roy C; Berdagué JL. 2001. Characterisation of volatile compounds produced by
bacteria isolated from spoilage flora of cold-smoked salmon. Int J Food Microbiol 66, 175-84.
Jørgensen, LV; Huss HH; Dalgaard P. 2001. Significance of volatile compounds produced by spoilage
bacteria in vacuum-packed cold-smoked salmon (Salmo salar) analyzed by GC-MS and multivariate
regression. J Agric Food Chem 49: 2376-81.
Leroi F, Joffraud JJ, Chevalier F, Cardinal M. 1998. Study of the microbial ecology of cold –smoked
salmon during storage at 8°C. Int J Food Microbiol 39: 111-21
Leroi F; Joffraud JJ; Chevalier F; Cardinal, M. 2001. Research of quality indices for cold-smoked
salmon using a stepwise multiple regression of microbiological counts and physico-chemical
parameters. J Appl Microbiol 90: 578-87.
Luzuriaga DA, Balaban MO. 1999a. Evaluation of Odor Decomposition in Raw and Cooked Shrimp:
Correlation of Electronic Nose Readings, Odor Sensory Evaluation and Ammonia Levels. In: Hurst
WJ, editor. Electronic nose and sensor array based system, Design and Applications. Proceedings of
the 5th International Symposium on Olfaction and the Electronic Nose. USA: Technomic Publication
Company, Inc. p 177-84.
Luzuriaga DA, Balaban MO. 1999b. Electronic nose odor evaluation of salmon fillets stored at
different temperature In: Hurst, WJ editor. Electronic nose and sensor array based system, Design and
Applications. Proceedings of the 5th International Symposium on Olfaction and the Electronic Nose.
USA, Technomic Publication Company, Inc. p.162-9.
Newman DJ, Luzuriaga DA, Balaban MO. 1999. Odor and Microbiological Evaluation of Raw Tuna:
Correlation of Sensory and Electronic Nose Data. In: Hurst WJ, editor. Electronic nose and sensor

array based system, Design and Applications. Proceedings of the 5th International Symposium on
Olfaction and the Electronic Nose. USA: Technomic Publication Company Inc. p 170-6.
Ohashi E, Takao Y, Fujita T, Shimizu Y and Egashira M. 1991. Semiconductive trimethylamine gas
sensor for detecting fish freshness. J Food Sci 56(5):1275-8.
Olafsdottir G, Chanie E, Westad F, Jonsdottir R, Bazzo S, Labreche S, Marcq P, Lundby F, Haugen JE.
2005. Rapid Control of Smoked Atlantic Salmon Quality by Electronic Nose: Correlation with
Classical Evaluation Methods. In: Marco S, Montoliu I, editors. Proceedings of the 11th International
Symposium on Olfaction and Electronic Nose, ISOEN2005, Electronic Department, Physics Faculty,
Barcelona University, Barcelona, Spain. p 110-4.
Olafsdottir G, Hognadottir A, Martinsdottir E, and Jonsdottir H. 2000. Application of an electronic
nose to predict total volatile bases in capelin (Mallotus villosus) for fishmeal production. J Agric
Food Chem 48:2353-9.
Olafsdottir G, Hognadottir A, Martinsdottir E. 1998. Application of gas sensors to evaluate freshness
and spoilage of various seafoods. In: Olafsdottir G, Luten J, Dalgaard P, Careche M, Verrez-Bagnis
V, Martinsdottir E, Heia K, editors. Methods to Determine the Freshness of Fish in Research and
Industry. Paris: International Institute of Refrigeration p 100-9.
Olafsdottir G; Fleurence J. 1998. Evaluation of fish freshness using volatile compounds - Classification
of volatile compounds in fish. In: Olafsdottir G, Luten J, Dalgaard P, Careche M, Verrez-Bagnis V,
Martinsdottir E, Heia K, editors. Methods to Determine the Freshness of Fish in Research and
Industry. Paris: International Institute of Refrigeration p. 55-69.
Olafsdottir G, Martinsdottir E, Jonsson EH. 1997. Rapid gas sensor measurement to determine spoilage
of capelin (Mallotus villosus). J Agric Food Chem 45:2654-9.
Olafsdottir G, Xiuchen L, Lauzon H, Jonsdottir R. 2002. Precision and application of electronic nose
for freshness monitoring of whole redfish stored in ice and modified atmosphere bulk storage. J
Aquat Food Prod Technol 11:229-49.
Olafsson R, Martinsdóttir E, Olafsdottir G, Sigfússon ÞI, Gardner JW. 1992. Monitoring of fish
freshness using tin oxide sensors. In: Gardner JW, Bartlett PN, editors. Sensors and Sensory Systems
for an Electronic Nose. The Netherlands: Kluwer Academic Publ. 257-272.
Bleibaum RN, Stone H, Tan T, Labreche S, Saint-Martin E, Isz S. 2002.Comparison of Sensory and
Consumer Results with Electronic Nose and Tongue Sensors for Apple Juices, Food Quality Pref, 13:
409-22.
Schweizer- Berberich PM; Vaihinger S, Göpel W. 1994. Characterisation of food freshness with sensor
arrays. Sens Act, B18(19): 282-0.
Stohr V, Joffraud JJ, Cardinal M, Leroi F. 2001. Spoilage potential and sensory profile associated with
bacteria isolated from cold-smoked salmon. Food Res Int 34 (9): 797-6
Stone H, Sidel JL. 1985. Sensory evaluation practices. Orlando FL: Academic Press, Inc. p 311.
Van Spreekens KJA. 1974. The suitability of Long & Hammer's medium for the enumeration of more
fastidious bacteria from fresh fishery products. Archiv fur Lebensmittelhygiene. 25 (10): 213-9.
Zhao CZ, Pan YZ, Ma LZ, Tang ZN, Zhao GL, Wang LD. 2002. Assay of fish freshness using
trimethylamine vapor probe based on a sensitive membrane on piezoelectric quartz crystal, Sens Actu
B-CHEM 81 (2-3): 218-22

Acknowledgments
The research work presented herein was a part of the EU CRAFT project FishNose
“Development of an electronic nose system for the automated quality control of
smoked fish” (QLK1-CT-2002-71304) sponsored by the European Commission.

Table 1 - Smoking and storage conditions of samples from the different smokehouses, number
of samples from each smokehouse and treatments.
Smokehouse
Conditions A B C D
Temp. (°C) 27 16-22 22 28
Smoking Time (hours) 0.5 14-18 5 6-12
Humidity (%) 40 50-60 50-60 50
Storage Packaging MAP/VAC VAC VAC VAC
Temp. (°C) 5 5 / 10 5 / 10 5 / 10
Storage study Batch 1 (n=64) 16 14 16 16
Process Batch 2 (n=16) 4 4 4 4
Process Batch 3 (n=18) 4 4 4 6
Total n=96 24 22 24 24
Table 2 - Range and mean of fat, water and salt content in smoked salmon samples from
different smokehouses.
Smokehouse % Fat Mean % Water Mean % Salt Mean
A 5.8 – 16.6 10.5 56.1 – 65.7 61.4 2.9 – 5.7 3.8
B 5.8 – 12.9 9.0 60.2 – 66.2 63.3 2.1 – 6.6 4.7
C 3.5 – 11.7 7.0 62.9 – 68.9 65.5 2.3 – 4.0 3.1
D 4.7 – 11.4 8.5 57.3 – 63.8 61.2 4.3 – 7.0 5.3

Table 3 - Quality criteria for good and bad samples based on microbial counts and sensory
odor attributes
Good/accepted samples: Bad/rejected samples:
TVC < 5
LAB < 4
Off odor < 20
Rancid odor < 10
Sweet/sour odor < 20
TVC > 5
LAB >4
Off odor > 20
Rancid odor > 10
Sweet/sour odor > 20
Table 4 - PLSR classification results of a global model for samples from all producers based
on microbial and sensory quality criteria (TVC, sweet/sour, rancid and off odor and LAB)
Expected % %
number of samples correct prediction wrong prediction
n = 96 Good / accepted 65 92 (n = 60 ) 8 (n = 5)
4 criteria
Bad / rejected 31 35 (n = 11 ) 65 (n = 20)
n = 96 Good / accepted
58 71 (n = 41) 29 (n = 17)
5 criteria
Bad / rejected 38 37 (n = 14) 63 (n = 24)

Table 5 - Correlation coefficients (r) between single sensor responses and selected quality
properties for individual producers
Sensors
Attributes PA/2 P10/1 P40/2 P40/1 LY2/G LY2/LG
Sweet/ sour 0.77 0.62 0.77 0.63 0.78 0.74
A Rancid odor 0.43 0.41 0.43 0.41 0.44 0.37
Off-odor 0.74 0.59 0.73 0.59 0.76 0.69
Log TVC 0.56 0.48 0.56 0.48 0.57 0.44
Log LAB 0.69 0.6 0.72 0.59 0.73 0.65
Sweet/ sour 0.87 0.72 0.88 0.72 0.91 0.89
D Rancid odor 0.74 0.73 0.74 0.72 0.7 0.68
Off-odor 0.84 0.71 0.85 0.71 0.87 0.86
Log TVC 0.56 0.43 0.57 0.42 0.62 0.58
Log LAB -0.33 -0.16 -0.34 -0.16 -0.43 -0.44
Sweet/ sour -0.52 -0.48 -0.23 -0.48 -0.22 -0.41
Rancid odor -0.47 -0.49 -0.27 -0.49 -0.25 -0.40
C Off-odor -0.45 -0.45 -0.21 -0.45 -0.23 -0.40
Log TVC 0.13 0.07 0.51 0.06 0.47 0.36
Log LAB 0.31 0.01 0.25 0.02 0.57 0.53
Sweet/ sour -0.16 -0.29 -0.17 -0.26 -0.09 -0.16
B Rancid odor 0.37 0.22 0.35 0.22 0.41 0.42
Off-odor -0.09 -0.12 -0.11 -0.08 -0.06 -0.05
Log TVC -0.29 -0.34 -0.22 -0.34 -0.15 -0.21
Log LAB -0.04 -0.21 0.00 -0.21 0.06 0.02

Table 6 - PLSR classification results of local models based on gas sensor and selected quality criteria for samples from each smokehouse (A. B. C. D) 1 2
A (n=24) D (n=16) C (n=16) B (n=13)
Expected % % Expected % % Expected % % Expected % %
Quality criteria number
of samples
correct prediction
wrong prediction
number of
samples
correct prediction
wrong prediction
number of
samples
correct prediction
wrong prediction
number of
samples
correct prediction
wrong prediction
TVC Good 15 73 27 13 92 8 7 100 0 8 63 38
Bad 9 100 0 3 33 67 9 100 0 5 100 0
LAB Good 15 80 20 15 100 0 14 100 0 8 75 25
Bad 9 89 11 1 0 100 2 0 100 5 100 0
Off odor Good 17 94 6 12 100 0 15 100 0 13 100 0
Bad 7 86 14 4 100 0 1 0 100 0
Sweet / Good 16 100 0 11 100 0 14 86 14 13 100 0
sour Bad 8 88 13 5 100 0 2 100 0 0
Rancid Good 21 100 0 13 92 8 15 100 0 13 100 0
Bad 3 0 100 3 67 33 1 0 100 0
Combine
d Good 14 79 21 8 0 100
Bad 10 90 10 8 100 0

29
List of Figures
Figure 1 - PCA based on the six FishNose gas sensor responses for 96 samples of
smoked salmon from different smokehouses A (●), B (▲), C (■), D (hexagonal
shape).
Figure 2 - Correlation loadings for the first two components from PLS regression with
fourteen sensory attributes as predictors and log TVC as response variable.
Figure 3 - Correlation loading plot from a PLSR model based on the six gas-sensors
as predictors and selected quality attributes (sweet/sour, off-odor, rancid, smoked odor
and microbial counts of TVC and LAB) as response variables.
Figure 4 - Total viable counts (log cfu/g) for salmon samples stored at 5°C and 10°C
for 28 and 10 days, respectively, and 8-10 samples from the process from all the
smokehouses (A1, A2, B, C and D). Two replicate samples were analyzed each day.
Line represents the quality criteria set at TVC log cfu/g = 5.
Figure 5 - Lactic acid bacteria counts (log cfu/g) for salmon samples stored at 5°C for
28 days, at 10°C for 10 days and 8 samples from the process from all the
smokehouses (A1, A2, B, C and D). Two replicate samples were analyzed each day.
Line represents the quality criteria set at LAB log cfu/g = 4.
Figure 6 - Sweet/sour odor scores for samples stored at 5°C and 10°C for 28 and 10
days, respectively, and 8 samples from the process from the different smokehouses
(A1, A2, B, C and D). Two replicate samples were analyzed each day. Line represents
the quality criteria set at 20.
Figure 7 - Off odor scores for samples stored at 5°C and 10°C for 28 and 10 days,
respectively, and 8 samples from the process from the different smokehouses (A1, A2,
B, C and D). Two replicate samples were analyzed each day. Line represents the
quality criteria set at 20.

30
Figure 8 - Rancid odor scores for samples stored at 5°C and 10°C for 28 and 10 days,
respectively, and 8 samples from the process from the different smokehouses (A1, A2,
B, C and D). Two replicate samples were analyzed each day. Line represents the
quality criteria set at 10.
Figure 9 - Smoked salmon odor scores for samples stored at 5°C and 10°C for 28 and
10 days, respectively, and 8 samples from the process from the different smokehouses
(A1, A2, B, C and D). Two replicate samples were analyzed each day.
Figure 10 - Sensor response distribution for samples measured with the FishNose
PA/2 sensor for samples stored at 5°C and 10°C for 28 and 10 days, respectively, and
8 samples from the process from the different smokehouses (A1, A2, B, C and D).
Two replicate samples were analyzed each day.

31
Figure 1.

32
Figure 2.
Figure 3

33
0
1
2
3
4
5
6
7
8
0 0 7 7 14 14 28 28 0 0 4 4 7 7 10 10 a b c d e f g h
TVC
log
cfu/
g
A1 A2 B C D
Storage at 10°CStorage at 5°C Process samples
Figure 4
0
1
2
3
4
5
6
7
8
0 0 7 7 14 14 28 28 0 0 4 4 7 7 10 10 a b c d e f g h
LAB
log
cfu/
g
A1 A2 B C D
Storage at 10°CStorage at 5°C Process samples
Figure 5
0
10
20
30
40
50
60
70
0 0 7 7 14 14 28 28 0 0 4 4 7 7 10 10 a b c d e f g h
Swee
t/sou
r odo
r sco
res
A1 A2 B C D
Storage at 10°CStorage at 5°C Process samples
Figure 6

34
0
10
20
30
40
50
60
0 0 7 7 14 14 28 28 0 0 4 4 7 7 10 10 a b c d e f g h
Off
odo
r sco
res
A1 A2 B C D
Storage at 10°CStorage at 5°C Process samples
Figure 7
0
5
10
15
20
25
30
0 0 7 7 14 14 28 28 0 0 4 4 7 7 10 10 a b c d e f g h
Ran
cid
odor
sco
res
A1 A2 B C D
Storage at 10°CStorage at 5°C Process samples
Figure 8
0
10
20
30
40
50
60
70
80
90
0 0 7 7 14 14 28 28 0 0 4 4 7 7 10 10 a b c d e f g h
Smok
ed s
alm
on o
dor s
core
s A1 A2 B C D
Storage at 10°CStorage at 5°C Process samples
Figure 9

35
0
1
2
3
4
5
6
7
8
9
0 0 7 7 14 14 28 28 0 0 4 4 7 7 10 10 a b c d e f g h
Res
pons
e PA
/2 s
enso
r A1 A2 B C D
Storage at 10°CStorage at 5°C Process samples
Figure 10