Volaris Reports Third Quarter 2018 Results: Ancillary...
17
1 Volaris Reports Third Quarter 2018 Results: Ancillary Revenue Expansion And Reduction Of Unit Cost Excluding Fuel Mexico City, Mexico, October 25, 2018 – Volaris* (NYSE: VLRS and BMV: VOLAR), the ultra-low-cost airline serving Mexico, the United States and Central America, today announced its financial results for the third quarter 2018. The following financial information, unless otherwise indicated, is presented in accordance with International Financial Reporting Standards (IFRS). Third Quarter 2018 Highlights Total operating revenues reached Ps.7,316 million for the third quarter, an increase of 11.3% year over year. Total ancillary revenues were Ps.2,220 million for the third quarter, an increase of 23.5% year over year. The total ancillary revenues per passenger for the third quarter were Ps.474, increasing 10.1% year over year. Total operating revenues per available seat mile (TRASM) were Ps.134.9 cents for the third quarter, a decrease of 1.9% year over year. Operating expenses per available seat mile (CASM) were Ps.130.4 cents for the third quarter, an increase of 4.8% year over year; with an average economic fuel cost per gallon of Ps.43.5, increasing 36.9% year over year, and an average exchange rate of Ps.18.98, a year over year increase of 6.5%. Operating expenses per available seat mile excluding fuel (CASM ex fuel) were Ps.81.9 cents for the third quarter, a decrease of 7.9% year over year. Operating income was Ps.246 million for the third quarter, with an operating margin of 3.4%, equal to a year over year operating margin decrease of 6.1 percentage points. Net loss was Ps.119 million (Ps. (0.12) per share / US$(1.17) per ADS for the third quarter, with a net loss margin of (1.6%), equal to a year over year net margin decrease of 12.6 percentage points. At the close of the third quarter, the Mexican peso had appreciated 5.3% against the U.S. dollar with respect to the end of period exchange rate of the previous quarter. The Company booked a foreign exchange loss of Ps.419 million as a consequence of our U.S. dollar net monetary asset position. Net cash flow used in operating activities was Ps.136 million, in conjunction with cash flow provided by investing activities of Ps.20 million, net cash flow used in financing activities of Ps.247 million, and a negative net foreign exchange difference of Ps.326 million; the net cash decrease in the third quarter was Ps.689 million. As of September 30, 2018, cash and cash equivalents were Ps.6,082 million.
Transcript of Volaris Reports Third Quarter 2018 Results: Ancillary...

1
Volaris Reports Third Quarter 2018 Results: Ancillary Revenue Expansion And
Reduction Of Unit Cost Excluding Fuel
Mexico City, Mexico, October 25, 2018 – Volaris* (NYSE: VLRS and BMV: VOLAR), the ultra-low-cost airline
serving Mexico, the United States and Central America, today announced its financial results for the third
quarter 2018.
The following financial information, unless otherwise indicated, is presented in accordance with International
Financial Reporting Standards (IFRS).
Third Quarter 2018 Highlights
Total operating revenues reached Ps.7,316 million for the third quarter, an increase of 11.3% year over
year.
Total ancillary revenues were Ps.2,220 million for the third quarter, an increase of 23.5% year over
year. The total ancillary revenues per passenger for the third quarter were Ps.474, increasing 10.1%
year over year.
Total operating revenues per available seat mile (TRASM) were Ps.134.9 cents for the third quarter, a
decrease of 1.9% year over year.
Operating expenses per available seat mile (CASM) were Ps.130.4 cents for the third quarter, an
increase of 4.8% year over year; with an average economic fuel cost per gallon of Ps.43.5, increasing
36.9% year over year, and an average exchange rate of Ps.18.98, a year over year increase of 6.5%.
Operating expenses per available seat mile excluding fuel (CASM ex fuel) were Ps.81.9 cents for the
third quarter, a decrease of 7.9% year over year.
Operating income was Ps.246 million for the third quarter, with an operating margin of 3.4%, equal to
a year over year operating margin decrease of 6.1 percentage points.
Net loss was Ps.119 million (Ps. (0.12) per share / US$(1.17) per ADS for the third quarter, with a net
loss margin of (1.6%), equal to a year over year net margin decrease of 12.6 percentage points.
At the close of the third quarter, the Mexican peso had appreciated 5.3% against the U.S. dollar with
respect to the end of period exchange rate of the previous quarter. The Company booked a foreign
exchange loss of Ps.419 million as a consequence of our U.S. dollar net monetary asset position.
Net cash flow used in operating activities was Ps.136 million, in conjunction with cash flow provided by
investing activities of Ps.20 million, net cash flow used in financing activities of Ps.247 million, and a
negative net foreign exchange difference of Ps.326 million; the net cash decrease in the third quarter
was Ps.689 million. As of September 30, 2018, cash and cash equivalents were Ps.6,082 million.

2
Stable Macroeconomics and Domestic Consumer Demand with Exchange Rate Depreciation
and Fuel Price Pressures
Resilient macroeconomics and domestic consumer demand: The macroeconomic indicators in
Mexico during the third quarter were stable, with same store sales[1] increasing 5.3% year over year;
remittances[2] increased 9.68% year over year during July and August 2018; and the Mexican
Consumer Confidence Balance Indicator (BCC) [3] increasing 17% year over year in third quarter 2018.
Air traffic volume increase: The Mexican DGAC reported overall passenger volume growth for
Mexican carriers of 8.1% year over year in July and August; domestic overall passenger volume
increased 7.4%, while international overall passenger volume increased 10.4%.
Exchange rate volatility: The Mexican peso depreciated 6.5% year over year against the US dollar,
from an average exchange rate of Ps.17.82 pesos per US dollar in the third quarter 2017 to Ps.18.98
pesos per US dollar during the third quarter 2018. At the close of the third quarter, the Mexican peso
had appreciated 5.3% with respect to the end of period exchange rate of the previous quarter. The
Company booked a foreign exchange loss of Ps.419 million, mainly as a consequence of our US dollar
net monetary asset position.
Higher fuel prices: The average economic fuel cost per gallon increased 36.9% to Ps.43.5 per gallon
(US$2.3) in the third quarter 2018, year over year.
Passenger Traffic Stimulation, Further Ancillary Revenue Expansion, and Positive TRASM
Trend Reaching Almost the Same Level Last Year
Passenger traffic stimulation: Volaris booked 4.7 million passengers in the third quarter of 2018, up
12.1% year over year. Volaris traffic (measured in terms of fare revenue miles, or RPMs) increased
9.9% for the same period. System load factor during the quarter decreased 2.7 percentage points year
over year to 83.5%.
Positive TRASM trend almost at the same level of last year: For the third quarter of 2018, yield
decreased 2.8% with TRASM decreasing 1.9%, year over year. During the third quarter 2018, in terms
of ASMs, domestic capacity grew 15.8%, while international capacity increased 8.4%, year over year.
[1] Source: Asociación Nacional de Tiendas de Autoservicio y Departamentales, A. C. (ANTAD) [2] Source: Banco de México (BANXICO) [3] Source: Instituto Nacional de Estadística y Geografía (INEGI)
3
Total ancillary revenue growth: For the third quarter of 2018, total ancillary revenues and total
ancillary revenues per passenger increased 23.5% and 10.1% year over year, respectively. The total
ancillary revenue generation continues to grow with new and matured products, appealing to
customers’ needs, representing 30.3% of the total operating revenues.
New routes: In the third quarter 2018, Volaris announced 11 domestic routes from its focus cities
Tijuana and Guadalajara, as well as from Mexico City and Bajio; and three international routes, two
from Bajio to Sacramento and San Jose, California and one from Guadalajara to Charlotte, North
Carolina.
Cost Control and Discipline, Despite Fuel Price Pressure and Exchange Rate Depreciation
CASM and CASM ex fuel for the third quarter 2018 were Ps.130.4 (US$6.9 cents) and Ps.81.9 cents
(US$4.3 cents), respectively. This represented an increase of 4.8% and a decrease of 7.9%,
respectively; mainly driven by higher average economic fuel cost per gallon of 36.9% and an average
exchange rate depreciation of 6.5%, which were offset by a tightening cost control discipline.
Young and Fuel-efficient Fleet
During the third quarter 2018, the Company incorporated three aircraft (two A320 neo and one A321
neo) to its fleet; during this quarter no redeliveries were registered. As of September 30, 2018,
Volaris’ fleet was composed of 73 aircraft (8 A319s, 52 A320s and 13 A321s), with an average age of
4.6 years. At the end of the third quarter 2018, Volaris’ fleet had an average of 184 seats, 72% of
which were in sharklet-equipped aircraft.
Solid Balance Sheet and Good Liquidity
Net cash flow used in operating activities was Ps.136 million, in conjunction with cash flow provided
by investing activities of Ps.20 million, net cash flow used in financing activities of Ps.247 million, and
a negative net foreign exchange differences of Ps.326 million; the net cash used in the third quarter
2018 was Ps.689 million. As of September 30, 2018, cash and cash equivalents were Ps.6,082
million, representing now 23% of last twelve months operating revenues. Volaris registered negative
net debt (or a positive net cash position) of Ps.2,889 million and total equity of Ps.8,863 million.
Active in Risk Management
Volaris remains active in its fuel risk management program. Volaris used call options to hedge 58%
of its third quarter 2018 fuel consumption, at an average strike price of US $1.78 per gallon, which
combined with the 42% unhedged consumption, resulted in a blended average economic fuel cost of
US$2.3 per gallon.

4
IFRS 15: Revenue from Contracts with Customers
During 1Q 2018, we adopted IFRS 15 “Revenue from Contracts with Customers” which replaces
existing revenue recognition guidance, including IAS 18 “Revenue”. IFRS 15 establishes a single
comprehensive model for entities to use in accounting for revenue arising from contracts with
customers.
The adoption of the IFRS 15 impacted the classification and timing of recognition of certain ancillary
items such as bags, advanced seat selection, itinerary changes and other air travel-related fees,
since they are deemed part of the single performance obligation of providing passenger
transportation. These ancillary items are now recognized in passenger revenue (disclosed in the
consolidated statement of operations including in these quarterly earnings release as “other
passenger revenue”).
Non-passenger revenue primarily consists of revenue from the sale of other items such as rental
cars, insurance, hotels and cargo. This change did not have a material impact on our income
statement or balance sheet in any period presented.
This quarterly earnings release includes supplemental information for comparable basis, with recast
amounts with the IFRS 15 adoption effects, and were derived from unaudited financial statements
included in the quarterly reports on Form 6-K during the year ended December 31, 2017.
5
IFRS 16: Leases
The Accounting Standards Board (IASB) issued IFRS 16 Leases, which is effective for annual
reporting periods beginning on or after January 1, 2019, with limited earlier application permitted.
This new standard will replace the current IAS 17 Leases standard.
Under IFRS 16, leases are accounted for based on a ‘right-of-use model’. The model reflects that, at
the commencement date, a lessee has a financial obligation to make lease payments to the lessor for
its right to use the underlying asset during the lease term. The lessor conveys that right to use the
underlying asset at lease commencement, which is the time when it makes the underlying asset
available for use by the lessee.
The most significant impacts of the new standard in airlines:
The new standard requires almost all lease agreements to be recognized on the balance
sheet; assets and liabilities will be increased significantly.
Almost all the lease payments will no longer be recognized as part of the “rent expenses”, but
as part of the “depreciation expense”.
The standard includes certain recognition exemptions: a) leases with a lease term of 12
months, and b) leases where the underlying asset has a low value when new, of US$5,000 or
less.
IFRS 16 permits two different adoption models. Full retrospective model or modified
retrospective model.
The impact of U.S. dollar volatility will have greater impact in Mexican airlines with Mexican
peso as functional currency. Accounting and taxes implication for the impact of non-cash
foreign exchange gain or losses as consequence of the recognition of the required lease
liabilities under the adoption of this new standard.
Cash Flows impact. Under IAS 17 (current standard) cash flows related to rent payments are
recorded as part of the operating cash flows, but under IFRS 16 the cash flows related to
rental payments will be presented as part of the financial cash flows.
Income tax accounting. a) Recognition and measurement of deferred tax assets and
liabilities; and b) Assessment of the recoverability of deferred tax assets.
Additional disclosures
The Company is in process of completing an assessment of the potential impact of adopting IFRS
16.
Investors are urged to carefully read the Company's periodic reports filed with or furnished to the Securities and Exchange Commission, for additional information regarding the Company.
6
Conference Call/Webcast Details:
About Volaris: *Controladora Vuela Compañía de Aviación, S.A.B. de C.V. (“Volaris” or the “Company”) (NYSE: VLRS and BMV:
VOLAR), is an ultra-low-cost carrier, with point-to-point operations, serving Mexico, the United States and Central
America. Volaris offers low base fares to build its market, providing quality service and extensive customer choice. Since
beginning operations in March 2006, Volaris has increased its routes from five to more than 167 and its fleet from four
to 73 aircraft. Volaris offers more than 319 daily flight segments on routes that connect 40 cities in Mexico and 27 cities
in the United States and Central America with the youngest fleet in Mexico. Volaris targets passengers who are visiting
friends and relatives, cost-conscious business people and leisure travelers in Mexico and to select destinations in the
United States and Central America. Volaris has received the ESR Award for Social Corporate Responsibility for eight
consecutive years. For more information, please visit: www.volaris.com
Forward-looking Statements:
Statements in this release contain various forward-looking statements within the meaning of Section 27A of the Securities
Act of 1933, as amended, and Section 21E of the Securities Exchange Act of 1934, as amended, which represent the
Company's expectations, beliefs or projections concerning future events and financial trends affecting the financial
condition of our business. When used in this release, the words "expects," “intends,” "estimates," “predicts,” "plans,"
"anticipates," "indicates," "believes," "forecast," "guidance," “potential,” "outlook," "may," “continue,” "will," "should,"
"seeks," "targets" and similar expressions are intended to identify forward-looking statements. Similarly, statements that
describe the Company's objectives, plans or goals, or actions the Company may take in the future, are forward-looking
statements. Forward-looking statements include, without limitation, statements regarding the Company's intentions and
expectations regarding the delivery schedule of aircraft on order, announced new service routes and customer savings
programs. Forward-looking statements should not be read as a guarantee or assurance of future performance or results
and will not necessarily be accurate indications of the times at, or by, which such performance or results will be
achieved. Forward-looking statements are based on information available at the time those statements are made and/or
management’s good faith belief as of that time with respect to future events and are subject to risks and uncertainties
that could cause actual performance or results to differ materially from those expressed in or suggested by the forward-
looking statements. Forward-looking statements are subject to a number of factors that could cause the Company's
actual results to differ materially from the Company's expectations, including the competitive environment in the airline
industry; the Company's ability to keep costs low; changes in fuel costs; the impact of worldwide economic conditions on
customer travel behavior; the Company's ability to generate non-ticket revenues; and government regulation. Additional
Presenters for the Company: Date:
Mr. Enrique Beltranena, CEO Mr. Holger Blankenstein, Airline EVP Ms. Maria Elena Rodriguez, Investor Relations & Corporate Finance Director Friday, October 26, 2018
Time: 10:00 am U.S. EDT (9:00 am Mexico City Time)
United States dial in (toll free): 1-877-830-2576
Mexico dial in (toll free): 001-800-514-6145 Brazil dial in (toll free): 0-800-891-6744 International dial in: + 1-785-424-1726 Participant passcode: VOLARIS (8652747) Webcast will be available at: https://webcasts.eqs.com/volaris20181026

7
information concerning these, and other factors is contained in the Company's Securities and Exchange Commission
filings. All forward-looking statements attributable to us or persons acting on our behalf are expressly qualified in their
entirety by the cautionary statements set forth above. Forward-looking statements speak only as of the date of this
release. You should not put undue reliance on any forward-looking statements. We assume no obligation to update
forward-looking statements to reflect actual results, changes in assumptions or changes in other factors affecting forward-
looking information, except to the extent required by applicable law. If we update one or more forward-looking
statements, no inference should be drawn that we will make additional updates with respect to those or other forward-
looking statements.
.
Investor Relations Contact:
Maria Elena Rodríguez & Andrea González / Investor Relations / [email protected] / +52 55 5261 6444
Media Contact:
Gabriela Fernández / [email protected] / +52 55 5246 0100

8
Controladora Vuela Compañía de Aviación, S.A.B. de C.V. and Subsidiaries
Financial and Operating Indicators
Unaudited
Three months ended September
30, 2018
Three months ended
September 30, 2018
Three months ended September
30, 2017 (Adjusted)
Variance
(In Mexican pesos, except otherwise indicated) (US Dollars)* (%) Total operating revenues (millions) 389 7,316 6,571 11.3% Total operating expenses (millions) 376 7,070 5,948 18.9% EBIT (millions) 13 246 623 (60.5%) EBIT margin 3.4% 3.4% 9.5% (6.1) pp Depreciation and amortization 6 115 150 (23.4%) Aircraft and engine rent expense 85 1,593 1,384 15.1% Net (loss) income (millions) (6) (119) 720 NA Net (loss) income margin (1.6%) (1.6%) 11.0% (12.6) pp (Loss) income per share: Basic (pesos) (0.01) (0.12) 0.71 NA Diluted (pesos) (0.01) (0.12) 0.71 NA (Loss) income per ADS: Basic (pesos) (0.06) (1.17) 7.11 NA Diluted (pesos) (0.06) (1.17) 7.11 NA Weighted average shares outstanding: Basic - 1,011,876,677 1,011,876,677 0.0% Diluted - 1,011,876,677 1,011,876,677 0.0%
Available seat miles (ASMs) (millions) (1) - 5,422 4,780 13.4% Domestic - 3,752 3,239 15.8% International - 1,670 1,541 8.4% Revenue passenger miles (RPMs) (millions) (1) - 4,526 4,119 9.9% Domestic - 3,230 2,852 13.3% International - 1,296 1,267 2.3% Load factor (2) - 83.5% 86.2% (2.7) pp Domestic - 86.1% 88.1% (2.0) pp International - 77.6% 82.2% (4.6) pp
Total operating revenue per ASM (TRASM) (cents) (1) 7.2 134.9 137.5 (1.9%) Fare revenue per ASM (RASM) (cents) (1) 5.0 94.0 99.9 (5.9%) Fare revenue per RPM (Yield) (cents) (1) 6.0 112.6 115.9 (2.8%) Average fare (2) 58 1,091 1,146 (4.8%) Average other passenger revenue (1) 22 419 362 15.7% Average non-passenger revenue (1) 2.9 55 68 (19.4%) Total ancillary revenue per passenger (4) 25.2 474 431 10.1% Operating expenses per ASM (CASM) (cents) (1) 6.9 130.4 124.4 4.8% Operating expenses per ASM (CASM) (US cents) (3) - 6.9 7.0 (1.6%) CASM ex fuel (cents) (1) 4.4 81.9 88.9 (7.9%) CASM ex fuel (US cents) (3) - 4.3 5.0 (13.5%)
Booked passengers (thousands) (1) - 4,680 4,173 12.1% Departures (1) - 30,391 26,999 12.6% Block hours (1) - 82,977 73,725 12.5% Fuel gallons consumed (millions) - 60.5 53.4 13.2% Average economic fuel cost per gallon 2.3 43.5 31.8 36.9% Aircraft at end of period - 73 67 9.0% Average aircraft utilization (block hours) - 13.1 12.5 4.4% Average exchange rate - 18.98 17.82 6.5% End of period exchange rate - 18.81 18.20 3.4% *Peso amounts were converted to U.S. dollars at end of period exchange rate for convenience purposes only (1) Includes schedule + charter (3) Dollar amounts were converted at average exchange rate of each period (2) Includes schedule (4) Includes “other passenger revenues” and “non-passenger revenues”
9
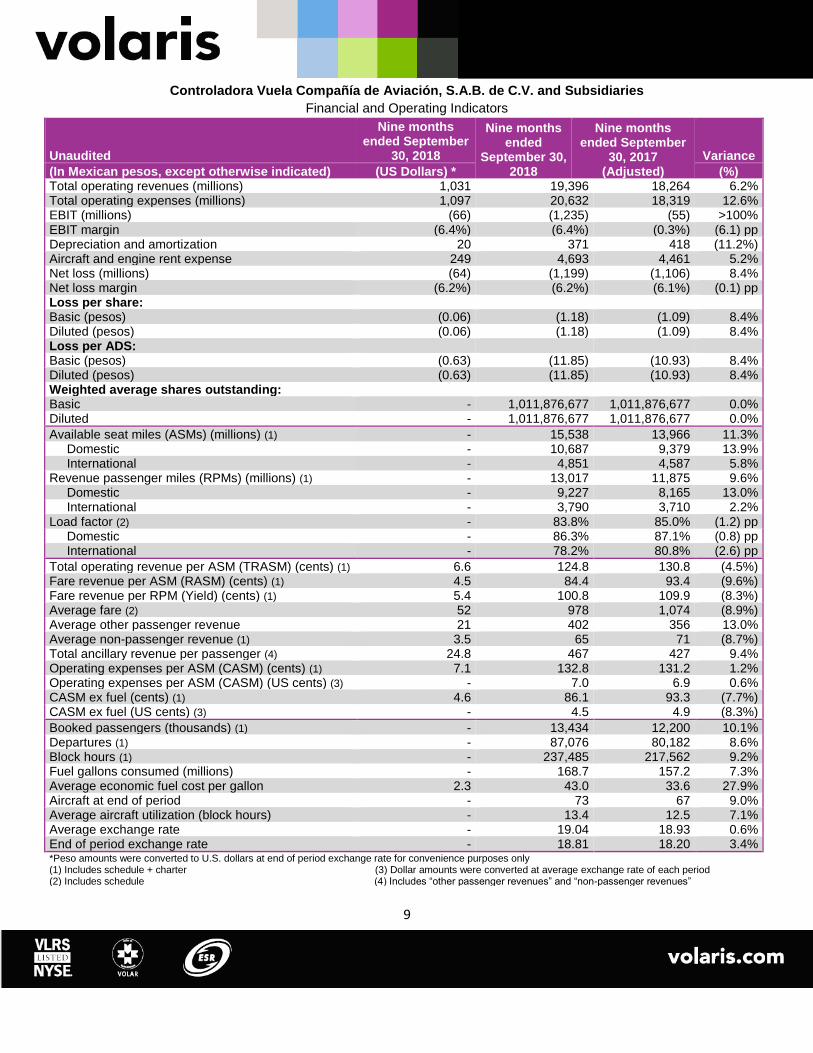
Controladora Vuela Compañía de Aviación, S.A.B. de C.V. and Subsidiaries
Financial and Operating Indicators
Unaudited
Nine months ended September
30, 2018
Nine months ended
September 30, 2018
Nine months ended September
30, 2017 (Adjusted)
Variance
(In Mexican pesos, except otherwise indicated) (US Dollars) * (%) Total operating revenues (millions) 1,031 19,396 18,264 6.2% Total operating expenses (millions) 1,097 20,632 18,319 12.6% EBIT (millions) (66) (1,235) (55) >100% EBIT margin (6.4%) (6.4%) (0.3%) (6.1) pp Depreciation and amortization 20 371 418 (11.2%) Aircraft and engine rent expense 249 4,693 4,461 5.2% Net loss (millions) (64) (1,199) (1,106) 8.4% Net loss margin (6.2%) (6.2%) (6.1%) (0.1) pp Loss per share: Basic (pesos) (0.06) (1.18) (1.09) 8.4% Diluted (pesos) (0.06) (1.18) (1.09) 8.4% Loss per ADS: Basic (pesos) (0.63) (11.85) (10.93) 8.4% Diluted (pesos) (0.63) (11.85) (10.93) 8.4% Weighted average shares outstanding: Basic - 1,011,876,677 1,011,876,677 0.0% Diluted - 1,011,876,677 1,011,876,677 0.0%
Available seat miles (ASMs) (millions) (1) - 15,538 13,966 11.3% Domestic - 10,687 9,379 13.9% International - 4,851 4,587 5.8% Revenue passenger miles (RPMs) (millions) (1) - 13,017 11,875 9.6% Domestic - 9,227 8,165 13.0% International - 3,790 3,710 2.2% Load factor (2) - 83.8% 85.0% (1.2) pp Domestic - 86.3% 87.1% (0.8) pp International - 78.2% 80.8% (2.6) pp
Total operating revenue per ASM (TRASM) (cents) (1) 6.6 124.8 130.8 (4.5%) Fare revenue per ASM (RASM) (cents) (1) 4.5 84.4 93.4 (9.6%) Fare revenue per RPM (Yield) (cents) (1) 5.4 100.8 109.9 (8.3%) Average fare (2) 52 978 1,074 (8.9%) Average other passenger revenue 21 402 356 13.0% Average non-passenger revenue (1) 3.5 65 71 (8.7%) Total ancillary revenue per passenger (4) 24.8 467 427 9.4% Operating expenses per ASM (CASM) (cents) (1) 7.1 132.8 131.2 1.2% Operating expenses per ASM (CASM) (US cents) (3) - 7.0 6.9 0.6% CASM ex fuel (cents) (1) 4.6 86.1 93.3 (7.7%) CASM ex fuel (US cents) (3) - 4.5 4.9 (8.3%)
Booked passengers (thousands) (1) - 13,434 12,200 10.1% Departures (1) - 87,076 80,182 8.6% Block hours (1) - 237,485 217,562 9.2% Fuel gallons consumed (millions) - 168.7 157.2 7.3% Average economic fuel cost per gallon 2.3 43.0 33.6 27.9% Aircraft at end of period - 73 67 9.0% Average aircraft utilization (block hours) - 13.4 12.5 7.1% Average exchange rate - 19.04 18.93 0.6% End of period exchange rate - 18.81 18.20 3.4% *Peso amounts were converted to U.S. dollars at end of period exchange rate for convenience purposes only (1) Includes schedule + charter (3) Dollar amounts were converted at average exchange rate of each period (2) Includes schedule (4) Includes “other passenger revenues” and “non-passenger revenues”

10
Controladora Vuela Compañía de Aviación, S.A.B. de C.V. and Subsidiaries Consolidated Statement of Operations
Unaudited
Three months ended
September 30, 2018
Three months ended September
30, 2018
Three months ended September
30, 2017 (Adjusted)
Variance
(In millions of Mexican pesos) (US Dollars) * (%) Operating revenues:
Passenger revenues 375 7,058 6,286 12.3% Fare revenues 271 5,096 4,773 6.8% Other passenger revenues 104 1,962 1,513 29.7% Non-passenger revenues 14 258 285 (9.5%) Cargo 3 55 38 44.7% Other non-passenger revenues 11 203 247 (17.8%) Total operating revenues 389 7,316 6,571 11.3% Other operating income (13) (243) (8) >100% Fuel 140 2,631 1,698 54.9% Aircraft and engine rent expense 85 1,593 1,384 15.1% Landing, take-off and navigation expenses 61 1,150 989 16.2% Salaries and benefits 44 834 695 19.9% Maintenance expenses 21 393 324 21.3% Sales, marketing and distribution expenses 18 340 468 (27.4%) Other operating expenses 14 257 248 3.6% Depreciation and amortization 6 115 150 (23.4%) Operating expenses 376 7,070 5,948 18.9%
Operating income 13 246 623 (60.5%)
Finance income 2 37 30 23.3% Finance cost (4) (64) (20) >100% Exchange (loss) gain, net (22) (419) 125 NA Comprehensive financing result (24) (446) 135 NA (Loss) income before income tax (11) (200) 758 NA Income tax benefit (expense) 4 81 (38) NA Net (loss) income (6) (119) 720 NA
*Peso amounts were converted to U.S. dollars at end of period exchange rate for convenience purposes only.

11
Controladora Vuela Compañía de Aviación, S.A.B. de C.V. and Subsidiaries Consolidated Statement of Operations
Unaudited
Nine months ended September 30, 2018
Nine months ended September
30, 2018
Nine months ended September
30, 2017 (Adjusted)
Variance
(In millions of Mexican pesos) (US Dollars)* (%) Operating revenues:
Passenger revenues 984 18,520 17,392 6.5% Fare revenues 697 13,118 13,050 0.5% Other passenger revenues 287 5,402 4,342 24.4%
Non-passenger revenues 47 877 872 0.5% Cargo 9 156 118 32.2% Other non-passenger revenues 38 720 754 (4.5%) Total operating revenues 1,031 19,396 18,264 6.2% Other operating income (25) (475) (19) >100% Fuel 385 7,250 5,284 37.2% Aircraft and engine rent expense 249 4,693 4,461 5.2% Landing, take-off and navigation expenses 182 3,425 3,029 13.1% Salaries and benefits 124 2,330 2,108 10.5% Maintenance expenses 60 1,126 1,037 8.5% Sales, marketing and distribution expenses 57 1,079 1,212 (11.0%) Other operating expenses 45 832 789 5.4% Depreciation and amortization 20 371 418 (11.2%) Operating expenses 1,097 20,632 18,319 12.6%
Operating loss (66) (1,235) (55) >100%
Finance income 6 108 72 50.0% Finance cost (7) (129) (62) >100% Exchange loss, net (24) (457) (1,578) (71.0%) Comprehensive financing result (25) (477) (1,567) (69.5%)
Loss before income tax (91) (1,713) (1,623) 5.5% Income tax benefit 27 514 517 (0.6%) Net loss (64) (1,199) (1,106) 8.4%
*Peso amounts were converted to U.S. dollars at end of period exchange rate for convenience purposes only.

12
Controladora Vuela Compañía de Aviación, S.A.B. de C.V. and Subsidiaries Reconciliation of total ancillary revenue per passenger
The adoption of the IFRS 15 impacted the classification and timing of recognition of certain ancillary items such as bags, advanced seat selection, itinerary changes and other air travel-related fees, since they are deemed part of the single performance obligation of providing passenger transportation. These ancillary items are now recognized in passenger revenue (disclosed below as “other passenger revenue”). Non-passenger revenue primarily consists of revenue from the sale of other items such as rental cars, insurance, hotels and cargo. This change did not have a material impact on our income statement or balance sheet in any period presented. The following table shows quarterly additional detail about the components of total ancillary revenue:
Unaudited
Three months ended
September 30, 2018
(US Dollars)*
Three months ended
September 30, 2018
Three months ended
September 30, 2017
(Adjusted) Variance
(%) (In millions of Mexican pesos)
Other passenger revenues 104 1,962 1,513 29.7% Non-passenger revenues 14 258 285 (9.5%) Total ancillary revenues 118 2,220 1,798 23.5% Booked passengers (thousands) 4,680 4,680 4,173 12.1% Total ancillary revenue per passenger 25.2 474 431 10.1%
*Peso amounts were converted to U.S. dollars at end of period exchange rate for convenience purposes only.
13
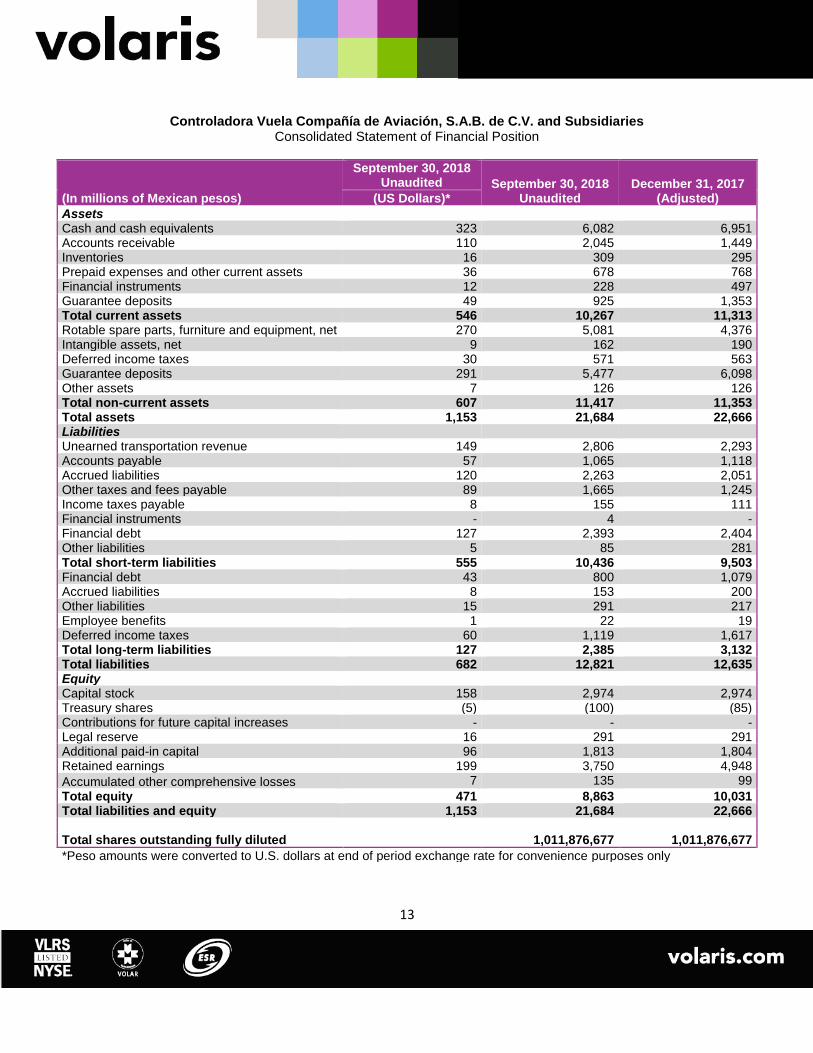
Controladora Vuela Compañía de Aviación, S.A.B. de C.V. and Subsidiaries Consolidated Statement of Financial Position
(In millions of Mexican pesos)
September 30, 2018 Unaudited September 30, 2018
Unaudited December 31, 2017
(Adjusted) (US Dollars)*
Assets
Cash and cash equivalents 323 6,082 6,951 Accounts receivable 110 2,045 1,449 Inventories 16 309 295 Prepaid expenses and other current assets 36 678 768 Financial instruments 12 228 497 Guarantee deposits 49 925 1,353 Total current assets 546 10,267 11,313 Rotable spare parts, furniture and equipment, net 270 5,081 4,376 Intangible assets, net 9 162 190 Deferred income taxes 30 571 563 Guarantee deposits 291 5,477 6,098 Other assets 7 126 126 Total non-current assets 607 11,417 11,353 Total assets 1,153 21,684 22,666 Liabilities
Unearned transportation revenue 149 2,806 2,293 Accounts payable 57 1,065 1,118 Accrued liabilities 120 2,263 2,051 Other taxes and fees payable 89 1,665 1,245 Income taxes payable 8 155 111 Financial instruments - 4 - Financial debt 127 2,393 2,404 Other liabilities 5 85 281 Total short-term liabilities 555 10,436 9,503 Financial debt 43 800 1,079 Accrued liabilities 8 153 200 Other liabilities 15 291 217 Employee benefits 1 22 19 Deferred income taxes 60 1,119 1,617 Total long-term liabilities 127 2,385 3,132 Total liabilities 682 12,821 12,635 Equity
Capital stock 158 2,974 2,974 Treasury shares (5) (100) (85) Contributions for future capital increases - - - Legal reserve 16 291 291 Additional paid-in capital 96 1,813 1,804 Retained earnings 199 3,750 4,948
Accumulated other comprehensive losses 7 135 99
Total equity 471 8,863 10,031 Total liabilities and equity 1,153 21,684 22,666
Total shares outstanding fully diluted
1,011,876,677 1,011,876,677
*Peso amounts were converted to U.S. dollars at end of period exchange rate for convenience purposes only

14
Controladora Vuela Compañía de Aviación, S.A.B. de C.V. and Subsidiaries Consolidated Statement of Cash Flows – Cash Flow Data Summary
Unaudited
Three months
ended September 30, 2018
Three months ended September
30, 2018
Three months ended September
30, 2017 (Adjusted) (In millions of Mexican pesos) (US Dollars)*
Net cash flow used in operating activities (7) (136) (385) Net cash flow provided by (used in) investing activities 1 20 (564) Net cash flow (used in) provided by financing activities (13) (247) 268 Decrease in cash and cash equivalents (19) (363) (681) Net foreign exchange differences (17) (326) 73 Cash and cash equivalents at beginning of period 359 6,771 5,981 Cash and cash equivalents at end of period 323 6,082 5,373 *Peso amounts were converted to U.S. dollars at end of period exchange rate for convenience purposes only
Controladora Vuela Compañía de Aviación, S.A.B. de C.V. and Subsidiaries Consolidated Statement of Cash Flows – Cash Flow Data Summary
Unaudited
Nine months
ended September 30, 2018
Nine months ended September
30, 2018
Nine months ended September
30, 2017 (Adjusted) (In millions of Mexican pesos) (US Dollars)*
Net cash flow provided by (used in) operating activities 25 464 (130) Net cash flow used in investing activities (34) (641) (1,409) Net cash flow (used in) provided by financing activities (21) (386) 533 Decrease in cash and cash equivalents (30) (563) (1,006) Net foreign exchange differences (16) (306) (692) Cash and cash equivalents at beginning of period 369 6,951 7,071 Cash and cash equivalents at end of period 323 6,082 5,373 *Peso amounts were converted to U.S. dollars at end of period exchange rate for convenience purposes only
15
Controladora Vuela Compañía de Aviación, S.A.B. de C.V. and Subsidiaries
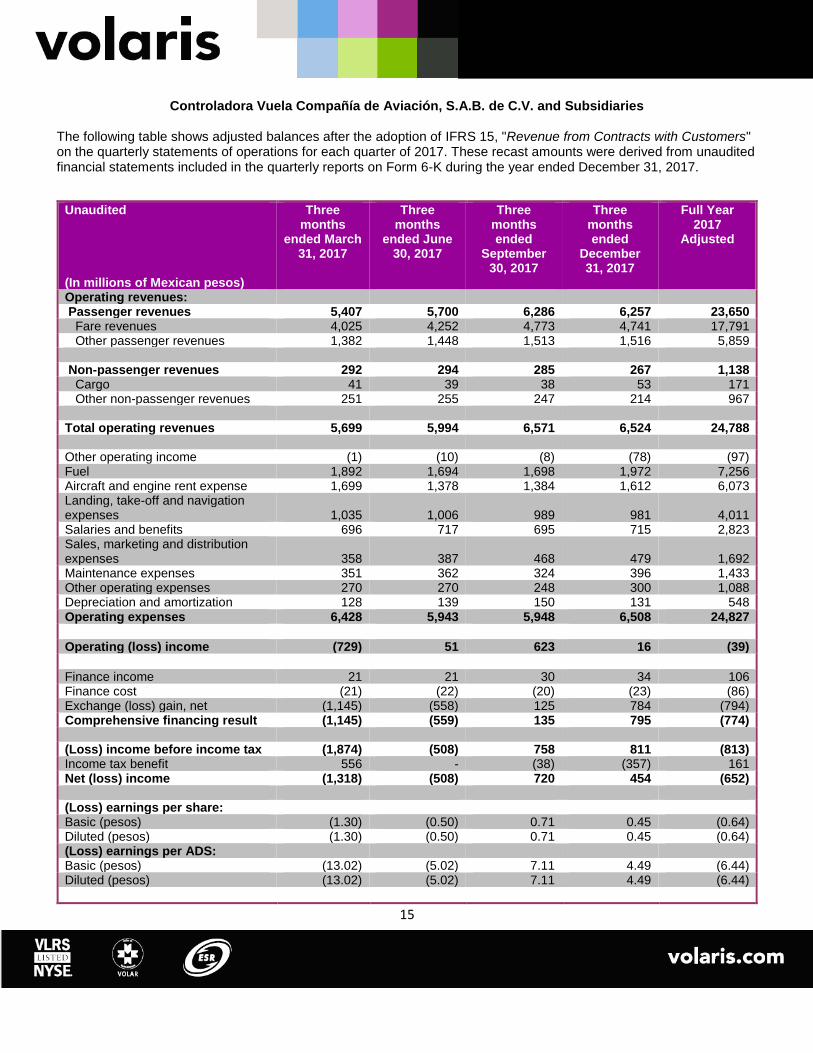
The following table shows adjusted balances after the adoption of IFRS 15, "Revenue from Contracts with Customers" on the quarterly statements of operations for each quarter of 2017. These recast amounts were derived from unaudited financial statements included in the quarterly reports on Form 6-K during the year ended December 31, 2017.
Unaudited Three months
ended March 31, 2017
Three months
ended June 30, 2017
Three months ended
September 30, 2017
Three months ended
December 31, 2017
Full Year 2017
Adjusted
(In millions of Mexican pesos) Operating revenues: Passenger revenues 5,407 5,700 6,286 6,257 23,650 Fare revenues 4,025 4,252 4,773 4,741 17,791 Other passenger revenues 1,382 1,448 1,513 1,516 5,859
Non-passenger revenues 292 294 285 267 1,138 Cargo 41 39 38 53 171 Other non-passenger revenues 251 255 247 214 967
Total operating revenues 5,699 5,994 6,571 6,524 24,788
Other operating income (1) (10) (8) (78) (97) Fuel 1,892 1,694 1,698 1,972 7,256 Aircraft and engine rent expense 1,699 1,378 1,384 1,612 6,073 Landing, take-off and navigation expenses 1,035 1,006 989 981 4,011 Salaries and benefits 696 717 695 715 2,823 Sales, marketing and distribution expenses 358 387 468 479 1,692 Maintenance expenses 351 362 324 396 1,433 Other operating expenses 270 270 248 300 1,088 Depreciation and amortization 128 139 150 131 548 Operating expenses 6,428 5,943 5,948 6,508 24,827
Operating (loss) income (729) 51 623 16 (39)
Finance income 21 21 30 34 106 Finance cost (21) (22) (20) (23) (86) Exchange (loss) gain, net (1,145) (558) 125 784 (794) Comprehensive financing result (1,145) (559) 135 795 (774)
(Loss) income before income tax (1,874) (508) 758 811 (813) Income tax benefit 556 - (38) (357) 161 Net (loss) income (1,318) (508) 720 454 (652)
(Loss) earnings per share: Basic (pesos) (1.30) (0.50) 0.71 0.45 (0.64) Diluted (pesos) (1.30) (0.50) 0.71 0.45 (0.64) (Loss) earnings per ADS: Basic (pesos) (13.02) (5.02) 7.11 4.49 (6.44) Diluted (pesos) (13.02) (5.02) 7.11 4.49 (6.44)

16
Controladora Vuela Compañía de Aviación, S.A.B. de C.V. and Subsidiaries
The following table shows quarterly adjustments made due to the adoption of IFRS 15, "Revenue from Contracts with Customers" on the statements of operations for 2017.
Unaudited Full Year 2017 as Reported
Three months ended March 31,
2017
Three months ended June 30,
2017
Three months ended
September 30, 2017
Three months ended
December 31, 2017
Full Year 2017 Adjusted (In millions of Mexican pesos)
Operating revenues: Passenger revenues 17,791 1,382 1,448 1,513 1,516 23,650 Fare revenues 17,791 - - - - 17,791 Other passenger revenues - 1,382 1,448 1,513 1,516 5,859 Non-passenger revenues 7,054 (1,339) (1,435) (1,524) (1,618) 1,138 Cargo 171 - - - - 171 Other non-passenger revenues 6,883 (1,339) (1,435) (1,524) (1,618) 967 Total operating revenues 24,845 43 13 (11) (102) 24,788 Other operating income (97) - - - - (97) Fuel 7,256 - - - - 7,256 Aircraft and engine rent expense 6,073 - - - - 6,073 Landing, take-off and navigation expenses 4,011 - - - - 4,011 Salaries and benefits 2,823 - - - - 2,823 Sales, marketing and distribution expenses 1,692 - - - - 1,692 Maintenance expenses 1,433 - - - - 1,433 Other operating expenses 1,088 - - - - 1,088 Depreciation and amortization 548 - - - - 548 Operating expenses 24,827 - - - - 24,827
Operating income (loss) 18 43 13 (11) (102) (39)
Finance income 106 - - - - 106 Finance cost (86) - - - - (86) Exchange (loss), net (794) - - - - (794) Comprehensive financing result (774) - - - - (774) (Loss)income before income tax (756) 43 13 (11) (102) (813) Income tax benefit 161 - - - - 161 Net (loss) income (595) 43 13 (11) (102) (652) Basic (loss) earnings per share (0.59) 0.04 0.01 (0.01) (0.10) (0.64) Diluted (loss) earnings per share (0.59) 0.04 0.01 (0.01) (0.10) (0.64)

17
Controladora Vuela Compañía de Aviación, S.A.B. de C.V. and Subsidiaries
Reconciliation of total ancillary revenue per passenger
The adoption of the IFRS 15 impacted the classification and timing of recognition of certain ancillary items such as bags, advanced seat selection, itinerary changes and other air travel-related fees, since they are deemed part of the single performance obligation of providing passenger transportation. These ancillary items are now recognized in passenger revenue (disclosed below as “other passenger revenue”). Non-passenger revenue primarily consists of revenue from the sale of other items such as rental cars, insurance hotels and cargo. This change did not have a material impact on our income statement or balance sheet in any period presented. The following table shows quarterly additional detail about the components of total ancillary revenue:
Unaudited Three months ended March
31, 2017
Three months ended June
30, 2017
Three months ended
September 30, 2017
Three months ended
December 31, 2017
Full Year 2017 Adjusted (In millions of Mexican pesos)
Other passenger revenues 1,382 1,448 1,513 1,516 5,859 Non-passenger revenues 292 294 285 267 1,138 Total ancillary revenues 1,674 1,742 1,798 1,783 6,997 Booked passengers (thousands) 3,964 4,063 4,173 4,226 16,426 Total ancillary revenue per passenger
422
429
431
422
426
Total ancillary revenue per passenger (as reported) (*)
411 426 434 446 429
(*) These recast amounts were derived from unaudited financial statements included in the quarterly reports on Form
6-K during the year ended December 31, 2017, under the called name “Non-ticket revenue per passenger”.