Vol.6, No.1, pp.49~57, March 2012 DOI 10.1007/s40069-012 ...
9
49 International Journal of Concrete Structures and Materials Vol.6, No.1, pp.49~57, March 2012 DOI 10.1007/s40069-012-0005-0 ISSN 1976-0485 / eISSN 2234-1315 Shear-Strengthening of Reinforced & Prestressed Concrete Beams Using FRP: Part II – Experimental Investigation Thomas H.-K. Kang 1), * and Moustapha Ibrahim Ary 2) Abstract: The main objectives of this research were to experimentally evaluate the impact of Carbon Fiber-Reinforced Polymers (CFRP) amount and strip spacing on the shear behavior of prestressed concrete (PC) beams and to evaluate the applicability of existing analytical models of Fiber-Reinforced Polymer (FRP) shear capacity to PC beams shear-strengthened with CFRP. The U- shaped CFRP strips with different spacing were applied externally to the test specimens in order to observe the overall behavio r of the prestressed concrete I-beams and the mode of failure of the applied CFRP strips. Results obtained from the experimental program showed that the application of CFRP strips to prestressed concrete I-beams did in fact enhance the overall behavior of the specimens. The strengthened specimens responded with an increase in ductility and in shear capacity. However, it should be noted that the CFRP strips were not effective at all at spacing greater than half the effective depth of the specimen and that fracture of the strips was the dominant failure mechanism of CFRP. Further research is needed to confirm the conclusion derived from the experimental program. Keywords: FRP, prestressed concrete, shear, strengthening, rehabilitation. 1. Introduction Fiber-Reinforced Polymers (FRP) are composite systems of fibers embedded in a polymeric matrix. 1 The polymer used is usu- ally epoxy resin mixed with a hardener for workability. Rehabilita- tion of reinforced concrete (RC) members using FRP has been practiced by engineers for many years. 2 Carbon Fiber Reinforced Polymers (CFRP) are widely used in civil engineering applica- tions due to their high strength-to-weight ratio and rigidity. Various studies conducted by academic researchers have shown that the application of CFRP for retrofit or repair increases the overall shear or flexural capacity of deficient structural members. 3 How- ever to date, due to the complex nature of the interaction between CFRP and concrete members, no accurate and comprehensive models for the prediction of the shear strength contribution by CFRP are available. In this research, an experimental program is devised to investi- gate the shear resistance of CFRP externally bonded to prestressed concrete I-beams without transverse reinforcement. No experi- mental tests have been conducted on prestressed concrete beams shear-strengthened with CFRP but without internal steel trans- verse reinforcement. The absence of transverse reinforcement could help to exclude the effects of steel transverse reinforcement. Furthermore, to the writers’ knowledge, few I-shaped beams with CFRP shear reinforcement have been tested. The experimental program is also intended to observe the bond mechanism between the CFRP sheet and the concrete. All experi- mental beams are specially designed to fail in shear in order to bet- ter study the interaction between the concrete and the externally applied CFRP sheets. Results obtained from the experimental pro- gram do not only expand the relatively small database currently available on CFRP shear-strengthening, but also help improve existing analytical models by evaluating and identifying new key parameters. Understanding the interaction between CFRP and concrete helps improve existing analytical models and obtain a better estimation of the shear strength added by the CFRP. Consid- ering the current database of CFRP strengthened beams, more data derived from large-scale specimen testing are needed in order to account for the scale effect and provide a better prediction of the behavior of externally applied CFRP sheets. Specific experiments designed to capture bond and anchorage issues are also needed to better predict the added shear capacity of the CFRP. 2. Hypotheses and objectives The general goals of this research are: 1) to study the shear behavior of prestressed concrete I-beams strengthened with CFRP; 2) to quantify the added shear capacity of the CFRP; 3) to examine applicability of available analytical models to prestressed concrete I-beams; and 4) to define an optimal CFRP strengthening scheme for prestressed concrete I-beams. Aiming at these goals, three prestressed concrete I-beams were designed such that a shear failure was induced to the beams in a predetermined shear span, and the increase in shear capacity due to the application of CFRP was measured. The test specimens in this experimental study were strengthened with external strips of U-wrapped CFRP at different 1) KCI Member, Department of Architecture and Architectural Engineering, Seoul National University, Seoul 151-744, Korea. *Corresponding Author; E-mail: [email protected] 2) School of Civil Engineering and Environmental Science, Univer- sity of Oklahoma, Norman, OK 73019, USA. Copyright ⓒ 2012, Korea Concrete Institute. All rights reserved, including the making of copies without the writ- ten permission of the copyright proprietors.
Transcript of Vol.6, No.1, pp.49~57, March 2012 DOI 10.1007/s40069-012 ...

49
International Journal of Concrete Structures and Materials
Vol.6, No.1, pp.49~57, March 2012
DOI 10.1007/s40069-012-0005-0
ISSN 1976-0485 / eISSN 2234-1315
Shear-Strengthening of Reinforced & Prestressed Concrete Beams Using FRP: Part II – Experimental Investigation
Thomas H.-K. Kang1),* and Moustapha Ibrahim Ary
2)
Abstract: The main objectives of this research were to experimentally evaluate the impact of Carbon Fiber-Reinforced Polymers
(CFRP) amount and strip spacing on the shear behavior of prestressed concrete (PC) beams and to evaluate the applicability of
existing analytical models of Fiber-Reinforced Polymer (FRP) shear capacity to PC beams shear-strengthened with CFRP. The U-
shaped CFRP strips with different spacing were applied externally to the test specimens in order to observe the overall behavio r
of the prestressed concrete I-beams and the mode of failure of the applied CFRP strips. Results obtained from the experimental
program showed that the application of CFRP strips to prestressed concrete I-beams did in fact enhance the overall behavior of
the specimens. The strengthened specimens responded with an increase in ductility and in shear capacity. However, it should be
noted that the CFRP strips were not effective at all at spacing greater than half the effective depth of the specimen and that fracture
of the strips was the dominant failure mechanism of CFRP. Further research is needed to confirm the conclusion derived from the
experimental program.
Keywords: FRP, prestressed concrete, shear, strengthening, rehabilitation.
1. Introduction
Fiber-Reinforced Polymers (FRP) are composite systems of
fibers embedded in a polymeric matrix.1 The polymer used is usu-
ally epoxy resin mixed with a hardener for workability. Rehabilita-
tion of reinforced concrete (RC) members using FRP has been
practiced by engineers for many years.2 Carbon Fiber Reinforced
Polymers (CFRP) are widely used in civil engineering applica-
tions due to their high strength-to-weight ratio and rigidity. Various
studies conducted by academic researchers have shown that the
application of CFRP for retrofit or repair increases the overall
shear or flexural capacity of deficient structural members.3 How-
ever to date, due to the complex nature of the interaction between
CFRP and concrete members, no accurate and comprehensive
models for the prediction of the shear strength contribution by
CFRP are available.
In this research, an experimental program is devised to investi-
gate the shear resistance of CFRP externally bonded to prestressed
concrete I-beams without transverse reinforcement. No experi-
mental tests have been conducted on prestressed concrete beams
shear-strengthened with CFRP but without internal steel trans-
verse reinforcement. The absence of transverse reinforcement
could help to exclude the effects of steel transverse reinforcement.
Furthermore, to the writers’ knowledge, few I-shaped beams with
CFRP shear reinforcement have been tested.
The experimental program is also intended to observe the bond
mechanism between the CFRP sheet and the concrete. All experi-
mental beams are specially designed to fail in shear in order to bet-
ter study the interaction between the concrete and the externally
applied CFRP sheets. Results obtained from the experimental pro-
gram do not only expand the relatively small database currently
available on CFRP shear-strengthening, but also help improve
existing analytical models by evaluating and identifying new key
parameters. Understanding the interaction between CFRP and
concrete helps improve existing analytical models and obtain a
better estimation of the shear strength added by the CFRP. Consid-
ering the current database of CFRP strengthened beams, more
data derived from large-scale specimen testing are needed in order
to account for the scale effect and provide a better prediction of the
behavior of externally applied CFRP sheets. Specific experiments
designed to capture bond and anchorage issues are also needed to
better predict the added shear capacity of the CFRP.
2. Hypotheses and objectives
The general goals of this research are: 1) to study the shear
behavior of prestressed concrete I-beams strengthened with
CFRP; 2) to quantify the added shear capacity of the CFRP; 3) to
examine applicability of available analytical models to prestressed
concrete I-beams; and 4) to define an optimal CFRP strengthening
scheme for prestressed concrete I-beams. Aiming at these goals,
three prestressed concrete I-beams were designed such that a shear
failure was induced to the beams in a predetermined shear span,
and the increase in shear capacity due to the application of CFRP
was measured. The test specimens in this experimental study were
strengthened with external strips of U-wrapped CFRP at different
1)KCI Member, Department of Architecture and Architectural
Engineering, Seoul National University, Seoul 151-744, Korea.
*Corresponding Author; E-mail: [email protected])School of Civil Engineering and Environmental Science, Univer-
sity of Oklahoma, Norman, OK 73019, USA.
Copyright ⓒ 2012, Korea Concrete Institute. All rights
reserved, including the making of copies without the writ-
ten permission of the copyright proprietors.

50│International Journal of Concrete Structures and Materials (Vol.6 No.1, March 2012)
spacing. It is hypothesized that strengthening the prestressed con-
crete members with CFRP increases the overall shear capacity of
the members.
3. Experimental program
3.1 Specimen designIn order to see the effects of the added shear capacity of CFRP, a
total of three prestressed concrete I-beams were designed. All
beams were designed to fail in shear in a specific shear span area.
The guidelines in ACI 318-08,8 Building Code Requirements for
Structural Concrete, were used to ensure that the test specimens
reflect real-world prestressed concrete I-beams. As mentioned in
Section 18.7.2 of ACI 318-08,8 the alternative method to the more
accurate determination (based on the strain compatibility) of the
stress (fps) in prestressing steel at nominal flexural strength was
used. This alternative method determines an approximate value of
fps based on the assumption that the effective stress (fse) in pre-
stressing steel (after allowance for all prestress losses) shall not be
less than 0.5fpu (specified tensile strength of prestressing steel). For
members with bonded tendons, the stress in prestressing steel at
nominal flexural strength is defined as:
(1)
where ω is the tension reinforcement index, ω' is the compression
reinforcement index, d is the effective depth for nonprestressed
mild steel, dp is the distance from extreme compression fiber to
centroid of prestressing steel, fpu is the specified tensile strength of
prestressing steel, f 'c is the specified compressive strength of con-
crete, ρp is the ratio of prestressing tendons(=Aps/bdp), Aps is the
prestressing steel area, b is the width of compression face of the
member, fps is the stress in prestressing steel at nominal flexural
strength, β1 is the factor relating the depth of the equivalent rectan-
gular compressive stress block to the neutral axis depth, and γp is
the factor for type of prestressing steel.
The nominal moment capacity and the corresponding ultimate
load that the beam can carry were computed. All test specimens
had a shear span-to-depth ratio (a'/dp) of 2.5. The chosen shear
span-to-depth ratio of 2.5 ensures that a large shear-to-moment
ratio is applied and the beams are expected to fail in shear as
opposed to flexural failure. No stirrups were provided in the shear
span zone. The nominal moment capacity of the beam was com-
puted as follows:
(2)
(3)
where Mn is the nominal moment capacity, fps is the stress in pre-
stressing steel at nominal flexural strength, Aps is the area of pre-
stressing steel in the flexural tension zone, a is the depth of the
equivalent rectangular stress block, As is the area of nonprestressed
longitudinal tension reinforcement, fy is the specified yield strength
of reinforcement, bw is the web width, and hf is the flange thick-
ness.
The shear capacity of the beam was estimated in accordance
with Section 11.3.2 of ACI 318-08,8 which specifies the concrete
shear capacity (Vc). The nominal shear capacity of the beams is
defined as the sum of the shear contribution by the concrete and
the steel transverse reinforcement. However, since no transverse
reinforcement was provided in the shear span of interest (test
span), the shear capacity in that region was only from the shear
contribution of the concrete.
To ensure that the test specimens failed in shear before flexural
yielding, while also keeping the under-reinforced aspect of the
beam, reinforcing bars were used in the specimen design. Two #6
longitudinal reinforcing bars with a clear cover of 1.63 in. and two
#8 bars with a clear cover of 4in. were placed at the tension face of
the specimens, and the two prestressing strands were located at a
clear cover of 1.75 in. On the compression face of the specimen,
two #4 bars were placed at a clear cover of 1.5 in. to enhance the
overall ductility of the specimen. The #3 bars were used for the
stirrups only in the constant moment region (outside the shear
span). Note also that all three test specimens were identical (same
cross-section, reinforcement and dimensions), except for the FRP
strengthening details. Figure 1 shows a detailed cross-sectional
view of the specimens and Figure 2 shows an elevation and a top
view of the beams. All dimensions are in inches.
3.2 Test setup and specimen preparationAll specimens were manufactured at Coreslab Structures Inc. in
Oklahoma City, Oklahoma, and tested in the Donald G. Fears
Structural Engineering Laboratory at the University of Oklahoma.
An automated hydraulic actuator having a load capacity of 500
fps fpu 1γp
β1
----- ρp
fpu
f ′c------
d
dp
----- ω ω ′–( )+–⎩ ⎭⎨ ⎬⎧ ⎫
=
Mn Apwfps dp
a
2---–⎝ ⎠
⎛ ⎞ Asfy d dp–( ) 0.85f ′c b bw–( )hf dp
hf
2----–⎝ ⎠
⎛ ⎞+ +=
Apwfps Apsfps Asfy 0.85f ′c b bw–( )hf–+=
Fig. 1 Cross-sectional view of test specimen (Unit: in.).
International Journal of Concrete Structures and Materials (Vol.6 No.1, March 2012)│51
kips was used to test all three specimens. The specimens were
simply supported and were tested under a four-point loading sys-
tem via a spreader beam. Two small rollers, located at 45 in. from
the supports, were placed at the contact point between the spreader
beam and the test specimens. The rollers were placed on top of the
specimens in order to induce the two point loads. The hydrostone
was used between the test specimens and the steel bearing plate of
the rollers to evenly distribute the load. The supports of the speci-
mens were located at a distance of 90 in. from the mid-span and at
12 in. from the end of the test beam. One end of the beam was
placed on a roller support to allow beam expansion under loading
while the other end was placed on a fixed support. One 100 kip
and one 500 kip load cell transducer were used in order to accu-
rately measure the load induced by the hydraulic actuator. The
load cell was put on a swivel to reduce the risk of eccentrically
loading the spreader beam which transfers the load to the test
specimens. A monotonic quasi-static loading was applied for all
specimens.
Six wire potentiometers (WPs) were used to measure the linear
vertical displacement of the specimens. The WPs, placed at both
faces of the specimens, were located at each of the application
points of the two-point loads and also at the mid-section of the
specimen. The WP data were used to generate a load versus
deflection curve, which was later used to investigate the shear
behavior of the specimens.
In order to make the CFRP placement easier, the test beams
were flipped upside down and pre-fit markings were drawn on the
beam to make sure that the carbon fabric was being placed at the
specified locations. A 360 in. by 42 in. roll of carbon fabric
shipped from Fabric Development Inc. was used to strengthen the
specimens. It is a multidirectional carbon fabric with a 24 × 23
fiber count per inch squared. The roll of carbon fabric was cut into
strips 53 in. long and 3 in. wide that would be placed on the test
specimens. The wet method was used to apply the carbon fabric to
the test beams. In this method, the surface of the beams was
checked for any irregularities that might alter the adhesion of the
epoxy mix and then a first heavy coat of epoxy and hardener mix
was rolled on the surface of the beams. The carbon fabric was then
positioned in the pre-fit markings on the beam and unrolled onto
the surface of the beams. A second coat of epoxy mix was then
applied with a foam roller on top of the fabric and any excess
epoxy was trimmed off with a plastic spreader. The epoxy and
hardener used were obtained from West System, a major supplier
of epoxy resin and hardeners in Oklahoma. The West System 105
epoxy resin and West System 205 hardener were used throughout
the experimental program. The 205 hardener had a pot life of 9 to
12 minutes, a working time of 60 to 70 minutes and a cure time of
6 to 8 hours. All test specimens had cured at least 48 hours before
being placed on the reaction frame for shear testing.
One beam, labeled as the control beam, was tested in shear in
the loading frame. The control beam was painted in white and a 5
in. by 5 in. grid was drawn to locate the shear cracks at failure. No
CFRP was applied to the control beam. The second beam, labeled
as IB-10, was strengthened with U-wrapped CFRP strips spaced
at 10 in. across the shear zone. The final beam, labeled IB-05, was
also strengthened with CFRP strips but with strip spacing of 5 in.
Figure 2 shows the test setup of the beam.
3.3 Material testingMaterial properties were obtained using the corresponding
American Standards for Testing Materials (ASTM). The tensile
yield strength of reinforcement bars was obtained using guidelines
in ASTM E8/E8M-09,9 Standard Test Methods for Tension Test-
ing of Metallic Materials. Reinforcing bar samples of 4 ft in length
were used to determine the yield strength of the steel used in the
test beams. All reinforcing bar samples were machined (ground
down) at the midsection to allow for a localized failure or necking
in a specified gauge length of 4 in. The specimens were ground to
not less than 90% of their original cross sectional area as man-
dated by the ASTM. An extensometer was used to measure the
Fig. 2 Elevation view and applied CFRP configurations for test specimens (Unit: in.; left pin end: south end; right roller end; north
end).

52│International Journal of Concrete Structures and Materials (Vol.6 No.1, March 2012)
strain of the bar samples under tensile loading. Wedge grips were
used along with the Baldwin machine to apply the uniaxial load.
The extensometer was removed when the test specimen reached
yielding. The ultimate strength of the rebar was later calculated
from the load on the Baldwin machine.The yield strength of the
steel reinforcing bar was found from the stress-strain relationship
where the stress remained constant after a given strain. The ulti-
mate strength of the specimen was determined by dividing the
failure load by the machined area of the sample.
The same ASTM E8/E8M-099 specifications were used to
determine the yield strength and ultimate strength of the 0.5 in.
special seven-wire strand used to prestress the beams. Note that
this special strand has a cross-sectional area different from that of
typical 0.5 in. diameter seven-wire strand. Figure 3 shows the rep-
resentative stress-strain curve for the strand.
The compressive strength of concrete was determined using
ASTM C39/C39M-10, StandardTest Method forCompressive
Strength of Cylindrical Concrete Specimens. A 6 in. diameter con-
crete cylinder was put between two bearing plates with bonded
pads and placed on the Forney machine. The axial load from the
Forney machine was applied at an acceptable rate until failure.
The failure load was then divided by the measured cross sectional
area of the cylinder to determine the compressive strength of the
concrete. A strain gauge was used to measure the strain in the con-
crete cylinder. Figure 4 shows the stress-strain curve for one of the
test cylinders.
The flexural strength of concrete was determined using ASTM
C78/C78M-10, Standard Test Method for Flexural Strength of
Concrete (Using Simple Beam withThird-Point Loading). A 6 in.
deep, 6 in. wide and 18 in. long prism was cast to measure the
Modulus of Rupture (MOR) of the concrete. TwoLinear Variable
Differential Transformers (LVDTs) were used to measure the lin-
ear displacement of the prism. The prism was put on the Forney
machine with a third point bending setup.
ASTM D3039/D3039M, Standard Test Method for Tensile
Properties of Polymer Matrix Composite Material, was used to
determine the actual strength of FRP used in the experimental pro-
gram. The CFRP strips 2 in. wide and 16 in. long (including 3 in.
grips on each end) were fabricated using the same epoxy and
hardener used for the test beams. A total of 5 CFRP strips were
tested in order to get an average tensile strength of the CFRP. The
strips were placed on the Baldwin machine and wedges with flat
grips were used to apply the uniaxial tensile load (Figure 5). The
test CFRP strips used had an average thickness between 0.04 in.
and 0.055 in. A strain gauge was placed at the mid-section of the
strip sample to record the strain induced to the strip during tensile
loading. Table 1 summarizes the material test results. All the data
for the materials are available elsewhere.4
4. Test results and discussion
4.1 ResultsAll three prestressed test specimens were subjected to a four-
point loading system and failed as expected in a shear failure. The
specimens showed diagonal shear cracks that initiated from the
Fig. 3 Stress-strain curve for representative seven-wire strand.
Fig. 4 Stress-strain curve for representative concrete cylinder.
Fig. 5 CFRP tensile test setup.
Table 1 Average material property data.
Material tf (in.) f'c (psi)Ef (ksi) fr (psi) ε fu fu (ksi) E (ksi) fy (ksi)
CFRP 0.049 - 955 - 0.015 14.32 - -
Concrete - 8846 - 711 - - 5702
#3 rebar - - - - - 101.4 28852 63.7
#4 rebar - - - - - 103.2 27071 60.1
#6 rebar - - - - - 111.1 29667 69.1
#8 rebar - - - - - 109.1 27981 62.8
Strand - - - - - 264 29087 241
tf=FRP thickness; f 'c=concrete compressive strength; Ef=modulus
of elasticity of FRP; fr=modulus of rupture of concrete; fu=ultimate
strength; E=modulus of elasticity; fy=yield strength of steel

International Journal of Concrete Structures and Materials (Vol.6 No.1, March 2012)│53
supports up to the loading points. Shear cracks were marked as
they appeared on the specimen along with the corresponding load
during the test. The 100 kip load cell transducer was used during
the control beam test and was later switched for the 400 kip load
cell for the strengthened specimens test. The 400 kip load cell was
used in order to protect the 100 kip cell, and because preliminary
calculations had predicted that the strengthened specimens would
fail at loads close to 100 kips. The wire potentiometers (WP)
placed at midsection and at loading points of the beam measured
the vertical displacement at both east and west faces of the beam
(i.e., front and back faces of the beam).Data from WP1 East in IB-
10 were compromised during testing, and as a consequence and
for comparison reasons, no data from WP1 East located at the east
face of the midsection on IB-10 were used in this project. Table 2
represents a summary of the results obtained during the experi-
mental program.
Figure 6 shows the load versus mid-span deflection relations of
the beams. Figure 7 shows the vertical displacement profile of the
control beam, where the data from two LVDTs on both sides of
the beam are shown to be similar, and hence more reliable. Figure
8 shows the failure pattern for the control beam and the location of
the shear cracks. The largest shear cracks were noticed at the south
end of all tested specimens (refer to Figures 1, 7 and 8 for beam
orientation). The control beam failed in shear with shear cracks
propagating from the support to the loading point at an approxi-
mately 45° angle. One large shear crack was developed at failure
and smaller cracks started to show up at approximately 40 kips
during the loading process. The ultimate load that the hydraulic
actuator induced to the control beam was 52.8 kips which yielded
a nominal shear capacity of 26.4 kips. Preliminary calculations
had predicted a nominal shear capacity of 23 kips. As expected,
the control beam failed in a brittle manner with the beam almost
being split in half in the shear span. The largest vertical deflection
was 0.5 in. and was recorded by WP1 West located at the west
face of the midsection of the beam.
Specimen IB-10 strengthened by external CFRP strips at a
spacing of 10 in. also failed as expected in shear with shear cracks
propagating diagonally in the shear span area and through the
CFRP strips (Figure 9). Concrete cracking occurred at around 40
kips as in the control beam (Figure 6). The beam was loaded in 5
kip increments until the first concrete cracking and then at 10 kip
increments until the ultimate failure. The largest shear crack was
located at the south end of the beam in the shear span area. The
ultimate load carried by the beam was 53.6 kips (26.8 kips shear
capacity). Upon failure, the CFRP strips were fractured along the
same plane as the shear cracking. Only fracture and not debonding
of the CFRP strips was observed. Concrete splitting in the shear
span was also observed (Figure 9). Note that the CFRP strips
failed in a brittle manner just like the beam itself. The maximum
midsection deflection of the beam was 0.5 in. (recorded by WP1
West) and the maximum vertical deflection of 0.5 in. was also
Table 2 Summary of experimental results.
Specimen Failure load (kip) Shear load (kip)CFRP shear contri-
bution (kip)Cracking load (kip)
WP1 west deflec-
tion (in.)CFRP failure type
Control beam 52.8 26.4 - 39.64 0.496 -
IB-10 53.6 26.8 0.4 40.02 0.486 Fracture
IB-05 72.8 36.4 10 39.9 0.635 Fracture
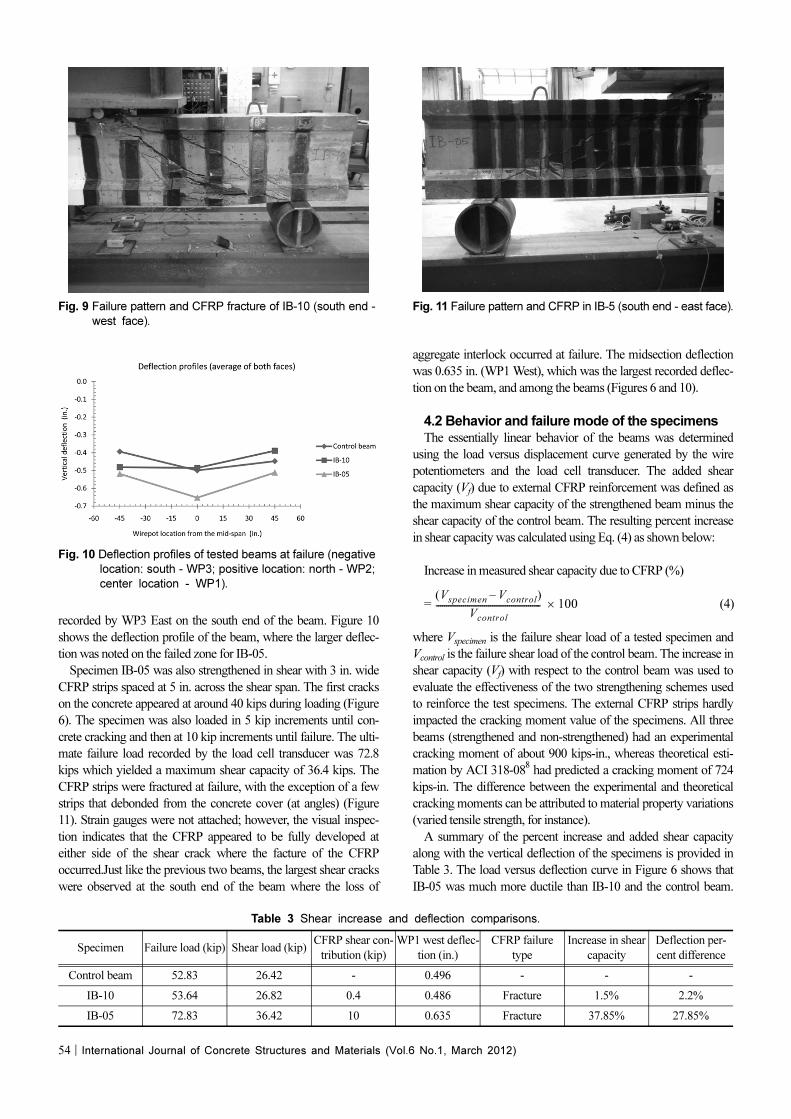
Fig. 6 Load versus mid-span deflection curves of tested beams.
Fig. 7 Deflection profile of control beam at failure (negative
location: south - WP3; positive location: north - WP2;
center location - WP1).
Fig. 8 Control beam shear cracks on the south end - east face.
54│International Journal of Concrete Structures and Materials (Vol.6 No.1, March 2012)
recorded by WP3 East on the south end of the beam. Figure 10
shows the deflection profile of the beam, where the larger deflec-
tion was noted on the failed zone for IB-05.
Specimen IB-05 was also strengthened in shear with 3 in. wide
CFRP strips spaced at 5 in. across the shear span. The first cracks
on the concrete appeared at around 40 kips during loading (Figure
6). The specimen was also loaded in 5 kip increments until con-
crete cracking and then at 10 kip increments until failure. The ulti-
mate failure load recorded by the load cell transducer was 72.8
kips which yielded a maximum shear capacity of 36.4 kips. The
CFRP strips were fractured at failure, with the exception of a few
strips that debonded from the concrete cover (at angles) (Figure
11). Strain gauges were not attached; however, the visual inspec-
tion indicates that the CFRP appeared to be fully developed at
either side of the shear crack where the facture of the CFRP
occurred.Just like the previous two beams, the largest shear cracks
were observed at the south end of the beam where the loss of
aggregate interlock occurred at failure. The midsection deflection
was 0.635 in. (WP1 West), which was the largest recorded deflec-
tion on the beam, and among the beams (Figures 6 and 10).
4.2 Behavior and failure mode of the specimensThe essentially linear behavior of the beams was determined
using the load versus displacement curve generated by the wire
potentiometers and the load cell transducer. The added shear
capacity (Vf) due to external CFRP reinforcement was defined as
the maximum shear capacity of the strengthened beam minus the
shear capacity of the control beam. The resulting percent increase
in shear capacity was calculated using Eq. (4) as shown below:
Increase in measured shear capacity due to CFRP (%)
= × 100 (4)
where Vspecimen is the failure shear load of a tested specimen and
Vcontrol is the failure shear load of the control beam. The increase in
shear capacity (Vf) with respect to the control beam was used to
evaluate the effectiveness of the two strengthening schemes used
to reinforce the test specimens. The external CFRP strips hardly
impacted the cracking moment value of the specimens. All three
beams (strengthened and non-strengthened) had an experimental
cracking moment of about 900 kips-in., whereas theoretical esti-
mation by ACI 318-088 had predicted a cracking moment of 724
kips-in. The difference between the experimental and theoretical
cracking moments can be attributed to material property variations
(varied tensile strength, for instance).
A summary of the percent increase and added shear capacity
along with the vertical deflection of the specimens is provided in
Table 3. The load versus deflection curve in Figure 6 shows that
IB-05 was much more ductile than IB-10 and the control beam.
Vspecimen Vcontrol–( )
Vcontrol
--------------------------------------------------
Fig. 9 Failure pattern and CFRP fracture of IB-10 (south end -
west face).
Fig. 10 Deflection profiles of tested beams at failure (negative
location: south - WP3; positive location: north - WP2;
center location - WP1).
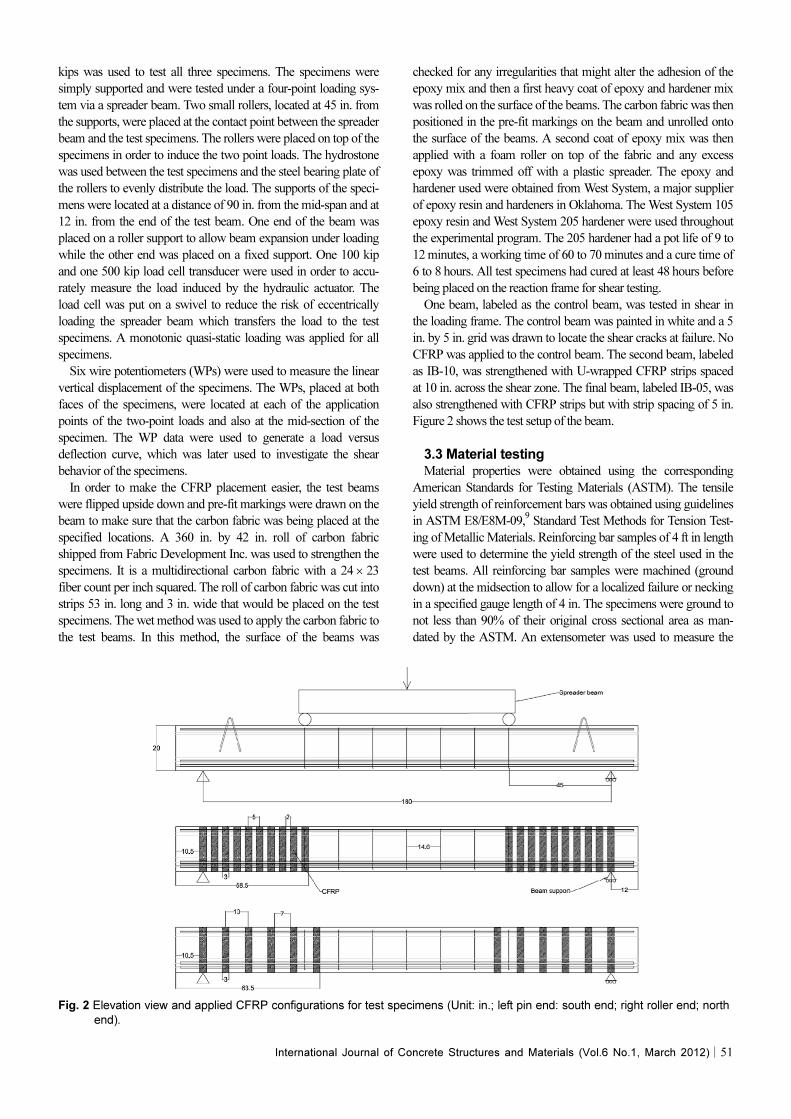
Fig. 11 Failure pattern and CFRP in IB-5 (south end - east face).
Table 3 Shear increase and deflection comparisons.
Specimen Failure load (kip) Shear load (kip)CFRP shear con-
tribution (kip)
WP1 west deflec-
tion (in.)
CFRP failure
type
Increase in shear
capacity
Deflection per-
cent difference
Control beam 52.83 26.42 - 0.496 - - -
IB-10 53.64 26.82 0.4 0.486 Fracture 1.5% 2.2%
IB-05 72.83 36.42 10 0.635 Fracture 37.85% 27.85%

International Journal of Concrete Structures and Materials (Vol.6 No.1, March 2012)│55
Specimen IB-10 and the control beam had almost the same mid-
section vertical deflection up to failure. The external CFRP rein-
forcement applied to IB-10 did not help increase the vertical
deflection of the beam. In contrast to the strengthening effect of
IB-10, the CFRP strips in IB-05 increased the overall deflection of
the beam. In fact, IB-05 had a deflection value almost 28% higher
than the control beam whereas IB-10 had an average deflection
2% less than that of the control beam. The experimental results
obtained showed that the spacing of CFRP strips played a role in
increasing the ductility of IB-05. Since spacing of the CFRP strips
was the only different variable in the strengthened beams, it can be
concluded that the spacing (10 in.) of the strips in IB-10 was not
effective at all and that CFRP reinforcementwith relatively large
strip spacing had negligible influence on the overall ductility of
IB-10. Figure 10 shows the deflection profile for all three beams
and shows the difference in ductility between IB-05 and the
remaining two other specimens.According to the experimental
results, the external CFRP strips applied to IB-10 did not generate
any noticeable increase in either the shear capacity or the ductility
of the specimen. The 3 in. wide CFRP strips applied externally to
IB-10 and spaced at 10 in. center-to-center had a shear contribu-
tion of only 0.4 kips relative to the overall shear capacity of the
beam. The beam had very similarly linear behavior with the con-
trol beam. This general behavior of IB-10 can be linked to the
large spacing of the external CFRP strips. It appearsthatthe CFRP
strips did not act as atensiontie due to the strip spacing which was
greater than half the effective depth of the concrete beam. Note
that the strips applied to IB-10 were spaced at 10 in. intervals cen-
ter-to-center while half the effective depth of the specimen was 8.4
in. On the other hand, specimen IB-05 showed a much more posi-
tive response in terms of the CFRP shear-strengthening; the exper-
imental shear contribution due to CFRP strengthening was 10
kips. This is approximately a 38% increase in overall shear capac-
ity compared to the control beam. The CFRP strips were only
spaced at 5 in. center-to-center, which represents half of the strip
spacing in IB-10.
The failure mode of CFRP in both IB-10 and IB-05 was mainly
dominated by fracture of the strips at ultimate loads. Some CFRP
strips in IB-05 debonded from the concrete at failure, but in gen-
eral, fracture of the CFRP was the primary failure mode. The U-
shaped CFRP reinforcement tends to have better anchorage to the
concrete when it has an effective depth that extends all the way to
the top compression fiber of a specimen, allowing for longer effec-
tive length for bonding compared with cases where the strip termi-
nates below the flange. The effective depth of both prestressed
specimens was the same as the effective depth of the external
CFRP used.
Also, it should be noted that themeasured tensile strength of the
carbon fiber sheet was quite a bit lower than expected, and conse-
quently the amount of each CFRP strip turned out to be very
small. This could be one more reason why most of the strips frac-
tured at failure. The relatively small amount of the CFRP applied
to the beam probably contributed to the full use of the tensile
capacity of CFRP during shear loading.
The debonding of the strips at some locations was likely due to
poor anchorage to the concrete cover which wascausedby the
angle in the I-beams. Figures 11 and 12 show a detailed view of
the debonding of CFRP at failure for IB-05. Note that debonding
of the strips occurred at inside angles of the I-beam where proper
anchorage is critical to avoid debonding.
4.3 Analytical model prediction in relation to
CFRP-strengthened prestressed concrete I-beamsThe analytical models assessed in the companion Part I paper
3
were evaluated in this study for the prestressed concrete test speci-
mens. The accuracy of the model was measured in comparison to
the previous experimental results obtained during testing.4-7
It
should be pointed out that even though the carbon fiber used was
multidirectional, only the principal fiber orientation with respect to
the longitudinal beam axis was used for theoretical CFRP shear
estimation. The principal fiber direction extended to a length of
roughly 53 in. and was oriented 90° from the longitudinal beam
axis while the minor fiber direction was only 3 in. and at 0° rela-
tive to the beam axis. It was assumed that the minor fiber direction
was negligible and did not contribute to any of the tensile strength
of the strips and therefore did not contribute in the shear-strength-
ening of the specimens. Table 4 indicates the theoretical values
derived from the analytical models along with the experimental
values. Figure 13 shows a comparison between experimental
Fig. 12 Debonding at angle of IB-05.
Table 4 Experimental and theoretical values of CFRP shear contribution.
Specimen bw (in.) d (in.) CFRP Config. wf (in.) sf (in.) α (deg) Vf (Exp.) (kip) Vf (ACI) (kip)Vf (T&A2000)
(kip)
Control beam 4 16.75 - - - - - - -
IB-10 4 16.75 U-strips 3 10 90 0.40 1.87 2.21
IB-05 4 16.75 U-strips 3 5 90 10.00 3.76 4.41
bw=beam web width; d=effective depth; wf=width of CFRP strip; sf=spacing between CFRP strips; α=angle of CFRP strip with respect to
beam axis; Vf=shear capacity of FRP.

56│International Journal of Concrete Structures and Materials (Vol.6 No.1, March 2012)
results obtained for FRP shear contribution and analytical model
predictions by ACI 440.2R-08, and Figure 14 shows a similar
comparison between the experimental data and the model devel-
oped by Triantafillou and Antonopoulos.5 The test specimen data
are plotted along with previous data obtained from 157 concrete
beams shear-strengthened with various FRP types.3
The added shear capacity of CFRP predicted by ACI 440.2R-
0810
was 1.9 kips for IB-10 and 3.8 kips for IB-05. The ACI esti-
mations, compared to the experimental results, underestimate the
added shear capacity of CFRP by 62% for IB-05. It can be safe to
assume that the ACI model prediction may not yield satisfactory
results in the prediction of added shear capacity by CFRP applied
externally to prestressed concrete I-beams, though the ACI 44010
model prediction is conservative in predicting the added shear
capacity of CFRP in IB-05. The underestimation for the test
results herein was attributed to the efficient use of CFRP until its
fracture. This might have been possible because a relatively small
amount of the CFRP was used to strengthen the shear capacity of
the PC beam. The analytical model developed by Triantafillou and
Antonopoulos5 gives similar results. The estimations were 2.2
kips for IB-10 and 4.41 kips for IB-05. This analytical model also
underestimates the experimentally measured shear capacity of the
CFRP in IB-05 by 56%. It is noted that both models adopt the
effective FRP strain concept. The effective FRP strains used in the
models were significantly smaller than the measured ultimate
strain (average=0.01532) of the CFRP in IB-05, which was the
primary reason for the under-prediction of the measured CFRP
shear capacity. Given the very small number of data available for
PC (I-shaped) beams shear-strengthened with CFRP, more experi-
mental tests would be necessary to confirm the effectiveness of
CFRP in shear-strengthening prestressed concrete beams.
5. Conclusions
The experimental program conducted in the Donald G. Fears
laboratory at the University of Oklahoma consisted of four-point
load tests of two prestressed concrete I-beams with U-shaped
CFRP strips and a companion prestressed concrete I-beam with-
out CFRP shear reinforcement. The results have shown that the
externally applied CFRP strips in prestressed concrete I-beams for
shear-strengthening improved the overall shear capacity of the
specimens, when the spacing was less than half the effective depth
of the prestressed concrete beams. As such, the spacing of the
strips used to reinforce the test specimen should be carefully
planned, because spacing larger than half the effective depth
hardly improved the shear behavior of the strengthened beam. On
the other hand, spacing of CFRP strips less than half the effective
depth has shown promising results. Also, such spacing has not
only increased the ductility of the beam (IB-05) by 28% but has
also increased its shear capacity by 38% compared to the shear
capacity of the control beam. Additionally, special attention should
be paid to properly bond the CFRP and concrete at irregularly
shaped locations such as the inside angle of an I-beam.
Both the ACI 440 prediction and the analytical model predic-
tion by Triantafillou and Antonopoulos5 failed to provide a satis-
factory estimation of the added shear contribution of CFRP
applied to the tested prestressed concrete I-beams. This was
because the predictions do not assume fracture of FRP strips,
which however occurred in the current test program. Although the
current test program provided very good information on the shear
behavior of PC I-beams strengthened by externally bonded CFRP
strips, for a better conclusion, more shear tests of PC beams
strengthened by CFRP (by varied amounts) would be necessary.
Acknowledgements
The work presented in this paper was supported by U.S. DOT-
RITA grant under No. DTRT06-G-0016/OTCREOS10.1-21.The
authors would like to thank the first author’s undergraduate and
graduate students, Deanna Quickle, Caroline Weston, Amy
Hufnagel, Woosuk Kim, Colin Osborne and Chris Hill, for their
assistance in the Donald G. Fears Structural Engineering Labora-
tory at the University of Oklahoma. The authors also acknowledge
the active participation of Michael F. Daly, P.E. from Coreslab
Structures, Inc. (OKLA), which provided all the prestressed con-
crete beams used in this study. The views expressed are those of
the authors, and do not necessarily represent those of the sponsor.
References
1. Khalifa, A. and Nanni, A., “Rehabilitation of Rectangular
Simply Supported RC Beams with Shear Deficiencies Using
CFRP Composites,” Construction and Building Materials, Vol.
16, No. 3, 2002, pp. 135-146.
Fig. 13 ACI 440 model prediction for beams tested in this
study (red circular dots) and in previous studies.
Fig. 14 Triantafillou and Antonopoulos model prediction for
beams tested in this study (red circular dots) and in
previous studies.

International Journal of Concrete Structures and Materials (Vol.6 No.1, March 2012)│57
2. Kansara, K. D., Ibell, T. J., Darby, A. P., and Everden, M.,
“Interpreting Conservativeness in Design Criteria for Flexural
Strengthening of RC Structures Using Externally Bonded FRP,”
International Journal of Concrete Structures and Materials, Vol.
4, No. 1, 2010, pp. 25-36.
3. Ibrahim Ary, M. and Kang, T. H.-K., “Shear-Strengthening
of Reinforced & Prestressed Concrete Beams Using FRP: Part I
– Review of Previous Research,” International Journal of Con-
crete Structures and Materials, Vol. 6, No. 1, 2012.
4. Ibrahim Ary, M.,“Shear Strengthening of Prestressed Con-
crete I-Beams Using Carbon Fiber-Reinforced Polymers,” Mas-
ter’s thesis, School of Civil Engineering and Environmental
Science, The University of Oklahoma, Norman, 2011, 96 pp.
5. Triantafillou, T. C. and Antonopoulos, C. P., “Design of
Concrete Flexural Members Strengthened in Shear with FRP,”
ASCE Journal of Composites for Construction, Vol. 4, No. 4,
2000, pp. 198-205.
6. Bousselham, A. and Chaallal, O., “Shear Strengthening of
Reinforced Concrete Beams with Fiber-Reinforced Polymer:
Assessment of Influencing Parameters and Required Research,”
ACI Structural Journal, Vol. 101, No. 2, 2004, pp. 219-227.
7. Sas, G., Täljsten, B., Barros, J., Lima, J., and Carolin, A.,
“Are Available Models Reliable for Predicting the FRP Con-
tribution to the Shear Resistance of RC Beams?,” ASCE Journal
of Composites for Construction, Vol. 13, No. 6, 2009, pp. 514-
534.
8. ACI Committee 318, “Building Code Requirements for Struc-
tural Concrete (ACI 318-08) and Commentary,” American Concrete
Institute, Farmington Hills, MI, 2008, 473 pp.
9. ASTM, “American Society for Testing and Materials
Annual Book of ASTM Standards,” Vol. 04.09, West Con-
shohocken, PA, 2008.
10. ACI Committee 440, “Guide for the Design and Con-
struction of Externally Bonded FRP Systems for Strengthening
Concrete Structures (ACI 440.2R-08),” American Concrete
Institute, Farmington Hills, MI, 2008, 76 pp.


![Calculus of Variations - Department of Mathematics | Penn …dmaxim/infinityabp.pdf · · 2012-11-09DOI 10.1007/s00526-012-0567-3 Calculus of Variations ... 21,23]. Moreover, solutions](https://static.fdocuments.in/doc/165x107/5aecc6267f8b9ad73f9020e3/calculus-of-variations-department-of-mathematics-penn-dmaxim-101007s00526-012-0567-3.jpg)