Vol.4 - 2014 - THK
33
INVESTOR INFORMATION THK CO., LTD. Copyright THK CO., LTD. 2014. All rights reserved. November 7, 2014 Vol.4 - 2014
Transcript of Vol.4 - 2014 - THK

INVESTOR INFORMATIONTHK CO., LTD.
Copyright THK CO., LTD. 2014. All rights reserved.
November 7, 2014
Vol.4 - 2014

1
Contents 目次
主要財務指標
Major Financial Data
経営目標
Management Target
数値目標
Numerical Targets
足元の状況
Current Business Situation
財務諸表
Financial Statements
会社概要
Company Profile
2-3
4
5
6
7
8
9
10
11
12
13
14-15
16
17
18
19
19
20-21
22-23
24
25
26
27
28
29-30
31
Major Financial Data 主要財務指標
System of Management Strategy
経営戦略の体系
Long-Term Management Target
長期経営目標
Full-Scale Globalization
グローバル展開
Development of New Businesses
新規分野への展開
Numerical Targets
数値目標
Capital Expenditure and Number of Employees
設備投資額と従業員数
Orders Received by Region
地域別受注状況
User Sales Breakdown by Industry
業種別売上高構成比
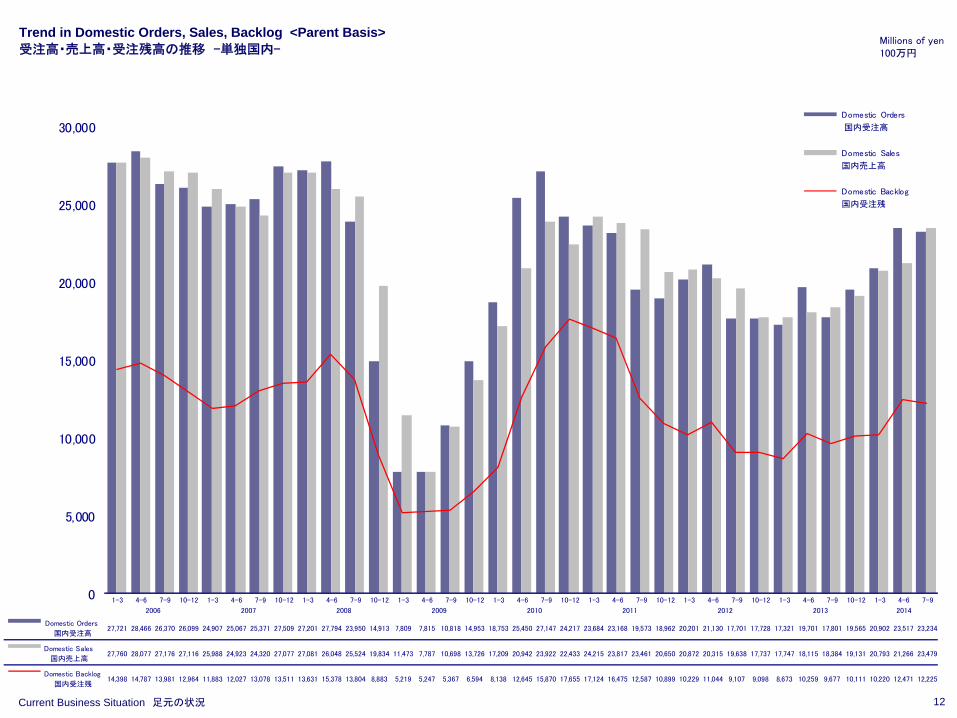
Trend in Domestic Orders, Sales, Backlog<Parent Basis>
受注高・売上高・受注残高の推移-単独国内-
Trend in Orders Classified by Industry <Parent Basis>
業種別受注高の推移-単独-
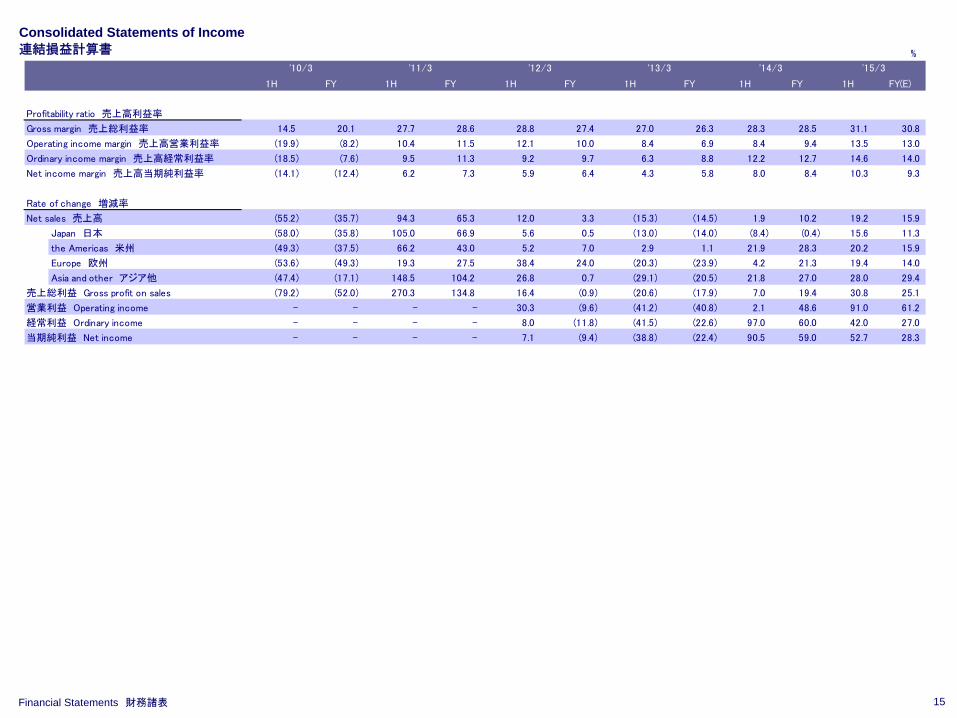
Consolidated Statements of Income
連結損益計算書
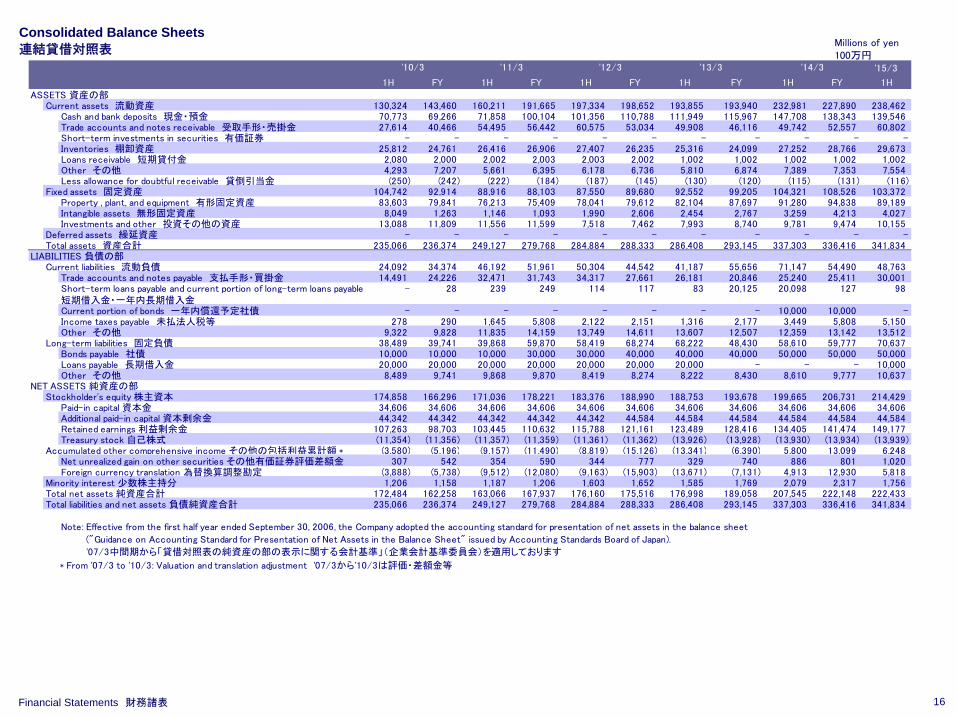
Consolidated Balance Sheets
連結貸借対照表
Segment Information
セグメント情報
Overviews of Major Subsidiaries
主要子会社
Capital Expenditure, Depreciation
設備投資額、減価償却費
R&D Expenses, Number of Employees
研究開発費、従業員数
Non-Consolidated Statement of Income
単独損益計算書
Subsidiaries
and Affiliate
連結子会社および持分法適用関連会社
Main Products
主要製品
History
沿革
Plants in Japan
日本の生産拠点
Plants in Asia
アジアの生産拠点
Plants in the Americas and Europe
欧米の生産拠点
Common Stock Information
株式情報
Corporate Data 会社データ
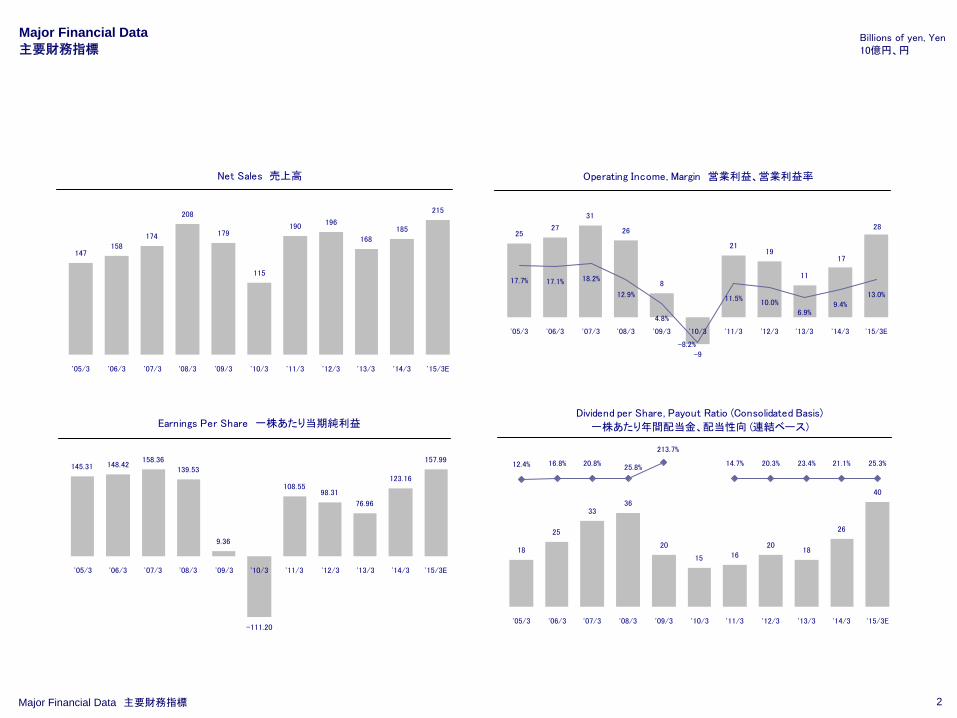
Dividend per Share, Payout Ratio (Consolidated Basis)
一株あたり年間配当金、配当性向 (連結ベース)
18
25
3336
20
15 16
40
26
1820
12.4% 16.8% 20.8% 14.7% 20.3% 23.4% 21.1% 25.3%
213.7%
25.8%
'05/3 '06/3 '07/3 '08/3 '09/3 '10/3 '11/3 '12/3 '13/3 '14/3 '15/3E
2
Major Financial Data 主要財務指標
Net Sales 売上高
147158
174
208
179
115
190196
168
185
215
'05/3 '06/3 '07/3 '08/3 '09/3 '10/3 '11/3 '12/3 '13/3 '14/3 '15/3E
Operating Income, Margin 営業利益、営業利益率
2527
31
26
8
-9
2119
11
17
28
4.8%
11.5%
-8.2%
13.0%9.4%
6.9%
12.9%10.0%
17.7% 18.2%17.1%
'05/3 '06/3 '07/3 '08/3 '09/3 '10/3 '11/3 '12/3 '13/3 '14/3 '15/3E
Billions of yen, Yen10億円、円
Major Financial Data 主要財務指標
Earnings Per Share 一株あたり当期純利益
145.31 148.42158.36
139.53
9.36
-111.20
108.5598.31
76.96
123.16
157.99
'05/3 '06/3 '07/3 '08/3 '09/3 '10/3 '11/3 '12/3 '13/3 '14/3 '15/3E

3
Major Financial Data 主要財務指標
Rate of Return on Equity 株主資本当期利益率
7.4%
11.8%
9.7%
0.7%
8.5%7.7%
-8.5%
12.6%
5.4%
14.7%
'05/3 '06/3 '07/3 '08/3 '09/3 '10/3 '11/3 '12/3 '13/3 '14/3
Inventory, Inventory Turnover Period (Months) 棚卸資産、回転月数
24 2425
2927
2426 26
24
28
2.0 1.9 1.8 1.7 1.8 1.61.7 1.7 1.9
2.6
'05/3 '06/3 '07/3 '08/3 '09/3 '10/3 '11/3 '12/3 '13/3 '14/3
Total Assets, Turnover Ratio 総資産、総資産回転率
220
244263 264
240 236
279 288 293
336
0.68 0.69
0.79 0.740.720.690.71
0.58 0.59
0.48
'05/3 '06/3 '07/3 '08/3 '09/3 '10/3 '11/3 '12/3 '13/3 '14/3
Billions of yen, Times, Month10億円、回、月
Major Financial Data 主要財務指標
Rate of Return on Assets 総資産事業利益率
12.8%11.8%
4.2%
-3.9%
5.7%
8.6%
3.6%
10.5%
12.8%
7.1%
'05/3 '06/3 '07/3 '08/3 '09/3 '10/3 '11/3 '12/3 '13/3 '14/3
4
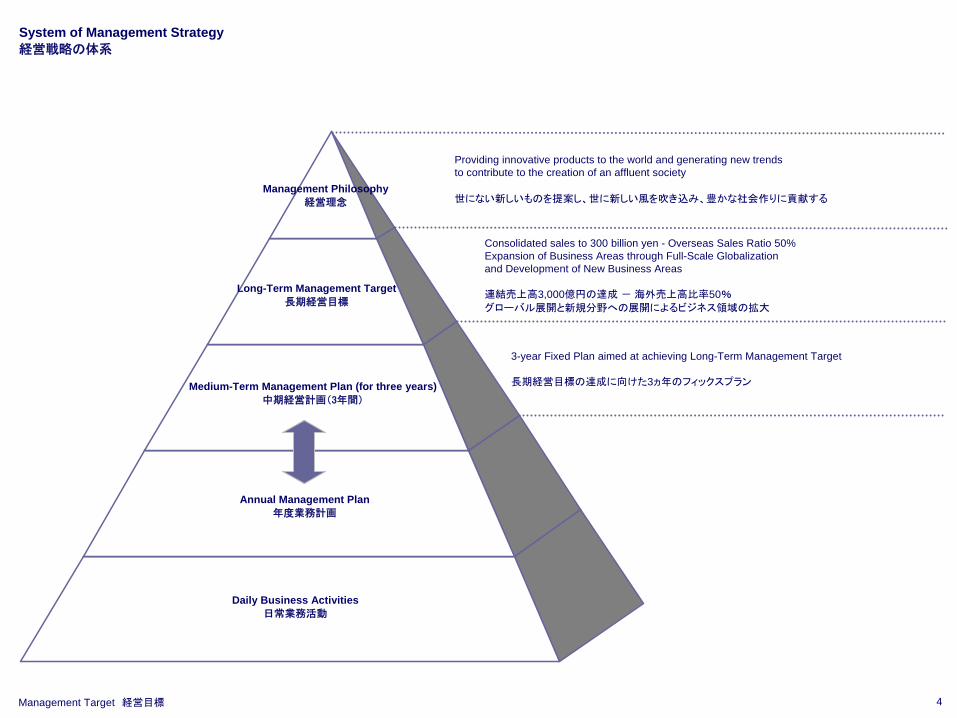
Management Philosophy経営理念
Long-Term Management Target長期経営目標
Medium-Term Management Plan (for three years)中期経営計画(3年間)
Annual Management Plan年度業務計画
Daily Business Activities日常業務活動
System of Management Strategy 経営戦略の体系
Management Target 経営目標
Providing innovative products to the world and generating new trends to contribute to the creation of an affluent society
世にない新しいものを提案し、世に新しい風を吹き込み、豊かな社会作りに貢献する
Consolidated sales to 300 billion yen - Overseas Sales Ratio 50%Expansion of Business Areas through Full-Scale Globalizationand Development of New Business Areas
連結売上高3,000億円の達成 - 海外売上高比率50%
グローバル展開と新規分野への展開によるビジネス領域の拡大
3-year Fixed Plan aimed at achieving Long-Term Management Target
長期経営目標の達成に向けた3ヵ年のフィックスプラン

5
Overseas Sales:
¥150 billion海外売上高
1,500億円
Overseas Sales Ratio:
50%海外売上高比率
Domestic Sales:
¥150 billion国内売上高
1,500億円
Full-
Scal
e G
loba
lizat
ion
グロ
ーバ
ル展
開
Development of New Businesses新規分野への展開
Consolidated Net Sales: ¥300 billionOP Margin: 20%, ROA: 15%
連結売上高:3,000億円営業利益率:20%、ROA:15%
Long-Term Management Target 長期経営目標
Expansion of Business Areas ビジネス領域の拡大
Management Target 経営目標

6
3726
FY2013
28 22
FY2013
101
128
FY2013
SA
LE
S
PR
OD
UC
TIO
N
AsiaTHK TAIWAN THK (CHINA)THK (SHANGHAI)DALIAN THKTHK MANUFACTURING OF CHINA (WUXI)THK MANUFACTURING OF CHINA (LIAONING)Beldex KoreaTHK LM SYSTEM Pte. Ltd.THK IndiaTHK MANUFACTURING OF VIETNAMTHK RHYTHM GUANGZHOUTHK RHYTHM CHANGZHOUTHK RHYTHM (THAILAND)THK RHYTHM MALAYSIASAMICK THK *
189
FY2013
(Billions of yen
10億円)
EuropeTHK EuropeTHK GmbHTHK FranceTHK Manufacturing of EuropeTHK Manufacturing of Ireland
the AmericasTHK Holdings of America THK America THK Manufacturing of AmericaTHK RHYTHM NORTH AMERICATHK RHYTHM MEXICANATHK RHYTHM MEXICANA ENGINEERING
JapanTHKTHK INTECHSTALK SYSTEMTHK NIIGATANIPPON SLIDETHK RHYTHML Trading
Building a Tetra-lateral Operational Network: Japan, the Americas, Europe and Asia四極での営業網の構築:日本、米州、欧州、アジア
Promotion of Regional Production Optimization適地生産の推進
(Billions of yen
10億円) (Billions of yen
10億円) (Billions of yen
10億円)
Full-Scale Globalization グローバル展開
Management Target 経営目標
*An equity investee 持分法適用関連会社

7
Machine Tools
工作機械
Chip Mounting Machines
実装機
Injection Molding Machines
射出成形機
Industrial Robot
産業用ロボット
Semiconductor Production Equipment
半導体製造装置
FPD Production Equipment
FPD製造装置
Expansion from Capital Goods into Consumer Goods資本財から消費財(民生分野)への展開を図る
Automotive Parts
自動車用部品
Seismic
Isolation and Damping System
免制震システム
Consumer Electronics
民生用電子機器
Servo-control Technology
サーボコントロール
Capital Goods資本財
Consumer Goods消費財
FAI Division
(Future Automotive Industry)
-
Develops and supplies key automotive componentsthat enhance automobile safety
-
Other transportation equipment-related businesses
・自動車の安全性向上に役立つ自動車用要素部品の開発、提供・その他輸送用機器関連ビジネス
ACE Division
(Amenity Creation Engineering)
-
Mainly develops and supplies seismic isolation devicesand damping system that help ensure housing safety
-
Support the home automation
・住宅の安全性を確保する免震、制震装置を主として開発、提供・ホームオートメーションのサポート+
Development of New Businesses 新規分野への展開
IMT Division
(Innovation Mechatronics Technology)
-
Supplies unit products customized to each customer’s needs-
Develops and supplies electric actuator seriesthat address customer’s general-purpose needs
-
Developing next generation robot related productsthat are projected to expand in the future
・お客様のカスタム仕様にお応えするユニット製品の提供・汎用用途のユーザーニーズにお応えする
電動アクチュエータシリーズの開発、提供・将来拡大が見込まれる次世代ロボット関連製品の開発
Management Target 経営目標
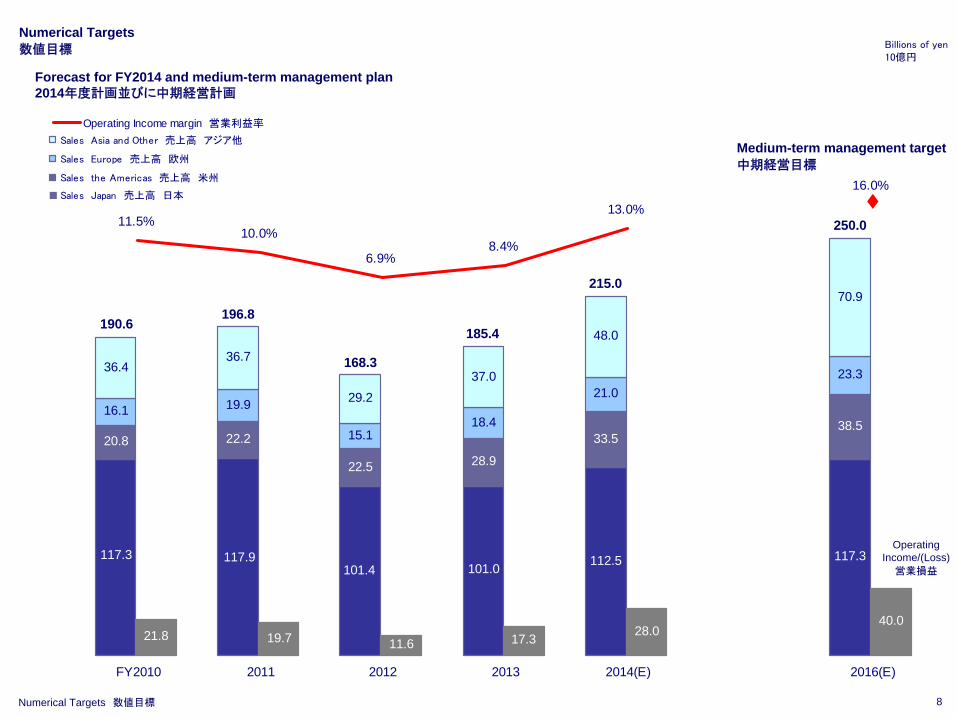
16.0%
8.4%10.0%
6.9%
13.0%11.5%
FY2010 2011 2012 2013 2014(E) 2016(E)
Operating Income margin 営業利益率
21.8 19.7 11.6 17.3
117.3
40.0
20.8 22.2
22.5 28.9
33.538.5
16.1 19.9
15.118.4
21.023.336.4
36.7
29.237.0
48.0
70.9
27.0
112.5101.0117.3 117.9
101.4
28.0
Sales Asia and Other 売上高 アジア他
Sales Europe 売上高 欧州
Sales the Americas 売上高 米州
Sales Japan 売上高 日本
8
Numerical Targets 数値目標
Numerical Targets 数値目標
Billions of yen10億円
OperatingIncome/(Loss)
営業損益
190.6196.8
168.3
185.4
250.0
215.0
Forecast for FY2014 and medium-term management plan 2014年度計画並びに中期経営計画
Medium-term management target 中期経営目標
9
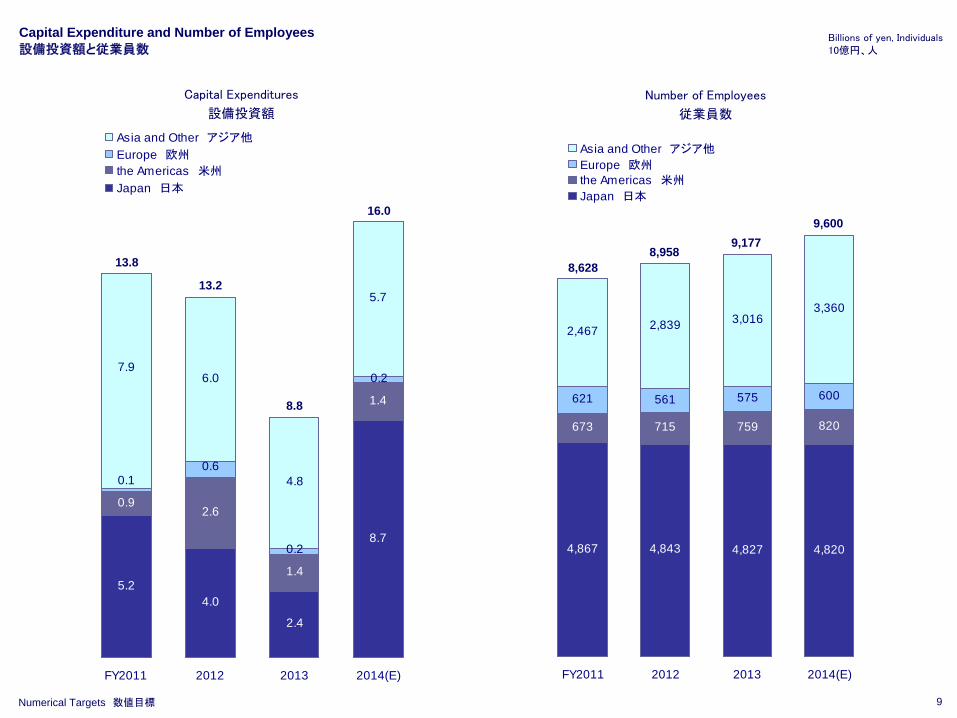
Capital Expenditure and Number of Employees 設備投資額と従業員数
Billions of yen, Individuals10億円、人
Number of Employees
従業員数
Capital Expenditures
設備投資額
4,867 4,843 4,827 4,820
673 715 759 820
621 561 575 600
2,467 2,839 3,0163,360
FY2011 2012 2013 2014(E)
Asia and Other アジア他
Europe 欧州
the Americas 米州
Japan 日本
5.24.0
2.4
8.7
0.92.6
1.4
1.4
0.10.6
0.2
0.2
5.7
4.8
6.07.9
FY2011 2012 2013 2014(E)
Asia and Other アジア他
Europe 欧州
the Americas 米州
Japan 日本
8,62813.8
Numerical Targets 数値目標
13.2
8,958
8.8
9,177
16.09,600
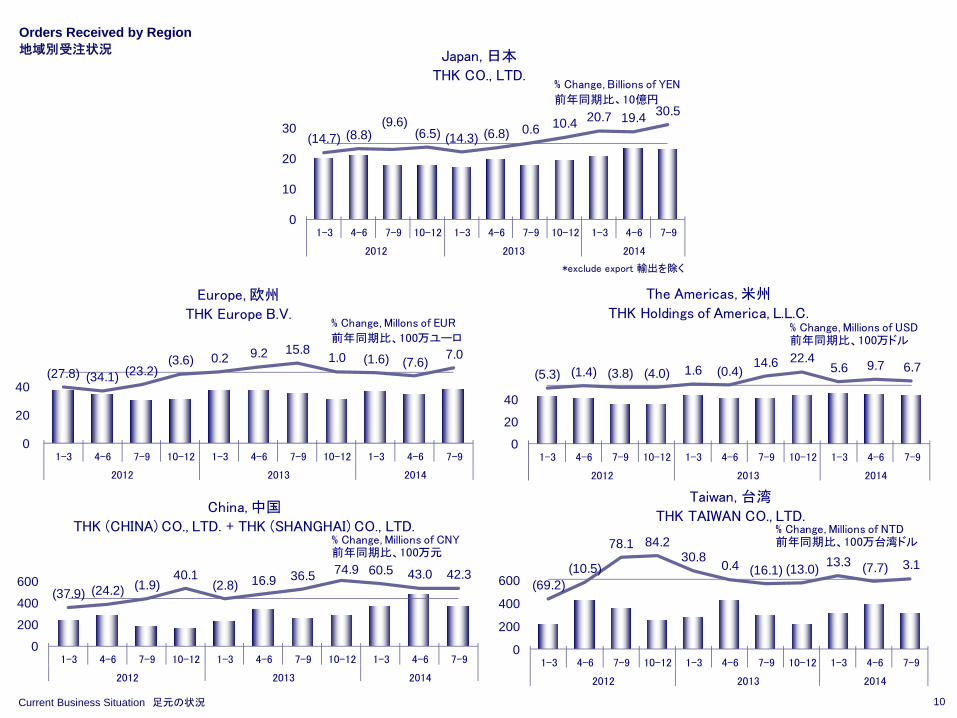
(27.8) (34.1) (23.2)(3.6) 0.2 9.2 15.8 1.0 (1.6) (7.6) 7.0
0
20
40
60
1-3 4-6 7-9 10-12 1-3 4-6 7-9 10-12 1-3 4-6 7-9
2012 2013 2014
Europe, 欧州
THK Europe B.V.% Change, Millons of EUR
前年同期比、100万ユーロ
10
(14.7) (8.8)(9.6)
(6.5) (14.3) (6.8) 0.6 10.4 20.7 19.4 30.5
0
10
20
30
1-3 4-6 7-9 10-12 1-3 4-6 7-9 10-12 1-3 4-6 7-9
2012 2013 2014
Japan, 日本
THK CO., LTD.% Change, Billions of YEN
前年同期比、10億円
(5.3) (1.4) (3.8) (4.0) 1.6 (0.4)14.6 22.4
5.6 9.7 6.7
0
20
40
60
80
1-3 4-6 7-9 10-12 1-3 4-6 7-9 10-12 1-3 4-6 7-9
2012 2013 2014
The Americas, 米州
THK Holdings of America, L.L.C.% Change, Millions of USD前年同期比、100万ドル
Orders Received by Region 地域別受注状況
(69.2)(10.5)
78.1 84.2 30.8 0.4 (16.1) (13.0) 13.3 (7.7) 3.1
0
200
400
600
800
1,000
1-3 4-6 7-9 10-12 1-3 4-6 7-9 10-12 1-3 4-6 7-9
2012 2013 2014
Taiwan, 台湾
THK TAIWAN CO., LTD.% Change, Millions of NTD前年同期比、100万台湾ドル
*exclude export 輸出を除く
(37.9) (24.2) (1.9)40.1
(2.8) 16.9 36.5 74.9 60.5 43.0 42.3
0
200
400
600
800
1-3 4-6 7-9 10-12 1-3 4-6 7-9 10-12 1-3 4-6 7-9
2012 2013 2014
China, 中国
THK (CHINA) CO., LTD. + THK (SHANGHAI) CO., LTD.% Change, Millions of CNY前年同期比、100万元
Current Business Situation 足元の状況

12%5%
40%
8%
26%
9%
Agency/Distributor
代理店・商社
45%
Electronics
エレクトロニクス
8%
General Machinery
一般機械
24%
Machine Tools
工作機械
8%
Outside '13/12
Inside '12/12
11
18%
16%
18%6%
4%
38%
Other
その他
5%
Agency/Distributor
代理店・商社
41%
Electronics
エレクトロニクス
17%
General Machinery
一般機械
16%
Machine Tools
工作機械
14%
19%4%
39%
11%
18%
9%
General Machinery
一般機械
17%
Machine Tools
工作機械
8%
Agency/Distributor
代理店・商社
37%
Other
その他
4%
Electronics
エレクトロニクス
13%
User Sales Breakdown by Industry 業種別売上高構成比
3%
29%
12%
15%
41%
Machine Tools
工作機械
48%
Agency/Distributor
代理店・商社
28%
Other
その他
5%
Electronics
エレクトロニクス
5%
Outside '14/3Inside ‘13/3
Outside ‘13/12Inside ‘12/12
Japan, 日本THK CO., LTD.
the Americas, 米州THK Holdings of America, L.L.C.
Europe, 欧州THK Europe B.V.
Taiwan, 台湾THK TAIWAN CO., LTD.
Current Business Situation 足元の状況
Outside ‘13/12Inside ‘12/12
*exclude export 輸出を除くTransportation
輸送用機器
21%
Transportation輸送用機器
7%
12%
Transportation
輸送用機器General Machinery
一般機械
14%3%
Other
その他
12
1-3 4-6 7-9 10-12 1-3 4-6 7-9 10-12 1-3 4-6 7-9 10-12 1-3 4-6 7-9 10-12 1-3 4-6 7-9 10-12 1-3 4-6 7-9 10-12 1-3 4-6 7-9 10-12 1-3 4-6 7-9 10-12 1-3 4-6 7-9
2006 2007 2008 2009 2010 2011 2012 2013 2014
Domestic Orders
国内受注高27,721 28,466 26,370 26,099 24,907 25,067 25,371 27,509 27,201 27,794 23,950 14,913 7,809 7,815 10,818 14,953 18,753 25,450 27,147 24,217 23,684 23,168 19,573 18,962 20,201 21,130 17,701 17,728 17,321 19,701 17,801 19,565 20,902 23,517 23,234
Domestic Sales
国内売上高27,760 28,077 27,176 27,116 25,988 24,923 24,320 27,077 27,081 26,048 25,524 19,834 11,473 7,787 10,698 13,726 17,209 20,942 23,922 22,433 24,215 23,817 23,461 20,650 20,872 20,315 19,638 17,737 17,747 18,115 18,384 19,131 20,793 21,266 23,479
Domestic Backlog
国内受注残14,398 14,787 13,981 12,964 11,883 12,027 13,078 13,511 13,631 15,378 13,804 8,883 5,219 5,247 5,367 6,594 8,138 12,645 15,870 17,655 17,124 16,475 12,587 10,899 10,229 11,044 9,107 9,098 8,673 10,259 9,677 10,111 10,220 12,471 12,225
0
5,000
10,000
15,000
20,000
25,000
30,000Domestic Orders
国内受注高
Domestic Sales
国内売上高
Domestic Backlog
国内受注残
Trend in Domestic Orders, Sales, Backlog <Parent Basis> 受注高・売上高・受注残高の推移
–単独国内-
Current Business Situation 足元の状況
Millions of yen100万円

13
Trend in Orders Classified by Industry <Parent Basis> 業種別受注高の推移
–単独-
1-3 4-6 7-9 10-12 1-3 4-6 7-9 10-12 1-3 4-6 7-9 10-12 1-3 4-6 7-9 10-12 1-3 4-6 7-9 10-12 1-3 4-6 7-9 10-12 1-3 4-6 7-9 10-12 1-3 4-6 7-9 10-12 1-3 4-6 7-9
2006 2007 2008 2009 2010 2011 2012 2013 2014
Machine Tools
工作機械3,409 3,757 3,685 3,769 3,658 3,926 3,925 3,965 3,727 3,635 3,263 1,319 527 535 846 1,612 2,164 3,443 4,020 3,808 4,183 3,970 3,423 3,318 3,681 3,721 3,536 3,114 2,117 2,439 2,683 2,753 3,129 4,004 4,188
General Machinery
一般機械4,970 5,486 4,825 4,664 4,217 4,581 4,603 4,833 4,835 4,942 3,969 2,219 1,091 1,268 1,654 2,445 3,216 4,730 4,627 3,792 4,056 3,896 3,428 2,875 3,300 3,301 2,797 2,878 2,782 3,272 2,972 3,133 3,545 3,908 3,398
Electronics
エレクトロニクス6,916 6,593 5,745 5,351 5,515 5,600 5,812 6,149 5,657 5,984 5,159 2,809 1,514 1,315 2,406 3,763 4,127 5,372 6,394 5,762 4,695 4,998 3,204 3,184 3,519 4,337 2,514 3,037 3,152 3,852 2,774 3,146 3,492 4,446 4,547
0
1,000
2,000
3,000
4,000
5,000
6,000
7,000
8,000Machine Tools工作機械
General Machinery一般機械
Electronicsエレクトロニクス
Current Business Situation 足元の状況
Millions of yen100万円

14
Consolidated Statements of Income 連結損益計算書
Financial Statements 財務諸表
Millions of yen, Yen100万円、円
1H FY 1H FY 1H FY 1H FY 1H FY 1H FY(E)
Net sales 売上高 47,402 115,330 92,120 190,661 103,208 196,866 87,432 168,366 89,099 185,466 106,207 215,000
Japan 日本 28,059 70,295 57,528 117,304 60,771 117,900 52,848 101,443 48,435 101,052 55,994 112,500
the Americas 米州 6,408 14,552 10,649 20,812 11,198 22,279 11,518 22,527 14,044 28,900 16,886 33,500
Europe 欧州 6,348 12,635 7,574 16,106 10,484 19,979 8,361 15,194 8,714 18,427 10,407 21,000
Asia and other アジア他 6,586 17,846 16,367 36,438 20,754 36,707 14,704 29,200 17,904 37,085 22,917 48,000
Cost of goods sold 売上原価 40,514 92,141 66,613 136,219 73,509 142,891 63,838 124,067 63,859 132,562 73,205 148,800
Gross profit on sales 売上総利益 6,887 23,189 25,506 54,442 29,698 53,975 23,594 44,298 25,239 52,903 33,001 66,200
SG&A 販売費及び一般管理費 16,299 32,697 15,940 32,598 17,237 34,229 16,262 32,605 17,753 35,533 18,700 38,200
Operating income 営業利益 (9,412) (9,508) 9,565 21,844 12,461 19,745 7,331 11,692 7,486 17,370 14,300 28,000
Non-operating income 営業外収益 1,104 1,586 769 1,689 1,183 2,174 880 4,268 4,183 7,611 1,538
Non-operating expenses 営業外費用 452 875 1,579 1,902 4,190 2,848 2,679 1,196 773 1,362 366
Ordinary income 経常利益 (8,760) (8,797) 8,755 21,631 9,454 19,072 5,531 14,765 10,897 23,618 15,472 30,000
Extraordinary gain 特別利益 369 452 151 176 29 43 37 40 4 608 7
Extraordinary loss 特別損失 417 6,165 51 195 479 594 20 69 21 222 19
Net income 当期純利益 (6,705) (14,300) 5,706 13,959 6,111 12,641 3,742 9,808 7,128 15,590 10,887 20,000
Earnings per share 1株当たり当期純利益 (52.14) (111.20) 44.37 108.55 47.52 98.31 29.16 76.96 56.31 123.16 86.00 157.99
Foreign-exchange rate 邦貨換算レート *
US$ Average rate 平均レート 95.48 93.58 91.37 87.81 82.05 79.84 79.75 79.83 95.59 97.65 102.47 103.97
Euro Average rate 平均レート 127.21 130.21 121.32 116.39 114.99 111.11 103.45 102.63 125.50 129.69 140.43 139.15
'14/3'12/3 '13/3 '15/3
* Foreign currency exchange rates used for translation of accounts of overseas subsidiaries (except '15/3 FY(E))
外貨建財務諸表(連結子会社)の換算レート('15/3 FY(E) を除く)
'11/3'10/3
15
Consolidated Statements of Income 連結損益計算書
1H FY 1H FY 1H FY 1H FY 1H FY 1H FY(E)
Profitability ratio 売上高利益率
Gross margin 売上総利益率 14.5 20.1 27.7 28.6 28.8 27.4 27.0 26.3 28.3 28.5 31.1 30.8
Operating income margin 売上高営業利益率 (19.9) (8.2) 10.4 11.5 12.1 10.0 8.4 6.9 8.4 9.4 13.5 13.0
Ordinary income margin 売上高経常利益率 (18.5) (7.6) 9.5 11.3 9.2 9.7 6.3 8.8 12.2 12.7 14.6 14.0
Net income margin 売上高当期純利益率 (14.1) (12.4) 6.2 7.3 5.9 6.4 4.3 5.8 8.0 8.4 10.3 9.3
Rate of change 増減率
Net sales 売上高 (55.2) (35.7) 94.3 65.3 12.0 3.3 (15.3) (14.5) 1.9 10.2 19.2 15.9
Japan 日本 (58.0) (35.8) 105.0 66.9 5.6 0.5 (13.0) (14.0) (8.4) (0.4) 15.6 11.3
the Americas 米州 (49.3) (37.5) 66.2 43.0 5.2 7.0 2.9 1.1 21.9 28.3 20.2 15.9
Europe 欧州 (53.6) (49.3) 19.3 27.5 38.4 24.0 (20.3) (23.9) 4.2 21.3 19.4 14.0
Asia and other アジア他 (47.4) (17.1) 148.5 104.2 26.8 0.7 (29.1) (20.5) 21.8 27.0 28.0 29.4
売上総利益 Gross profit on sales (79.2) (52.0) 270.3 134.8 16.4 (0.9) (20.6) (17.9) 7.0 19.4 30.8 25.1
営業利益 Operating income - - - - 30.3 (9.6) (41.2) (40.8) 2.1 48.6 91.0 61.2
経常利益 Ordinary income - - - - 8.0 (11.8) (41.5) (22.6) 97.0 60.0 42.0 27.0
当期純利益 Net income - - - - 7.1 (9.4) (38.8) (22.4) 90.5 59.0 52.7 28.3
'15/3'11/3'10/3 '14/3'13/3'12/3
Financial Statements 財務諸表
%
16
Consolidated Balance Sheets 連結貸借対照表
'15/3
1H FY 1H FY 1H FY 1H FY 1H FY 1H
ASSETS 資産の部Current assets 流動資産 130,324 143,460 160,211 191,665 197,334 198,652 193,855 193,940 232,981 227,890 238,462
Cash and bank deposits 現金・預金 70,773 69,266 71,858 100,104 101,356 110,788 111,949 115,967 147,708 138,343 139,546Trade accounts and notes receivable 受取手形・売掛金 27,614 40,466 54,495 56,442 60,575 53,034 49,908 46,116 49,742 52,557 60,802Short-term investments in securities 有価証券 - - - - - - - - - - -Inventories 棚卸資産 25,812 24,761 26,416 26,906 27,407 26,235 25,316 24,099 27,252 28,766 29,673Loans receivable 短期貸付金 2,080 2,000 2,002 2,003 2,003 2,002 1,002 1,002 1,002 1,002 1,002Other その他 4,293 7,207 5,661 6,395 6,178 6,736 5,810 6,874 7,389 7,353 7,554Less allowance for doubtful receivable 貸倒引当金 (250) (242) (222) (184) (187) (145) (130) (120) (115) (131) (116)
Fixed assets 固定資産 104,742 92,914 88,916 88,103 87,550 89,680 92,552 99,205 104,321 108,526 103,372Property , plant, and equipment 有形固定資産 83,603 79,841 76,213 75,409 78,041 79,612 82,104 87,697 91,280 94,838 89,189Intangible assets 無形固定資産 8,049 1,263 1,146 1,093 1,990 2,606 2,454 2,767 3,259 4,213 4,027Investments and other 投資その他の資産 13,088 11,809 11,556 11,599 7,518 7,462 7,993 8,740 9,781 9,474 10,155
Deferred assets 繰延資産 - - - - - - - - - - -Total assets 資産合計 235,066 236,374 249,127 279,768 284,884 288,333 286,408 293,145 337,303 336,416 341,834
LIABILITIES 負債の部Current liabilities 流動負債 24,092 34,374 46,192 51,961 50,304 44,542 41,187 55,656 71,147 54,490 48,763
Trade accounts and notes payable 支払手形・買掛金 14,491 24,226 32,471 31,743 34,317 27,661 26,181 20,846 25,240 25,411 30,001Short-term loans payable and current portion of long-term loans payable - 28 239 249 114 117 83 20,125 20,098 127 98短期借入金・一年内長期借入金Current portion of bonds 一年内償還予定社債 - - - - - - - - 10,000 10,000 -Income taxes payable 未払法人税等 278 290 1,645 5,808 2,122 2,151 1,316 2,177 3,449 5,808 5,150Other その他 9,322 9,828 11,835 14,159 13,749 14,611 13,607 12,507 12,359 13,142 13,512
Long-term liabilities 固定負債 38,489 39,741 39,868 59,870 58,419 68,274 68,222 48,430 58,610 59,777 70,637Bonds payable 社債 10,000 10,000 10,000 30,000 30,000 40,000 40,000 40,000 50,000 50,000 50,000Loans payable 長期借入金 20,000 20,000 20,000 20,000 20,000 20,000 20,000 - - - 10,000Other その他 8,489 9,741 9,868 9,870 8,419 8,274 8,222 8,430 8,610 9,777 10,637
NET ASSETS 純資産の部Stockholder's equity 株主資本 174,858 166,296 171,036 178,221 183,376 188,990 188,753 193,678 199,665 206,731 214,429
Paid-in capital 資本金 34,606 34,606 34,606 34,606 34,606 34,606 34,606 34,606 34,606 34,606 34,606Additional paid-in capital 資本剰余金 44,342 44,342 44,342 44,342 44,342 44,584 44,584 44,584 44,584 44,584 44,584Retained earnings 利益剰余金 107,263 98,703 103,445 110,632 115,788 121,161 123,489 128,416 134,405 141,474 149,177Treasury stock 自己株式 (11,354) (11,356) (11,357) (11,359) (11,361) (11,362) (13,926) (13,928) (13,930) (13,934) (13,939)
Accumulated other comprehensive income その他の包括利益累計額 * (3,580) (5,196) (9,157) (11,490) (8,819) (15,126) (13,341) (6,390) 5,800 13,099 6,248Net unrealized gain on other securities その他有価証券評価差額金 307 542 354 590 344 777 329 740 886 801 1,020Foreign currency translation 為替換算調整勘定 (3,888) (5,738) (9,512) (12,080) (9,163) (15,903) (13,671) (7,131) 4,913 12,930 5,818
Minority interest 少数株主持分 1,206 1,158 1,187 1,206 1,603 1,652 1,585 1,769 2,079 2,317 1,756Total net assets 純資産合計 172,484 162,258 163,066 167,937 176,160 175,516 176,998 189,058 207,545 222,148 222,433Total liabilities and net assets 負債純資産合計 235,066 236,374 249,127 279,768 284,884 288,333 286,408 293,145 337,303 336,416 341,834
Note: Effective from the first half year ended September 30, 2006, the Company adopted the accounting standard for presentation of net assets in the balance sheet
("Guidance on Accounting Standard for Presentation of Net Assets in the Balance Sheet" issued by Accounting Standards Board of Japan).
'07/3中間期から「貸借対照表の純資産の部の表示に関する会計基準」(企業会計基準委員会)を適用しております
* From '07/3 to '10/3: Valuation and translation adjustment '07/3から'10/3は評価・差額金等
'10/3 '11/3 '14/3'13/3'12/3
Financial Statements 財務諸表
Millions of yen100万円

17
Segment Information セグメント情報
Financial Statements 財務諸表
Millions of yen100万円
'15/31H FY 1H FY 1H FY 1H FY 1H FY 1H
Geographical Segment Information 所在地別セグメント情報Japan 日本
Net sales 売上高 37,898 97,184 81,674 167,294 89,441 166,622 72,963 139,726 72,998 147,064 82,360Customers 外部顧客に対する売上高 30,669 77,666 63,284 127,944 65,844 125,956 56,038 107,005 52,189 107,436 60,565Inter-segment セグメント間の内部売上高 7,228 19,518 18,389 39,349 23,597 40,665 16,924 32,720 20,809 39,628 21,794
Operating expenses 営業費用 42,540 98,660 73,330 148,972 78,828 150,006 67,221 128,150 65,681 130,630 70,314Operating income セグメント利益(営業利益) (4,642) (1,476) 8,343 18,322 10,613 16,615 5,741 11,575 7,317 16,434 12,046
the Americas 米州
Net sales 売上高 6,398 14,456 10,577 20,729 11,143 21,948 11,409 22,348 13,904 28,631 16,774Customers 外部顧客に対する売上高 6,373 14,410 10,510 20,608 11,028 21,835 11,397 22,308 13,896 28,618 16,754Inter-segment セグメント間の内部売上高 24 45 66 121 114 113 12 39 7 13 19
Operating expenses 営業費用 6,697 14,821 9,637 18,922 10,415 20,766 10,868 21,337 13,295 27,465 15,939Operating income セグメント利益(営業利益) (299) (364) 939 1,807 727 1,182 540 1,010 609 1,166 835
Europe 欧州
Net sales 売上高 6,264 12,450 7,549 16,114 10,419 19,885 8,318 15,074 8,639 18,332 10,316Customers 外部顧客に対する売上高 6,255 12,429 7,542 16,099 10,411 19,868 8,312 15,062 8,628 18,292 10,300Inter-segment セグメント間の内部売上高 9 20 7 15 8 17 5 11 11 40 16
Operating expenses 営業費用 6,966 14,026 7,980 17,049 10,773 20,169 8,288 15,452 9,090 18,152 9,385Operating income セグメント利益(営業利益) (701) (1,576) (430) (934) (354) (283) 30 (378) (451) 180 931
Asia and other アジア他
Net sales 売上高 4,503 12,407 - - - - - - - - -Customers 外部顧客に対する売上高 4,104 10,823 - - - - - - - - -Inter-segment セグメント間の内部売上高 398 1,584 - - - - - - - - -
Operating expenses 営業費用 5,366 12,939 - - - - - - - - -Operating income セグメント利益(営業利益) (863) (531) - - - - - - - - -
China 中国
Net sales 売上高 - - 7,336 17,298 10,464 20,173 8,873 17,668 11,154 23,649 14,395Customers 外部顧客に対する売上高 - - 5,730 13,969 8,777 17,117 6,469 13,427 8,914 19,857 12,546Inter-segment セグメント間の内部売上高 - - 1,605 3,328 1,686 3,056 2,403 4,241 2,240 3,791 1,849
Operating expenses 営業費用 - - 6,533 14,831 8,733 17,577 8,576 18,003 11,376 24,263 14,229Operating income セグメント利益(営業利益) - - 802 2,466 1,730 2,596 297 (335) (221) (614) 166
Other その他
Net sales 売上高 - - 5,054 12,081 7,216 12,273 5,370 10,885 5,809 11,971 6,593Customers 外部顧客に対する売上高 - - 5,052 12,039 7,146 12,089 5,214 10,561 5,470 11,261 6,039Inter-segment セグメント間の内部売上高 - - 1 41 69 183 156 323 338 709 554
Operating expenses 営業費用 - - 4,782 11,535 6,885 11,770 5,225 10,594 5,472 11,294 6,007Operating income セグメント利益(営業利益) - - 271 545 330 503 144 291 336 676 586
- -Elimination or Corporate 消去又は全社
(2,905) (5,559) (360) (363) (587) (867) 576 (471) (104) (472) 264
'12/3'10/3
Note: Unallocated operating expenses included in the “Elimination or Corporate” amount from the fiscal year ended March 31, 2008 to that ended March 31, 2010 mainly consist of administration expenses of the head office
of the reporting company.
’08/3期から‘10/3期において、営業費用のうち消去又は全社の項目に含めた配布不能営業費用の主なものは、提出会社本社の総務部門等管理部門にかかる費用です。
Note: Due to the adoption of new accounting standards effective from the fiscal year ending March 31, 2011, the previous category “Asia and Other” is now subdivided into “China” and “Other.”
’11/3期より会計基準の変更に伴い、従来の「アジア他」を「中国」および「その他」に分けて表示しております。
'13/3'11/3 '14/3

18
Overviews of Major Subsidiaries 主要子会社
Financial Statements 財務諸表
'08/12 '09/12 '10/12 '11/12 '12/12 '13/12 '14/12(E)
THK Ho ldin gs o f Amer ic a, L .L .C. Millions of USD 100万ドル
Net Sales 売上高 137 87 142 164 161 162 181
y/y 前年比 (3.6%) (36.4%) +62.9% +15.2% (1.9%) +0.5% +11.6%
Operating income 営業利益 8 (4) 16 13 10 10 12
y/y 前年比 +107.4% - - (21.4%) (21.9%) +0.6% +14.3%
Operating margin 売上高営業利益率 6.3% (5.1%) 11.9% 8.1% 6.5% 6.5% 6.6%
Exchange rate 換算レート ¥103.46 ¥93.58 ¥87.81 ¥79.84 ¥79.83 ¥97.65 ¥103.97
THK Eu rope B.V. Millions of EUR 100万ユーロ
Net Sales 売上高 163 95 138 178 146 141 150
y/y 前年比 +3.4% (41.6%) +44.8% +29.3% (17.9%) (3.8%) +6.1%
Operating income 営業利益 6 (12) (8) (2) (3) 1 12
y/y 前年比 (68.2%) - - - - - +869.2%
Operating margin 売上高営業利益率 4.2% (12.9%) (5.8%) (1.5%) (2.6%) 0.9% 8.0%
Exchange rate 換算レート ¥152.44 ¥130.21 ¥116.39 ¥111.11 ¥102.63 ¥129.69 ¥139.15
'09/3 '10/3 '11/3 '12/3 '13/3 '14/3 '15/3(E)
THKリズム連結
THK RHYTHM (Conso lidate d) Millions of YEN 100万円
Net Sales 売上高 25,485 31,585 36,356 40,366 45,763 47,500
y/y 前年比 +23.9% +15.1% +11.0% +13.4% +3.8%
Operating income 営業利益 (673) 977 1,168 1,289 1,903 2,100
y/y 前年比 - +19.5% +10.3% +47.7% +10.4%
Operating margin 売上高営業利益率 (2.6%) 3.1% 3.2% 3.2% 4.2% 4.4%
19
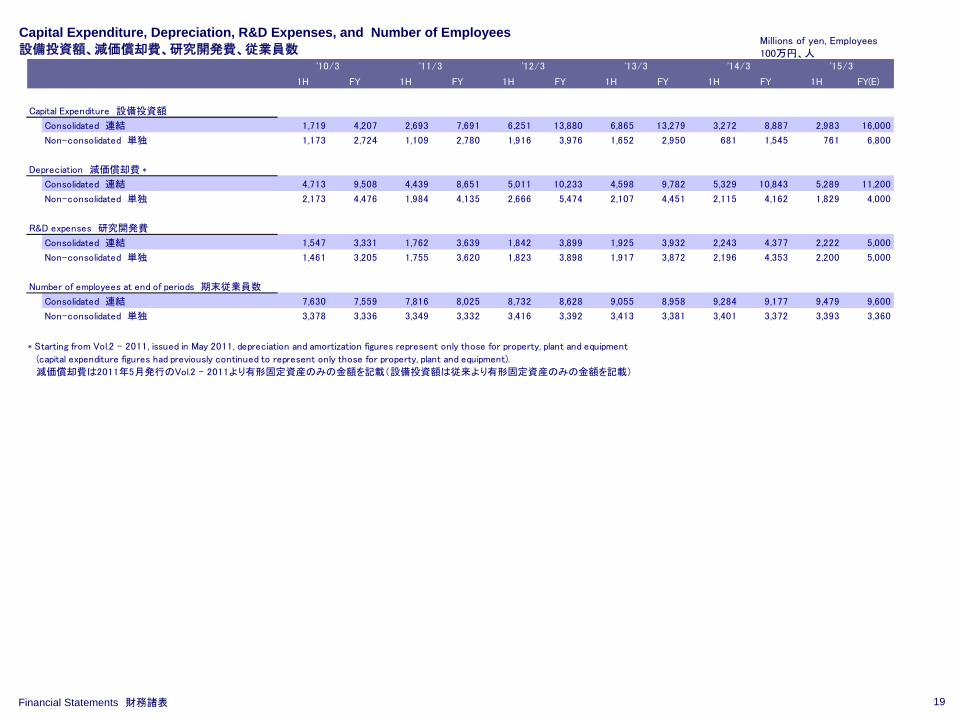
Capital Expenditure, Depreciation, R&D Expenses, and Number of Employees 設備投資額、減価償却費、研究開発費、従業員数
1H FY 1H FY 1H FY 1H FY 1H FY 1H FY(E)
Capital Expenditure 設備投資額
Consolidated 連結 1,719 4,207 2,693 7,691 6,251 13,880 6,865 13,279 3,272 8,887 2,983 16,000
Non-consolidated 単独 1,173 2,724 1,109 2,780 1,916 3,976 1,652 2,950 681 1,545 761 6,800
Depreciation 減価償却費 *
Consolidated 連結 4,713 9,508 4,439 8,651 5,011 10,233 4,598 9,782 5,329 10,843 5,289 11,200
Non-consolidated 単独 2,173 4,476 1,984 4,135 2,666 5,474 2,107 4,451 2,115 4,162 1,829 4,000
R&D expenses 研究開発費
Consolidated 連結 1,547 3,331 1,762 3,639 1,842 3,899 1,925 3,932 2,243 4,377 2,222 5,000
Non-consolidated 単独 1,461 3,205 1,755 3,620 1,823 3,898 1,917 3,872 2,196 4,353 2,200 5,000
Number of employees at end of periods 期末従業員数
Consolidated 連結 7,630 7,559 7,816 8,025 8,732 8,628 9,055 8,958 9,284 9,177 9,479 9,600
Non-consolidated 単独 3,378 3,336 3,349 3,332 3,416 3,392 3,413 3,381 3,401 3,372 3,393 3,360
'14/3
* Starting from Vol.2 – 2011, issued in May 2011, depreciation and amortization figures represent only those for property, plant and equipment
(capital expenditure figures had previously continued to represent only those for property, plant and equipment).
減価償却費は2011年5月発行のVol.2 - 2011より有形固定資産のみの金額を記載(設備投資額は従来より有形固定資産のみの金額を記載)
'11/3'10/3 '13/3'12/3 '15/3
Financial Statements 財務諸表
Millions of yen, Employees100万円、人
20
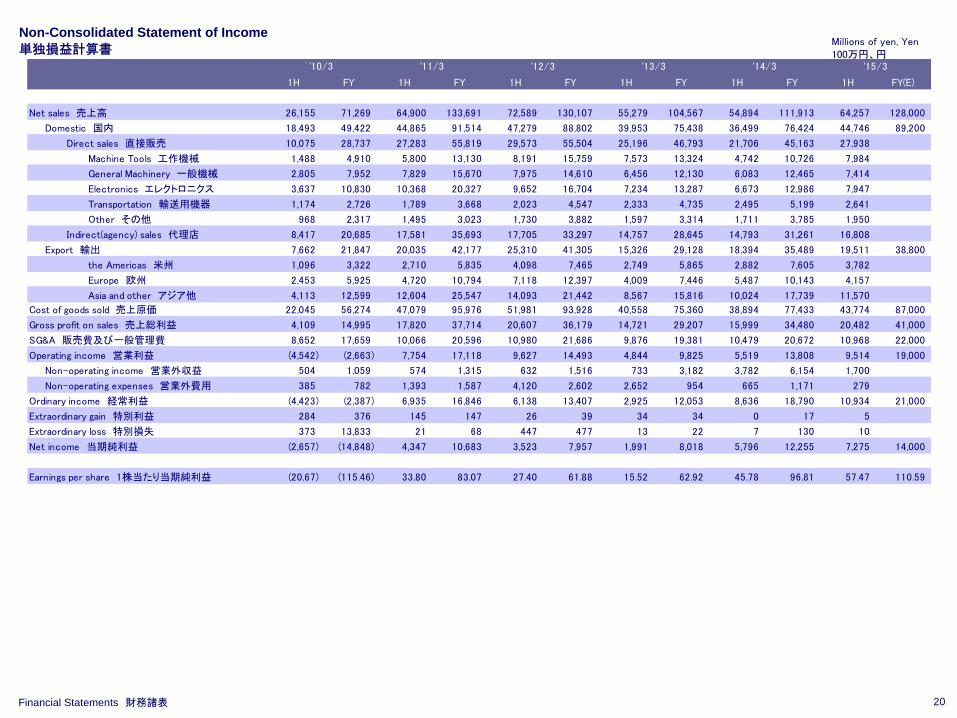
Non-Consolidated Statement of Income 単独損益計算書
1H FY 1H FY 1H FY 1H FY 1H FY 1H FY(E)
Net sales 売上高 26,155 71,269 64,900 133,691 72,589 130,107 55,279 104,567 54,894 111,913 64,257 128,000
Domestic 国内 18,493 49,422 44,865 91,514 47,279 88,802 39,953 75,438 36,499 76,424 44,746 89,200
Direct sales 直接販売 10,075 28,737 27,283 55,819 29,573 55,504 25,196 46,793 21,706 45,163 27,938
Machine Tools 工作機械 1,488 4,910 5,800 13,130 8,191 15,759 7,573 13,324 4,742 10,726 7,984
General Machinery 一般機械 2,805 7,952 7,829 15,670 7,975 14,610 6,456 12,130 6,083 12,465 7,414
Electronics エレクトロニクス 3,637 10,830 10,368 20,327 9,652 16,704 7,234 13,287 6,673 12,986 7,947
Transportation 輸送用機器 1,174 2,726 1,789 3,668 2,023 4,547 2,333 4,735 2,495 5,199 2,641
Other その他 968 2,317 1,495 3,023 1,730 3,882 1,597 3,314 1,711 3,785 1,950
Indirect(agency) sales 代理店 8,417 20,685 17,581 35,693 17,705 33,297 14,757 28,645 14,793 31,261 16,808
Export 輸出 7,662 21,847 20,035 42,177 25,310 41,305 15,326 29,128 18,394 35,489 19,511 38,800
the Americas 米州 1,096 3,322 2,710 5,835 4,098 7,465 2,749 5,865 2,882 7,605 3,782
Europe 欧州 2,453 5,925 4,720 10,794 7,118 12,397 4,009 7,446 5,487 10,143 4,157
Asia and other アジア他 4,113 12,599 12,604 25,547 14,093 21,442 8,567 15,816 10,024 17,739 11,570
Cost of goods sold 売上原価 22,045 56,274 47,079 95,976 51,981 93,928 40,558 75,360 38,894 77,433 43,774 87,000
Gross profit on sales 売上総利益 4,109 14,995 17,820 37,714 20,607 36,179 14,721 29,207 15,999 34,480 20,482 41,000
SG&A 販売費及び一般管理費 8,652 17,659 10,066 20,596 10,980 21,686 9,876 19,381 10,479 20,672 10,968 22,000
Operating income 営業利益 (4,542) (2,663) 7,754 17,118 9,627 14,493 4,844 9,825 5,519 13,808 9,514 19,000
Non-operating income 営業外収益 504 1,059 574 1,315 632 1,516 733 3,182 3,782 6,154 1,700
Non-operating expenses 営業外費用 385 782 1,393 1,587 4,120 2,602 2,652 954 665 1,171 279
Ordinary income 経常利益 (4,423) (2,387) 6,935 16,846 6,138 13,407 2,925 12,053 8,636 18,790 10,934 21,000
Extraordinary gain 特別利益 284 376 145 147 26 39 34 34 0 17 5
Extraordinary loss 特別損失 373 13,833 21 68 447 477 13 22 7 130 10
Net income 当期純利益 (2,657) (14,848) 4,347 10,683 3,523 7,957 1,991 8,018 5,796 12,255 7,275 14,000
Earnings per share 1株当たり当期純利益 (20.67) (115.46) 33.80 83.07 27.40 61.88 15.52 62.92 45.78 96.81 57.47 110.59
'11/3'10/3 '15/3'14/3'13/3'12/3
Financial Statements 財務諸表
Millions of yen, Yen100万円、円

21
Non-Consolidated Statement of Income 単独損益計算書
1H FY 1H FY 1H FY 1H FY 1H FY 1H FY(E)
Profitability ratio 売上高利益率
Gross margin 売上総利益率 15.7 21.0 27.5 28.2 28.4 27.8 26.6 27.9 29.1 30.8 31.9 32.0
Operating income margin 売上高営業利益率 (17.4) (3.7) 11.9 12.8 13.3 11.1 8.8 9.4 10.1 12.3 14.8 14.8
Ordinary income margin 売上高経常利益率 (16.9) (3.3) 10.7 12.6 8.5 10.3 5.3 11.5 15.7 16.8 17.0 16.4
Net income margin 売上高当期純利益率 (10.2) (20.8) 6.7 8.0 4.9 6.1 3.6 7.7 10.6 11.0 11.3 10.9
Rate of change 増減率
Net sales 売上高 (63.7) (36.7) 148.1 87.6 11.8 (2.7) (23.8) (19.6) (0.7) 7.0 17.1 14.4
Gross profit on sales 売上総利益 (80.3) (47.2) 333.6 151.5 15.6 (4.1) (28.6) (19.3) 8.7 18.1 28.0 18.9
Operating income 営業利益 - - - - 24.2 (15.3) (49.7) (32.2) 13.9 40.5 72.4 37.6
Ordinary income 経常利益 - - - - (11.5) (20.4) (52.3) (10.1) 195.2 55.9 26.6 11.8
Net income 当期純利益 - - - - (19.0) (25.5) (43.5) 0.8 191.0 52.8 25.5 14.2
'15/3'14/3'13/3'12/3'11/3'10/3
Financial Statements 財務諸表
%
22
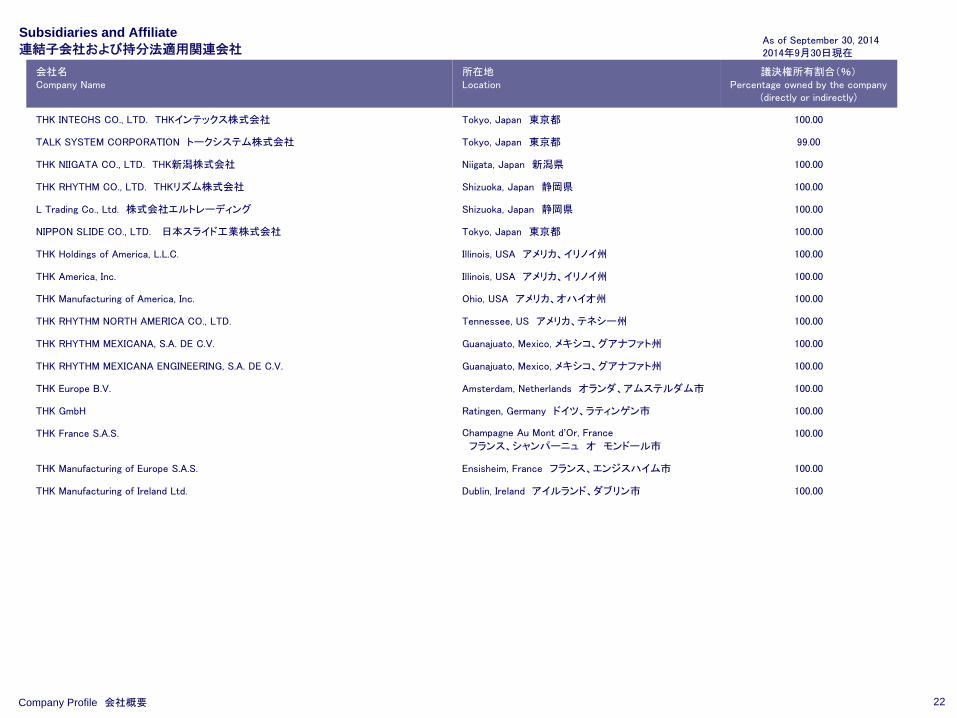
Subsidiaries and Affiliate 連結子会社および持分法適用関連会社
会社名Company Name
所在地Location
議決権所有割合(%)Percentage owned by the company
(directly or indirectly)
THK INTECHS CO., LTD.
THKインテックス株式会社 Tokyo, Japan
東京都 100.00
TALK SYSTEM CORPORATION
トークシステム株式会社 Tokyo, Japan
東京都 99.00
THK NIIGATA CO., LTD.
THK新潟株式会社 Niigata, Japan
新潟県 100.00
THK RHYTHM CO., LTD.
THKリズム株式会社 Shizuoka, Japan
静岡県 100.00
L Trading Co., Ltd.
株式会社エルトレーディング Shizuoka, Japan
静岡県 100.00
NIPPON SLIDE CO., LTD. 日本スライド工業株式会社 Tokyo, Japan
東京都 100.00
THK Holdings of America, L.L.C. Illinois, USA
アメリカ、イリノイ州 100.00
THK America, Inc. Illinois, USA
アメリカ、イリノイ州 100.00
THK Manufacturing of America, Inc. Ohio, USA
アメリカ、オハイオ州 100.00
THK RHYTHM NORTH AMERICA CO., LTD. Tennessee, US
アメリカ、テネシー州 100.00
THK RHYTHM MEXICANA, S.A. DE C.V. Guanajuato, Mexico, メキシコ、グアナファト州 100.00
THK RHYTHM MEXICANA ENGINEERING, S.A. DE C.V. Guanajuato, Mexico, メキシコ、グアナファト州 100.00
THK Europe B.V. Amsterdam, Netherlands
オランダ、アムステルダム市 100.00
THK GmbH Ratingen, Germany
ドイツ、ラティンゲン市 100.00
THK France S.A.S. Champagne Au Mont d’Or, France
フランス、シャンパーニュ
オ
モンドール市100.00
THK Manufacturing of Europe S.A.S. Ensisheim, France
フランス、エンジスハイム市 100.00
THK Manufacturing of Ireland Ltd. Dublin, Ireland
アイルランド、ダブリン市 100.00
Company Profile 会社概要
As of September 30, 20142014年9月30日現在

23
Subsidiaries and Affiliate 連結子会社および持分法適用関連会社
会社名Company Name
所在地Location
議決権所有割合(%)Percentage owned by the company
(directly or indirectly)
THK (CHINA) CO., LTD. THK(中国)投資有限公司 Dalian, China
中国、大連市 100.00
THK (SHANGHAI) CO., LTD.
THK(上海)国際貿易有限公司 Shanghai, China
中国、上海市 100.00
DALIAN THK CO., LTD.
大連THK瓦軸工業有限公司 Dalian, China
中国、大連市 70.00
THK MANUFACTURING OF CHINA (WUXI) CO., LTD.
THK(無錫)精密工業有限公司 Wuxi, China
中国、無錫市 100.00
THK MANUFACTURING OF CHINA (LIAONING) CO., LTD. THK(遼寧)精密工業有限公司 Dalian, China
中国、大連市 100.00
THK MANUFACTURING OF CHINA (CHANGZHOU) CO.,
LTD.
THK(常州)精工有限公司 Changzhou, China
中国、常州市 100.00
THK RHYTHM GUANGZHOU CO., LTD.
THKリズム(広州)汽車配件有限公司 Guangzhou, China
中国、広州市 100.00
THK RHYTHM CHANGZHOU CO., LTD. THKリズム(常州)汽車配件有限公司 Changzhou, China
中国、常州市 100.00
THK TAIWAN CO., LTD. Taipei, Taiwan
台湾、台北市 100.00
Beldex KOREA Corporation 株式会社ベルデックスコリア Seoul,
South Korea
韓国、ソウル市 100.00
THK LM SYSTEM Pte. Ltd. Kaki Bukit, Singapore シンガポール、カキブキ地区 100.00
THK RHYTHM (THAILAND) CO., LTD. Rayong, Thailand
タイ、ラヨーン県 100.00
THK MANUFACTURING OF VIETNAM CO., LTD. Bac Ninh, Vietnam
ベトナム、バックニン省 100.00
THK RHYTHM MALAYSIA Sdn. Bhd. Penang, Malaysia
マレーシア、ペナン州 80.00
THK India Private Limited Bangalore, India インド、バンガロール市 100.00
SAMICK THK CO., LTD.
三益THK株式会社 Taegu, South Korea
韓国、テグ市 33.82
Company Profile 会社概要
Equity investee持分法適用関連会社
As of September 30, 20142014年9月30日現在
24
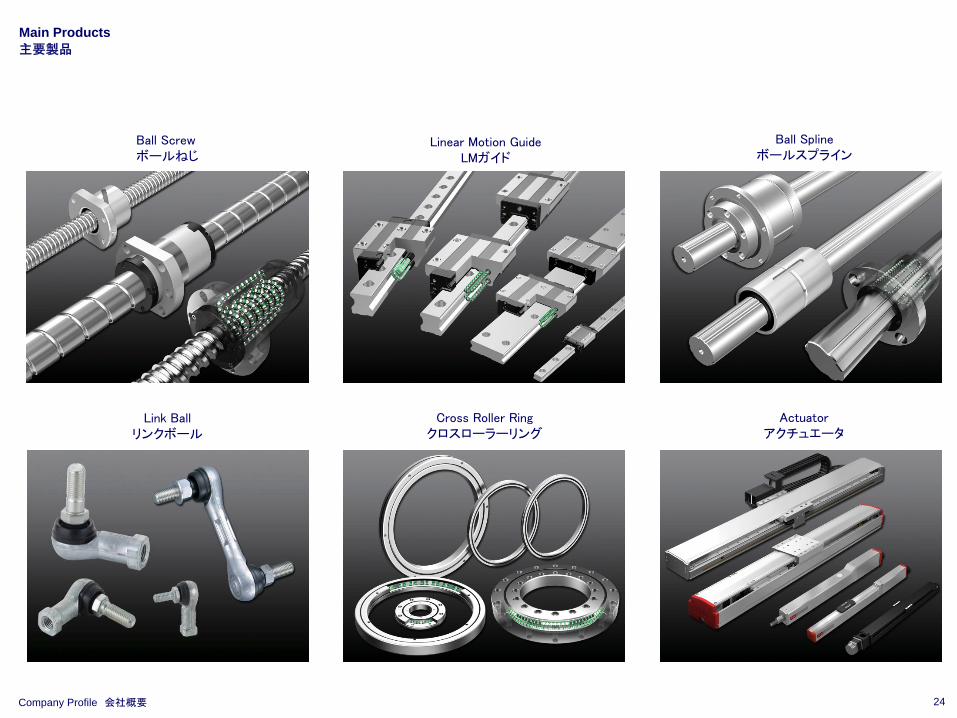
Ball Splineボールスプライン
Ball Screwボールねじ
Link Ballリンクボール
Linear Motion GuideLMガイド
Main Products 主要製品
Company Profile 会社概要
Cross Roller Ringクロスローラーリング
Actuatorアクチュエータ

0 10 20 30 40 50 60 70 80 90 100 110 120 130 140 150 160 170 180 190 200 210 220 230
'72/3'73/3
'74/3'75/3'76/3
'77/3'78/3
'79/3'80/3
'81/3'82/3'83/3
'84/3'85/3
'86/3'87/3
'88/3'89/3'90/3
'91/3'92/3
'93/3'94/3
'95/3'96/3
'97/3'98/3'99/3
'00/3'01/3
'02/3'03/3
'04/3'05/3'06/3
'07/3'08/3
'09/3'10/3
'11/3'12/3'13/3
'14/3'15/3
25
1977: Kofu plant (JPN) opened
甲府工場を設立
1982: THK Europe (DEU) established
THKヨーロッパ(DEU)を設立
1984: Gifu plant (JPN) opened
岐阜工場(JPN)を設立
1985: Mie plant (JPN) opened
三重工場(JPN)を設立
1981: THK America (USA) established
THKアメリカ(USA)を設立
1972: Production and sales of LM Guides and Ball Splines commences
LMガイド、ボールスプラインの製造販売開始
1991: Yamagata plant (JPN) opened
山形工場を設立
1997: TMA (USA) established
TMA(USA)を設立
2000: TME (FRA) established
TME(FRA)を設立
1989: Listed on the OTC market
株式店頭登録 1989: THK TAIWAN (TWN) established
THK台湾(TWN)を設立
2001: Listed on the First Section of TSE
東京証券取引所第一部上場
1985: Yamaguchi plant (JPN) opened
山口工場(JPN)を設立
1988: THK Yasuda (currently THK NIIGATA) (JPN) established
THK安田(現THK新潟)(JPN)を設立
1991: SAMICK LMS (KOR) Joint-Venture
三益LMS(KOR)に資本参加
1992: PGM (currently TMI)
(UK & IRL)
buy-out
PGM(現TMI)を買収
Note: Figures for '72/3-'90/3: Non-consolidated Net Sales '91/3-'15/3(E): Consolidated Net Sales'72/3-'90/3については単独売上高
'91/3-'15/3(E)については連結売上高
1996: DALIAN THK (CHN) established
大連THK(CHN)を設立
2003: THK SHANGHAI (CHN) established
THK上海(CHN)を設立
2004: THK WUXI (CHN) established
THK無錫(CHN)を設立
Billions of yen 10億円
History 沿革
Company Profile 会社概要
2005:
THK LIAONING (CHN) established
THK遼寧(CHN)を設立
2006:
THK LM SYSTEM (SGP) established
T
HK LM SYSTEM(SGP)を設立
2007:
Acquisition of all of the shares of Rhythm (currently THK RHYTHM) (JPN)リズム社(現THKリズム)(JPN)の全株式を取得
2011: NIPPON SLIDE(JPN), TMV(VNM), TRCC(CHN), TRMS(MYS) have been added tothe list of our consolidated subsidiaries
日本スライド(JPN)、TMV(VNM)、TRCC(CHN)、TRMS(MYS)を連結子会社に追加
1996: Production and sale of second generation LM Guides started
第二世代LMガイドの製造販売開始
2005:
THK CHINA (CHN) established
THK中国(CHN)を設立
2012:
TRMX (MEX), TRME (MEX), THK India (IND) establishedTRMX (MEX)、TRME (MEX)、THK India(IND)を設立
’15/3(E)2014:
ASEAN Customer Support establishedASEAN Customer Supportを設立

26
Plants in Japan 日本の生産拠点
Company Profile 会社概要
THK CO., LTD., Yamagata PlantTHK株式会社
山形工場
Major Products
主要生産品目LM Guide
LMガイドBall Screw
ボールねじActuator
アクチュエータ
THK NIIGATA CO., LTD.THK新潟株式会社
Major Products
主要生産品目Ball
Spline
ボールスプライン
THK CO., LTD., Kofu PlantTHK株式会社
甲府工場
Major Products
主要生産品目Ball Screw
ボールねじ
THK CO., LTD., Gifu PlantTHK株式会社
岐阜工場
Major Products
主要生産品目LM Guide
LMガイド
THK CO., LTD., Yamaguchi PlantTHK株式会社
山口工場
Major Products
主要生産品目LM Guide
LMガイド
THK CO., LTD., Mie PlantTHK株式会社
三重工場
Major Products
主要生産品目Cross Roller Ring
クロスローラーリング
THK INTECHS CO., LTD., Sendai PlantTHKインテックス株式会社
仙台工場
Major Products
主要生産品目Machine Tool
工作機械Machinery and Equipment
機械装置
THK INTECHS CO., LTD., Mishima PlantTHKインテックス株式会社
三島工場
Major Products
主要生産品目XY Stage
XYステージ
THK RHYTHM CO., LTD. Kyushu PlantTHKリズム株式会社
九州工場
Major Products
主要生産品目Suspension Ball Joint
サスペンションボールジョイントSteering Linkage
ステアリングリンケージ
THK RHYTHM CO., LTD., Inasa Plant THKリズム株式会社
引佐工場
Major Products
主要生産品目Steering Linkage
ステアリングリンケージSteering Tie Rod
ステアリングタイロッド
THK RHYTHM CO., LTD., Hamamatsu PlantTHKリズム株式会社
浜松工場
Major Products
主要生産品目Aluminium Suspension Link
アルミリンクSteering Tie Rod
ステアリングタイロッド
NIPPON SLIDE CO., LTD.日本スライド工業株式会社
Major Products
主要生産品目Slide Rail スライドレール
27
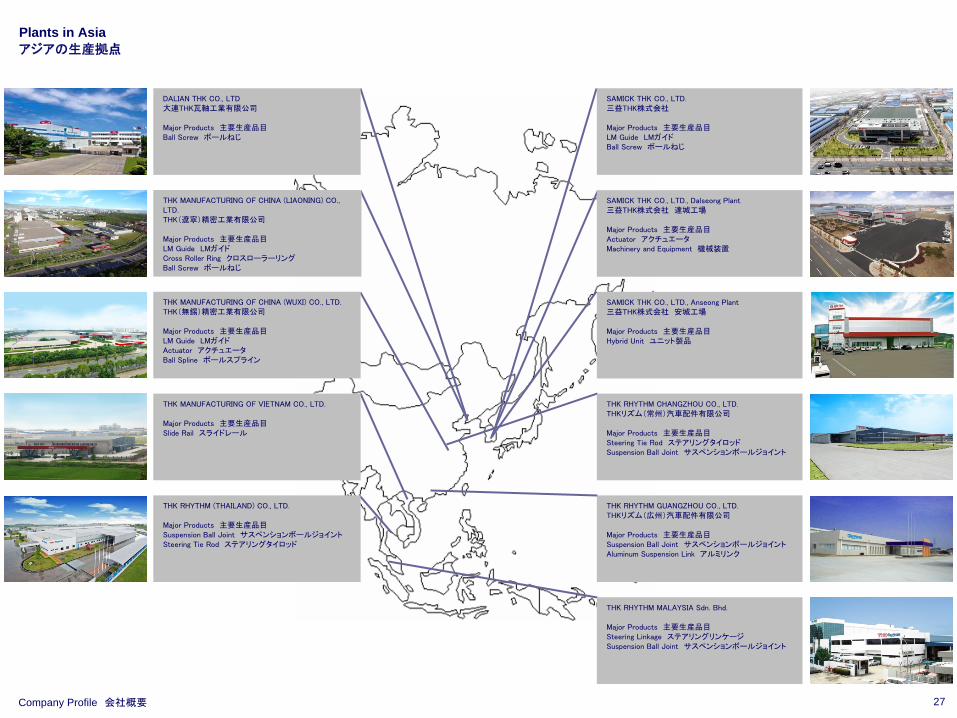
Plants in Asia アジアの生産拠点
Company Profile 会社概要
SAMICK THK CO., LTD., Dalseong Plant三益THK株式会社
達城工場
Major Products
主要生産品目Actuator
アクチュエータMachinery and Equipment
機械装置
SAMICK THK CO., LTD., Anseong Plant三益THK株式会社
安城工場
Major Products
主要生産品目Hybrid Unit
ユニット製品
THK RHYTHM MALAYSIA Sdn. Bhd.
Major Products
主要生産品目Steering Linkage
ステアリングリンケージSuspension Ball Joint
サスペンションボールジョイント
THK RHYTHM GUANGZHOU CO., LTD.THKリズム(広州)汽車配件有限公司
Major Products
主要生産品目Suspension Ball Joint
サスペンションボールジョイントAluminum Suspension Link
アルミリンク
THK RHYTHM CHANGZHOU CO., LTD.THKリズム(常州)汽車配件有限公司
Major Products
主要生産品目Steering Tie Rod
ステアリングタイロッドSuspension Ball Joint
サスペンションボールジョイント
SAMICK THK CO., LTD.三益THK株式会社
Major Products
主要生産品目LM Guide
LMガイドBall Screw
ボールねじ
DALIAN THK CO., LTD大連THK瓦軸工業有限公司
Major Products
主要生産品目Ball Screw
ボールねじ
THK MANUFACTURING OF CHINA (LIAONING) CO., LTD.THK(遼寧)精密工業有限公司
Major Products
主要生産品目LM Guide
LMガイドCross Roller Ring
クロスローラーリングBall Screw
ボールねじ
THK MANUFACTURING OF CHINA (WUXI) CO., LTD.THK(無錫)精密工業有限公司
Major Products
主要生産品目LM Guide
LMガイドActuator
アクチュエータBall Spline
ボールスプライン
THK MANUFACTURING OF VIETNAM CO., LTD.
Major Products
主要生産品目Slide Rail
スライドレール
THK RHYTHM (THAILAND) CO., LTD.
Major Products
主要生産品目Suspension Ball Joint
サスペンションボールジョイントSteering Tie Rod
ステアリングタイロッド

28
Plants in the Americas and Europe 欧米の生産拠点
Company Profile 会社概要
THK Manufacturing of Ireland Ltd.
Major Products
主要生産品目Ball Screws
ボールねじ
THK Manufacturing of Europe S.A.S.
Major Products
主要生産品目LM Guide
LMガイドBall Screws
ボールねじLink Ball
リンクボール
THK RHYTHM NORTH AMERICA CO., LTD.
Major Products
主要生産品目Suspension Ball Joint
サスペンションボールジョイントAluminum Suspension Link
アルミリンク
THK Manufacturing of America, Inc.
Major Products
主要生産品目LM Guide
LMガイドLink Ball
リンクボールActuator
アクチュエータ
THK RHYTHM MEXICANA, S.A. DE C.V.
Major Products
主要生産品目Suspension Ball Joint
サスペンションボールジョイントSteering Tie Rod
ステアリングタイロッドStabilizer Connecting Rod
スタビライザーコンロッド
29
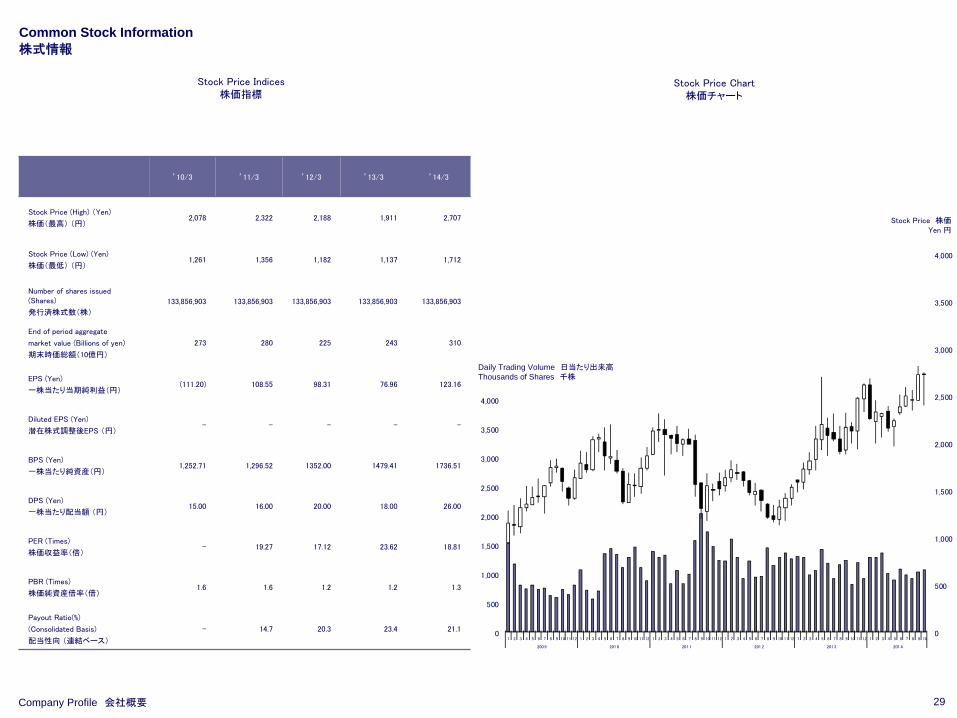
Common Stock Information 株式情報
Stock Price Indices株価指標
Company Profile 会社概要
Stock Price Chart株価チャート
’10/3 ’11/3 ’12/3 ’13/3 ’14/3
Stock Price (High) (Yen)
株価( 高)
(円)2,078 2,322 2,188 1,911 2,707
Stock Price (Low) (Yen)
株価( 低)
(円)1,261 1,356 1,182 1,137 1,712
Number of shares issued (Shares)
発行済株式数(株)
133,856,903 133,856,903 133,856,903 133,856,903 133,856,903
End of period aggregate
market value (Billions of yen)
期末時価総額(10億円)
273 280 225 243 310
EPS (Yen)
一株当たり当期純利益(円)(111.20) 108.55 98.31 76.96 123.16
Diluted EPS (Yen)
潜在株式調整後EPS (円)- - - - -
BPS (Yen)
一株当たり純資産(円)1,252.71 1,296.52 1352.00 1479.41 1736.51
DPS (Yen)
一株当たり配当額
(円)15.00 16.00 20.00 18.00 26.00
PER (Times)
株価収益率(倍)- 19.27 17.12 23.62 18.81
PBR (Times)
株価純資産倍率(倍)1.6 1.6 1.2 1.2 1.3
Payout Ratio(%)
(Consolidated Basis)
配当性向 (連結ベース)
- 14.7 20.3 23.4 21.10
500
1,000
1,500
2,000
2,500
3,000
3,500
4,000
0
500
1,000
1,500
2,000
2,500
3,000
3,500
4,000
4,500
5,000
5,500
6,000
6,500
1 2 3 4 5 6 7 8 9 10 11 12 1 2 3 4 5 6 7 8 9 10 11 12 1 2 3 4 5 6 7 8 9 10 11 12 1 2 3 4 5 6 7 8 9 10 11 12 1 2 3 4 5 6 7 8 9 10 11 12 1 2 3 4 5 6 7 8 9 10
200 9 201 0 201 1 201 2 201 3 201 4
Stock Price
株価Yen 円
Daily Trading Volume 日当たり出来高Thousands of Shares 千株
30
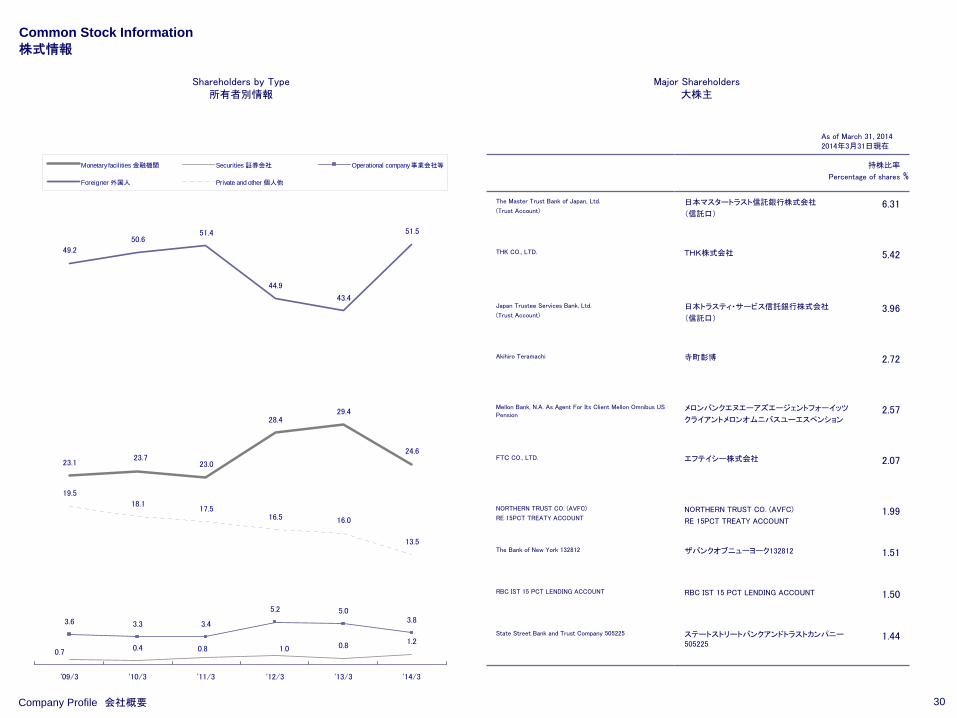
Common Stock Information 株式情報
Shareholders by Type所有者別情報
Major Shareholders大株主
Company Profile 会社概要
As of March 31, 20142014年3月31日現在
%
23.1 23.0
28.429.4
24.6
0.4 0.81.2
3.6 3.3 3.4
5.2 5.03.8
51.4
17.5
13.5
23.7
1.00.80.7
51.5
43.4
44.9
50.6
49.2
16.016.5
18.1
19.5
'09/3 '10/3 '11/3 '12/3 '13/3 '14/3
Monetary facilities 金融機関 Securities 証券会社 Operational company 事業会社等
Foreigner 外国人 Private and other 個人他
持株比率
Percentage of shares
The Master Trust Bank of Japan, Ltd.
(Trust Account)日本マスタートラスト信託銀行株式会社
(信託口)6.31
THK CO., LTD. THK株式会社 5.42
Japan Trustee Services Bank, Ltd.
(Trust Account)日本トラスティ・サービス信託銀行株式会社
(信託口)3.96
Akihiro Teramachi 寺町彰博 2.72
Mellon Bank, N.A. As Agent For Its Client Mellon Omnibus US Pension
メロンバンクエヌエーアズエージェントフォーイッツ
クライアントメロンオムニバスユーエスペンション2.57
FTC
CO., LTD. エフテイシー株式会社 2.07
NORTHERN TRUST CO. (AVFC)
RE 15PCT TREATY ACCOUNTNORTHERN TRUST CO. (AVFC)
RE 15PCT TREATY ACCOUNT1.99
The Bank of New York 132812 ザバンクオブニューヨーク132812 1.51
RBC IST 15 PCT LENDING ACCOUNT RBC IST 15 PCT LENDING ACCOUNT 1.50
State Street Bank and Trust Company 505225 ステートストリートバンクアンドトラストカンパニー
5052251.44

31
Corporate Data 会社データ
THK CO., LTD. THK株式会社
Head Office: 3-11-6Nishi-Gotanda,Shinagawa-ku, Tokyo 141-8503, Japan
本社: 〒141-8503東京都品川区西五反田3-11-6
Established: April 1971 設立: 1971年4月
Number of Employees: 9,479 (As of September 30, 2014) 従業員数: 9,479 (2014年9月30日現在)
Common StockAuthorized:
Issued:465,877,700 (As of September 30, 2014)133,856,903 (As of September 30, 2014)
普通株式会社が発行する株式の総数:
発行済株式総数:465,877,700
(2014年9月30日現在)133,856,903
(2014年9月30日現在)
Number of Shareholders: 17,746 (As of September 30, 2014) 株主数: 17,746 (2014年9月30日現在)
Transfer Agent: Mitsubishi UFJ Trust and Banking Co., Ltd. 名義書換代理人: 三菱UFJ信託銀行株式会社
Stock Exchange Listings: Tokyo Stock Exchange (TSE) 上場取引所: 東京証券取引所
Ticker Code on the TSE: 6481 証券コード: 6481
Investor Relations: Investor Relations Section,Corporate Planning Department,Corporate Strategy DivisionE-mail: [email protected]: http://www.thk.com/
お問合せ先: 経営戦略本部総合企画部IR課E-mail: [email protected]: http://www.thk.com/jp/
Company Profile 会社概要

In this presentation material contains forward-looking statements that reflect the Company’s business plans, performance projections, and management strategy. Such statements are based on information currently available to the Company. However, changes in the operating environment may cause actual results and achievements to differ from those anticipated in this Corporate Presentation material. Also, please let you know that this briefing contains reference information that are not exactly accounts indication matters.
E-mail: [email protected]
Web Site: http://www.thk.com/
本資料に含まれている事業計画、業績予想、経営戦略など将来の見通しに関する事項は、
本資料制作時点において入手可能な情報に基づき、THK株式会社の経営者が判断したものです。
したがって、環境の変化により、業績や戦略の進捗状況が異なることがあり得ることをご承知ください。
また、当資料には決算開示事項以外の参考情報が含まれますこともご承知ください。