Vol 18 No 12, December 2009 1674-1056/2009/18(12)/5451-06 ...
6
Vol 18 No 12, December 2009 1674-1056/2009/18(12)/5451-06 Chinese Physics B c ⃝ 2009 Chin. Phys. Soc. and IOP Publishing Ltd A theoretical study of harmonic generation in a short period AlGaN/GaN superlattice induced by a terahertz field Chen Jun-Feng(陈军峰) † and Hao Yue(郝 跃) Key Laboratory of the Ministry of Education for Wide Band-Gap Semiconductor Materials and Devices, School of Microelectronics, Xidian University, Xi’an 710071, China (Received 22 June 2009; revised manuscript received 21 August 2009) Based on an improved energy dispersion relation, the terahertz field induced nonlinear transport of miniband electrons in a short period AlGaN/GaN superlattice is theoretically studied in this paper with a semiclassical theory. To a short period superlattice, it is not precise enough to calculate the energy dispersion relation by just using the nearest wells in tight binding method: the next to nearest wells should be considered. The results show that the electron drift velocity is 30% lower under a dc field but 10% higher under an ac field than the traditional simple cosine model obtained from the tight binding method. The influence of the terahertz field strength and frequency on the harmonic amplitude, phase and power efficiency is calculated. The relative power efficiency of the third harmonic reaches the peak value when the dc field strength equals about three times the critical field strength and the ac field strength equals about four times the critical field strength. These results show that the AlGaN/GaN superlattice is a promising candidate to convert radiation of frequency ω to radiation of frequency 3ω or even higher. Keywords: terahertz, GaN, superlattice, nonlinear transport PACC: 7230, 7360L, 7210 1. Introduction The terahertz (THz) regime, which corresponds to the frequency range from 100 GHz to 10 THz (3 mm to 30 µm wavelength), has attracted much attention in recent decades because it offers many special ad- vantages over the traditional frequency regime. Re- cently, theories and experiments have been developed for the promising application of THz in biological and medical imaging, broadband and safety communica- tion, radar, space science, etc. [1−4] There are two ways to obtain THz radiation. From the low side of the THz frequency electronic based devices such as Gunn diodes, impact avalanche transit time diodes, and res- onant tunnelling diodes are widely investigated. [5−8] From the high side, photonics based devices such as quantum cascade lasers extend the emission wave- length from mid- and far-infrared to the THz spec- trum range. [9−12] Currently, THz devices are mainly fabricated with GaAs material. The output power and the operation temperature of these devices are limited by the intrin- sic property of the GaAs material. The GaN material is famous for its high critical field (2 MV/cm), electron saturation velocity (2 × 10 7 cm/s) and higher ther- mal conductivity (1.3 W/cm·K). These advantages al- low for the high output power and operation tem- perature, thus the GaN material may be one of the best candidates for fabricating THz devices. In this paper, the high harmonic response of a short period AlGaN/GaN superlattice under a THz field is inves- tigated with emphasis on the relations of the third harmonic amplitude, phase, power efficiency and the frequency, strength of the THz electric field. 2. Model 2.1. Energy dispersion relation of the short period AlGaN/GaN superlat- tice Consider a planar superlattice, in which electrons travel along the growth direction (z axis) through the lowest miniband formed by the periodically spaced po- tential wells and barriers. Electrons move freely in the lateral plane (x and y directions), the energy is the same as that of the free electrons ε k∥ = k 2 ∥ /2m, while the energy along the z direction is quantized by the periodically spaced potential field. The total electron energy equals the sum of the transverse energy and † Corresponding author. E-mail: [email protected] http://www.iop.org/journals/cpb http://cpb.iphy.ac.cn
Transcript of Vol 18 No 12, December 2009 1674-1056/2009/18(12)/5451-06 ...
Vol 18 No 12, December 20091674-1056/2009/18(12)/5451-06 Chinese Physics B c⃝ 2009 Chin. Phys. Soc.
and IOP Publishing Ltd
A theoretical study of harmonic generation in ashort period AlGaN/GaN superlattice induced
by a terahertz field
Chen Jun-Feng(陈军峰)† and Hao Yue(郝 跃)
Key Laboratory of the Ministry of Education for Wide Band-Gap Semiconductor Materials and Devices, School of
Microelectronics, Xidian University, Xi’an 710071, China
(Received 22 June 2009; revised manuscript received 21 August 2009)
Based on an improved energy dispersion relation, the terahertz field induced nonlinear transport of miniband
electrons in a short period AlGaN/GaN superlattice is theoretically studied in this paper with a semiclassical theory.
To a short period superlattice, it is not precise enough to calculate the energy dispersion relation by just using the nearest
wells in tight binding method: the next to nearest wells should be considered. The results show that the electron drift
velocity is 30% lower under a dc field but 10% higher under an ac field than the traditional simple cosine model obtained
from the tight binding method. The influence of the terahertz field strength and frequency on the harmonic amplitude,
phase and power efficiency is calculated. The relative power efficiency of the third harmonic reaches the peak value
when the dc field strength equals about three times the critical field strength and the ac field strength equals about
four times the critical field strength. These results show that the AlGaN/GaN superlattice is a promising candidate to
convert radiation of frequency ω to radiation of frequency 3ω or even higher.
Keywords: terahertz, GaN, superlattice, nonlinear transport
PACC: 7230, 7360L, 7210
1. Introduction
The terahertz (THz) regime, which corresponds
to the frequency range from 100 GHz to 10 THz (3 mm
to 30 µm wavelength), has attracted much attention
in recent decades because it offers many special ad-
vantages over the traditional frequency regime. Re-
cently, theories and experiments have been developed
for the promising application of THz in biological and
medical imaging, broadband and safety communica-
tion, radar, space science, etc.[1−4] There are two ways
to obtain THz radiation. From the low side of the
THz frequency electronic based devices such as Gunn
diodes, impact avalanche transit time diodes, and res-
onant tunnelling diodes are widely investigated.[5−8]
From the high side, photonics based devices such as
quantum cascade lasers extend the emission wave-
length from mid- and far-infrared to the THz spec-
trum range.[9−12]
Currently, THz devices are mainly fabricated with
GaAs material. The output power and the operation
temperature of these devices are limited by the intrin-
sic property of the GaAs material. The GaN material
is famous for its high critical field (2 MV/cm), electron
saturation velocity (2 × 107 cm/s) and higher ther-
mal conductivity (1.3 W/cm·K). These advantages al-
low for the high output power and operation tem-
perature, thus the GaN material may be one of the
best candidates for fabricating THz devices. In this
paper, the high harmonic response of a short period
AlGaN/GaN superlattice under a THz field is inves-
tigated with emphasis on the relations of the third
harmonic amplitude, phase, power efficiency and the
frequency, strength of the THz electric field.
2. Model
2.1. Energy dispersion relation of the
short period AlGaN/GaN superlat-
tice
Consider a planar superlattice, in which electrons
travel along the growth direction (z axis) through the
lowest miniband formed by the periodically spaced po-
tential wells and barriers. Electrons move freely in the
lateral plane (x and y directions), the energy is the
same as that of the free electrons εk∥ = k2∥/2m, while
the energy along the z direction is quantized by the
periodically spaced potential field. The total electron
energy equals the sum of the transverse energy and
†Corresponding author. E-mail: [email protected]://www.iop.org/journals/cpb http://cpb.iphy.ac.cn
5452 Chen Jun-Feng et al Vol.18
the vertical energy which is calculated by the tight
binding (TB) method, considering the coupling of the
wave function between the nearest wells[13]
ε(k) = εk∥ + εkz (1)
with
εkz =1
2∆(1− cos(kz · d)), (2a)
where ∆ is the width of the lowest miniband, d is the
superlattice period (well add barrier). kz is the wave
vector in the z direction. GaN based material has
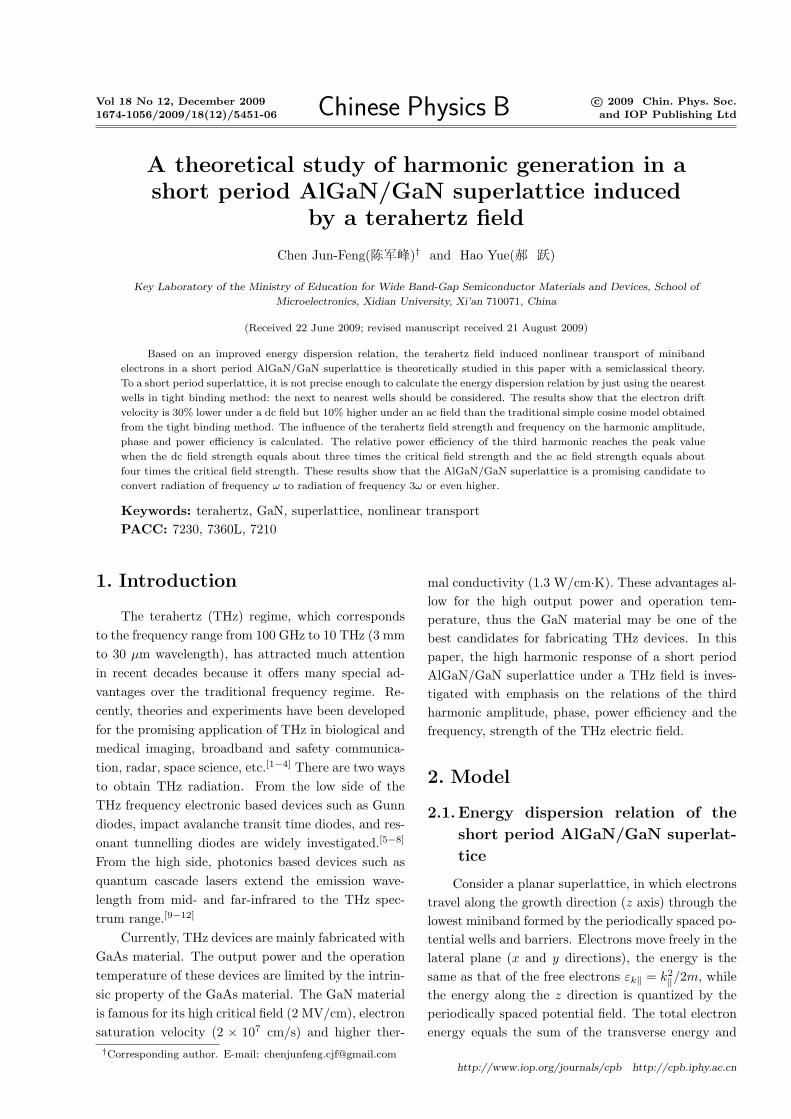
a strong polarization effect. For a short period Al-
GaN/GaN superlattice, its saw shape band edge os-
cillation (shown in Fig.1) differs from the rectangu-
lar shape band edge oscillation of an AlGaAs/GaAs
superlattice. The saw shape band edge oscillation is
caused by piezoelectric polarization induced by the
interface misfit between the AlGaN and GaN layers.
The penetration coefficient of the wave function in the
short triangular well is greater than that in the rect-
angular well, thus it is not precise enough to calculate
the energy dispersion relation just using the nearest
wells in TB method. More wells must be accounted
for in this situation. We use parameter γ to describe
the coupling coefficient of the next nearest wells. The
magnitude of the coefficient γ depends on the extent
of wave fuction overlap and does not exceed 0.2 even
for a superlattice as short as d = 2.2 nm. Then the
vertical energy dispersion relation can be rewritten as
in Eq.(2b).[14] In comparison with Eq.(2a), the new
relation includes the effect of the 2kz term
εkz =1
2∆[1− γ − (cos(kz · d)− γ cos(2kz · d))]. (2b)
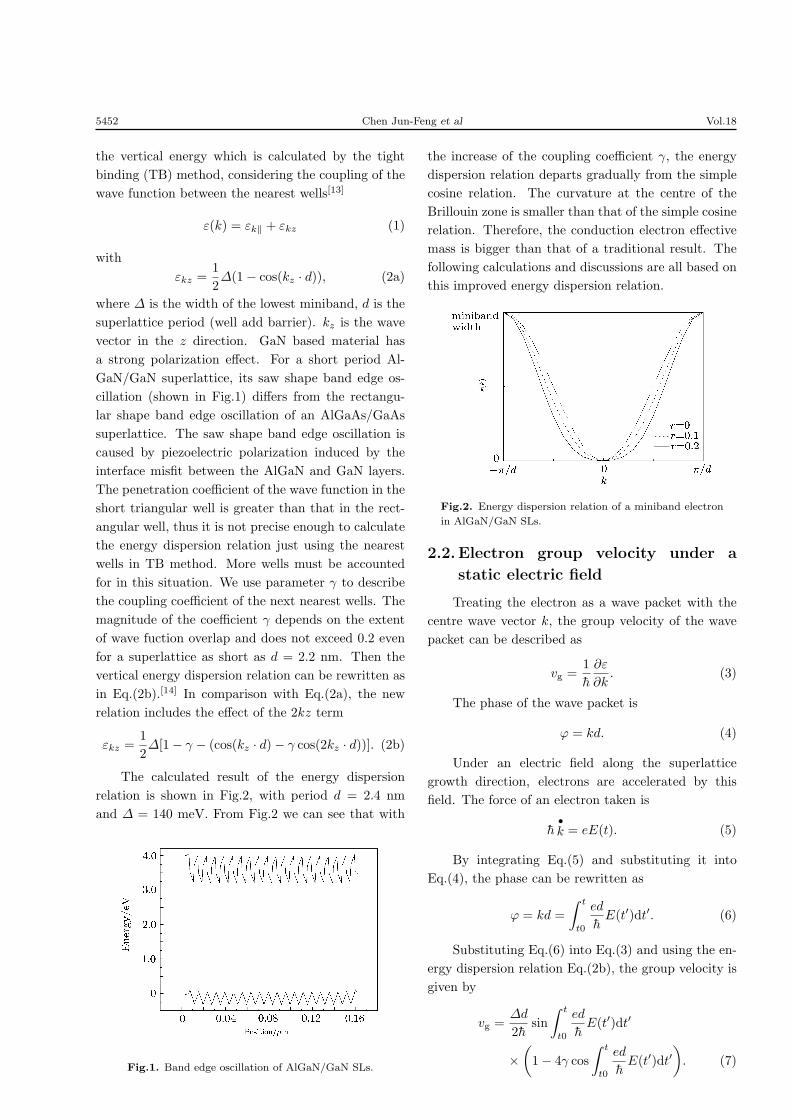
The calculated result of the energy dispersion
relation is shown in Fig.2, with period d = 2.4 nm
and ∆ = 140 meV. From Fig.2 we can see that with
Fig.1. Band edge oscillation of AlGaN/GaN SLs.
the increase of the coupling coefficient γ, the energy
dispersion relation departs gradually from the simple
cosine relation. The curvature at the centre of the
Brillouin zone is smaller than that of the simple cosine
relation. Therefore, the conduction electron effective
mass is bigger than that of a traditional result. The
following calculations and discussions are all based on
this improved energy dispersion relation.
Fig.2. Energy dispersion relation of a miniband electron
in AlGaN/GaN SLs.
2.2. Electron group velocity under a
static electric field
Treating the electron as a wave packet with the
centre wave vector k, the group velocity of the wave
packet can be described as
vg =1
h̄
∂ε
∂k. (3)
The phase of the wave packet is
φ = kd. (4)
Under an electric field along the superlattice
growth direction, electrons are accelerated by this
field. The force of an electron taken is
h̄•k = eE(t). (5)
By integrating Eq.(5) and substituting it into
Eq.(4), the phase can be rewritten as
φ = kd =
∫ t
t0
ed
h̄E(t′)dt′. (6)
Substituting Eq.(6) into Eq.(3) and using the en-
ergy dispersion relation Eq.(2b), the group velocity is
given by
vg =∆d
2h̄sin
∫ t
t0
ed
h̄E(t′)dt′
×(1− 4γ cos
∫ t
t0
ed
h̄E(t′)dt′
). (7)
No.12 A theoretical study of harmonic generation in a short period AlGaN/GaN superlattice induced . . . 5453
When the electric field is a static field E(t) = Es,
equation (7) can be simplified as
vg =∆d
2h̄sinωb(t− t0)(1− 4γ cosωb(t− t0)), (8)
where ωb = edEs/h̄ is the Bloch angular frequency. In
one period an electron is accelerated by the static elec-
tric field until it reaches the upper band edge, then it
undergoes Bragg reflection and decelerates to the ini-
tial energy. Suppose that P is the collision probability
that an electron does not undergo collision from time
t0 to t; then P can be written as
P =1
τexp
(− t− t0
τ
), (9)
where τ is the electron overall relaxation time. At
room temperature, the dominant relaxation pro-
cess in bulk GaN is associated with polar optical
phonons.[15,16] The relaxation time in this paper is
based on the intersubband scattering time estimated
for AlGaN/GaN quantum wells.[17,18] The relaxation
time 0.25 ps is taken in our calculation.
From Eqs.(9) and (7) the electron drift velocity is
obtained:
v(t) =
∫ t
−∞
1
τexp
(− t− t0
τ
)vgdt0. (10)
In a static electric field, using Eq.(8), equation
(10) can be rewritten as
vs =1
τ
∆d
2h̄
(τ2ωb
1 + τ2ω2b
− 2γ2τ2ωb
1 + 4τ2ω2b
), (11)
making Ec = h̄/edτ and vp = ∆d/4h̄, equation (11)
can be simplified as
vs = 2vp
(Es/Ec
1 + (Es/Ec)2− 4γ
Es/Ec
1 + 4(Es/Ec)2
). (12)
By comparing this result with that from the tra-
ditional simple cosine relation,[19] the second term is a
new additional term causing anharmonic electron os-
cillations at the multiples of the fundamental Bloch
frequency. Figure 3 shows the relations of the elec-
tron drift velocity under a static electric field Es with
various coupling coefficients γ. When γ = 0, at the
region from −Ec to Ec, the drift velocity increases
quasi-linearly as vd ≈ u · Es, this is the Ohmic resis-
tance region. In the region of Es > Ec and Es < −Ec,
the drift velocity decreases, which is the negative re-
sistance region. When γ increases, the peak drift ve-
locity becomes smaller, and the electric field Es is
larger at the peak velocity. When γ = 0.1 and 0.2, the
peak velocity is 84% and 70% of the value at γ = 0.
Furthermore, when γ = 0.2 the linear Ohmic region
−Ec < Es < Ec can be divided into two linear regions
Es < |0.3Ec| and |0.3Ec| < Es < |Ec|. The velocity
slope in the first region is smaller than that in the sec-
ond region, which means that the Ohmic resistance is
smaller at Es < |0.3Ec| than at |0.3Ec| < Es < |Ec|.This phenomenon is caused by the anharmonic term
in the energy dispersion relation. This semiclassical
theory is concise and acceptable for depicting the ef-
fects of the overall relaxation time on the nonlinear
transport characteristic, but it cannot be used to in-
vestigate the specific transport mechanism in detail.
When γ = 0 the drift velocity agrees with the re-
sult derived from one-dimensional Boltzmann theory
in the relaxation time approximation.[20]
Fig.3. Drift velocity under a static field.
2.3.Drift velocity of a miniband electron
under an ac electric field
Consider a dc electric field E0 and a cosine ac field
of frequency ω and amplitude Eω as:
E(t) = E0 + Eω cos(ωt). (13)
Substituting Eq.(13) into Eq.(7), the drift veloc-
ity of the steady state under E(t) is obtained:
v(t) =
∫ t
−∞
1
τ
∆d
2h̄exp
(− t− t0
τ
)×[sin
∫ t
t0
ed
h̄E(t′)dt′
×(1− 4γ cos
∫ t
t0
ed
h̄E(t′)dt′
)]dt0.
(14)
An AlGaN/GaN superlattice structure with pe-
riod d = 2.4 nm and ∆ = 140 meV to an applied field
of frequency f = 1 THz, E0 = 3Ec and Eω = 3Ec
is considered. The calculated steady time-dependent

5454 Chen Jun-Feng et al Vol.18
response in one period of the transient drift velocity
after eliminating a time delay of a few picoseconds
from turning on the applied THz field E(t) is shown
in Fig.4. Compared with the drift velocity at γ = 0,
the peak drift velocity at γ = 0.2 is 10% larger and the
peak velocity reaches 0.03 picoseconds earlier, which
almost equals π/16 earlier in the phase. Figures 3 and
4 show clearly that the coupling effect in the short pe-
riod AlGaN/GaN superlattice plays an important role
in the electron transport characteristics.
Fig.4. Steady time-dependent response of the drift veloc-
ity under E(t) = 3Ec + 3Ec cos(ωt) at f = 1 THz.
3. Harmonic analysis and discus-
sion
A superlattice is a nonlinear element that re-
sponds to an ac electric field not only at the principal
frequency but also at higher harmonics. From Eq.(14),
it can be seen that the drift velocity is a periodic time
function with period Tω = 1/f , thus the drift velocity
of the steady state can be expanded in the form of a
Fourier series consisting of dc and different harmonic
components:
vd(t) = vd0 +∞∑
n=1
[vdn1 cos(nωt) + vdn2 sin(nωt)],
(15)
where the dc component and the harmonic compo-
nents are given by
vd0 =1
T
∫ T
0
vd(t)dt, (16a)
vdn1 =2
T
∫ T
0
vd(t) cos(nωt)dt, (16b)
vdn2 =2
T
∫ T
0
vd(t) sin(nωt)dt. (16c)
An Al0.4Ga0.6N/GaN superlattice with period
d = 2.4 nm, miniband width ∆ = 140 meV and
coupling coefficient γ = 0.15 is used in the following
calculation. In this structure, the peak drift velocity
νp = 1.1×107 cm/s, Ec = 13.2 kV/cm. Figure 5 shows
the calculated real part amplitude of the steady drift
velocity of the first 10 odd order harmonic components
at f = 1 THz, E0 = 0 and Eω = 5Ec. In this zero
biased case, the dc component and all the even order
harmonic amplitudes of the steady drift velocity are
zero. The amplitude of the odd order harmonic com-
ponents decreases rapidly with increasing harmonic
order. The first and the second harmonic components
are positive, while the other harmonic components are
negative or almost zero. Figure 6 shows the relation
between the real part amplitude of the first, third,
fifth, seventh order harmonic components and the ac
electric field strength at f = 1 THz and E0 = 0. The
first harmonic component reaches its peak value at
about 3.4Ec then decreases rapidly, the amplitudes of
the third, fifth, seventh order harmonic components
oscillate and increase gradually with the increase of
ac field strength Eω.
Fig.5. Calculated real parts of the first 10 odd order har-
monics.
Fig.6. Real parts of the first, third, fifth and seventh
order harmonic components.
No.12 A theoretical study of harmonic generation in a short period AlGaN/GaN superlattice induced . . . 5455
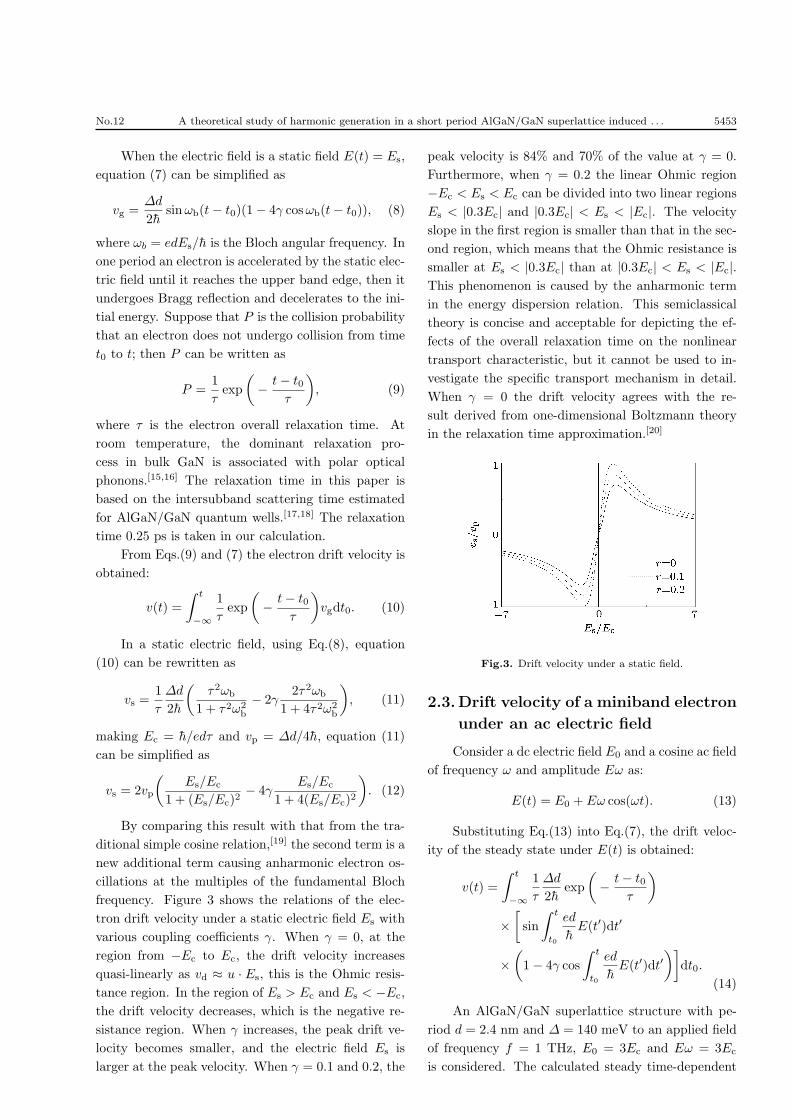
Figure 7 shows the relation of the real part ampli-
tude of the third harmonic component with the elec-
tric field strength E0 and Eω, at f = 1 THz. When
the ac field is low the dc field can suppress the third
harmonic amplitude. The peak amplitude is reached
at E0 = 1 and Eω = 5Ec. With increasing E0, the
peak amplitude decreases and shifts to the high side
of the Eω axis. The threshold Eω for the nonzero
amplitude increases as well. As a complement, the
role of the ac field frequency to the third harmonic
amplitude accompanied by the ac field strength Eω
is calculated and shown in Fig.8. With increasing
ac field strength, the third amplitude varies from
Fig.7. Relation of the third harmonic amplitude with ac
and dc field strengths.
Fig.8. Relation of the third harmonic amplitude with ac
field strength and frequency.
positive to negative. At the low side of the frequency
f = 100 GHz, the amplitude decreases to a valley at
first and then increases as follows. At the high side,
the amplitude will increase to a peak value at first
and then the amplitude decreases rapidly to the val-
ley point. In comparison with the low frequency side,
the valley shifts to the high side of the Eω axis.
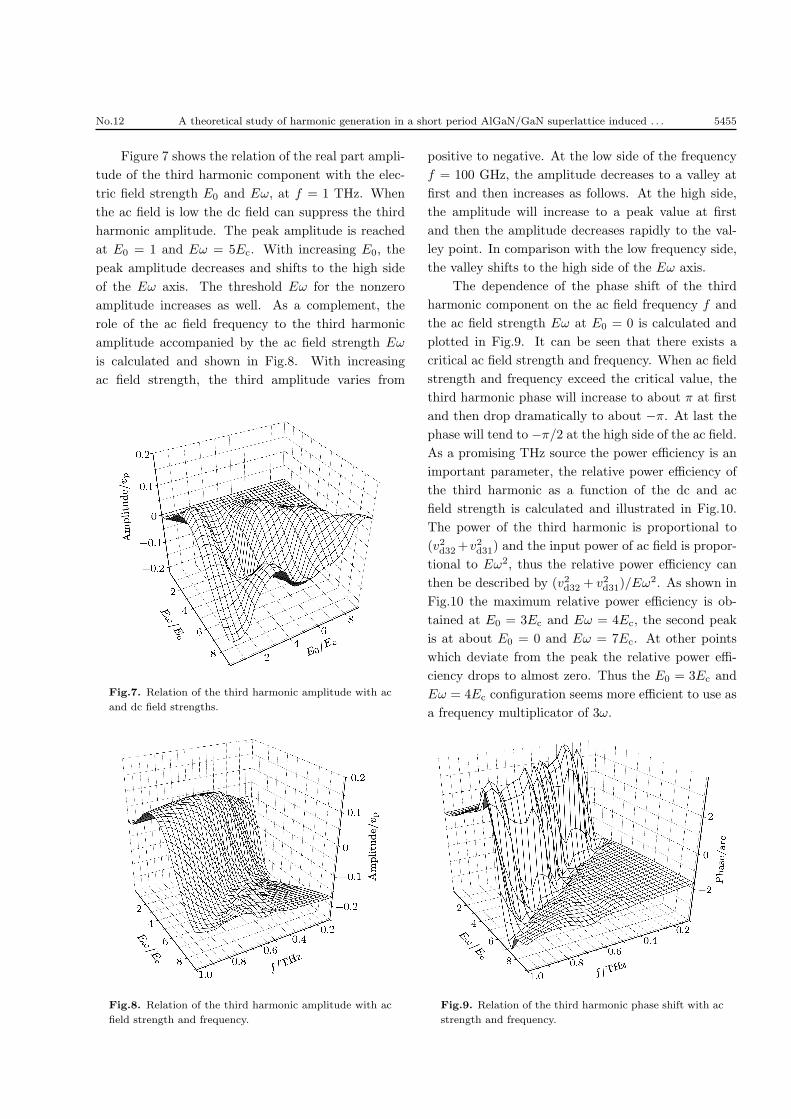
The dependence of the phase shift of the third
harmonic component on the ac field frequency f and
the ac field strength Eω at E0 = 0 is calculated and
plotted in Fig.9. It can be seen that there exists a
critical ac field strength and frequency. When ac field
strength and frequency exceed the critical value, the
third harmonic phase will increase to about π at first
and then drop dramatically to about −π. At last the
phase will tend to −π/2 at the high side of the ac field.
As a promising THz source the power efficiency is an
important parameter, the relative power efficiency of
the third harmonic as a function of the dc and ac
field strength is calculated and illustrated in Fig.10.
The power of the third harmonic is proportional to
(v2d32+v2d31) and the input power of ac field is propor-
tional to Eω2, thus the relative power efficiency can
then be described by (v2d32 + v2d31)/Eω2. As shown in
Fig.10 the maximum relative power efficiency is ob-
tained at E0 = 3Ec and Eω = 4Ec, the second peak
is at about E0 = 0 and Eω = 7Ec. At other points
which deviate from the peak the relative power effi-
ciency drops to almost zero. Thus the E0 = 3Ec and
Eω = 4Ec configuration seems more efficient to use as
a frequency multiplicator of 3ω.
Fig.9. Relation of the third harmonic phase shift with ac
strength and frequency.

5456 Chen Jun-Feng et al Vol.18
Fig.10. Relation of the third harmonic relative power
efficiency with ac and dc strengths.
4. Conclusion
Benefiting from the high critical field and the
thermal conductivity, THz devices fabricated by GaN
material can supply a higher output power density
and suffer from higher operation temperature. In this
paper, based on the improved energy dispersion re-
lation the harmonic components of short period Al-
GaN/GaN superlattice miniband electron drift veloc-
ity under a THz electric field is investigated. To a
short period AlGaN/GaN superlattice, the coupling
effects on the energy dispersion cannot be negligible.
The calculated drift velocity is 30% smaller under a dc
field and 10% larger under an ac field than the results
taking no account of the coupling effects. Both the
field strength and the field frequency play important
roles in the harmonic amplitude, phase and relative
power efficiency. The maximum relative power effi-
ciency is obtained at about E0 = 3Ec and Eω = 4Ec.
These results show that the AlGaN/GaN superlattice
is a promising candidate to convert radiation of fre-
quency ω to radiation of frequency 3ω or even higher.
References
[1] Kawase K, Ogawa Y and Watanabe Y 2003 Opt. Express
11 2549
[2] Yen T J, Padilla W J and Fang N 2004 Science 303 1494
[3] Wang S H, Ferguson B, Zhang C L and Zhang X C 2003
Acta Phys. Sin. 52 120 (in Chinese)
[4] Liu H, Xue D G and Yao J Q 2009 Chin. Phys. B 18 1077
[5] Trew R J 2005 IEEE Trans. Electron Devices 52 638
[6] Foutz B E, Eastman L F and Bhapkar U V 1997 Appl.
Phys. Lett. 70 2849
[7] Kolnik J, Oguzman I, Brennan K F, Wang R P, Ruden P
P and Wang Y 1995 J. Appl. Phys. 78 1033
[8] Krishnamurthy S, Schilfgaarde M V and Scher A 1997
Appl. Phys. Lett. 71 1999
[9] Kohler R, Tredicucci A, Beltram F, Beere H E, Linfield E
H, Davies A G, Ritchie D A, Iotti R C and Rossi F 2002
Nature 417 156
[10] Williams B S, Kumar S, Hu Q and Reno J L 2006 Elec-
tron. Lett. 42 89
[11] Kumar S, Williams B S, Hu Q and Reno J L 2006 Appl.
Phys. Lett. 88 121123
[12] Williams B S, Kumar S, Hu Q and Reno J L 2005 Opt.
Express 13 331
[13] Esaki L and Tsu R 1970 IBM J. Res. Develop. 14 61
[14] Litvinov V I, Manasson A and Pavlidis D 2004 Appl. Phys.
Lett. 85 600
[15] Shur M, Gelmont B and Asif Khan M 1996 J. Electron.
Mater. 25 777
[16] Zanato D, Gokden S, Balkan N, Ridley B K and Schaff W
J 2003 Superlatt. Microst. 34 77
[17] Ng H M, Gmachl C, Frolov S V, Chu S N G and Cho A
Y 2001 IEEE Proc. Optoelectron. 145 215
[18] Heber J D, Gmachl C, Ng H M and Cho A Y 2002 Appl.
Phys. Lett. 81 1237
[19] Renk K F, Rogl A and Stahl B I 2007 J. Luminescence
125 252
[20] Ignatov A A, Schomburg E, Grenzer J, Renk K F and
Dodin E P 1995 Z. Phys. B 98 187