Void conditions and potential for mould growth in ...
38
Void conditions and potential for mould growth in insulated and uninsulated suspended timber ground floors Special Issue Paper: Enthalpy, Moisture, and Ventilation Issues in Buildings in International Journal of Building Pathology and Adaptation (Guest editors William Isaacs and William Rose, Steve McNeil) Authors: Pelsmakers, S., Vereecken E., Airaksinen, M., Elwell, C.A. Accepted 12.09.2018 (DOI 10.1108/IJBPA-05-2018-0041) 1. Abstract Purpose: Millions of properties have suspended timber ground floors globally, with around 10 million in the UK alone. However, it is unknown what the floor void conditions are, nor the effect of insulating such floors. Upgrading floors changes the void conditions, which might increase or decrease moisture build-up and mould and fungal growth. This paper provides a review of the current global evidence and presents the results of in-situ monitoring of 15 UK floor voids. Research method: An extensive literature review on the moisture behaviour in both uninsulated and insulated suspended timber crawl spaces is supplemented with primary data of a monitoring campaign during different periods between 2012 to 2015. Air temperature and relative humidity sensors were placed in different floor void locations. Where possible, crawl spaces were visually inspected. Implications: Comparison of void conditions to mould growth thresholds highlights that a large number of the monitored floor voids might exceed the critical ranges for mould growth, leading to potential occupant health impacts if mould spores transfer into living spaces above. A direct comparison could not be made between insulated and uninsulated floors in the sample due to non-random sampling and because the insulated floors included historically damp floors. The study also highlighted that long-term monitoring over all seasons and high-resolution monitoring and inspection are required; conditions in one location are not representative of conditions in other locations. Value: This study presents the largest UK sample of monitored floors, evaluated using a review of current evidence and comparison with literature thresholds. Key words: suspended timber ground floors, crawl spaces, retrofit, void conditions, moisture, mould growth ————————— 2. Introduction
Transcript of Void conditions and potential for mould growth in ...

Void conditions and potential for mould growth in insulated and uninsulated suspended timber ground floors
Special Issue Paper: Enthalpy, Moisture, and Ventilation Issues in Buildings in International Journal of Building Pathology and Adaptation (Guest editors William Isaacs and William Rose, Steve McNeil)
Authors: Pelsmakers, S., Vereecken E., Airaksinen, M., Elwell, C.A.
Accepted 12.09.2018 (DOI 10.1108/IJBPA-05-2018-0041)
1. Abstract
Purpose: Millions of properties have suspended timber ground floors globally, with around 10 million in the UK alone.
However, it is unknown what the floor void conditions are, nor the effect of insulating such floors. Upgrading floors changes
the void conditions, which might increase or decrease moisture build-up and mould and fungal growth. This paper provides
a review of the current global evidence and presents the results of in-situ monitoring of 15 UK floor voids.
Research method: An extensive literature review on the moisture behaviour in both uninsulated and insulated suspended
timber crawl spaces is supplemented with primary data of a monitoring campaign during different periods between 2012 to
2015. Air temperature and relative humidity sensors were placed in different floor void locations. Where possible, crawl
spaces were visually inspected.
Implications: Comparison of void conditions to mould growth thresholds highlights that a large number of the monitored
floor voids might exceed the critical ranges for mould growth, leading to potential occupant health impacts if mould spores
transfer into living spaces above. A direct comparison could not be made between insulated and uninsulated floors in the
sample due to non-random sampling and because the insulated floors included historically damp floors. The study also
highlighted that long-term monitoring over all seasons and high-resolution monitoring and inspection are required;
conditions in one location are not representative of conditions in other locations.
Value: This study presents the largest UK sample of monitored floors, evaluated using a review of current evidence and
comparison with literature thresholds.
Key words: suspended timber ground floors, crawl spaces, retrofit, void conditions, moisture, mould growth
—————————
2. Introduction

Suspended ground floor constructions are common in the USA, New Zealand, Australia (Hill, 2005, Coulter, n.d.,
Williamson, 2000, Cox-Smith, 2008) and throughout Europe (Meijer et al., 2009). In the UK there are an estimated 10
million uninsulated suspended timber ground floors (Shorrock, 2005),(Dowson et al., 2012) with an estimated 6.5 million
and 4.5 million in France and Germany, respectively (Westoby, n.d., DStatis, 2013).
Insulating the millions of uninsulated floors in cold climate regions might lead to large carbon savings (Shorrock, 2005,
Power, 2008), supporting carbon reduction policies. Additionally, insulating floors might improve dwelling airtightness and
occupant thermal comfort (Pelsmakers, 2016, Saint-Gobain, 2014), but this remains poorly characterised at present. For
example, floor insulation was highlighted as a cost-effective carbon reduction measure by Shorrock (2005), and around
60% to 90% of the heat loss through suspended timber ground floors might be reduced by insulating them, depending on
interventions (Pelsmakers and Elwell, 2017). In England, between January 2013 and June 2015, around 200,000
suspended ground floor insulation measures were recommended (DECC, 2015a), though only 9,000 floors (or 0.5% of
identified floors) were actually insulated under the ECO-policy and under the (meanwhile withdrawn) Green Deal (DECC,
2015b). In the Netherlands and Austria it is estimated that the proportion of uninsulated suspended ground floors might be
as high as 57% and 70%, respectively (Meijer et al., 2009). The number of insulated and uninsulated floors in many regions
is currently not well recorded (Boardman, 2005, Meijer et al., 2009) and the actual impact of the insulation installations (i.e.
the thermal upgrade benefits and risks) remains poorly characterised.
In the UK a 150 mm minimum ventilation zone below the timber floor joists has been required since the 1860's-
1870's, to avoid rotting (Muthesius, 1984). Historic information is provided in Douglas (1997) and Douglas (1998c), who
notes that pre-1937 floors are unlikely to have damp-proof membranes. NBS (2013) provides guidance for moisture control
in ground floors in the UK: new suspended timber ground floors require damp-proof courses protecting the timbers and
usually a 100 mm concrete over-site ground cover to resist ground moisture, with the top of the over-site above external
ground level. The 150 mm minimum ventilated zone below the joists (or insulation) is still required at present, alongside the
requirement for ventilation openings to be 0.0015 m2 per meter exposed wall perimeter, or 500 mm2/m2 of floor area,
whichever is the greatest (NBS, 2013). BRE (1998) noted that existing floors often have less than the current minimum
recommended ventilation areas. Yet BRE (1998) and Douglas and Singh (1995) recommend that existing floors with no
over-site concrete need 0.0030 m2/m ventilation opening area and until the early 1970s this was also the requirement in
Scotland (Douglas, 1998a). It is however unclear what data these standards are based on and if such standards are

sufficient to prevent timber rot i, or whether they are overly cautious, leading to unnecessary heat loss and draughts.
Reduced void ventilation can also occur when (partially) blocking airbricks with insulating material, whether
intentionally to reduce heat loss, or unintentionally. However, obstructing or reducing floor void ventilation can lead to build-
up of moisture in the floor void (Rickaby, 2014, EST, 2006, BRE, 2000). Additionally, ventilation paths are likely to be
altered during retrofitting with insulation, reducing upward airflow from the void through gaps and cracks to the spaces
above (EH, 2010, Stephen, 1998). Insulating suspended ground floors leads to reduced winter heat loss to the external
environment through the floor void, which also leads to higher relative humidity due to colder floor voids. These changes to
the crawl space conditions might increase the risk of mould growth or timber decay as noted by for example Samuelson
(1994) and Lstiburek (2008) for new insulated suspended ground floor constructions in Sweden and the USA, respectively.
Mould spores can also transfer from the crawl space to the living spaces above, affecting occupant health (Airaksinen et
al., 2004).
Knowledge of the pre- and post-insulated hygrothermal floor void conditions is of great importance to avoid structural
damage and health issues. Hence in this study, empirical floor void data was collected to allow a preliminary investigation
into the hygrothermal conditions of both insulated and uninsulated floor voids and to compare with mould growth thresholds
found in the literature. The aim of the study was to combine and review current evidence related to floor void conditions
globally and to reinforce and extend this global knowledge by the empirical local data collection in 15 different UK floor
voids, the largest known sample of UK floor void conditions available. Additionally, an overview of practical monitoring
issues and protocols is provided. Firstly, a global overview of available evidence related to uninsulated floor void conditions
is presented, followed by a discussion of evidence available for insulated floors. Subsequently, the empirical data collection
campaign is described, including instrumentation and research and analysis methods, followed by presentation and
discussion of results. Special attention is given to a mould growth risk evaluation based on literature thresholds. Finally, a
concluding summary is provided, focusing on practical implications arising from the findings.
3. Uninsulated suspended ground floor void conditions: a review of evidence
In the UK, an increased risk of damp and mould problems in dwellings built pre-1919 has been reported (DCLG, 2010),
with around 5.8% of floors requiring repair of some kind (DCLG, 2010). In the USA, moisture problems have been reported
since the 1940s (Rose, 1994), leading to a more significant body of research than in the UK.

3.1. Potential sources of moisture build-up
Moisture build-up in pre-1919 suspended floors can come from a variety of sources, e.g.: moisture from the ground, lack of
external site drainage, leaks from services, impermeable floor finishes, external ventilation, floor insulation and surface
condensation; these are each briefly discussed below and illustrated in Figure 1.
Figure 1. Possible sources of moisture in pre-1919 suspended timber ground floors; letters refer to letters in text below.
A. Moisture from the ground: wet soil (e.g. due to high ground water level) or standing water in the floor void could
cause high evaporation rates and high relative humidity (RH) in the crawl space; this moisture can transfer to indoor
spaces above (Harris, 1995). In most existing suspended ground floors, no ground cover exists (Douglas, 1998c) and
evaporation from damp soil is considered a major source of moisture (Harris, 1995, Moses, 1954). In addition, joists
supported by brick walls can become damp when timber joists are in contact with soil (Tsongas, 1994). Damp joists can
also occur due to driving rain or 'splash back' or where joists are supported by walls with rising damp, especially a risk
without damp proof membranes (Harris, 1995, Oliver, 1997, Douglas, 1998b, Ridout, Tsongas, 1994) - see Figure 2 and
3. Ground soil can be a moisture source during cold season but can absorb some moisture during summer time
(Matilainen, 2003).

Figure 2. (left) and Figure 3. (right) illustrate a crumbling sleeper wall/dwarf wall in a Manchester (UK) crawl space, caused
by high ground moisture. Joists were laid on a damp-proof membrane (indicated by arrow) to prevent immediate contact;
while this protects from direct contact with damp surfaces, this does not protect from high RH in the floor void itself. Figure
3. Illustrates a DIY installation of the ground cover (indicated by arrow) to reduce evaporation of moisture from the ground;
in some cases condensation water can pool on the membrane, as was the case here.
B. Inadequate external site drainage and/or external ground level can be above floor level so that water can enter
floor voids (Rose, 1994, Brook, 1994, Oliver, 1997, Singh, 1998).
C. Leaks from services can occur above/below the floor or leaks from rainwater runoff pipes nearby (Brook, 1994,
Tsongas, 1994, Morton, 2013). Spillage from living spaces above is probably rare (Harris, 1995) and both spillages and
leaks are likely to be localised (Douglas, 1998b). However, this can still lead to localised mould growth as illustrated in
Figure 4.
Figure 4. Mould growth in the void area (indicated by arrow), caused by a leaking rainwater pipe, wetting the brick walls
down to foundations in a London (UK) crawl space. This leak occurred in the final 12 months of a 3 year monitoring period,
highlighting the dynamic nature of void conditions, and their interaction with whole house mechanisms.

D. Impermeable floor finishes might prevent moisture transfer to the spaces above where previously this was possible
and may induce a critical wood moisture content (BRE, 1991). This includes insulation materials and membranes in the
construction.
E. Ventilation plays a complex role in managing moisture risk. For example, moisture will be brought in from the
outside through airbricks and other non-airtight paths, but can also increase the swift dispersal of moisture build-up
(Kurnitski, 2001) especially in winter (Hill, 2005), though this may not always be effective (Harris, 1995). Douglas (1995)
acknowledges that even when voids are well ventilated, humidity can build up in void recesses. Furthermore, increased
ventilation leads to an increased evaporation rate from damp soil and other moist surfaces which can increase moisture
build-up in the floor void, despite increased ventilation rates (Harris, 1995, Kurnitski, 2000a). Furthermore, Hill (2005)
argues that ventilation on its own is insufficient to deal with significant amounts of moisture build-up in floor voids and
summer-ventilation can increase moisture build-up risk. In summer, warm, humid air enters the generally cooler floor void
thereby increasing RH; however, in winter, cold and more dry external air is warmed in the void, decreasing RH
(Vanhoutteghem, 2017, Richter and Staněk, 2015). The high thermal mass of the ground reduces the impact of the warm
summer air on increasing the temperature of the floor void: it is cooled and RH increases (Kurnitski, 2001, Airaksinen,
2003, Rose, 1994, Hill, 2005, Samuelson, 1994). This can lead to summer surface condensation in the void - see point F.
below.
A lack of void ventilation, e.g. due to sealed airbricks, is considered by many to be the cause of moisture build-up in floor
voids (Oliver, 1997, Burke, Douglas, 1998c, Douglas, 1998a, BRE, 1991, Singh, 1998). This (partial) sealing of airbricks
can occur when installing floor insulation (Figure 5); chamfering floor insulation could reduce this risk (Figure 6). However,
a sealed void is reported by others to prevent moisture build-up in summer (Rose, 1994, Samuelson, 1994, Lstiburek,
2004) for the reasons described above. Nevertheless, Kurnitski (2001) points out the difficulty associated with sealing
airbricks to control summer moisture ingress because air can enter the crawl space via other ventilation paths. All of these
observations are based on non-UK climates and constructions; for the UK climate, Oliver (1997) notes the increased risk of
condensation when sealing floor void air-vents in winter, especially when these are blocked in summer. Clearly, outdoor air
cannot dry the floor void if it infiltrates at a higher moisture content than the floor void itself and instead will bring moisture
in. Hence Kurnitski (2001) argues that if there is no moisture source in the void (i.e. if the void is 'moisture insulated') there
is no need to ventilate, but acknowledges that "any leakage in the moisture insulation can bring about high relative
humidity" (Kurnitski, 2001). Sealing of airbricks is considered undesirable when radon is present, however this discussion is
excluded here.

Figure 5. (left) and 6 (right) Illustrates a blocked airbrick, unintentionally caused by placing rigid insulation boards between
the joists. Figure 6. illustrates chamfering of the insulation to aid instead of obstruct airbrick airflow.
F. Installation of floor insulation might lead to colder void air and surface temperatures, impacting on void moisture
conditions (Samuelson, 1994, Airaksinen, 2003). In Finland, Airaksinen (2003) reported that floors with a typical U-value of
0.2 Wm-2K-1 had an average modeled void RH almost 10% higher than floors with 0.4 Wm-2K-1 U-value; the less insulated
floors were predicted to have a 2ºC warmer void air temperatures on average (Airaksinen, 2003). Section 4 discusses
insulating floors in more detail.
G. Surface condensation can occur when the void air reaches its moisture vapour saturation point at a given temperature
and condenses against surfaces in the void which are below the dew point temperature. This might occur especially in
summer when warm, humid air meets for example cold, uninsulated metal pipes or other cold surfaces (Lstiburek, 2008,
Hill, 2005).
3.2. Moisture risks in floor voids
3.2.1. Risk of mould growth and wood decay
The main danger of moisture build-up in floor voids is that it can lead to fungal growth and timber decay (Moses,
1954, Singh, 1998, Oliver, 1997). Most occupants do not notice the presence of fungal growth or timber decay until some
incident indicates its presence (Frankland, 1951), such as fine red dust (caused by dry rot spores) on floor surfaces
(Morton, 2013, Ridout) or springy floors (Singh, 1998) or failure of floorboards or floor joists (BRE, 1998).
The organisms of concern in floor voids are wood rotting fungi (such as dry and wet rot) and non-wood rotting
fungi, which either grow on timber or on other materials. Wood can have a high Wood Moisture Content (WMC) if directly in
contact with wet surfaces, but also due to a high ambient RH in floor voids: timber as a hygroscopic material will absorb
moisture from the atmosphere until in equilibrium with the surrounding air (Ridout, 2001). The lower the WMC, the less
susceptible the material is to decay (Oliver, 1997) and this is ideally below 15% WMC (Ridout, 2001) (or <75% RH (EH,
2010)). Timber decay does not generally occur below 22-24% WMC, often lowered to 20% as a safety measure (Ridout,
2001) (or equivalent to around 90% RH (EH, 2010)). EH (2012), on the other hand, reports that timber decay might not
occur below 28-30% WMC, which is associated with a relative humidity level of at least 95%.
Airborne spores can be a health hazard - see section 3.2.2. - but in all cases remedy and prevention of moisture
build-up and water penetration eventually kills the fungus (Ridout, 2001, Oliver, 1997) and reduces occupant exposure. Wet
rot requires higher moisture thresholds: 20-25ºC with WMC above 30% (Ridout, 2001, Douglas and Singh, 1995) (i.e.
~100% RH); with optimal WMC of 50-60% (Oliver, 1997). Dry rot is one of the most common fungi in buildings in the UK
(Douglas and Singh, 1995) and can grow rapidly at 21-23ºC with WMC of 30-40% (Douglas and Singh, 1995, Oliver, 1997),
requiring >90% RH at minimum 20ºC (Ridout, 2001). It can grow at lower thresholds, though decay will be slower; ideal
conditions for growth are RH of 99% (or 26-30% WMC) (Ridout, 2001). Dry rot’s food source is timber or other cellulose
based materials (Douglas and Singh, 1995) and it needs a source of calcium, which is present in damp cement/lime mortar
and in plaster (Ridout, Douglas and Singh, 1995), and other organic material, such as rock or glass wool insulation
(Douglas and Singh, 1995), commonly used in buildings (EH, 2010), including suspended floors. Dry rot also favours
stable, unchanging environments (Ridout, 2001).
For mould growth, thresholds are lower. Typically, mould growth can be initiated on timber in conditions of >70%
RH at room temperature (Oliver, 1997); however mould fungi do not tend to decay timbers but have superficial growth and
may stain surfaces (Ridout, 2001). Mould can grow on EPS and mineral wool insulation during long-term exposure to RH
>97% (Viitanen, 2007). At very high RH (> 97% RH or wet materials) bacteria also cause smell and health problems similar
to mould fungi (Viitanen et al., 2010). Even in dry air conditions, mould can grow on wet and nutrient rich surfaces. At
temperatures lower than 10ºC, which are less ideal for fungal growth, growth occurs slowly, but could "accumulate
considerably during years and decades in the life of a building" (Pasanen, 1991a), yet conditions are poorly characterised
for floor voids. In floor voids, RH conditions of 80-85% over several weeks or months can lead to mould growth as
temperatures are usually above 5ºC (Kurnitski, 2000b).
As timber rot requires higher RH conditions and usually longer exposure times compared to mould growth (Viitanen

et al., 2010), mould growth risk tends to be used as a threshold to evaluate a construction's condition (and thereby avoiding
more severe risks) (Airaksinen, 2003, Johansson, 2012, Sedlbauer, n.d., Viitanen et al., 2010, Hukka, 1999). Different
evaluation criteria can be found in the literature, ranging from single value thresholds (Gradeci, 2017, Johansson, 2014,
Sedlbauer, 2001) over isopleth systems (Smith, 1982, Sedlbauer, 2001, Clarke, 1999) to more sophisticated models
(Sedlbauer, 2001, Viitanen et al., 2010). Johansson (2014) states critical RH thresholds for wood (based) materials ranging
from 75% to 89% at 22°C and between 75% and 95% at 10°C. Sedlbauer (2001) concludes that the lowest humidity that
can induce mould growth in buildings is approximately 70%. The latter is also the lowest critical relative humidity in the
overview summarised by Gradeci (2017) whose literature review indicates critical RH between 70% and 85%.
Isopleths are curves of RH threshold as a function of the temperature (Figure 7). Simple isopleth curves, such as
used in the ESP-r model (Clarke, 1999, Rowan, 1999), or presented by Smith (1982) or Hens (1999), describe the lowest
conditions with significant mould growth risk and are specific to mould spore type. However, Sedlbauer (2001) developed a
lowest isopleth for mould (LIM), below which no mould will grow but also isopleths indicating the critical RH and
temperature threshold to initiate mould spore germination for a specified time (e.g. 1, 2, 4,… days). Additionally, Sedlbauer
(2001) developed isopleths indicating the mould growth (in millimeters) per day as a function of the relative humidity and
temperature. Isopleths for specific types of moulds, different health hazardous classes (health class A, B and C) as well as
material substrates (substrate category 0 till III) can be found in literature. Figure 7 gives a comparison of a selection of
lowest isopleths for mould growth: (1) the ESP-r threshold for xerophilic ii mould spores, (2) Sedlbauers’ LIM-curves for
substrate category I (biologically recyclable building materials), substrate category II (building materials with porous
structure such as certain wood species) and health class B/C (fungi that are pathogenic when exposed to over a long
period and fungi that are not pathogenic) and (3) the critical threshold suggested by (Hens, 1999). Additionally, the critical
relative humidity level as included in the VTT model is shown (Hukka, 1999).
Figure 7. Comparison of a selection of isopleths (ESP-r and Sedlbauer) and the critical relative humidity included in the
65
70
75
80
85
90
95
100
0 10 20 30 40
Rela
tive
hum
idity (
%)
Temperature ( C)
ESP-r xerophilic
LIM B/C
LIM I
LIM II
Hens
Critical RH VTT original
Sedlbauer

VTT model.
Predicting mould growth based on the single value thresholds and the isopleths is challenging because in-situ conditions
affecting mould growth usually fluctuate with the (e.g. diurnal and seasonal) weather conditions; this is especially the case
for the dynamic floor void conditions. For example, an interim drying out of the mould spores cannot be taken into account
in such predictions. A possible way to deal with fluctuating conditions could be applying Moon’s germination graph method
(Moon, 2005), though the way a transition from favourable to unfavourable conditions and vice versa is included in this
method deviates from practice (Vereecken and Roels, 2012).
To enable a prediction or evaluation of the mould growth risk under dynamic conditions, within years, more sophisticated
mould prediction models are usually used. In this respect, the VTT model (Hukka, 1999) and the WUFI-Bio biohygrothermal
model (Sedlbauer, 2001, Krus, 2007, WTA, 2006) are two models frequently applied in the building physics field
(e.g.(Airaksinen, 2015, Langmans, 2015, Holzhueter, 2017)). As is the case for the single threshold values and the isopleths,
these more sophisticated mould prediction models are mainly developed based on controlled – steady state – laboratory
studies (Oreszczyn, 1999). Despite focusing on wood not commonly used outside Scandinavia and despite exclusion of dust
contaminated samples (Vereecken and Roels, 2012), which are likely to be found in floor voids, the benefit of the VTT-model
is that it has been validated with in-situ monitored floor void mould growth and temperature and RH profiles typically found in
(Finnish) floor voids (Airaksinen, 2013). The WUFI-Bio biohygrothermal model, however, is limited to indoor building surfaces
(Sedlbauer, 2017), as also discussed by Marincioni (2017); floor void environments are likely characterised by lower air and
surface temperatures and seasonally different RH conditions than the internal surfaces assumed in WUFI-Bio. Ultimately, the
big differences between lab and in-situ conditions can make mould growth predictions unreliable and variant between models
(Vereecken and Roels, 2012, Vereecken et al., 2015, H. Altamirano-Medina, 2009). Therefore, in the current study a
preliminary assessment of the 15 floor void conditions is performed based on the critical (isopleth) thresholds only (see
section 5.2).
3.2.2. Floor void moisture build-up and potential health impacts
Occupant health might be affected prior to any visual manifestation of issues, as contaminants (such as fungal
spores, microbes and bacteria which can thrive in moist environments) can be transferred from the floor void into living
spaces as noted most recently by among others, Kroger (2007), Hill (2005), Airaksinen et al. (2004), Lilly (1988), McGrath
(1996), Coulter (n.d.) and Frankland (1951). Dampness and mould exacerbate asthmatic conditions (Frankland, 1951,
WHO, 2009) and fungal spores are associated with respiratory problems (Park et al., 2004, Verdier et al., 2014). Moist
environments can also give rise to the production of MVOCs (Microbial Volatile Organic Compounds) by fungal and
microbic organisms (Paavilainen, n.d.) which can affect human health (Korpi et al., 2009, Fiedler et al., 2001). As such the
transfer of air from contaminated floor voids into internal spaces is a significant concern for occupant health (Airaksinen,
2007).
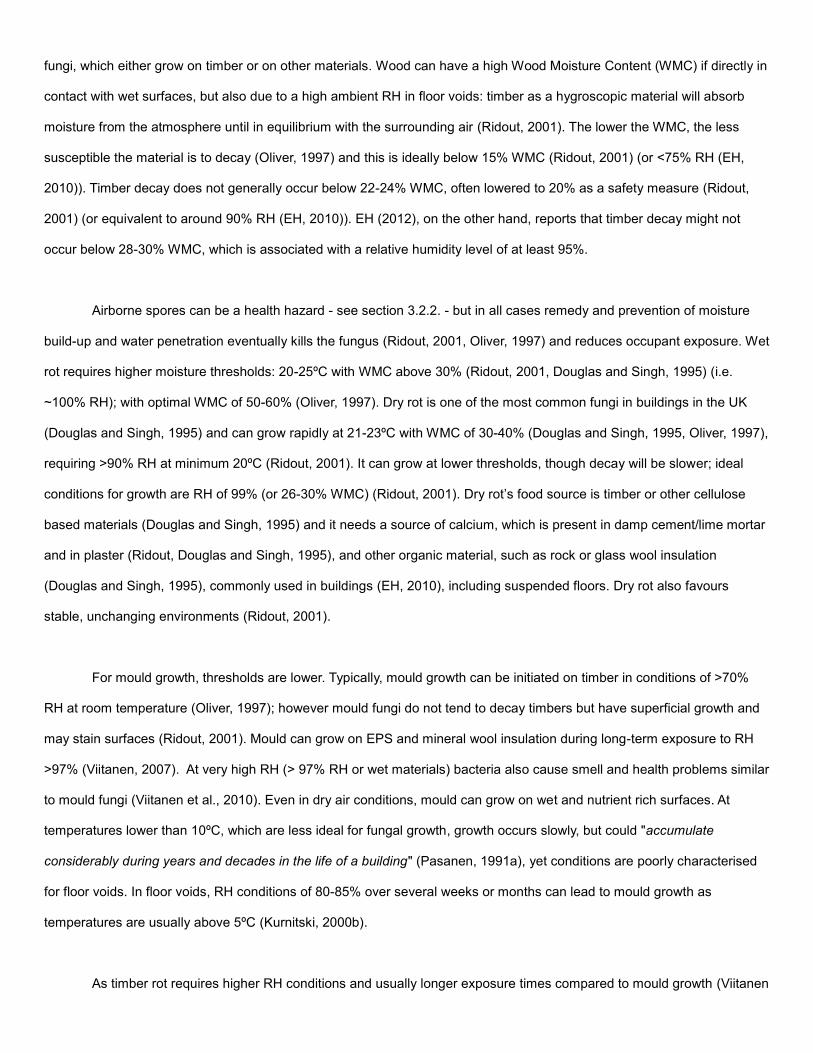
In Finland, fungal spores in insulated floor voids were observed to be 10 times higher than internal spaces; usually
highest on timber materials. These microbial and fungal contaminants can then be transported from the floor void to the
indoor spaces, which are continuously mechanically ventilated (Airaksinen, 2003). Stack-effect driven airflow from void to
internal spaces was observed in naturally ventilated dwellings in the UK (Hartless, 1999, Hill, 2005). Both stack-driven and
wind-driven infiltration from the void is likely to find its way into internal spaces (Hartless, 1994), enabling the spread of
fungal spores in living spaces (Figure 8). However, with an airtight floor, no fungal spore transfer was observed through
concrete and EPS or PUR layers (Viitanen et al., 2010), while through solid concrete floors, the air infiltration is less or even
negligible depending on construction (Sherman, n.d.). However, for timber floors: "penetration of fungal spores is difficult to
control by sealing and by controlling the airtightness of the building envelope" (Airaksinen, n.d.). Balanced building
ventilation with equal air intake and extract might be an effective measure instead (Airaksinen, n.d.).
Figure 8. Sources of mould and microbial growth could transfer to internal spaces - diagram adapted from
(Airaksinen, 2003).

4. Insulated suspended ground floor void conditions: a review of evidence
Insulated ground floors are poorly characterised at present, however some sources refer to the potential increased
risk of moisture build-up in insulated suspended ground floors. For example, Shrubsole (2014) and others
(Energy_Solutions, n.d.) note that adding floor insulation can increase the risk of unintended consequences, such as
condensation on service ducts and pipes, potentially leading to mould growth and timber decay (Coulter, n.d.). Insulated
floor void spaces in Finland experienced optimal conditions for fungal growth (Hukka, 1999, Pasanen, 2001), especially
with high (>80%) RH in summer, regardless of the ground cover and with temperatures in the floor voids between 10ºC and
17ºC (Pasanen, 2001). In the USA there are reports that insulated floors have moisture issues, in some cases leading to
mould growth and wood rot (Lstiburek, 2008, Hill, 2005, Flynn, 1994, Coulter, n.d., ASHRAE, 1994). However, Harris (1995)
suggests that condensation risk in insulated floors might be minimal. Similarly, Tsongas (1994) reported almost non-existent
long-term moisture-related issues for a varied sample of 121 floor voids (insulated, uninsulated, ventilated and
unventilated) in 5 different locations in the Northwest of the USA. Timber decay (including historic) was only observed in a
few floors with plumbing leaks or on wood in contact with soil.
High summer humidities were reported in insulated floor voids in Sweden and Finland (Burke, Matilainen, 2003, Kurnitski,
2000b), in the USA (Coulter, n.d., Lstiburek, 2008) and in a test cell in Germany (Werther, 2010). Tsongas (1994)
associates the moisture-issue absence in the 121 floor void sample due to the local climate's dry summers unlike in other
regions of the USA. Furthermore, summer surface condensation can be exacerbated by uninsulated air-conditioning ducts
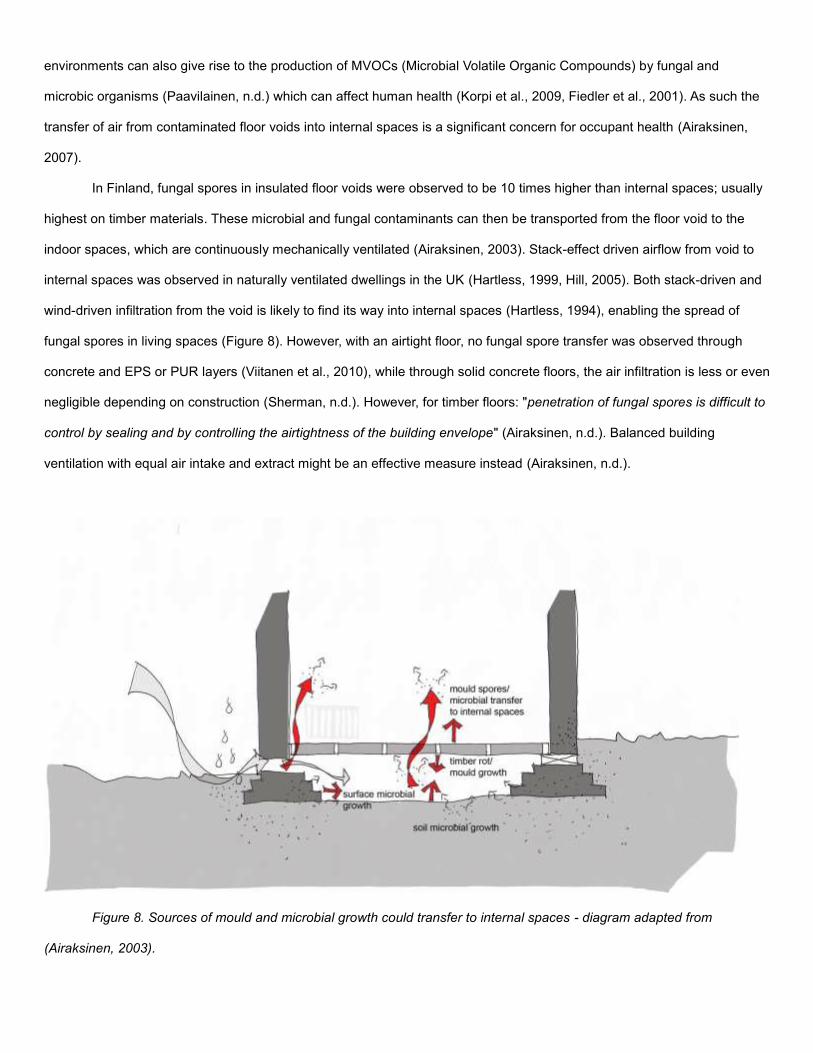
running through the floor voids (Lstiburek, 2008, Tsongas, 1994). Table 1 presents insulated floor void condition data as
measured in Nordic counties and highlights that in several cases critical mould growth thresholds are met or exceeded.
VOID
temperature
(ºC)
VOID RH
(%) Source + notes
10 to 17ºC
60-95%
Pasanen (2001), measured May to September; mid-summer
highest RH; above 80% RH for 8 weeks. Different ground
covers; assumed insulated floors (not explicitly stated).
n/a
90-95% summer near
foundation walls
60-70% in winter near
foundation walls
Samuelson (1994), insulated floor; ventilated void; study of
the effect of different ground covers as measured
80-90% both summer &
winter, with ground insulation
Air Temp:
7-19.5ªC
68%-88% no ground cover
50%-75% plastic ground
cover
Kurnitski (2000b), approximate RH and void air temperature,
as measured
n/a 67%-84% natural ventilation
Kurnitski (2001), modelled
Table 1. Observed void conditions in dwellings subjected to Nordic climate and usually over several seasons; typically
based on insulated floor voids.
Whether the floor void conditions reach or exceed critical mould growth thresholds will depend on many variables and
characteristics, including winter but especially summer climate, floor insulation thickness and characteristics, ventilation
and construction, alongside the presence of moisture sources, presence of (uninsulated) services in the void and moisture
management solutions. Some possible floor void moisture management includes: ground covers, ground insulation, and
mechanical void ventilation when void conditions reach critical levels (Airaksinen, 2003, Samuelson, 1994). However,
without further evidence and research that takes these different variables into account, no clear conclusions can be drawn
on the nature of the increased moisture build-up risk in insulated suspended ground floors. Note that insulating floors could
also lead to other unintended consequences, such as an increased fire risk if old electrical wires are embedded, a risk of
burst water pipes in colder voids (EH, 2010) and radon build-up (Lugg, 1997) - see Figure 9.
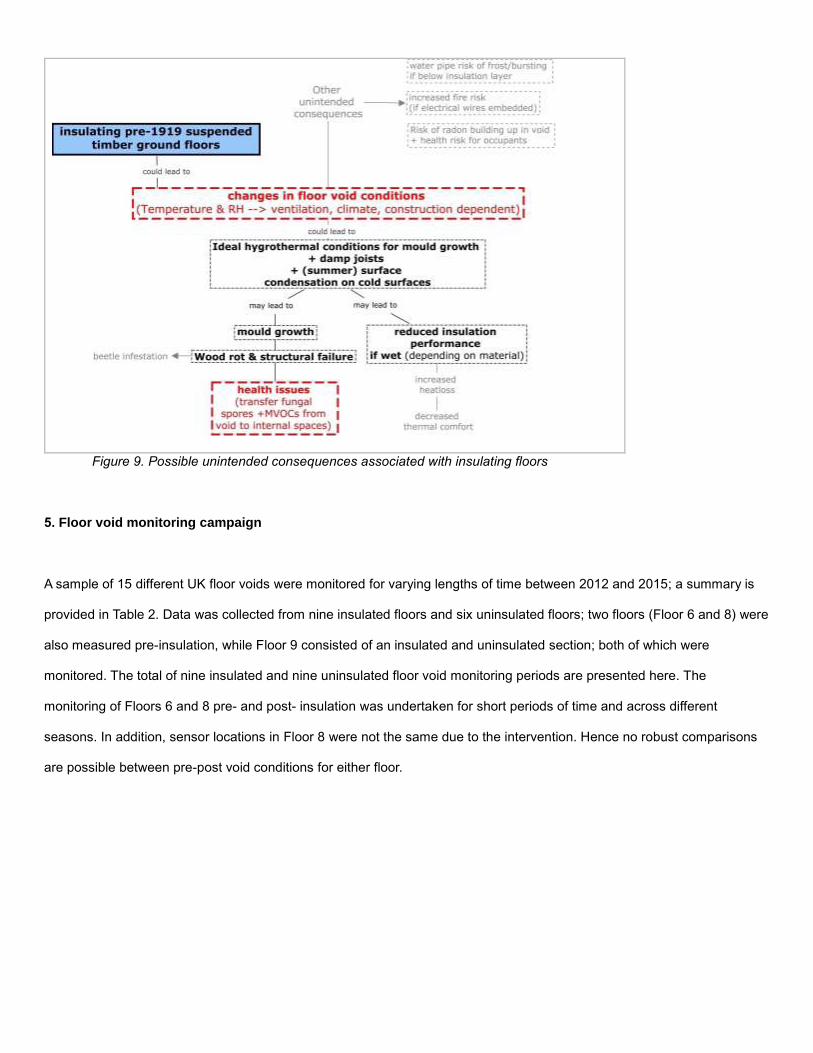
Figure 9. Possible unintended consequences associated with insulating floors
5. Floor void monitoring campaign
A sample of 15 different UK floor voids were monitored for varying lengths of time between 2012 and 2015; a summary is
provided in Table 2. Data was collected from nine insulated floors and six uninsulated floors; two floors (Floor 6 and 8) were
also measured pre-insulation, while Floor 9 consisted of an insulated and uninsulated section; both of which were
monitored. The total of nine insulated and nine uninsulated floor void monitoring periods are presented here. The
monitoring of Floors 6 and 8 pre- and post- insulation was undertaken for short periods of time and across different
seasons. In addition, sensor locations in Floor 8 were not the same due to the intervention. Hence no robust comparisons
are possible between pre-post void conditions for either floor.


Table 2. Summary of uninsulated and insulated floor void monitoring sample and number and specification of sensors per
floor and monitoring timeline. Use of HOBO U12 sensors (±0.35ºC and ± 3% RH, up to 95% RH) unless stated otherwise.
Note that the measured floor void ventilation generally fell below current UK building codes of 0.0015 m2/m.
5.1. Research methods and sampling
All ground floor crawl spaces were located in the UK and were of suspended timber construction; one floor had a
basement underneath (Floor 10). Three of the insulated floors had sealed airbricks (Floors 11, 13, 15), while all the other
floors were naturally ventilated through the airbricks. The floor void of Floor 11 and 15 were fully-filled with EPS insulation
beads. Sample size was limited by availability of accessible floors.
There are many different dwelling and floor archetypes, and each floor is subject to different variables, so that a
comparison between floors remains difficult. Due to this diversity, and the statistically small sample of 15 floors, the floors
would not be representative of the wider population, even if randomly sampled. However, the intention of the study was not
to compare the floors with each other, but rather to explore the seasonal and spatial conditions in different floor voids, and
compare this to literature thresholds, as well as to contribute to methodological insights and implications to support future
studies. Given that the purpose of the study was to explore and to gain an increased understanding of different floor void
conditions, and methodological implications, case studies were identified by convenience or self-selection sampling.
Hence, some ‘extreme’ cases (Saunders, 2009) were monitored; for example some insulated floors were included after
stakeholders approached the authors wishing to participate due to previously identified issues with moisture build-up in the
floor void (e.g. Floors 13, 14 and 15), or concern about the impact of the insulation intervention on the void condition (Floor
11). Additionally, the sample includes floors with bead-filled voids and sealed airbricks (e.g. Floor 11) as well as monitoring
of void conditions with a history of dampness and/or mould growth (Floors 11, 13, 14, 15), and this further contributed to an
intentional heterogeneous selection of cases with many different variables. Given the purposeful inclusion of cases with
historical mould risk factors, the study was able to provide insights into the characteristics of non- and “at risk” voids,
exploring the methodological implications and the variation of floor void conditions. To abide by research ethics, any
potential identified risk to human health or structure was shared with property owners as soon as this became apparent
from data collection or visual inspection.
Instrumentation
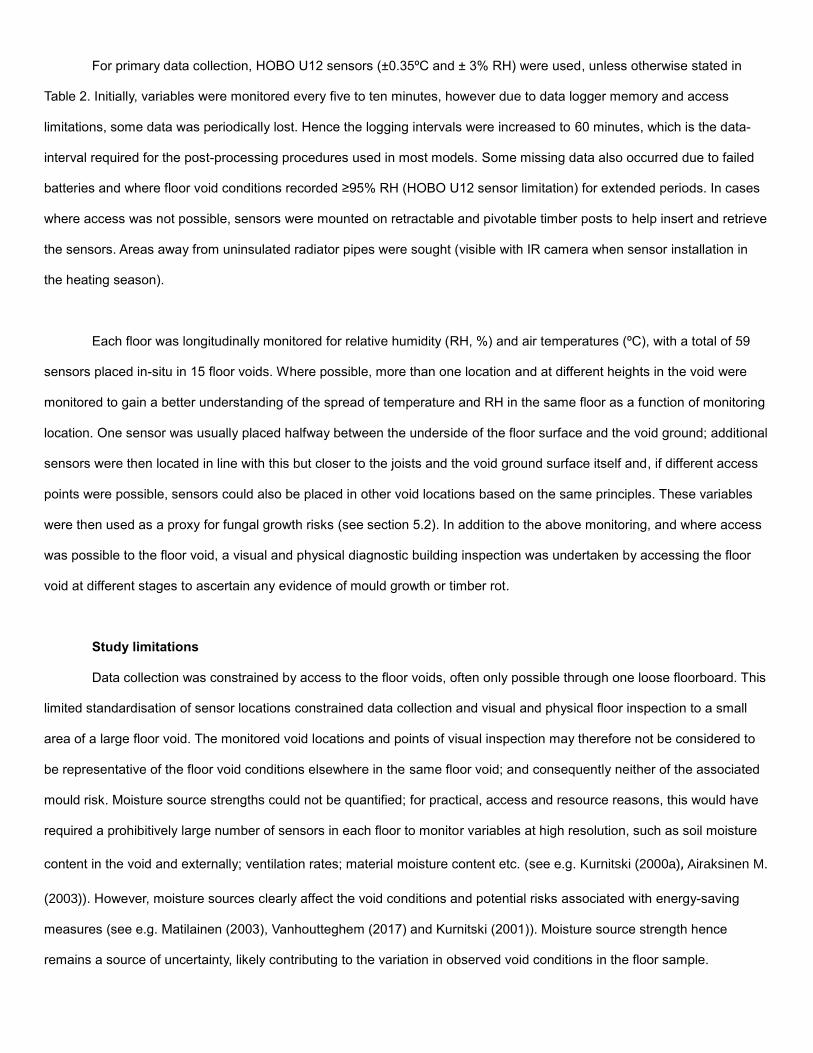
For primary data collection, HOBO U12 sensors (±0.35ºC and ± 3% RH) were used, unless otherwise stated in
Table 2. Initially, variables were monitored every five to ten minutes, however due to data logger memory and access
limitations, some data was periodically lost. Hence the logging intervals were increased to 60 minutes, which is the data-
interval required for the post-processing procedures used in most models. Some missing data also occurred due to failed
batteries and where floor void conditions recorded ≥95% RH (HOBO U12 sensor limitation) for extended periods. In cases
where access was not possible, sensors were mounted on retractable and pivotable timber posts to help insert and retrieve
the sensors. Areas away from uninsulated radiator pipes were sought (visible with IR camera when sensor installation in
the heating season).
Each floor was longitudinally monitored for relative humidity (RH, %) and air temperatures (ºC), with a total of 59
sensors placed in-situ in 15 floor voids. Where possible, more than one location and at different heights in the void were
monitored to gain a better understanding of the spread of temperature and RH in the same floor as a function of monitoring
location. One sensor was usually placed halfway between the underside of the floor surface and the void ground; additional
sensors were then located in line with this but closer to the joists and the void ground surface itself and, if different access
points were possible, sensors could also be placed in other void locations based on the same principles. These variables
were then used as a proxy for fungal growth risks (see section 5.2). In addition to the above monitoring, and where access
was possible to the floor void, a visual and physical diagnostic building inspection was undertaken by accessing the floor
void at different stages to ascertain any evidence of mould growth or timber rot.
Study limitations
Data collection was constrained by access to the floor voids, often only possible through one loose floorboard. This
limited standardisation of sensor locations constrained data collection and visual and physical floor inspection to a small
area of a large floor void. The monitored void locations and points of visual inspection may therefore not be considered to
be representative of the floor void conditions elsewhere in the same floor void; and consequently neither of the associated
mould risk. Moisture source strengths could not be quantified; for practical, access and resource reasons, this would have
required a prohibitively large number of sensors in each floor to monitor variables at high resolution, such as soil moisture
content in the void and externally; ventilation rates; material moisture content etc. (see e.g. Kurnitski (2000a), Airaksinen M.
(2003)). However, moisture sources clearly affect the void conditions and potential risks associated with energy-saving
measures (see e.g. Matilainen (2003), Vanhoutteghem (2017) and Kurnitski (2001)). Moisture source strength hence
remains a source of uncertainty, likely contributing to the variation in observed void conditions in the floor sample.

Additionally, the large number of different variables in the sample limits interpretation of differences in floor void conditions
between floors; especially the intentional inclusion of 'problem' floors limits comparison between insulated and uninsulated
floor void conditions. In several floors only short-term monitoring was possible; but this is not a good indicator of floor void
conditions: as described in previous sections. Clearly, the short monitoring periods for certain floors in this study do not
provide mould risk insights over all seasons e.g. monitoring over summer may overestimate mould growth risk, while
monitoring over winter may underestimate the risk.
Additionally, due to practical and resource issues, this study monitored air temperatures and relative humidities, while most
models use surface conditions to evaluate mould growth risk; this creates uncertainty about the use of air temperature
conditions as a proxy for surface conditions. In this respect, Vereecken et al. (2015) mentioned the potential difference
between air and surface relative humidity: an equilibrium between air and surface RH will, especially for short RH
fluctuations, not be achieved, which can have an impact on the mould risk assessment. Additionally, (H. Altamirano-Medina,
2009) reported that surface RH may be 10% higher than surrounding air RH for internal room surfaces of new dwellings;
however the impact for floor voids is unknown. The difference between surface and air conditions will be largest for the
uninsulated floors, because the addition of insulation in insulated floors reduces the relative impact on void conditions of
the house interior, compared to the surfaces within the void (see e.g. Airaksinen M. (2003)). The difference will depend on
several factors such as the room temperature, the insulation’s thermal performance, the presence of a ground cover, etc.
and will be location dependent, which again requires spatial monitoring to enable a thorough surface temperature mapping.
The difficulty of the determination of the surface conditions is clear from the use of air conditions instead of surface
conditions in other crawl-space studies (e.g. Laukkarinen and Vinha (2017), Kurnitski (2000a), Airaksinen M. (2003);
Matilainen (2003) and Flynn (1994)); the complication of measuring ground surface temperatures and RH is noted by e.g.
Kurnitski (2000b).
Finally, handheld two-pin wood moisture content (WMC) meters were initially used (after e.g. Stiles (1994)); however,
depending on the timber, its treatment and prior exposure to damp, as well as how deep and whether measured in the
grain or against the grain, a significantly different WMC was obtained for the same joist location (see also e.g. Straube
(2002), outside the instrument accuracy and across different thresholds, which made the interpretation of results unreliable,
they are not included here.
5.2. Hygrothermal conditions in uninsulated and insulated voids: Results and discussion
Analysis of yearly temperature and RH conditions
Tables 3 and 4 present the mean RH and void temperatures for all the sensors combined per floor void for the
uninsulated and insulated floors, respectively. Additionally, these conditions are compared to some of the isopleth
thresholds presented in section 3.2.1 to evaluate potential mould growth risk. In this comparison, the longest period of
consecutive threshold exceedance (in hours) is indicated. If no exceedance of the threshold takes place, this is indicated by
a green colour in Tables 3 and 4. If the threshold is exceeded for a period of less than 30 consecutive days, this is indicated
in orange, while a red colour indicates that the threshold is exceeded for at least 30 consecutive days. As previously
described, mould growth tends to occur at lower moisture thresholds and is a precursor of wood-rotting fungi, which require
higher moisture requirements. Hence evaluating floor void conditions based on the risk of mould growth contamination
minimises adverse occupant health impacts from possible fungal spore transfer to living spaces, while simultaneously also
reducing risk of structural damage caused by wood-rotting fungi. Mould growth risk has also been used by most research in
this area to evaluate a construction's condition (Airaksinen, 2003, Hukka, 1999, Viitanen et al., 2010, Sedlbauer, n.d.,
Johansson, 2012).
The uninsulated floors were slightly warmer on average than insulated floors (i.e. five of the nine uninsulated floors
had a mean temperature of 16ºC or 17ºC), given that they were conditioned by heat loss from above. While both insulated
and uninsulated samples have a mean void temperature of approximately 15ºC, eight of the nine insulated floor void
conditions had void temperatures ≤15ºC. This lower void temperature for insulated floor voids becomes even more clear
when focusing on the measurements during winter only, resulting in a lowest mean temperature of 9.9°C for the insulated
floor voids and 11.8°C for the uninsulated floor voids (not explicitly mentioned in Tables 3 and 4). The mean temperatures
during winter for all the insulated floor voids was 12.9°C, compared to 13.3° for the uninsulated floor voids, where the
former value was influenced by the bead-filled floors (Floor 11 and Floor 15) and the shorter (and warmer) winter period
measurement on Floor 13 (when excluding Floor 11, 13 and 15, the value of 12.9°C is reduced to 12.0°C). Due to the
colder void conditions as well as self-selected sample of ‘historically damp’ floors in the insulated floor sample, it is
unsurprising that the mean RH in these insulated floor voids ranges between 73% to 93% over their monitored periods,
which is more humid than the uninsulated floors with a mean RH between 66% and 94%. High RH conditions were
observed in Floor 1 and 9; Floor 1 had a rainwater pipe leak and water ingress into the floor void during the monitoring
period; Floor 9 had blocked ventilation paths, which may explain moisture build-up. Note that the moisture issues in Floor 1
occurred in the final 12 months of a 3 year monitoring period, highlighting the dynamic nature of floor void conditions, and
their interaction with whole house mechanisms. Excluding ‘damp’ Floors 1 and 9 in the uninsulated sample leads to
reduced RH ranges between 66 and 79%. As previously described, the differences between floors and
insulated/uninsulated floor void conditions might be due to sampling strategy and do not constitute evidence of insulated
floors being subject to increased moisture risk. Furthermore, the floors were monitored over different seasons, which also
impedes a clear comparison.
Comparison of the uninsulated and insulated floor void sample with other existing UK floor void data is not possible
due to the absence of such data; comparison with the Nordic sample of insulated floor voids indicates that the ranges
observed here for the entire sample (13ºC to 18ºC and 66% to 94% RH on average) are within the ranges in Table 1, which
indicates a relative humidity ranging from 50% to 95%, depending on source and void characteristics and monitoring
season. As expected, Finnish floor voids have lower minimum temperatures due to the colder climate (and inclusion of
mainly insulated floors). As indicated in Tables 3 and 4, the mean individual sensor readings are similar for uninsulated and
insulated floors and slightly elevated compared to the Nordic floor sample (Table 1). Given the difference in climatic and
constructional characteristics, no robust conclusions can be drawn from this. Clearly, further monitoring in more floor voids
is required to establish if these trends are also observed in the wider stock.
Evaluating the potential mould growth from the observed RH and temperature-conditions based on some of the
critical thresholds presented in section 3.2.1, indicates that the choice of mould risk evaluation criterion has an important
impact on the results. The lowest isopleth for the hazardous class B/C (LIM B/C) indicates a possible mould growth risk
starting from lower RH levels (see Figure 7) and thus results in a higher mould growth risk compared to the other
thresholds. Also based on the other thresholds in combination with a critical exposure time of 30 days, several floors are
found to include a mould growth risk (indicated by the red color in Table 3 and 4). Here, the critical exposure time of 30
days is an assumption made based on criteria for indoor spaces (IEA, 1990) and on the distance between Sedlbauers’ LIM
and his other isopleth curves, indicating the mould growth initiation after 1, 2, 4, 8 and 16 days. Despite the prediction of a
mould growth risk for some of the floors, in practice only in one case of the seven visually inspected floor voids (Floor 1)
was mould growth observed; though this was attributed to a leaking pipe (see Figure 4). Floors 11, 13, 14 and 15 were a
purposively-selected sample due to homeowner concern about dampness history. The floor void conditions in floors 13, 14
and 15 suggest that dampness issues may still be a problem. For Floor 11, the predicted risk seems to largely depend on
the location in the floor. Apart from these floors, comparison with the selected thresholds also suggests potential mould
growth risk in the insulated Floors 6, 8, 9, 10 and 12; mould growth was not visually observed during data collection
periods, however this does not mean there was no microscopic growth or that no mould growth took place during periods
without visual observations. Finally, as with the RH and temperature conditions, the monitoring and inspection interval and
period can have an impact on the predicted mould risk indicated in Table 3 and 4. A short measurement period (e.g. for the
uninsulated Floor 6) or sampling during winter (e.g. uninsulated Floor 6 and some locations in the insulated Floor 6) could

result in an under (or over-) estimation of the mould growth risk. A closer look at the seasonal variability is given in the next
section.
Table 3. Mean void RH and temperature for all the sensors in the uninsulated floors, combined per floor and
RHmean Tmean
(%) (°C) LIM B/C LIM I LIM II RHcrit VTT 80%
1 82 13 132 W, SP, SU, A 977 758 742 742 742
2 72 15 633 W, SP, SU, A 2738 1203 1170 1181 1204
3 94 15 791 W, SP, SU, A 16236 14893 13359 14367 15687
4 91 12 138 W, SP, A 1801 1577 1151 1527 1577
5 98 12 138 W, SP, A 3309 1585 958 1528 3309
6 94 12 138 W, SP, A 1511 989 958 958 2378
7 89 11 98 W, SP, A 2351 1554 490 788 2350
MEAN 89 13
8 69 17 726 W, SP, SU, A 1058 259 106 77 115
MEAN 69 17
9 66 17 520 W, SP, SU, A 462 183 64 49 80
MEAN 66 17
10 74 16 369 W, SP, SU, A 3596 1603 479 367 515
11 72 16 369 W, SP, SU, A 3556 1419 467 144 476
12 74 17 262 W, SP, SU, A 3593 2023 811 838 838
13 74 16 369 W, SP, SU, A 3685 695 440 246 462
MEAN 74 16
14 83 18 151 SP, SU, A 3617 1847 1622 1619 1619
15 73 19 151 SP, SU, A 425 138 62 60 60
16 79 15 151 SP, SU, A 1110 687 360 0 362
17 80 15 151 SP, SU, A 711 447 357 0 359
MEAN 79 17
20 77 9 13 W 96 29 7 0 30
21 72 10 13 W 35 15 0 0 13
22 62 13 13 W 0 0 0 0 0
23 78 13 6 W 99 20 8 0 13
24 74 13 6 W 81 10 3 0 10
25 67 14 6 W 0 0 0 0 0
MEAN 72 12
37 72 15 343 W, SP, SU, A 326 178 90 10 144
38 72 13 118 W, SP 125 0 0 0 0
39 72 12 107 W, SP 66 0 0 0 0
MEAN 72 13
40 73 16 25 SU, A 121 63 7 0 18
41 72 16 25 SU, A 123 64 14 0 19
MEAN 72 16
44 94 14 117 SU, A 2819 2819 1397 1779 1780
MEAN 94 14
UNINSULATED FLOOR SAMPLES
Floor 1
Floor 2
Floor 3
Visual mould
growthSensor
Total days
(excl. NaN)Season
Longest period of consecutive threshold
exceedance (h)
no
n/a
yes
no
n/a
no
n/a
no
Floor 4
Floor 5
Floor 6
Floor 7
Floor 8
Floor 9 n/a

comparison to the critical thresholds according to a selection of (lowest) isopleths for mould growth (see Figure 7).
Additionally, a constant RH of 80% is applied as a threshold. Green is assigned if no exceedance of the threshold takes
place, orange if the threshold is exceeded for a period less than 30 consecutive days; and red if the threshold is exceeded
for at least 30 consecutive days. Additionally, for each sensor the longest period of consecutive threshold exceedance is
indicated (in hours). As the length of the measurement period and the sampled season can have an impact on the
predicted mould risk, also the total experimental time (with exclusion of NaN-values) and the sampled seasons are
indicated (W = Winter, SP = Spring, SU = Summer, A = Autumn). The mean temperature of all insulated floors was 15ºC,
the mean relative humidity was 76% RH.

Table 4. Mean void RH and temperature for all the sensors in the insulated floors, combined per floor and
comparison to the critical thresholds according to a selection of (lowest) isopleths for mould growth (see Figure 7).
Additionally, a constant RH of 80% is applied as a threshold. Green is assigned if no exceedance of the threshold takes
place, orange if the threshold is exceeded for a period less than 30 consecutive days; and red if the threshold is exceeded
for at least 30 consecutive days. Additionally, for each sensor the longest period of consecutive threshold exceedance is
RHmean Tmean
(%) (°C) LIM B/C LIM I LIM II RHcrit VTT 80%
26 82 10 480 W 480 278 1 0 315
27 76 12 480 W 378 1 0 0 1
28 73 12 480 W 20 0 0 0 0
29 77 10 552 W 68 38 17 0 65
30 73 10 552 W 32 17 10 0 18
31 69 12 552 W 11 0 0 0 0
32 76 13 122 W 59 10 0 0 0
33 76 12 122 W 97 0 0 0 0
34 73 13 122 W 7 0 0 0 0
35 79 15 5543 (W), SP, SU, A 523 258 157 42 175
36 81 16 5543 (W), SP, SU, A 3010 2282 644 728 728
MEAN 76 12
42 71 12 5166 W, SP, SU, A 494 106 47 0 51
43 76 14 9912 W, SP, SU, A 3443 858 278 0 329
MEAN 74 13
45 81 15 2819 SU, A 1468 695 260 0 315
MEAN 81 15
46 84 15 2413 W, A 2413 1973 1189 1891 1891
47 82 15 3619 W, A 3619 2046 1493 1954 1955
MEAN 83 15
48 89 15 13825 W, SP, SU, A 11776 9392 4329 6517 6517
49 76 16 17101 W, SP, SU, A 3712 1698 1275 1397 1398
50 66 17 3618 W, SP, SU, A 516 60 0 0 0
51 66 19 5038 W, SP, SU, A 301 90 0 0 0
52 66 18 10124 W, SP, SU, A 717 169 11 0 19
53 73 15 5086 W, SP, SU, A 728 693 119 0 136
54 75 17 5086 W, SP, SU, A 1902 356 32 0 43
MEAN 73 17
55 81 14 6359 W, SP, SU, A 760 344 229 0 318
MEAN 81 14
56 84 16 1177 W, SP 1177 1177 958 1001 1001
57 98 15 1177 W, SP 1177 1177 1177 1177 1177
58 97 14 1177 W, SP 1177 1177 1177 1177 1177
MEAN 93 15
59 86 14 11764 W, SP, SU, A 8803 4710 1097 1204 1225
MEAN 86 14
60 86 16 5700 W, SP, SU, A 3707 3030 2986 2996 2998
61 94 14 5699 W, SP, SU, A 5699 5699 3884 5699 5699
MEAN 90 15
SensorTotal days
(excl. NaN)Season
Longest period of consecutive threshold
exceedance (h)
Floor 11 n/a
Floor 12 no
INSULATED FLOOR SAMPLES
Floor 10 no
Floor 9 n/a
Visual mould
growth
Floor 6 no
Floor 8 n/a
Floor 13 n/a
Floor 14 no
Floor 15 n/a

indicated (in hours). As the length of the measurement period and the sampled season can have an impact on the
predicted mould risk, also the total experimental time (with exclusion of NaN-values) and the sampled seasons are
indicated (W = Winter, SP = Spring, SU = Summer, A = Autumn). The mean temperature of all insulated floors was 15ºC,
the mean relative humidity was 82% RH.
Seasonal analysis
Four uninsulated floors and three insulated floors were measured for at least 12 months. As an example, Figure 10
and 11 show the seasonal void RH and temperature for some locations in these uninsulated and insulated floors. In general
and as reported elsewhere, floor voids were warmer and had higher RH in summer (21st June to 21st September) than in
winter (21st December to 21st March), and this was the case for both insulated and uninsulated floor voids (see also Table
5 and 6). An exception to this is uninsulated Floor 1, which has higher RH in autumn and in winter than in summer, likely
due to a rainwater pipe leakage in the last year of monitoring, which led to moisture build up over time and mould growth on
the brick foundation wall - see Figure 4. For the insulated floors (Figure 11, Table 6), void conditions have generally similar
or lower RH during autumn than in summer, despite being colder. Exceptions to this are sensors 48 and 54 in Floor 11
(Table 6); the conditions in Floor 11 where measured in the bead filled void with sealed airbricks.
Figure 10: Seasonal void relative humidity and temperature for uninsulated floors: (a) Floor 1 (sensor 2), (b) Floor 2
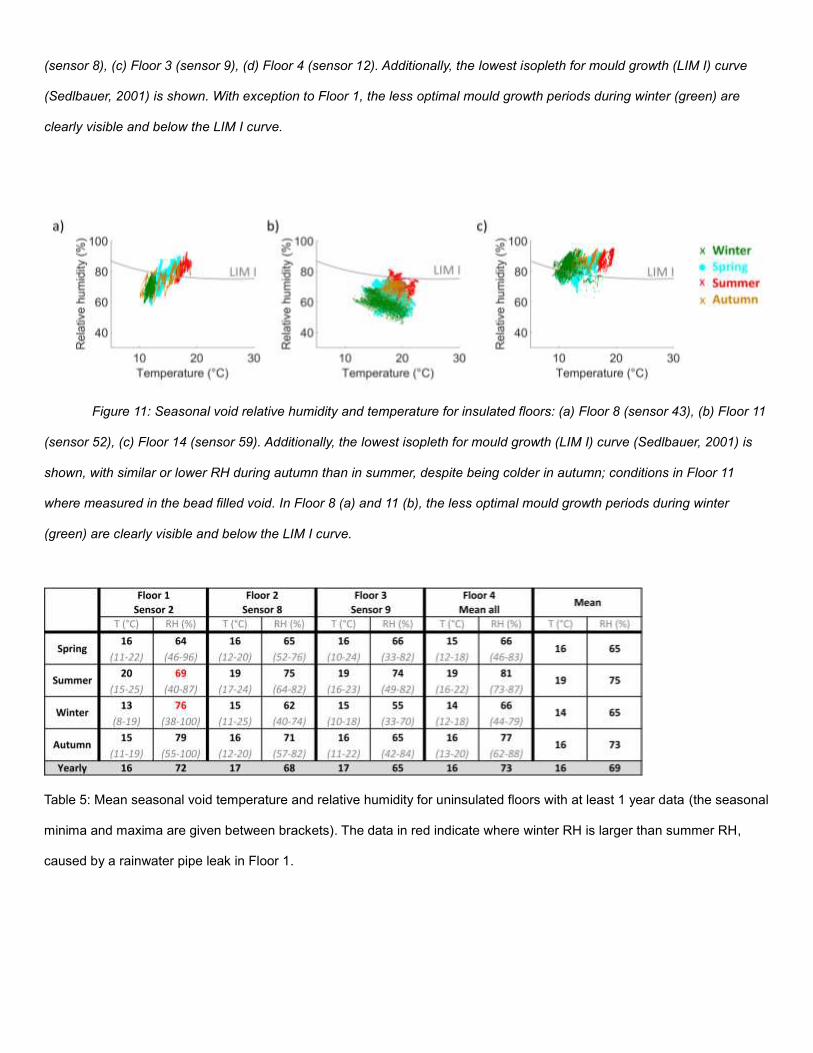
(sensor 8), (c) Floor 3 (sensor 9), (d) Floor 4 (sensor 12). Additionally, the lowest isopleth for mould growth (LIM I) curve
(Sedlbauer, 2001) is shown. With exception to Floor 1, the less optimal mould growth periods during winter (green) are
clearly visible and below the LIM I curve.
Figure 11: Seasonal void relative humidity and temperature for insulated floors: (a) Floor 8 (sensor 43), (b) Floor 11
(sensor 52), (c) Floor 14 (sensor 59). Additionally, the lowest isopleth for mould growth (LIM I) curve (Sedlbauer, 2001) is
shown, with similar or lower RH during autumn than in summer, despite being colder in autumn; conditions in Floor 11
where measured in the bead filled void. In Floor 8 (a) and 11 (b), the less optimal mould growth periods during winter
(green) are clearly visible and below the LIM I curve.
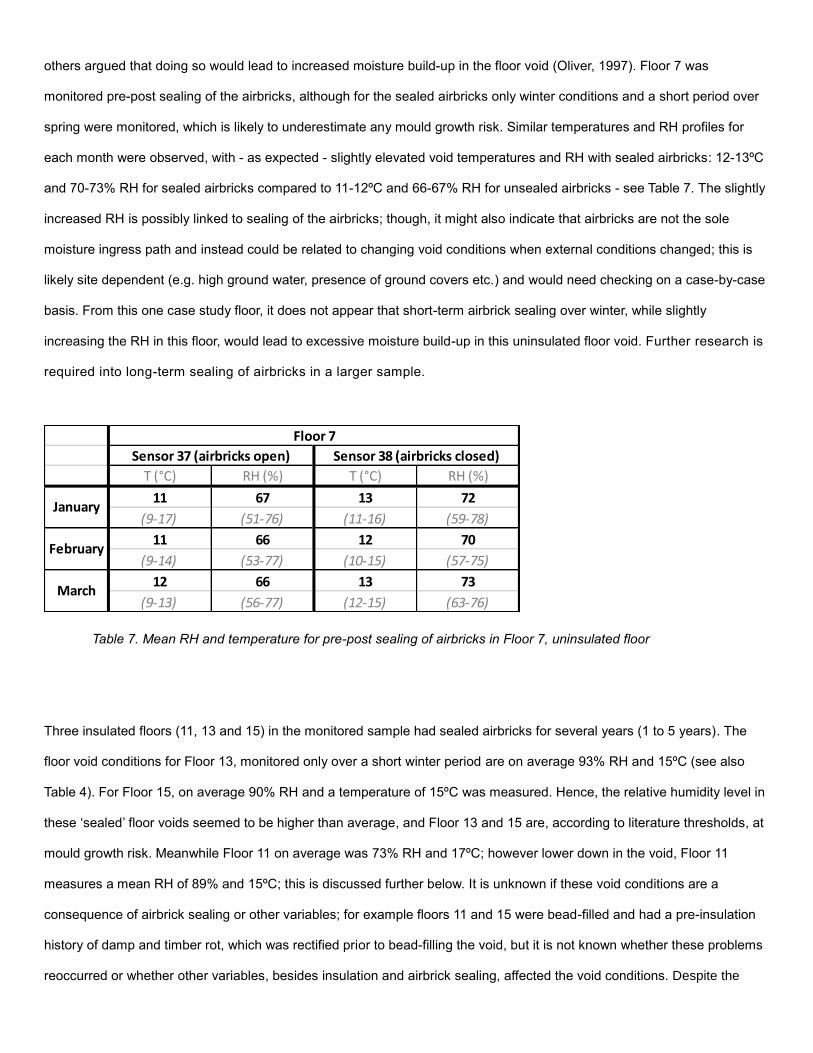
Table 5: Mean seasonal void temperature and relative humidity for uninsulated floors with at least 1 year data (the seasonal
minima and maxima are given between brackets). The data in red indicate where winter RH is larger than summer RH,
caused by a rainwater pipe leak in Floor 1.

Table 6: Mean seasonal void temperature and relative humidity for insulated floors with at least 1 year data (the seasonal
minima and maxima are given between brackets). The data in red indicate where winter RH is larger than summer RH;
conditions in Floor 11 where measured in the bead filled void with sealed airbricks; and sensor 48 was located near the
void ground near the external foundation wall; sensor 54 was near joist level, 1m away from the external wall.
Uninsulated floor void temperatures for the sample of floors in Table 5, measured by the different sensors, ranged
(averaged over time) between 13ºC to 15ºC in winter and 19ºC to 20ºC in summer; while RH ranged between 55% and
76% in winter and 69% to 81% in summer. For insulated floors presented in Table 6, winter void temperatures measured by
the different sensors, ranged (averaged over time) between 11ºC and 16ºC with RH between 59% and 92%. In summer,
void temperatures increased to 17ºC to 20ºC, with RH between 72% to 89%.
Generally and over at least a year, uninsulated floor voids appear to have lower humidity void conditions compared
to the insulated floor voids: the mean RH (69%) of the four uninsulated floors is 14% below the mean RH (79%) of the three
insulated floors, while both groups have similar mean void temperatures of 15ºC (insulated) and 16ºC (uninsulated); the
mean RH of the four uninsulated floors is elevated due to a pipe leakage in Floor 1. However, floors were purposively
sampled to included cases with historical damp problems, and cases in which there was some concern about potential
damp, so direct extrapolation to the wider stock isn’t possible. Overall however, the void conditions were in similar ranges
to those reported by others in Finland, e.g. Pasanen (2001), Airaksinen (2003), Kurnitski (2000b) and Samuelson (1994) in
Sweden, indicating that optimal conditions for mould growth might exist, depending on exposure time. Clearly, further
monitoring in a variety of floor voids is required to establish if these trends are also observed in the wider stock.
Effect of sealing airbricks in winter
The sealing of airbricks can lead to winter heat loss reduction as discussed by (Hill, 2005). Some research argued
that sealing of airbricks might, furthermore, reduce summer RH (Rose, 1994, Samuelson, 1994, Lstiburek, 2004), though
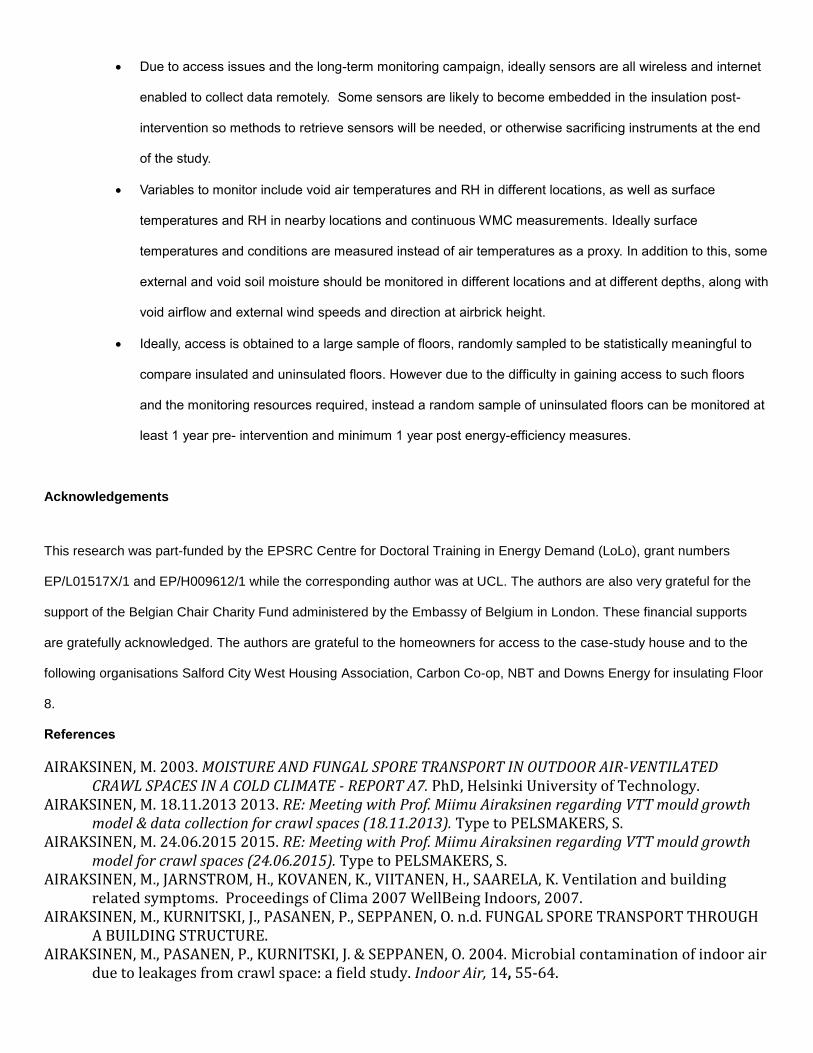
others argued that doing so would lead to increased moisture build-up in the floor void (Oliver, 1997). Floor 7 was
monitored pre-post sealing of the airbricks, although for the sealed airbricks only winter conditions and a short period over
spring were monitored, which is likely to underestimate any mould growth risk. Similar temperatures and RH profiles for
each month were observed, with - as expected - slightly elevated void temperatures and RH with sealed airbricks: 12-13ºC
and 70-73% RH for sealed airbricks compared to 11-12ºC and 66-67% RH for unsealed airbricks - see Table 7. The slightly
increased RH is possibly linked to sealing of the airbricks; though, it might also indicate that airbricks are not the sole
moisture ingress path and instead could be related to changing void conditions when external conditions changed; this is
likely site dependent (e.g. high ground water, presence of ground covers etc.) and would need checking on a case-by-case
basis. From this one case study floor, it does not appear that short-term airbrick sealing over winter, while slightly
increasing the RH in this floor, would lead to excessive moisture build-up in this uninsulated floor void. Further research is
required into long-term sealing of airbricks in a larger sample.
Table 7. Mean RH and temperature for pre-post sealing of airbricks in Floor 7, uninsulated floor
Three insulated floors (11, 13 and 15) in the monitored sample had sealed airbricks for several years (1 to 5 years). The
floor void conditions for Floor 13, monitored only over a short winter period are on average 93% RH and 15ºC (see also
Table 4). For Floor 15, on average 90% RH and a temperature of 15ºC was measured. Hence, the relative humidity level in
these ‘sealed’ floor voids seemed to be higher than average, and Floor 13 and 15 are, according to literature thresholds, at
mould growth risk. Meanwhile Floor 11 on average was 73% RH and 17ºC; however lower down in the void, Floor 11
measures a mean RH of 89% and 15ºC; this is discussed further below. It is unknown if these void conditions are a
consequence of airbrick sealing or other variables; for example floors 11 and 15 were bead-filled and had a pre-insulation
history of damp and timber rot, which was rectified prior to bead-filling the void, but it is not known whether these problems
reoccurred or whether other variables, besides insulation and airbrick sealing, affected the void conditions. Despite the
T (°C) RH (%) T (°C) RH (%)
11 67 13 72
(9-17) (51-76) (11-16) (59-78)
11 66 12 70
(9-14) (53-77) (10-15) (57-75)
12 66 13 73
(9-13) (56-77) (12-15) (63-76)
Floor 7
February
March
Sensor 38 (airbricks closed)
January
Sensor 37 (airbricks open)

limited sample, this is a potential cause for concern and highlights that interventions must be undertaken on a case by case
basis. Furthermore, post intervention monitoring with wireless, internet enabled sensors, may be an inexpensive way to
ascertain that void conditions are not worsened.
A final consideration is that, while air velocity between 0.5 to 1.5 m/s could encourage the release of fungal spores
(Pasanen, 1991b), mould growth and timber rot require stable environments (Ridout, 2001). Sealing of the airbricks creates
more stable conditions, potentially increasing the risk of mould growth but decreasing the risk of spore diffusion. Figure 13
illustrates the more stable RH and temperature conditions in Floor 8 with sealed airbricks; it also highlights that - as
expected – temperature conditions are more stable, slightly higher and with lower RH further away from the airbricks
compared to near the airbricks, for this uninsulated floor.
Figure 12. Impact of sealing airbricks on the dynamic behaviour of the relative humidity and temperature during a winter
period in uninsulated Floor 8. Sealed airbricks result in more stable conditions; and further away from the airbricks might
suggest higher RH when sealed for this floor. Away from the airbricks, the air temperature is higher, resulting in a lower air
relative humidity.

Effect of location in the floor void
Sensors placed in different locations indicate that there are different conditions for different monitoring locations in the floor
void. This is illustrated by for example insulated Floor 11 (Figure 13) which was measured in several different locations.
There is an indication that some measured void conditions are below the LIM-curve in certain seasons (e.g. when
measured near the floorboard surface), while others are very high (when measured near the bottom of the void – Figure
14). Note that Floor 11 sensors were suspended in a floor void fully filled with EPS beads and sealed airbricks. This floor
also had a history of dampness, which was rectified prior to fitting floor insulation. Issues with localised monitoring and
generalisation of localised data to an entire floor void are also highlighted in Table 3 and 4, where clearly different mould
growth risks are predicted depending on the observed location.
Figure 13: Seasonal void relative humidity and temperature for different locations in Floor 11, most of the sensors are
placed near the external foundation wall due to access issues: (a) measured near top of joists, in beads (sensor 49), (b)
measured at top of joists but not in beads (sensor 53), (c) measured 200mm below joists, in middle of bead-filled void
(sensor 51), (d) measured 400mm below joists, near the bottom of the bead-filled void (sensor 48) and (e) measured about
1m away from the external wall at top of joists in beads (sensor 54). The lowest isopleth for mould growth (LIM I) curve
(Sedlbauer, 2001) is shown, and indicates that some measured void conditions are below the LIM-curve in certain seasons,
while others are very high (when measured near the bottom of the void) in all seasons.

Clearly, conditions in one location are not representative of conditions in other locations and the absence of mould growth
in one location does not guarantee absence in other locations, hence monitoring should be undertaken at different
locations and at different heights.
6. Conclusion and recommendations
The installation of floor insulation brings a potential for energy and carbon reductions, as well as an improvement to
occupant thermal comfort. However, upgrading floors also changes floor void conditions, which might lead to moisture
build-up and therefore to mould and fungal growth. These organisms can affect building structure or occupant health if
mould spores transfer into living spaces above. Therefore, it is important to consider the global performance of the
construction taking into account for example the pressure differences across the floor as well as the air flow and the
ventilation rates in the floor voids. At present these considerations are poorly characterised, individually or combined.
Some evidence in climates with warm and humid summers suggests that mould growth risk may increase in
insulated floors due to an increased RH in floor voids. However, generally floor voids are poorly characterised for different
climates and constructions and it is unclear if increased risk of mould growth also applies to colder and drier climates.
Fifteen ground floor crawl spaces were monitored in England; six were uninsulated and nine were insulated; two
floor voids were monitored for short periods pre-post insulation while another floor consisted of an insulated and
uninsulated section. The uninsulated mean floor void air temperature was 15ºC with mean RH of 76%. As expected and on
average, the uninsulated floors were slightly drier compared to the insulated floors (mean 82% RH of all nine floors). Most
insulated floors in this sample meet or exceed the critical thresholds for mould growth for significant periods, as compared
to the literature. However, one uninsulated floor had high void RH due to a rainwater pipe leak during the monitoring period;
this was the only case where actual mould growth was visually observed during the monitoring period. Because cases were
purposively sampled to explore different floor void conditions and study methods, ‘historically damp’ floors were
intentionally included in the insulated floor sub-sample for this study. Additionally, monitoring occurred in different periods
and for different lengths of time, hence a robust comparison between insulated and uninsulated floor void conditions was

not possible and was not the purpose of this study.
From a sub-sample of seven floors for which seasonal data was available, it was generally observed that there
were some seasonal differences in void conditions: for uninsulated floor voids, summer RH was generally higher than
winter RH, while for insulated floor voids, summer and autumn RH were generally higher than in winter. Given the sampling
strategy, the data did, however, not allow a fair comparison between insulated and uninsulated floors. Generally the closer
to the airbricks, the greater the RH and the colder the void compared to further away from the airbricks, which also
provided more stable conditions. The long-term effect of airbrick sealing could however not be verified and a longer-term
study and a larger random sample would be required to do so.
The variability in void conditions across the sample, both pre- and post-insulation retrofitting, highlights the need for
further research. For practical reasons, this paper did not measure or quantify moisture sources in the voids and their
contribution to the void condition. However, site specific considerations, such as the level of the water table, the actual
ventilation through the void, infiltration between void and living spaces, and condition of the ground beneath the floor are
important factors to consider, in addition to the identification of faults such as leaking services and drainage. This variability
also lead to highly inhomogeneous conditions within a single case study floor void, associated with the proximity to
ventilation, sources and sinks of moisture. This suggests that high resolution monitoring (i.e. a large number of
measurement points) is necessary to characterise the space well, for example at different heights, proximity to airbricks,
joists, and sleeper walls. The absence or presence of conditions that could lead to mould growth in one location is not
necessarily a good indicator of the conditions elsewhere. Characterisation of floor void conditions is best performed over a
long monitoring campaign, to account for seasonal climatic factors, ideally at least one year in duration. Visual inspection
provides a valuable supplement to such monitoring.
Criteria for mould growth risk instead of for fungal decay are recommended to use for evaluating floor void conditions due
to the possible impact on occupant health. The UK floor void samples were evaluated based on a selection of lowest
isopleth thresholds for mould growth and an 80% RH-rule. Except for the impact of the sampling location, also the choice of
the mould growth evaluation criterion was shown to influence the predicted risk. Further research is required to define
robust thresholds for the mould growth risk assessment in floor voids. In this respect, also further research on mould
growth under fluctuating conditions is desirable. Such fluctuating conditions could, for instance, result in an interim drying
out of the mould spores, something that is not taken into account in the isopleths. More sophisticated prediction models
that can deal with a dynamic input can be found in the literature; though, these are not validated for typical floor void
conditions, with the exception of the VTT-model. Moreover, previous studies (Vereecken and Roels, 2012, Vereecken et al.,

2015, H. Altamirano-Medina, 2009) indicated mould growth predictions that were variant between models.
Encouraging the widespread uptake of insulation interventions in floors requires a body of evidence that such work
will not cause occupant health issues or structural problems. This evidence does not yet exist, and such interventions
should therefore be undertaken with great care. Equally at present there is insufficient evidence to indicate whether floor
insulation will increase moisture build-up risk. Hence, when insulating floors, awareness of potential risk factors and
minimising these risks in interventions (such as fixing any dampness problems prior to insulation, ensuring adequate
ventilation to dissipate moisture build-up, considering the likely moisture conditions in the specific site etc.), should help
manage risks. Additionally, regular post-retrofit inspection and monitoring would help detect any problems at the early
stages and reduce long-term risk. Given that there are millions of properties with suspended timber ground floors globally,
further research on the sources of moisture, and effective moisture source control measures, is required alongside the
consequences of undertaking energy-efficiency measures in such floors. Clearly moisture sources (and any moisture
source reduction measures) affect the moisture build-up risks and any risks associated with energy-saving interventions,
such as insulation and ventilation changes through the void (and up into the spaces above). Hence more research is
needed into these factors but also their interactions to gain a better understanding of risks of specific energy-efficiency
interventions in floors with specific moisture source strengths, and with and without potential moisture reduction measures.
The recommendations on the research method for sampling, monitoring and evaluating floor void conditions,
inferred from the findings of the UK floor void measurement campaign, are of major importance for the reliability of such
further research. The exploratory nature of this study highlighted seasonal and spatial monitoring implications as well as
practical data collection issues related to access to floor voids and their instrumentation, supporting reflection and
refinement of methodologies for future studies. The study also highlighted that suspended ground floors are poorly
characterised at present, indicating the need for a wider study to classify different floor archetypes and void conditions.
Until this is done, the sampling of floors based on pre-set criteria when such criteria and its floors are not yet classified, will
remain difficult. In addition, at present it is unknown if a sufficient number of floors with the same criteria (and exclusion of
other criteria) can be accessed for monitoring. Despite these challenges, some methodological implications to optimise
future studies, can be drawn out based on the current study:
Each floor should be monitored at high resolution for minimum 1 year, both at different depths in the void
and at different locations across the floor void; near airbricks and further away as well as near joists and
floorboards as well as the void ground. This will require different access points, with sensors which can
measure at the higher RH range (up to 100%).
Due to access issues and the long-term monitoring campaign, ideally sensors are all wireless and internet
enabled to collect data remotely. Some sensors are likely to become embedded in the insulation post-
intervention so methods to retrieve sensors will be needed, or otherwise sacrificing instruments at the end
of the study.
Variables to monitor include void air temperatures and RH in different locations, as well as surface
temperatures and RH in nearby locations and continuous WMC measurements. Ideally surface
temperatures and conditions are measured instead of air temperatures as a proxy. In addition to this, some
external and void soil moisture should be monitored in different locations and at different depths, along with
void airflow and external wind speeds and direction at airbrick height.
Ideally, access is obtained to a large sample of floors, randomly sampled to be statistically meaningful to
compare insulated and uninsulated floors. However due to the difficulty in gaining access to such floors
and the monitoring resources required, instead a random sample of uninsulated floors can be monitored at
least 1 year pre- intervention and minimum 1 year post energy-efficiency measures.
Acknowledgements
This research was part-funded by the EPSRC Centre for Doctoral Training in Energy Demand (LoLo), grant numbers
EP/L01517X/1 and EP/H009612/1 while the corresponding author was at UCL. The authors are also very grateful for the
support of the Belgian Chair Charity Fund administered by the Embassy of Belgium in London. These financial supports
are gratefully acknowledged. The authors are grateful to the homeowners for access to the case-study house and to the
following organisations Salford City West Housing Association, Carbon Co-op, NBT and Downs Energy for insulating Floor
8.
References
AIRAKSINEN, M. 2003. MOISTURE AND FUNGAL SPORE TRANSPORT IN OUTDOOR AIR-VENTILATED CRAWL SPACES IN A COLD CLIMATE - REPORT A7. PhD, Helsinki University of Technology.
AIRAKSINEN, M. 18.11.2013 2013. RE: Meeting with Prof. Miimu Airaksinen regarding VTT mould growth model & data collection for crawl spaces (18.11.2013). Type to PELSMAKERS, S.
AIRAKSINEN, M. 24.06.2015 2015. RE: Meeting with Prof. Miimu Airaksinen regarding VTT mould growth model for crawl spaces (24.06.2015). Type to PELSMAKERS, S.
AIRAKSINEN, M., JARNSTROM, H., KOVANEN, K., VIITANEN, H., SAARELA, K. Ventilation and building related symptoms. Proceedings of Clima 2007 WellBeing Indoors, 2007.
AIRAKSINEN, M., KURNITSKI, J., PASANEN, P., SEPPANEN, O. n.d. FUNGAL SPORE TRANSPORT THROUGH A BUILDING STRUCTURE.
AIRAKSINEN, M., PASANEN, P., KURNITSKI, J. & SEPPANEN, O. 2004. Microbial contamination of indoor air due to leakages from crawl space: a field study. Indoor Air, 14, 55-64.

AIRAKSINEN M., K. J. A. S. O. 2003. On the crawl space moisture control in buildings. . Proceedings of the Estonian Academy of Sciences: Engineering 9, 34-58.
ASHRAE. ASHRAE Recommended practices for controlling moisture in crawl spaces -. In: ASHRAE, ed. Ashrae Transactions 1994, Symposium on recommended practices for controlling moisture in crawl spaces - a collection of papers, 1994 New Orleans, Louisiana. ASHRAE.
BOARDMAN, B., DARBY, S., KILLIP, G., HINNELLS, M., JARDINE, C.N., PALMER, J., SINDEN, G. 2005. 40% house. Oxford: Environmental Change Institute, University of Oxford.
BRE 1991. BRE Digest 364 - Design of timber floors to prevent decay. In: BRE (ed.). BRE 1998. Good repair guide 17 - repairing and replacing ground floors. BRE 2000. Good Practice Guide 294, Refurbishment guidance for solid-walled houses - ground floors. BROOK, D. 1994. Home Moisture problems (reprinted 2008). Oregon State University. BURKE, S. n.d. Advantages and Risks Associated with Crawl Space Foundations. Lund University. CLARKE, J. A., JOHNSTONE, C.M., KELLY, N.J., MCLEAN, R.C., ANDERSON, J.A., ROWAN, N.J., ET AL. 1999. A
technique for the prediction of the conditions leading to mould growth in buildings. Building and Environment 515-521.
COULTER, J. n.d. Liabilities of Vented Crawl Spaces, Their Impacts on Indoor Air Quality in Southeastern U.S. Homes and One Intervention Strategy. North Carolina, USA.: Advanced Energy in Raleigh.
COX-SMITH, I. 2008. In-situ measurement of thermal resistance of suspended floors - Study Report SR-202 (2008). Branz.
DCLG 2010. English Housing survey- Housing Stock Report 2008. London: Comunities & local government. DECC 2015a. Data tables: Green Deal and ECO statistics. In: DECC (ed.). London: DECC. DECC 2015b. Data tables: Green Deal, ECO and insulation levels, up to September 2015. In: DECC (ed.).
London: DECC. DOUGLAS, J. 1997. The development of ground floor constructions: part II". Structural Survey, 15, 151-156. DOUGLAS, J. 1998a. The development of ground floor constructions: part 6 (subfloors). Structural Survey,
16, 193-199. DOUGLAS, J. 1998b. The development of ground floor constructions: part III (damp proofing materials).
Structural Survey, 16, 18-22. DOUGLAS, J. 1998c. The development of ground floor constructions: part IV (damp proofing methods).
Structural Survey, 16, 76-80. DOUGLAS, J. & SINGH, J. 1995. Investigating dry rot in buildings. Building Research & Information, 23, 345-
352. DOWSON, M., POOLE, A., HARRISON, D. & SUSMAN, G. 2012. Domestic UK retrofit challenge: Barriers,
incentives and current performance leading into the Green Deal. Energy Policy, 50, 294-305. DSTATIS 2013. Gebaude und Wohnungen Bundesrepublik Deutshland - Zensus 2011. In: BUNDESAMT, S.
(ed.). Wiesbaden. EH 2010. English Heritage, Energy Efficiency in Historic Buildings. Insulation of Suspended timber floors. EH 2012. Practical Building Conservation: Timber, Ashgate Publishing Limited. ENERGY_SOLUTIONS n.d. Cost Effective Retrofit Solutions for Solid Wall Properties - A study for the Royal
Borough of Kensington & Chelsea. EST 2006. CE184 - practical refurbishment of solid-walled houses. London: EST. FIEDLER, K., SCHUTZ, E. & GEH, S. 2001. Detection of microbial volatile organic compounds (MVOCs)
produced by moulds on various materials. International Journal of Hygiene and Environmental Health, 204, 111-21.
FLYNN, K. A., QUARLES, S.L., DOST, W.A. 1994. Comparison of ambient conditions and wood mositure contents in crawl spaces in a California condominium complex. Ashrae Transactions 1994, Symposium on recommended practices for controlling moisture in crawl spaces.
FRANKLAND, A. W., HAY, M.J. 1951. Dry rot as a cause of allergic complaints. Acta Allergologica, IV, 186-200.

GRADECI, K., LABONNOTE, N., TIME, B., KÖHLER, J. 2017. Mould growth criteria and design avoidance approaches in wood-based materials – A systematic review. . Construction and Building Materials 77-88.
H. ALTAMIRANO-MEDINA, M. D., I. RIDLEY, D. MUMOVIC AND T. ORESZCZYN 2009. Guidelines to Avoid Mould Growth in Buildings. ADVANCES IN BUILDING ENERGY RESEARCH 3, 221-236.
HARRIS, D. J. 1995. Moisture beneath suspended timber floors. Structural Survey, 13, 11-15. HARTLESS, R., WHITE,M. 1994. Measuring subfloor ventilation rates. 15th AIVC Conference. UK. HARTLESS, R. P., LLEWELLYN, J.W. 1999. Measuring and modelling moisture and tempertaure beneath a
suspended timber floor. AIVC conference 1999. HENS, H. 1999. Fungal defacement in buildings, a performance related approach. . International Journal of
Heating, Ventilation, Air-Conditioning and refrigerating Research, 265-289. HILL, W. W. 2005. Crawlspace Ventilation - Position paper prepared for the Indiana Building Code
Committee at the request of Bill Fox. In: COLLEGE OF ARCHITECTURE AND PLANNING, B. S. U. (ed.).
HOLZHUETER, K., ITONAGA, K. 2017. An evaluation of WUFI-Bio to predict mold growth in straw bale walls in Japan. . Journal of Asian Architecture and Building Engineering 357-362
HUKKA, A., VIITANEN, H.A. 1999. A mathematical model of mould growth on wooden material. Wood Science and Technology, 475-485.
IEA 1990. IEA-annex 14. Condensation and energy. Guidelines and practice. . Leuven; Acco IEA. JOHANSSON, P. 2012. Critical Moisture Conditions for Mould Growth on Building Materials. Licentiate thesis,
Lund University JOHANSSON, P. 2014. Determination of the critical moisture level for mould growth on building materials. .
PhD, LUND University. KORPI, A., JARNBERG, J. & PASANEN, A. L. 2009. Microbial volatile organic compounds. Crit Rev Toxicol, 39,
139-93. KROGER, T., VEPSALAINEN,K., REIMAN, M., KESKIKURU, T., HALONEN, R., KOKOTTI,H. 2007. The
determiniation of conditions for microbial growth in crawl spaces. In: AIVC (ed.) 2nd PALENC Conference and 28th AIVC Conference on Building Low Energy Cooling and Advanced Ventilation Technologies in the 21st Century, September 2007, Crete island, Greece.
KRUS, M., KILIAN, R., SEDLBAUER, K. 2007. Mould growth prediction by computational simulation on historical buildings. , Denmark, National Musem of Denmark.
KURNITSKI, J. 2000a. Crawl space air change, heat and moisture behaviour. Energy and Buildings, 32, 19-39.
KURNITSKI, J. 2001. Ground moisture evaporation in crawl spaces. Building and Environment, 36, 359-373. KURNITSKI, J., MATILAINEN, M. 2000b. Moisture conditions of outdoor air-ventilated crawl spaces in
apartment buildings in a cold climate. Energy and buildings 33, 15-29. LANGMANS, J., ROELS, S. 2015. What are the hygrothermal consequences of applying exterior air barriers
in timber frame constructions in Europe? . Journal of Building Performance Simulation 191-204. LAUKKARINEN, A. & VINHA, J. 2017. Temperature and relative humidity measurements and data analysis
of five crawl spaces. Energy Procedia, 132, 711-716. LILLY, J. P., PIGGINS, J.M., STANWAY,R.J. 1988. A study of the ventilation characteristics of a suspended
floor. 9th AIVC Conference. Gent. LSTIBUREK, J. 2004. Conditioned Crawl Space Construction, Performance and Codes. buildingscience.com. LSTIBUREK, J. 2008. New Light in Crawlspaces. Insight, buildingscience.com. LUGG, A., PROBERT,D. 1997. Indoor radon gas: A potential health hazard resulting from implementing
energy-efficiency measures. Applied Energy, 56, 93-196. MARINCIONI, V. A.-M., H. 2017. Analysis of the suitability of mould growth models for the risk assessment
of woodfibre internal Wall insulation. . Energy Procedia, 132. MATILAINEN, M., KURNITSKI,J. 2003. Moisture conditions in highly insulated outdoor ventilated crawl
spaces in cold climates. Energy and Buildings, 35(2003).

MCGRATH, P. T., MCMANUS, J. 1996. Air infiltration from basements and sub-floors to the living space. Building Services Engineering Research and Technology, 17(2), 85-87.
MEIJER, F., ITARD, L. & SUNIKKA-BLANK, M. 2009. Comparing European residential building stocks: performance, renovation and policy opportunities. Building Research & Information, 37, 533-551.
MOON, H. J. 2005. Assessing mold risk in buildings uncertainty. . PhD, Georgia Institute of Technology. MORTON, D. 2013. RE: Meeting with surveyor David Morton (25.01.2013). MOSES, C. S. 1954. CONDENSATION AND DECAY PREVENTION UNDER BASEMENTLESS HOUSES. In:
LABORATORY, F. P. (ed.). Madison, Wisconsin: Forest Service U. S. Department of Agriculture. MUTHESIUS, S. 1984. The English Terraced House, Yale, Yale University Press. NBS 2013. PART C building Regulations Site Preparation and resistance to contaminants and moisture -
including 2013 changes. London: NBS. OLIVER, A. 1997. Dampness in Buildings, Wiley-Blackwell. ORESZCZYN, T., PRETLOVE, S.E.C. 1999. Condensation Targeter II: Modelling surface relative humidity to
predict mould growth in dwellings Building Services Engineering Research and Technology, 20 143-153.
PAAVILAINEN, J., JARNSTROM, H., SAARELA, K., SARLIN, T., VIITANEN, H, AIRAKSINEN, M. n.d. Simulation of moisture and microbial problems in building.
PARK, J. H., SCHLEIFF, P. L., ATTFIELD, M. D., COX-GANSER, J. M. & KREISS, K. 2004. Building-related respiratory symptoms can be predicted with semi-quantitative indices of exposure to dampness and mold. Indoor Air, 14, 425-33.
PASANEN, A.-L., KALLIOKOSKI, P, PASANEN, P., JANTUNEN, M.J, NEVALAINEN, A. 1991a. LABORATORY STUDIES ON THE RELATION- SHIP BETWEEN FUNGAL GROWTH AND ATMOSPHERIC TEMPERATURE AND HUMIDITY. Environment International, 17, 225-228.
PASANEN, A.-L., PASANEN, P., JANTUNEN, M.J, KALLIOKOSKI, P 1991b. SIGNIFICANCE OF AIR HUMIDITY AND AIR VELOCITY FOR FUNGAL SPORE RELEASE INTO THE AIR. Atmospheric Environment, 25A, 459-462.
PASANEN, P. O., KOLARI, S., PASANEN, A-L., KURNITSKI, J. 2001. Fungal Growth on Wood Surfaces at Different Moisture Conditions in Crawl Spaces. IAQ, 1-5.
PELSMAKERS, S. 2016. Pre-1919 suspended timber ground floors in the UK: estimating in-situ U-values and heat loss reduction potential of interventions. PhD PhD, UCL.
PELSMAKERS, S. & ELWELL, C. A. 2017. Suspended timber ground floors: Heat loss reduction potential of insulation interventions. Energy and Buildings, 153, 549-563.
POWER, A. 2008. Does demolition or refurbishment of old and inefficient homes help to increase our environmental, social and economic viability? Energy Policy, 36, 4487-4501.
RICHTER, J. & STANĚK, K. 2015. Moisture Safe and Mould Free Crawl Spaces: State-of-the-art and Design of Full-scale Experiment. Energy Procedia, 78, 2754-2759.
RICKABY, R. 2014. An introduction to low carbon refurbishment, London, Construction Products Association.
RIDOUT, B. 2001. Timber Decay in Buildings: The Conservation Approach to Treatment. APT Bulletin, 32, 58-60.
ROSE, W. B., TEN WOLDE, A. 1994. Moisture Control in Crawl Spaces. Wood Design Focus, 5, 11-14. ROWAN, N., JOHNSTONE, C., CRAIG, R., ANDERSON, J., CLARKE, J. 1999. Prediction of toxigenic fungal
growth in buildings by using a novel modelling system. . Applied and Environmental Microbiology, 4814-4821.
SAINT-GOBAIN 2014. Energy House - the very fabric of whole house retrofit. In: SAINT-GOBAIN (ed.). SAMUELSON, I. 1994. Moisture control in crawl spaces. In: ASHRAE (ed.) Ashrae Transactions 1994,
Symposium on recommended practices for controlling moisture in crawl spaces. ASHRAE. SAUNDERS, M., LEWIS, P., THORNHILL, A 2009. Research methods for business students, England, Pearson
Education. SEDLBAUER, K. 2001. Beurteilung von Schimmelpilzbildung auf und in Bauteilen. PhD, Universität Stuttgart.
SEDLBAUER, K. n.d. Prediction of mould fungus formation on the surface of and inside building components. PhD, Fraunhofer Institute for Building Physics.
SEDLBAUER, K., KRUS, M., ZILLIG, W. 2017. WUFI-Bio 3.4. Germany: Fraunhofer Institute for Building Physics.
SHERMAN, M., CHAN, R. n.d. LAWRENCE BERKELEY NATIONAL LABORATORY REPORT NO. LBNL-53356 - Building Airtightness: Research and Practice. In: LBNL (ed.) LAWRENCE BERKELEY NATIONAL LABORATORY REPORT NO. LBNL-53356. LAWRENCE BERKELEY NATIONAL LABORATORY.
SHORROCK, L. D., HENSERSON, J., UTLEY, J.I. 2005. Reducing Carbon Emissions from the UK Housing Stock - BR 480. In: BRE (ed.). Watford: BRE.
SHRUBSOLE, C., MACMILLAN, A., DAVIES, M. & MAY, N. 2014. 100 Unintended consequences of policies to improve the energy efficiency of the UK housing stock. Indoor and Built Environment, 23, 340-352.
SINGH, J. 1998. Dry Rot and Other Wood-Destroying Fungi: Their Occurrence, Biology, Pathology and Control. Indoor + Built Environment, 8, 3-20.
SMITH, S. L., HILL, S.T. 1982. Influence of temperature and water activity on germination and growth of Aspergillus restrictus and A. versicolor. . Transactions of the British Mycological Society, 558-560.
STEPHEN, R. K. 1998. Airtightness in UK dwellings: BRE's test results and their significance. Watford: BRE for DETR.
STILES, L., CUSTER, M. Reduction of moisture in wood joists in crawl spaces - a study of seventeen houses in Southern New Jersey. In: ASHRAE, ed. Ashrae Transactions 1994, Symposium on recommended practices for controlling moisture in crawl spaces - a collection of papers, 1994. ASHRAE, 1314-1324.
STRAUBE, J., ONYSKO, D., SCHUMACHER, C. 2002. Methodology and Design of Field Experiments for Monitoring the Hygrothermal Performance of Wood Frame Enclosures. Journal of Building Physics.
TSONGAS, G. A. Crawl space moisture conditions in new and existing northwest homes. Ashrae Transactions 1994, Symposium on recommended practices for controlling moisture in crawl spaces, 1994. ASHRAE, 1326-1332.
VANHOUTTEGHEM, L., MORELLI, M., SØRENSE, L. S. 2017. Can crawl space temperature and moisturec onditions be calculated with a whole0building hygrothermal simulation tool? Energy Procedia, 688-693.
VERDIER, T., COUTAND, M., BERTRON, A. & ROQUES, C. 2014. A review of indoor microbial growth across building materials and sampling and analysis methods. Building and Environment, 80, 136-149.
VEREECKEN, E. & ROELS, S. 2012. Review of mould prediction models and their influence on mould risk evaluation. Building and Environment, 51, 296-310.
VEREECKEN, E., VANOIRBEEK, K. & ROELS, S. 2015. Towards a more thoughtful use of mould prediction models: A critical view on experimental mould growth research. Journal of Building Physics.
VIITANEN, H., OJANEN, T. 2007. Improved Model to Predict Mold Growth in Building Materials. ASHRAE. VIITANEN, H., VINHA, J., SALMINEN, K., OJANEN, T., PEUHKURI, R., PAAJANEN, L. & LAHDESMAKI, K. 2010.
Moisture and Bio-deterioration Risk of Building Materials and Structures. Journal of Building Physics, 33, 201-224.
WERTHER, N. W. S. 2010. ANALYSIS OF CLIMATE CONDITIONS IN CRAWL SPACES WITH HIGH INSULATED WOODEN FLOOR PLATES FOR PREVENTION OF STRUCTURAL DAMAGES. WCTE World Conference on Timber Engineering - 2010.
WESTOBY, J. n.d. Use of lumber in the construction of dwelling units. Unasylva - Vol. 12, No. 1. WHO 2009. DAMP AND MOULD - Health risks, prevention and remedial actions. Denmark: WHO Regional
Office for Europe. WILLIAMSON, T., OLWENY,M. 2000. Heat Flow Through Timber Floors & Results of the Monitoring
Programme - Design of environmentally responsible housing for Australia with emphasis on the use of timber. In Design of Environmentally Responsible Housing for Australia: With Emphasis on the Use of Timber, Bennetts, H. & Williamson, T.J. (Eds.). Adelaide.

WTA 2006. Merkblatt 6-3-05/D. Rechnerische Prognose des Schimmelpilzwachstumsrisikos. . Germany: Fraunhofer IRB Verslag.
i The historic requirements appear sufficient given the lack of widespread timber rot reporting in the existing housing stock.
ii Xerophilic means tolerant of dry conditions