Voice of the Visitor: Guest Insights Report by PGAV Destinations
68
Voice of the Visitor 2016 Annual Outlook on the Attractions Industry Conducted by PGAV Destinations in partnership with H2R Market Research and Blooloop
-
Upload
charles-read -
Category
Business
-
view
173 -
download
1
Transcript of Voice of the Visitor: Guest Insights Report by PGAV Destinations

Voice of the Visitor 2016 Annual Outlook on the Attractions Industry
Conducted by PGAV Destinations in partnership with H2R Market Research and Blooloop

TABLE OF CONTENTSStarting from the Beginning
More Visitors
Who is Going?
Who is Going Where?
Going On-Line Before Getting In-Line
Guest Satisfaction
Boomers
Millennials
Attraction Data Tidbits
2015 Findings by attraction category
pg 5
pg 7
pg 13
pg 17
pg 23
pg 27
pg 31
pg 33
pg 35
pg 37
AQUARIUMS ART GALLERIES BOTANICAL GARDENS
FAMILY ENTERTAINMENT
CENTERS (FEC)
HISTORICAL HOMES & MANSIONS
LARGE FORMAT THEATERS
HISTORICAL LANDMARKS
MUSEUMSSCIENCE CENTERS
SIGHTSEEING TOURSTHEATERSTHEME PARKS
WATER PARKS
ZOOLOGICAL ATTRACTIONS Voice of the Visitor
2016 Annual Outlook on the Attractions Industry

STARTING FROM THE BEGINNING“One’s destination is never a place, but a new way of seeing things.” – Henry Miller
2016 Voice of the Visitor

Many studies are available (including many by PGAV Destinations) about attractions and their characteristics. They are useful resources for designing, improving and shaping the ideal attraction customer experience. PGAV Destinations has become a recognized leader in both investing in tourism research and the incorporation of these consumer insights and trends into the planning process. For this survey, we wanted to get insights into the point of view of the visitors themselves about why they choose to visit attractions – or not to visit. After all, the goal of all of our hard work is a well-designed attraction with happy visitors; and ideally, the Holy Grail.. REPEAT VISITORS.
The 2016 Outlook on the Attractions Industry study was done in conjunction with our partners, H2R Market Research and Blooloop, among 1,006 U.S. leisure attraction visitors who have either visited an attraction in 2015 or are open to doing so in 2016.
The purpose is to provide an industry-standard dashboard that quantifies aggregate attractions’ industry performance and provides an outlook on future visits. This will be an annual forecasting report, using the same timing and methodology, making it a permanent resource for the attractions industry.
At PGAV, we plan and design extraordinary experiences, and we want all of our destinations to be high on the to-do lists of the traveling public; which, as it happens, is a very large audience. According to the U.S. Travel Association, U.S. residents logged 1.7 billion trips for leisure purposes in 2014, and more than three out of four domestic trips taken are for leisure purposes. Americans are eager to hit the road, and we’re just as eager to share the results of this benchmark survey.
So let’s go!
US Leisure Attraction Visitors
Surveyed
Domestic trips taken are for
leisure purposes
3 out of 4
1,006
trips for leisure purposes in 2014
U.S. residents logged
1.7 BILLION
Reference | https://www.ustravel.org/research/travel-industry-answer-sheet 5
more visitors“Once a year go someplace you’ve never been before.” - Dalai Lama
2016 Voice of the Visitor

The big news is, attraction visitors will visit even more attractions in 2016.
Based upon visitor input, the forecast for 2016 is for aggregate attractions’ industry visits to increase by 3%. This is driven by Generation Xers, Millennials, and minorities, along with a 5.1% increase in the average number of attraction visits expected per household.
This correlates with a study done by MMGY Global; the Traveler Sentiment IndexTM (TSI), which measures U.S. adults’ interest in travel, time for travel, personal finances available for travel, affordability of travel, quality of service, and safety of travel, all of which have grown to the highest level recorded since the survey’s inception in Q1 2007.*
Those attractions expected to see the most robust growth include Family Entertainment Centers (FEC) Large-Screen Format Theaters (LFT) Aquariums Historic Homes/Mansions
all expected to see attendance gains of 5% or more.
Fa
m i ly Ent e rta i n m e nt C e nt ers
La
rge-Scr e e n F or m at T h e at ers
A q u ar i u m s
Old H o m es / M a n s i o n S
86% of attractions visitors plan to travel for leisure in 2016
5% ATTENDANCE GAINS
Reference | *http://www.mmgyglobal.com/news/?p=2&contributor=News%20Release&category= 7

2016 Voice of the Visitor

On the MoveMost attractions visitors are optimistic about the direction the U.S. economy is heading. More than four out of five (83%) say they expect the economy to improve or stay about the same over the next six months, and those expecting improvement (42%) greatly outnumber those expecting things to get worse (17%). That’s a pretty optimistic view overall, and it’s helping to boost travel intent figures for 2016. The most economically optimistic segments of the attractions population are minorities (58%) and Gen. Xers (48%), while Matures and Baby Boomers tend to be the least optimistic demographic groups.
Overall, attraction visitors are loyal. The average intent to return to the same attraction last visited is 3.97 on a 5-point scale, with 71% indicating they probably/definitely will return in 2016. Intent, it’s important to note, varies widely by category.
MORE VISITORS
TOP SIX HIGHEST AVERAGE INTENT TO RETURN TO THE SAME ATTRACTION IN 2016 based on a 5 point scale
LARGE-FORMAT SCREEN
THEATERS
ZOO/ANIMAL ATTRACTIONS
FAMILY ENTERTAINMENT
CENTER
BOTANICAL GARDEN WATER PARK
SCIENCE CENTER/SCIENCE
ATTRACTION
45% dEFINITELY wILL
5% dEFINITELY wILL NOT
10% pROBABLY WILL NOT
14% MAY OR MAY NOT 26%
pROBABLY wILL
2015 GUESTS' INTENTION TO RETURN TO THE SAME ATTRACTION IN 2016
9

THEM
E PA
RKS
84%81%
76%
68%67% 67%
60% 59%
52%47%
ZOO
S/A
NIM
ALS
LARG
E FO
RMA
T TH
EATE
RS
FAM
ILY
ENTE
RTA
INM
ENT
CEN
TERS
WA
TER
PARK
S
SCIE
NC
E A
TTRA
CTI
ON
S
AQ
UA
RIU
MS
THEA
TERS
ART
GA
LLER
IES
BOTA
NIC
AL
GA
RDEN
S
REPEAT VISITORSPercentage of respondents who said their most recent attraction visit was not their first visit to that specific attraction.

Loyalty is important for reasons beyond the obvious. According to a previous PGAV survey, consumers are 42% more likely to use the products and services promoted within a brand destination after visiting it. (Destinology - Brand Destinations: The Power of Place, August 2015)
Repeatability is also important. Nearly two-thirds of all attraction visitation occurs from repeat visitors. Theme Parks and Zoos see the largest number of repeat customers while Sightseeing Tours and Old Homes/Mansions see the lowest repeat business. Intent to return in 2016 is uniformly high across the board; except with Matures, who seem to have gotten their fill of Museums and Zoos in 2015. Some of the intent to return numbers are quite high: for Millennials and Gen. Xers, many of the intent to return numbers double those of 2015. (Maybe some New Year’s resolutions?) Boomers reported more modest expectations; except for Theaters and Large-Format Screen Theaters, which appear to be high on to-do lists this year.
And what about those who don'’t intend to return in 2016? The “Been there, done that” factor is high for repeat visitors. A similar sentiment we saw was, “I’ve seen it all, and it won’t change.” So how do you turn one-timers into repeat visitors? Keep attractions fresh with new content, new information, and added perks à la apps to plan activities, dining options, or transportation.
43%41%
36%34%
MU
SEU
MS
HIS
TORI
C L
AN
DM
ARK
S
HIS
TORI
C H
OM
ES &
MA
NSI
ON
S
SIG
HTS
EEIN
G T
OU
RS
MORE VISITORS 11

who is going?“This year, I am going to take more time to be with my family and have fun.” - Guest
2016 Voice of the Visitor
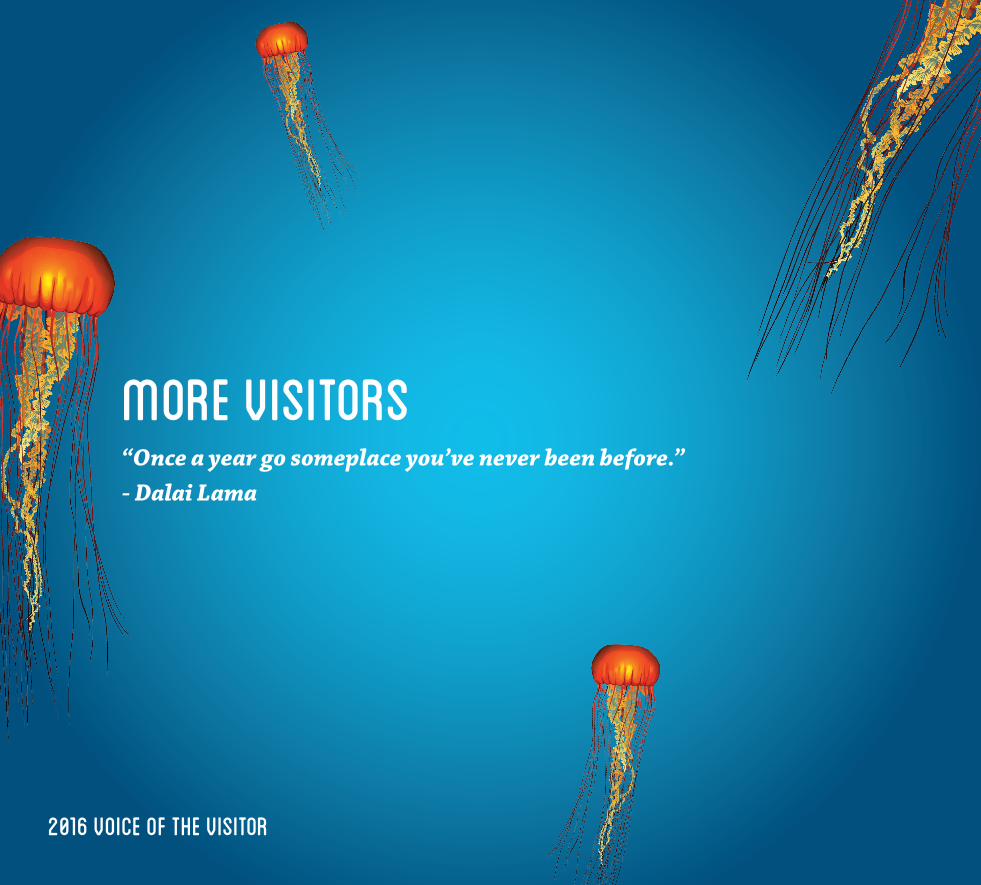
Who’'s going on a trip? Just about everyone!
Of the roughly 124 million households in the U.S. in 2015, 82% of them visited an attraction in 2015.
Nearly six in ten (59%) attraction visitors are Millennials or Gen. Xers under 51 years of age. But relative to the size of their
population, Baby Boomers are the generational bunch most likely to visit an attraction Not surprisingly, Millennials and Gen. Xers tend to visit different types of attractions (Animal
Attractions, Water and Theme Parks, FECs, etc.) than Boomers and Matures (Museums, Art Galleries, Historic Places,
Old Homes, etc.).
13

2015 VISITS OCCURRED WITH SEASON PASS/MEMBERSHIP
THEM
E PA
RKS
33%
WA
TER
PARK
S
30%
ZOO
S/A
NIM
ALS
25%
MU
SEU
MS
18%
AQ
UA
RIU
MS
16%
SCIE
NC
E A
TTRA
CTI
ON
S
16%
BOTA
NIC
AL
GA
RDEN
S
16%
THEA
TERS
11%SI
GH
TSEE
ING
TO
URS
10%
LARG
E FO
RMA
T TH
EATE
RS
10%

Baby Boomers now contribute just 16% of the family visits for the attractions’ industry.Interestingly, nearly half (45%) of all families with children are Millennials, and more than half (54%) of all Millennials visit with children. Which perhaps points to an increase in summer travel: according to a survey conducted by Citibank and Wakefield Research, nearly half (46 percent) of travelers are likely to take multiple weekend trips during the summer.*
More than one-third (37%) of all self-reported attraction visits were generated by customers who were season pass holders, annual pass holders, or members of the attraction they visited. As a result of duplication across attractions, the 37% ratio is higher than the total for any one attraction category. In terms of individual cohorts, Matures were the least inclined toward annual membership, while Gen. Xers were the most frequent users of season passes.
Attraction visitors with college educations earn household incomes ($82.7k) that are nearly $30,000 higher than those who did not earn a college degree ($52.8k). Those who visit attractions in their communities are both younger (44 yrs vs. 47 yrs) and have lower incomes ($63.5 vs. $73k) than those who visit attractions while traveling.
ART
GA
LLER
IES
10%
FAM
ILY
ENTE
RTA
INM
ENT
C
ENTE
RS
10%
HIS
TORI
C
LAN
DM
ARK
S
9%
HIS
TORI
C H
OM
ES
& M
AN
SIO
NS
8%
who is going?Reference | *http://www.wakefieldresearch.com/blog/2015/06/12/
hitting-the-road-5-travel-trends-for-summer-2015 15
who is going WHERE?“My family always loves going to new places and trying new things. We try to get out and explore as often as possible.” - Guest
2016 Voice of the Visitor

So, where did everyone go’?Survey respondents reported which of the following types of attractions they visited in 2015.
17

First of all, who is the typical attraction visitor?
2016 Voice of the Visitor

Here she is; let’s call her Jennifer.
Jennifer is a white female, aged 41 or older, with an annual household income above $50K.
She...• Does not have a college degree• Expects the economy to stay the same or improve• Visits attraction websites as her primary planning tool• Uses Facebook more than any other social media outlet• Is visiting an attraction within 50 miles of home• Thinks that friendly staff members/volunteers are the most
important attribute of an attraction
She also traveled more than 50 leisure miles total in 2015, likely went to a national park, plans to travel for leisure in 2016, and will likely visit one of these locations:
OrlandoNew York CityLas VegasFlorida Gulf CoastSan Diego Tampa areaGatlinburg/Pigeon Forge areaSan FranciscoAustin, TX
who is the typical ATTRACTION visitor?
who is going where? 19

2016 Voice of the Visitor

Both Zoos and Theme Parks came in highest for college-educated visitors and those without a college education. Minorities and Millennials scored lowest on overall satisfaction with their most recent attraction visit.
Matures and Boomers scored highest. More than half (56%) of aggregate attraction visits in 2015 was generated from tourists traveling more than 50 miles from home. Gen. Xers and Millennials were the most inclined to stick close to home. Sightseeing Tours (86%), Old Homes/Mansions (76%), and Theme Parks (73%) are typical of attractions that generated the largest ratio of gross visitation from travelers.
Large-Format Screen Theaters (30%), Theaters (33%), and Family Entertainment Centers (40%) attracted the fewest visits from travelers in 2015.
In addition to travel intentions, we also asked about the last attraction visited, offering the same list of choices. Not surprisingly, answers varied according to cohort:
Millennials1. Zoo/Animal Attraction2. Theme Park3. Family Entertainment Center(Art Galleries and Sightseeing Tours tied for last)
Gen Xers1. Theme Park2. Zoo/Animal Attraction3. Museum & Historic Landmark/Places (tie)(Art Galleries came in last)
Boomers1. Historic Landmarks/Places2. Museum3. Theme Park(Old homes/mansions came in last)
Matures1. Theater2. Zoo/Animal Attraction3. Theme Park & Museums (tie)(Art Galleries came in last)
who is going where?Interestingly enough, Art Galleries also scored low even amongst resident attraction visitors.
LAST attraction visited in 2015
21
going online’before getting in line
2016 Voice of the Visitor
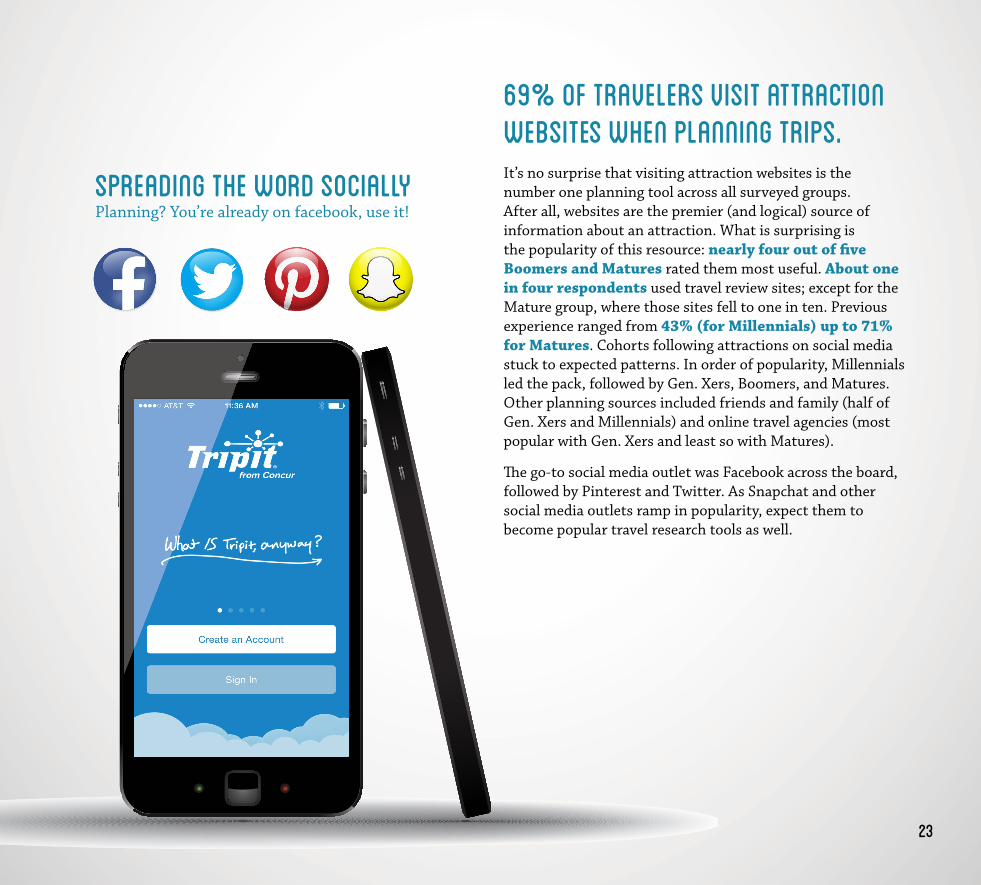
It’s no surprise that visiting attraction websites is the number one planning tool across all surveyed groups. After all, websites are the premier (and logical) source of information about an attraction. What is surprising is the popularity of this resource: nearly four out of five Boomers and Matures rated them most useful. About one in four respondents used travel review sites; except for the Mature group, where those sites fell to one in ten. Previous experience ranged from 43% (for Millennials) up to 71% for Matures. Cohorts following attractions on social media stuck to expected patterns. In order of popularity, Millennials led the pack, followed by Gen. Xers, Boomers, and Matures. Other planning sources included friends and family (half of Gen. Xers and Millennials) and online travel agencies (most popular with Gen. Xers and least so with Matures).
The go-to social media outlet was Facebook across the board, followed by Pinterest and Twitter. As Snapchat and other social media outlets ramp in popularity, expect them to become popular travel research tools as well.
SPREADING THE WORD SOCIALLY Planning? You’re already on facebook, use it!
69% of travelers visit attraction websites when planning trips.
23

2016 Voice of the Visitor
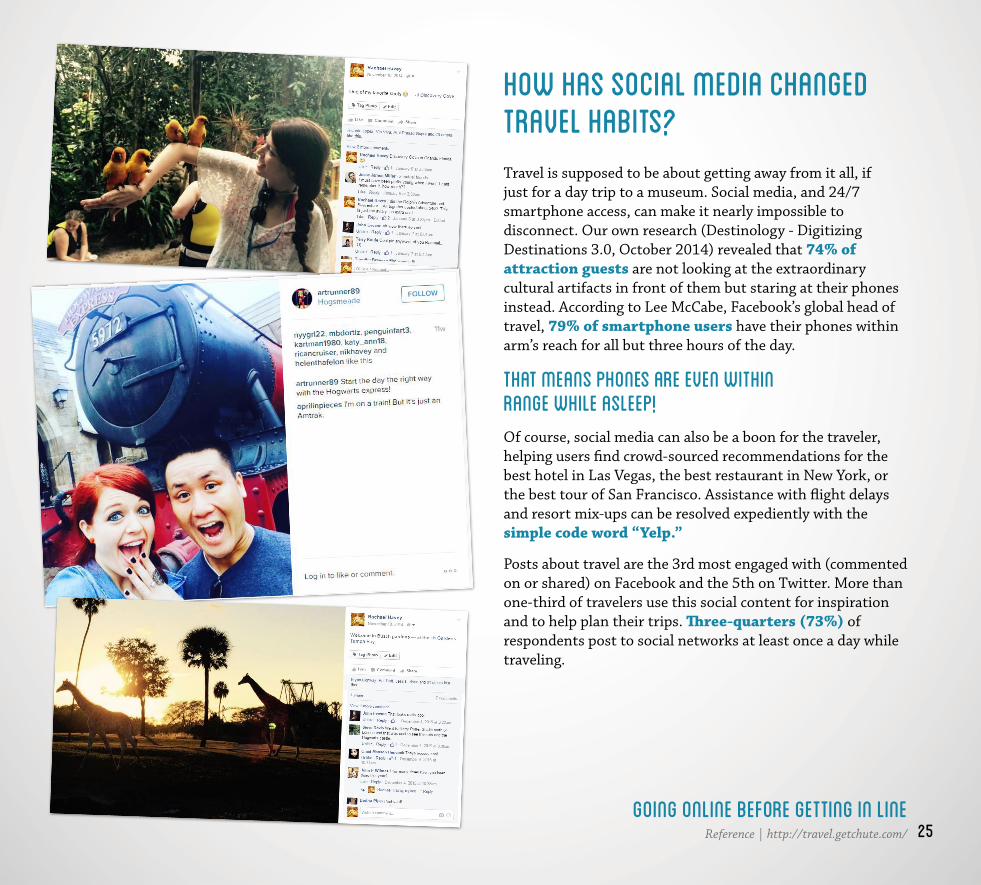
Travel is supposed to be about getting away from it all, if just for a day trip to a museum. Social media, and 24/7 smartphone access, can make it nearly impossible to disconnect. Our own research (Destinology - Digitizing Destinations 3.0, October 2014) revealed that 74% of attraction guests are not looking at the extraordinary cultural artifacts in front of them but staring at their phones instead. According to Lee McCabe, Facebook’s global head of travel, 79% of smartphone users have their phones within arm’s reach for all but three hours of the day.
That means phones are even within range while asleep! Of course, social media can also be a boon for the traveler, helping users find crowd-sourced recommendations for the best hotel in Las Vegas, the best restaurant in New York, or the best tour of San Francisco. Assistance with flight delays and resort mix-ups can be resolved expediently with the simple code word “Yelp.”
Posts about travel are the 3rd most engaged with (commented on or shared) on Facebook and the 5th on Twitter. More than one-third of travelers use this social content for inspiration and to help plan their trips. Three-quarters (73%) of respondents post to social networks at least once a day while traveling.
HOW HAS SOCIAL MEDIA CHANGED TRAVEL HABITS?
going online before getting in lineReference | http://travel.getchute.com/ 25

GUEST SATISFACTION“You can’t always get what you want…but if you try sometime, you find, you get what you need.” - Mick Jagger and Keith Richards
2016 Voice of the Visitor
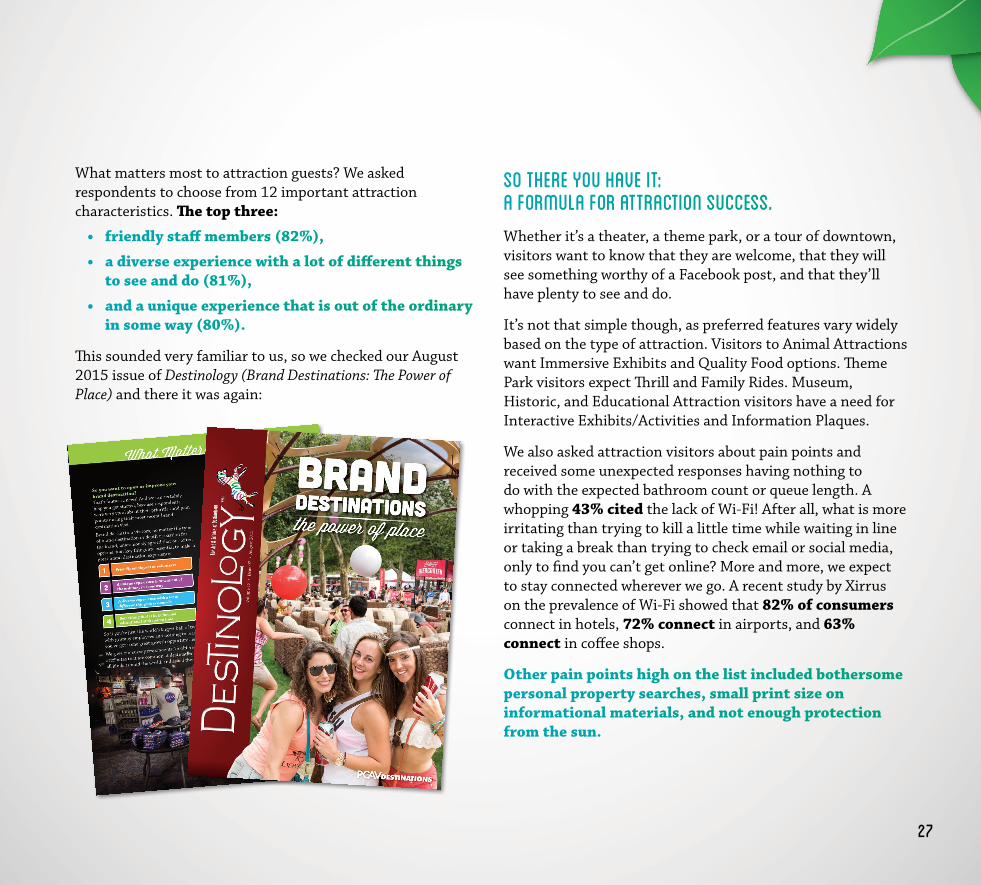
So there you have it: a formula for attraction success. Whether it’s a theater, a theme park, or a tour of downtown, visitors want to know that they are welcome, that they will see something worthy of a Facebook post, and that they’ll have plenty to see and do.
It’s not that simple though, as preferred features vary widely based on the type of attraction. Visitors to Animal Attractions want Immersive Exhibits and Quality Food options. Theme Park visitors expect Thrill and Family Rides. Museum, Historic, and Educational Attraction visitors have a need for Interactive Exhibits/Activities and Information Plaques.
We also asked attraction visitors about pain points and received some unexpected responses having nothing to do with the expected bathroom count or queue length. A whopping 43% cited the lack of Wi-Fi! After all, what is more irritating than trying to kill a little time while waiting in line or taking a break than trying to check email or social media, only to find you can’t get online? More and more, we expect to stay connected wherever we go. A recent study by Xirrus on the prevalence of Wi-Fi showed that 82% of consumers connect in hotels, 72% connect in airports, and 63% connect in coffee shops.
Other pain points high on the list included bothersome personal property searches, small print size on informational materials, and not enough protection from the sun.
What matters most to attraction guests? We asked respondents to choose from 12 important attraction characteristics. The top three:
• friendly staff members (82%),
• a diverse experience with a lot of different things to see and do (81%),
• and a unique experience that is out of the ordinary in some way (80%).
This sounded very familiar to us, so we checked our August 2015 issue of Destinology (Brand Destinations: The Power of Place) and there it was again:
27
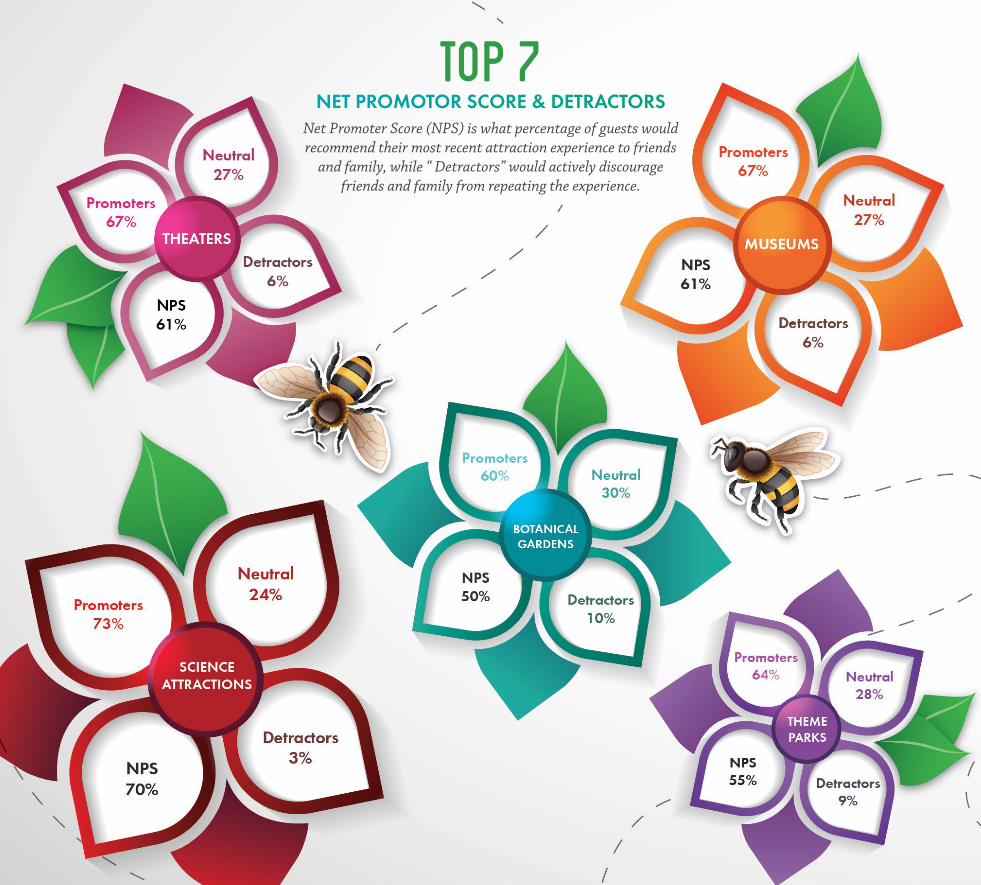
TOP 7 NET PROMOTOR SCORE & DETRACTORS
Net Promoter Score (NPS) is what percentage of guests would recommend their most recent attraction experience to friends
and family, while “ Detractors” would actively discourage friends and family from repeating the experience.
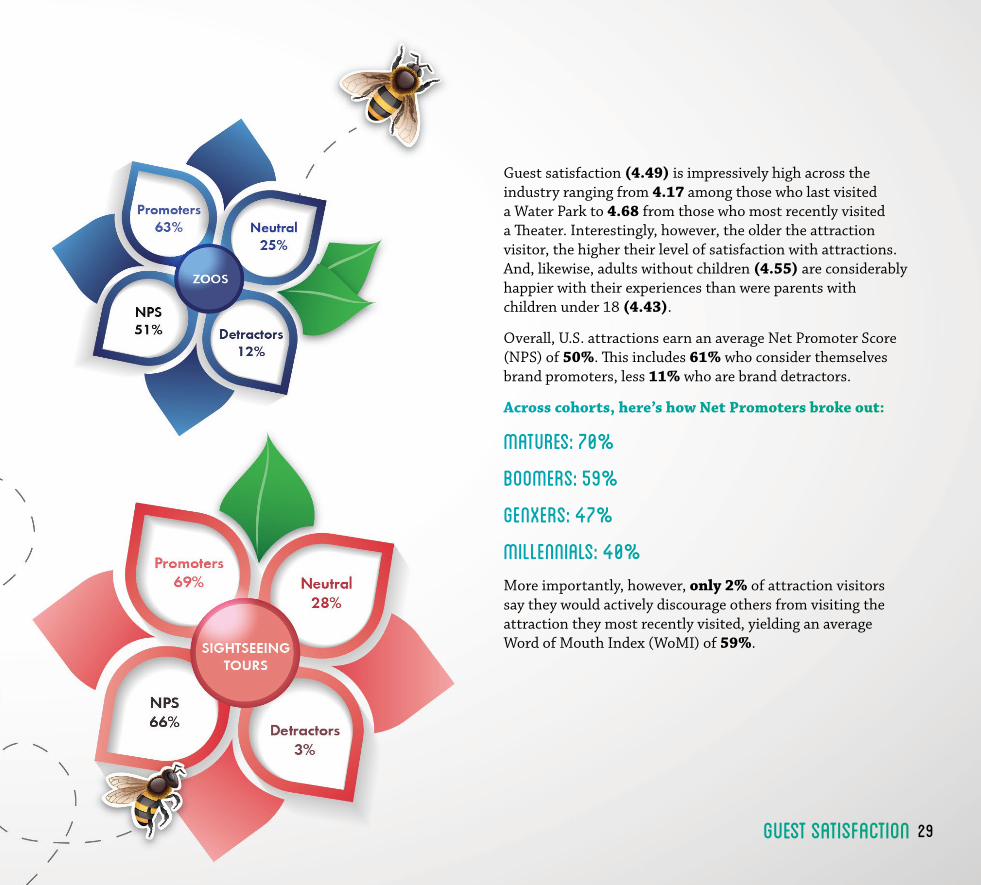
Guest satisfaction (4.49) is impressively high across the industry ranging from 4.17 among those who last visited a Water Park to 4.68 from those who most recently visited a Theater. Interestingly, however, the older the attraction visitor, the higher their level of satisfaction with attractions. And, likewise, adults without children (4.55) are considerably happier with their experiences than were parents with children under 18 (4.43).
Overall, U.S. attractions earn an average Net Promoter Score (NPS) of 50%. This includes 61% who consider themselves brand promoters, less 11% who are brand detractors.
Across cohorts, here’s how Net Promoters broke out:
Matures: 70%
Boomers: 59%
GenXers: 47%
Millennials: 40%More importantly, however, only 2% of attraction visitors say they would actively discourage others from visiting the attraction they most recently visited, yielding an average Word of Mouth Index (WoMI) of 59%.
guest satisfaction 29
boomers“We are empty nesters and we have more time for travel.” - Guest
age 52-71

When we asked Baby Boomers where they visited most recently, only 13% of them said a Zoo or an Animal Attraction. This makes some sense when you consider the zoos of Boomer youth. Throughout the evolution of zoos, education has taken a more prominent role in the zoo experience with far more information available about the animals and their environments. For example, if you’re looking at a lion, there is a good chance you’re in a themed portion of the zoo that teaches you about the lion’s habits and habitats.
Today’s zoo will inform you, engage you, and entertain you. Staff are more informed and more available; food choices abound beyond popcorn and soda; and you can find inviting, comfortable places to rest during your visit.
With so much of the attraction world having changed for the better, Boomers will likely be steady travelers for as long as they’re able to keep pace. In fact, AARP reports that practically all Baby Boomers (99%) anticipate traveling for leisure in 2016, with approximately four or five trips already in the works.
And why not, with all of those marvelous experiences waiting?
Museums and Historic Landmarks scored high with Boomers as 47% visited one in 2015. On the other end of the spectrum, science centers and water parks came in at 15% and 12%.
MORE THAN ONE IN TEN noted a historic place as their last attraction visited and 71% intend to return to the last attraction visited.
Some 84% are traveling without kids; 38% are from the South and the split between those who have a college degree and those who don’t is just about even.
Six in 10 (63%) are repeat visitors and only 12% are season pass members.
NINE in 10 (88%) preferred Facebook over other social media sites.
When it comes to planning an attraction visit, 69% look at attraction websites and 52% check brand websites (such as Disney or Smithsonian.)
31

Millennials“A museum is a place where one should lose one’s head.” - Renzo Piano
age 16-36

We do know one thing... Millennials are firmly attached to their mobile devices, and those mobile devices have to play a part in how Millennials are engaged. Online platforms have become a key extension of everyday experiences, allowing Millennials to move through the world taking along their network of family and friends. Facebook has changed the meaning of the phrase “group activity.” Going to the supermarket; commuting to work; and waiting in line at an amusement park are all fodder for group activities!
So Wi-Fi is a must, both to keep everyone occupied while waiting in lines and to publicize their social lives. Wi-Fi, in short, invites everyone to the party.
The tech factor is changing traditional behavior in other ways. Conventional wisdom holds that museums are places for quiet reflection and to be alone with one’s thoughts and world masterpieces; but that doesn’t translate to Millennials. The key to reaching Millennials is enabling them to share their impressions of Impressionism, with or without a selfie stick. Discussing an exhibit with friends is as simple as an Instagram post or a Facebook event.
According to our Digitizing Destinations 3.0 study, nearly two-thirds of respondents said that improved technological features inspire them to stay longer at a attraction. For example, there are apps available that enable users to navigate around a museum or gallery, obtain exhibit-specific information, and share it all on social media.
Millennials are homebodies 63% frequented attractions within 50 miles of home.
They’ are loyal Two-thirds were repeat visitors.
Nearly 60% went to a zoo or animal attraction, and even more plan to go in 2016.
Less than 10% went to a historic home or mansion.
Half went to a theater (in spite of Netflix!)
And, the up-close-and-personal factor is important. Four out of five chose thrill rides as a preferred attraction feature, with 71% choosing interactive exhibits or activities as key. (By comparison, the Mature cohort’s most important feature was informational plaques.)
According to Hipmunk*, 63% of Millennials planned to take more trips in 2015 than they did in 2014. Our own research points to intent carrying through in 2016. Roughly 94% say they probably or definitely will visit attractions this year.
Much has been made of Millennial behavior patterns and motivations, particularly since they are a very appealing demographic for marketers. They’d rather rent than buy homes; they want more bang for their entertainment buck; and they are not influenced by advertising.
Reference | *http://www.marketwired.com/press-re-lease/hipmunk-uncovers-what-millennial-travel-ers-really-want-and-its-not-housekeeping-2006236.htmgetchute.com/
33
Attraction DATA TIDBITS“I haven’t been everywhere, but it’s on my list.” - Susan Sontag
2016 Voice of the Visitor
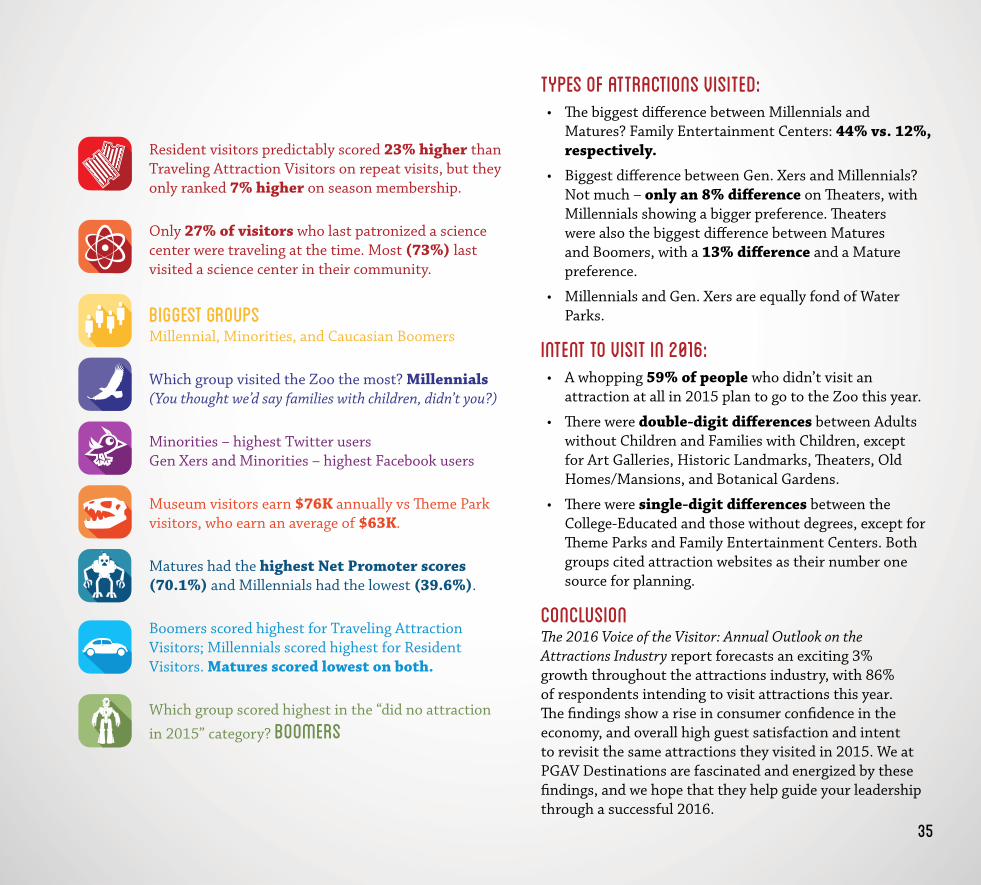
Types of attractions visited: • The biggest difference between Millennials and
Matures? Family Entertainment Centers: 44% vs. 12%, respectively.
• Biggest difference between Gen. Xers and Millennials? Not much – only an 8% difference on Theaters, with Millennials showing a bigger preference. Theaters were also the biggest difference between Matures and Boomers, with a 13% difference and a Mature preference.
• Millennials and Gen. Xers are equally fond of Water Parks.
Intent to visit in 2016: • A whopping 59% of people who didn’t visit an
attraction at all in 2015 plan to go to the Zoo this year.
• There were double-digit differences between Adults without Children and Families with Children, except for Art Galleries, Historic Landmarks, Theaters, Old Homes/Mansions, and Botanical Gardens.
• There were single-digit differences between the College-Educated and those without degrees, except for Theme Parks and Family Entertainment Centers. Both groups cited attraction websites as their number one source for planning.
Conclusion The 2016 Voice of the Visitor: Annual Outlook on the Attractions Industry report forecasts an exciting 3% growth throughout the attractions industry, with 86% of respondents intending to visit attractions this year. The findings show a rise in consumer confidence in the economy, and overall high guest satisfaction and intent to revisit the same attractions they visited in 2015. We at PGAV Destinations are fascinated and energized by these findings, and we hope that they help guide your leadership through a successful 2016.
Resident visitors predictably scored 23% higher than Traveling Attraction Visitors on repeat visits, but they only ranked 7% higher on season membership.
Only 27% of visitors who last patronized a science center were traveling at the time. Most (73%) last visited a science center in their community.
Biggest groups Millennial, Minorities, and Caucasian Boomers
Which group visited the Zoo the most? Millennials (You thought we’d say families with children, didn’t you?)
Minorities – highest Twitter users Gen Xers and Minorities – highest Facebook users
Museum visitors earn $76K annually vs Theme Park visitors, who earn an average of $63K.
Matures had the highest Net Promoter scores (70.1%) and Millennials had the lowest (39.6%).
Boomers scored highest for Traveling Attraction Visitors; Millennials scored highest for Resident Visitors. Matures scored lowest on both.
Which group scored highest in the “did no attraction
in 2015” category? Boomers
35

2015 Findings By Attraction Category

Aquariums
Art Galleries
Botanical Gardens
Family Entertainment Centers
Historic Homes/Mansions
Historic Landmarks
Large Format Theaters
Museums
Science Attractions
Sightseeing Tours
Theaters
Theme Parks
Water Park
Zoos/Animals
pg 39
pg 41
pg 43
pg 45
pg 47
pg 49
pg 51
pg 53
pg 55
pg 57
pg 59
pg 61
pg 63
pg 65
372016 Voice of the Visitor
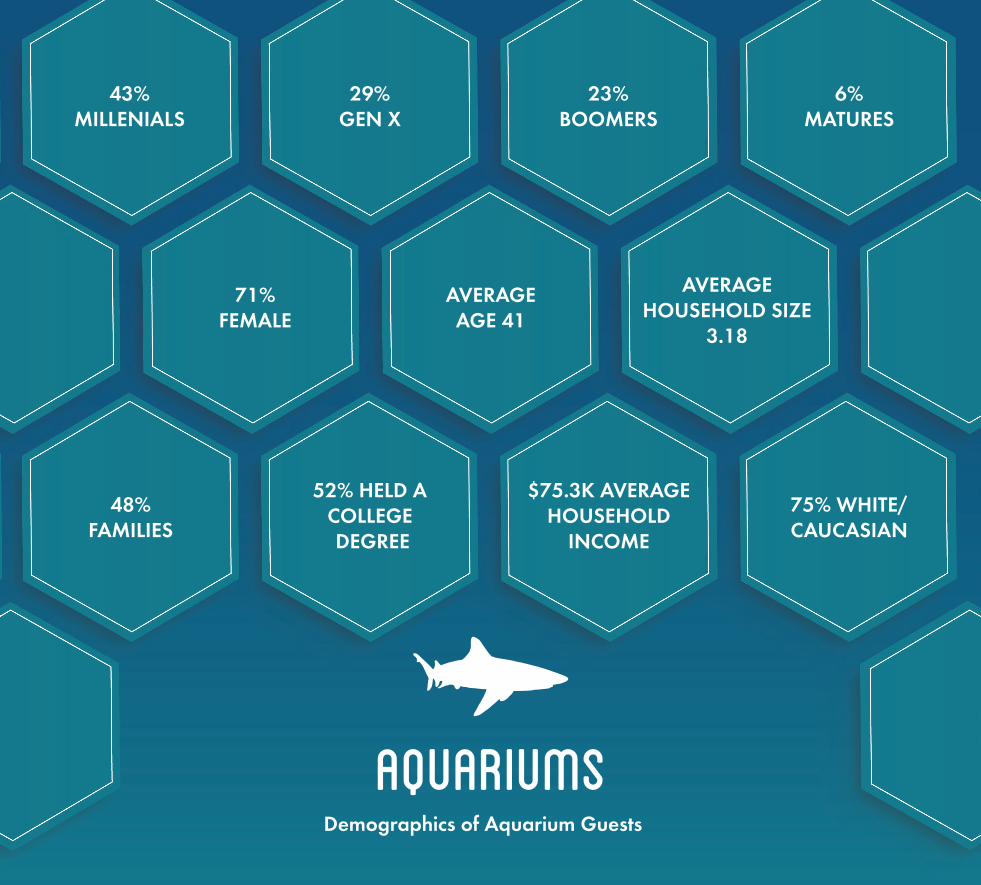
AQUARIUMS
71% FEMALE
AVERAGE AGE 41
43% MILLENIALS
48% FAMILIES
52% HELD A COLLEGE DEGREE
$75.3K AVERAGE HOUSEHOLD
INCOME
75% WHITE/CAUCASIAN
29% GEN X
23% BOOMERS
6% MATURES
AVERAGE HOUSEHOLD SIZE
3.18
Demographics of Aquarium Guests

AQUARIUMS
2015 REVIEW30% of respondents visited an aquarium in 2015.
62% of those who visited an aquarium in 2015 did so while traveling more than 50 miles from home.
16% of respondents held a 2015 aquarium membership.
6% of respondents noted that an aquarium was their most recent attraction visit.
60% of respondents noted that this was not their first time visiting this particular aquarium.
During their most recent attraction visit, 50% of respondents visited an aquarium as a family with children under the age of 18.
61% of those who visited an aquarium in 2015 were likely to recommend it to family and friends.
16% of those who visited an aquarium in 2015 were likely to discourage family and friends from going.
82% of those who visited an aquarium in 2015 also took a vacation.
For those respondents whose most recent attraction visit was an aquarium, aquariums scored an average 4.51 on a five-point scale on overall satisfaction.
Of those guests who visited an aquarium, 67% also visited a Zoo, 60% visited a Museum, and 58% visited a Theater, and 50% visited a Theme Park.
2016 FORECASTOn a five point scale, aquariums scored an average of 4.08 when respondents were asked their likelihood to return to the same aquarium in 2016.
Based on the responses of all survey participants, aquarium attendance is forecasted to rise by 5.0% in 2016.
71% of respondents who visited an aquarium in 2015 expect the US economy to improve in 2016.
For those respondents who intend to visit an aquarium in 2016, Immersive Animal Exhibits, Information Plaques, and Live Demonstrations are the top three priorities.
39
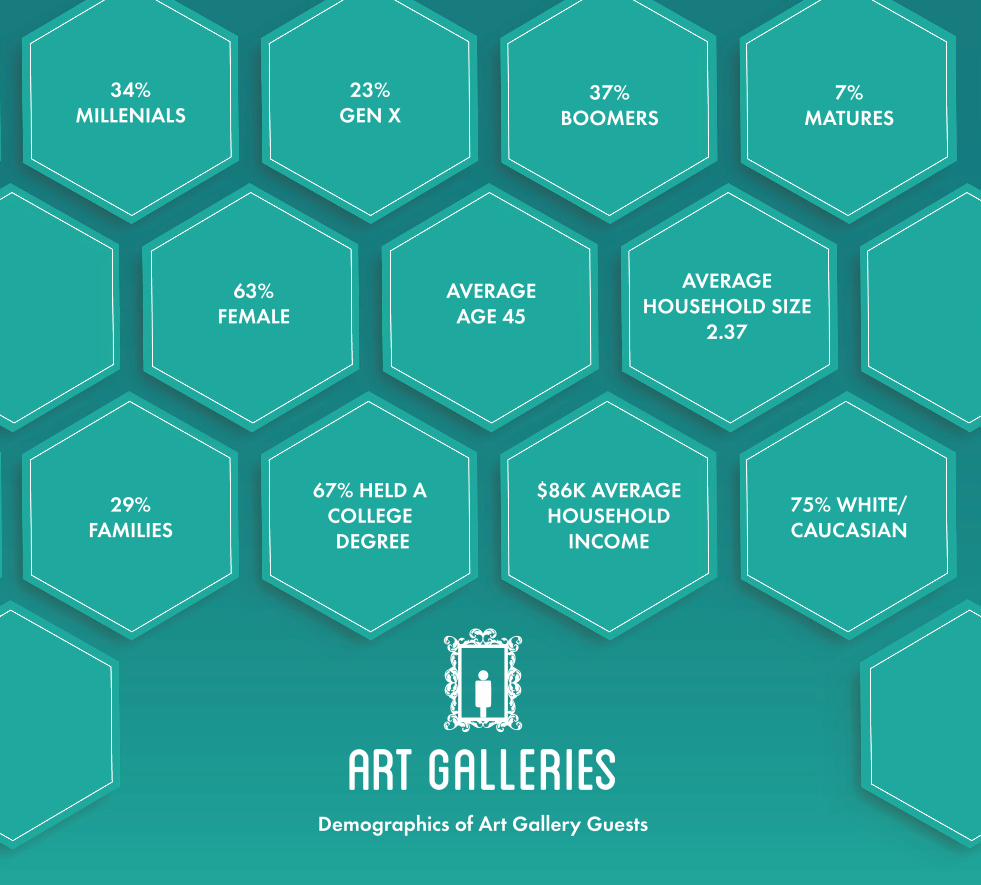
art galleries
63% FEMALE
AVERAGE AGE 45
34% MILLENIALS
29% FAMILIES
67% HELD A COLLEGE DEGREE
$86K AVERAGE HOUSEHOLD
INCOME
75% WHITE/CAUCASIAN
23% GEN X
37% BOOMERS
7% MATURES
AVERAGE HOUSEHOLD SIZE
2.37
Demographics of Art Gallery Guests

art galleries
2015 REVIEW18% of respondents visited an art gallery in 2015.
60% of those who visited an art gallery in 2015 did so while traveling more than 50 miles from home.
10% of respondents held a 2015 art gallery membership.
2% of respondents noted that an art gallery was their most recent attraction visit.
52% of respondents noted that this was not their first time visiting this particular art gallery.
During their most recent attraction visit, 19% of respondents visited an art gallery as a family with children under the age of 18.
50% of those who visited an art gallery in 2015 were likely to recommend it to family and friends.
14% of those who visited an art gallery in 2015 were likely to discourage family and friends from going.
89% of those who visited an art gallery in 2015 also took a vacation.
For those respondents whose most recent attraction visit was an art gallery, art galleries scored an average 4.58 on a five-point scale on overall satisfaction.
Of those guests who visited an art gallery, 76% also visited a Museum, 68% visited a Theater, 60% visited a Historic Landmark, and 57% visited a Zoo.
2016 FORECASTOn a five point scale, art galleries scored an average of 4.05 when respondents were asked their likelihood to return to the same art gallery in 2016.
Based on the responses of all survey participants, art gallery attendance is forecasted to rise by 2.2% in 2016.
55% of respondents who visited an art gallery in 2015 expect the US economy to improve in 2016.
For those respondents who intend to visit an art gallery in 2016, Information Plaques, Rotating Exhibits, Self-guided Tours, and Interactive Exhibits are the top four priorities.
41

BOTANICAL GARDENs
66% FEMALE
AVERAGE AGE 47
26% MILLENIALS
33% FAMILIES
59% HELD A COLLEGE DEGREE
$84.7K AVERAGE HOUSEHOLD
INCOME
82% WHITE/CAUCASIAN
26% GEN X
39% BOOMERS
8% MATURES
AVERAGE HOUSEHOLD SIZE
2.59
Demographics of Botanical Garden Guests
botanical gardens
2015 REVIEW20% of respondents visited a botanical garden in 2015.
57% of those who visited a botanical garden in 2015 did so while traveling more than 50 miles from home.
16% of respondents held a 2015 botanical garden membership.
3% of respondents noted that a botanical garden was their most recent attraction visit.
47% of respondents noted that this was not their first time visiting this particular botanical garden.
During their most recent attraction visit, 28% of respondents visited a botanical garden as a family with children under the age of 18.
60% of those who visited a botanical garden in 2015 were likely to recommend it to family and friends.
10% of those who visited a botanical garden in 2015 were likely to discourage family and friends from going.
85% of those who visited a botanical garden in 2015 also took a vacation.
For those respondents whose most recent attraction visit was a botanical garden, botanical gardens scored an average 4.56 on a five-point scale on overall satisfaction.
Of those guests who visited a botanical garden, 66% also visited a Museum, 60% visited a Zoo, 58% visited a Historic Landmark, 57% visited a Theater, and 50% visited an Aquarium.
2016 FORECASTOn a five point scale, botanical gardens scored an average of 4.2 when respondents were asked their likelihood to return to the same botanical garden in 2016.
Based on the responses of all survey participants, botanical garden attendance is forecasted to rise by 3.4% in 2016.
57% of respondents who visited a botanical garden in 2015 expect the US economy to improve in 2016.
For those respondents who intend to visit a botanical garden in 2016, Interactive Exhibits, Live Demonstrations, and Educational Programs are the top three priorities.
43
family entertainment centers
66% FEMALE
AVERAGE AGE 47
26% MILLENIALS
33% FAMILIES
59% HELD A COLLEGE DEGREE
$84.7K AVERAGE HOUSEHOLD
INCOME
82% WHITE/CAUCASIAN
26% GEN X
39% BOOMERS
8% MATURES
AVERAGE HOUSEHOLD SIZE
2.59
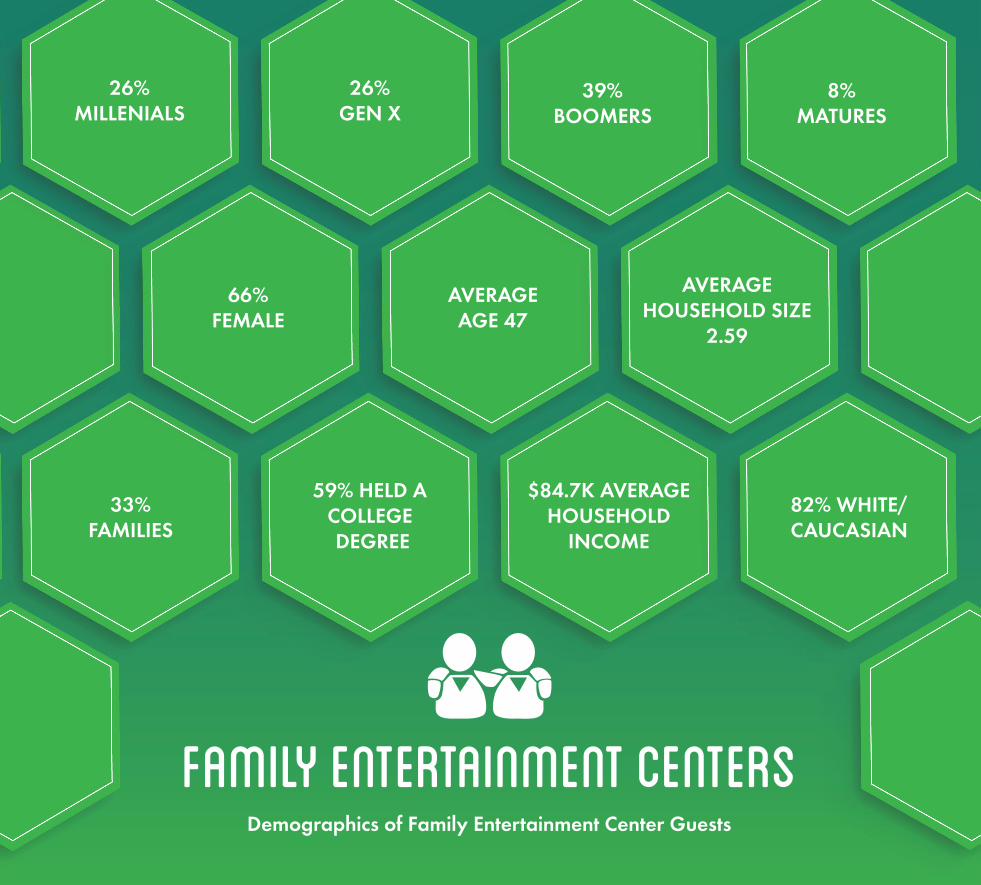
Demographics of Family Entertainment Center Guests

family entertainment centers
2015 REVIEW33% of respondents visited a FEC in 2015.
55% of those who visited a FEC in 2015 did so while traveling more than 50 miles from home.
10% of respondents held a 2015 FEC membership.
7% of respondents noted that a FEC was their most recent attraction visit.
68% of respondents noted that this was not their first time visiting this particular FEC.
During their most recent attraction visit, 48% of respondents visited a FEC as a family with children under the age of 18.
51% of those who visited a FEC in 2015 were likely to recommend it to family and friends.
12% of those who visited a FEC in 2015 were likely to discourage family and friends from going.
77% of those who visited a FEC in 2015 also took a vacation.
28% of respondents who visited a FEC in 2015 expect the US economy to improve in 2016.
For those respondents whose most recent attraction visit was a FEC, FECs scored an average 4.47 on a five-point scale on overall satisfaction.
Of those guests who visited a FEC, 59% also visited a Zoo, 58% visited a Theater, 54% visited a Theme Park, and 50% visited a Museum.
2016 FORECASTOn a five point scale, FECs scored an average of 4.25 when respondents were asked their likelihood to return to the same FEC in 2016.
Based on the responses of all survey participants, FEC attendance is forecasted to rise by 6.6% in 2016.
28% of respondents who visited a FEC in 2015 expect the US economy to improve in 2016.
For those respondents who intend to visit a FEC in 2016, Quality Food, Kids Play Areas, and Live Demonstrations are the top three priorities.
45

HISTORIC HOME & MANSIONs
64% FEMALE
AVERAGE AGE 51
20% MILLENIALS
28% FAMILIES
54% HELD A COLLEGE DEGREE
$79.5K AVERAGE HOUSEHOLD
INCOME
87% WHITE/CAUCASIAN
24% GEN X
44% BOOMERS
12% MATURES
AVERAGE HOUSEHOLD SIZE
2.41
Demographics of Family Entertainment Center Guests

historic homes & mansions
2015 REVIEW15% of respondents visited a historic home or mansion in 2015.
66% of those who visited a historic home or mansion in 2015 did so while traveling more than 50 miles from home.
8% of respondents held a 2015 historic home or mansion membership.
3% of respondents noted that a historic home or mansion was their most recent attraction visit.
36% of respondents noted that this was not their first time visiting this particular historic home or mansion.
During their most recent attraction visit, 28% of respondents visited a historic home or mansion as a family with children under the age of 18.
56% of those who visited a historic home or mansion in 2015 were likely to recommend it to family and friends.
12% of those who visited a historic home or mansion in 2015 were likely to discourage family and friends from going.
82% of those who visited a historic home or mansion in 2015 also took a vacation.
For those respondents whose most recent attraction visit was a historic home or mansion, historic homes and mansions scored an average 4.51 on a five-point scale on overall satisfaction.
Of those guests who visited a historic home or mansion, 76% also visited a Historic Landmark, 72% visited a Museum, 55% visited a Theater, and 51% visited a Zoo.
2016 FORECASTOn a five point scale, historic home or mansions scored an average of 3.16 when respondents were asked their likelihood to return to the same historic home or mansion in 2016.
Based on the responses of all survey participants, historic home and mansion attendance is forecasted to rise by 5.0% in 2016.
48% of respondents who visited a historic home or mansion in 2015 expect the US economy to improve in 2016.
For those respondents who intend to visit a historic home or mansion in 2016, Information Plaques, Guided Tours, and Quality Food are the top three priorities.
47
HISTORIC LANDMARKS
66% FEMALE
AVERAGE AGE 51
18% MILLENIALS
18% FAMILIES
49% HELD A COLLEGE DEGREE
$69.7K AVERAGE HOUSEHOLD
INCOME
92% WHITE/CAUCASIAN
24% GEN X
50% BOOMERS
8% MATURES
AVERAGE HOUSEHOLD SIZE
2.3
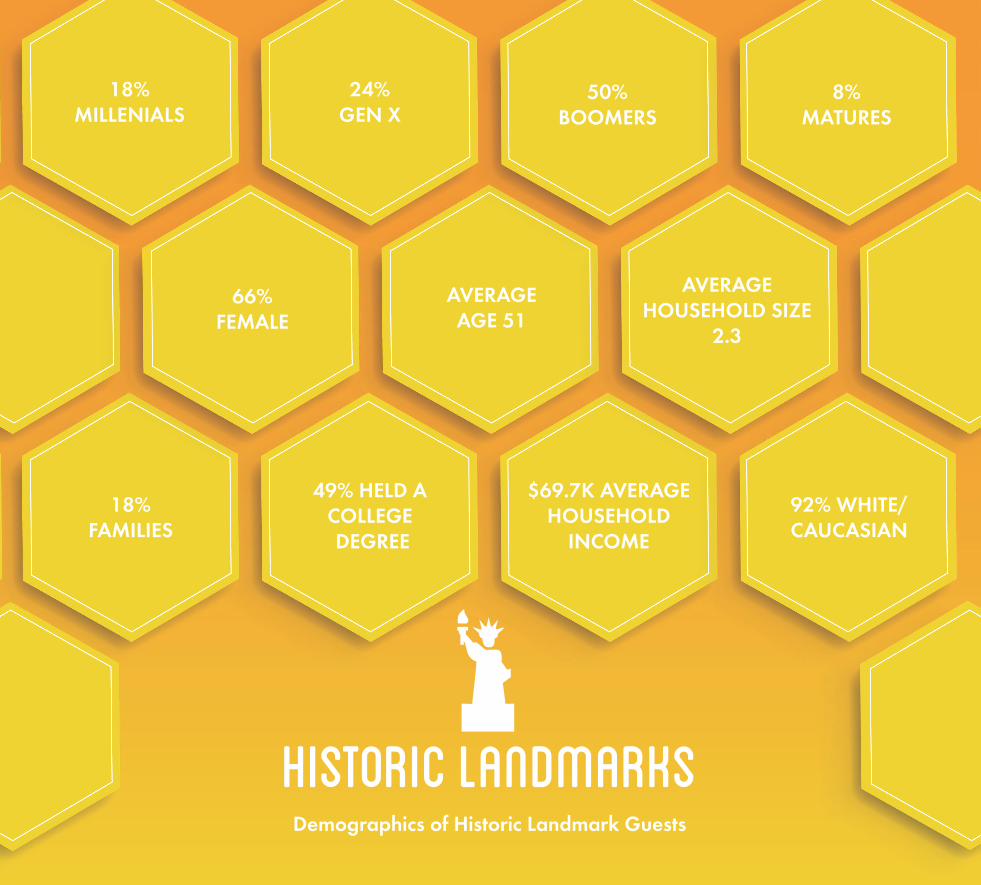
Demographics of Historic Landmark Guests

historic landmarks
2015 REVIEW40% of respondents visited a historic landmark in 2015.
58% of those who visited a historic landmark in 2015 did so while traveling more than 50 miles from home.
9% of respondents held a 2015 historic landmark membership.
11% of respondents noted that a museum was their most recent attraction visit.
41% of respondents noted that this was not their first time visiting this particular historic landmark.
During their most recent attraction visit, 15% of respondents visited a museum as a family with children under the age of 18.
56% of those who visited a historic landmark in 2015 were likely to recommend it to family and friends.
12% of those who visited a historic landmark in 2015 were likely to discourage family and friends from going.
84% of those who visited a historic landmark in 2015 also took a vacation.
For those respondents whose most recent attraction visit was a historic home or mansion, historic homes and mansions scored an average 4.58 on a five-point scale on overall satisfaction.
Of those guests who visited a historic landmark, 64% also visited a Museum, 51% visited a Theater, and 50% visited a Zoo.
2016 FORECASTOn a five point scale, historic landmarks scored an average of 3.3 when respondents were asked their likelihood to return to the same historic landmark in 2016.
Based on the responses of all survey participants, historic landmark attendance is forecasted to rise by 2.3% in 2016.
39% of respondents who visited a museum in 2015 expect the US economy to improve in 2016.
For those respondents who intend to visit a historic landmark in 2016, Information Plaques, Guided Tours, and Quality Food are the top three priorities.
49
LARGE FORMAT THEATERS
69% FEMALE
AVERAGE AGE 41
42% MILLENIALS
45.4% FAMILIES
56.8% HELD A COLLEGE DEGREE
$74.5K AVERAGE HOUSEHOLD
INCOME
77% WHITE/CAUCASIAN
31% GEN X
23% BOOMERS
4% MATURES
AVERAGE HOUSEHOLD SIZE
2.83
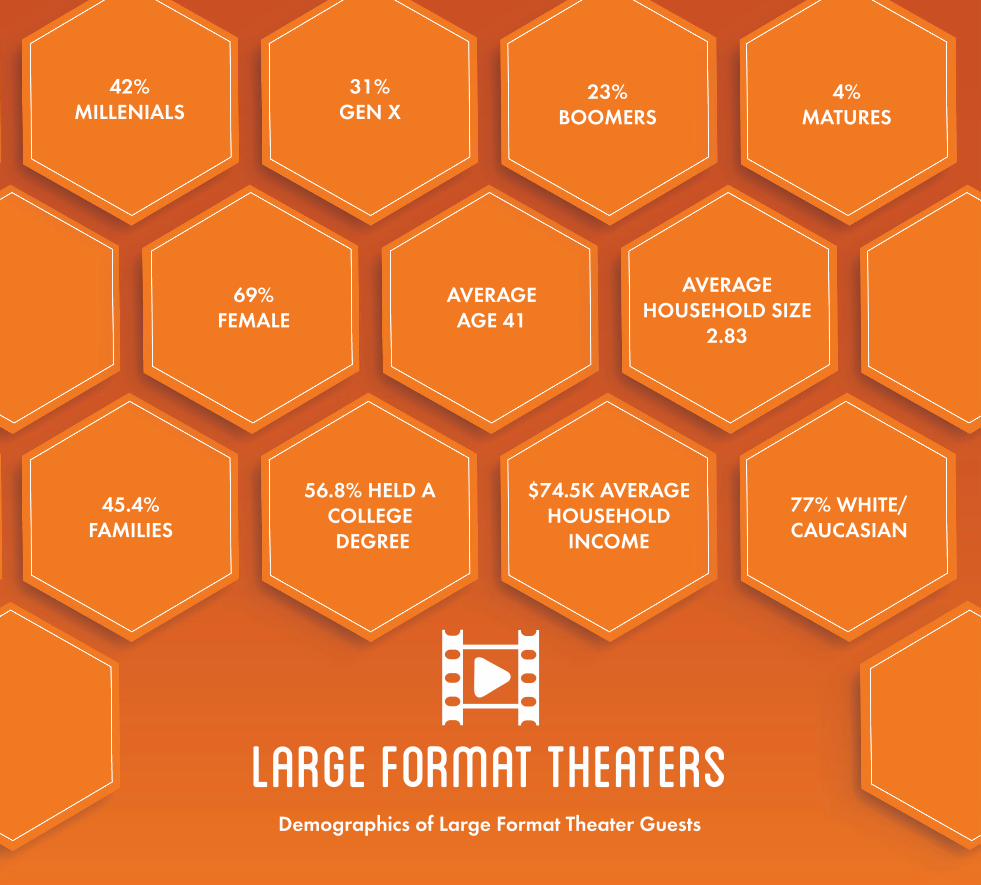
Demographics of Large Format Theater Guests
large format theaters
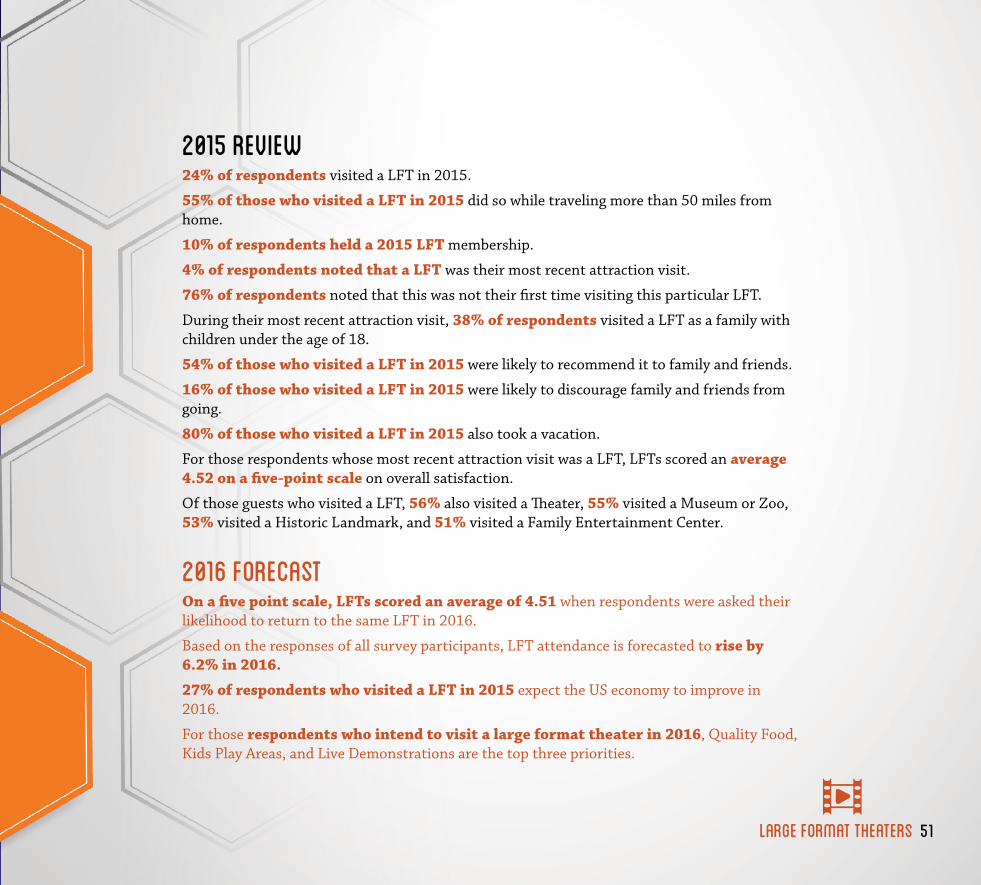
2015 REVIEW24% of respondents visited a LFT in 2015.
55% of those who visited a LFT in 2015 did so while traveling more than 50 miles from home.
10% of respondents held a 2015 LFT membership.
4% of respondents noted that a LFT was their most recent attraction visit.
76% of respondents noted that this was not their first time visiting this particular LFT.
During their most recent attraction visit, 38% of respondents visited a LFT as a family with children under the age of 18.
54% of those who visited a LFT in 2015 were likely to recommend it to family and friends.
16% of those who visited a LFT in 2015 were likely to discourage family and friends from going.
80% of those who visited a LFT in 2015 also took a vacation.
For those respondents whose most recent attraction visit was a LFT, LFTs scored an average 4.52 on a five-point scale on overall satisfaction.
Of those guests who visited a LFT, 56% also visited a Theater, 55% visited a Museum or Zoo, 53% visited a Historic Landmark, and 51% visited a Family Entertainment Center.
2016 FORECASTOn a five point scale, LFTs scored an average of 4.51 when respondents were asked their likelihood to return to the same LFT in 2016.
Based on the responses of all survey participants, LFT attendance is forecasted to rise by 6.2% in 2016.
27% of respondents who visited a LFT in 2015 expect the US economy to improve in 2016.
For those respondents who intend to visit a large format theater in 2016, Quality Food, Kids Play Areas, and Live Demonstrations are the top three priorities.
51

MUSEUMS
70% FEMALE
AVERAGE AGE 47
30% MILLENIALS
40% FAMILIES
57% HELD A COLLEGE DEGREE
$76.7K AVERAGE HOUSEHOLD
INCOME
82% WHITE/CAUCASIAN
26% GEN X
36% BOOMERS
9% MATURES
AVERAGE HOUSEHOLD SIZE
2.71
Demographics of Museum Guests
museums
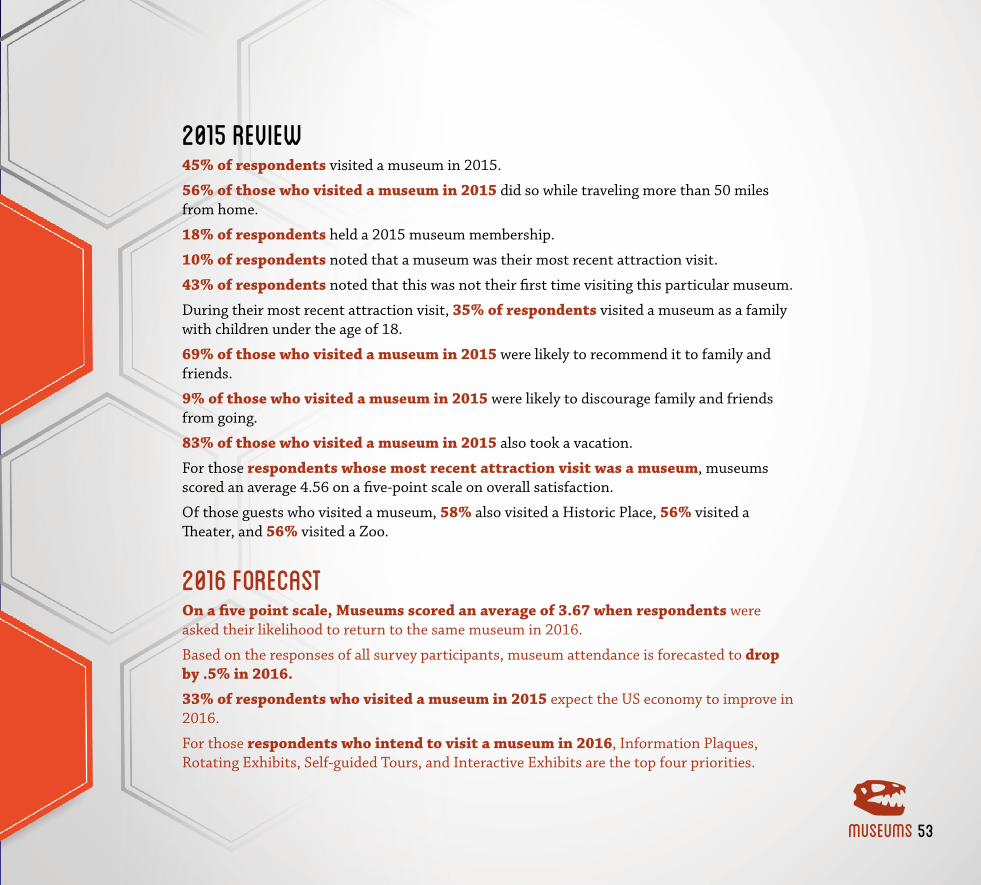
2015 REVIEW45% of respondents visited a museum in 2015.
56% of those who visited a museum in 2015 did so while traveling more than 50 miles from home.
18% of respondents held a 2015 museum membership.
10% of respondents noted that a museum was their most recent attraction visit.
43% of respondents noted that this was not their first time visiting this particular museum.
During their most recent attraction visit, 35% of respondents visited a museum as a family with children under the age of 18.
69% of those who visited a museum in 2015 were likely to recommend it to family and friends.
9% of those who visited a museum in 2015 were likely to discourage family and friends from going.
83% of those who visited a museum in 2015 also took a vacation.
For those respondents whose most recent attraction visit was a museum, museums scored an average 4.56 on a five-point scale on overall satisfaction.
Of those guests who visited a museum, 58% also visited a Historic Place, 56% visited a Theater, and 56% visited a Zoo.
2016 FORECASTOn a five point scale, Museums scored an average of 3.67 when respondents were asked their likelihood to return to the same museum in 2016.
Based on the responses of all survey participants, museum attendance is forecasted to drop by .5% in 2016.
33% of respondents who visited a museum in 2015 expect the US economy to improve in 2016.
For those respondents who intend to visit a museum in 2016, Information Plaques, Rotating Exhibits, Self-guided Tours, and Interactive Exhibits are the top four priorities.
53
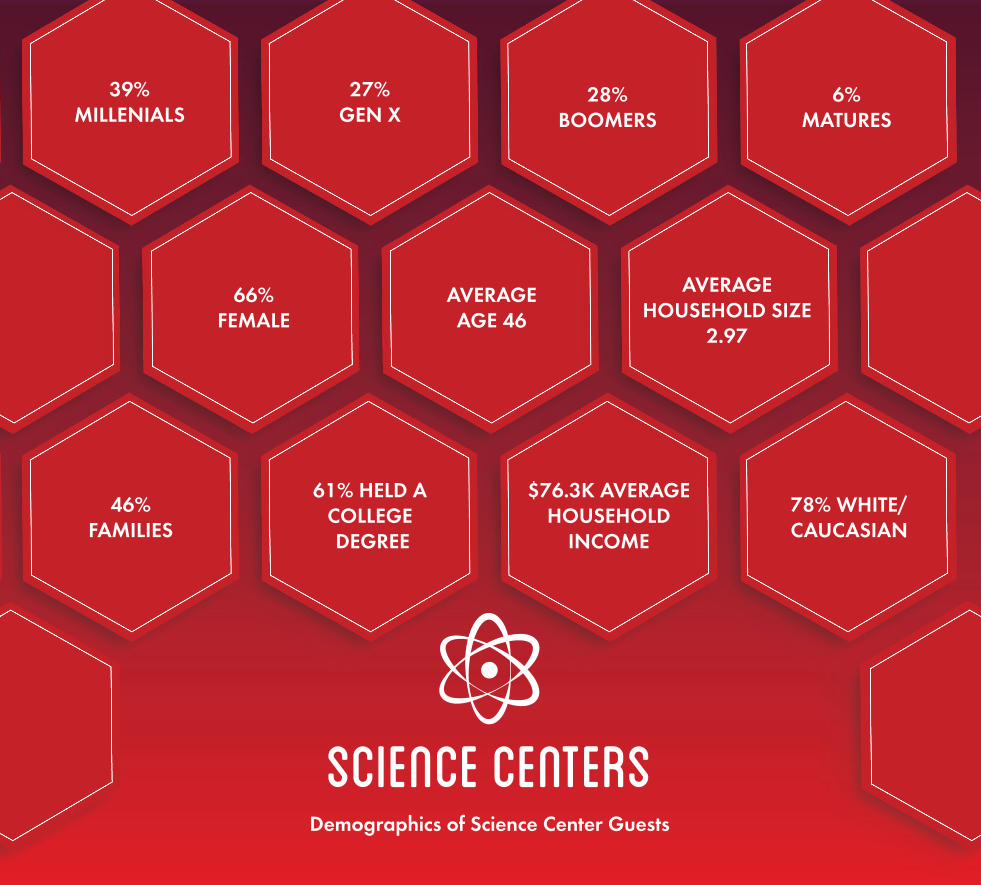
SCIENCE CENTERs
66% FEMALE
AVERAGE AGE 46
39% MILLENIALS
46% FAMILIES
61% HELD A COLLEGE DEGREE
$76.3K AVERAGE HOUSEHOLD
INCOME
78% WHITE/CAUCASIAN
27% GEN X
28% BOOMERS
6% MATURES
AVERAGE HOUSEHOLD SIZE
2.97
Demographics of Science Center Guests

science centers
2015 REVIEW17% of respondents visited a science center in 2015.
57% of those who visited a science center in 2015 did so while traveling more than 50 miles from home.
16% of respondents held a 2015 science center membership.
3% of respondents noted that a science center was their most recent attraction visit.
67% of respondents noted that this was not their first time visiting this particular science center.
During their most recent attraction visit, 56% of respondents visited a science center as a family with children under the age of 18.
73% of those who visited a science center in 2015 were likely to recommend it to family and friends.
3% of those who visited a science center in 2015 were likely to discourage family and friends from going.
82% of those who visited a science center in 2015 also took a vacation.
For those respondents whose most recent attraction visit was a science center, science centers scored an average 4.49 on a five-point scale on overall satisfaction.
Of those guests who visited a science center, 75% also visited a Museum, 65% visited a Zoo, 64% visited a Historic Landmark, 59% visited a Theater, 54% visited an Aquarium, and 51% visited a Theme Park.
2016 FORECASTOn a five point scale, science centers scored an average of 4.17 when respondents were asked their likelihood to return to the same science center in 2016.
Based on the responses of all survey participants, science center attendance is forecasted to rise by 1.8% in 2016.
50% of respondents who visited a science center in 2015 expect the US economy to improve in 2016.
For those respondents who intend to visit a science center in 2016, Interactive Exhibits, Live Demonstrations, and Educational Programs are the top three priorities.
55

SIGHTSEEING TOURs
67% FEMALE
AVERAGE AGE 47
30% MILLENIALS
35% FAMILIES
66% HELD A COLLEGE DEGREE
$86.5K AVERAGE HOUSEHOLD
INCOME
83% WHITE/CAUCASIAN
26% GEN X
35% BOOMERS
10% MATURES
AVERAGE HOUSEHOLD SIZE
2.66
Demographics of Sightseeing Tour Guests
sightseeing tours
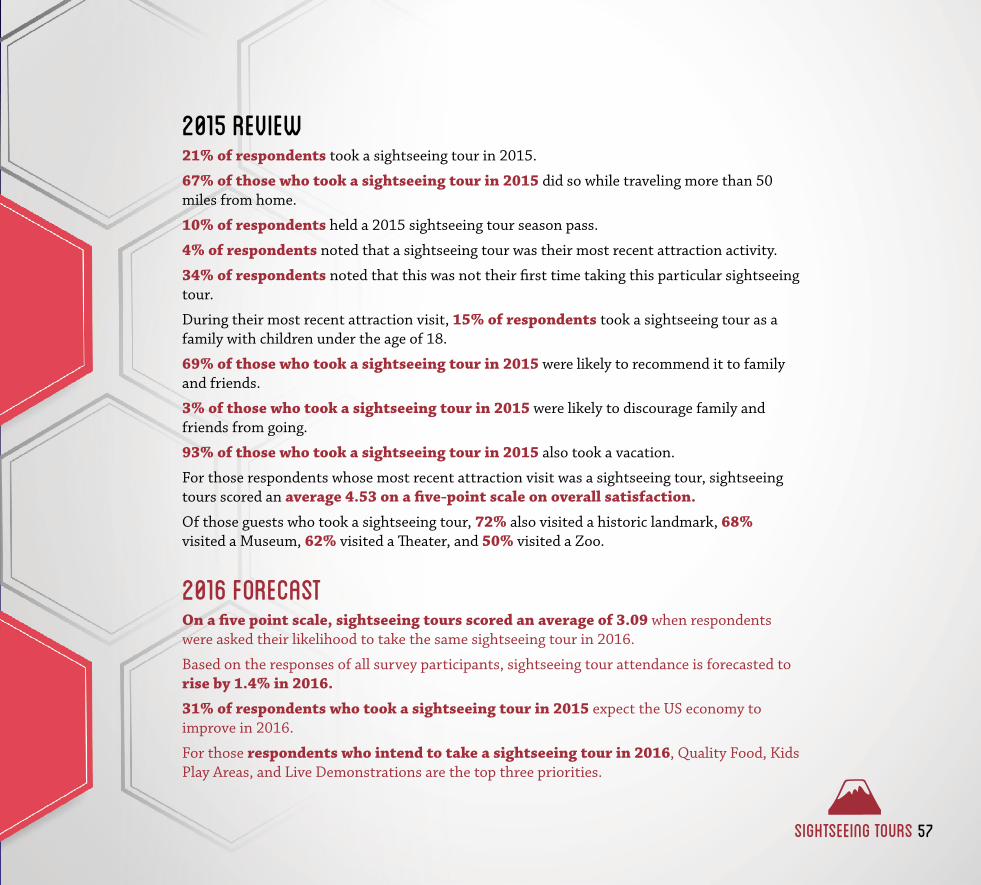
2015 REVIEW21% of respondents took a sightseeing tour in 2015.
67% of those who took a sightseeing tour in 2015 did so while traveling more than 50 miles from home.
10% of respondents held a 2015 sightseeing tour season pass.
4% of respondents noted that a sightseeing tour was their most recent attraction activity.
34% of respondents noted that this was not their first time taking this particular sightseeing tour.
During their most recent attraction visit, 15% of respondents took a sightseeing tour as a family with children under the age of 18.
69% of those who took a sightseeing tour in 2015 were likely to recommend it to family and friends.
3% of those who took a sightseeing tour in 2015 were likely to discourage family and friends from going.
93% of those who took a sightseeing tour in 2015 also took a vacation.
For those respondents whose most recent attraction visit was a sightseeing tour, sightseeing tours scored an average 4.53 on a five-point scale on overall satisfaction.
Of those guests who took a sightseeing tour, 72% also visited a historic landmark, 68% visited a Museum, 62% visited a Theater, and 50% visited a Zoo.
2016 FORECASTOn a five point scale, sightseeing tours scored an average of 3.09 when respondents were asked their likelihood to take the same sightseeing tour in 2016.
Based on the responses of all survey participants, sightseeing tour attendance is forecasted to rise by 1.4% in 2016.
31% of respondents who took a sightseeing tour in 2015 expect the US economy to improve in 2016.
For those respondents who intend to take a sightseeing tour in 2016, Quality Food, Kids Play Areas, and Live Demonstrations are the top three priorities.
57
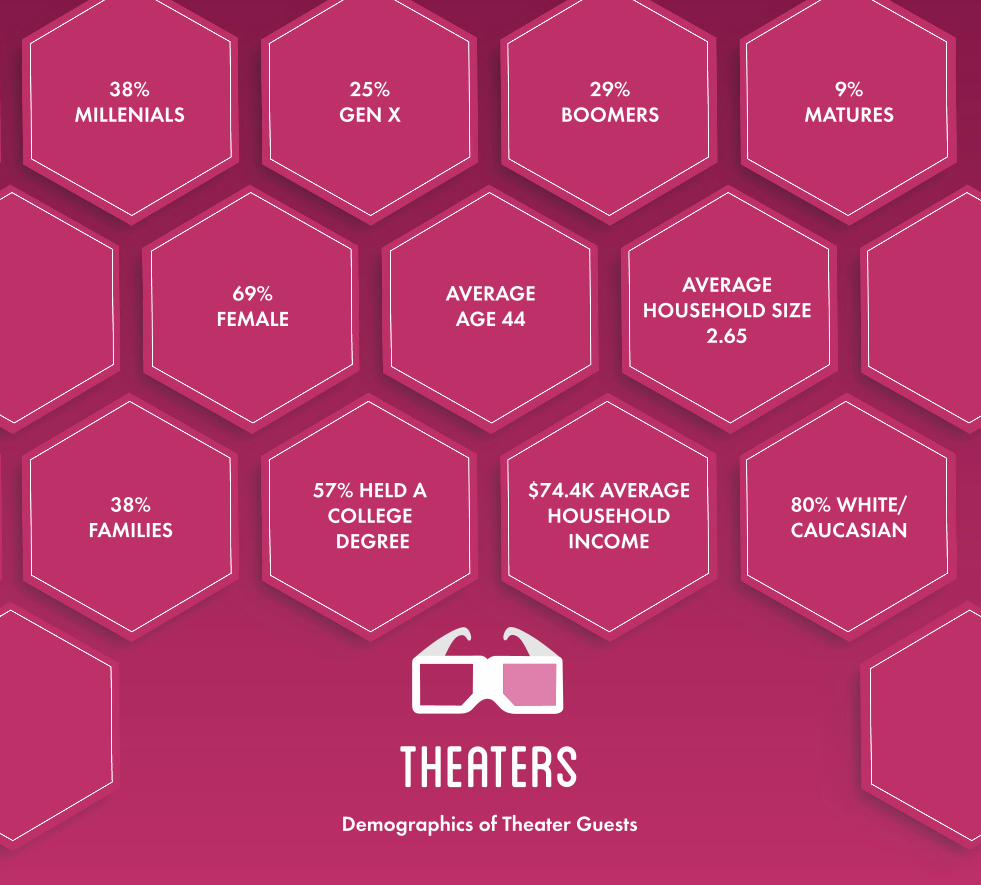
theaters
69% FEMALE
AVERAGE AGE 44
38% MILLENIALS
38% FAMILIES
57% HELD A COLLEGE DEGREE
$74.4K AVERAGE HOUSEHOLD
INCOME
80% WHITE/CAUCASIAN
25% GEN X
29% BOOMERS
9% MATURES
AVERAGE HOUSEHOLD SIZE
2.65
Demographics of Theater Guests

theaters
2015 REVIEW44% of respondents visited a theater in 2015.
58% of those who visited a theater in 2015 did so while traveling more than 50 miles from home.
11% of respondents held 2015 theater season tickets.
10% of respondents noted that a theater was their most recent attraction visit.
59% of respondents noted that this was not their first time visiting this particular theater.
During their most recent attraction visit, 21% of respondents visited a theater as a family with children under the age of 18.
67% of those who visited a theater in 2015 were likely to recommend it to family and friends.
6% of those who visited a theater in 2015 were likely to discourage family and friends from going.
81% of those who visited a theater in 2015 also took a vacation.
For those respondents whose most recent attraction visit was a theater, theaters scored an average 4.56 on a five-point scale on overall satisfaction.
Of those guests who visited a theater, 58% also visited a Museum and 52% visited a Zoo.
2016 FORECASTOn a five point scale, theaters scored an average of 4.02 when respondents were asked their likelihood to return to the same theater in 2016.
Based on the responses of all survey participants, theater attendance is forecasted to rise by 2.8% in 2016.
40% of respondents who visited a theater in 2015 expect the US economy to improve in 2016.
For those respondents who intend to visit a theater in 2016, Quality Food, Kids Play Areas, and Live Demonstrations are the top three priorities.
59

THEME PARKs
70% FEMALE
AVERAGE AGE 41
39% MILLENIALS
49% FAMILIES
47% HELD A COLLEGE DEGREE
$71.3K AVERAGE HOUSEHOLD
INCOME
75% WHITE/CAUCASIAN
32% GEN X
25% BOOMERS
4% MATURES
AVERAGE HOUSEHOLD SIZE
2.92
Demographics of Theme Park Guests
theme parks
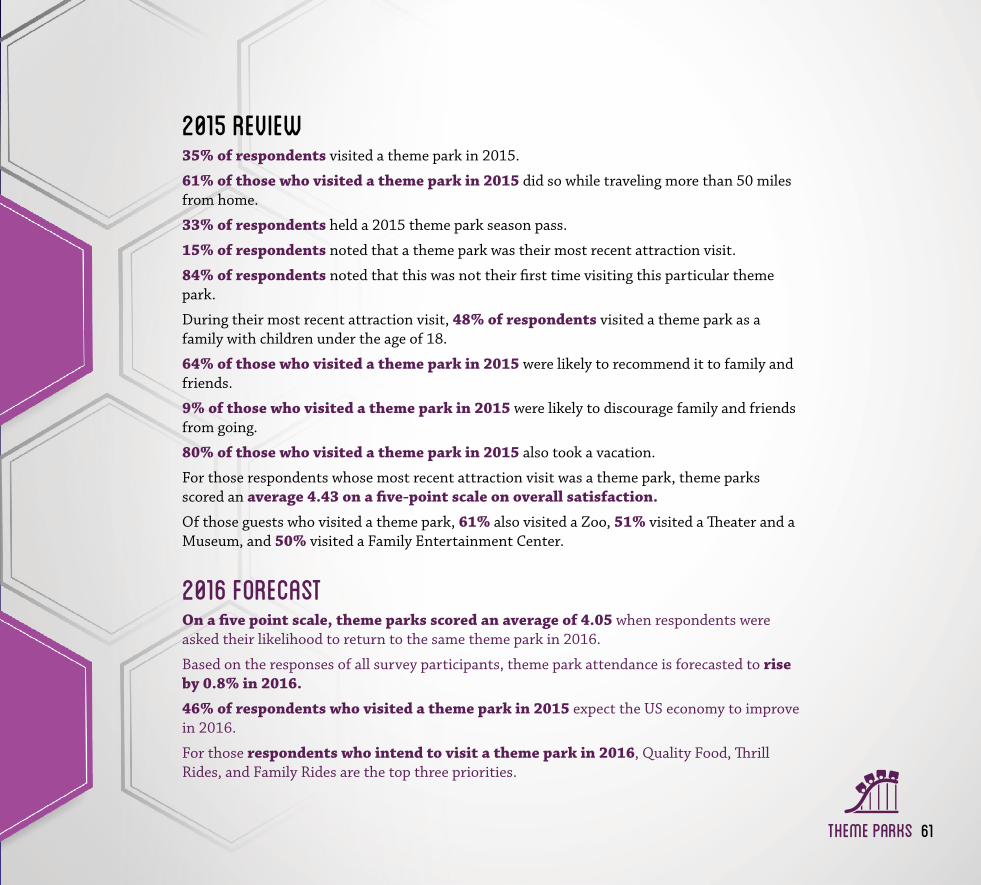
2015 REVIEW35% of respondents visited a theme park in 2015.
61% of those who visited a theme park in 2015 did so while traveling more than 50 miles from home.
33% of respondents held a 2015 theme park season pass.
15% of respondents noted that a theme park was their most recent attraction visit.
84% of respondents noted that this was not their first time visiting this particular theme park.
During their most recent attraction visit, 48% of respondents visited a theme park as a family with children under the age of 18.
64% of those who visited a theme park in 2015 were likely to recommend it to family and friends.
9% of those who visited a theme park in 2015 were likely to discourage family and friends from going.
80% of those who visited a theme park in 2015 also took a vacation.
For those respondents whose most recent attraction visit was a theme park, theme parks scored an average 4.43 on a five-point scale on overall satisfaction.
Of those guests who visited a theme park, 61% also visited a Zoo, 51% visited a Theater and a Museum, and 50% visited a Family Entertainment Center.
2016 FORECASTOn a five point scale, theme parks scored an average of 4.05 when respondents were asked their likelihood to return to the same theme park in 2016.
Based on the responses of all survey participants, theme park attendance is forecasted to rise by 0.8% in 2016.
46% of respondents who visited a theme park in 2015 expect the US economy to improve in 2016.
For those respondents who intend to visit a theme park in 2016, Quality Food, Thrill Rides, and Family Rides are the top three priorities.
61

water PARKs
75% FEMALE
AVERAGE AGE 39
45% MILLENIALS
65% FAMILIES
42% HELD A COLLEGE DEGREE
$67K AVERAGE HOUSEHOLD
INCOME
73% WHITE/CAUCASIAN
35% GEN X
18% BOOMERS
2% MATURES
AVERAGE HOUSEHOLD SIZE
3.15
Demographics of Water Park Guests

water parks
2015 REVIEW23% of respondents visited a water park in 2015.
60% of those who visited a water park in 2015 did so while traveling more than 50 miles from home.
30% of respondents held a 2015 water park membership.
5% of respondents noted that a water park was their most recent attraction visit.
67% of respondents noted that this was not their first time visiting this particular water park.
During their most recent attraction visit, 57% of respondents visited a water park as a family with children under the age of 18.
46% of those who visited a water park in 2015 were likely to recommend it to family and friends.
22% of those who visited a water park in 2015 were likely to discourage family and friends from going.
79% of those who visited a water park in 2015 also took a vacation.
For those respondents whose most recent attraction visit was a water park, water parks scored an average 4.48 on a five-point scale on overall satisfaction.
Of those guests who visited a water park, 67% also visited a Zoo, 61% visited a Family Entertainment Center, 61% visited a Theme Park, and 53% visited a Museum and a Theater.
2016 FORECASTOn a five point scale, water parks scored an average of 4.17 when respondents were asked their likelihood to return to the same water park in 2016.
Based on the responses of all survey participants, water park attendance is forecasted to rise by 3.8% in 2016.
54% of respondents who visited a water park in 2015 expect the US economy to improve in 2016.
For those respondents who intend to visit a water park in 2016, Quality Food, Thrill Rides, and Family Rides are the top three priorities.
63

Zoological attractions
73% FEMALE
AVERAGE AGE 41
45% MILLENIALS
55% FAMILIES
42% HELD A COLLEGE DEGREE
$64.8K AVERAGE HOUSEHOLD
INCOME
74% WHITE/CAUCASIAN
27% GEN X
22% BOOMERS
5% MATURES
AVERAGE HOUSEHOLD SIZE
3.2
Demographics of Zoo Guests

2015 REVIEW44% of respondents visited a zoo in 2015.
53% of those who visited a zoo in 2015 did so while traveling more than 50 miles from home.
25% of respondents held a 2015 zoo membership.
15% of respondents noted that a zoo was their most recent attraction visit.
81% of respondents noted that this was not their first time visiting this particular zoo.
During their most recent attraction visit, 57% of respondents visited a zoo as a family with children under the age of 18.
63% of those who visited a zoo in 2015 were likely to recommend it to family and friends.
12% of those who visited a zoo in 2015 were likely to discourage family and friends from going.
76% of those who visited a zoo in 2015 also took a vacation.
For those respondents whose most recent attraction visit was a zoo, zoos scored an average 4.55 on a five-point scale on overall satisfaction.
Of those guests who visited a zoo, 56% also visited a Museum and 51% visited a Theater.
2016 FORECASTOn a five point scale, zoos scored an average of 4.38 when respondents were asked their likelihood to return to the same zoo in 2016.
38% of respondents who visited a zoo in 2015 expect the US economy to improve in 2016.
Based on the responses of all survey participants, zoo attendance is forecasted to rise by 3.3% in 2016.
For those respondents who intend to visit a zoo in 2016, Immersive Animal Exhibits, Information Plaques, and Live Demonstrations are the top three priorities.
zoological attractions 65


We believe in the power of destinations to enrich lives, enhance communities, and celebrate culture, nature, and heritage through an unforgettable story and beautiful, immersive design.
PGAV Destinations is recognized across the world as the leading master planner and designer of theme parks, zoos, museums, aquariums, heritage sites, destination retail, and brand-based celebrations. Our passionate staff includes more than 120 full-time dreamers, thinkers, and makers including planners, architects, brand specialists, earned revenue specialists, interior designers, graphic designers, landscape architects, artists, and interpretive designers: all thrill seekers at the drawing board. No other firm in the industry offers such an integrated approach to destination design and strategy.
We take a holistic approach in creating experiences that exemplify your mission, brands, and heritage, leveraging leading consumer insights and research that is often published in our quarterly magazine, Destinology. With a passion for place-making, we design incredible destinations that enrich the lives of your visitors through engaging, immersive, memory-making moments.
www.pgavdestinations.com
H2R Market Research is a leader in providing consumer insights in the travel & tourism research industry. Since 2001 the company has been helping attractions and travel organizations better understand their visitors, what motivates and inspires action and what drives the visitor experience.
H2R’s primary areas of focus center on guest satisfaction/voice of the customer measurements, concept evaluation studies, brand health and brand perception as well as contextual marketing measurements such as ad effectiveness studies. The company’s key clients include industry leaders such as Coca Cola, Herschend Family Entertainment, as well as numerous zoos, museums, aquariums, state travel offices and destination marketing organizations. www.H2RMarketResearch.com
www.h2rmarketresearch.com
www.blooloop.com has been the global attractions industry’s leading news site for over a decade. Business professionals rely on blooloop to keep ahead of the game in this fast moving industry with its news, features and commentary. blooloop also brings the industry together through an extensive social media network and in-person at their conferences and networking events.
www.blooloop.com
67

EXPERIENCES & EXHIBITS THAT STRETCH THE IMAGINATION
in partnership with
p ga vd e s t in a t ion s .com | 314-231-7318