Vodafone - Ofcom · C1 - Unclassified Vodafone Limited, Vodafone House, The Connection, Newbury,...
19
C1 - Unclassified Vodafone Limited, Vodafone House, The Connection, Newbury, Berkshire, RG14 2FN, England. Registered in England No. 1471587 Page 1 of 19 Vodafone June 2016 Response to Ofcom’s Consultation: Wholesale Local Access Market Review: Approaches to fibre cost modelling
Transcript of Vodafone - Ofcom · C1 - Unclassified Vodafone Limited, Vodafone House, The Connection, Newbury,...
C1 - Unclassified
Vodafone Limited, Vodafone House, The Connection, Newbury, Berkshire, RG14 2FN, England. Registered in England No. 1471587 Page 1 of 19
Vodafone
June 2016
Response to Ofcom’s Consultation:
Wholesale Local Access Market Review: Approaches to fibre cost modelling
C1 - Unclassified
Vodafone Limited, Vodafone House, The Connection, Newbury, Berkshire, RG14 2FN, England. Registered in England No. 1471587 Page 2 of 19
Introduction
1.1 This consultation and the wider Wholesale Local Access market review project are key to determining if
Ofcom’s Digital Communications Review aspirations can be met. If Ofcom is to make communications
work for everyone, then the appropriate pricing of and access to Next Generation Access (NGA) services
are a vital component. Without access to affordable, ubiquitous higher speed services UK consumers will
be disadvantaged. The disadvantage will arise as a result of the emerging gap within the UK between
those who can achieve the highest speeds and those who can’t, but also in international comparisons,
where a global market place dictates an ever greater need for reliable high speed digital connectivity, if a
nation and all its parts are to succeed economically. In countries like France, Portugal, Ireland, and Spain
we are seeing a real Fibre To The Premises (FTTP) transformation occurring. In Spain the entire
telephone network will be converted to FTTP by 2020 and further afield, in the UAE universal FTTP is
already a reality. The UK needs at the least to keep in step, not simply in metropolitan areas but also
nationwide.
1.2 In the UK we have come a long way in the last decade, with legacy copper infrastructure being pushed
ever harder to try and satisfy our growing appetite for bandwidth. While this path of innovation will
continue through initiatives like G.fast, developments in this area will always be throttled by the physical
characteristics of the copper access wire being used for a task it was never designed for and where
longer copper lengths defeat any technological interventions to increase speed.
1.3 The progress made on broadband speeds has to a large extent been to the detriment of competition. In
the move away from using Local Loop Unbundling (LLU), BT has secured a better deal on both charges
(focusing on a product which to date hasn’t been charge controlled) and being left free to design its
implementation in a way that does not require equivalent consumption built on a co-location presence.
1.4 The pricing and availability of NGA is therefore linked to other strategic policy considerations that Ofcom
is currently contemplating, including how the UK is to meet the future USO challenge of providing a
minimum of 10Mbit/s access to every UK home and the considerations around the future ownership,
direction and control of Openreach. At some point the dots need to join up, however whilst this project is
focused on delivering the correct NGA pricing outcomes in the next market review period to 2020, it
cannot be done in isolation from the substantial policy questions. This means getting the foundations
right to support the Gigabit society of the future, ensuring the UK has the right infrastructure to deliver
all its digital aspirations in the decades ahead.
1.5 In summary, Ofcom is walking a tightrope, whilst recognising that:
Legacy copper isn’t going to deliver the same benefits to UK consumers as alternative forms of NGA
connectivity such as FTTP.
Restricting charge control regulation to a legacy technology risks a totally inappropriate regulation
being set.
C1 - Unclassified
Vodafone Limited, Vodafone House, The Connection, Newbury, Berkshire, RG14 2FN, England. Registered in England No. 1471587 Page 3 of 19
BT has significant incumbency advantages that discourage others from entering the NGA
market with their own investments in infrastructure. Addressing these incumbency
advantages is not the same as encouraging BT to invest.
Any ‘investment risk premium return’ incorporated into NGA regulated pricing must only be
contemplated when the time is right (and there is a realistic prospect of investment) and
done in a transparent way. If costs are exaggerated in the short run then only BT and its
shareholders will benefit rather than UK consumers as a whole, and it will leave other
infrastructure investment an even more distant prospect. An outcome that delivers greater
returns for BT in the short run (over a three year control), is unlikely to provide a sufficient
enough incentive for others contemplating the costs of deploying new infrastructure.
Pricing in the next control period should reflect efficient cost, preventing BT over-recovery
and excessive profitability and the resulting damage to competition.
All stakeholders require an understanding of the true cost of provision of NGA using FTTC /
G.fast. This will ensure this regulatory model is robust, future business cases are sound and
consumers benefit from prices set at appropriate levels.
While the European Framework directive advocates national regulators taking a technological
neutral approach, Ofcom’s Digital Communication Review clearly set the aspiration for fibre.
Without a change in the UK’s underlying regulatory environment the proper transition to fibre
is unlikely to occur.
1.15 We don’t believe that the regulatory and commercial environment in the UK supports the fibre
ambition at this point in time, although we recognise the environment is beginning to evolve with
hopes pinned on a number of initiatives such as duct access. We recognise this consultation and
the forthcoming market review are simply the start of the process to ensure the UK regulatory
environment is one that encourages the competition and infrastructure investment.
1.16 This response is divided into two sections, the first discusses the wider policy considerations that
are in play, setting out a wider frame of reference for the fibre cost model, providing market
context both now and in expectations for the future. The next section then turns to the specifics
of the proposed model, addressing Ofcom’s specific questions and discusses the model’s
proposed design and its approach to calculating the cost of NGA access in the UK to 2020.

C1 - Unclassified
Vodafone Limited, Vodafone House, The Connection, Newbury, Berkshire, RG14 2FN, England. Registered in England No. 1471587 Page 4 of 19
2. Policy Considerations on fibre cost modelling
2.1 If Ofcom is to succeed in making communications work for everyone then it needs to achieve the right
outcomes from this charge control and market review. There is a significant trade-off between delivering
copper based NGA today to consumers at a price that fairly reflects its underlying costs and creating an
environment that ensures that the UK has fit for purpose infrastructure that supports a more complete
NGA in the years ahead.
Copper is no match for Fibre
2.2 The expediency of relying on BT’s legacy copper network is not a strategy without significant risk. While
it undoubtedly results in most of the UK having access to some form of NGA from either BT’s
commercial roll out or through state aid support (via BDUK), it does result in a solution that performs
poorly against fully fibre based alternatives and leaves around 5% of the UK population unserved, with
this latter issue being considered in the concurrent Broadband USO review.
2.3 In 2027 no one wants to be looking back at a lost decade, where the continued presence of copper
access because of policy choices made 10 years before are visibly constraining the UK economically,
with the gap between those who have access to the faster speeds and those that don’t wider than ever.
Today’s utilisation of copper based Fibre To The Cabinet (FTTC) must be viewed as a staging post to
ultrafast NGA connectivity, a stepping stone towards FTTP, not a barrier that thwarts it becoming a reality
in the UK.
2.4 Whilst article eight of the Framework Directive requires Ofcom to “take the utmost account of the
desirability of making regulations technologically neutral”1, Ofcom has taken a very different policy
stance in its initial conclusions in the Digital Communications Review, as it states that it will promote “a
strategic shift to large-scale investment in more fibre2”. A technology neutral stance in this aspect of
regulation is one that is almost certainly destined to promote and prolong the use of the copper
network. Remaining silent over the drawbacks of copper and its limitations results in a rational
incumbent sweating its assets for as long as possible and acting as a commercial barrier to entrants
investing in fibre. If Ofcom really wants to “incentivise fibre build” then costing and pricing decisions
need to take account of this. Unless this is undertaken, sticking to technology neutrality will result in the
UK becoming ever more reliant on and constrained by the copper network, through its significant
physical limitations coupled with BT’s rational desire to maximise financial rewards for its shareholders
from its existing network assets.
2.5 FTTC and G.fast are options to extend the life of the copper network and aren’t Modern Equivalent Assets
(MEAs) for anyone other than BT. In Germany, BT’s largest shareholder Deutsche Telekom’s has
regulatory approval for Vectoring using FTTC, another technique designed to speed up copper. This
technology also requires other providers of broadband to be removed from the Deutsche Telekom
network, restricting competition in the short run and further entrenching the incumbent’s role in NGA
1 http://eur-lex.europa.eu/legal-content/EN/TXT/PDF/?uri=CELEX:32002L0021&from=en 2 http://stakeholders.ofcom.org.uk/binaries/telecoms/policy/digital-comms-review/DCR-statement.pdf
C1 - Unclassified
Vodafone Limited, Vodafone House, The Connection, Newbury, Berkshire, RG14 2FN, England. Registered in England No. 1471587 Page 5 of 19
delivery. Choosing a different path focused away from legacy copper creates a market where more
investment choices are possible across a range of providers, ensuring that one company isn’t acting as
the de facto Broadband System Operator in the UK and setting the connectivity direction for the entire
country. This would avoid the inevitable conflict that will arise when it becomes clear that what is best
for BT isn’t necessarily what is best for the citizens and enterprises of the UK.
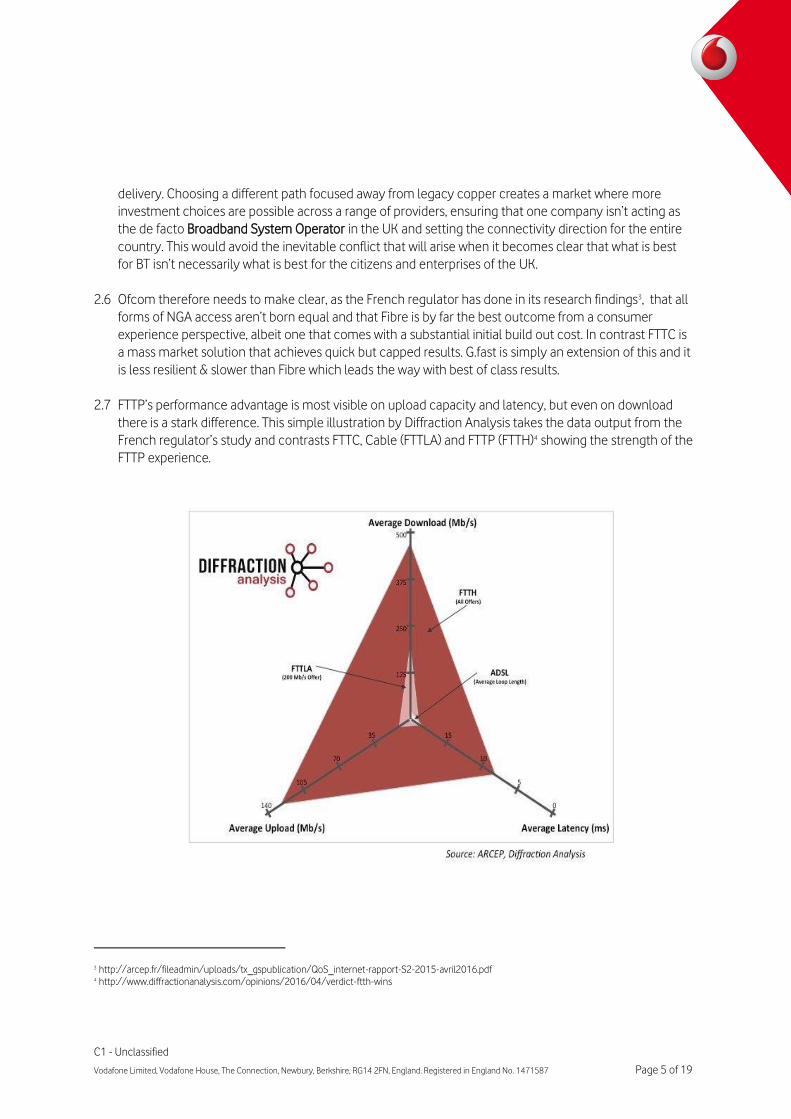
2.6 Ofcom therefore needs to make clear, as the French regulator has done in its research findings3, that all
forms of NGA access aren’t born equal and that Fibre is by far the best outcome from a consumer
experience perspective, albeit one that comes with a substantial initial build out cost. In contrast FTTC is
a mass market solution that achieves quick but capped results. G.fast is simply an extension of this and it
is less resilient & slower than Fibre which leads the way with best of class results.
2.7 FTTP’s performance advantage is most visible on upload capacity and latency, but even on download
there is a stark difference. This simple illustration by Diffraction Analysis takes the data output from the
French regulator’s study and contrasts FTTC, Cable (FTTLA) and FTTP (FTTH)4 showing the strength of the
FTTP experience.
3 http://arcep.fr/fileadmin/uploads/tx_gspublication/QoS_internet-rapport-S2-2015-avril2016.pdf 4 http://www.diffractionanalysis.com/opinions/2016/04/verdict-ftth-wins
C1 - Unclassified
Vodafone Limited, Vodafone House, The Connection, Newbury, Berkshire, RG14 2FN, England. Registered in England No. 1471587 Page 6 of 19
2.8 In addition to user experience, FTTP is a proven technology with lower long run opex costs as it avoids all
the plant and reliability drawbacks of copper, with lower fault rates and maintenance requirements as
well as the almost infinite ability to upgrade to ensure growing bandwidth demand can be met.
Recognising the incumbency advantages
2.9 Vodafone is the fastest growing fixed broadband provider in Europe, with 30m households passed by our
own Next Generation Network and ambitious plans to expand our fibre footprint. In the UK, our home
market, we don’t believe that the regulatory and commercial environment supports that ambition at this
point in time, although we recognise the environment is beginning to evolve with hopes pinned on a
number of initiatives such as passive duct access, seen as key to ensuring that investment in FTTP can
occur at some point in the future. However as it stands today BT retains considerable incumbency
advantages that haven’t been properly articulated or addressed by Ofcom in this debate. If Ofcom is to
make communications work for everyone then it needs to understand these advantages and try and
address them as far as is possible, leveling the playing field to allow infrastructure competition in fibre to
develop in the UK.
2.10 BT’s defensive position on NGA mean it is effectively dug-in on copper, using its deployed FTTC network
as a barrier against new entrants, with any BT FTTP investment limited and as yet undelivered (having
previously cancelled its own previously planned FTTP investment in 2013). BT’s incumbency advantages
in the NGA market are hard to refute:
Incremental NGA investment to upgrade copper is modest in comparison to the initial capex
required for a new FTTP network needed to provide ultrafast services and bring about
infrastructure competition.
As BT is in complete control of the FTTC network, it can select niche locations where it will
invest in FTTP and can simply shut down the copper network in these areas. It therefore doesn’t
ever over-build itself in the medium term.
In contrast an alternative FTTP investor has not only got to overcome a massive scale
disadvantage, but has to compete with the double threat of (1) future pricing uncertainties
around FTTC taking demand away from any ultrafast FTTP offering (as a proportion of
consumers will opt for a less functional FTTC offering if the price is right); and (2) new entrants
also face the continued threat that BT will over build using FTTP, locally and selectively rolling
out their own fibre while the market is nascent and killing competition before it has begun.
At a retail level BT benefits from an existing large customer base. Customer inertia will mean
that BT can migrate existing customers onto higher speed services at a lower cost than a new
entrant will incur to win new customers. This will require the new entrant to invest more heavily
in customer acquisition and price at a discount to BT in order to build its market share.
It is highly likely that any new entrant to the superfast broadband markets will operate in a
converged retail quad-play market and have to compete against the bundled calls, broadband,
mobile and TV offers of the BT. In order to compete with these bundled offers the new entrant
C1 - Unclassified
Vodafone Limited, Vodafone House, The Connection, Newbury, Berkshire, RG14 2FN, England. Registered in England No. 1471587 Page 7 of 19
may have to subsidise certain elements of bundles to obtain customers, placing it at a
disadvantage compared to the converged incumbent with existing mobile, or TV services.
BT’s wholesale customer base (supplying its own retail lines of business and other
communication providers) gives it increased take-up on its network, boosting overall utilisation
and so reduces the risk of any investment outlay (this advantage exists even absent mandated
access to new higher speed services). This ease of access to existing retail and wholesale
customers gives BT a much lower cost to switch its base to G.fast or indeed FTTP. In contrast a
new FTTP player would face significantly higher capex and marketing costs and pricing pressure
in order to build the scale essential to breakthrough and make a material difference to the
competitive dynamics in the market.
2.11 Understanding the impact of these advantages, both in terms of de-risking BT’s own investments and
also assessing the likely impact of alternative investment is important in order to set the right charging
structure for NGA broadband. Conflicts between technology neutrality based policy and at the same
time promoting more fibre investment, protecting BT’s ‘risky investment’ whilst not addressing the
incumbency advantage which means that any other investment is even more risky mean that Ofcom is
at risk of not delivering on any policy aims.
2.12 This cost model and any related charge control is by necessity focused on the period 2017 – 2020, a
time when FTTP investment is likely to be modest, however if the investment environment is to change
post 2020 then Ofcom must be ready to respond and encourage investors. Policy initiatives like Dark
Fibre and duct access are expected to help but are as yet unproven and Communication Providers need
greater certainty around price and practicalities of using duct access before they will invest. When fibre
investment is a more likely prospect that can be built on a sound and proven foundation of passive
access remedies, then Ofcom’s approach to NGA pricing may need to adapt to support that investment.
So it important that Ofcom does nothing at this point in time that limits its freedom in the future.
Improving Cost Transparency
2.13 Any alternative infrastructure investment needs to be soundly based on market realities as new
entrants will need to compete head on with BT’s FTTC and G.fast networks, so inflating prices for policy
reasons that has the objective of stimulating FTTP investment will fail if that investment isn’t grounded in
commercial reality. Who would invest in FTTP today without a proper understanding of where VULA
pricing could level out at in the years ahead? If VULA pricing is artificially inflated to retain a dividend for
investment elsewhere, it doesn’t create the correct pricing signals in the market, with the incumbent
reaping the financial rewards and the new entrants getting an unrealistic view of the market price with
the prospect that in the next control period pricing will tend towards cost leaving their investment
unsustainable.
2.14 The true extent of BT’s investment in FTTC (and the impact of state aid) have been largely obscured
from public scrutiny thus far and it is important that all stakeholders gain a proper understanding of the
underlying cost of the FTTC network and any incremental G.fast investment. This is essential if:
(1) consumers are to get fair pricing (in a market where BT has SMP and where competition cannot
deliver at this point); and
C1 - Unclassified
Vodafone Limited, Vodafone House, The Connection, Newbury, Berkshire, RG14 2FN, England. Registered in England No. 1471587 Page 8 of 19
(2) other communication providers have the correct investment signals so they can undertake
rational investment appraisal to ensure any decisions to invest aren’t likely to be subsequently
undermined at a future point in time due to the true cost level of FTTC being obscured.
2.15 It would be completely wrong if Ofcom were to preside over a charge control regime that gave rise to
the next seam of BT excess profitability that was only addressed at some undetermined point in the
future, but only on a forward looking basis after the size of the excess became too much of an
uncomfortable reminder of the inadequacy of the price regulation set in this critical market. Ofcom
therefore needs to use this consultation exercise and subsequent changes to the regulatory reporting
obligations to ensure all stakeholders and consumers understand in far more detail:
(1) the cost of establishing the FTTC / G.fast network on a homes past and at a cabinet / distribution
point level;
(2) details of the upgrade/scalability costs associated with growing the FTTC / G.fast network to
meet future demand. At this point in time we don’t have access to reliable information to
ascertain what costs arise when capacity is increased.
2.16 The absence of this information has undoubtedly contributed to some poor deals being struck in the
BDUK process, with individual local authorities or devolved governments striking deals with BT for FTTC
deployment without a proper frame of reference or benefit of peer view due to BT being the only
Communication Provider in the process (individual contracts remain confidential). It is also vital that
potential FTTP investors get sight of this detail as it is key market information that needs to be analysed
before any commitments can be given on the worthiness of the UK as a place to invest in for fibre
deployment. It is also practical information that can be used to sanity check Ofcom’s cost model outputs
to ensure UK consumers aren’t paying too much and prices are set that reflect the underlying cost.
Transparency on returns
2.17 In the Digital Communications Review Ofcom talked in broad terms about ensuring that investment
reward is built into its approach to regulatory pricing for next generation access and that aspiration is
repeated in the consultation5. At a high level we see the attraction of this approach; however Ofcom
need to balance this aspiration with other key considerations that will ultimately determine in the longer
term if such an approach will attract new alternative investment to enable communication to work for
everyone. These considerations include:
(1) recognising the fact that due to some very significant incumbency advantages, BT’s incremental
investment in NGA over copper via FTTC or G.fast is far less risky than any investment capital
that could be put forward by alternative providers looking to deploy FTTP. So a flat reward rate
that gives BT a disproportionate benefit that can be used to compete against other CPs in this
5 Consultation 2.12.2: Price access to BT’s network in a way to encourage CPs to invest in new networks, across as much of the UK as is practicable,
whilst protecting consumers from excessive pricing;
C1 - Unclassified
Vodafone Limited, Vodafone House, The Connection, Newbury, Berkshire, RG14 2FN, England. Registered in England No. 1471587 Page 9 of 19
market and other adjacent markets ultimately undermines competition and results in
consumers paying too much as the one already dominant player is strengthened above all
others.
(2) inflating the true cost of NGA over copper gives a new entrant an unrealistically optimistic view
of the market, leaving them vulnerable to future NGA over copper price reductions. It also is
likely to be insufficient to make a material impact on their overall business case for FTTP while at
the same time giving BT a shot in the arm to generate substantial excess profits from day one of
the charge control, further tipping the scales against new entrants who would need to build out
scale before they could see any benefit.
2.18 If Ofcom are to include an investment risk premium at some point in the future (and we don’t
necessarily believe that time is now), it should do so with a degree of certainty around the prospect of
new investment materialising. If a risk reward is to be incorporated into regulated pricing it must be
done in the most transparent way possible. This means uplifting the cost of capital with an investment
premium surcharge. This makes the reward premium visible to all and a policy discussion can then
occur around what if anything should be done with this excess (for example ring fencing it for USO
purposes). The alternative approach would be to give BT the benefit of the doubt in every sub-
calculation / assumption used to derive the cost of the network, effectively building in fat into the
model at each stage to arrive at an exaggerated total cost that lacks any degree of transparency,
making it impossible to understand what the true underlying costs are. This would be a completely
unsatisfactory outcome for all concerned, except of course BT. It would result in consumers paying too
much, funneling excessive profits to the incumbent that can’t be easily identified for policy
consideration elsewhere and obscuring the true costs of FTTC/G.fast deployment from FTTP
competitors and contributing to a toxic investment environment weighed down by moral hazard. Such
an outcome would make the UK a no go zone for rational infrastructure investors.
Understanding State Aid
2.19 To ensure the model is as robust as possible it is essential that it is sanity checked against the capex
that was committed by both BT and Government when FTTC was rolled out. The model should take full
account of the impact of the BDUK subsidies and provide independent confirmation of BT’s own capital
to deliver FTTC in non-commercial areas. Stakeholders need to understand how much of a return BT is
generating from its FTTC/G.fast network in the Regulatory Financial Statements, ideally at an overall
product level, with figures for state aid areas available separately. We would welcome proposals to this
effect in the forthcoming policy consultation. Annual publication of this information within BT’s
regulatory reporting output would clearly be of value to the broadband USO debate.
C1 - Unclassified
Vodafone Limited, Vodafone House, The Connection, Newbury, Berkshire, RG14 2FN, England. Registered in England No. 1471587 Page 10 of 19
3. Design of Fibre Cost Model
3.1 This section deals with the specifics of the proposed model, discussing its design and its approach to
calculating the cost of NGA access in the UK to 2020.
Choice of NGA technology
3.2 The model assumes that for the period to 2047/48, all NGA services will be provided using FTTC plus
VDSL2 over copper pairs. Ofcom’s rationale is that this is the predominant technology used by BT for
delivering NGA services over this review period6 . However, under the modelling approach proposed by
Ofcom (and in particular the Economic Depreciation approaches), modelled costs during this review
period are strongly affected by assumed service volumes over the entire period to 2047/48.
3.3 It is unrealistic to assume the continued predominance of VDSL2 over the period to 2047/48. BT has
already announced plans to deploy G.fast technology to most of the UK by 20257 , and in the longer
term wider deployment of FTTP is a realist prospect given the right investment environment. These
developments have the potential to materially impact modelled costs. A proportion of G.fast
deployment is likely to require fibre to be extended from the cabinet to the distribution point (FTTdp) in
order to avoid excessively long copper connections. Therefore, for some G.fast volumes, and all FTTP
volumes, the costs involved are not simply an incremental overlay over FTTC costs. For example, they
will not use FTTC DSLAMs. And yet, the modelling assumes all services will use FTTC DSLAMs all the way
through to 2047/48.
3.4 Because of this unrealistic assumption, the true cost of FTTC/VDSL2 is likely to be distorted, in particular
under the Economic Depreciation approaches, where costs and volumes in all years to 2047/48 play a
key role in influencing unit costs during the period to 2019/20. However, it may be that until the nature
and scale of the future deployment of these technologies becomes clearer, it will be difficult to eliminate
this distortion.
Bottom up modelling and treatment of common costs
3.5 Vodafone agrees with Ofcom’s proposal to model the costs of an NGA network on a bottom-up basis, for
the reasons given by Ofcom: more accurate modelling of cost-volume relationships, greater
transparency, and consistency with the 2013 EC Recommendation8.
6 Paras 3.5 and 4.09, Consultation 7 The future of G.fast – an ultrafast update, BT Newsbyte, December 2015 8 Paras 3.9 to 3.15, Consultation
C1 - Unclassified
Vodafone Limited, Vodafone House, The Connection, Newbury, Berkshire, RG14 2FN, England. Registered in England No. 1471587 Page 11 of 19
3.6 Ofcom explains that the bottom-up modelling approach it presents includes only the incremental costs
incurred in providing fibre based access services, and does not include any costs which are common
between fibre based access services and copper based access services, the treatment of such common
costs being a matter for the WLA Market Review consultation9. This approach is confirmed by
Cartesian10.
3.7 Vodafone agrees with this approach, as the recovery of common costs should be considered in a
coordinated fashion across all relevant services, in order to minimise the risk of over- or under-recovery.
However, the approach appears to be contradicted by two statements:
a) Ofcom states that the model relies on input data from top-down sources “on the costs associated
with shared infrastructure (between CGA and NGA services)”11; and
b) Cartesian states that the model includes “network components which are shared by NGA and non-
NGA services”, with “top-down costs… used as inputs to the Cost Module”12.
3.8 It is not clear from the model which components and costs fall into this category. However, the
inclusion of such costs would appear to contradict the approach proposed by Ofcom, and introduce the
dangers that the proposed approach is aimed at avoiding. Vodafone would appreciate clarification on
this point.
Scorched node
3.9 Vodafone acknowledges that a scorched node approach to the bottom up modelling has practical
benefits. However, it should be noted that the current network topology deployed by BT for its FTTC
services is heavily influenced the legacy left by its copper-based origins. An efficient network topology
would feature far fewer optical nodes, and be less costly overall. Moreover, BT plans to change its
network topology fundamentally in that direction over the medium term (within the timescale
considered by the model), vacating most of its exchanges13. Therefore, applying the scorched node
approach to BT’s current network topology inflates costs above not only efficient greenfield levels, but
also above BT’s own likely level of costs in the medium to longer term.
9 Paras 2.22 and 3.38 to 4.40, Consultation 10 Paras 2.09, 2.11, 3.2 to 3.4, and 3.27, Cartesian report 11 Para 3.16, Consultation 12 Para 4.1, Cartesian 13 Para 75, Response to Ofcom’s second consultation - Review of BT’s cost attribution methodologies, BT, 15 December 2015; paras 3.22 to 3.26,
Ofcom’s second consultation on BT’s cost attribution methodologies – a report for BT, FTI Consulting, 14 December 2015
C1 - Unclassified
Vodafone Limited, Vodafone House, The Connection, Newbury, Berkshire, RG14 2FN, England. Registered in England No. 1471587 Page 12 of 19
Geographic coverage
3.10 The model excludes coverage areas that were part-funded by BDUK or any other state intervention14. In
Vodafone’s view, these areas should be included in the modelling, with both costs and state aid
contributions transparently reflected. This would have a number of benefits:
a) Reflecting the higher take up of FTTC broadband in these areas15;
b) The bottom-up model will rely heavily on calibration with top-down data from BT. It may in
several cases be difficult to disaggregate top-down data between non-BDUK and BDUK areas, in
which case calibration will be more reliable against a model which includes both areas.
NGA services in scope
3.11 The model is designed “so as to allow the modelling of costs for any service delivered over an FTTC
network”16.
3.12 The choice of broadband services covered is considered above under “Choice of NGA technology”. In
addition to broadband services, BT has made it clear that it plans to deliver its voice services over its
FTTC network within the next 10 years, i.e. before the half way point of the timescale considered by the
model:
“Our goal is that by 2025 all our voice customers will be served using an IP to the premises solution
and will migrate off the traditional telephony solution.17”
3.13 This has significant implications for the cost modelling:
a) Under the Economic Depreciation approaches, unit costs during the period to 2019/20 are
affected by service volumes from 2025/26 onwards. The exclusion of voice services means
that Economic Depreciation unit costs will be distorted.
b) If both broadband and voice are delivered over the FTTC network, significant elements of that
network will be a common cost between the two sets of services. The allocation of those
common costs will therefore be subject to consideration in Ofcom’s forthcoming WLA Market
14 Para 3.26, Consultation 15 We understand that while State aid areas may lag behind commercial roll out areas in terms of subscriber numbers, this is in part due to them being
at the end of the roll out. Where cabinets have been enabled in state funded areas the take up rates have been greater than expected due to the
poorer speed available on standard broadband. See: https://www.gov.uk/government/news/additional-129-million-boost-for-nationwide-
broadband-rollout. This has meant that the boundary between BT only and BDUK areas are not static, but fluid 16 Par Para 75, Response to Ofcom’s second consultation - Review of BT’s cost attribution methodologies, BT, 17 Para 75, Response to Ofcom’s second consultation - Review of BT’s cost attribution methodologies, BT, 15 December 2015
C1 - Unclassified
Vodafone Limited, Vodafone House, The Connection, Newbury, Berkshire, RG14 2FN, England. Registered in England No. 1471587 Page 13 of 19
Review consultation. Exclusion of voice services from the model would appear to prejudge that
consultation by allocating FTTC network common costs exclusively to broadband services.
3.14 It may however be that these issues cannot be fully resolved until the timing of the migration of voice
to IP becomes clearer.
Modelling design
Service volumes
3.15 Ofcom states that it considers it likely that non-BT CPs will utilise other wholesale inputs (e.g. self-build
or duct access) in order to provide FTTP, rather than obtaining GEA-FTTP18. The basis of this assumption
is unclear.
FTTC network build
Cabinet deployment algorithm
3.16 The model assumes an initial deployment of 51,000 FTTC cabinets to serve 51,000 FTTC-enabled PCPs
by 2015/16. Of these 51,000 cabinets:
a) 31,460 are “Type 1” cabinets serving 31,460 “Type 1” (small) PCPs, with a maximum effective
capacity of 90 subscribers from each cabinet; and
b) 19,540 are “Type 2” cabinets serving 19,540 “Type 2” (large) PCPs, with a maximum effective
capacity of 202 subscribers from each cabinet19.
3.17 This gives an initial capacity of 6.7m subscribers:
a) 2.8m subscribers on the 41,460 Type 1 PCPs; and
b) 3.9m subscribers on the 19,540 Type 2 PCPs.
3.18 By 2028/29, demand is forecast to reach 24.1m subscribers, served by the same 51,000 PCPs20:
a) 11.4m subscribers on the 31,460 Type 1 PCPs; and
b) 12.7m subscribers on the 19,540 Type 2 PCPs21.
18 Footnote 34, Consultation 19 Rows 13 to 32, Input_Coverage, 2.Network Cost; rows 69 to 83, Input_Network, 2.Network Cost 20 Rows 13 to 32, Input_Coverage, 2.Network Cost 21 Rows 19 and 25, Calc_Network, 2.Network Cost
C1 - Unclassified
Vodafone Limited, Vodafone House, The Connection, Newbury, Berkshire, RG14 2FN, England. Registered in England No. 1471587 Page 14 of 19
3.19 This implies that by 2028/29:
a) each Type 1 PCP has an average of 361 subscribers; and
b) each Type 2 PCP has an average of 649 subscribers.
3.20 Since this demand is well in excess of the capacity of the initially deployed cabinets, some assumption
is required for how extra capacity will be provided. The model assumes that this extra capacity is
achieved by the installation of additional “Type 1” cabinets at “Type 1” PCPs, and “Type 2” cabinets at
“Type 2” PCPs. Moreover, it assumes that each additional cabinet required the digging of costly brand
new duct (i.e. the 2nd cabinet cannot re-use any of the duct dig for the 1st cabinet22). As a result, by
2028/29:
a) each Type 1 PCP is served by an average of 4.0 Type 1 cabinets; and
b) each Type 2 PCP is served by an average of 3.2 Type 2 cabinets.
3.21 The deployment suggested by the model implies, for an average Type 1 PCP:
a) installation of an initial Type 1 cabinet in 2011/12;
b) installation of a 2nd Type 1 cabinet 4 years later in 2015/16;
c) installation of a 3rd Type 1 cabinet 2 years later in 2018/19; and
d) installation of a 4th Type 1 cabinet 4 years later in 2022/23.
3.22 It is hard to imagine that an efficient operator (unlike one that is protected against inefficient
investment) would develop a network in this way, installing 4 separate cabinets, and digging 4 separate
ducts, in little over 10 years, purely to keep pace with demand. It would be far less costly to install fewer
larger capacity cabinets less frequently.
PCP-Cabinet Duct
3.23 Even if such a cabinet deployment strategy were to be adopted, the proposed approach to modelling
PCP-Cabinet duct appears unrealistic. For example:
a) The modelling appears to assume that the required linkage between the PCP and the cabinet
will be served exclusively by new duct, and that there will be no re-use of existing duct, even
though Cartesian acknowledges that in reality, there would be some re-use23.
22 Cell I99, Input_Network, 2.Network Cost 23 Footnote 5, Cartesian report

C1 - Unclassified
Vodafone Limited, Vodafone House, The Connection, Newbury, Berkshire, RG14 2FN, England. Registered in England No. 1471587 Page 15 of 19
b) Even if the first FTTC cabinet at a PCP requires all new duct, it seems highly unlikely, as currently
assumed by the model, that the second third and fourth cabinets would each require the same
length of new duct again (i.e. that there would be no re-use of the first cabinet duct).
Backhaul duct and fibre
3.24 Where the closest exchange to a cabinet is not fibre-enabled, the fibre cable needs to be extended to
its fibre-enabled Parent Exchange. Cartesian states that the modelling assumes that the link between
the two exchanges uses existing duct, and that “additional backhaul duct and fibre is not required for
providing FTTC services, as they rely on existing infrastructure”24. Vodafone agrees that unless there is
any firm evidence of additional backhaul duct being deployed for FTTC services, this is an appropriate
assumption.
However, the model includes 5,000km of backhaul duct and fibre25. As the model is supposed to include
only the incremental costs incurred in providing fibre based access services, the assumption would appear
to be that these services require the deployment of 5,000km of incremental duct and fibre. This is
inconsistent with Cartesian’s statements and does not appear to be supported by any reasoning. Indeed
BT is required to offer Passive Access to new duct infrastructure greater than 1KM in the state aid area (or
new duct costing more than £50k to construct). Although this is only a subset of the total FTTC network,
BT has only identified 190km26 of new duct as being available for Passive Access under this arrangement,
suggesting that the 5,000km assumption is excessive.
3.25 Vodafone would welcome clarification on this issue.
Cost of FTTC equipment
3.26 Cartesian states that cost trends are input in nominal terms, and then converted into real terms using
CPI; and that after 2027/28; unit capex and opex are assumed to stay constant in real terms27. In fact,
the model assumes that unit capex and opex stay constant in nominal terms, and so decline in real
terms28, although this is an input assumption that can easily be varied.
24 Paras 3.36 to 3.37, Cartesian report 25 Rows 146 to 147, Input_Network, 2.Network Cost 26 https://www.openreach.co.uk/orpg/home/products/ductandpolesharing/ductandpolesharing.do 27 Paras 4.23 to 4.24, Cartesian report 28 Rows 18 to 82, Input_CostTrends, 2.Network Cost
C1 - Unclassified
Vodafone Limited, Vodafone House, The Connection, Newbury, Berkshire, RG14 2FN, England. Registered in England No. 1471587 Page 16 of 19
Depreciation approach
Real v nominal results
3.27 The Network Cost module is in real terms, except where some inputs (e.g. unit cost trends) are input in
nominal terms and then converted into real terms.
a) The real term outputs from the Network Cost module are fed into the OED and SED calculations in
the Cost Recovery module, which produce results that are also in real terms.
b) The real term outputs from the Network Cost module are also fed into the CCA calculations in the
Cost Recovery module. These are converted into nominal terms in order to calculate holding
gains/losses etc., and so produce results in nominal terms. However, these are not converted back
into real terms.
c) As a result, the reporting sheets in the Cost Recovery module which appear to compare CCA, OED
and SED results29 are misleading, because reported CCA results (in nominal terms) are not
comparable with reported OED/SED results (in real terms).
CCA volatility
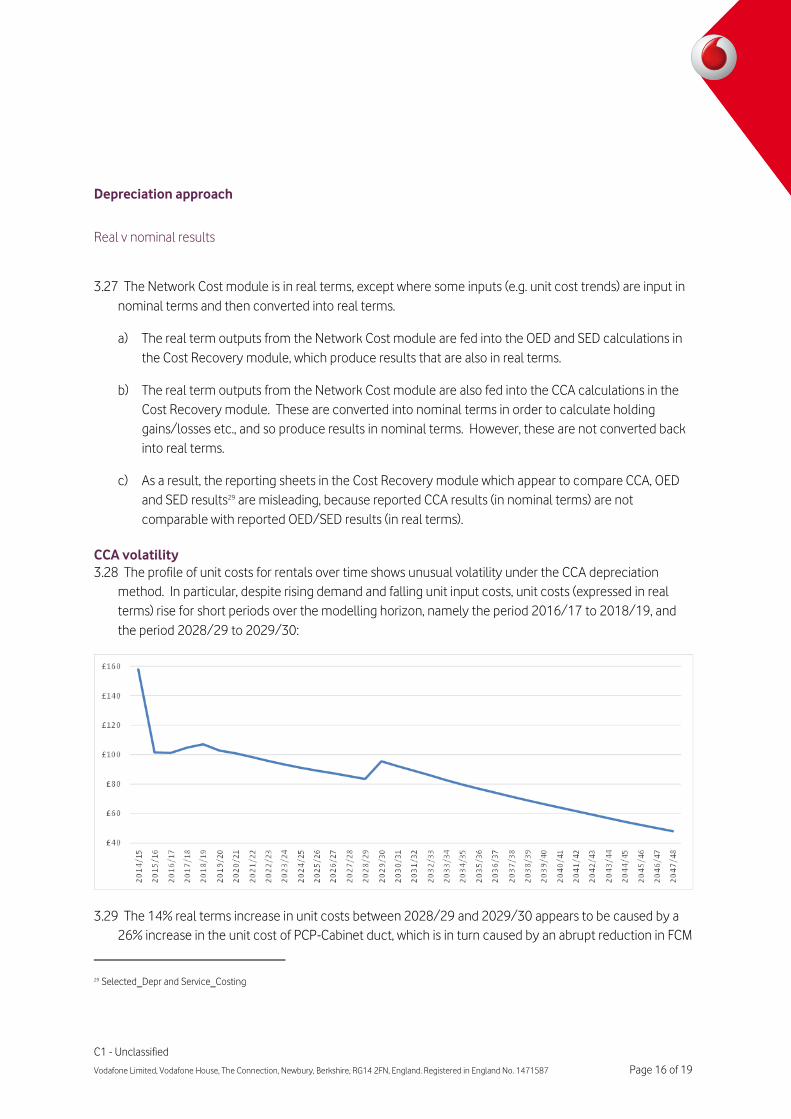
3.28 The profile of unit costs for rentals over time shows unusual volatility under the CCA depreciation
method. In particular, despite rising demand and falling unit input costs, unit costs (expressed in real
terms) rise for short periods over the modelling horizon, namely the period 2016/17 to 2018/19, and
the period 2028/29 to 2029/30:
3.29 The 14% real terms increase in unit costs between 2028/29 and 2029/30 appears to be caused by a
26% increase in the unit cost of PCP-Cabinet duct, which is in turn caused by an abrupt reduction in FCM
29 Selected_Depr and Service_Costing
C1 - Unclassified
Vodafone Limited, Vodafone House, The Connection, Newbury, Berkshire, RG14 2FN, England. Registered in England No. 1471587 Page 17 of 19
holding gains for that network element30, reflecting an assumed slowdown in unit labour cost trends.
The 6% real terms increase in unit costs between 2016/17 and 2018/19 also appears to relate to
changes in PCP-cabinet duct holding gains. It is far from clear that such volatility is an appropriate
reflection of the underlying trend in the economics of access fibre.
CCA saw tooth
3.30 There is another commonly acknowledged disadvantage of using CCA depreciation in an environment
where a large volume of long lived assets are deployed over a relatively short period of time, which does
not become clear over the planning horizon used by the model. Specifically, and as noted in the past by
Ofcom’s own consultants31, the ROCE for each individual asset (and its replacement successors) displays
a “saw tooth” profile, with a higher ROCE on the relatively undepreciated capital cost in the early years of
its life, and a lower ROCE on the more depreciated capital cost in the later years of its life.
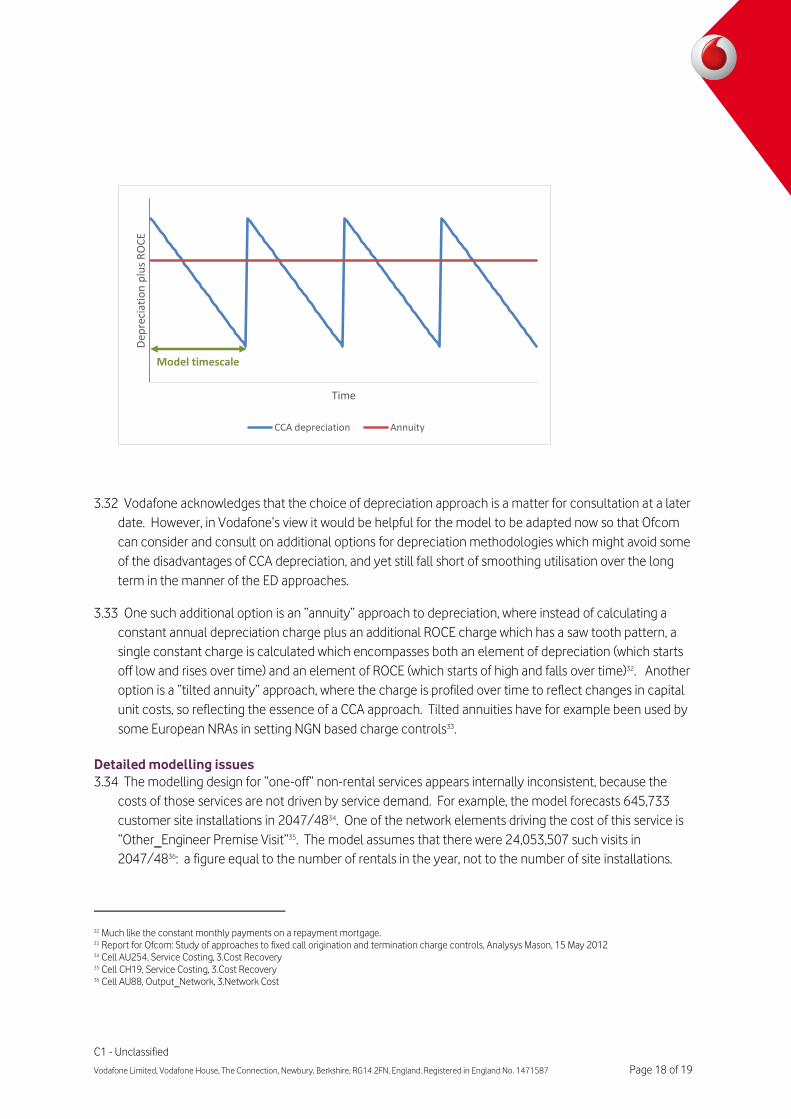
3.31 In many circumstances this effect is barely noticeable, because the initial deployment of the asset base
occurs over an extended time frame and the life stages of different individual assets balance out.
However, where, as here, many assets are deployed over a short period of time, the saw tooth can
remain significant. The saw tooth is not clear in the trend shown above, because the most significant
asset in cost terms, PCP-Cabinet duct, has an assumed lifetime of 40 years and does not therefore get
replaced within the timescale of the model. However, if the timescale were to be extended, the
replacement of duct would create a sharp rise in unit costs immediately after 2047/48, revealing the
fact that the entire unit cost profile covered by the model’s timescale is one long path down a single
tooth of the “saw tooth” pattern:
30 Row 1130, CCA, 3.Cost Recovery 31 Page 35, Report for Ofcom: Alternative methodologies for the valuation of BT‟s duct assets, Analysys Mason, 2 March 2010
C1 - Unclassified
Vodafone Limited, Vodafone House, The Connection, Newbury, Berkshire, RG14 2FN, England. Registered in England No. 1471587 Page 18 of 19
3.32 Vodafone acknowledges that the choice of depreciation approach is a matter for consultation at a later
date. However, in Vodafone’s view it would be helpful for the model to be adapted now so that Ofcom
can consider and consult on additional options for depreciation methodologies which might avoid some
of the disadvantages of CCA depreciation, and yet still fall short of smoothing utilisation over the long
term in the manner of the ED approaches.
3.33 One such additional option is an “annuity” approach to depreciation, where instead of calculating a
constant annual depreciation charge plus an additional ROCE charge which has a saw tooth pattern, a
single constant charge is calculated which encompasses both an element of depreciation (which starts
off low and rises over time) and an element of ROCE (which starts of high and falls over time)32. Another
option is a “tilted annuity” approach, where the charge is profiled over time to reflect changes in capital
unit costs, so reflecting the essence of a CCA approach. Tilted annuities have for example been used by
some European NRAs in setting NGN based charge controls33.
Detailed modelling issues
3.34 The modelling design for “one-off” non-rental services appears internally inconsistent, because the
costs of those services are not driven by service demand. For example, the model forecasts 645,733
customer site installations in 2047/4834. One of the network elements driving the cost of this service is
“Other_Engineer Premise Visit”35. The model assumes that there were 24,053,507 such visits in
2047/4836: a figure equal to the number of rentals in the year, not to the number of site installations.
32 Much like the constant monthly payments on a repayment mortgage. 33 Report for Ofcom: Study of approaches to fixed call origination and termination charge controls, Analysys Mason, 15 May 2012 34 Cell AU254, Service Costing, 3.Cost Recovery 35 Cell CH19, Service Costing, 3.Cost Recovery 36 Cell AU88, Output_Network, 3.Network Cost
Dep
reci
atio
n p
lus
RO
CE
Time
CCA depreciation Annuity
Model timescale

C1 - Unclassified
Vodafone Limited, Vodafone House, The Connection, Newbury, Berkshire, RG14 2FN, England. Registered in England No. 1471587 Page 19 of 19
This appears to lead to a number of errors, including the misstatement of unit costs are misstated, and
negative CCA depreciation charges in later years. A similar problem exists for GEA FTTC provisioning37.
END
37 And might also arise for GEA software changes