Vodafone India – Idea · PDF fileVodafone India and Idea: benefits for all stakeholders....
23
Investor presentation Vodafone India – Idea merger 20 March 2017
-
Upload
nguyentram -
Category
Documents
-
view
219 -
download
1
Transcript of Vodafone India – Idea · PDF fileVodafone India and Idea: benefits for all stakeholders....
Investor presentation
Vodafone India– Idea merger
20 March 2017
Forward Looking Statements
Certain information contained in this document constitutes “forward-looking statements”, which can be identified by the use of terms such as “may”, “will”, “should”, “expect”,“anticipate”, “project”, “estimate”, “intend”, “continue”, “target” or “believe” (or the negatives thereof) or other variations thereon or comparable terminology, or by discussionsof strategy, plans, objectives, goals, future events or intentions. Such statements express the intentions, opinions, or current expectations of the parties with respect to possiblefuture events and are based on current plans, estimates and forecasts, which the parties have made to the best of their respective knowledge, concerning, among other things,the respective business, results of operations, financial position, prospects, growth and strategies of Vodafone and Idea Cellular Limited (“Idea”) (an Aditya Birla Group company),statements regarding the transaction and the anticipated consequences and benefits of the transaction, the future growth prospects of the combined company and thetargeted closing date of the transaction, and the intended financing for the combined company (including the intended leverage). Due to various risks and uncertainties, actualevents or results or the actual performance may differ materially from those reflected or contemplated in such forward-looking statements.
Such risks and uncertainties include, but are not limited to, regulatory approvals that may require acceptance of conditions with potential adverse impacts; risks involving theparties’ respective ability to realise expected benefits associated with the transaction; the impact of legal or other proceedings; and continued growth in the market fortelecommunications services and general economic conditions in the relevant market(s).
Furthermore, a review of the reasons why actual results and developments may differ materially from the expectations disclosed or implied within forward-looking statementscan be found:
• under “Forward-looking statements” and “Principal risk factors and uncertainties” in the Vodafone Group Plc’s annual report for the year ended 31 March 2016; and
• under "Other Information – Forward-Looking Statements" in Vodafone Group Plc's Half-Year Financial Report for the six months ended 30 September 2016.
No assurances can be given that the forward-looking statements in this announcement will be realised. As a result, recipients should not rely on such forward-lookingstatements. Subject to compliance with applicable law and regulations, the parties undertake no obligation to update these forward-looking statements. No representation orwarranty is made as to the reasonableness of such forward-looking statements. No statement in this document is intended to be nor may be construed as a profit forecast orestimate for any period and no statement in this document should be interpreted to mean that cash flow from operations, free cash flow, earnings, or earnings per share foreither of Vodafone (as altered by the combined company) or Idea will necessarily match or exceed the historical or published cash flow from operations, free cash flow,earnings, or earnings per share for either of Vodafone or Idea (as appropriate). Actual results could differ materially from those expressed or implied.
This document is for information purposes only and is not intended to and does not constitute, or form part of, any invitation or offer to sell, dispose, acquire, purchase orsubscribe for any securities of any companies mentioned herein in any jurisdiction, whether pursuant to the transaction or otherwise. This document shall not be distributed orused by any person or entity in any jurisdiction where such distribution or use would be contrary to applicable law or regulation.
Disclaimer
2
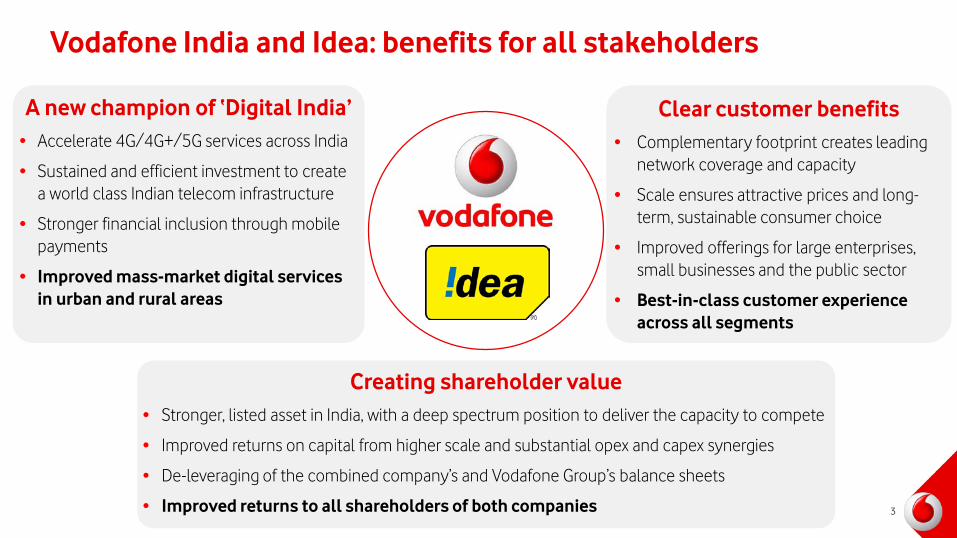
InputVodafone India and Idea: benefits for all stakeholders
A new champion of ‘Digital India’• Accelerate 4G/4G+/5G services across India
• Sustained and efficient investment to create a world class Indian telecom infrastructure
• Stronger financial inclusion through mobile payments
• Improved mass-market digital services in urban and rural areas
Creating shareholder value• Stronger, listed asset in India, with a deep spectrum position to deliver the capacity to compete
• Improved returns on capital from higher scale and substantial opex and capex synergies
• De-leveraging of the combined company’s and Vodafone Group’s balance sheets
• Improved returns to all shareholders of both companies
Clear customer benefits• Complementary footprint creates leading
network coverage and capacity
• Scale ensures attractive prices and long-term, sustainable consumer choice
• Improved offerings for large enterprises, small businesses and the public sector
• Best-in-class customer experience across all segments
3

Vodafone and Idea: the largest Indian telco
1. Revenue market share based on Q3 FY 2017 gross revenue 2. Based on current footprint; 2G site numbers likely to fall post-completion due to rationalisation3. Spectrum holdings are shown on a pro-forma combined basis and may need to be reduced to comply with M&A guidelines4. NPV of cost and capex synergies after integration costs and spectrum liberalisation fees; run-rate savings on an annual basis before integration costs in the fourth full year after completion
Largest telecom operator:#1/#2 RMS in 21 out of 22 circles1
Highly complementary footprintand coverage• Metro, urban and rural markets• Broadest coverage: 273k 2G sites2,
189k 3G/4G sites2
Competitive spectrum portfolio and broadband coverage• 1,850 MHz3, premium 900 MHz in 17 circles• 163 3G/4G carriers3, up to 250mbps
in 12 circles
Extensive distribution channels and unparalleled service infrastructure• Over 2m retailers• 19k branded stores and 28k contact
centre agents
Full digital services to Indian consumers and businesses• Mobile payments, IoT, advanced enterprise
offerings and entertainment services
Substantial cost and capex synergies • Estimated NPV of US$10bn4
• $2.1bn annual run rate in 4th year4
4
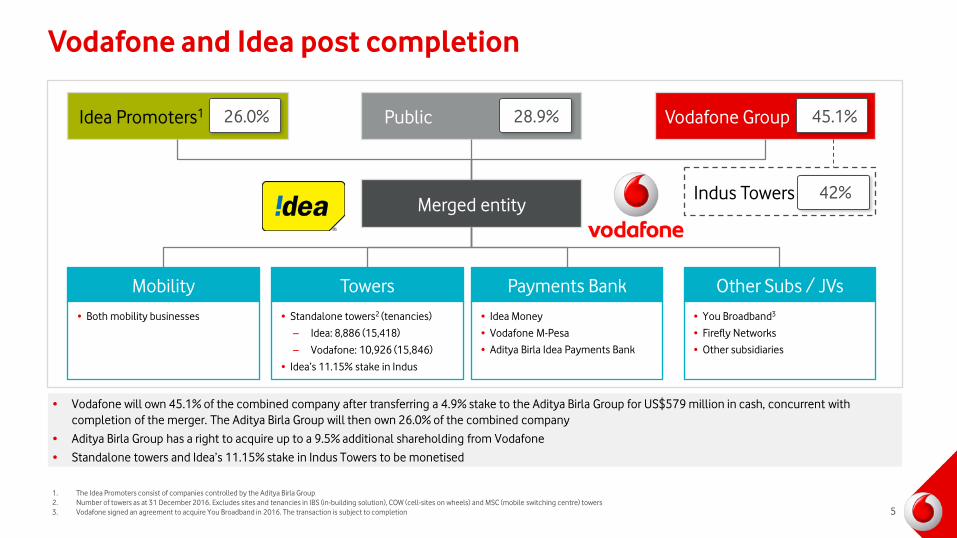
Vodafone and Idea post completion
• Vodafone will own 45.1% of the combined company after transferring a 4.9% stake to the Aditya Birla Group for US$579 million in cash, concurrent with completion of the merger. The Aditya Birla Group will then own 26.0% of the combined company
• Aditya Birla Group has a right to acquire up to a 9.5% additional shareholding from Vodafone
• Standalone towers and Idea’s 11.15% stake in Indus Towers to be monetised
Idea Promoters1
1. The Idea Promoters consist of companies controlled by the Aditya Birla Group2. Number of towers as at 31 December 2016. Excludes sites and tenancies in IBS (in-building solution), COW (cell-sites on wheels) and MSC (mobile switching centre) towers3. Vodafone signed an agreement to acquire You Broadband in 2016. The transaction is subject to completion
Mobility• Both mobility businesses
Towers• Standalone towers2 (tenancies)
– Idea: 8,886 (15,418)
– Vodafone: 10,926 (15,846)
• Idea’s 11.15% stake in Indus
Payments Bank• Idea Money
• Vodafone M-Pesa
• Aditya Birla Idea Payments Bank
Other Subs / JVs• You Broadband3
• Firefly Networks
• Other subsidiaries
Public Vodafone Group
Merged entity
26.0% 28.9% 45.1%
42%Indus Towers
5
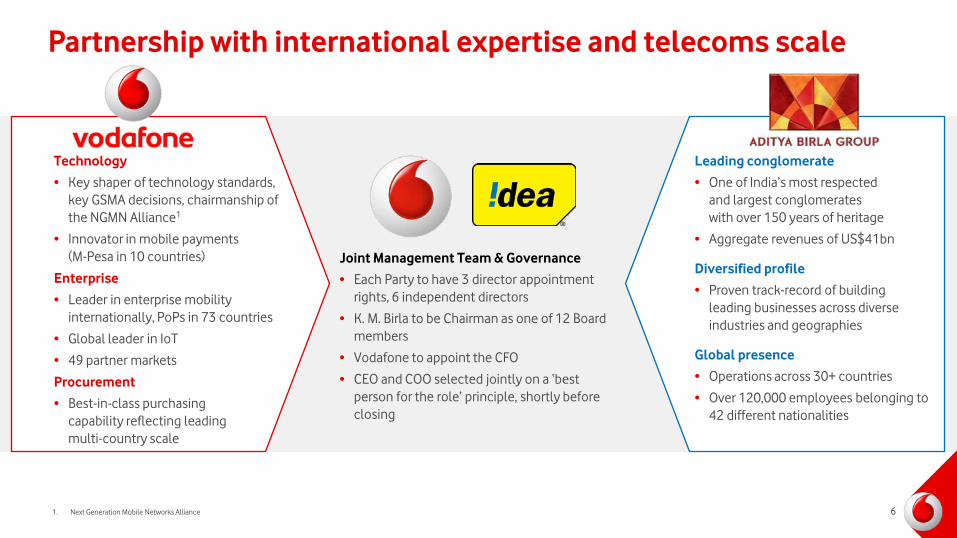
Partnership with international expertise and telecoms scale
6
Technology
• Key shaper of technology standards, key GSMA decisions, chairmanship of the NGMN Alliance1
• Innovator in mobile payments(M-Pesa in 10 countries)
Enterprise
• Leader in enterprise mobility internationally, PoPs in 73 countries
• Global leader in IoT
• 49 partner markets
Procurement
• Best-in-class purchasingcapability reflecting leadingmulti-country scale
Leading conglomerate
• One of India’s most respectedand largest conglomerateswith over 150 years of heritage
• Aggregate revenues of US$41bn
Diversified profile
• Proven track-record of building leading businesses across diverse industries and geographies
Global presence
• Operations across 30+ countries
• Over 120,000 employees belonging to 42 different nationalities
Joint Management Team & Governance
• Each Party to have 3 director appointment rights, 6 independent directors
• K. M. Birla to be Chairman as one of 12 Board members
• Vodafone to appoint the CFO
• CEO and COO selected jointly on a ‘best person for the role’ principle, shortly before closing
1. Next Generation Mobile Networks Alliance
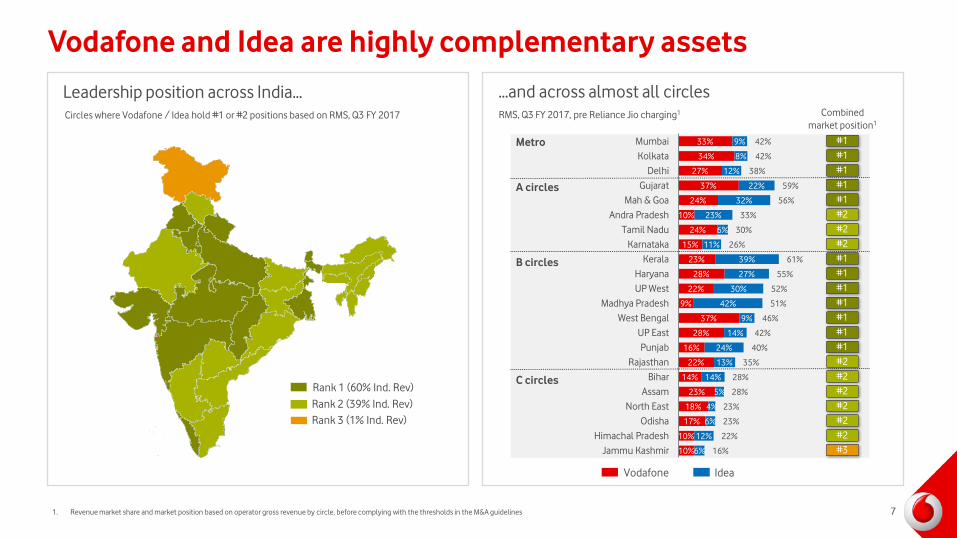
Vodafone and Idea are highly complementary assets
…and across almost all circles
10%
10%
17%
18%
23%
14%
22%
16%
28%
37%
9%
22%
28%
23%
15%
24%
10%
24%
37%
27%
34%
33%
6%
12%
6%
4%
5%
14%
13%
24%
14%
9%
42%
30%
27%
39%
11%
6%
23%
32%
22%
12%
8%
9%
16%
22%
23%
23%
28%
28%
35%
40%
42%
46%
51%
52%
55%
61%
26%
30%
33%
56%
59%
38%
42%
42%
Jammu KashmirHimachal Pradesh
OdishaNorth East
AssamBihar
RajasthanPunjab
UP EastWest Bengal
Madhya PradeshUP WestHaryana
KeralaKarnataka
Tamil NaduAndra Pradesh
Mah & GoaGujarat
DelhiKolkata
MumbaiMetro
A circles
B circles
C circles
Vodafone Idea
RMS, Q3 FY 2017, pre Reliance Jio charging1
#2#2#2
#3#2#2
#1#1#1
#2#1#1
#2#2#1
#1#1#2
#1#1#1
#1
Combinedmarket position1
1. Revenue market share and market position based on operator gross revenue by circle, before complying with the thresholds in the M&A guidelines
Leadership position across India…Circles where Vodafone / Idea hold #1 or #2 positions based on RMS, Q3 FY 2017
Rank 1 (60% Ind. Rev)Rank 2 (39% Ind. Rev)Rank 3 (1% Ind. Rev)
7
Total spectrum holdingspost Oct-2016 auction (MHz)1
958
1,489
1,235
984 958 891 883
387
891
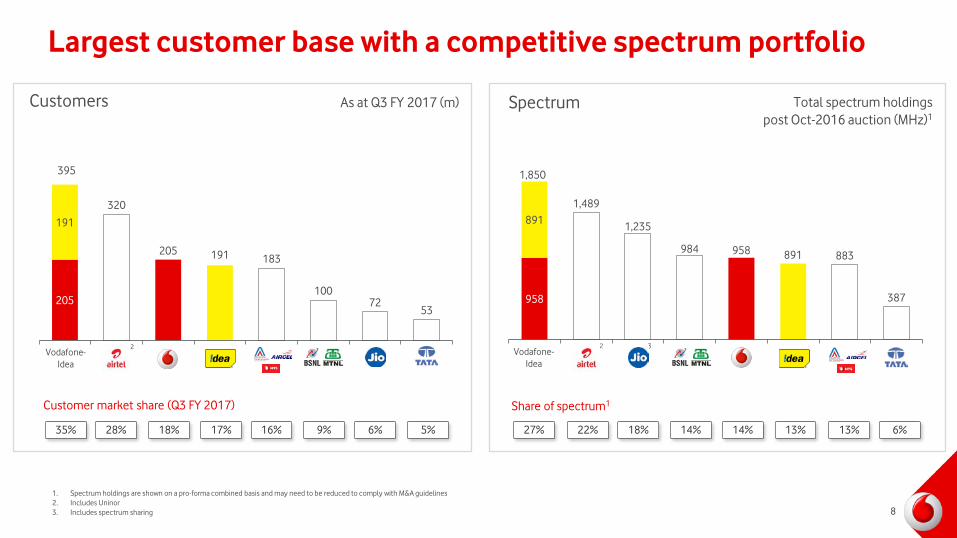
Largest customer base with a competitive spectrum portfolio
1. Spectrum holdings are shown on a pro-forma combined basis and may need to be reduced to comply with M&A guidelines2. Includes Uninor3. Includes spectrum sharing
205
320
205 191 183
10072
53
191
Vodafone-Idea
395
35% 28% 18% 17% 16% 6% 5%
Customer market share (Q3 FY 2017)
Spectrum
Vodafone-Idea
Share of spectrum1
27% 22% 18% 14% 13% 6%
1,850
13%9% 14%
Customers As at Q3 FY 2017 (m)
2 2 3
8
2.0
3.3
2.0 1.8
0.5n.a.
1.8
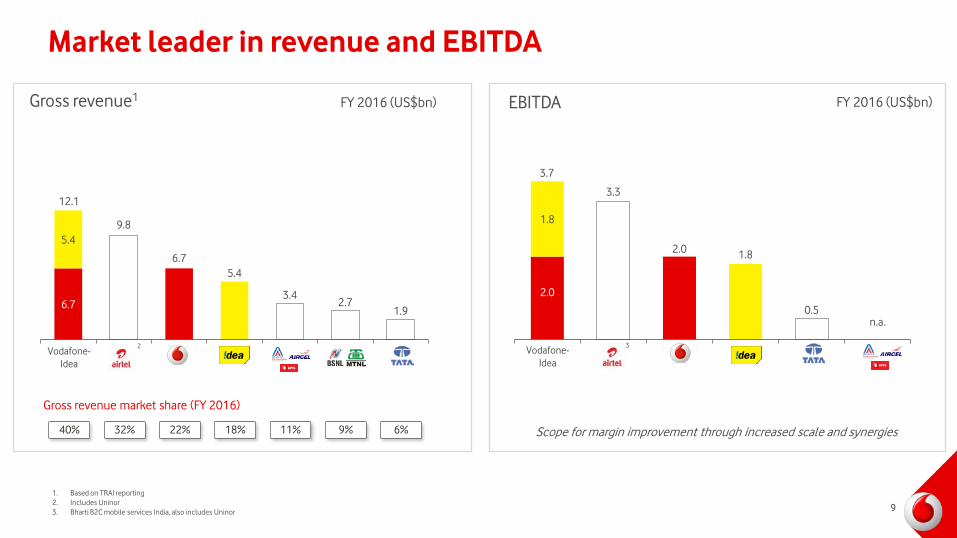
Market leader in revenue and EBITDA
1. Based on TRAI reporting2. Includes Uninor3. Bharti B2C mobile services India, also includes Uninor
Vodafone-Idea
3.7
Scope for margin improvement through increased scale and synergies
6.7
9.8
6.75.4
3.42.7
1.9
5.4
Vodafone-Idea
12.1
40% 32% 22% 18% 11% 6%9%
FY 2016 (US$bn)EBITDAGross revenue1 FY 2016 (US$bn)
Gross revenue market share (FY 2016)
2 3
9
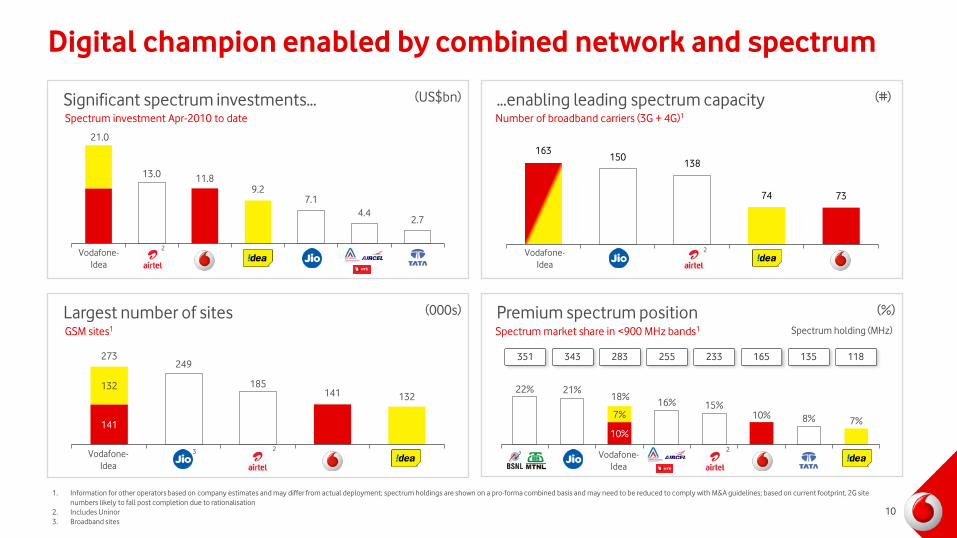
Digital champion enabled by combined network and spectrum
141
249
185141 132
132
Significant spectrum investments…
13.0 11.89.2
7.14.4
2.7
Vodafone-Idea
21.0
Spectrum investment Apr-2010 to date…enabling leading spectrum capacity
Largest number of sitesGSM sites1
273
(US$bn) (#)
1. Information for other operators based on company estimates and may differ from actual deployment; spectrum holdings are shown on a pro-forma combined basis and may need to be reduced to comply with M&A guidelines; based on current footprint, 2G site numbers likely to fall post completion due to rationalisation
2. Includes Uninor3. Broadband sites
(000s)
10
Number of broadband carriers (3G + 4G)1
163150
138
74 73
Vodafone-Idea
Vodafone-Idea
22% 21%
10%
16% 15%10% 8% 7%
7%
Premium spectrum position
351
(%)Spectrum market share in <900 MHz bands1 Spectrum holding (MHz)
343 255 233
Vodafone-Idea
18%
118135283 165
2 2
223
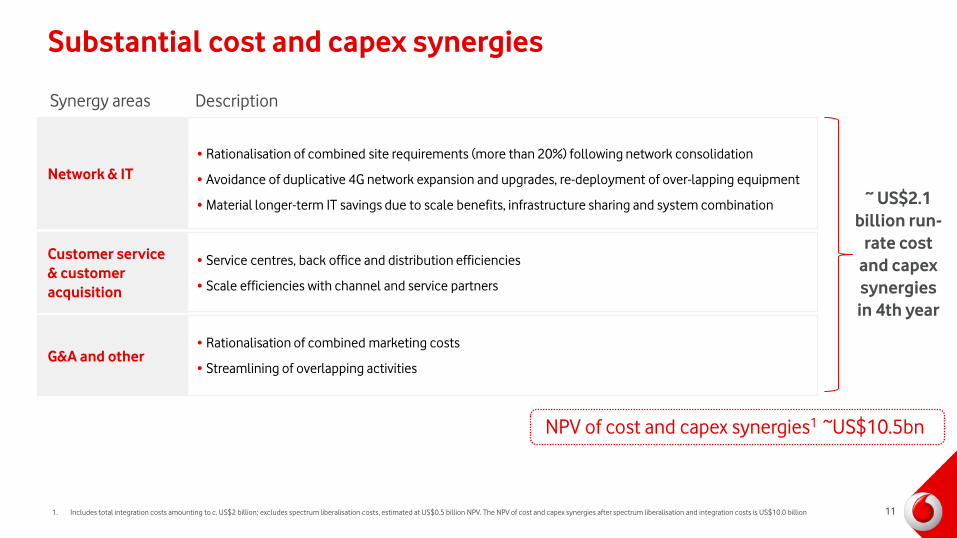
Substantial cost and capex synergies
Network & IT• Rationalisation of combined site requirements (more than 20%) following network consolidation
• Avoidance of duplicative 4G network expansion and upgrades, re-deployment of over-lapping equipment
• Material longer-term IT savings due to scale benefits, infrastructure sharing and system combination
Customer service & customer acquisition
• Service centres, back office and distribution efficiencies
• Scale efficiencies with channel and service partners
G&A and other• Rationalisation of combined marketing costs
• Streamlining of overlapping activities
Synergy areas Description
~ US$2.1 billion run-
rate cost and capex synergies in 4th year
NPV of cost and capex synergies1 ~US$10.5bn
1. Includes total integration costs amounting to c. US$2 billion; excludes spectrum liberalisation costs, estimated at US$0.5 billion NPV. The NPV of cost and capex synergies after spectrum liberalisation and integration costs is US$10.0 billion 11
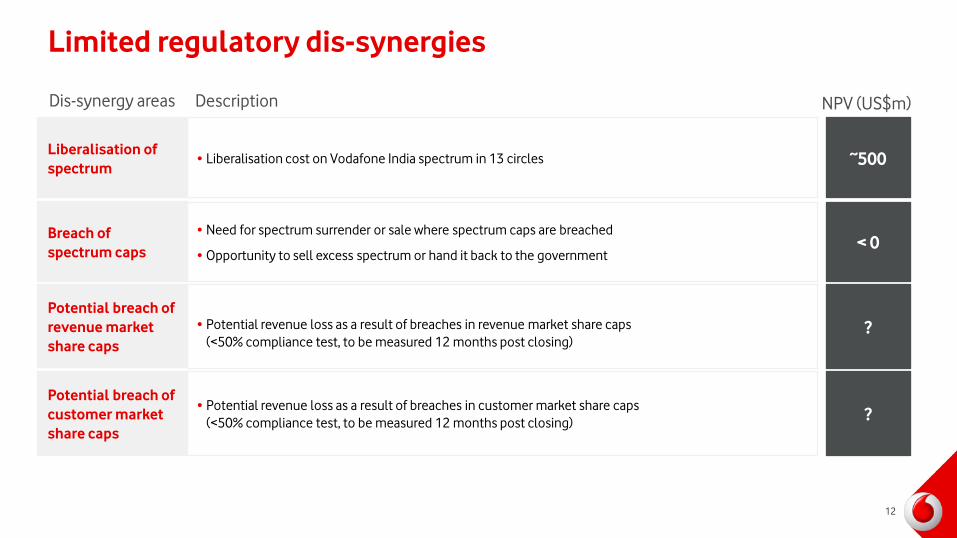
Limited regulatory dis-synergies
Liberalisation of spectrum ~500• Liberalisation cost on Vodafone India spectrum in 13 circles
Breach of spectrum caps < 0
• Need for spectrum surrender or sale where spectrum caps are breached
• Opportunity to sell excess spectrum or hand it back to the government
Potential breach of revenue market share caps
?• Potential revenue loss as a result of breaches in revenue market share caps(<50% compliance test, to be measured 12 months post closing)
Dis-synergy areas Description NPV (US$m)
Potential breach of customer market share caps
• Potential revenue loss as a result of breaches in customer market share caps(<50% compliance test, to be measured 12 months post closing) ?
12
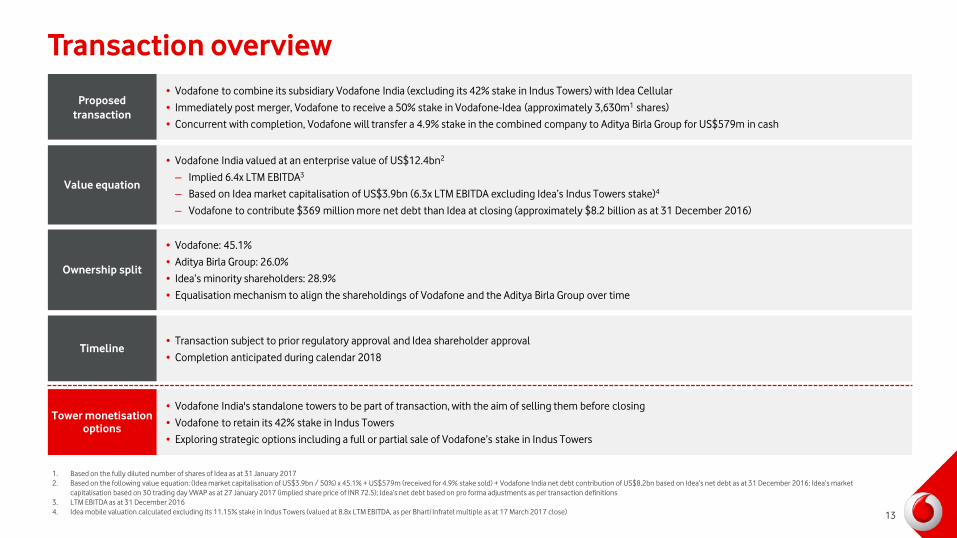
Transaction overview
1. Based on the fully diluted number of shares of Idea as at 31 January 20172. Based on the following value equation: (Idea market capitalisation of US$3.9bn / 50%) x 45.1% + US$579m (received for 4.9% stake sold) + Vodafone India net debt contribution of US$8.2bn based on Idea’s net debt as at 31 December 2016; Idea’s market
capitalisation based on 30 trading day VWAP as at 27 January 2017 (implied share price of INR 72.5); Idea’s net debt based on pro forma adjustments as per transaction definitions3. LTM EBITDA as at 31 December 20164. Idea mobile valuation calculated excluding its 11.15% stake in Indus Towers (valued at 8.8x LTM EBITDA, as per Bharti Infratel multiple as at 17 March 2017 close)
• Vodafone to combine its subsidiary Vodafone India (excluding its 42% stake in Indus Towers) with Idea Cellular
• Immediately post merger, Vodafone to receive a 50% stake in Vodafone-Idea (approximately 3,630m1 shares)
• Concurrent with completion, Vodafone will transfer a 4.9% stake in the combined company to Aditya Birla Group for US$579m in cash
Proposed transaction
• Vodafone: 45.1%
• Aditya Birla Group: 26.0%
• Idea’s minority shareholders: 28.9%
• Equalisation mechanism to align the shareholdings of Vodafone and the Aditya Birla Group over time
Ownership split
• Transaction subject to prior regulatory approval and Idea shareholder approval
• Completion anticipated during calendar 2018Timeline
• Vodafone India valued at an enterprise value of US$12.4bn2
– Implied 6.4x LTM EBITDA3
– Based on Idea market capitalisation of US$3.9bn (6.3x LTM EBITDA excluding Idea’s Indus Towers stake)4
– Vodafone to contribute $369 million more net debt than Idea at closing (approximately $8.2 billion as at 31 December 2016)
Value equation
• Vodafone India's standalone towers to be part of transaction, with the aim of selling them before closing
• Vodafone to retain its 42% stake in Indus Towers
• Exploring strategic options including a full or partial sale of Vodafone’s stake in Indus Towers
Tower monetisation options
13
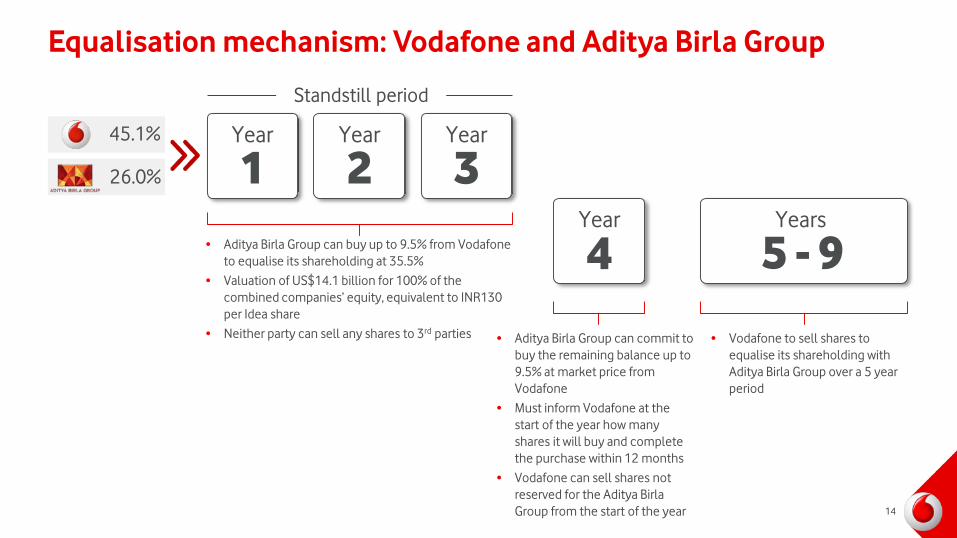
Equalisation mechanism: Vodafone and Aditya Birla Group
45.1%
26.0%
• Aditya Birla Group can buy up to 9.5% from Vodafone to equalise its shareholding at 35.5%
• Valuation of US$14.1 billion for 100% of the combined companies’ equity, equivalent to INR130 per Idea share
• Neither party can sell any shares to 3rd parties • Vodafone to sell shares to equalise its shareholding with Aditya Birla Group over a 5 year period
Standstill period
1Year
2Year
3Year
4Year
5 - 9Years
• Aditya Birla Group can commit to buy the remaining balance up to 9.5% at market price from Vodafone
• Must inform Vodafone at the start of the year how many shares it will buy and complete the purchase within 12 months
• Vodafone can sell shares not reserved for the Aditya Birla Group from the start of the year 14
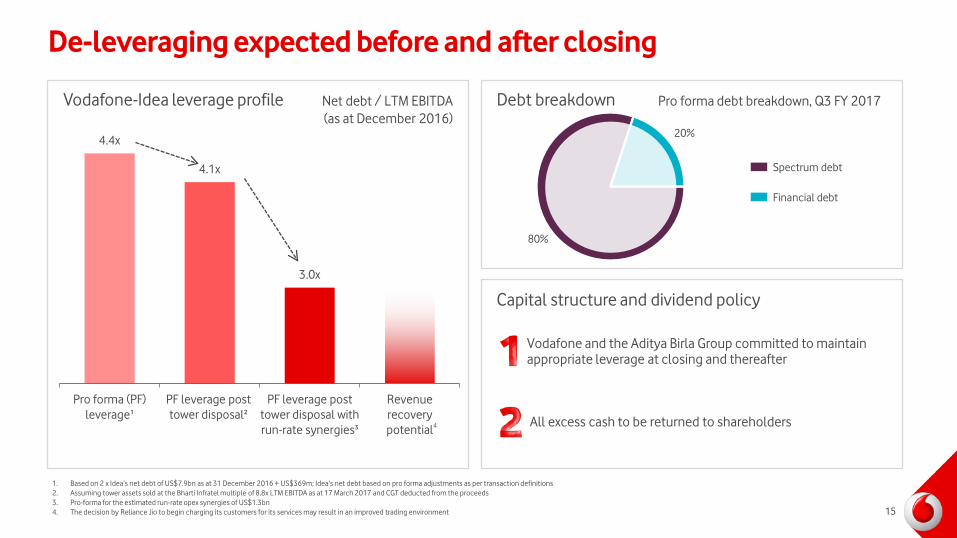
4.4x
4.1x
3.0x
Pro forma (PF)leverage¹
PF leverage posttower disposal²
PF leverage posttower disposal withrun-rate synergies³
Revenuerecoverypotential
De-leveraging expected before and after closing
Vodafone-Idea leverage profile Debt breakdown
Capital structure and dividend policy
Net debt / LTM EBITDA(as at December 2016)
Pro forma debt breakdown, Q3 FY 2017
20%
80%
Vodafone and the Aditya Birla Group committed to maintain appropriate leverage at closing and thereafter
All excess cash to be returned to shareholders
1. Based on 2 x Idea’s net debt of US$7.9bn as at 31 December 2016 + US$369m; Idea’s net debt based on pro forma adjustments as per transaction definitions2. Assuming tower assets sold at the Bharti Infratel multiple of 8.8x LTM EBITDA as at 17 March 2017 and CGT deducted from the proceeds3. Pro-forma for the estimated run-rate opex synergies of US$1.3bn 4. The decision by Reliance Jio to begin charging its customers for its services may result in an improved trading environment
Spectrum debt
Financial debt
4
15
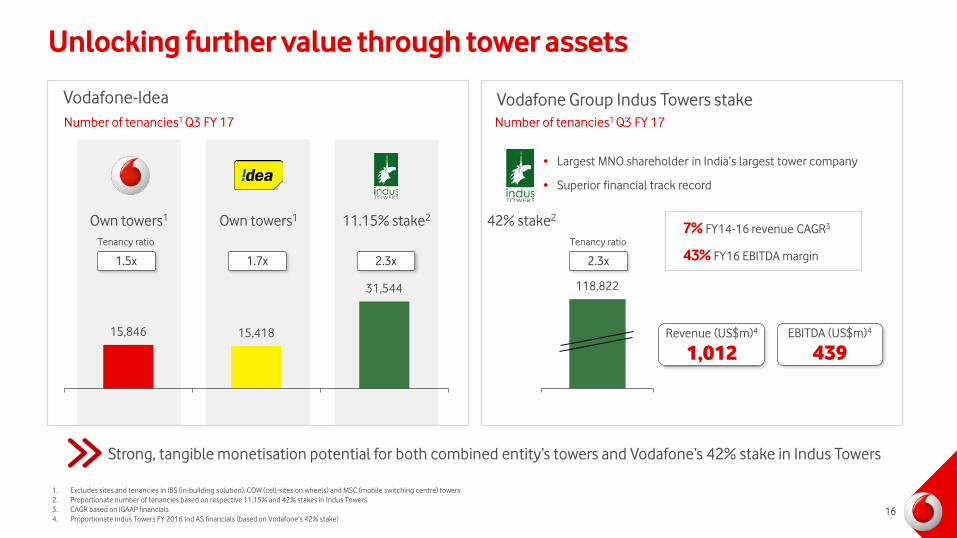
Unlocking further value through tower assets
16
Vodafone-Idea Vodafone Group Indus Towers stake
1.5x
Own towers1 Own towers1 11.15% stake2
15,846 15,418
31,544
1.7x 2.3x
Tenancy ratio
Number of tenancies1 Q3 FY 17
118,822
• Largest MNO shareholder in India’s largest tower company
• Superior financial track record
Number of tenancies1 Q3 FY 17
2.3x
Tenancy ratio
Revenue (US$m)4
1,012EBITDA (US$m)4
439
42% stake27% FY14-16 revenue CAGR3
43% FY16 EBITDA margin
Strong, tangible monetisation potential for both combined entity’s towers and Vodafone’s 42% stake in Indus Towers
1. Excludes sites and tenancies in IBS (in-building solution), COW (cell-sites on wheels) and MSC (mobile switching centre) towers2. Proportionate number of tenancies based on respective 11.15% and 42% stakes in Indus Towers3. CAGR based on IGAAP financials4. Proportionate Indus Towers FY 2016 Ind AS financials (based on Vodafone’s 42% stake)
• IFRS requires de-consolidation of Vodafone India immediately post announcement1
• After completion, India to be accounted for as a joint venture:
– JV reported under the equity method
– Net debt de-consolidated, improving pro-forma leverage ratios by around 0.3x2
– Accretive to Group cash flow post spectrum payments from the first full year post closing
• FY2016/17 guidance unchanged, continues to include India
• Going forwards, guidance to exclude India, consistent with local market practice
Implications for Vodafone Group financial reporting
1. The Vodafone Group’s reported revenue, EBITDA, operating profit and profit before and after tax for the year ending 31 March 2017 will exclude Vodafone India, with the after tax result of Vodafone India being presented as a single line in the income statement. All previous years’ financial results will be restated onto this basis
2. Based on expected Vodafone Group net debt/EBITDA at March 31 2017, pro-forma for the deconsolidation of Vodafone Netherlands. Net debt/EBITDA impact assumes deconsolidation of US$8.2 billion of India net debt, calculated as US$369 million more than Idea’s adjusted net debt of US$7.9 billion as of 31 December 2016, takes into account the cash payment of US$579 million received from the Aditya Birla Group and is subject to closing adjustments
17
Summary
1. Based on Idea net debt of US$7.9 billion as at 31 December 2016, plus US$369 million; Vodafone’s contribution of net debt will be subject to customary closing adjustments
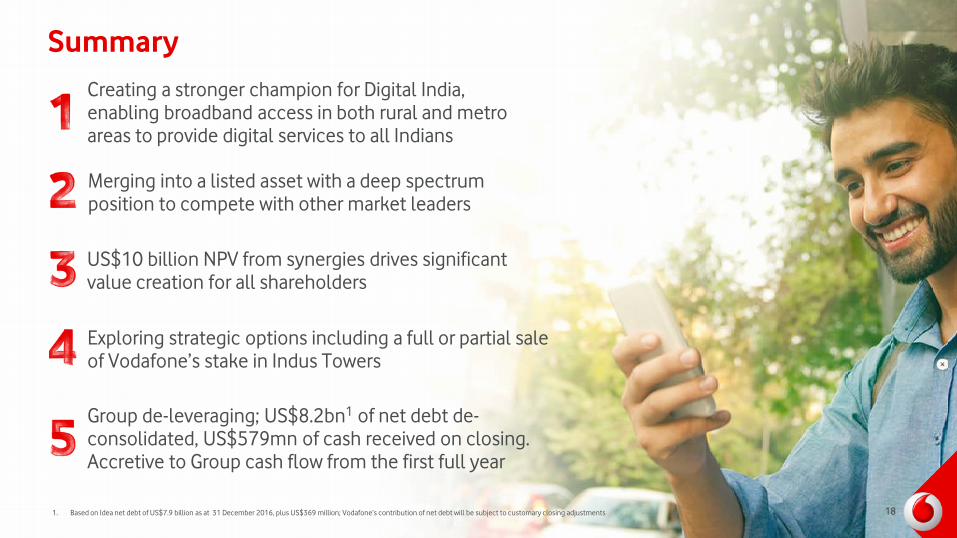
Creating a stronger champion for Digital India, enabling broadband access in both rural and metro areas to provide digital services to all Indians
Merging into a listed asset with a deep spectrum position to compete with other market leaders
US$10 billion NPV from synergies drives significant value creation for all shareholders
Exploring strategic options including a full or partial sale of Vodafone’s stake in Indus Towers
Group de-leveraging; US$8.2bn1 of net debt de-consolidated, US$579mn of cash received on closing. Accretive to Group cash flow from the first full year
18
Appendix
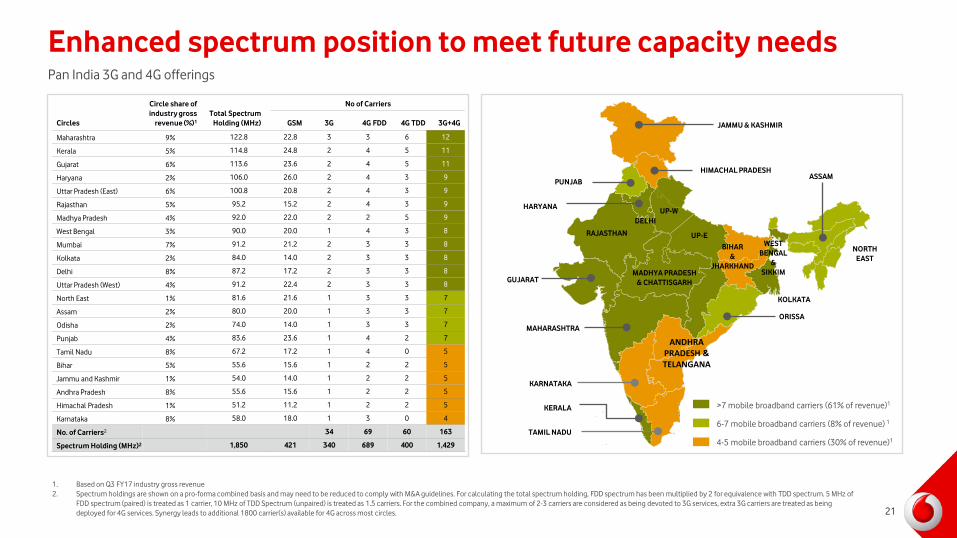
Enhanced spectrum position to meet future capacity needsPan India 3G and 4G offerings
>7 mobile broadband carriers (61% of revenue)1
6-7 mobile broadband carriers (8% of revenue) 1
4-5 mobile broadband carriers (30% of revenue)1
RAJASTHAN
GUJARAT
MAHARASHTRA
HIMACHAL PRADESH
KARNATAKA
KERALA
TAMIL NADU
JAMMU & KASHMIR
PUNJAB
ANDHRA PRADESH & TELANGANA
MADHYA PRADESH& CHATTISGARH
WESTBENGAL
&SIKKIM
HARYANA
DELHI
ASSAM
BIHAR&
JHARKHAND
NORTH EAST
UP-W
UP-E
ORISSA
KOLKATA
Circles
Circle share of industry gross
revenue (%)1
Total Spectrum Holding (MHz)
No of Carriers
GSM 3G 4G FDD 4G TDD 3G+4G
Maharashtra 9% 122.8 22.8 3 3 6 12
Kerala 5% 114.8 24.8 2 4 5 11
Gujarat 6% 113.6 23.6 2 4 5 11
Haryana 2% 106.0 26.0 2 4 3 9
Uttar Pradesh (East) 6% 100.8 20.8 2 4 3 9
Rajasthan 5% 95.2 15.2 2 4 3 9
Madhya Pradesh 4% 92.0 22.0 2 2 5 9
West Bengal 3% 90.0 20.0 1 4 3 8
Mumbai 7% 91.2 21.2 2 3 3 8
Kolkata 2% 84.0 14.0 2 3 3 8
Delhi 8% 87.2 17.2 2 3 3 8
Uttar Pradesh (West) 4% 91.2 22.4 2 3 3 8
North East 1% 81.6 21.6 1 3 3 7
Assam 2% 80.0 20.0 1 3 3 7
Odisha 2% 74.0 14.0 1 3 3 7
Punjab 4% 83.6 23.6 1 4 2 7
Tamil Nadu 8% 67.2 17.2 1 4 0 5
Bihar 5% 55.6 15.6 1 2 2 5
Jammu and Kashmir 1% 54.0 14.0 1 2 2 5
Andhra Pradesh 8% 55.6 15.6 1 2 2 5
Himachal Pradesh 1% 51.2 11.2 1 2 2 5
Karnataka 8% 58.0 18.0 1 3 0 4
No. of Carriers2 34 69 60 163
Spectrum Holding (MHz)2 1,850 421 340 689 400 1,429
1. Based on Q3 FY17 industry gross revenue2. Spectrum holdings are shown on a pro-forma combined basis and may need to be reduced to comply with M&A guidelines. For calculating the total spectrum holding, FDD spectrum has been multiplied by 2 for equivalence with TDD spectrum. 5 MHz of
FDD spectrum (paired) is treated as 1 carrier, 10 MHz of TDD Spectrum (unpaired) is treated as 1.5 carriers. For the combined company, a maximum of 2-3 carriers are considered as being devoted to 3G services, extra 3G carriers are treated as being deployed for 4G services. Synergy leads to additional 1800 carrier(s) available for 4G across most circles. 21
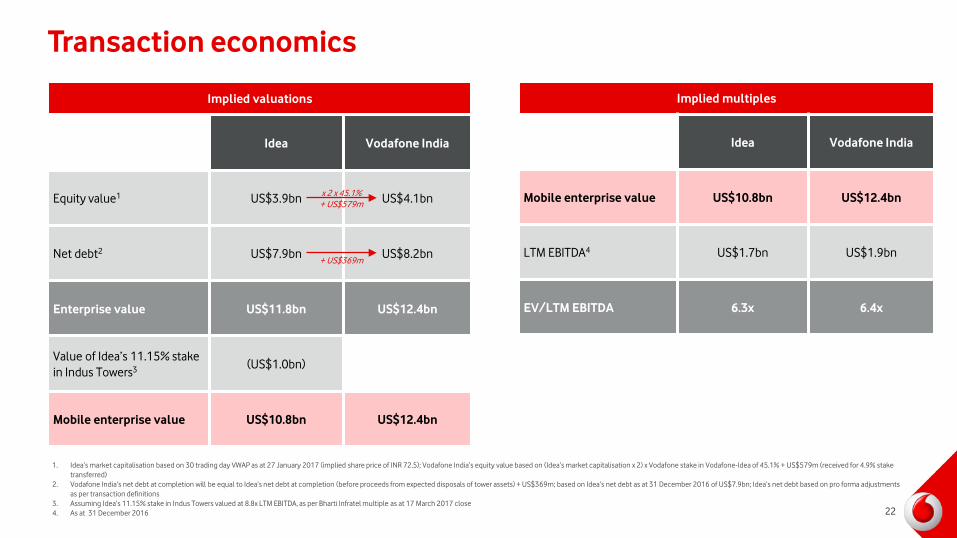
Transaction economics
Implied valuations
Idea Vodafone India
Equity value1 US$3.9bn US$4.1bn
Net debt2 US$7.9bn US$8.2bn
Enterprise value US$11.8bn US$12.4bn
Value of Idea’s 11.15% stake in Indus Towers3 (US$1.0bn)
Mobile enterprise value US$10.8bn US$12.4bn
Implied multiples
Idea Vodafone India
Mobile enterprise value US$10.8bn US$12.4bn
LTM EBITDA4 US$1.7bn US$1.9bn
EV/LTM EBITDA 6.3x 6.4x
x 2 x 45.1% + US$579m
+ US$369m
1. Idea’s market capitalisation based on 30 trading day VWAP as at 27 January 2017 (implied share price of INR 72.5); Vodafone India’s equity value based on (Idea’s market capitalisation x 2) x Vodafone stake in Vodafone-Idea of 45.1% + US$579m (received for 4.9% stake transferred)
2. Vodafone India’s net debt at completion will be equal to Idea’s net debt at completion (before proceeds from expected disposals of tower assets) + US$369m; based on Idea’s net debt as at 31 December 2016 of US$7.9bn; Idea’s net debt based on pro forma adjustments as per transaction definitions
3. Assuming Idea’s 11.15% stake in Indus Towers valued at 8.8x LTM EBITDA, as per Bharti Infratel multiple as at 17 March 2017 close4. As at 31 December 2016 22
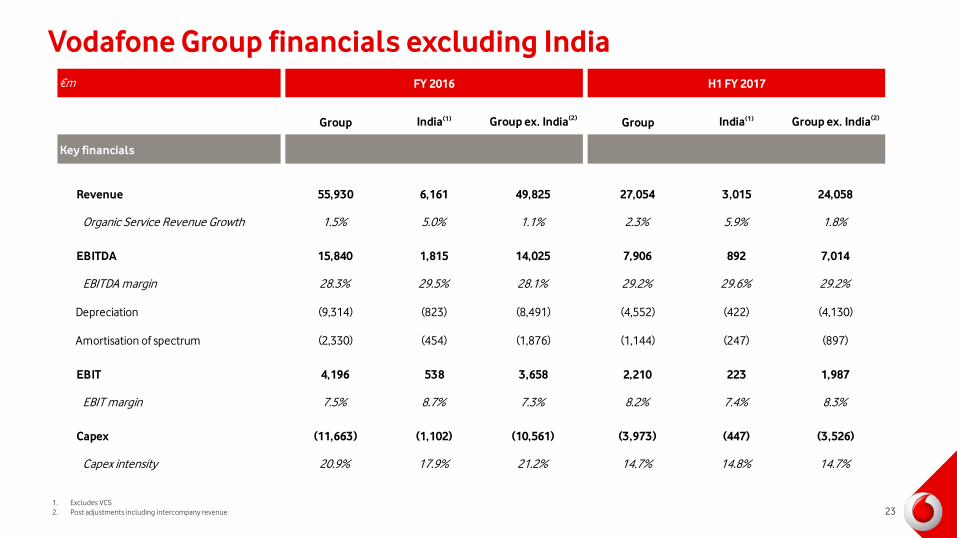
Vodafone Group financials excluding India
231. Excludes VCS2. Post adjustments including intercompany revenue
€m FY 2016 H1 FY 2017
Group India(1) Group ex. India(2) Group India(1) Group ex. India(2)
Key financials
Revenue 55,930 6,161 49,825 27,054 3,015 24,058
Organic Service Revenue Growth 1.5% 5.0% 1.1% 2.3% 5.9% 1.8%
EBITDA 15,840 1,815 14,025 7,906 892 7,014
EBITDA margin 28.3% 29.5% 28.1% 29.2% 29.6% 29.2%
Depreciation (9,314) (823) (8,491) (4,552) (422) (4,130)
Amortisation of spectrum (2,330) (454) (1,876) (1,144) (247) (897)
EBIT 4,196 538 3,658 2,210 223 1,987
EBIT margin 7.5% 8.7% 7.3% 8.2% 7.4% 8.3%
Capex (11,663) (1,102) (10,561) (3,973) (447) (3,526)
Capex intensity 20.9% 17.9% 21.2% 14.7% 14.8% 14.7%