Vodafone Group Plc Preliminary · PDF fileactual results to differ from these forward-looking...
23
Vodafone Group Plc Preliminary results For the year ended 31 March 2014 20 May 2014 Information in the following communication relating to the price at which relevant investments have been bought or sold in the past, or the yield on such investments, cannot be relied upon as a guide to the future performance of such investments. This presentation does not constitute an offering of securities or otherwise constitute an invitation or inducement to any person to underwrite, subscribe for or otherwise acquire or dispose of securities in any company within the Group. The presentation contains forward-looking statements within the meaning of the US Private Securities Litigation Reform Act of 1995 which are subject to risks and uncertainties because they relate to future events. These forward-looking statements include, without limitation, statements in relation to the Group’s financial outlook and future performance. Some of the factors which may cause actual results to differ from these forward-looking statements are discussed on the final slide of the presentation. The presentation also contains non-GAAP financial information which the Group’s management believes is valuable in understanding the performance of the Group. However, non-GAAP information is not uniformly defined by all companies and therefore may not be comparable with similarly titled measures disclosed by other companies, including those in the Group’s industry. Although these measures are important in the assessment and management of the business, they should not be viewed in isolation or as replacements for but rather as complementary to, the comparable GAAP measures. Vodafone, the Vodafone Speech Mark, the Vodafone Portrait, the 4g Logo, Power to You, Vodacom, Vodafone Red, Vodafone One Business, and Vodafone Ready Business are trademarks of the Vodafone Group. The Vodafone Rhombus is a registered design of the Vodafone Group. Other product and company names mentioned herein may be the trademarks of their respective owners. Disclaimer 2
Transcript of Vodafone Group Plc Preliminary · PDF fileactual results to differ from these forward-looking...

Vodafone Group Plc
Preliminary results
For the year ended 31 March 2014
20 May 2014
Information in the following communication relating to the price at which relevant investments have been bought or sold in the past,
or the yield on such investments, cannot be relied upon as a guide to the future performance of such investments. This presentation
does not constitute an offering of securities or otherwise constitute an invitation or inducement to any person to underwrite,
subscribe for or otherwise acquire or dispose of securities in any company within the Group.
The presentation contains forward-looking statements within the meaning of the US Private Securities Litigation Reform Act of 1995
which are subject to risks and uncertainties because they relate to future events. These forward-looking statements include, without
limitation, statements in relation to the Group’s financial outlook and future performance. Some of the factors which may cause
actual results to differ from these forward-looking statements are discussed on the final slide of the presentation.
The presentation also contains non-GAAP financial information which the Group’s management believes is valuable in understanding
the performance of the Group. However, non-GAAP information is not uniformly defined by all companies and therefore may not be
comparable with similarly titled measures disclosed by other companies, including those in the Group’s industry. Although these
measures are important in the assessment and management of the business, they should not be viewed in isolation or as
replacements for but rather as complementary to, the comparable GAAP measures.
Vodafone, the Vodafone Speech Mark, the Vodafone Portrait, the 4g Logo, Power to You, Vodacom, Vodafone Red, Vodafone One
Business, and Vodafone Ready Business are trademarks of the Vodafone Group. The Vodafone Rhombus is a registered design of the
Vodafone Group. Other product and company names mentioned herein may be the trademarks of their respective owners.
Disclaimer
2

Financial
performance
• Q4 Group service revenue -3.8% or -4.0% including Italy at 100%1
• Q4 Europe service revenue -8.5%, underlying trends improving in UK and Spain
• Q4 AMAP grew +6.0%; India +11.9% and Vodacom +5.1%, supported by strong data growth
• Improving fixed broadband trends, customer base +2.2% to 9.3m
• Met full year guidance: pro forma AOP £4.9bn and FCF £4.8bn
Strategic
progress
• Vodafone Red: 12m customers in 20 markets, improvements in churn and NPS
• 4G available in 14 countries with 4.7m customers, improvements in usage and ARPU
• Enterprise acceleration in key growth areas: M2M +20.9%, VGE +2.1%2
• Project Spring underway; accelerated network build-out in India and Germany
• Unified communications: Spain fibre commercial launch, Portugal fibre build ahead of plan
• Planned acquisition of Ono for £6.0bn; expected completion Q2 14/15
• US transaction completed, $85 billion returned to shareholders
3
Results above include joint ventures on a proportionate basis and all growth rates shown are organic unless otherwise stated
1. 100% ownership from 21 February 2014
2. Like-for-like growth rate
Full year highlights
Full year 13/14
Financial review
Nick Read Group Chief Financial Officer

Results affected by pricing pressure and increased customer
investment
FY 13/14
(£m)
Reported
growth (%)
Organic
growth (%)
Q4 13/14
growth (%)
Group revenue 43,616 (1.9) (3.5) (5.9)
Group service
revenue
39,529 (2.4) (4.3) (3.8)1 • Q4 -2.6%1 excluding MTR impact
• FY -2.0% excluding MTR impact
Group EBITDA2 12,831 (5.4) (7.4) • Increased customer investment in H2
EBITDA margin (%) 29.4 (1.1)ppt (1.3)ppt
Adjusted operating
profit2,3
7,874 (37.4) (9.4) • VZW 5 months contribution only
• AOP includes £3.2bn from VZW
All growth rates shown are organic unless otherwise stated
1. Organic growth on a comparable basis, with Italy weighted at 77% for the whole year
2. Now reported excluding the impact of restructuring costs and significant one-off items. Restructuring costs were £374m in FY 13/14 and £311m in FY 12/13
3. Excludes amortisation of acquired intangible customer bases and brand intangible assets
5
Significant profit on US disposal
Adjusted operating profit (management)1 7,874 12,577 (37.4)
Presentation adjustments2 (3,564) (6,987)
Adjusted operating profit (statutory)1 4,310 5,590
Net financing costs (1,208) (1,291) • Average cost of debt 4.9%
Taxation (4,445) (2,226)
Impairments (6,600) (7,700) • Germany, Spain, Portugal, Czech, Romania
Deferred taxation 19,318 -
Discontinued and other items3 46,520 - • £45.0bn gain on disposal
Customer & brand amortisation (551) (249)
Other4 1,910 6,289
Profit for the year 59,254 413
Adjusted earnings per share1 17.54 20.12 (12.8)
Ordinary dividend per share 11.0 10.2 8 • 11.0p; final 7.47p
FY 13/14
(£m)
FY 12/13
(£m)
Reported
growth (%)
6
All growth rates shown are organic unless otherwise stated
1. Now reported excluding the impact of restructuring costs, significant one-off items and amortisation of acquired intangible customer bases and brand intangible assets
2. Comprises discontinued operations in respect of the US group: FY 13/14 £3,169m, FY 12/13 £6,500m, plus adjustments to restate joint ventures from a proportionate to an equity basis:
FY 13/14 £395m, FY 12/13 £487m
3. Includes £44,996m pre-tax gain on disposal, VZW tax distributions post 2 September 2013 £1,703m, and other costs £179m
4. Includes the Group’s share of results in Verizon Wireless FY 13/14 £3,218m, FY 12/13 £6,366m, and restructuring costs FY 13/14 £355m, FY 12/13 £311m

Strong and increasing contribution from AMAP
7
All growth rates shown are organic unless otherwise stated
1. Reported growth
2. Full year 13/14
3. Europe and Common Functions
26.4
13.1
8.1
4.7
62%
38%
Service revenue (£bn)2 EBITDA (£bn)2 OFCF1, 2
£6.9bn 12.8 39.5
127
307
Customer numbers (m)1, 2
434
Full year 13/14 service revenue growth (excl. MTRs) (%)
AMAP +6.1%, Group -4.3% AMAP +16%, Group -7% +4ppt in AMAP AMAP +9%, Group +7%
Europe: -6.5%
AMAP: +7.8%
Group
Europe3
AMAP
19.3
13.0 10.1 8.4
2.6 2.0
(1.4) (2.0) (2.5) (4.6) (4.8)
(6.9) (7.4) (8.9) (9.3) (10.0) (12.8)
Ghana India Turkey Vodacom
Group
Egypt Romania Ireland UK Germany Netherlands Portugal Australia Greece Czech
Republic
Spain Italy
Service revenue: £0.9bn MTR hit
• Full year reported service revenue decline -2.4%, organic decline -4.3%
• Mobile in-bundle revenue grew +7.8% in FY 13/14 and Q4
• Q4 in-bundle revenues 61% of mobile service revenue in Europe
• 5 MVNO contracts ended, 3 renegotiated in the year
8 All growth rates shown are organic unless otherwise stated
1. Primarily represents adjustments for CWW, KDG and Italy
(£m)
40,495
(771)
1,460
1,163
(1,753)
198
(882) (381)
39,529
FY 12/ 13
reported service
revenue
FX M&A In-bundle Out-of-bundle Incoming MTR Other FY 13/14
reported service
revenue
1

30.5 0.2 30.7
(0.8) (0.5)
(0.3) (0.1)
0.4 0.4
(0.1) (0.3)
29.4
FY 12/13 FX & M&A Germany Italy Spain UK India Australia Other Mix FY 13/14
EBITDA margin: growth in AMAP partially offsetting decline in Europe
(% margin)
• Reported margin decline of 1.1ppt; organic decline 1.3ppt
• Europe: competitive pricing and increased customer investment driving margin decline
• AMAP: strong revenue growth and cost control
9
Stable underlying financing costs
FY 13/14
(£m)
FY 12/13
(£m)
Underlying net financing costs (1,242) (1,270)
Mark to market gains/(losses) 118 (112) • Gain on interest rate fixing
Potential interest on tax 15 91
US bond redemption (99) -
Net financing costs (1,208) (1,291)
Average cost of debt1 4.9% 5.1%
10
1. Excludes Piramal
FY 14/15
• Average cost of debt expected to increase due to
higher proportion of emerging market debt

Higher effective tax rate
FY 13/14
(£bn)
FY 12/13
(£bn)
Taxation1 4,445 2,226
Tax on re-organisation (2,210) - • US $3.6bn expected liability
VZW tax post 2 September (1,019)
Other 403 150
Adjusted tax expense 1,619 2,376
11
Effective tax rate 27.3% 24.5%
FY 14/15
• High 20’s % ETR forecast FY 14/15
1. Includes income tax expense from discontinued operations of £1,709m in FY 13/14 and £1,750m in FY 12/13
Continued investment, strong cash flow
FY 13/14
(£m)
FY 12/13
(£m)
EBITDA 12,831 13,566 • Lower EBITDA driven by revenue decline
Capital additions (7,102) (6,266) • Increased in UK, India, Spain, Germany
Working capital 1,414 410 • Includes £0.5bn from Project Spring
Net interest (1,471) (1,185)
Taxation (3,547) (2,933)
VZW tax distribution 2,763 2,389 • Final VZW tax distribution May 2014
Other net dividends (217) (348)
Other (266) (25)
Free cash flow 4,405 5,608
Free cash flow per share (p) 16.6 20.9
12

Healthy balance sheet position
13
• Key items within FY 13/14 closing net debt:
– KDG (100%)
– VZW proceeds
– Tax on re-organisation paid
– Spectrum acquisitions/renewals including
deferred Indian spectrum payments
– Includes Australia and Indus debt of £1.8bn
Pro forma net debt FY 14/15 (£bn) • Comfortable at around 2x net debt/EBITDA
– Flexibility if other opportunities arise
• Excludes VZ loan notes (US $5bn)
• Further spectrum auctions in FY 14/15
13
13.7
(1.8)
+ve c.3 c.23
6.0
15.5
March
2014
Indus /
Australia
March
2014
ONO Guidance
FCF
Dividend FY 14/15
Closing net debt (£bn)
27.0
8.5
(19.5) (0.5)
15.5
March 2013 KDG US transaction Other March 2014
1. March 2014 statutory net debt
2. Based on FY 13/14 dividend per share of 11.0p
1
2
My priorities for FY 14/15
14
Delivering integration synergies
from acquisitions
Deliver Project Spring
returns
Continued cost
improvement
14
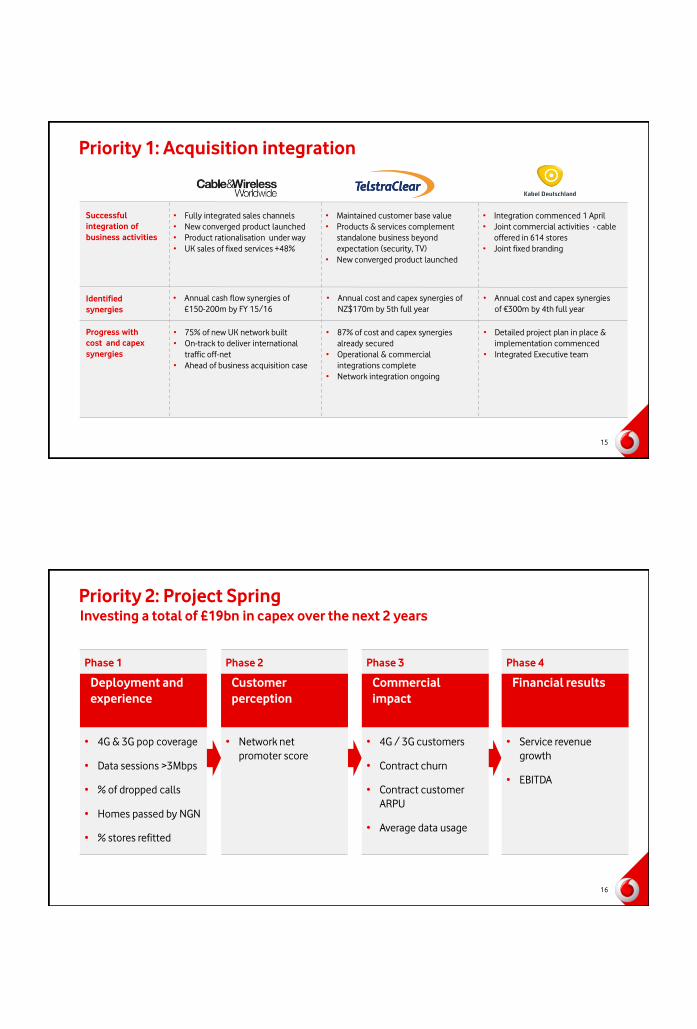
Priority 1: Acquisition integration
15
Identified
synergies
Successful
integration of
business activities
Progress with
cost and capex
synergies
• Annual cash flow synergies of
£150-200m by FY 15/16
• Annual cost and capex synergies of
NZ$170m by 5th full year
• Annual cost and capex synergies
of €300m by 4th full year
• 87% of cost and capex synergies
already secured
• Operational & commercial
integrations complete
• Network integration ongoing
• Maintained customer base value
• Products & services complement
standalone business beyond
expectation (security, TV)
• New converged product launched
• Integration commenced 1 April
• Joint commercial activities - cable
offered in 614 stores
• Joint fixed branding
• Detailed project plan in place &
implementation commenced
• Integrated Executive team
• 75% of new UK network built
• On-track to deliver international
traffic off-net
• Ahead of business acquisition case
• Fully integrated sales channels
• New converged product launched
• Product rationalisation under way
• UK sales of fixed services +48%
Priority 2: Project Spring
16
Investing a total of £19bn in capex over the next 2 years
• 4G & 3G pop coverage
• Data sessions >3Mbps
• % of dropped calls
• Homes passed by NGN
• % stores refitted
• Network net
promoter score
• 4G / 3G customers
• Contract churn
• Contract customer
ARPU
• Average data usage
• Service revenue
growth
• EBITDA
Phase 1
Deployment and
experience
Phase 2
Customer
perception
Phase 3
Commercial
impact
Phase 4
Financial results
16

Priority 3: cost savings
All growth rates shown are organic unless otherwise stated
1. Organic opex includes Europe and Common Functions, excludes restructuring costs and Project Spring
European opex1 (£bn)
6.7 6.4
FY 12/13 FY 13/14
Now in phase 3 of cost delivery programme:
17
European opex1 savings delivered – further opportunities targeted
FY 13/14 European opex
target delivered
Phase 1 – Procurement & roaming
• Central procurement now at €10.2bn
• Common ERP
• Network Operating Centres: 13 to 2
• Around 13,500 shared service centre employees
Phase 2 – Backend services
• Drive online mCare penetration
• Tariff and product rationalisation
• Common IT architecture
Phase 3 – Standardisation of frontend services
• FY 13/14 pro forma guidance1 met: AOP £4.9bn, FCF £4.8bn
• Guidance2 for FY 14/15: – EBITDA £11.4-11.9bn
– Positive free cash flow after all capex
Guidance
• Post Project Spring capital intensity reverting to 13-14% of annual revenue
• Intention to grow the dividend per share from 11.0p
18
1. Excludes VZW and includes 100% of Vodafone Italy for the whole year. This pro forma guidance included Vodafone’s remaining joint ventures (Australia, Fiji and Indus Towers), on an equity
accounting basis, consistent with IFRS requirements and excluded the impact of licence and spectrum purchases, material tax settlement related payments, restructuring costs and purchase
adjustments on the Vodafone Italy transaction. Guidance foreign exchange rates for the year ended 31 March 2014 were £1:€1.17, £1=US$1.52, £1:INR 84.9 and £1:ZAR 14.3.
2. Guidance for FY 14/15 assumes foreign exchange rates of £1:€1.21, £1:INR 105.8 and £1:ZAR 18.4 . It excludes the impact of licences and spectrum purchases, material one-off tax-related
payments, restructuring costs and any fundamental structural change to the Eurozone. It also assumes no material change to the current structure of the Group.
EBITDA movements
(£bn) 12.8
(0.6)
0.4
(0.1)
12.5
(0.5)
11.4 – 11.9
FY 13/14 reported
EBITDA
FX KDG JV accounting FY 13/14
restated
Project Spring Underlying Guidance
14/15
2
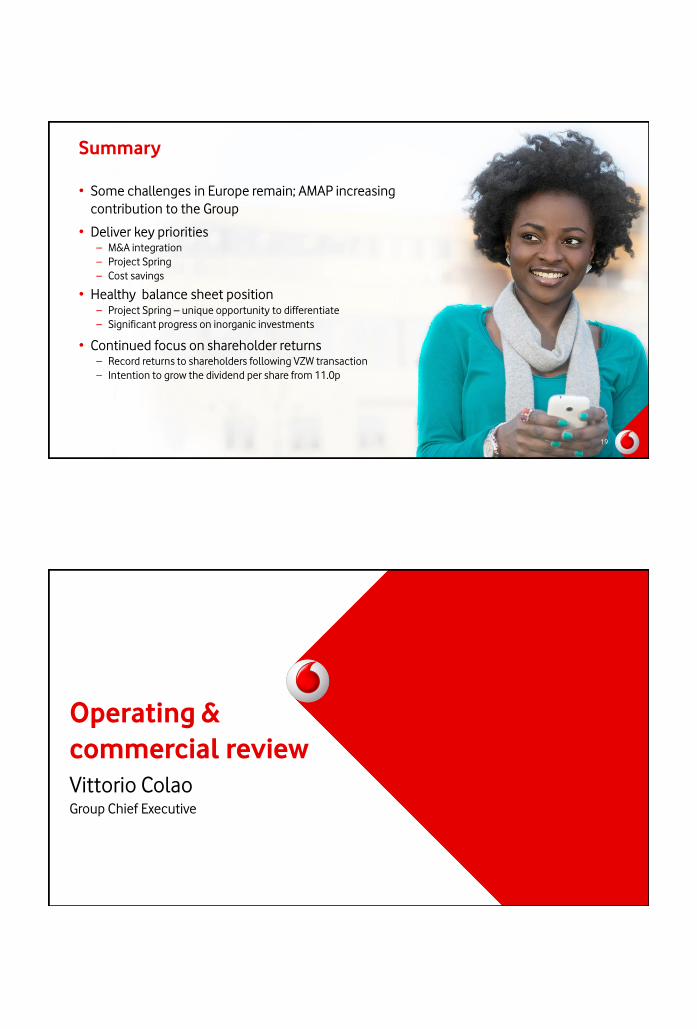
• Some challenges in Europe remain; AMAP increasing
contribution to the Group
• Deliver key priorities – M&A integration
– Project Spring
– Cost savings
• Healthy balance sheet position – Project Spring – unique opportunity to differentiate
– Significant progress on inorganic investments
• Continued focus on shareholder returns – Record returns to shareholders following VZW transaction
– Intention to grow the dividend per share from 11.0p
Summary
19
Operating &
commercial review
Vittorio Colao Group Chief Executive
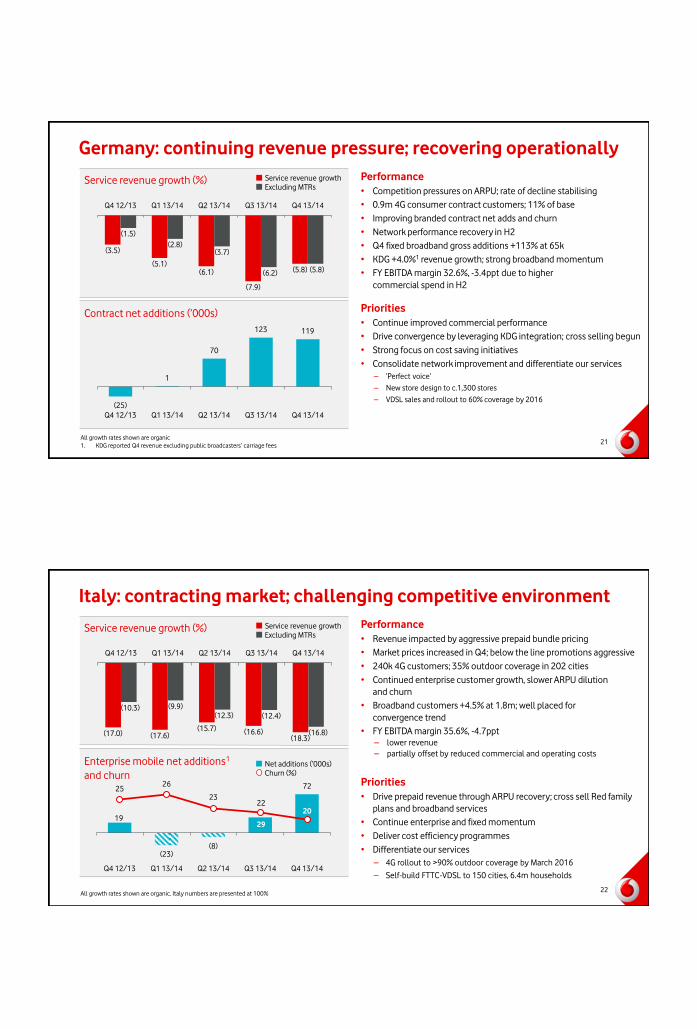
Germany: continuing revenue pressure; recovering operationally
Performance
• Competition pressures on ARPU; rate of decline stabilising
• 0.9m 4G consumer contract customers; 11% of base
• Improving branded contract net adds and churn
• Network performance recovery in H2
• Q4 fixed broadband gross additions +113% at 65k
• KDG +4.0%1 revenue growth; strong broadband momentum
• FY EBITDA margin 32.6%, -3.4ppt due to higher
commercial spend in H2
Priorities
• Continue improved commercial performance
• Drive convergence by leveraging KDG integration; cross selling begun
• Strong focus on cost saving initiatives
• Consolidate network improvement and differentiate our services
– ‘Perfect voice’
– New store design to c.1,300 stores
– VDSL sales and rollout to 60% coverage by 2016
Service revenue growth (%)
21 21
Contract net additions (’000s)
(3.5)
(5.1) (6.1)
(7.9)
(5.8)
(1.5)
(2.8) (3.7)
(6.2) (5.8)
Q4 12/13 Q1 13/14 Q2 13/14 Q3 13/14 Q4 13/14
(25)
1
70
123 119
Q4 12/13 Q1 13/14 Q2 13/14 Q3 13/14 Q4 13/14
Service revenue growth
Excluding MTRs
All growth rates shown are organic
1. KDG reported Q4 revenue excluding public broadcasters’ carriage fees
19
(23) (8)
29
72 25 26
23 22
20
Q4 12/13 Q1 13/14 Q2 13/14 Q3 13/14 Q4 13/14
Italy: contracting market; challenging competitive environment
Performance
• Revenue impacted by aggressive prepaid bundle pricing
• Market prices increased in Q4; below the line promotions aggressive
• 240k 4G customers; 35% outdoor coverage in 202 cities
• Continued enterprise customer growth, slower ARPU dilution
and churn
• Broadband customers +4.5% at 1.8m; well placed for
convergence trend
• FY EBITDA margin 35.6%, -4.7ppt
– lower revenue
– partially offset by reduced commercial and operating costs
Priorities
• Drive prepaid revenue through ARPU recovery; cross sell Red family
plans and broadband services
• Continue enterprise and fixed momentum
• Deliver cost efficiency programmes
• Differentiate our services
– 4G rollout to >90% outdoor coverage by March 2016
– Self-build FTTC-VDSL to 150 cities, 6.4m households
Service revenue growth (%)
22 22
Enterprise mobile net additions1
and churn
(17.0) (17.6) (15.7) (16.6)
(18.3)
(10.3) (9.9)
(12.3) (12.4)
(16.8)
Q4 12/13 Q1 13/14 Q2 13/14 Q3 13/14 Q4 13/14
All growth rates shown are organic. Italy numbers are presented at 100%
Service revenue growth
Excluding MTRs
Net additions (‘000s)
Churn (%)

India: double digit growth, supported by strong data demand
Performance
• 6.2m customer net additions, effective price per minute up YoY
• Data: 10% of service revenues; 7m 3G customers, accelerated
3G roll-out
• 3G roaming permitted; consistent service for customers
• Key spectrum acquired to support our data strategy
• FY EBITDA margin 31.8%, +3.1ppt
Priorities
• Accelerate 3G roll-out and extend 2G coverage
• Roll out small cells and high capacity fibre backhaul to base
stations
• Competitive enterprise reach and fibre to enterprise
• Optimise effective rate per minute
• Differentiate our services with M-Pesa
Service revenue growth (%)
23 23
7.8
13.8 13.2 13.2 11.9
Q4 12/13 Q1 13/14 Q2 13/14 Q3 13/14 Q4 13/14
All growth rates shown are organic, includes Indus Towers
Data traffic (Petabytes)
Q4 12/13 Q1 13/14 Q2 13/14 Q3 13/14 Q4 13/14
2G 3G
14
33
2.4x
Vodacom: successful pricing strategy in South Africa
Performance
South Africa
• Customer base +4.6% to 39.4m; Q4 net additions +1.3m
• Prepaid ARPU maintained despite falling price per minute
• Data revenue +21.5% with 22% smartphone penetration
• In-bundle service revenue 38% of service revenue
• c.1,000 4G sites, covering 20% of the population1
• Vodacom FY EBITDA margin flat at 38.3%
International
• Service revenue +15.2% driven by +22% customer growth
• M-Pesa: launched in all markets with 4.4m active customers; 19% of
Tanzania FY service revenue +5ppt
Priorities
South Africa
• Maintain leadership in data; extend 3G & 4G coverage
• High speed backhaul; fibre to the base station
• Enterprise fibre; integrate Neotel
International
• Continue to grow M-Pesa customer base
• Accelerate 2G & 3G site roll out
Service revenue growth (%)
24 24
(0.7)
3.2
4.6
3.5
5.1
(2.0)
(0.1)
0.2 0.6 0.7
Q4 12/13 Q1 13/14 Q2 13/14 Q3 13/14 Q4 13/14
Vodacom Group
South Africa
All growth rates shown are organic
1. 128kbps outdoor coverage
88.6
105.0
127.4 129.5 134.0
57.96 56.43 58.12 62.47 55.48
0.70 0.64
0.54 0.56 0.49
Q4 12/13 Q1 13/14 Q2 13/14 Q3 13/14 Q4 13/14
Minutes of use
ARPU (ZAR)
Revenue per minute (ZAR)
South Africa prepaid trends

75 91
132
191
148
Q4 12/13 Q1 13/14 Q2 13/14 Q3 13/14 Q4 13/14
UK: steady recovery; consumer contract service revenue growth
Performance
• 637k 4G customers1, 48% activation of sport and music offer
• Growing contract base; +5% to 11.7m customers
• Contract churn improved 0.4ppt
• CWW cash flow on track; growing fixed pipeline in Enterprise
• Network KPIs improved significantly; 4G coverage accelerated
• FY EBITDA margin 22.1%, -1.4ppt due to increased commercial
investment and CWW dilution
Priorities
• Ramp-up of integrated enterprise sales team; grow fixed revenue
• Differentiate our services
– Best network, complete London investment
– 99% 4G outdoor pop coverage by March 2016
– Strengthen branded distribution; 150 new stores
– Best customer experience with investment in CRM systems
and online sales support
• Further cost savings through continued CWW integration
and network JV
Service revenue growth (%)
25 25
Contract net additions (’000s)
(6.6)
(4.5) (4.3) (5.1)
(3.6) (3.5)
(2.5) (2.5) (3.3)
(1.6)
Q4 12/13 Q1 13/14 Q2 13/14 Q3 13/14 Q4 13/14
Service revenue growth
Excluding MTRs
All growth rates shown are organic
1. 4G enabled plans
Spain: trending positively; growing in broadband
Service revenue growth (%)
26 26
Fixed line net additions (’000s)
(12.7) (10.6)
(16.1) (14.1)
(12.6) (11.0)
(9.4)
(12.0) (10.0)
(8.4)
Q4 12/13 Q1 13/14 Q2 13/14 Q3 13/14 Q4 13/14
38 43 43
57
73
Q4 12/13 Q1 13/14 Q2 13/14 Q3 13/14 Q4 13/14
All growth rates shown are organic
Performance
• Improvement in underlying revenue trend
• 4G outdoor coverage 48% nationwide; 797k customers
• Fixed service revenue +6.0%; reached 1m customers
• Red driving contract churn improvement of 5.1ppt
• Positive enterprise net additions in Q4
• Fibre product launched April; c.400k homes passed
• FY EBITDA margin 22.4%, -3.7ppt
Priorities
• Continue to market converged offers including fibre
• Differentiate our services
– Accelerate 4G coverage to leadership position
– Redesign 1,000 retail stores
• Continued co-build fibre deployment
• Integration of Ono
Service revenue growth
Excluding MTRs

27
Where we aim to be five years from now
• Converged in all our key markets
• Leader in mobile
Europe consumer Emerging markets
consumer Enterprise
• Strong leader
• First choice for data
• Major international player with
full service offering
Project Spring: turbo-charging differentiation
• Best mobile voice and data
(coverage and quality) –
4G/HSPA+
• Competitive in fixed and best
converged experience
Always best
connected
Unmatched customer
experience
Integrated worry-free
solutions
Cost efficient
organisation
• Number one in customer
experience – in store, online,
on the phone
• Consistent execution
across markets
• Simplest connectivity and
price plans
• Converged Enterprise
product suite
• Innovator in M2M, IP Comms,
mCommerce
• Operating with efficient
and effective processes
and systems
1. Q4 on a like for like basis was 50% up QoQ and includes South Africa and Australia in Q3 13/14
2. Consumer average, cohort data, March 2014. UK 3G to 4G handset upgrade.
Strong demand for 4G
4G base doubled QoQ1 (m)
2.0
4.7 5.4
10.5
Q3 13/14 Q4 13/14
4G customers
4G devices
Increased app usage (ppt uplift from 3G to 4G)
+11 +10 +10
+9 +8
+6
Travel
apps
Cloud
storage
Mobile
payments
Weather
apps
Calls over
internet
Streaming
audio
Significant uplift in data usage2 (MB)
801
1,812
3G 4G
2.3x 512
917
3G 4G
1.8x
Top 5 apps on 4G
• Internet
• Download apps
• Social media
• Online shopping
28

15
42
39
4
3G
63
25
12
4G
4G and content drive uplift in usage and ARPU
UK bundling strategy increases data usage (Data usage)
Not yet activated Sky Spotify
Healthy 4G ARPUs1
£29 £34
3G 4G
£34 £38
3G 4G
2.0x
2.2x
2.3x
+18% +12%
UK customers trade up to higher data plans (Customer migration from 3G to 4G in Jan 14)
33
23
40
14
0-500MB 500MB - 1GB 0-500MB 500MB - 1GB
29
1. UK includes content blend across base average, cohort data March 2014
2. Customers on both 4G and 3G plans
8GB
4GB
2GB
1GB
0-500MB
3G
4G
Customers increasingly exceeding data bundles (% customers)2
% %
12 million Vodafone Red customers
Improving customer loyalty
Protecting revenue (In-bundle mobile service revenue %)
Q4 12/13 Q4 13/14
30
Non-Red Red Non Red Red
6ppt to 11ppt +9ppts
Early churn improvement
(%)
Net promoter score
66
40
54 61
55
70
53 56 68
61
DE IT UK ES Europe
Driving more connections
per account (%)
Red Family Red Multi-device
5 6
27
10 11 7
11
33
DE UK ES IT
430
800
Before Red After Red
x2
Monthly average data usage
per user (MB)
Unlocking worry-free usage
280
315
Before Red After Red
+11%
Monthly average voice per
user (MoU)
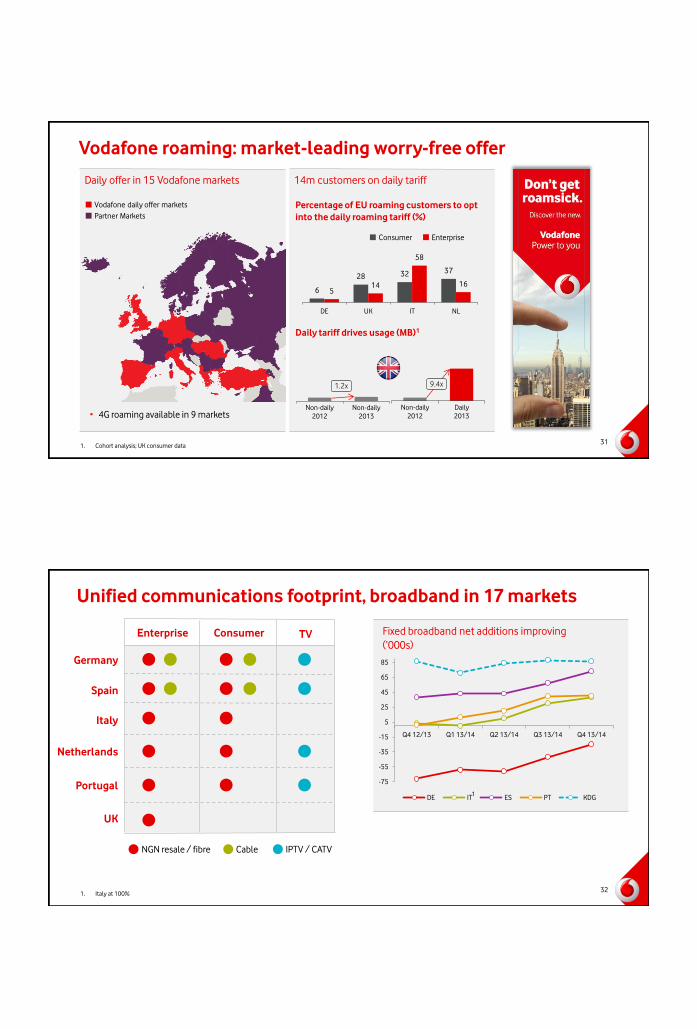
Vodafone roaming: market-leading worry-free offer
Daily offer in 15 Vodafone markets
31
1. Cohort analysis; UK consumer data
• 4G roaming available in 9 markets
14m customers on daily tariff
Percentage of EU roaming customers to opt
into the daily roaming tariff (%)
6
28 32 37
5 14
58
16
DE UK IT NL
Consumer Enterprise
Vodafone daily offer markets
Partner Markets
Daily tariff drives usage (MB)1
Non-daily
2012
Non-daily
2013
Non-daily
2012
Daily
2013
9.4x 1.2x
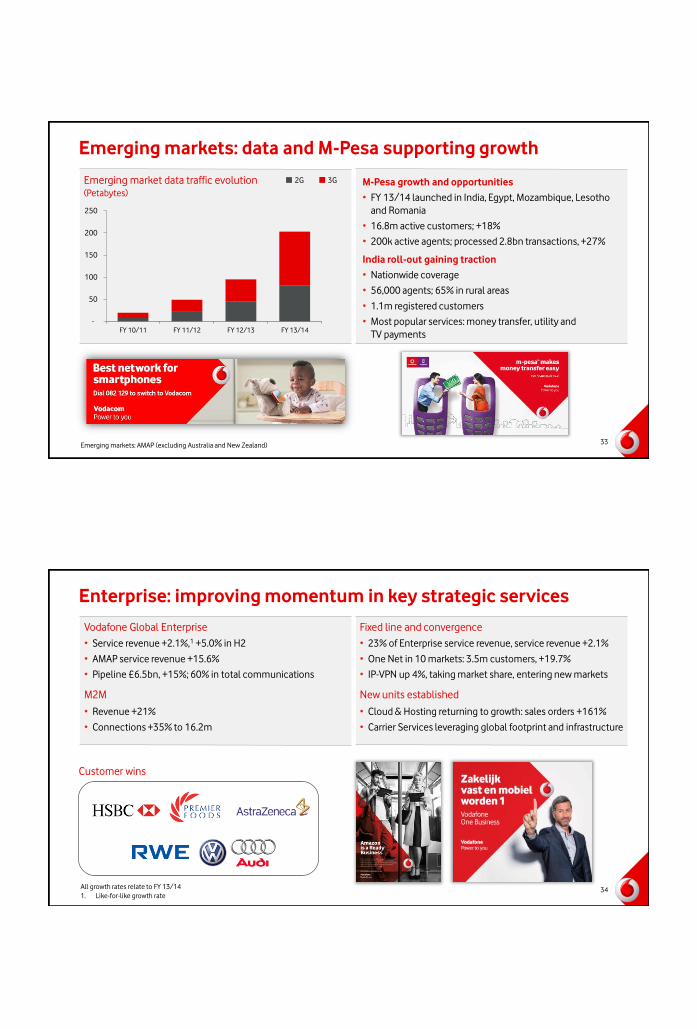
Unified communications footprint, broadband in 17 markets
32
Enterprise Consumer TV
NGN resale / fibre IPTV / CATV
1. Italy at 100%
Germany
Spain
Italy
Netherlands
Portugal
UK
Cable
-75
-55
-35
-15
5
25
45
65
85
Q4 12/13 Q1 13/14 Q2 13/14 Q3 13/14 Q4 13/14
DE IT ES PT KDG1
Fixed broadband net additions improving
(‘000s)
M-Pesa growth and opportunities
• FY 13/14 launched in India, Egypt, Mozambique, Lesotho
and Romania
• 16.8m active customers; +18%
• 200k active agents; processed 2.8bn transactions, +27%
India roll-out gaining traction
• Nationwide coverage
• 56,000 agents; 65% in rural areas
• 1.1m registered customers
• Most popular services: money transfer, utility and
TV payments
Emerging markets: data and M-Pesa supporting growth
33 Emerging markets: AMAP (excluding Australia and New Zealand)
Emerging market data traffic evolution (Petabytes)
-
50
100
150
200
250
FY 10/11 FY 11/12 FY 12/13 FY 13/14
2G 3G
Enterprise: improving momentum in key strategic services
Vodafone Global Enterprise Fixed line and convergence
34
• Service revenue +2.1%,1 +5.0% in H2
• AMAP service revenue +15.6%
• Pipeline £6.5bn, +15%; 60% in total communications
• 23% of Enterprise service revenue, service revenue +2.1%
• One Net in 10 markets: 3.5m customers, +19.7%
• IP-VPN up 4%, taking market share, entering new markets
M2M New units established
• Revenue +21%
• Connections +35% to 16.2m
• Cloud & Hosting returning to growth: sales orders +161%
• Carrier Services leveraging global footprint and infrastructure
Customer wins
All growth rates relate to FY 13/14
1. Like-for-like growth rate

Project Spring to improve network capability and experience
35
76
77
78
85
DE
UK
IT
ES
March 2016 >90%
March 2014
Improving customer experience (Data sessions >3Mbps downlink %)
Build achievements since Sep 2013
New 2G sites
for ‘perfect voice’
New 3G sites
competitive 3G
New 4G sites
grow outdoor coverage
7,000
13,000
7,000
47,000
73,000
77,000
New single RAN installations
radio modernisation
New high capacity backhaul sites
for improved data experience
20,000
17,000
106,000
87,000
To March 2014 By March 2016
March 2014 March 2016 >91%
68
35
35
48
DE
UK
IT
ES
4G coverage accelerated through Spring (4G >1Mbps outdoor coverage %)
• Over £80bn returned to shareholders over last 4 years
• Dividend per share +8% in FY 13/14 to 11p total dividend; +33% since 2010
• Intention to grow dividends per share annually, improved cover post Spring
Shareholder returns remain a priority
1. Return of value calculated at £1 = $1.6714
Returns to shareholders (£bn)
Special dividend
Share buybacks
Ordinary dividends
4.5 4.6 4.8 5.1
2.1 3.6 1.6 1.0
2.0
51.0
FY 10/11 FY 11/12 FY 12/13 FY 13/14
10.2
6.4 6.6
57.1
36
Return of value1

Summary: Vodafone transformation in progress
37
FY 13/14
• Macroeconomic, regulatory and competitive
headwinds in Europe
• Some underperformance, already being addressed
• Strong growth in emerging markets
• Significant unified communications progress
• Met pro forma full year guidance
Priorities FY 14/15
• Better network and customer experience
• Integration of KDG and completion of Ono
• Progress in unified communications and enterprise
• Sustained data leadership in emerging markets
• Support more favourable regulatory environment
• Significant focus on Project Spring returns
Mobile
Unified Communications
Europe
Europe & Emerging Markets
Consumer
Consumer & Enterprise
Metered voice
Data & innovation in service
Q&A
38

39
Appendices
40
Reconciliation: management to statutory results
40
FY 13/14
management VZW Italy Indus Australia Other
FY 13/14
statutory
Group
revenue 43,616 - (3,790) (450) (1,016) (14) 38,346
EBITDA 12,831 - (1,354) (262) (261) 130 11,084
D&A (8,181) - 699 213 207 (36) (7,098)
Associates 3,224 (3,169) 402 21 (62) (92) 324
AOP 7,874 (3,169) (253) (28) (116) 2 4,310
Capex 7,102 - (427) (81) (256) (25) 6,313
Free cash
flow
4,405 - (641) (13) 166 266 4,183

41
Adjusted earnings per share
FY 13/14 (£m) FY 12/13 (£m)
Profit attributable to equity shareholders 59,254 413
Deferred tax (19,318) -
Other tax adjustments1 1,807 (150)
Removal of VZW results and tax after 2 Sept 1,019 (2,669)
Impairment charges 6,600 7,700
Other income and expense2 1,249 (144)
Customer & brand amortisation 551 249
Discontinued and other items (46,520) -
Net profit for underlying EPS 4,642 5,399
Average share count 26,472 26,831
Underlying adjusted earnings per share (p) 17.54 20.12 -12.8%
1. Other tax adjustments includes £2,210m of tax liability relating to rationalisation and reorganisation of non US assets prior to VZW disposal.
2. Other income and expenses primarily relates to restructuring costs of £355 million (£311 million in FY12/13); £712 million loss on deemed disposal of Italy in FY 13/14; and
£473 million gain on CWW acquisition in FY 12/13. 41
Project Spring KPIs
42
Deployment and experience Q1
14/15
Q2
14/15
Q3
14/15
Q4
14/15
4G % outdoor population coverage
% of data sessions (> 3 Mbps)
% of dropped calls
% homes reached by NGN
% of stores refitted
Europe
Commercial impact
4G customers
Contract churn
Contract customer ARPU
Average data usage
Customer perception
Network NPS
Financials
Service revenue growth
Deployment and experience Q1
14/15
Q2
14/15
Q3
14/15
Q4
14/15
3G % outdoor population coverage
% of data sessions (> 1 Mbps)
% of dropped calls
% of stores refitted
AMAP
Commercial impact
3G/4G customers
Blended customer ARPU
Average data usage
Customer perception
Network NPS
Financials
Service revenue growth

FY 12/13 FY 13/14 FY 14/15e
£bn % £bn % %
Europe
Service revenue (0.66) (2.5) (0.67) (2.6) (0.8)
EBITDA (0.15) (0.10)
AMAP
Service revenue (0.19) (1.5) (0.21) (1.7) (1.2)
EBITDA (0.07) (0.06)
Group
Service revenue (0.85) (2.1) (0.88) (2.3) (1.3)
EBITDA (0.22) (0.16)
MTR impact
43
More information
www.vodafone.com/investor
Upcoming dates
@VodafoneIR
Download
our iPad app
Follow us
on Twitter
+44 (0) 7919 990 230
Contact us
Visit our website for more information
AGM
29 July
For definitions of terms please see www.vodafone.com/content/index/investors/glossary
Q1 IMS
25 July
44
Interim results
11 November

Forward-looking statements This presentation contains “forward-looking statements” within the meaning of the US Private Securities Litigation Reform Act of 1995 with respect to the Group’s financial condition, results of operations and businesses and
certain of the Group’s plans and objectives. In particular, such forward-looking statements include: statements relating to the Group’s future performance generally, including guidance for the 2015 financial year; expectations
regarding growth in customers and usage, especially in emerging markets and mobile data, and technological advancements generally; statements relating to the impact of MTRs and spectrum spend; statements in relation to
the launch of new products and service offerings; statements and expectations in relation to the acquisition of CWW, Kabel Deutschland and Ono, and in relation to Project Spring, as well as existing and proposed network sharing
initiatives, and the anticipated benefits associated therewith; statements in relation to the US transaction; statements and assumptions relating to movements in foreign exchange rates; and expectations regarding adjusted
operating profit, service revenue growth, average cost of debt, anticipated cost reductions, EBITDA, EBITDA margin, free cash flow, costs and dividends, tax settlements, especially in India, and capital expenditures.
Forward-looking statements are sometimes, but not always, identified by their use of a date in the future or such words as “will”, “anticipates”, “aims”, “could”, “may”, “should”, “expects”, “believes”, “intends”, “plans” or “targets”.
By their nature, forward-looking statements are inherently predictive, speculative and involve risk and uncertainty because they relate to events and depend on circumstances that may occur in the future. There are a number of
factors that could cause actual results and developments to differ materially from those expressed or implied by these forward-looking statements. These factors include, but are not limited to, the following: changes in
macroeconomic or political conditions in markets served by operations of the Group that would adversely affect the level of demand for mobile services, and changes to the associated legal, regulatory and tax environments;
greater than anticipated competitive activity, from both existing competitors and new market entrants, which could require changes to the Group’s pricing models, lead to customer churn and/or make it more difficult to acquire
new customers; levels of investment in network capacity and the Group’s ability to deploy new technologies, products and services in a timely manner, particularly mobile data content and services, or the rapid obsolescence of
existing technology; higher than expected costs or capital expenditures; rapid changes to existing products and services and the inability of new products and services to perform in accordance with expectations, including as a
result of third party or vendor marketing efforts; the ability of the Group to integrate new technologies, products and services with existing networks, technologies, products and services; the Group’s ability to generate and grow
revenue from both voice and non-voice services and achieve expected cost savings; a lower than expected impact of new or existing products, services or technologies on the Group’s future revenue, cost structure and capital
expenditure outlays; slower than expected customer growth, reduced customer retention, reductions or changes in customer spending and increased pricing pressure; the Group’s ability to expand its spectrum position, win
4G/3G allocations and realise expected synergies and benefits associated with 4G/3G; the Group’s ability to secure the timely delivery of high quality, reliable handsets, network equipment and other key products from
suppliers; loss of suppliers, disruption of supply chains and greater than anticipated prices of new mobile handsets; changes in the costs to the Group of, or the rates the Group may charge for, terminations and roaming minutes;
the Group’s ability to realise expected benefits from acquisitions, partnerships, joint ventures, franchises, brand licences or other arrangements with third parties, particularly those related to the development of data and internet
services; acquisitions and divestments of Group businesses and assets and the pursuit of new, unexpected strategic opportunities, which may have a negative impact on the Group’s financial condition and results of operations;
the Group’s ability to integrate acquired business or assets and the imposition of any unfavourable conditions, regulatory or otherwise, on any pending or future acquisitions or dispositions; the extent of any future write-downs
or impairment charges on the Group’s assets, or restructuring charges incurred as a result of an acquisition or disposition; developments in the Group’s financial condition, earnings and distributable funds and other factors that
the Group’s Board of Directors takes into account in determining the level of dividends; the Group’s ability to satisfy working capital requirements through borrowing in the capital markets, bank facilities and operations; changes
in foreign exchange rates, including, particularly, the exchange rate of pounds sterling to the euro and the US dollar; changes in the regulatory framework in which the Group operates, including the commencement of legal or
regulatory action seeking to regulate the Group’s permitted charging rates; the impact of legal or other proceedings against the Group or other companies in the mobile communications industry; and changes in statutory tax
rates and profit mix, the Group’s ability to resolve open tax issues and the timing and amount of any payments in respect of tax liabilities.
Furthermore, a review of the reasons why actual results and developments may differ materially from the expectations disclosed or implied within forward-looking statements can be found by referring to the information
contained under the heading “Forward-looking statements” in the Group’s half-year financial report for the six months ended 30 September 2013 and under the headings “Forward-looking statements” and "Principal risk factors
and uncertainties" in Vodafone Group Plc's annual report for the year ended 31 March 2013. The half-year financial report and the annual report can be found on the Group’s website (www.vodafone.com/investor). All
subsequent written or oral forward-looking statements attributable to the Company or any member of the Group or any persons acting on their behalf are expressly qualified in their entirety by the factors referred to above. No
assurances can be given that the forward-looking statements in this presentation will be realised. Except as otherwise stated herein and as may be required to comply with applicable law and regulations, Vodafone does not
intend to update these forward-looking statements and does not undertake any obligation to do so.
45