
Vocational Training in Assessment of Buenos días Existing ...
94
22.6.2012 1 Vocational Training in Assessment of Existing Structures Agreement number: CZ/11/LLP- LdV/TOI/134005 1 1 Vocational Training in Assessment of Existing Structures Agreement number: CZ/11/LLP-LdV/TOI/134005 Milan Holický Czech Technical University in Prague Buenos días 2 The first meeting in Prague, 26.10.2011 P1: KI, Applicant co-ordinator, Milan Holicky P2: SPSS, Associated p., Roman Gottfried P3: HR, Core partner, Dimitris Diamantidis P4: IET, Core partner, Angel Arteaga P5: UOP, Core partner, Pietro Groce P6: TNO, Associated p., Ton Vrouwenvelder P7: PAU, Core partner, Selcuk Toprak
Transcript of Vocational Training in Assessment of Buenos días Existing ...

22.6.2012
1
Vocational Training in Assessment of Existing Structures
Agreement number: CZ/11/LLP-LdV/TOI/134005
1 1
Vocational Training in Assessment of
Existing Structures Agreement number: CZ/11/LLP-LdV/TOI/134005
Milan Holický
Czech Technical University in Prague
Buenos días
2
The first meeting in Prague, 26.10.2011
P1: KI, Applicant co-ordinator, Milan Holicky
P2: SPSS, Associated p., Roman Gottfried
P3: HR, Core partner, Dimitris Diamantidis
P4: IET, Core partner, Angel Arteaga
P5: UOP, Core partner, Pietro Groce
P6: TNO, Associated p., Ton Vrouwenvelder
P7: PAU, Core partner, Selcuk Toprak
22.6.2012
2
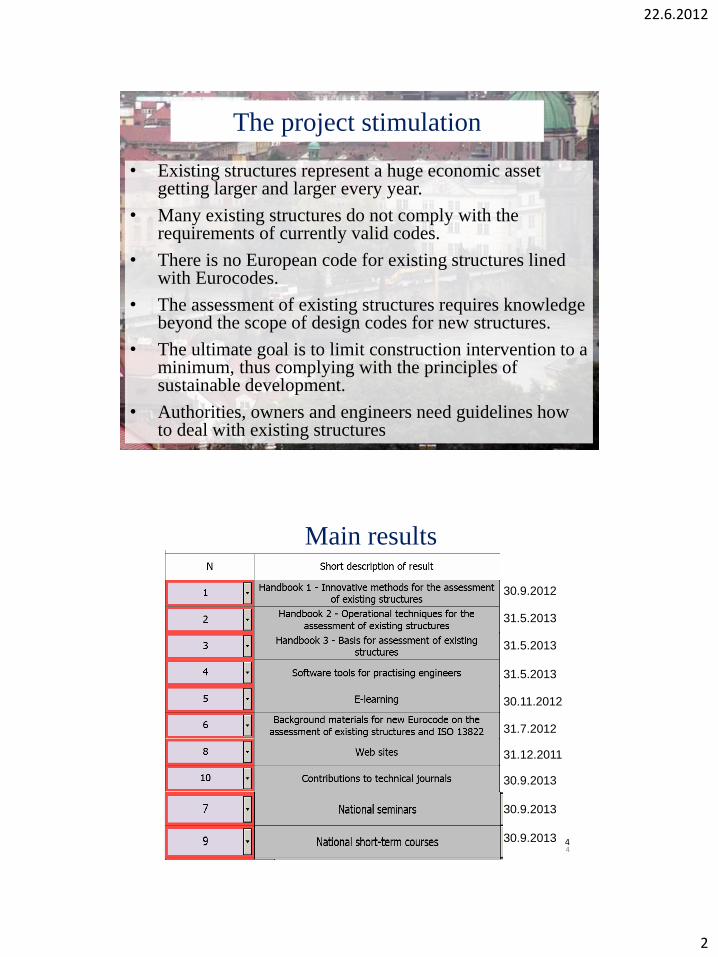
The project stimulation
• Existing structures represent a huge economic asset getting larger and larger every year.
• Many existing structures do not comply with the requirements of currently valid codes.
• There is no European code for existing structures lined with Eurocodes.
• The assessment of existing structures requires knowledge beyond the scope of design codes for new structures.
• The ultimate goal is to limit construction intervention to a minimum, thus complying with the principles of sustainable development.
• Authorities, owners and engineers need guidelines how to deal with existing structures
4 4
Main results
30.9.2012
31.5.2013
31.5.2013
31.5.2013
30.11.2012
31.7.2012 31.12.2011 30.9.2013
30.9.2013
30.9.2013

22.6.2012
3
The third meeting in Barcelona
14 to 16 June 2012
Thank you for your attention – Gracias
Why existing structures?
Assessment of an existing structure in many aspects differs from
designing a new structure, the main differences include:
– effects of the construction process and subsequent life,
– alteration, deterioration, misuse, and other changes,
– economic and social aspects.
Two main principles of assessment are usually accepted:
1. Actual characteristics of structural materials, actions,
geometric data and structural behaviour should be
considered.
2. The original design documentation should be used as
guidance documents only and currently valid codes for
verification of structural reliability should be considered.

22.6.2012
4
7 7
Meetings - kick-off meeting, Prague, 26.,27.10.2011
- plenary meeting in Pisa, 8.,9.3.2012
- plenary meeting in Barcelona, 14.15.5. 2012
- plenary meeting in Regensburg, 11.12.10.2012
- plenary meeting in Pisa, 04/2013
- plenary meeting in Denizli, Istambul, Izmir, 06/2013
- final plenary meeting in Prague, 09/2013
Additional meetings between P1, and relevant partners
will be planned depending on work progress.
Bilateral meetings (for example between P1 and P2) or
other upon need.
8 8
Vocational Training in Assessment of
Existing Structures Agreement number: CZ/11/LLP-LdV/TOI/134005
The second meeting in Pisa on 8. and 9.3.2012

22.6.2012
5
The Fourth meeting in Regensburg
11 to 12 October 2012

1
Codes and Recommendations
Project number: CZ/08/LLP-LdV/TOI/134005
Seminar: Assessment of existing structures
Codes and RecommendationsDimitris Diamantidis
Regensburg University of Applied Sciences
• Need and criteria for codes and recommendationsE l d
Barcelona June 14, 20121
• Example codes• Example contents• Safety acceptance – performance criteria• Future tendencies
Structural failures experience
2
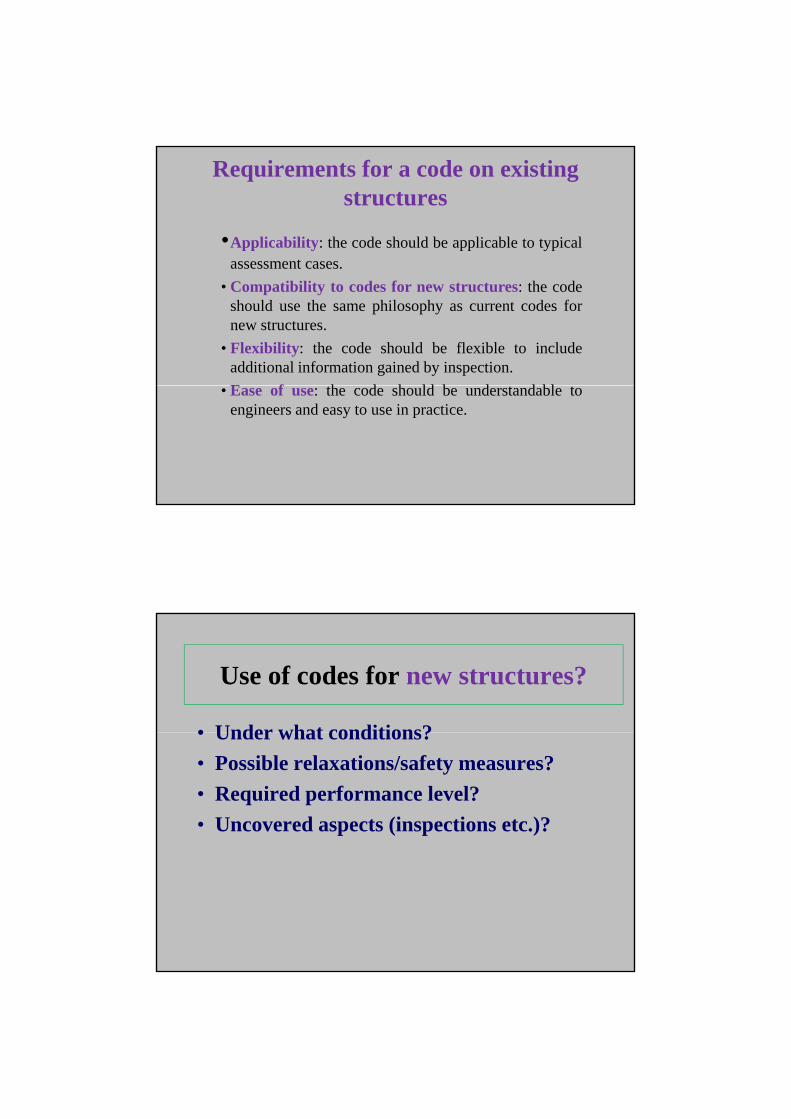
Requirements for a code on existing structures
•Applicability: the code should be applicable to typicalassessment casesassessment cases.
• Compatibility to codes for new structures: the codeshould use the same philosophy as current codes fornew structures.
• Flexibility: the code should be flexible to includeadditional information gained by inspection.
E f h d h ld b d d bl• Ease of use: the code should be understandable toengineers and easy to use in practice.
Use of codes for new structures?
• Under what conditions?• Under what conditions?
• Possible relaxations/safety measures?
• Required performance level?
• Uncovered aspects (inspections etc.)?

3
Regulatory tools for existing structures
• What topics are covered?• What topics are covered?
• What type of buildings are dealt with?
• Under which circumstances?
• Used methodologies (prescriptive or risk based)based)
• Specified performance level
Example: Building Code
• 1997 UBC: 2 pages• 1997 UBC: 2 pages
• 2000 IBC: 14 pages
• 2003 International Existing
Building Code:
67 pages +214 pages Anne es67 pages +214 pages Annexes
• 2012 new version 290 pages

4
Why reassess an existing structure?
• Deviations from original design• Deviations from original design
• Doubts about safety
• Adverse inspection results
• Change of use
Lifetime prolongation• Lifetime prolongation
• Inadequate serviceability
Typical questions
• What type of inspections are necessary?
• What type of measurements shall betaken?
• What analyses shall be performed?
• What is the future
risk in using
the structure?

5
How to find the Answers
• No classical code approach• No classical code approach
• New information becomes available
• New techniques can be implemented
• New material technologies can be used
Ne decision criteria nder ne• New decision criteria under new uncertainties
Prenormative and regulatory tools
• ISO 13822 2003• ISO 13822, 2003
• ICC Existing Buildings Code, 2009
• SIA 462 (Switzerland), 1994
• Danish Technical Research Council
• ASCE Seismic Evaluation, 2003
• ACI 437R -03, 2003
• JCSS Recommendations, 2001

6
ISO 13822
• General Framework of AssessmentGe e a a ewo o ssess e t• Data for assessment• Structural Analysis• Verification (Limit State)• Assessment based on satisfactory past performance• Interventions• Report• Report• Judgement and Decisions
New Information (Updating)
A) Proof Load
B) Variables (concrete ) (strength)
7
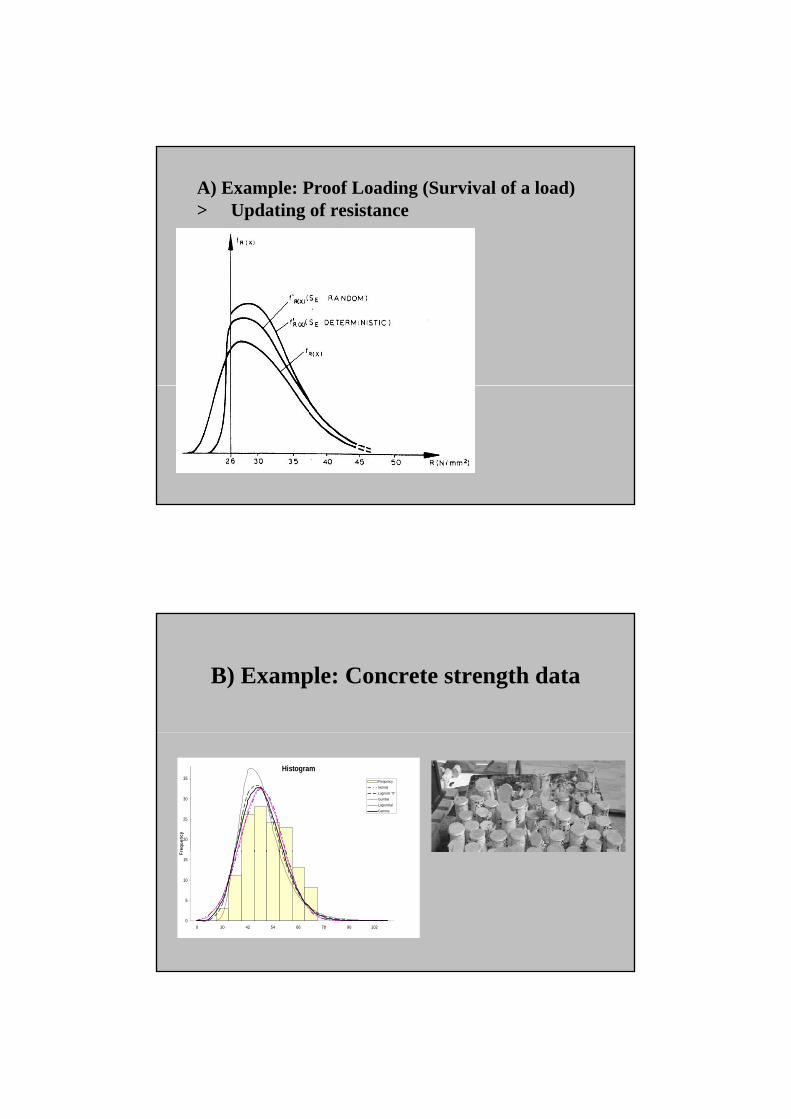
A) Example: Proof Loading (Survival of a load)> Updating of resistance
B) Example: Concrete strength data
Histogram
20
25
30
35
req
uen
cy
Frequency
Normal
Lognorm "0"
Gumbel
Lognormal
Gamma
0
5
10
15
0 30 42 54 66 78 90 102
F

8
JCSS Recommendations forExisting Structures
• Preface• Preface
• Part 1: General (Guidelines, Codification)
• Part 2: Reliability Updating
• Part 3: Acceptability Criteria
Part 4: E amples and case st dies• Part 4: Examples and case studies
• Annex:Reliability Analysis Principles
Safety Acceptance Criteria
European Experience (limit state- European Experience (limit state verification)
- New practice in the US (performance based design)
- Optimisation based on LQIOp Q
- Judgement

9
Methodology
a) Prescriptive rulesa) Prescriptive rules
(limit state verification by use of safety factors)
b) Performance based designg
(global check of structure)
PBD criteria
<pE . pNP|E < pA
pE :propability of event
pNP|E:conditional probability of no |performance given event
pA :acceptable probability

10
PBD criteria (new structure)
<pE . pNP|E < pA
pE : 2% in 50 years
pNP|E: 10%|
pA : 4x10⁻⁵ per year
PBD criteria (old structure)
<pE . pNP|E < pA
pE :4% in 50 years
pNP|E:25%|
pA :2x10⁻⁴ per year (5 times larger)

11
Conclusions regarding risk acceptance
• A lower safety level compared to a new• A lower safety level compared to a new structure is acceptable
• Various criteria have been proposed
• Acceptance criteria depend on cost of safety, consequences of failure, desired residual lifetimelifetime
• An increase of acceptable pF by a factor of 2 to 10 is recommended
Concluding remarks:1. Available codes: General, material, structures dependent2. Covered topics: inspection, maintenance, repair3. Implemented methods: Structural, reliability, collapse analysis
22.6.2012
1
Basic concepts of assessment of existing structures
Milan Holický
Klokner Institute, Czech Technical University in Prague
Background materials ISO, EN, JCSS
1. ISO 2394 General principles on reliability for structures, 1998
2. ISO 13822 Assessment of existing structures, 2008
3. ISO 13823 Design for durability, working draft
4. ISO 13824 Risk Assessment, working draft
5. ISO 12491 Statistical methods, 1997
6. EN 1990 Basis of structural design, 2002
7. EN 13791 Assessment of in-situ compressive strength in structures and precast concrete components, 2007
7. JCSS- RILEM Probabilistic Assessment of Existing Structures, 2001
8. JCSS Probabilistic Model Code, working draft
9. JCSS new activities on risk assessment a robustness, working drafts
10. FIP model code, 2007

22.6.2012
2
When assessment of existing structures ?
- rehabilitation of an existing facility when new structural members are added to the existing load-carrying system;
- adequacy checking in order to establish whether the existing structure can resist loads associated with the anticipated change in use of the facility;
- repair of a structure deteriorated due to time dependent environmental effects or which has suffered damage from accidental actions, for example, impact;
- doubts concerning actual reliability of the structure.
General aspects
The following aspects seems to be the most significant:
- effect of construction, alterations, misuse;
- past performance, damage, deterioration, maintenance;
- actual actions, geometry and material property;
- reliability differentiation (consequences, cost of
safety measures, societal, political and culture aspects).
Assessment is in many aspects different from designing a new structure
ISO 13822

22.6.2012
3
Two main principles
• Actual characteristics of structural material, action (permanent load), geometric data and structural behaviour should be considered.
• Currently valid codes should be considered (models for actions and resistances), codes valid in the period when the structure was designed, should be used as guidance documents.
Main steps of assessment
Assessment is an iterative process consisting of:
• specification of the assessment objectives;
• scenarios related to structural conditions and actions;
• preliminary assessment including recommendations;
• detailed assessment including reliability verification;
• report including proposal for intervention;
• repetition of the sequence if necessary.

22.6.2012
4
Adopted from ISO 13822
General flowof assessment

22.6.2012
5
Target reliabilities indicated in ISO 13822
Target β for the reference period 50 years
1
1,5
2
2,5
3
3,5
4
4,5
1 2 3 4Consequences
Be
ta
EN 1990
JCSS PMC
ISO 2394
small some moderate great
3,8
and “moderate” (ISO) or “normal” (JCSS) relative costs of safety measures
10

22.6.2012
6
The optimum βopt and target in ISO β
ISO, β= 4,3, Table 2
ISO, β = 3,1, Table 2
ISO, β = 1,5, Table 2
βopt
q= 0,01 0,03 0,05
Cf/C1 1 10 100 1 .103 1 .104 1 .105 1 .106
1
2
3
4
5
6
JCSS, β = 4,7, Table 3
11
Probability and data updating
fX(x), fX(x|I)
X
prior distribution fX(x)
updated distribution fX(x|I)
updated xdprior xd
fX(x|I) = C P(I|x) fX(x)updated likelihood prior

22.6.2012
7
Partial factor
Assessment in case of damage
1) Visual inspection
2) Explanation of observed phenomena
3) Reliability assessment
4) Additional information
5) Decision if the reliability is still too low:• accept the present situation for economical reasons;
• reduce the load on the structure;
• repair the building;
• start demolition of the structure.

22.6.2012
8
The final reportThe final report on structural assessment and possible interim reports (if required) should
• be concise and clear and should include
• clear conclusions with regard to the objective of the assessment
• based on careful reliability assessment and cost of repair or upgrading.
A recommended report format is indicated in Annex G to ISO/CD 13822 [2].
Summary
• Assessment of existing structures is in many aspects different from designing a new structure
• Actual characteristics of structural material, action (permanent load), and geometric data should be considered.
• Currently valid codes should be considered (models for actions and resistances). Previously used codes as background documents.
• Target reliability level should be optimized taking into account residual life time, consequences and costs of safety measures.
• Partial factor method and probabilistic methods are recommended.
• Assessment based on satisfactory past performance may be used.
• Final report should include recommendations concerning intervention.

22.6.2012
9
The Charles Bridge in Prague – 650 years
In some cases assessment of existing structures is very difficult
Thank you for your attention - Gracias
17
Motivation of the project
• Existing structures represent a huge economic asset getting larger and larger every year.
• Many existing structures do not comply with the requirements of the EUROCODES
• The assessment of existing structures requires knowledge beyond the scope of design codes for new structures.
• The ultimate goal is to limit construction intervention to a minimum, thus complying with the principles of sustainable development.
• Authorities, owners and engineers need guidelines how to deal with existing structures
22.6.2012
10
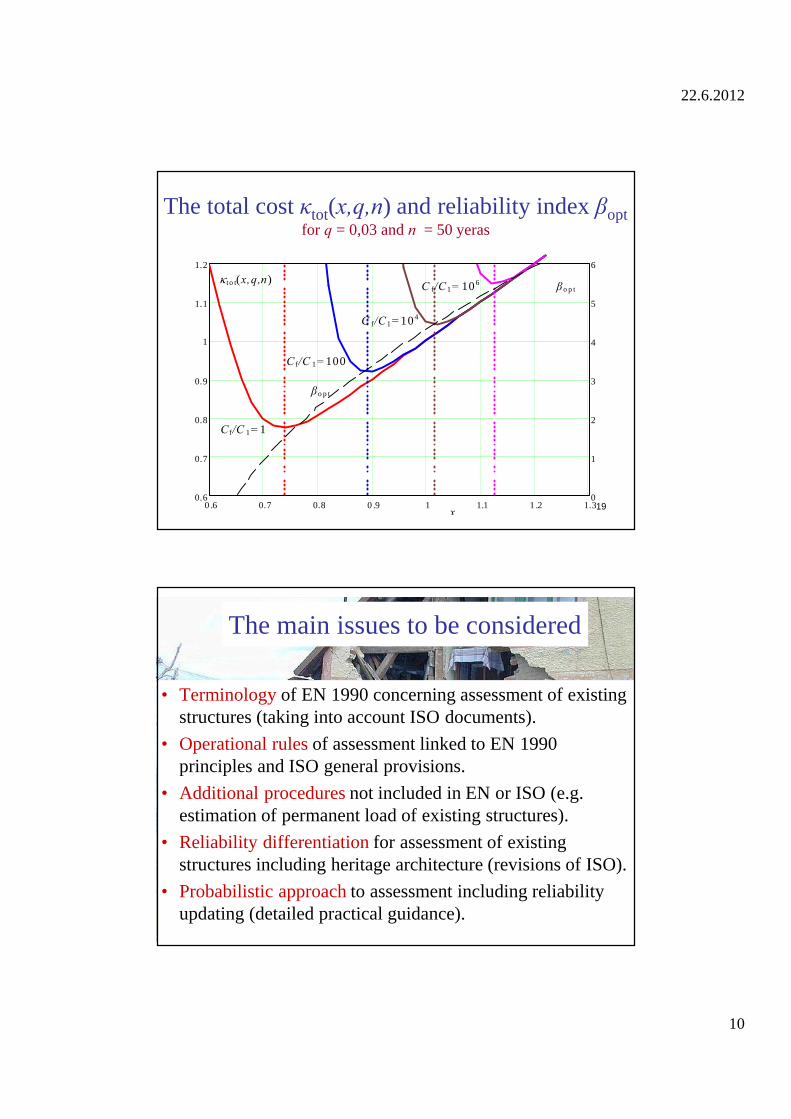
The total cost κtot(x,q,n) and reliability index βoptfor q = 0,03 and n = 50 yeras
0 .6 0.7 0.8 0 .9 1 1.1 1 .2 1.30.6
0.7
0.8
0.9
1
1.1
1.2
0
1
2
3
4
5
6
x
κto t(x,q,n)
C f/C 1 =1
C f/C 1 =100
C f/C1 =104
C f/C1= 106
βo p t
βo p t
19
The main issues to be considered
• Terminology of EN 1990 concerning assessment of existing structures (taking into account ISO documents).
• Operational rules of assessment linked to EN 1990 principles and ISO general provisions.
• Additional procedures not included in EN or ISO (e.g. estimation of permanent load of existing structures).
• Reliability differentiation for assessment of existing structures including heritage architecture (revisions of ISO).
• Probabilistic approach to assessment including reliability updating (detailed practical guidance).

22.6.2012
11
Definition of the project Existing structures
• Terms and definitions (additional terms to EN 1990)• General framework (assessment procedures)• Data for assessment (actions, materials, dimensions)• Structural analysis (models, uncertainties, deterioration)• Reliability verification (limit states, target reliabiloities) • Assessment based on satisfactory past performance• Interventions (alternative approaches)• Report (inspection and maintenance)• Annexes (updating, time dependence, target reliability, …)
Material independent document, linked to 1990
Foreseen main chapters
Basic concepts of assessment of existing structures
Milan Holický
Klokner Institute, Czech Technical University in Prague
Backgrounds: EN 1990, ISO 2394, ISO 13822, JCSS, RILEM

22/06/2012
1
Reliability Aspects
Ton VrouwenvelderDelft University / TNO
Leonardo da VinciAssessment of existing structuresProject number: CZ/08/LLP‐LdV/TOI/134005
Reliability
b l f f lf l ll d
EN 1990:
‐ ability of a structure to fulfil all required functions during a specified period of time under given conditions
Failure probability PFailure probability Pf‐most important measure of structural reliability
22/06/2012
2
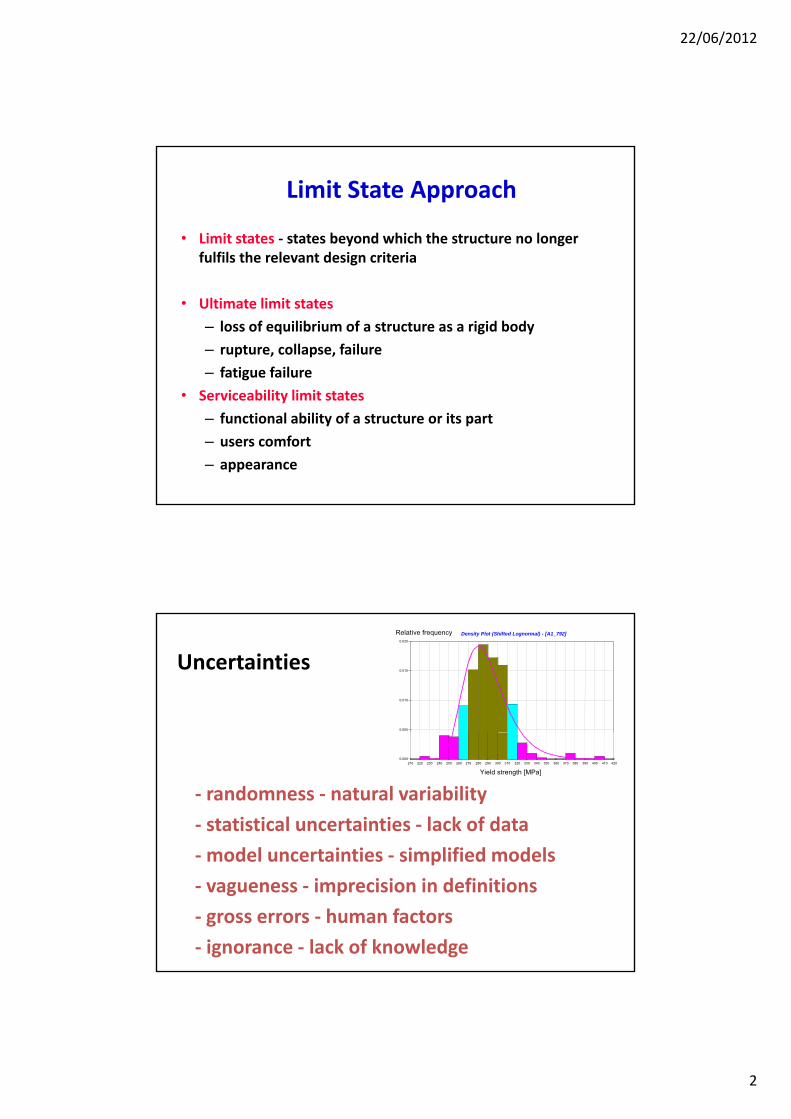
Limit State Approach
• Limit states ‐ states beyond which the structure no longer fulfils the relevant design criteria
• Ultimate limit states
– loss of equilibrium of a structure as a rigid body
– rupture, collapse, failure
– fatigue failure
• Serviceability limit states
– functional ability of a structure or its part
– users comfort
– appearance
Uncertainties
Density Plot (Shifted Lognormal) - [A1_792]
0.005
0.010
0.015
0.020
Relative frequency
‐ randomness ‐ natural variability
‐ statistical uncertainties ‐ lack of data
model uncertainties simplified models
210 220 230 240 250 260 270 280 290 300 310 320 330 340 350 360 370 380 390 400 410 4200.000
Yield strength [MPa]
‐model uncertainties ‐ simplified models
‐ vagueness ‐ imprecision in definitions
‐ gross errors ‐ human factors
‐ ignorance ‐ lack of knowledge

22/06/2012
3
R
EXAMPLE
R
Resistance: R = d2 fy / 4Load effect: E = V
Failure if E>R or: V > d2 fy / 4Limit state: V = d2 fy / 4
E
y
Limit state function: Z = R-E = d2 fy / 4 - V
R
distribution mean sd R resistance Lognormal 100 10
Statistical models
E
gE load effect Gumbel 50 5
0 .06
P ro b ab ility d en sity E (x ), R (x )
L o ad e ffec t E , G u m bel d is trib u tio n , E = 5 0 , E = 5 R esis tance R
lo g-n o rm al d is trib u tio n ,
40 60 8 0 100 120 1 40 0 .00
0 .02
0 .04
R an d om va riab le X
g R = 10 0 , R = 10

22/06/2012
4
R
distribution mean sd R resistance Lognormal 100 10
Partial factor approach
E
gE load effect Gumbel 50 5
0 .06
P ro b ab ility d en sity E (x ), R (x )
L o ad e ffec t E , G u m bel d is trib u tio n , E = 5 0 , E = 5 R esis tance R
lo g-n o rm al d is trib u tio n ,
E k R k
40 60 8 0 100 120 1 40 0 .00
0 .02
0 .04
R an d om va riab le X
g R = 10 0 , R = 10
Rk/m > Ek Q
Z = R ‐ E
derd)e()r()0Z(PP
R
Probabilistic approach
0)X(Z
ERf derd)e()r()0Z(PP
E Techniques:
Numerical integration (NI)
Monte Carlo (MC)Monte Carlo (MC)
First order Second moment method (FOSM)
Third moment method (accounting for skewness)
First Order Reliability Methods (FORM)

22/06/2012
5
R
First Order Second Moment method
Z = R - E
E
Z = R - E = 100 – 50 = 50
= Z /Z = 3.54
22E
2R
2Z 14σσσ
Pf = P(Z 0) = Z(0) = 0.0002
0,04
Probability density Z(g)
= Z /Z = 3.54 Pf = P(Z 0) = Z(0) = 0.0002
0,02
0,03
1 pf
Z
10 0 10 20 30 40 50 0,00
0,01
Z
pf

22/06/2012
6
Reliability index
Probability of Failure = (‐) 10 ‐
1.3 2.3 3.1 3.7 4.2 4.7
P(F)=(-) 10-1 10-2 10-3 10-4 10-5 10-6
Relation Partial factors and beta‐level:
γ = exp{α β V – kV} 1 + α β V
α = 0.7‐0.8
β = 3.3 ‐ 3.8 ‐ 4,3 (life time, Annex B)
k = 1.64 (resistance)
k 0 0 (loads)k = 0.0 (loads)
V = coefficient of variation

22/06/2012
7
Extensions
• load fluctuations• systems • degradation• inspection• risk analysisy• target reliabilities
Target levels Reliablity
Eurocode EN 1990, Annex B
Reliability index Reliability
classes Consequences for loss of human life, economical, social and environmental
consequences
a for Ta= 1 yr
d for Td= 50 yr
Examples of buildings and civil engineering works
RC3 – high High 5,2 4,3 Important bridges, public buildings
RC2 normal Medi m 4 7 3 8 Residential and officeRC2 – normal Medium 4,7 3,8 Residential and office buildings
RC1 – low Low 4,2 3,3 Agricultural buildings, greenhouses
= exp [(-k)V] ~ 1 + V

22/06/2012
8
JCSS TARGET RELIABILITIES for a one year reference period
Consequences of failure
Minor Moderate Large
Large =3.1 (pF10‐3) =3.3 (pF 5 10‐4) =3.7 (pF 10‐4)
Cost toincrease safety
Normal =3.7 (pF10‐4) =4.2 (pF 10‐5) =4.4 (pF 5 10‐6)
Small =4.2 (pF10‐5) =4.4 (pF 5 10‐5) =4.7 (pF 10‐6)
Cost optimisation / design versus assessment
PF = 10 ‐

22/06/2012
9
Human life safety
• Include value for human life in D
• Still reasons for IR and SR• Still reasons for IR and SR
• Example: p < 10‐4 / year
optimal annual failure probability
0 15
0,2
0,2500
1
0
0,05
0,1
0,15
0 10 20 30 40 50 60
design working time [year]
tim
es 0
,0
Existing Structures (NEN 8700)
Reliability index in case of assessment
Minimum β < βnew – 1.0
Human safety: β > 3.6 – 0.8 log T

22/06/2012
10
Example NEN 8700 (Netherlands)
Minimum values for the reliability index with a minimum reference period
Consequence class
Minimum reference period
for existing building
-NEW -EXISTING
wn wd wn wd
0 1 year 3.3 2,3 1.8 0.8
1 15 years 3.3 2,3 1.8a 1.1a
2 15 years 3.8 2.8 2.5a 2.5a
3 15 4 3 3 3 3 3a 3 3a3 15 years 4.3 3.3 3.3a 3.3a
Class 0: As class 1, but no human safety involved wn = wind not dominant wd = wind dominant (a) = in this case is the minimum limit for personal safety normative
Condition
Inspection en monitoring
limit
Time

22/06/2012
11
Updating
1) Updating distributions (eg concrete strength)
Observations
x x
2) Updating failure probability PF | I
Observations
Information ( I )Rk at design
2) Updating failure probability PF | I Example: I = {crack = 0.6 mm}
see JCSS document on Existing Structures en ISO13822
)P(B)BP(AB)P(A Two types of information I:
equality type: h(x) = 0
inequality type: h(x) < 0; h(x) > 0
)I)P(IP(F I)P(F
)(
)()(
IP IF PIFP
inequality type: h(x) < 0; h(x) > 0
x = vector of basic variables
)0)((
)0)(0)(()(
1
12
thP
thtZPIFP

22/06/2012
12
Fatigue steel structures
Find
d crack a
P(a(t+t) > d | a(t) = .. of a(t)<..)
0.4
0.6
0.8
1.0
PO
D
alpha = 1 ; beta = 3 alpha = 3 ; beta = 10
no cracks found, but? measured 1 mm, but?
0.0
0.2
0
0 5 10 15 20 25
Scheurafmeting [mm]

22/06/2012
13
Reliabilty level Beta (one year periods)given a crack found at t=10 a
8fully correlated
2
4
6
reli
ab
ilit
y in
dex
after inspection
00 5 10 15 20 25
time [year]
without inspection
Updating distributions
P(x|I) = P(x) P(I | x) / P(I)
fX (x|I) = C fX(x) P( I | x)
fX(x), fX(x|I)
updated distribution fX(x|I)
updated prior likelihood
X
prior distribution fX(x)
updated xdprior xd
22/06/2012
14
)L()fC)|(f |ˆ|(ˆ '''
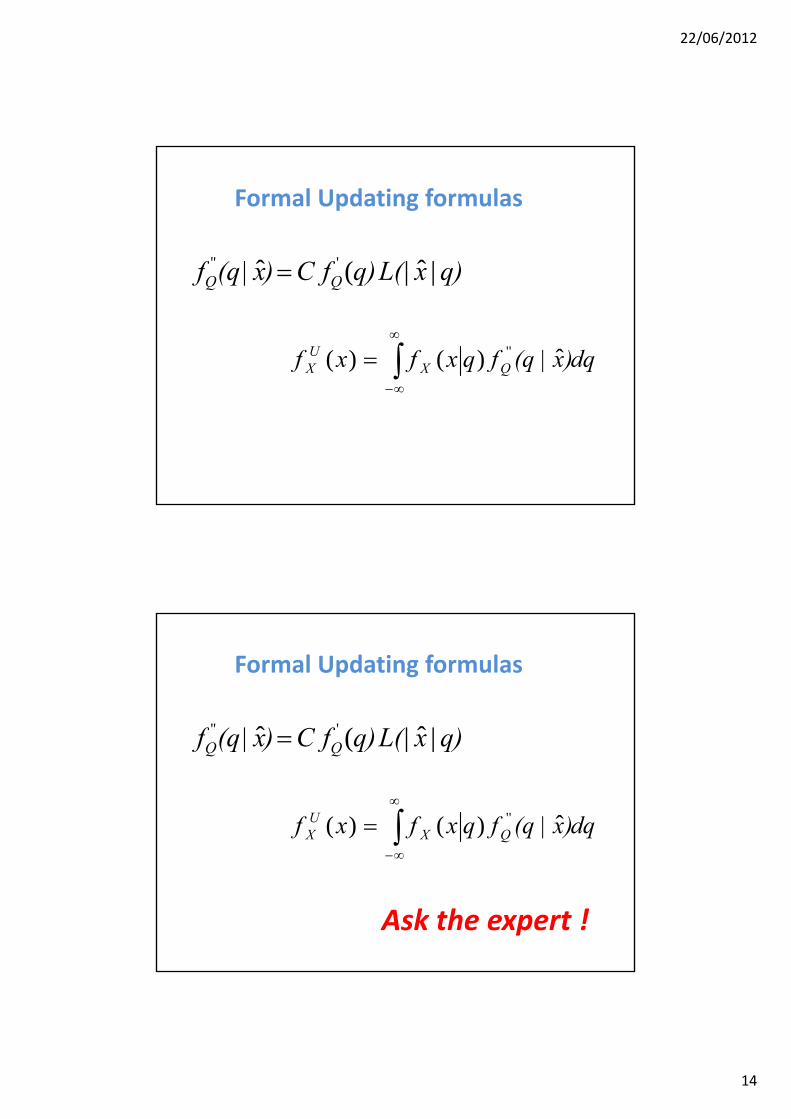
Formal Updating formulas
q)xL(q)fC)x|(qf QQ ||(
dq)x|(qfqxfxf QXUX
ˆ)()( ''
)L()fC)|(f |ˆ|(ˆ '''
Formal Updating formulas
q)xL(q)fC)x|(qf QQ ||(
dq)x|(qfqxfxf QXUX
ˆ)()( ''
Ask the expert !

22/06/2012
15
Example: Resistance with unknown mean mR and known stand. Dev. sR =17,5
Assume we have 3 observations with mean mm = 350Then mR has sm = 17,5/√3 = 10.If the load is to 304 then:
mZ= 350‐304=46sZ =(17,52 +102) = 20,2=2,27Pf=0,0116
Now we have one extra observation equal to 350.In that case the estimate of the mean mm does not change. h d d d f h h /( )The standard deviation of the mean changes to 17,5/(4) = 8,8
mZ= 350‐304=46,sZ =(17,52 +8,82) = 19,6,=2,35Pf=0,0095
Summary Reliability aspects
Uncertainties exist
Probability Theory may be helpful
Reliability targets depends on consequences of failure
Reliability targets depend on costs of improving
Existing structures may have a lower target reliabilityg y g y
Reliability may be updated using inspection results
There is a relation partial factor – reliability index

1
Assessment and Procedures
Project number: CZ/08/LLP-LdV/TOI/134005
Seminar: Assessment of existing structures
Assessment and ProceduresDimitris Diamantidis
Regensburg University of Applied Sciences
• Assessment process
Barcelona June 14, 20121
• Phases and procedures• Decision criteria• Examples
Assessment Process

2
Phase 1: Preliminary Assessment
• Visual inspection• Visual inspection
• Review of documentation
• Code compatibility
• Scoring system:1. age of the structure
2. general condition
3. loading (modifications)
4. structural system
5. residual working life
Phase 2: Detailed Assessment
• Quantitative inspections• Quantitative inspections
• Updating of information
• Structural reanalysis
• Reliability analysis
• Acceptance criteria
Histogram
30
35Frequency
Normal
Lognorm "0"
Gumbel
Lognormal
Gamma
0
5
10
15
20
25
0 30 42 54 66 78 90 102
Fre
qu
ency
Gamma
3
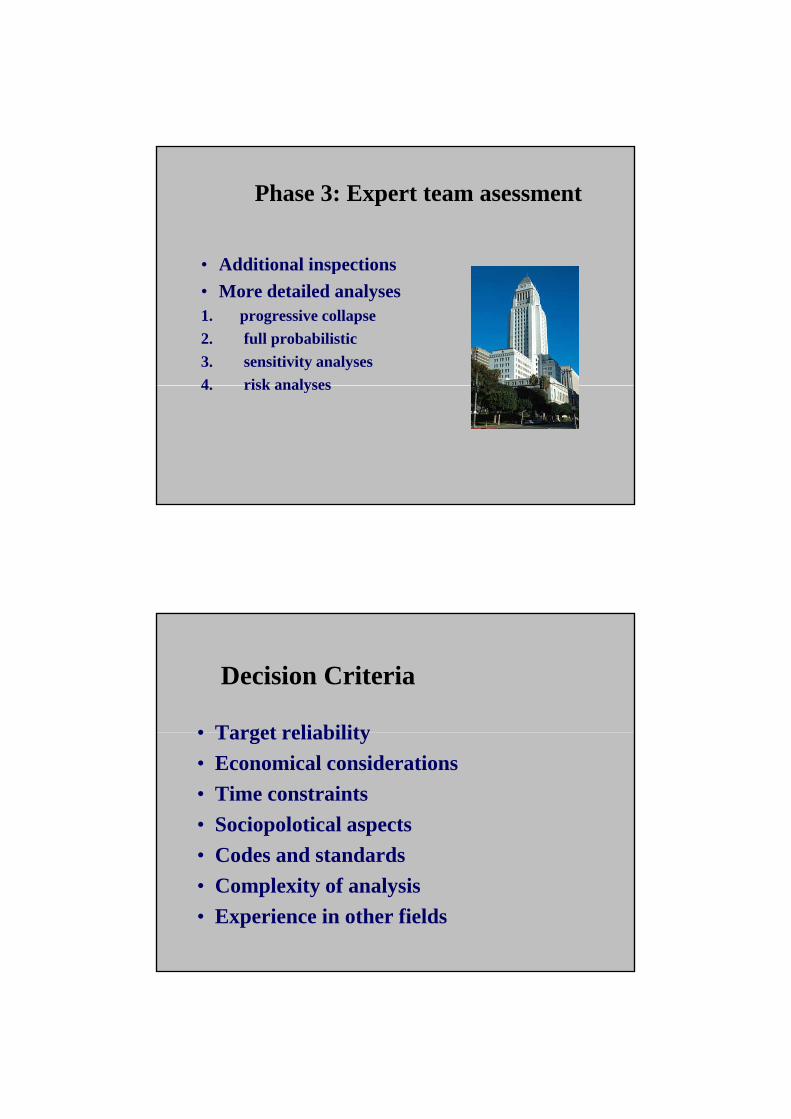
Phase 3: Expert team asessment
• Additional inspections• Additional inspections
• More detailed analyses1. progressive collapse
2. full probabilistic
3. sensitivity analyses
4 risk analyses4. risk analyses
Decision Criteria
• Target reliability• Target reliability
• Economical considerations
• Time constraints
• Sociopolotical aspects
Codes and standards• Codes and standards
• Complexity of analysis
• Experience in other fields

4
Old Railway Bridges(single span systems)
Railway Bridges
• 100 years old• 100 years old• Scoring system
verification (foundation, corrosion, joints, supports)
• R (steel resistance) from code on old bridgescode on old bridges
• S (train load) from DB(German Railways)
• Durability problems

5
Example Concrete floor structure(Phase 2 Procedure)
Reassessment of r.c. floor structure
flexural limit state functionflexural limit state function
g = Mu - Ma
Mu: Ultimate Bending Moment
Ma: Acting Bending Moment

6
Two Cases for Updating
• Case a) Updating of random variables• Case a) Updating of random variables
(due to destructive tests)
• Case b) proof load = 4x design load
Variable Distribution c.o.v.
Steel strength
Lognormal 0.06
Case a) Updating of random variables(due to destructive tests)
strengthg
Concrete Strength
Lognormal 0.14
Cover thickness
Lognormal 0.25
i i i i ß i i f 3 0Reliability index ß is increased from 3.70(prior information) to 3.80, due to
reduced variability of the parameters

7
Case b) proof load
• Partial proof test until collapse resulted to a• Partial proof test until collapse resulted to a very high proof load
• Artificial limit state function
g = Mproof – Mu<=0
• Computation of conditional failure probability
=> Reliability index ß is increased from 3.70
to 4.90
Typical limit states
- extreme load
Steel road bridges
(Phase 3 Procedure)
- extreme load
- Fatigue
Which measures are necessary in order to meet acceptance criteria (residual life time 20 years)?
8
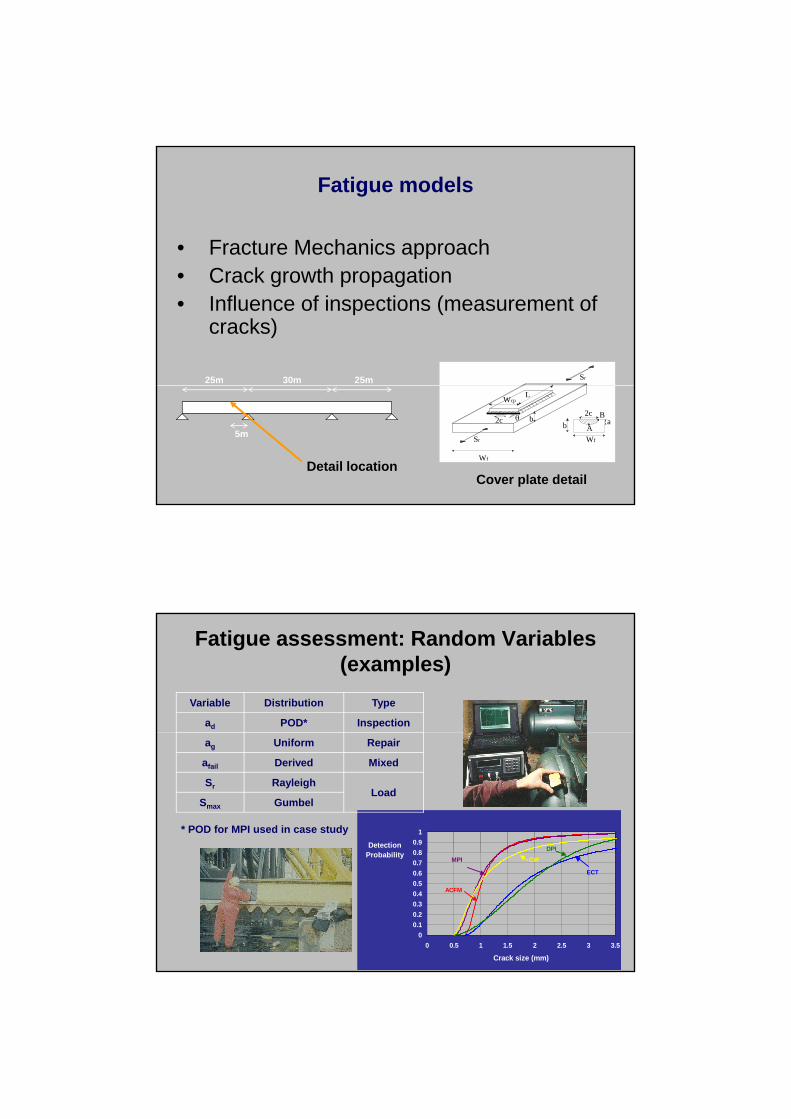
Fatigue models
• Fracture Mechanics approach• Crack growth propagation• Influence of inspections (measurement of
cracks)
Sr25m 30m 25m
2ca
Wf
A
Bb
2c
Sr
Wf
b
WcpL
5m
Detail locationCover plate detail
Variable Distribution Type
ad POD* Inspection
Fatigue assessment: Random Variables (examples)
0 8
0.9
1
DetectionP b bili
DPI
ag Uniform Repair
afail Derived Mixed
Sr RayleighLoad
Smax Gumbel
* POD for MPI used in case study
0
0.1
0.2
0.3
0.4
0.5
0.6
0.7
0.8
0 0.5 1 1.5 2 2.5 3 3.5
Crack size (mm)
Probability
ECT
CWMPI
ACFM

9
1,00E-01
1,00E+00
GIADI
DI
Fatigue assessment: typical results
1,00E-04
1,00E-03
1,00E-02
Pf
GIADI
LTIADI
GLTIADI
Prior
1,00E-05
30 60 90 120T (Years)
I: Inspection, D=DetectionIA: Invasive Action, LT=Load Truncation, G=Weld Toe Grinding
• Inspection and crack detection at T=30y
Alt ti id d
Fatigue assessment: scenarios
• Alternatives considered:1. Load truncation (LT)
2. Weld toe grinding (G)
3. Load truncation + weld toe grinding (LT+G)

LEONARDO DA VINCI PROJECT CZ/11/LLP-LdV/TOI/134005
SEMINAR ON ASSESSMENT OF EXISTING STRUCTURES Barcelona. 14-06-2012
ON THE ASSESSMENT OF DETERIORATING STRUCTURES
Peter Tanner. Carlos Lara. Miguel Prieto
Assessment of existing structures
MOTIVATION
– The need to assess the reliability of an existing structure may arise from different causes
– All can be traced back to doubts about the structural safety– All can be traced back to doubts about the structural safety
Reliability ok for future use ?
Staged evaluation procedure, improving accuracy of data

Influence of updated information
ASSESSMENT WITH PARTIAL FACTOR METHOD
– Probabilistic methods are most accurate to take into account updated information
But they are not fit for use in daily practice– But they are not fit for use in daily practice
– Partial factor method should be available for assessment
kact,E E act,act,kR
act,R
Influence of updated information
ASSESSMENT WITH PARTIAL FACTOR METHOD
– Updated characteristic value of X
f(X) Updated information
XXX
Prior information
information
– Updated partial factor X,act
Can not be derived directly
Link between probabilistic and partial factor methods: design point, the most probable failure point on LS surface
XkXk,act
kact,E E act,act,kR
act,R
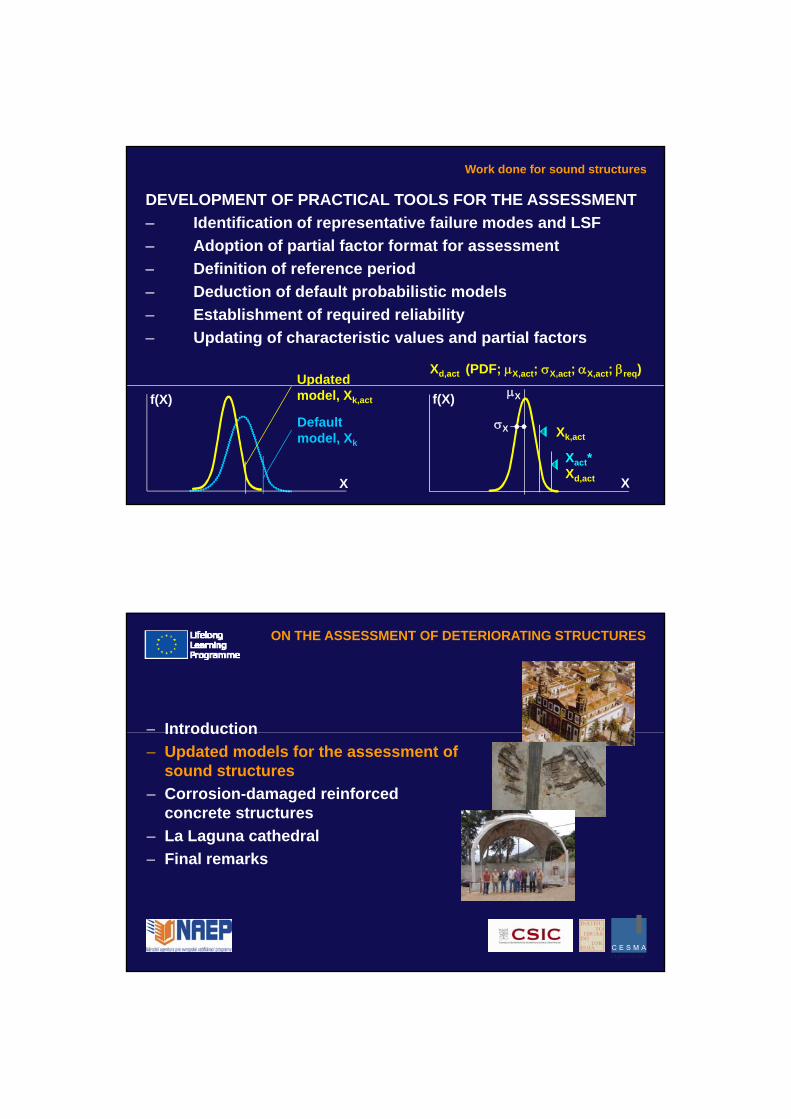
Work done for sound structures
DEVELOPMENT OF PRACTICAL TOOLS FOR THE ASSESSMENT
– Identification of representative failure modes and LSF
– Adoption of partial factor format for assessment
Definition of reference period– Definition of reference period
– Deduction of default probabilistic models
– Establishment of required reliability
– Updating of characteristic values and partial factors
Xd,act (PDF; X,act; X,act; X,act; req)Updated
f(X)
X
Default model, Xk
pmodel, Xk,act f(X)
X
Xact*Xd,act
Xk,act
X
X
ON THE ASSESSMENT OF DETERIORATING STRUCTURES
– IntroductionIntroduction
– Updated models for the assessment of sound structures
– Corrosion-damaged reinforced concrete structures
– La Laguna cathedral
– Final remarks
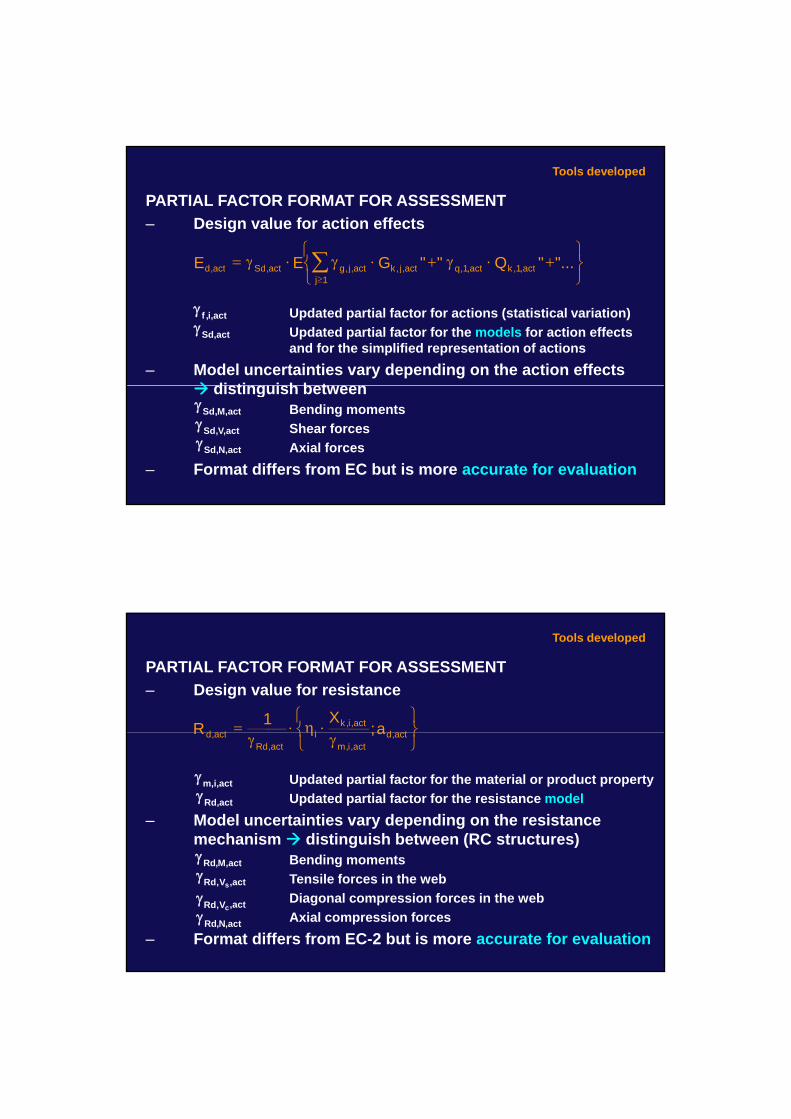
Tools developed
PARTIAL FACTOR FORMAT FOR ASSESSMENT
– Design value for action effects
t1kt1tjktjtSdtd ""Q""GEE
Updated partial factor for actions (statistical variation)
Updated partial factor for the models for action effects and for the simplified representation of actions
– Model uncertainties vary depending on the action effects disting ish bet een
i,act,fSd,act
1jact,1,kact,1,qact,j,kact,j,gact,Sdact,d ...QGEE
distinguish betweenBending moments
Shear forces
Axial forces
– Format differs from EC but is more accurate for evaluation
M,act,SdV,act,SdN,act,Sd
Tools developed
PARTIAL FACTOR FORMAT FOR ASSESSMENT
– Design value for resistance
tdact,i,k
itd a;X1
R
Updated partial factor for the material or product property
Updated partial factor for the resistance model
– Model uncertainties vary depending on the resistance mechanism distinguish between (RC structures)
m,i,actRd,act
act,dact,i,m
iact,Rd
act,d a;R
Bending moments
Tensile forces in the web
Diagonal compression forces in the web
Axial compression forces
– Format differs from EC-2 but is more accurate for evaluation
M,act,Rd
N,Rd
sV,Rd
cV,Rd,act
,act
,act

Tools developed
DEFAULT PROBABILISTIC MODELS COMPLYING WITH THE FOLLOWING REQUIREMENTS
– Representation of physical properties of the corresponding variable 4
5
6Gumbel Probability Plot
of the corresponding variable
– Consistency with JCSS models
– Representation of the state of uncertainty associated with code rules
Representation of
f(X)
30 40 50 60 70 80 90 100 110-3
-2
-1
0
1
2
3
X
-log(
-log(
F))
– Representation of uncertainties by means of random variables, suitable for practical applications
X
X
X
Xk
XFORM
Xd = X·Xk
ii XXi TypeX ;
Tools developed
2.50
UPDATED PARTIAL FACTORS
– For example partial factor for concrete strength versus CoV
0.50
1.00
1.50
2.00
c
V i bl d i t
0.00
0 0.1 0.2 0.3 0.4 0.5 0.6Vc
V ariable dominante
No Dominante
act,d
act,i,m
act,i,ki
act,Rdact,d a;
X1R
Comparable
Definition
EC-2,cRdc EC-2,cc
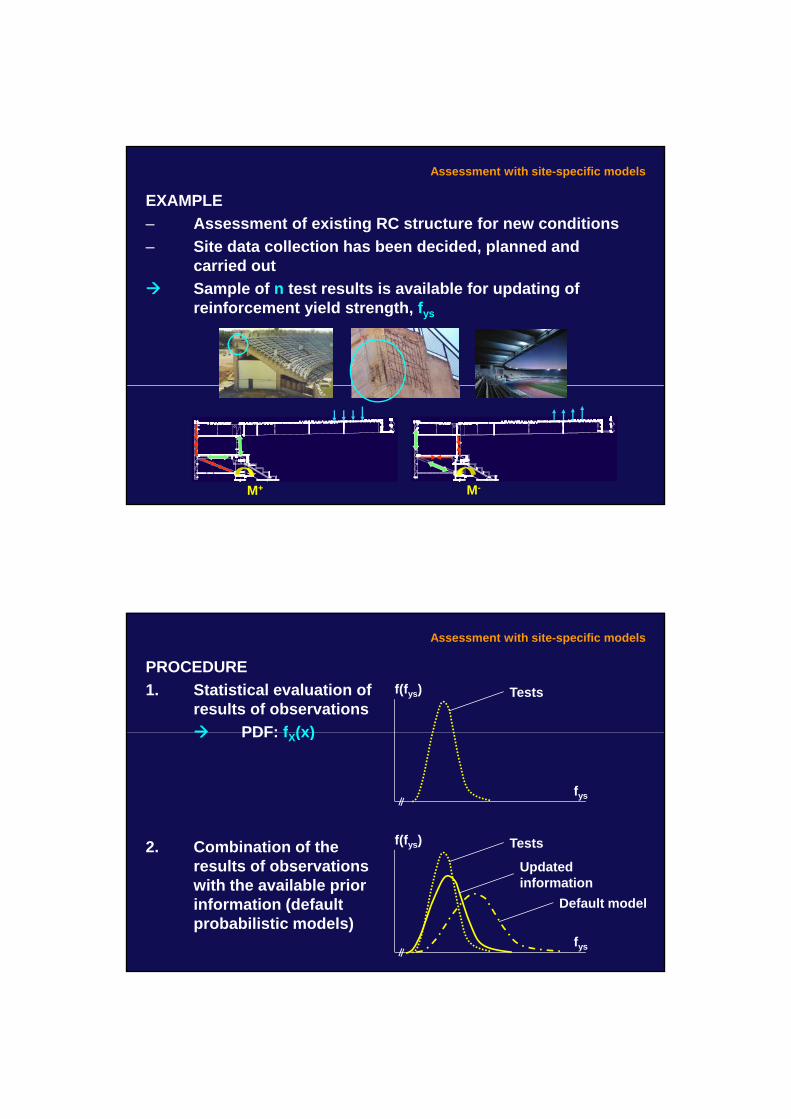
EXAMPLE
– Assessment of existing RC structure for new conditions
– Site data collection has been decided, planned and carried out
Assessment with site-specific models
carried out
Sample of n test results is available for updating of reinforcement yield strength, fys
M-M+
PROCEDURE
1. Statistical evaluation of results of observations
PDF: f (x)
f(fys) Tests
Assessment with site-specific models
PDF: fX(x)
2. Combination of the f(fys) Tests
fys
2. Combination of the results of observations with the available prior information (default probabilistic models)
fys
Default model
Updated information
PROCEDURE
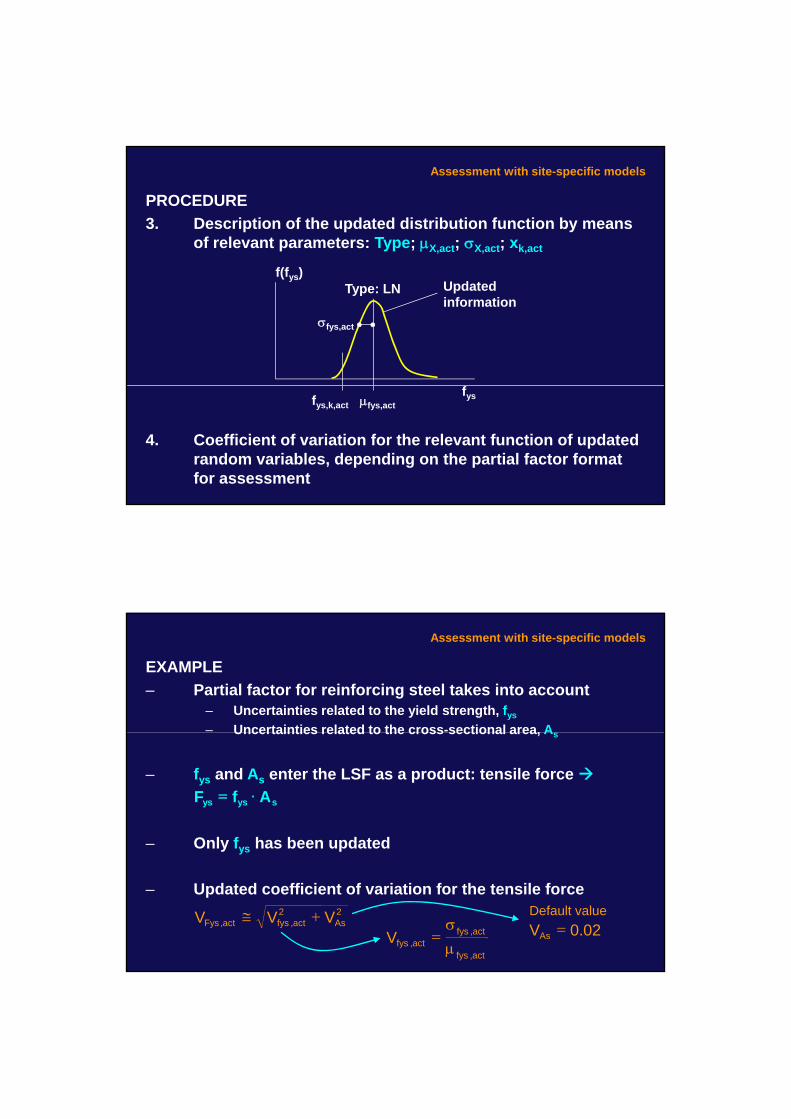
3. Description of the updated distribution function by means of relevant parameters: Type; X,act; X,act; xk,act
Assessment with site-specific models
f(fys)
fys,act
Updated information
Type: LN
4. Coefficient of variation for the relevant function of updated random variables, depending on the partial factor format for assessment
fys,act
fysfys,k,act
EXAMPLE
– Partial factor for reinforcing steel takes into account– Uncertainties related to the yield strength, fys
– Uncertainties related to the cross-sectional area, A
Assessment with site-specific models
Uncertainties related to the cross sectional area, As
– fys and As enter the LSF as a product: tensile force
– Only fys has been updated
sysys AfF
ys
– Updated coefficient of variation for the tensile force2As
2act,fysact,Fys VVV
act,fys
act,fysact,fysV
Default value
02.0VAs

PROCEDURE
5. Updated partial factor, considering the updated variable dominating or non dominating (unknown in advance)
Assessment with site-specific models
1.0
1.1
1.2
γs
γs,act,δ
γs,act,ν
0.8
0.9
0 0.025 0.05 0.075 0.1 0.125VFys
Dominating
Non dominating
VFys,act
PROCEDURE
6. Verification of structural safety with updated characteristic values and partial factors: xik,act; Xi,act
Assessment with site-specific models
1.1
1.2
γs,act,δ
0 2
0.4
0.6
0.8
1.0Xrm
fys
d
fc
As
Vigas de cubierta Hormigón armado Momentos flectores
Regresión polinomial
Dominating variable unknown in advance trial and error or considering x
0.8
0.9
1.0
0 0.025 0.05 0.075 0.1 0.125
γs
VFys
Dominating
Non dominating
γs,act,ν
VFys,act -1.0
-0.8
-0.6
-0.4
-0.2
0.0
0.2
0 0.2 0.4 0.6 0.8 1
As
b1
Mc
Mp
Xem
Mq2
Número de vigas: 240

EXAMPLE
– Verification of bending resistance of RC element
– Only fys has been updated
D i ti i bl F
Assessment with site-specific models
– Dominating variable: Fys
– Verification of structural safety: act,Rdact,Ed MM
b1
f
fA5.0d
fA1M
ckc
c
2
,act,s
act,k,yss
,act,s
act,k,yss
M,Rdact,Rd
ON THE ASSESSMENT OF DETERIORATING STRUCTURES
– IntroductionIntroduction
– Updated models for the assessment of sound structures
– Corrosion-damaged reinforced concrete structures
– La Laguna cathedral
– Final remarks

Performance of corroded elements
MAIN EFFECTS OF CORROSION OF REINFORCEMENT BARS
1. Decrease of bar cross-section
2. Decrease of ductility of steel u reduction of 30 to 50%)
3. Bond deterioration
4. Cracking of concrete cover (due to corrosion products)
3
4
corrosion prod cts
sound steel
a/2
cover, d
Corrosion may affect performance at ULS and SLS
concrete
1
2
products
a/2diameter, 0
ASSUMPTIONS
– Lower bound theorem of the theory of plasticity is validA load system, based on a statically admissible stress field which nowhere violates the yield condition is a lower bound to the
Performance of corroded elements
ycollapse load.
– Stress field models can be establishedMuttoni et al., 2011
– Required information – Geometry, particularly remaining bar cross-sections
– Material properties
– Bond strength

SITE DATA COLLECTION
– Geometry and material properties can be updated
Performance of corroded elements
BOND STRENGTH
– Pull-out tests on specimens with accelerated and natural corrosion
Normalized bond strength depending on cross-section loss
Performance of corroded elements
Normalized bond strength depending on cross-section loss
8 0
10,0
12,0M. Prieto (corr > 5%)
M. Prieto (corr < 5%)
M. Prieto (No corrosion)
Lineal (corr > 5 %)
Lineal ( corr < 5 %)
Lineal (No corrosion)
Normalized bond strength for corroded bars
Linear Regression (corr > 5 % )
Linear Regression (corr < 5 % )
Linear Regression (No corrosion)
95 % fractile
0,0
2,0
4,0
6,0
8,0
0 1 2 3 4 5 6 7 8
τ/f ctm
a/
95 % fractile
5 % fractile
5 % fractile
5 % fractile
95 % fractile
Performance of corroded elements
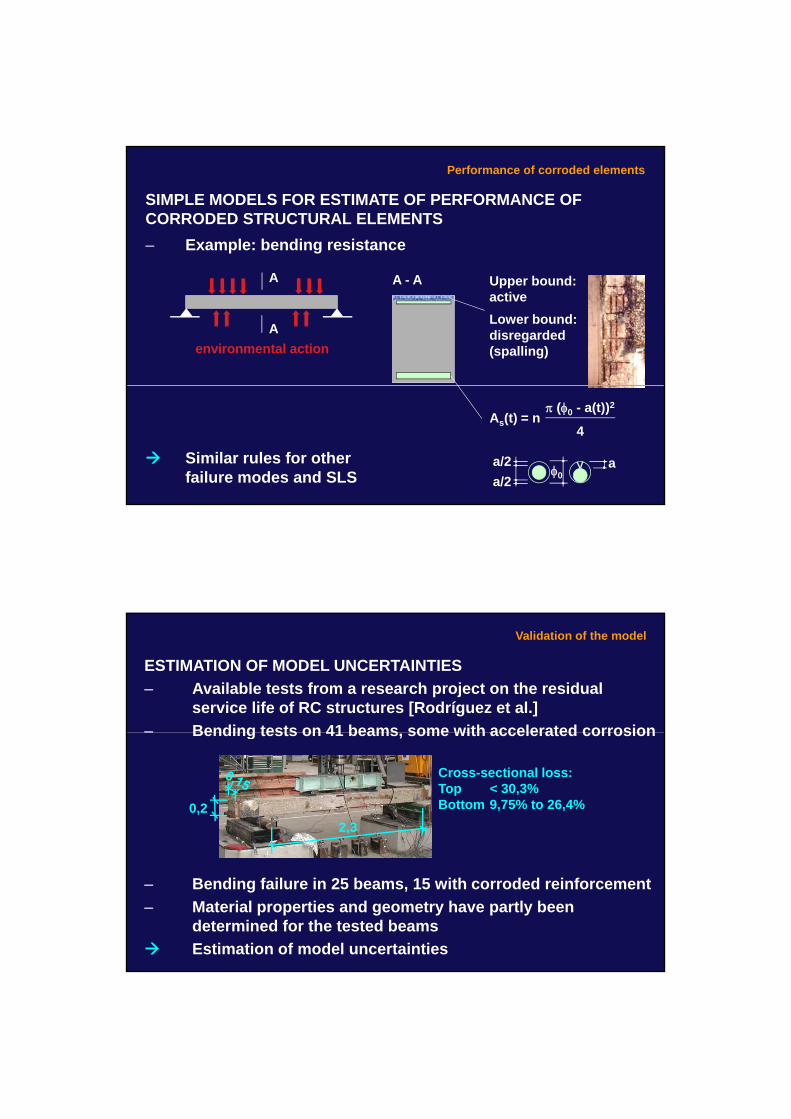
SIMPLE MODELS FOR ESTIMATE OF PERFORMANCE OF CORRODED STRUCTURAL ELEMENTS
– Example: bending resistance
A
A
environmental action
Upper bound: active
Lower bound: disregarded(spalling)
A - A
Similar rules for other failure modes and SLS 0
aa/2
a/2
As(t) = n (0 - a(t))2
4
ESTIMATION OF MODEL UNCERTAINTIES
– Available tests from a research project on the residual service life of RC structures [Rodríguez et al.]
– Bending tests on 41 beams some with accelerated corrosion
Validation of the model
– Bending tests on 41 beams, some with accelerated corrosion
2,3
Cross-sectional loss:Top < 30,3%Bottom 9,75% to 26,4%0,2
– Bending failure in 25 beams, 15 with corroded reinforcement
– Material properties and geometry have partly been determined for the tested beams
Estimation of model uncertainties

PARAMETERS FOR UNCERTAINTY VARIABLES
– Comparison test – model and statistical evaluation of results
U b d ti
Validation of the model
Model
L b d
Distribution
LN
1 34
CoV
0 11
Upper bound: active
Lower bound: disregarded
Remaining cross-sections
– Model for lower bound is conservative
– Lower precision than in bending strength models for sound beams reasonable
Lower boundUpper bound
LNLN
1,340,97
0,110,11
CONSEQUENCES
– Higher model uncertainties lead to increase in pf
– Partial factor should be increased
X
Validation of the model
Further studies are required, for example for members with– Larger dimensions
– Natural corrosion
act,d
act,i,m
act,i,ki
act,Rdact,d a;
X1R

ONGOING TESTS
– Industrial building in the northwest of Spain – Construction from the 40’s of the last century
– In disuse for 20 years
Validation of the model
In disuse for 20 years
– Exposure to marine environment during 70 years
– Change of use– Transformation into cultural centre
Partial demolition required
ONGOING TESTS
– Selection of representative, corrosion-damaged members for testing
– 8 beams
Validation of the model
8 beams
– 5 columns
– 1 frame

FIRST RESULTS
– Bending test on beam nº 1– Deformation control
– Ductile behaviour
A - A
Validation of the model
Ductile behaviour
LVDT-2LVDT-1
A
80
100
120Ensayo de flexión 4 puntos viga 1 (LVDT-2)
4,84
1,0 1,0A
0
20
40
60
80
0 5 10 15 20 25 30 35 40 45 50
Ca
rga
(k
N)
Flecha (mm)
THEORETICAL LOAD BEARING CAPACITY
– Prior information – Geometry: measured on tested beam prior to the test
– Material properties: determined for members from the same
Validation of the model
Material properties: determined for members from the same building
– Analysis based on prior information using stress field model and comparison to test
– Mult,t = 127 kNm
– Mult,e = 123 kNm
Muttoni et al., 2011

ON THE ASSESSMENT OF DETERIORATING STRUCTURES
– IntroductionIntroduction
– Updated models for the assessment of sound structures
– Corrosion-damaged reinforced concrete structures
– La Laguna cathedral
– Final remarks
SAN CRISTÓBAL DE LA LAGUNA
– Historic city located in Tenerife
– Typical urban structure developed in Latin America during colonisation
Context
colonisation
Declared a UNESCO World Heritage Site in 1999

CATHEDRAL
– Built over former church of Nuestra Señora de los Remedios
– Cathedral since 1818
Declared in ruins in 1897 due to settlements induced damage
Context
– Declared in ruins in 1897 due to settlements induced damage
Except neo-classical facade, it was completely demolished
CATHEDRAL
– Rebuilt between 1905 and 1913 in neo-gothic style according to engineering drawings by José Rodrigo Vallabriga
– Novel technology was used: reinforced concrete
Context
– Novel technology was used: reinforced concrete – Shorter construction time
– Lower costs

RISKS ASSOCIATED WITH SCANTILY PROVEN TECHNOLOGY
– Aggregates with inbuilt sulfates, chlorides, seashells, ...
– Concrete with high porosity and low resistivity
High relative humidity and filtration of rainwater
Motivation
– High relative humidity and filtration of rainwater
Ongoing deterioration mechanisms with severe damage to both, concrete and reinforcement
– Corrosion
– Spalling
– ...
RISKS ASSOCIATED WITH SCANTILY PROVEN TECHNOLOGY
– Less than 100 years after reconstruction, the cathedral was to be closed to the public again and was propped ...
Detailed assessment showed
Motivation
Detailed assessment showed – Impossibility to detain deterioration mechanisms
– Technical difficulties and uncertainties entailed in repairing roof
Recommendation to demolish and rebuild the roof maintaining the rest of the temple

WORLD HERITAGE SITE
– Authorities wish to save the existing main dome
– For this purpose, durability requirements are reduced Service period for normal building structures not for
Motivation
– Service period for normal building structures, not for monumental buildings
Future techniques might be suitable to fully detain deterioration mechanisms
GEOMETRY
– Global system
Description
1010
5,4
7,5
Spherical dome
Cylindrical “drum”
Lantern
– Structural members of the spherical dome – 8 arches
– Shells
– Tension ring

STRUCTURAL BEHAVIOUR
– No significant seismic actions
– Distributed loads produce mainly membrane forces
Thrust is equilibrated by tension ring forces
Description
– Thrust is equilibrated by tension ring forces
Mainly vertical loads are transmitted to the robust cylindrical “drum”
Assessment focuses on the dome
PRIOR INFORMATION
– Previous assessment of the existing building, particularly the lower roof
– Available information about
Information
– Available information about – Material properties
– Cross sections of main elements
– Deterioration mechanisms
Prior information for the main dome

DATA ACQUISITION PROGRAM
– Geometry – Overall system dimensions
– Cross sections of structural and ornamental elements
Information
Cross sections of structural and ornamental elements
– Self weight and permanent actions
– Material properties
– Qualitative and quantitative determination of damage
– Cracks
S lli
Outside Inside
– Spalling
– Carbonation and chloride ingress
– Corrosion velocity and cross section loss
– Material deterioration such as crystallization of salts, efflorescence, humidity
– Previous interventions
CROSS SECTIONS
– Parameters for different variables derived from a minimum of 4 measurements
Updated models
hNi,
2
hNi 1
hNi,3
h
hNi
As1,N As2,N
hm
3,L
bm,N
r2As
1,N
hm2
,N
riAs1,N
hl1 L
hl2,L
As,L
Nervio interior
Lámina
b1,Ni b3,Ni
bNi
b2,Ni
Ni,1
bNe
hNe
hL
rlAs1,N
rldAs2,N
r1As1,N
rAs2,N
rliAs2,N
hm1,L
hc,L
l1,L
rAs,L
Nervio exterior
A A

CROSS SECTIONS
– Equivalent cross sections for structural analysis
Updated models
0 19
Arches Shell
0,12
0,20
Ø13
Ø20
Ø20
0,19
0,06 0,06 0
,02
0,0
5
0,0
4
0,08
0,03
1Ø6c./0,22
1Ø6c./0,09
0,11 0,15
Tension ring
0,26
0,77 0,74As,T = 1.592 mm2
SELF WEIGHT AND PERMANENT ACTIONS
– For each layer, j, establishment of – Thickness, hj
– Density of material, j
Updated models
Density of material, j
Mean values and coefficients of variation for self weight and permanent actions
Updated partial factors, for example for self weight
06,1
18,11
,,
,,,,,
2,
2,,,
NENE
cccc
VNSdactNSd
acthactgactg
e
VV

MATERIAL PROPERTIES FOR REINFORCING STEEL
– Manufacture of specimens
– Execution of tensile tests
Updated models
MATERIAL PROPERTIES FOR REINFORCING STEEL
– Evaluation of test results and combination of information
Updated models
0.1Prior PDF
0
0.02
0.04
0.06
0.08
220 240 260 280 300 320
Tests
Predictive PDF
– Updated parameters: LN; fys,act; fys,act; fys,k,act; s,act
– Updated characteristic values– < 6 mm: fys,k,act = 304 N/mm2
– > 6 mm: fys,k,act = 262 N/mm2
fy [MPa]
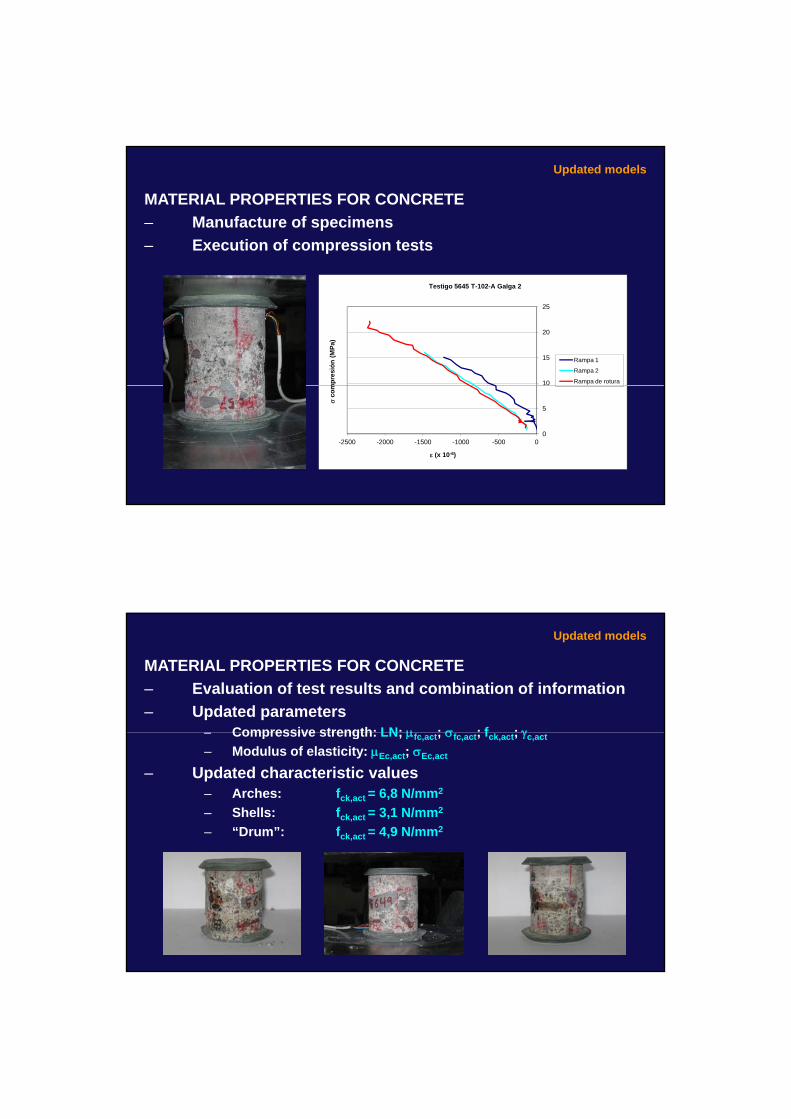
MATERIAL PROPERTIES FOR CONCRETE
– Manufacture of specimens
– Execution of compression tests
Updated models
10
15
20
25
mp
resi
ón
(M
Pa)
Testigo 5645 T-102-A Galga 2
Rampa 1
Rampa 2
Rampa de rotura
0
5
-2500 -2000 -1500 -1000 -500 0
co
m
(x 10-6)
MATERIAL PROPERTIES FOR CONCRETE
– Evaluation of test results and combination of information
– Updated parameters Compressive strength: LN; ; ; f ;
Updated models
– Compressive strength: LN; fc,act; fc,act; fck,act; c,act
– Modulus of elasticity: Ec,act; Ec,act
– Updated characteristic values– Arches: fck,act = 6,8 N/mm2
– Shells: fck,act = 3,1 N/mm2
– “Drum”: fck,act = 4,9 N/mm2
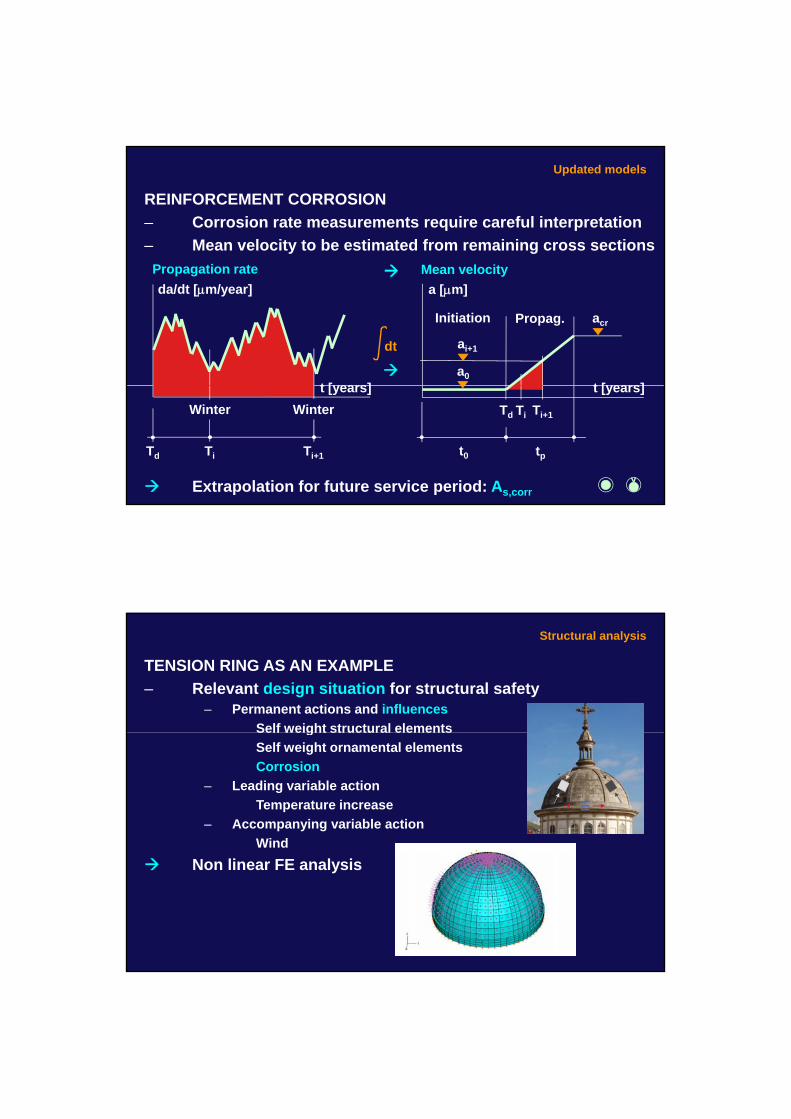
REINFORCEMENT CORROSION
– Corrosion rate measurements require careful interpretation
– Mean velocity to be estimated from remaining cross sections
Updated models
P ti t M l it
t [years]
da/dt [m/year] a [m]
t [years]
acr
ai+1
a0
Initiation Propag.
dt
Propagation rate Mean velocity
Extrapolation for future service period: As,corr
Winter Winter
Td Ti Ti+1
t [years] t [years]
t0 tp
Td Ti Ti+1
TENSION RING AS AN EXAMPLE
– Relevant design situation for structural safety – Permanent actions and influences
Self weight structural elements
Structural analysis
Self weight structural elements
Self weight ornamental elements
Corrosion
– Leading variable action
Temperature increase
– Accompanying variable action
Wind
Non linear FE analysis

TENSION RING AS AN EXAMPLE
– Updated design action effects NEd,act = 175 kN
– Updated design resistance at the end of future service period
Verification of structural safety
– Updated design resistance at the end of future service periodNRd,act = 363 kN
– Verification NEd,act < NRd,act
RECOMMENDATION
– Structural reliability can be verified, but – Severe damage to concrete and reinforcement
– Impossibility to detain deterioration mechanisms
Decision
Impossibility to detain deterioration mechanisms
– Technical difficulties and uncertainties entailed in repairing dome
Demolition and reconstruction of the roof is advisable
ON THE ASSESSMENT OF DETERIORATING STRUCTURES
– IntroductionIntroduction
– Updated models for the assessment of sound structures
– Corrosion-damaged reinforced concrete structures
– La Laguna cathedral
– Final remarks
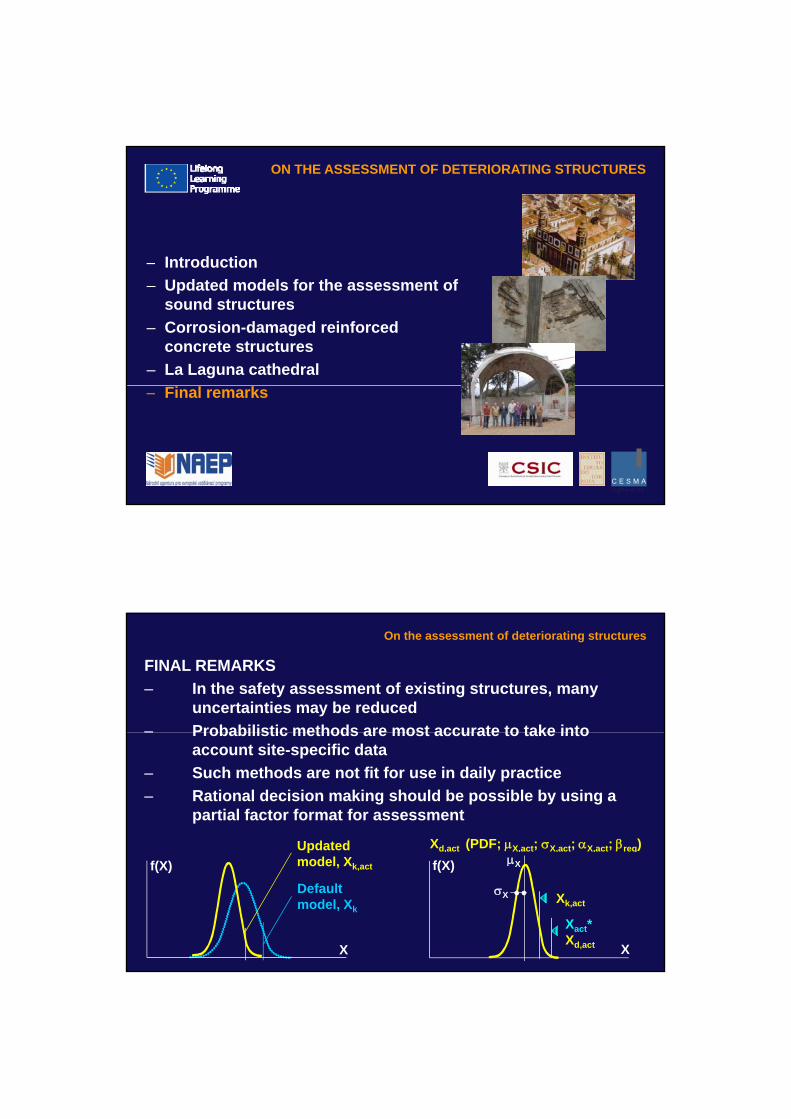
FINAL REMARKS
– In the safety assessment of existing structures, many uncertainties may be reduced
– Probabilistic methods are most accurate to take into
On the assessment of deteriorating structures
– Probabilistic methods are most accurate to take into account site-specific data
– Such methods are not fit for use in daily practice
– Rational decision making should be possible by using a partial factor format for assessment
Xd,act (PDF; X,act; X,act; X,act; req)Updated
f(X)
X
Default model, Xk
pmodel, Xk,act f(X)
X
Xk,act
X
X
Xact*Xd,act

FINAL REMARKS
– Tools have been developed to accommodate site-specific data by updating characteristic values and partial factors
– Further efforts are needed to extend these tools to the
On the assessment of deteriorating structures
– Further efforts are needed to extend these tools to the assessment of deteriorating structures

June 14-15, 2012 1
SEISMIC SEISMIC PERFORMANCE EVALUATION PERFORMANCE EVALUATION OF OF REINFORCED CONCRETE BUILDING REINFORCED CONCRETE BUILDING
IN IN TURKEYTURKEY
Assoc. Prof. Dr. Mehmet INELPamukkale University, Denizli, TURKEY
Leonardo da VinciAssessment of existing structures
Project number: CZ/08/LLP-LdV/TOI/134005
June 14-15, 2012 2
OutlineOutline
Observed damages in past earthquakes
Turkish Earthquake Code-2007
Seismic Evaluation of a Typical School Building
Field Assessment
Office Work
Discussion of Results Observed Concrete Strength in Existing Buildings

June 14-15, 2012 3
Destructive Earthquakes in TurkeyDestructive Earthquakes in Turkey
Date(dd/mm/yy) Magnitude Location # of
deaths# of injured
# of heavily damaged buildings
Latitude (N)
Longitude (E)
Depth (km)
13.03.1992 Ms = 6.8 Erzincan 653 3 850 6 702 39.68 39.56 27
01.10.1995 Ms = 5.9 Dinar 94 240 4 909 38.18 30.02 24
27.06.1998 Ms = 5.9 Adana Ceyhan 146 940 4 000 36.85 35.55 23
17.08.1999 Ms = 7.4 Kocaeli 15 000 32 00050 000 or 100
000 residences
40.70 29.91 20
12.11.1999 Mw = 7.2 Duzce 845 4 948 15 389 40.79 31.21 11
03.02.2002 Mw = 6.5 Afyon-Sultandagi 42 325 4 401 38.46 31.30 6
01.05.2003 Mw = 6.4 Bingol 176 521 1 351 38.94 40.51 6
June 14-15, 2012 4
General ObservationsGeneral Observations
Mid-rise RC buildings with low technology engineered residential construction have been responsible for considerable life and property losses during seismic events
Structural damages were mostly due to repetition of well known mistakes of the past in the design and construction of reinforced concrete buildings
Damaged buildings generally had irregular structural framing, poor detailing, and no shear walls
Turkey has a modern seismic code that is compatible with the codes in other seismic countries of the world

June 14-15, 2012 5
General ObservationsGeneral Observations ((Cont’dCont’d))
Altering the member sizes from what is foreseen in the design drawings
Poor detailing which do not comply with the design drawings
Inferior material quality and improper mix-design
Changes in structural system by adding/removing components
Reducing quantity of steel from what is required and shown in the design
Poor construction practice
June 14-15, 2012 6
Turkish Earthquake CodeTurkish Earthquake Code--20072007
Following 1999 Kocaeli Earthquake, many strengthening and retrofit of damaged buildings are carried out without any fundamentaldocument.
TEC-2007 includes a chapter for performance evaluation and seismic retrofit of existing structures adapted from FEMA-356.

June 14-15, 2012 7
Seismic Retrofit in TurkeySeismic Retrofit in Turkey-- Current Stage Current Stage Public Buildings: Hospitals, School and other public
buildings
Urban development –Urban transformation law in order to minimize potential earthquake losses.
June 14-15, 2012 8
Evaluation of a Typical Public BuildingEvaluation of a Typical Public Building Seismic Evaluation Steps
Building properties: geometry and element size
Material properties: concrete strength and steel properties, soil properties
RC element properties; amount of longitudinal and lateral reinforcement
Existing damage state
Laboratory work to determine concrete strength and soilproperties
Modeling of building
Performance assessment

June 14-15, 2012 9
Evaluation of a Typical Public BuildingEvaluation of a Typical Public Building Seismic Performance Evaluation
Whether the buildings satisfy performance objectives?
Seismic retrofit and strengthening required, economical / not economical, demolish and reconstruct.
June 14-15, 2012 10
TypicalTypical SchoolSchool BuildingBuilding
June 14-15, 2012 11
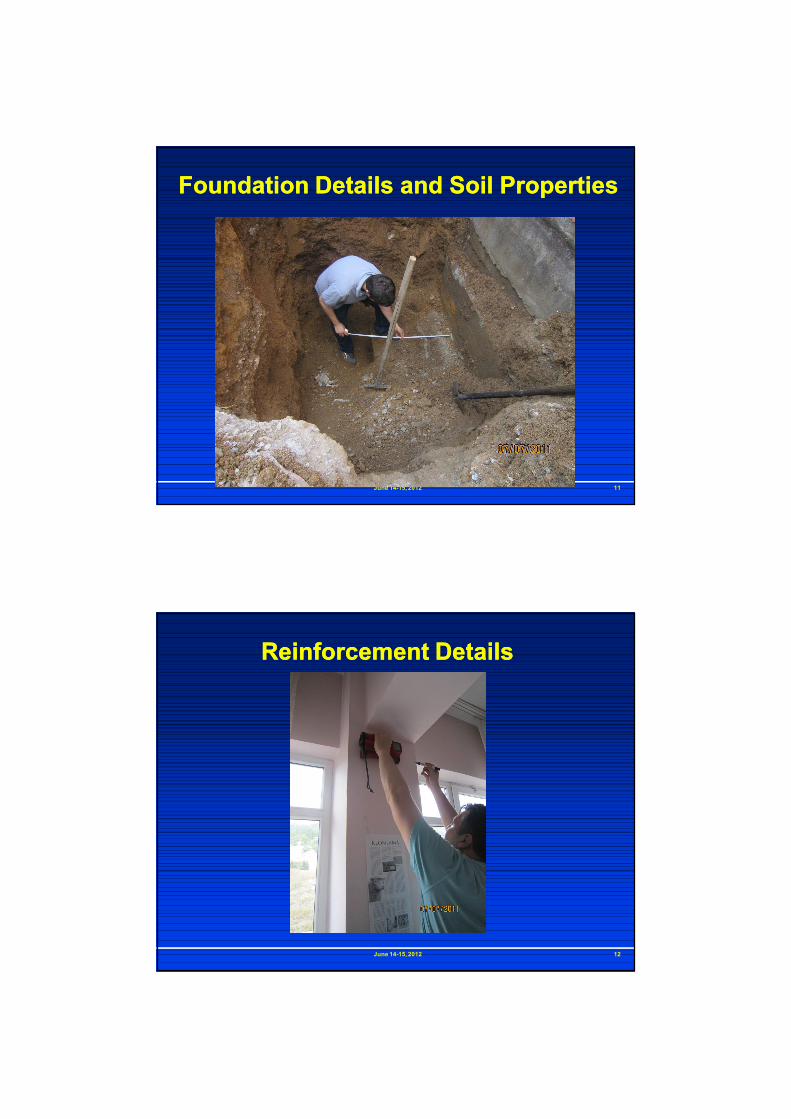
Foundation Details and Soil PropertiesFoundation Details and Soil Properties
June 14-15, 2012 12
Reinforcement DetailsReinforcement Details
June 14-15, 2012 13
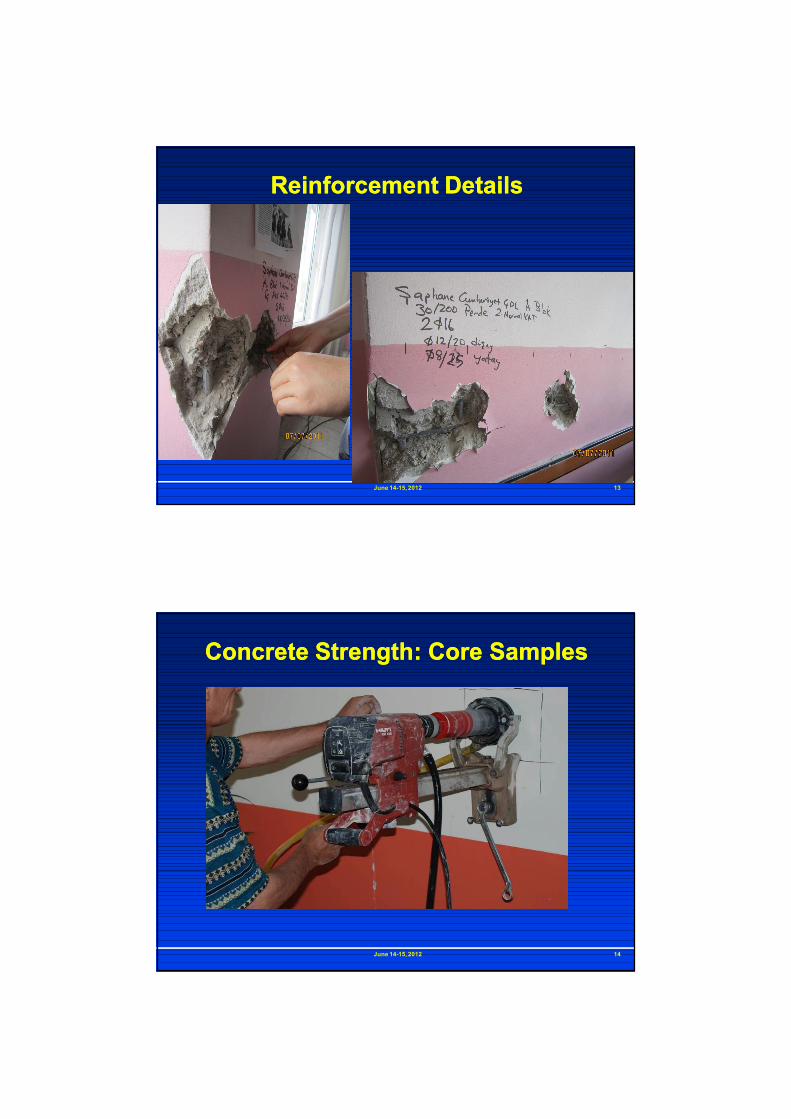
Reinforcement DetailsReinforcement Details
June 14-15, 2012 14
Concrete StrengthConcrete Strength: : Core SamplesCore Samples

June 14-15, 2012 15
FinishingFinishing--ReparingReparing MortarMortar
June 14-15, 2012 16
Laboratory Testing of Core SamplesLaboratory Testing of Core Samples

June 14-15, 2012 17
ModellingModelling
June 14-15, 2012 18
Story Plan ViewStory Plan View
FRP

June 14-15, 2012 19
Performance EvaluationPerformance Evaluation
Deformation
Forc
e
A
B
C
D E
IO LS CP
June 14-15, 2012 20
Performance EvaluationPerformance EvaluationPerformance Level
Performance Criteria
Immediate Occupancy (IO)
1.There shall not be any column or shear walls beyond IO level. 2.The ratio of beams in IO-LS region shall not exceed 10% in any story. 3.There shall not be any beams beyond LS.4.Story drift ratio shall not exceed 0.8% in any story.
Life Safety (LS)
1.In any story, the shear carried by columns or shear walls in LS-CP region shall not exceed 20% of story shear. This ratio can be taken as 40% for roof story. 2.In any story, the shear carried by columns or shear walls yielded at both ends shall not exceed 30% of story shear. 3.The ratio of beams in LS-CP region shall not exceed 20% in any story.4.Story drift ratio shall not exceed 2% in any story.
Collapse Prevention (CP)
1.In any story, the shear carried by columns or shear walls beyond CP region shall not exceed 20% of story shear. This ratio can be taken as 40% for roof story.2.In any story, the shear carried by columns or shear walls yielded at both ends shall not exceed 30% of story shear.3.The ratio of beams beyond CP region shall not exceed 20% in any story. 4.Story drift ratio shall not exceed 3% in any story.

June 14-15, 2012 21
June 14-15, 2012 22
Concrete Strength in Existing Public BuildingConcrete Strength in Existing Public Building
Core samples taken from public buildings (schools, hospitals, etc) to evaluate concrete strength in existing building stock
Prepared for testing and subjected to uniaxialcompression in laboratory
Results converted into compressive strength of standard cylinder (150x300 mm)
1684 core samples tested from 168 buildings
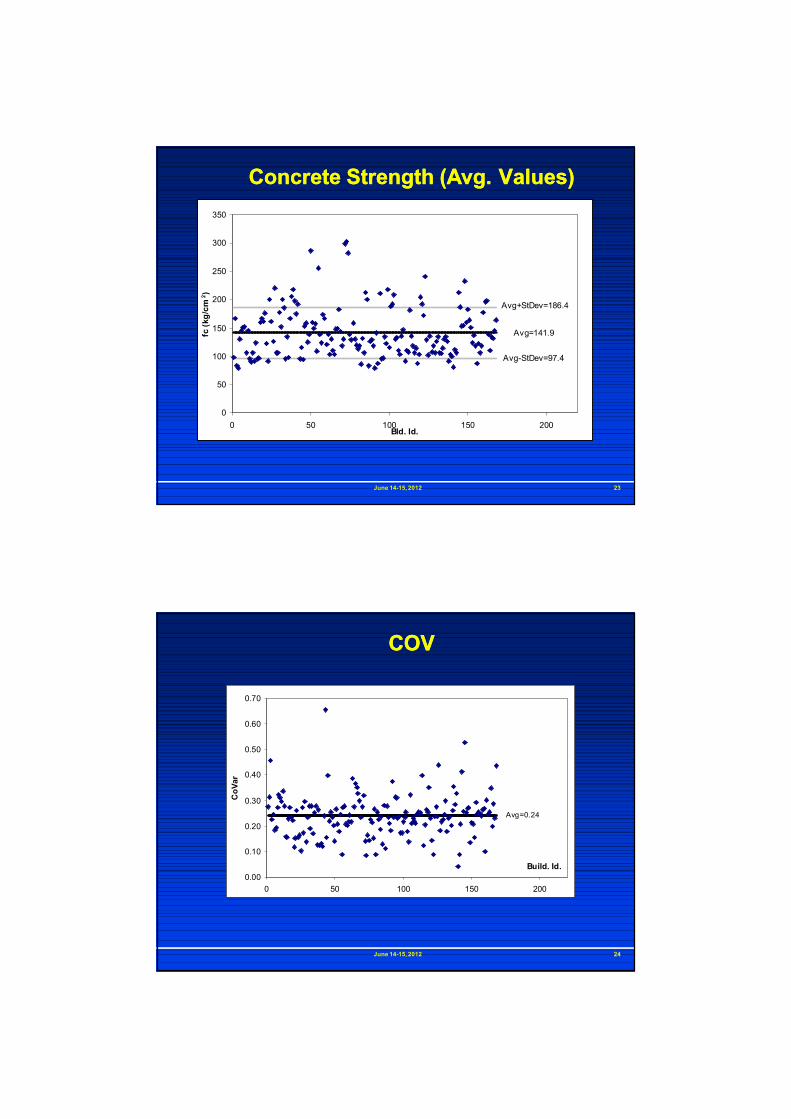
June 14-15, 2012 23
Concrete Strength (AvgConcrete Strength (Avg.. Values)Values)
Avg=141.9
Avg-StDev=97.4
Avg+StDev=186.4
0
50
100
150
200
250
300
350
0 50 100 150 200Bld. Id.
fc (k
g/cm
2 )
June 14-15, 2012 24
COVCOV
Avg=0.24
0.00
0.10
0.20
0.30
0.40
0.50
0.60
0.70
0 50 100 150 200
Build. Id.
CoV
ar

June 14-15, 2012 25
Date of ConstructionDate of Construction
0
50
100
150
200
250
300
350
1930 1950 1970 1990 2010
Date Of Construction
fc (k
g/cm
2 )
163.0 122.5167.4
194.9
131.2
151.0
94.0
222.9
111.9
0
50
100
150
200
250
300
350
1930 1950 1970 1990 2010
Date Of Construction
fc (k
g/cm
2 )
June 14-15, 2012 26
STATISTICSSTATISTICS
29024520015511065
20
15
10
5
0
fc
Perc
ent
Loc 4.908Scale 0.3064N 168
Lognormal fc (All Buildings)
400
300
200
150
1009080706050
99.9
99
9590
80706050403020
105
1
0.1
fc* (A1&A2&A3)
Perc
ent
Loc 4.908Scale 0.3064N 168AD 0.808P-Value >0.250
Normality Check for fc distribution (All Buildings)Lognormal - 95% Confidence Interval
0.010
0.008
0.006
0.004
0.002
0.000
fc
Den
sity
91.4
0.9
Lognormal, Loc=4.9083, Scale=0.3064, Thresh=0Distribution Plot of fc (All Buildings)

June 14-15, 2012 27
STATISTICSSTATISTICS
2402101801501209060
25
20
15
10
5
0
fc
Perc
ent
Loc 4.782Scale 0.2297N 93
Lognormal fc (1970<Buildings<1990)
24021018015012090
40
30
20
10
0
fc
Perc
ent
Loc 5.075Scale 0.1934N 24
Lognormal fc (Buildings<1970)
300250200150100
25
20
15
10
5
0
fc
Perc
ent
Loc 5.068Scale 0.3228N 51
Lognormal fc (Buildings>1990)
June 14-15, 2012 28
Concrete Strength in Existing BuildingConcrete Strength in Existing Building
After May 19, 2011 Simav Earthquake, buildingswith moderate damage are investigated
Core samples taken from 148 buildings withmoderate damage
Prepared for testing and subjected to uniaxialcompression in laboratory
Results converted into compressive strength of standard cylinder (150x300 mm)
About 1600 core samples tested from 148 buildings
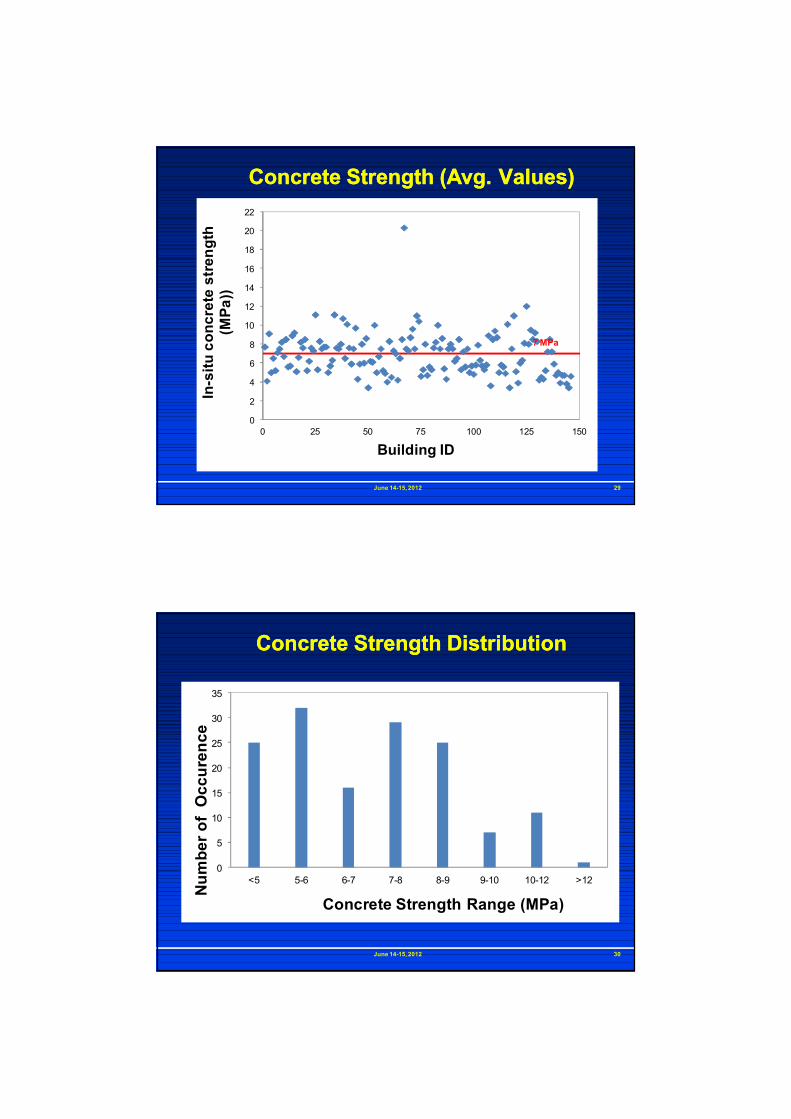
June 14-15, 2012 29
Concrete Strength (AvgConcrete Strength (Avg.. Values)Values)
0
2
4
6
8
10
12
14
16
18
20
22
0 25 50 75 100 125 150
In-s
itu c
oncr
ete
stre
ngth
(M
Pa))
Building ID
7 MPa
June 14-15, 2012 30
Concrete Strength Concrete Strength DistributionDistribution
0
5
10
15
20
25
30
35
<5 5-6 6-7 7-8 8-9 9-10 10-12 >12
Num
ber o
f O
ccur
ence
Concrete Strength Range (MPa)