Vocabulary Random Variable- A random variable assumes any of several different values as a result of...
27
-
Upload
angel-marshall -
Category
Documents
-
view
225 -
download
0
Transcript of Vocabulary Random Variable- A random variable assumes any of several different values as a result of...


Vocabulary
Random Variable- A random variable assumes any of several different values as a result of some random event. Random variables are denoted by a capital letter such as X.
Discrete Random Variable- A random variable that can take one of finite number of distinct outcomes is called a discrete random variable.
Continuous Random Variable- A random variable that can take any numeric value within a range of values. The range my be infinite or bounded at either or both ends
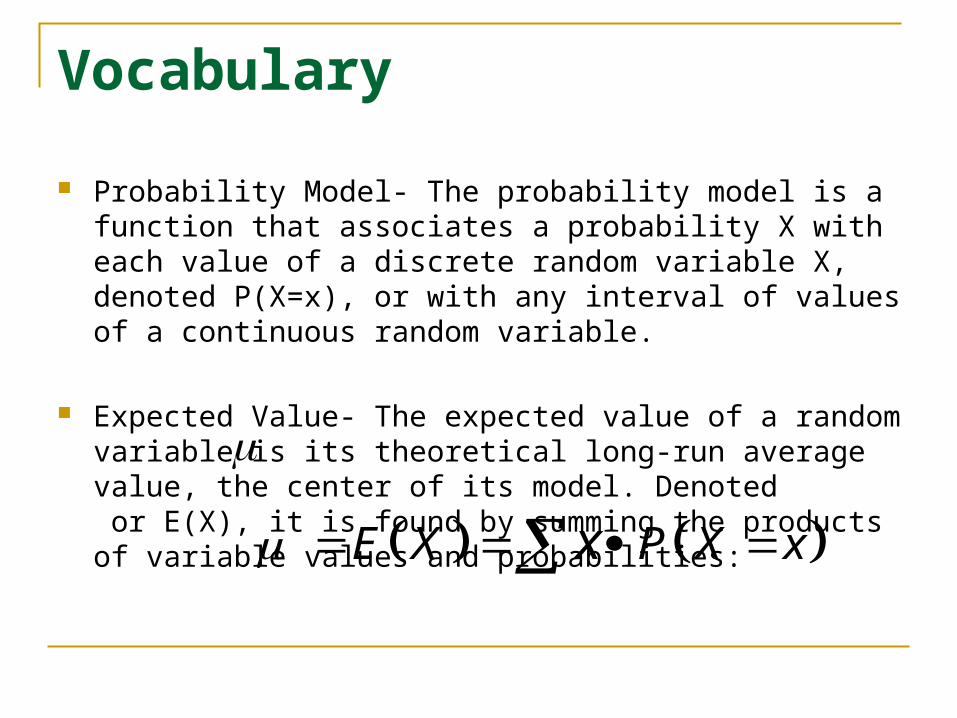
Vocabulary Probability Model- The probability model is a function that
associates a probability X with each value of a discrete random variable X, denoted P(X=x), or with any interval of values of a continuous random variable.
Expected Value- The expected value of a random variable is its theoretical long-run average value, the center of its model. Denoted or E(X), it is found by summing the products of variable values and probabilities:
E X P X xx

Vocabulary
Standard deviation- The standard deviation of a random variable describes the spread in the model, and is the square root of the variance
22 Var X x P X x SD X Var X

Expected Value: Center
Multiply each value by the probability that it occurs and find the sum.
X, Y and Z are the most common random
variables. The expected value (the mean) of a random
variable is written or
E X P X xx
E X

Real World Problem
An insurance company offers a “death and disability” policy that pays $10,000 when you die or $5,000 if you are permanently disabled.
You pay a premium of only $50 a year. Is the company likely to make a profit selling
such a plan?

State The Variables
The amount the company pays out on an individual policy is .
The particular value that it can have will be $10,000 (if you die) $5,000 (if you are disabled) $0 (if neither occurs)
Xx
x x x

Make A Chart
Imagine the company insures 1,000 people.
Imagine 1 policyholder dies, 2 are disabled and the remaining 997 survive.
Policyholder outcome
Payout (x)
Probability P(X=x)
DEATH 10,000 1/1000
DISABILITY 5,000 2/1000
NEITHER 0 997/1000

Show The Work
The company pays out $20 per policy
The company makes a profit of $30 per customer.
$10,000 1/1000 $5,000 2 /1000 $0 997 /1000
$20
E X
Income= Price of policy - Payout
$50 $20
$30
I

Spread
Because the company must anticipate variability, it need to know the standard deviation of the random variable.
Policyholder outcome
Payout (x) Probability P(X=x)
Deviation
DEATH 10,000 1/1000 (10,000-20) =9980
DISABILITY 5,000 2/1000 (5,000-20) =4980
NEITHER 0 997/1000 (0-20)=-20

Show The Work Now Square each deviation and multiply by the appropriate
probability to find the variance.
Now take the square root of the variance to get the standard deviation.
The company can expect an average payout of $20 per policy with a standard deviation of $386.78.
22 2Var X 9980 1/1000 4980 2 /1000 20 997 /1000
149,600
SD X 149,600
$386.78
Facts
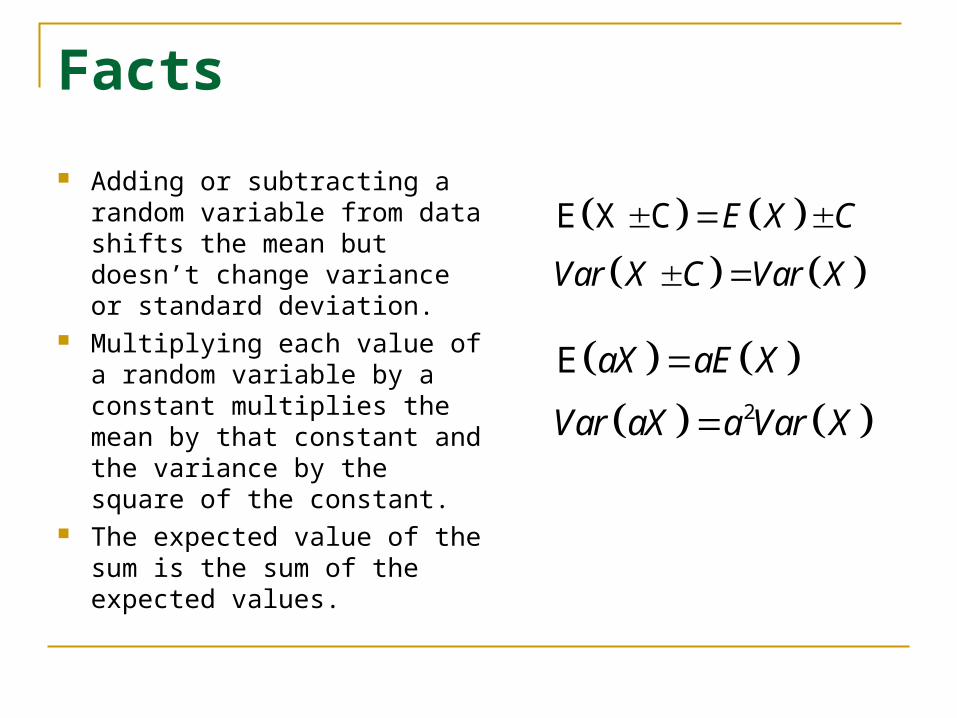
Adding or subtracting a random variable from data shifts the mean but doesn’t change variance or standard deviation.
Multiplying each value of a random variable by a constant multiplies the mean by that constant and the variance by the square of the constant.
The expected value of the sum is the sum of the expected values.
E X C E X C
Var X C Var X
2
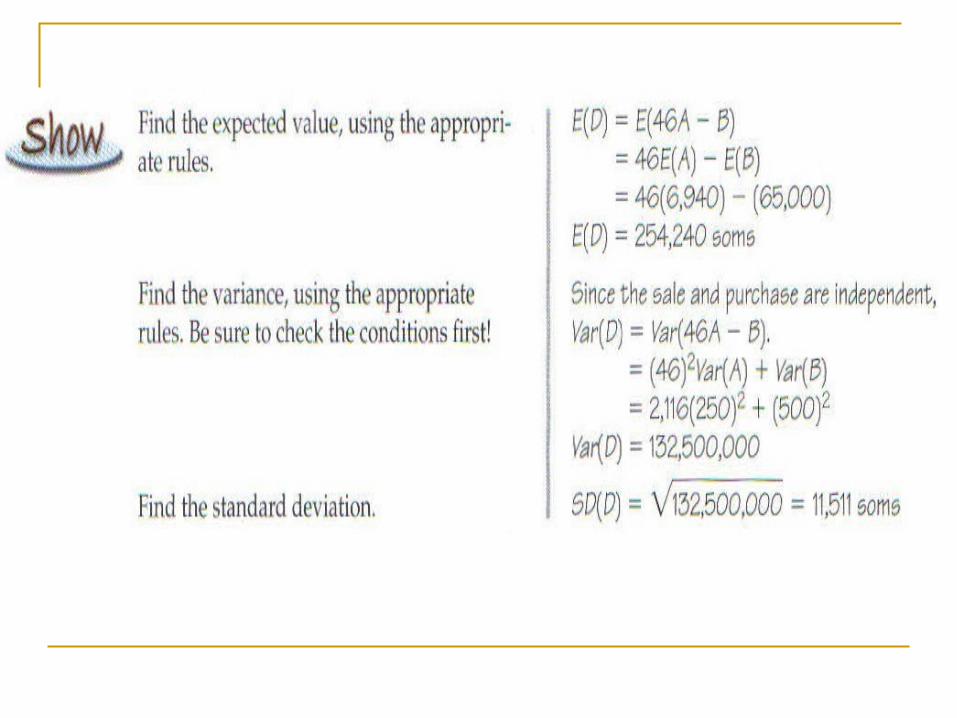
E aX aE X
Var aX a Var X
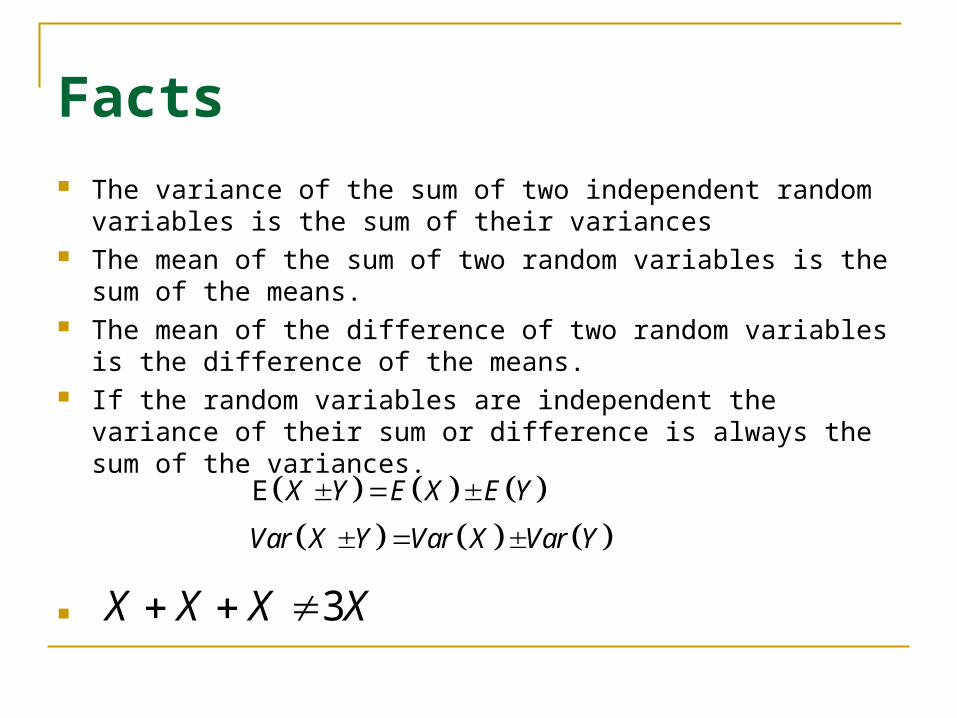
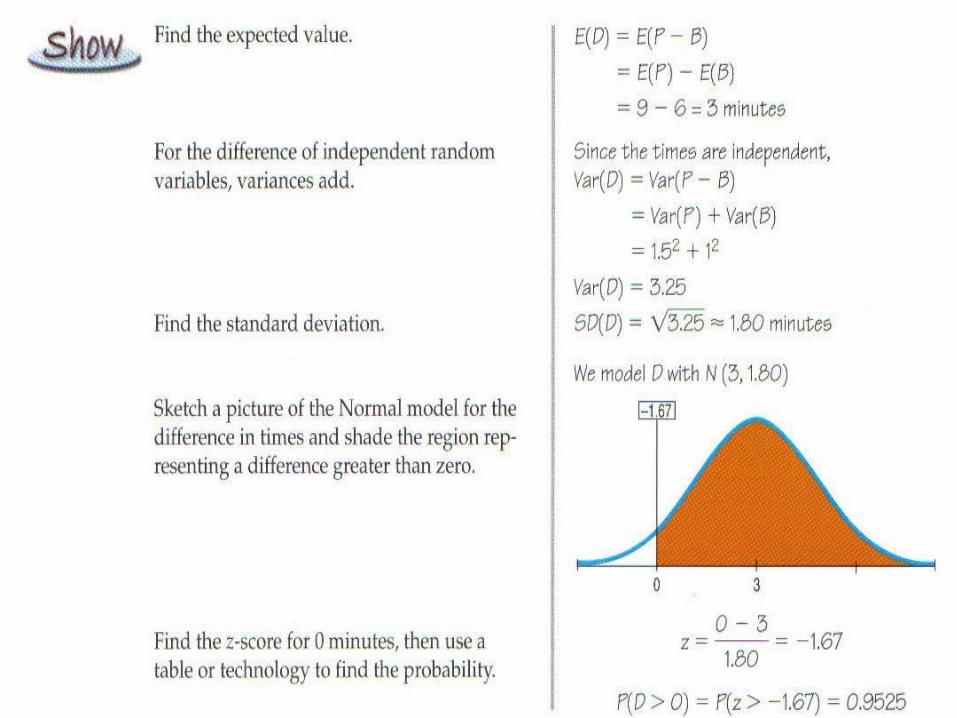
Facts The variance of the sum of two independent random variables is
the sum of their variances The mean of the sum of two random variables is the sum of the
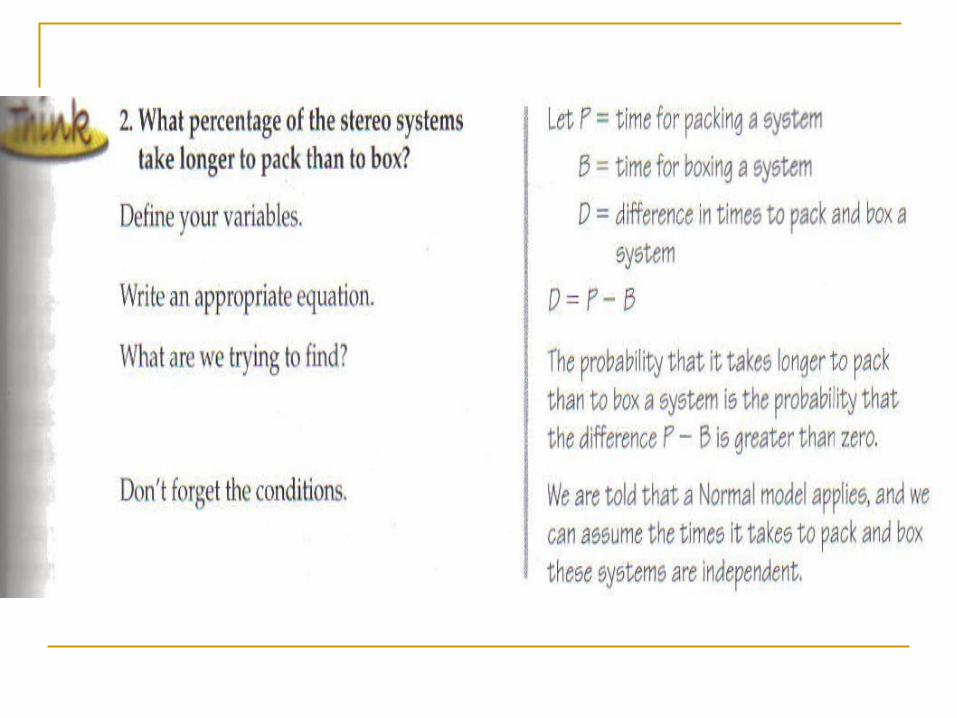
means. The mean of the difference of two random variables is the
difference of the means. If the random variables are independent the variance of their
sum or difference is always the sum of the variances.
E X Y E X E Y
Var X Y Var X Var Y
3X X X X
What Can Go Wrong? Probability models are still just models.
Question probabilities as you would data. If the model is wrong, so is everything else.
Make sure the probability adds up to 1. Watch out for variables that aren’t
independent. Variances of independent random variables
add. Standard deviations don’t.

What Can Go Wrong?
Variances of independent random variables add, even when you’re looking at the difference between them.
Don’t write independent instances of a random variable with notation that looks like they are the same variable instead of
1 2 3X X X X X X

Formulas
Expected Value
Variance
Standard Deviation
E X x P X x 22 Var X x P X x
SD X Var X SD X Var X