Vocabulary Learning and Instruction - About VLI
86
Vocabulary Learning and Instruction Volume 2, Number 1, September 2013 doi: http://dx.doi.org/10.7820/vli.v02.1.2187-2759
Transcript of Vocabulary Learning and Instruction - About VLI

Vocabulary Learning and Instruction
Volume 2, Number 1,
September 2013
doi: http://dx.doi.org/10.7820/vli.v02.1.2187-2759

VLI Editorial Team
Editor: Raymond Stubbe
Editorial Board: Jeffrey Stewart, Luke Fryer, Charles J. Anderson, Aaron Gibson,Peter Carter
Reviewers: John A. Read, John P. Racine, Ishii Tomoko, Tim Stoeckel, Dale Brown
Copy Editors: Alex Cameron, Tim Pritchard, Andrew Thompson, Alonzo Williams
The Editorial Team expresses a sincere thank you to Mana Ikawa, who designed thecover for the print version of VLI.
Copyright # 2013 Vocabulary Learning and Instruction, ISSN: Online 2187-2759;Print 2187-2767. All articles are copyrighted by their respective authors.

Vocabulary Learning and Instruction
Volume 2, Number 1, September 2013doi: http://dx.doi.org/10.7820/vli.v02.1.2187-2759
Full Issue PDF (print version)
Table of Contents
Article Page
Letter from the Editor
Raymond Stubbe PDF
i
June 29, 2013 JALT Vocabulary SIG / CUE SIG Vocabulary Symposium
Vocabulary Learning Session
Re-examining Semantic Clustering: Insight from Memory ModelsTomoko Ishii Abstract N Article PDF
1
How L1 Loanwords Can Create a False Sense of Familiarity with L2 Vocabulary Meaning
and UsageMarie-Emilie Masson Abstract N Article PDF
8
Enhancing Self-efficacy in Vocabulary Learning: A Self-regulated Learning Approach
Atsushi Mizumoto Abstract N Article PDF
15
A Comparison of Lexical Feedback on Writing From Peers and a Teacher
Rachael Ruegg Abstract N Article PDF
25
Commentary on Four Studies for JALT Vocabulary SIG
Paul Nation Abstract N Article PDF
32
June 29, 2013 JALT Vocabulary SIG / CUE SIG Vocabulary Symposium
Vocabulary Assessment Session
Comparing Regression versus Correction Formula Predictions of Passive Recall Test Scores
from Yes-No Test Results
Raymond Stubbe Abstract N Article PDF
39
Sources of Differential Item Functioning Between Korean and Japanese Examinees on a
Second Language Vocabulary Test
Tim Stoeckel & Phil Bennett Abstract N Article PDF
47
Difficulties in Reading English Words: How Do Japanese Learners Perform on a Test of
Phonological Deficit?
David Coulson, Mayumi Ariiso, Rina Kojima, & Masami Tanaka Abstract N Article PDF
56
Validating a Pictorial Vocabulary Size Test via the 3PL-IRT Model
Wen-Ta Tseng Abstract N Article PDF
64
Second Language Vocabulary Assessment Research: Issues and Challenges
Yo In’nami Abstract N Article PDF
74
Copyright # 2013 Vocabulary Learning and Instruction, ISSN: Online 2187-2759; Print 2187-2767.Articles are copyrighted by their respective authors.

Letter from the Editor
Dear readers,
It is my great pleasure to present to you the second edition of Vocabulary
Learning and Instruction. Similar to our inaugural issue last year, this editionfeatures articles from the 2013 JALT Vocab SIG Vocabulary Symposium, held at
Kyushu Sangyo University in Fukuoka on July 2nd.
In these pages you will find commentaries by the two discussants: Paul
Nation in the morning session and Yo In’nami in the afternoon session, as well as
papers written by each of the eight presenters. The morning session of this
symposium focused on qualitative research by exploring the following themes: re-
examining semantic clustering; loanword usage difficulties; self-efficacy in vocabu-
lary learning; and comparison of lexical feedback on student writing. The
afternoon session focused on quantitative research and included studies on:
regression versus correction formula predictions; sources of differential itemfunctioning; difficulties in reading English words; and validating a pictorial
vocabulary size test.
As a reminder, submissions for publication in VLI are welcome at any time. Check
out the VLI website for details: http://www.vli-journal.org/index.html.
On behalf of the Editorial Team, I truly hope you enjoy these articles as much as we
have enjoyed preparing them.
Raymond Stubbe,
Editor, VLI
Vocabulary Learning and Instruction
Volume 2, Issue 1, September 2013
http://vli-journal.org
Vocabulary Learning and Instruction, 2 (1), i.

Reexamining Semantic Clustering: Insight fromMemory Models
Tomoko IshiiSeikei University
doi: http://dx.doi.org/10.7820/vli.v02.1.ishii
Abstract
It has been repeatedly argued that semantically related words should not
be learned together because learning is impeded. However, the results of
past studies are not uniform, some providing favorable results for
semantic clustering, and some seem to suggest different types of similarity
affect memory in different ways. The types of similarity that truly cause
the problem therefore need to be examined more carefully. Focusing on
visual features, which are commonly observed across different models of
working memory, a study was conducted to examine if learners have
difficulty memorizing a group of words that describe items with common
physical features. The study compared the learning of three types of word
sets: unrelated, semantically related, and physically related. While no
statistically significant difference was observed between semantically
related and unrelated sets, the scores for physically related sets were
significantly lower than those for the other two types. This suggests the
possibility that the impeding effect of semantic clustering reported in the
past could be partly due to the precise nature of semantically similar
words, which sometimes share visual features.
1 Background and aim
Among researchers of second language vocabulary learning, semantic
clustering is often considered something to be avoided. This issue has long been
investigated, with studies dating back to at least 50 years ago (Higa, 1963).
Tinkham’s (1993) was likely the study that drew the serious attention of researchers
to the problem of semantically related words, with replicational studies by himself
(Tinkham, 1997) and Waring (1997). They suggest that if words that fall into the
same semantic field such as ‘‘fruits’’ (apple, orange, and pear) or ‘‘furniture’’ (table,
chair, and bed) are learned at the same time, learning is impeded because of
confusion stemming from semantic overlap. Following such research, the negative
impact of semantic clustering is sometimes treated almost as if it were an
established fact to the extent that the idea that grouping semantically similar
words is advantageous for learning has been called a myth (Folse, 2004). However,
the results of more recent research on this issue are not entirely uniform; Erten and
Tekin (2008) report on the negative effect of semantic clustering, whereas
Papathanasiou (2009) and Davies (2012) suggest mixed results, and Hashemi and
Gowdasiaei (2005) present support for semantic clustering.
Examining this line of research, Nation and Webb (2011) point out that the
effect of semantic clustering has been mostly investigated under strict experimental
Vocabulary Learning and Instruction
Volume 2, Issue 1, September 2013
http://vli-journal.org
Please cite this article as: Ishii, T. (2013). Reexamining semantic clustering: Insight from memory
models. Vocabulary Learning and Instruction, 2 (1), 1�7. doi: 10.7820/vli.v02.1.ishii

conditions. In most studies, for instance, the learners memorized words withconsiderable time restrictions, and the target words were presented in isolation, not
in a sentence. This concern is strengthened when Hashemi and Gowdasiaei (2005,
where the participants learned the words in an actual classroom setting) present
favorable results for learning words in semantic sets.
Another void in the research on this issue is the lack of serious discussion on
what is really causing the confusion. As a background to research in this area,
researchers refer to ‘‘Interference Theory’’, which states that when the items to be
learned have too many elements in common, the items interfere with each other and
learning is impeded. However, what it means to be semantically similar is rarely
discussed. Words can be connected semantically in different ways. Some aresynonymous, some are in hyper- and sub-ordinate relationships. Even if the nature
of the relationship is the same, there are different degrees of similarity. For instance,
among coordinates of ‘‘musical instruments’’, many people would probably
recognize piano as being closer to organ than to cymbals. It is unreasonable to
assume that different types and degrees of similarity affect vocabulary learning in
the same manner. Tinkham (1997) suggests that while ‘‘semantic clustering’’ in
which the words are all from the same parts of speech has a negative impact,
‘‘thematic clustering’’, which includes words along one theme such as ‘‘frog’’ (frog,hop, slimy, pond, croak, and green) and the words are from different parts of speech,
has facilitative effects. Although different labels are given to these two groupings,
they are in effect both semantically connected and what Tinkham (1997) really
shows is that different types of semantic relationship affect memory in different
ways. More consideration on which type of similarity has a greater impact on
learning is therefore necessary.
The study presented in this paper was designed as an attempt to reexamine
the problem underlying semantic sets, with insight from theories of memory.
Review of different models of working memory reveals that visual images are
considered to be very important in memory research. The current study wasconducted under the hypothesis that visual images play such an important role in
human memory that they may be the central problem in learning semantically
related words. The following sections will briefly review various models of working
memory, followed by the report of the study.
2 Importance of image in memory
In the field of psychology, various models of memory have been suggested.
Examining each model is well beyond the scope of this paper, but there is one
commonality to the different models, which can be a clue to understanding the
issue of semantic clustering. The common feature seen across various models ofworking memory, the first system the information goes through when it is being
processed, is that they all have some form of visual component. For instance, an
early model proposed by Baddely and Hitch (1974) has two initial components: the
Phonological Loop, which processes sound, and the Visuo-Spatial Sketchpad,
which deals with visual images. These types of information are then fed into the
Central Executive, where the information is synthesized and committed to memory.
When attempting to memorize something, sound and visual information are
2 Ishii: Reexamining Semantic Clustering
Vocabulary Learning and Instruction, 2 (1), 1�7.

rehearsed in their respective components. Logie’s (1995) model has a similar
structure, with the Executive Functions, the Phonological Store, and the Visual
Cache, all of which interact with the Knowledge Base. A more recent model, by
Baddely (2000), adds the Episodic Buffer, but the Visuo-Spatial Sketchpad and the
Phonological Loop still are part of his model, and the visual component remains
one of the key factors in information processing.
The importance of visual image in theories of memory gives us a new
perspective on research on semantic clustering. Tinkham (1997), for example,
employed metal names (tin, bronze, iron, brass, lead, and steel) for one of his
semantic sets, which are very difficult to differentiate visually. This is certainly an
extreme case, but a fruit often has a round shape and clothes such as jacket, shirt,
and coat share some physical similarity. It is not uncommon for semantically
grouped words to have a similar visual image in people’s mind, and this could
possibly be the reason why the field has repeatedly observed the negative impact of
semantic clustering. In the literature of second-language vocabulary learning,
confusion between words that are similar in form, and therefore sound, has been
reported (Pigada & Schmitt, 2006). This confusion is understandable as phonology
is considered to be important in many models of memory. It is then quite
reasonable to hypothesize that words describing visually similar items might also
cause confusion, with interference occurring within a visual component.
Given the importance attributed to imagery in information processing, as well
as its possible connection to semantic clustering, an experiment was designed to see
if the words for the items sharing visual features cause confusion when learned
together.
3 Study
This study was designed under the following research question: ‘‘Does
grouping semantically unrelated but physically related words have a negative
impact on memory?’’ Three intact groups at a university in Tokyo were selected for
data collection, and 64 Japanese students in either their first or second year were
involved. The participants learned nonwords paired with a Japanese meaning for
three different categories: ‘‘Unrelated’’, ‘‘Semantically related’’, and ‘‘Physically
related.’’ Table 1 shows the nature of each category as well as the Japanese
meanings used in the study.
Each of the three above categories had three sets of six pairs, totaling 18 pairs
per category, for a total number of 54 pairs to be learned. To each Japanese
meaning, a nonword generated using a program named Wuggy (Keuleers &
Brysbaert, 2010) was allocated. The participants looked at six pairs displayed on a
computer screen for 45 seconds and were tested on their memory immediately after
this learning session (Test 1). This test asked the participants to write the Japanese
meaning of each nonword. Repeating this cycle of learning and testing sessions nine
times, they learned all 54 pairs and were tested on how much they could memorize.
These sets were presented randomly in order to minimize the effect of order on
participants’ memory.
Ishii: Reexamining Semantic Clustering 3
Vocabulary Learning and Instruction, 2 (1), 1�7.

The participants worked on actual class activities unrelated to this study for
20 minutes and were then asked once again to write Japanese meanings for thenonwords learned earlier (Test 2). This time, all the nonwords were presented to the
participants in an alphabetical order.
4 Results
Across all three categories, the participants memorized a large number of
pairs in 45 second learning sessions (Table 2), but retention was fragile and greatly
decayed with only 20 minutes of distraction (Table 3).
A repeated measures ANOVA assuming sphericity determined that mean
scores for Test 1 differed statistically significantly between categories (F(2, 126) �11.986, pB0.001). Post hoc tests using the Bonferroni correction revealed that the
Table 1. Nature of Categories and Japanese Meanings Prepared for the Study
Category Nature Japanese meanings
Unrelated There is no obvious link
among the words in this
group
1) Rat, cherry, clip, lotus, spoon,
and mountain
2) Elephant, banana, tape, bur-
dock, kettle, and stone
3) Rabbit, pear, scissors, cabbage,
cup, and forest
Semantically
related
The words fall into one
semantic field: animals,
vegetables, and kitchen
utensils. The words were
selected so that they would
have little visual similarity
1) Chicken, pig, giraffe, monkey,
snake, and whale
2) Japanese radish, cucumber,
spinach, okra, tomato, and egg
plant
3) Pan, knife, cutting board, fork,
strainer, and ladle
Physically related The words describe the
objects that share physical
features: being round, being
thin and long, and being
rectangular
1) Globe, watermelon, ball, pearl,
candy, and marble
2) Pencil, fishing pole, chopsticks,
straw, rope, and shoe laces
3) Pass card, playing card, student
card, business card, post card,
and poster
Table 2. Results of Test 1 (N�64, possible max.�18)
Max. Min. Mean SD Std. error
Unrelated 18 1 13.42 3.93 0.49
Semantic 18 3 14.00 3.89 0.49
Physical 18 0 12.30 4.16 0.52
Table 3. Results of Test 2 (N �64, Possible max �18)
Max. Min. Mean SD Std. error
Unrelated 15 0 5.06 3.58 0.45
Semantic 16 0 5.59 3.91 0.49
Physical 16 0 4.02 3.50 0.44
4 Ishii: Reexamining Semantic Clustering
Vocabulary Learning and Instruction, 2 (1), 1�7.

difference in means between the unrelated and semantic sets was not statisticallysignificant (p�0.273), whereas the mean score of the physically related sets was
significantly lower than the other two categories (p �0.018 against the unrelated
sets and p B0.001 against the semantic sets). Likewise, a statistically significant
difference was confirmed for Test 2 (F(2, 126) �12.069, pB0.001). While post hoc
analysis did not show any significant difference between the unrelated and semantic
sets (p �0.336), the physical sets were again shown to have a significantly lower
mean than the other two categories (p �0.007 against the unrelated sets, and pB
0.001 against the semantically similar sets). Partial eta-squared for these analyseswere 0.306 for Test 1 and 0.286 for Test 2.
In addition to the mean scores, it is worth noting the frequency of cases whereparticipants confused words from the same set. For instance, in Test 2, several
participants answered ‘‘pass card (teiki-ken)’’ when the correct answer would be
‘‘student card (gakusei-sho)’’. Those two words were presented together in the
learning session, and such cases indicate confusion in memory across word pairs
they tried to memorize at the same time. Among unrelated sets, there was only one
such case, while semantically related sets had 13 cases. In contrast, physically
related sets observed as many as 36 cases of such confusion. The number of
occurrences being limited as a whole, it was not possible to run a statistical analysison this, but the difference is considerable. It should be noted however that there
were 33 participants who did not show any confusion in any of the conditions.
Most of these participants scored very low in Test 1, meaning they remembered few
words and so there were fewer opportunities for confusion. However, two
participants were able to recall over 40 out of 54 words after 20 minutes of
distraction with no instances of confusion. There was thus a large degree of
individual difference in the occurrence of such confusion.
5 Discussion and conclusions
The results presented above suggest that it is harder to learn physically related
words at the same time than learning unrelated or semantically related words,
although variation among individuals needs to be recognized. The difficulty may
stem from the confusion generated by processing similar visual images of items
described by the words, as the visual component is considered important in theories
of working memory. This study did not observe any advantage or disadvantage of
the semantic sets that avoided visual similarity of the items described, whichsuggests that the impeding effect of such clustering reported in the past could be
explained partly by the nature of semantically related words, in that they sometimes
share visual features.
It should be noted, however, that the results presented in this paper could
possibly be an artifact of the selection of Japanese concepts as well as that of
nonwords. It is hard to argue against the critique that what is considered as visual
similarity is determined by the rather subjective judgment of the author.
Furthermore, this study was conducted under an experimental setting, not in
actual classrooms, and does not examine any long-term effect. It is therefore
necessary that the research be replicated with different meanings and nonwords, aswell as in different contexts.
Ishii: Reexamining Semantic Clustering 5
Vocabulary Learning and Instruction, 2 (1), 1�7.

Visual similarity is an aspect of memory that has not been well addressed inthe literature of semantic clustering. In this small-scale study the negative impact of
visually related but semantically unrelated sets were observed, while similar effects
for semantically related but visually unrelated sets was not observed. These results
question the often-cited source of difficulty in learning semantically grouped words.
With further study employing different word meanings, as well as different types of
visual features, the real source of confusion caused by semantic clustering could be
further clarified.
References
Baddely, A.D. (2000). The episodic buffer: A new component of working memory?
Trends in Cognitive Sciences, 4 (11), 417�423. doi:10.1016/S1364-6613(00)
01538-2
Baddely, A.D., & Hitch, G.J. (1974). Working memory. In G.A. Bower (Ed.),
Recent advances in learning and motivation (Vol. 8, pp. 47�89). New York:
Academic Press.
Davies, M.J. (2012). A comparison of the memorization and recall of vocabulary in
semantic and thematic groups. Vocabulary Education & Research Bulletin, 1
(1), 3�4. http://jaltvocab.weebly.com/uploads/3/3/4/0/3340830/verb-vol1.1.pdf
Erten, I.H., & Tekin, M. (2008). Effects on vocabulary acquisition of presenting
new words in semantic sets versus semantically-unrelated sets. System, 36 (3),
407�422. doi:10.1016/j.system.2008.02.005
Folse, K.S. (2004). Vocabulary myths. Michigan: The University of Michigan Press.
Hashemi, M.R., & Gowdasiaei, F. (2005). An attribute-treatment interaction study:
Lexical-set versus semantically-unrelated vocabulary instruction. RELC
Journal, 36 (3), 341�361. doi:10.1177/0033688205060054
Higa, M. (1963). Interference effects of intralist word relationships in verbal
learning. Journal of Verbal Learning and Verbal Behavior, 2, 170�175. doi:10.
1016/S0022-5371(63)80082-1
Keuleers, E., & Brysbaert, M. (2010). Wuggy: A multilingual pseudoword
generator. Behavior Research Methods, 42 (3), 627�633. doi:10.3758/BRM.42.
3.627
Logie, R.H. (1995). Visuo-spatial working memory. Hove: Lawrence Erlbaum
Associates.
Nation, I.S.P., & Webb, S. (2011). Researching and analyzing vocabulary. Boston:
Heinle Cengage Learning.
Papathanasiou, E. (2009). An investigation of ways of presenting vocabulary. ELT
Journal, 63 (2), 313�322. doi:10.1093/elt/ccp014
Pigada, M., & Schmitt, N. (2006). Vocabulary acquisition from extensive reading: A
case study. Reading in a Foreign Language, 18 (1), 1�27. Retrieved from http://
nflrc.hawaii.edu/rfl/april2006/pigada/pigada.pdf
6 Ishii: Reexamining Semantic Clustering
Vocabulary Learning and Instruction, 2 (1), 1�7.

Tinkham, T.M. (1993). The effect of semantic clustering on the learning ofsecond language vocabulary. System, 21, 371�380. doi:10.1016/0346-251X(93)
90027-E
Tinkham, T. (1997). The effects of semantic and thematic clustering on the learning
of second language vocabulary. Second Language Research, 13 (2), 138�163.
doi:10.1191/026765897672376469
Waring, R. (1997). The negative effects of learning words in semantic sets: A
replication. System, 25, 261�274. doi:10.1016/S0346-251X(97)00013-4
Ishii: Reexamining Semantic Clustering 7
Vocabulary Learning and Instruction, 2 (1), 1�7.

How L1 Loanwords Can Create a False Sense ofFamiliarity with L2 Vocabulary Meaning and
Usage
Marie-Emilie MassonKyushu Sangyo University
doi: http://dx.doi.org/10.7820/vli.v02.1.masson
Abstract
Almost 50% of high-frequency English (L2) words have Japanese
cognates in the form of loanwords, and depending on cognate type these
are generally considered to be an excellent way to promote vocabulary
retention. However, relatively unexplored is the impact loanword
cognates have on word usage in sentences. This paper will describe the
discrepancies between students’ perceived knowledge and actual knowl-
edge of meaning and usage of English words with Japanese cognates. The
results suggest that cognates which are usually more difficult for students
to retain, such as distant false friends (because they have undergone a
semantic shift), are not the only source of difficulty in terms of word
usage. In addition to this, it appears loanword cognates that students
consider themselves to know can create a false sense of familiarity with
L2 meaning and usage. True cognates and convergent cognates, which are
generally considered the easiest to recall meaning of, showed the most
discrepancies in terms of accurate word usage.
1 Introduction
Loanword cognates are commonly considered an excellent resource for
learning English vocabulary. A broad definition of cognates includes words across
languages that have similar forms, which may or may not have similar meanings.
Daulton (1999) suggests, Japanese loanwords with English source words can be
helpful for Japanese learners who want to increase their L2 vocabulary. In the top
3000 word families of English, at least 45.5% have some affiliation with Japanese
loanwords (Daulton, 2003). However, there has not been enough investigation into
the different types of loanword cognates and how they affect learners with regard tomeaning and usage (Daulton, 2008).
It has been acknowledged that loanwords can mislead students if the L1
definition deviates substantially from the source word in L2. But as Uchida (2001)points out, loanword cognates are often incorrectly grouped together as a single
category of ‘‘false friends,’’ when in fact the loanwords can be very different from
one another in relation to English and Japanese meanings. Daulton sums up the
situation as follows:
These studies ignore the semantic varieties such as true cognates, close/distant falsecognates and convergent/divergent cognates, key distinctions in determining the degreeof facilitation. The anecdotal condemnation of certain cognates has often led to the
Vocabulary Learning and Instruction
Volume 2, Issue 1, September 2013
http://vli-journal.org
Please cite this article as: Masson, M.-E. (2013). How L1 loanwords can create a false sense of
familiarity with L2 vocabulary meaning and usage. Vocabulary Learning and Instruction, 2 (1),
8�14. doi: 10.7820/vli.v02.1.masson

guilt by association of all. The problem is so endemic that much previous research is inneed of re-evaluation; cognates could be made to look quite difficult by including onlyfalse friends. (Daulton, 2008, p. 57)
This is problematic as false friends are only one type of loanword cognate.
Uchida (2001) argues that while some forms are more difficult to learn, others can
facilitate vocabulary retention. In Uchida’s taxonomy, there are six types of
Japanese�English cognates into which loanwords can be categorized (Figure 1).
True cognates are words that have the same meaning in L1 and L2.
Convergent cognates are words that have more meanings in L2 than in L1. For
instance, the word baiku in Japanese (from the English bike) only refers to
motorbikes, whereas bike can mean either motorbike or bicycle in English.
Divergent cognates are words that have more meanings in L1 than in L2. For
instance, handoru in Japanese (from the English handle) can refer to any kind of
handle, including bicycle handle bars and even a steering wheel. Close false friends
are words that have similar forms and meanings. For instance, shiiru in Japanese
(from the English seal) means sticker in English. Distant false friends are words
which have undergone a semantic shift: the L1 and L2 meanings are no longer the
same. For instance, sumaato in Japanese (from the English smart) means slim.
Japanized English words have no English equivalent; they are created in Japanese
from English loanwords. For instance, sukinshippu, which means physical intimacy
in Japanese, is a hybridization of the English source words skin and relationship,
but ‘‘skinship’’ does not exist in English.
This categorization has been limited to examining the comprehension of word
meaning. Still unexplored is the effect loanword cognates have on word usage. The
aims of this study are twofold. 1) To determine whether, depending on cognate type,
Figure 1. Types of Japanese�English loanword cognates and spectrum of difficulty from easiest
(not shaded) to hardest (shaded) (adapted from Uchida, 2001).
Masson: L1 Loanwords and Familiarity with L2 Usage 9
Vocabulary Learning and Instruction, 2 (1), 8�14.

loanwords create a false sense of familiarity for students for both L2 word meaningand usage; and, 2) to compare students’ self-reported knowledge of loanword
cognates with their actual knowledge.
2 Method
Three classes in a private Japanese university taught by two teachers,
including 55 first- and second-year students averaging 400 on the TOEIC† test,
participated in this study. The students were not English majors but had elected to
take part in the course.
Students completed a checklist of 30 English words. Checklists have been
shown to be a psychometrically reliable way to check word knowledge (Gibson &
Stewart, 2011). Students were asked to self-report their knowledge of word meaning
and usage by choosing between:
(1) I don’t know this word,(2) I’ve seen this word and I know one meaning,
(3) I know more than one meaning for this word and I can write a sentence using
this word.
The words were written in English with their part of speech provided in
Japanese. All the words, which had corresponding Japanese loanwords, were
randomly selected from the top 2000 spoken English words. One word, which did
not meet this criterion, was removed from the analysis, as was a second word, which
was mislabeled as a verb. The checklists contained all five types of cognates
outlined above, except Japanized English because these words do not have English
source words.
Once the checklists were completed, students made sentences with the same
items to demonstrate their knowledge of word meaning and usage. The sentenceswere marked by two teachers to determine whether meaning and usage were
demonstrated correctly in contrast to the checklists which measured students’
beliefs about word knowledge. Teachers were trained before marking the tests and
achieved an inter-rater reliability of over 80%. Words that presented a high ratio of
discrepancy were then examined more thoroughly through qualitative linguistic
analysis using Nvivo (v.10).
3 Results and discussion
As hypothesized by Uchida (2001), distant false friends created the greatest
discrepancies. Figure 2 shows that students overestimated their knowledge of word
meaning for three loanword cognates in particular: miss (n.), present (v.) and trip
(v.).
The words miss (n.), present (v.) and trip (v.) have all undergone semantic
transfer as loanwords in Japanese making them distance false friends which are
particularly problematic for students who are lulled into a false sense of familiarity,but do not notice that the meaning has changed.
10 Masson: L1 Loanwords and Familiarity with L2 Usage
Vocabulary Learning and Instruction, 2 (1), 8�14.

However, discrepancies in knowledge of word usage showed a different
picture. As indicated in Figure 3, in contrast to word meaning, true cognates and
convergent cognates, which are considered to be the easiest loanwords for Japanese
learners, were the most problematic.
Within words for which the meaning was correctly known, the widest
discrepancies were found in the close cognate holiday, and the true cognates
communication, discussion, character and sport. This is interesting, because in
regard to comprehension of L2 word meaning, true and close cognates are
considered to be the least problematic categories, and in fact are considered
beneficial for vocabulary retention.
As illustrated by Figure 2, meaning is well known for true cognates and
convergent cognates. However, Figure 3 shows convergent cognates and true
cognates are the most problematic for students in terms of usage.
Figure 2. Self-reported knowledge and actual knowledge of word meaning of checklist items.
Figure 3. Self-reported knowledge and actual knowledge of word usage of checklist items.
Masson: L1 Loanwords and Familiarity with L2 Usage 11
Vocabulary Learning and Instruction, 2 (1), 8�14.

What follows is a qualitative analysis of errors made with this convergent
cognate and these true cognates. There were two major categories where misuse was
identified: the use of collocations and word placement. The following example
sentences are transcribed as students wrote them on the productive test. They are
numbered in order of appearance.
3.1 The use of collocations
Students showed difficulty in using particles, particularly with the word
holiday. In Japanese, the loanword for holiday is mainly read in the names of
companies or clubs that want to sound exotic or progressive (as in
) or to express the idea of traveling to a foreign place
(as in ), but it is rarely used in daily conversation. Due to its
meaning, students may be applying the same connective logic to holiday as other
words used to express location, such as in New York, or static periods of time, such
as in December or in summer.
HOLIDAY (n.) 01 *My family often go to picnic in a holiday.
02 *I went shopping with my friend in holiday.
(HOLIDAY: on holidays)
An overview of the different particles used to connect adverbial phrases of
time, place, cause, consequence, among others, is one way to assist students with
mastering this type of collocation.
Students also had difficulty with verb�noun associations, particularly with
the words communication and discussion. Both of these words are commonly used
as loanwords in spoken Japanese. Their non-loanword equivalents ( and ,
respectively) carry a somewhat archaic nuance reserved for describing exchanges
in very serious formal settings. In Japanese, the noun
(komyunikeeshon) is collocated with the verb toru (to take), and the noun
(disukasshon) is collocated with the verb suru (to do).
COMMUNICATION (n.) 03 *The nurce need to study how to take communication with illness.
(COMMUNICATION: enter into communication)
DISCUSSION (n.) 04 *We did the discussion for class everyday.
05 *I must do discussion with my friend, because our homework.
(DISCUSSION: have a discussion)
Encouraging students to investigate verb�noun associations in L2, by using a
dictionary or the Internet (Park & Kinginger, 2010), will help develop their
interlanguage. Teachers can use these examples to demonstrate to students that
content words, along with their associated verbs and functions words, ought to be
learned as chunks.
12 Masson: L1 Loanwords and Familiarity with L2 Usage
Vocabulary Learning and Instruction, 2 (1), 8�14.

3.2 Word placement
Japanese is a topic-prominent language that is situation-focused (Wlodarczyk,
1996); the meaning of a sentence centers on a topic or a shared situation. The topic
is generally made explicit, whereas the subject does not need to be. English is a
subject-prominent language, meaning the sentence will be constructed around the
grammatical subject, and the topic can be inferred.
Character and sport are both true cognates commonly used in Japanese. In
both cases, the first meaning for the Japanese loanword corresponds to the first
meaning of the word in English. In sentences 06 through 11, the students have
topicalized the true cognates. With character, the word has also become the subject.
Although character can be used as a subject, the collocation has a bad character, inwhich the word character is used as an object, and is much more common in
English. With sport, the word is being made explicit as the topic of the sentence.
This results in the sentence sounding redundant as the topic of ‘‘sports’’ can be
inferred from the content of the sentence, in this case the individual sports (e.g.,
baseball, tennis, and soccer).
CHARACTER (n.) 06 *Your charactor is shy I think.
07 *His charactor is very bad so everyone don’t like him.
08 *Her charactor was very nice so she have many friends.
SPORT (n.) 09 *Which do you like sport soccer or baseball?10 *I like sport tennis, soccer, volleyball and so on.
11 *I like doing some sports baseball and tennis.
This difference in perspective when building sentences is another challenge for
Japanese students which shows that true cognates, where the first meaning of the
word corresponds in both languages, is not a guarantee that students will be able to
use the words successfully in their L2. Teachers can help students by showing them
how to separate the topic and subject of a sentence and how to infer the topic.
4. Conclusion and future directions
Research has shown that certain types of Japanese�English cognates can be
beneficial to student vocabulary acquisition, with distant false friends among the
most challenging for students and true cognates among the easiest (Uchida, 2001).However, as demonstrated in this study, the opposite pattern can be observable
with regard to word usage; although meaning is well known for true cognates and
convergent cognates, usage is poorly understood. While beneficial for learning L2
word meanings, these types of cognates can create a false sense of familiarity for
students and dissuade them from studying L2 vocabulary beyond word-to-word
meaning. As educators, it is possible that because students understand the meaning
of true and close cognates with a high degree of facilitation, we focus less
instruction on them, when in fact these words remain a challenge to students.
In future, an extensive investigation of student knowledge of loanword
meaning and usage according to cognate type is necessary to understand how eachcategory affects students’ learning. In order to assist educators with a vocabulary
Masson: L1 Loanwords and Familiarity with L2 Usage 13
Vocabulary Learning and Instruction, 2 (1), 8�14.

component to their courses, a detailed qualitative analysis of students’ writtenoutput, using various types of loanword cognates to determine the difficulty level of
each type, in terms of usage, and the kinds of challenges students face when
incorporating these words to their L2 output is needed.
References
Daulton, F.E. (1999). English loanwords in Japanese � The built-in lexicon. The
Internet TESL Journal, 5 (1). Retrieved from http://iteslj.org/Articles/Daul-
ton-Loanwords.html
Daulton, F.E. (2003). List of high frequency baseword vocabulary for Japanese
EFL students # 2. The Internet TESL Journal, 9 (3). Retrieved from http://
iteslj.org/lists/Daulton-BasewordVocab2.html
Daulton, F.E. (2008). Japan’s built-in lexicon of English-based loanwords.
Clevedon & Philadelphia, PA: Multilingual Matters.
Gibson, A., & Stewart, J. (2011). Using yes/no tests to examine the relationship
between frequency and difficulty in the vocabulary knowledge of second
language learners. Kyushu Sangyo University Language Education and
Research Center Journal, 6, 23�35.
Park, K., & Kinginger, C. (2010). Writing/thinking in real time: Digital video and
corpus query analysis. Language Learning & Technology, 14 (3), 30�49.Retrieved from http://llt.msu.edu/issues/october2010/parkkinginger.pdf
Uchida, E. (2001). The use of cognate inferencing strategies by Japanese learners ofEnglish (Ph.D. dissertation, University of Essex).
Wlodarczyk, A. (1996). La thematisation en japonais et l’article francais. InV. Koseska-Toszewa & D. Rytel-Kuc (Eds.), Semantyka a Konfrontacja
Jezykowa [Semantics and contrast between languages] (pp. 131�139),
Warszawa: PAN-SOW.
14 Masson: L1 Loanwords and Familiarity with L2 Usage
Vocabulary Learning and Instruction, 2 (1), 8�14.

Enhancing Self-efficacy in Vocabulary Learning:A Self-regulated Learning Approach
Atsushi MizumotoKansai University
doi: http://dx.doi.org/10.7820/vli.v02.1.mizumoto
Abstract
The current study aimed to explore the effects of integrating a self-
regulated learning approach on self-efficacy in vocabulary learning. A
group of 115 English as a Foreign Language (EFL) learners from a
university in Japan participated in this longitudinal study. The participants
were assigned as the treatment group, the contrast group 1, and the
contrast group 2. Only the treatment group received the intervention based
on the self-regulated learning approach. The participants completed a
questionnaire on self-efficacy in vocabulary learning three times and a
vocabulary test twice. Multilevel analysis of change was employed to
examine the trajectories of change in the participants’ self-efficacy over the
measurement occasions. The gain scores in the vocabulary test were
submitted to analysis of variance. The results showed that the treatment
group showed a steady increase in self-efficacy and vocabulary knowledge
compared with the other two contrast groups. The findings from the
current study provide empirical evidence suggesting that through a self-
regulated learning approach, it might be possible to enhance self-efficacy,
which in turn may contribute to the development of vocabulary knowledge.
1 Background
It is a well-known fact in vocabulary research and instruction that teachers
cannot teach all the words learners may need to know. In fact, Nation (2008) argues
that in awell-designed vocabulary development program, the teacher’s jobs ‘‘in order of
importance are planning, strategy training, testing and teaching vocabulary’’ (p. 1).
Teaching comes at the end of the list because vocabulary teaching tends to be inefficient
considering that (a) there are simply too many words to deal with, (b) the rate of
teaching words has to be slow, (c) the amount of learning is low, and (d) using word
cards, or flash-card programs, can result in close to 100% learning (Nation, 2012).
As learners have to learn vocabulary independently and outside the classroom
in most instances, vocabulary learning strategies are of particular importance. This
is also why Nation (2008) regards strategy training to be the second most important
job in vocabulary teaching. The purpose of strategy training is to get the learners to
become independent and autonomous in their vocabulary learning (Nation, 2008,
p. 4). A number of studies on voca7bulary learning strategies instruction have been
conducted with this goal in mind (e.g., Mizumoto & Takeuchi, 2009; Rasekh &
Ranjbary, 2003; Zaki & Ellis, 1999). They have generally reported positive results
for strategy instruction, and thus practitioners are now in a better position to
incorporate strategy training in their vocabulary teaching.
Vocabulary Learning and Instruction
Volume 2, Issue 1, September 2013
http://vli-journal.org
Please cite this article as: Mizumoto, A. (2013). Enhancing self-efficacy in vocabulary learning: A
self-regulated learning approach. Vocabulary Learning and Instruction, 2 (1), 15�24. doi: 10.7820/vli.v02.1.mizumoto

In recent years, the concept of language-learning strategies has expanded into
a more extensive notion of self-regulated learning, partly in response to a wave of
criticism directed at the paucity of rigid theoretical underpinnings (see Cohen &
Macaro, 2007; Dornyei, 2005; Tseng, Dornyei, & Schmitt, 2006 for details). Self-
regulated learning, or self-regulation, has been researched mainly within the field
of educational psychology. Although several theories of self-regulation exist,
Zimmerman’s social-cognitive model of self-regulation (1989) suggests that
‘‘self-regulation involves learners who proactively direct their behavior or strategies
to achieve self-set goals. They also rely on affective, cognitive, motivational, and
behavioral feedback to modify or adjust their strategies and behaviors when unable
to initially attain their goals’’ (Cleary & Zimmerman, 2004, p. 538).
Zimmerman’s (1989) cyclical model of self-regulated learning considers self-
regulated learning as a process. It consists of three phases: forethought,
performance, and self-reflection. In Zimmerman’s cyclical model of self-regulated
learning, self-efficacy emerges as a key concept. Self-efficacy refers to ‘‘the belief in
one’s capabilities to organize and execute the courses of action required to manage
prospective situations’’ (Bandura, 1995, p. 330).
In theory, engaging in the cyclical model of self-regulated learning will
enhance self-efficacy as ‘‘(s)elf-regulation affects motivation, emotions, selection of
strategies, and effort regulation and leads to increases in self-efficacy and improved
academic achievement’’ (Bembenutty, 2011, p. 4). However, no study to date has
investigated the effects of self-regulated learning on self-efficacy in vocabulary
learning. In the current study, therefore, the effects of integrating a self-regulated
learning approach into regular English courses were examined. The research
question of the current study was as follows: will self-efficacy for vocabulary
learning be enhanced by integrating a self-regulated learning approach?
2 Method
2.1 Participants
The study was conducted during the two semesters in the academic year 2012.
The participants were three intact classes of Japanese university English as a
Foreign Language (EFL) learners at a private university in western Japan
(humanities or engineering majors; aged 18�20). They were first-year students
enrolled in a compulsory English course at their university.
The three groups were assigned as (a) the treatment group, (b) the contrast
group 1, and (c) the contrast group 2. The participants in the contrast group 1 were
of a lower level of English proficiency, and those in the contrast group 2 had the
highest level of English proficiency of the three groups. After the list-wise deletion
of incomplete cases at the end of the course, the total number of participants
amounted to 115 (50 women and 65 men). The number of participants in each
group was: 39 for the treatment group (15 women and 24 men), 40 for the contrast
group 1 (15 women and 25 men), and (c) 36 for the contrast group 2 (20 women and
16 men).
16 Mizumoto: Self-efficacy in Vocabulary Learning
Vocabulary Learning and Instruction, 2 (1), 15�24.

2.2 Measures
In order to measure the participants’ self-efficacy in vocabulary learning, a
questionnaire, comprised of four items, was administered. The items were the same
ones used in Mizumoto (2013), in which the validity and reliability of the scale
were established. The participants responded on a six-point scale, from 1 (Not at all
true of me) to 6 (Very true of me), according to the degree of perception on their
learning process. The same questionnaire was administered three times at (a) Time
1: the beginning of the first semester, (b) Time 2: the end of the first semester, and
(c) Time 3: the end of the second semester to investigate the changes in thetrajectory of self-efficacy. Table 1 shows the descriptive statistics of self-efficacy at
three measurement occasions (see Appendix A for the items).
In addition to the questionnaire, a vocabulary test was administered, as a
measure of vocabulary knowledge (see Appendix B for the sample items). The test
was made up of 60 items from the academic vocabulary section of Vocabulary
Levels Test (Schmitt, 2000; Schmitt, Schmitt, & Clapham, 2001), modified by the
author (Mizumoto, 2013). This test was administered as a pretest and a posttest to
examine the effects of integrating a self-regulated learning approach into regular
English courses (Table 2).
2.3 Procedures
The three groups of participants met once a week for a 90-minute class during
a 15-week semester. The study lasted two semesters, spanning 30 classes in total
(approximately eight months). All three classes used the same textbook, Focus on
Vocabulary 1 (Schmitt, Schmitt, & Mann, 2011). At the beginning of each lesson,
Table 1. Descriptive Statistics of Self-efficacy in Vocabulary
Learning
Time 1
(a�0.85)
Time 2
(a�0.85)
Time 3
(a�0.85)
Group n Mean SD Mean SD Mean SD
Treatment 39 2.70 0.95 3.21 0.89 3.43 0.78
Contrast 1 40 2.92 0.60 3.11 0.62 3.11 0.70
Contrast 2 36 3.44 0.92 3.60 1.03 3.46 0.81
Note. The possible range for scores was from 1 to 6.
Table 2. Descriptive Statistics of Vocabulary Test
Pretest
(a�0.91)
Posttest
(a�0.91) Gain
Group n Mean SD Mean SD Mean SD
Treatment 39 41.67 8.36 45.41 7.65 3.74 3.80
Contrast 1 40 38.23 9.81 39.28 9.83 1.05 3.04
Contrast 2 36 45.75 9.52 47.25 9.66 1.50 3.28
Note. The possible range for scores was from 0 to 60.
Mizumoto: Self-efficacy in Vocabulary Learning 17
Vocabulary Learning and Instruction, 2 (1), 15�24.

only the treatment group received a handout, which contained (a) a space to writethe learner’s specific action plans to achieve their short-term goal by the next lesson
(i.e., goal setting), (b) a table describing ‘‘what is involved in knowing a word’’
(Nation, 2001) to draw the learner’s attention to a variety of aspects (meaning,
form, and use) in learning a word, (c) a space to write the strategies they plan to use
to memorize the target vocabulary of the week, (d) a space to write a self-reflection
report about their learning, and (e) three self-efficacy rating scales to reflect on their
self-regulated learning. The cyclic self-regulative approach (Zimmerman, Bonner, &
Kovach, 1996) was used as a model for instruction.
The session always lasted 10�15 minutes of a 90-minute lesson. For the first
few lessons, the teacher, author of this article, described explicitly the key conceptssuch as self-regulated learning, vocabulary-learning strategies, and metacognitive
strategies. The participants were encouraged to exchange their ideas and opinions
about the things they wrote down on their handout. This type of interaction was
included to help participants understand the different perspectives on vocabulary of
other participants.
2.4 Data analyses
All the analyses in this study were conducted using R version 2.14.2. To
address the research question of the current study, ‘‘Will self-efficacy in vocabulary
learning be enhanced by integrating a self-regulated learning approach?’’ A
multilevel analysis of change was employed. Multilevel model, also known by thenames such as hierarchical linear model, linear mixed model, mixed-effect model,
and random effects model, can be applied to longitudinal data analysis to
investigate change over time (specifically called growth curve model in such
application). The advantages of these newer statistical models over traditional
procedures such as ANOVA can be so great that Second Language Acquisition
(SLA) researchers have increasingly started using multilevel modeling (e.g., Kozaki
& Ross, 2011) and mixed-effect modeling (e.g., Ardasheva & Tretter, 2012;
Cunnings, 2012; Sonbul & Schmitt, 2013), depending on the purpose of theresearch.
In addition to the longitudinal analysis of self-efficacy in vocabulary learning
data, gain scores of vocabulary test (i.e., posttest minus pretest) was submitted toone-way ANOVA with a one between-subject factor (i.e., the type of intervention)
to further investigate the effects of integrating a self-regulated learning approach
into regular English courses. It should be noted that the result of this analysis is
identical with the interaction effect gained in a two-way ANOVA with a one
between-subject factor (intervention) and a one within-subject factor (pretest and
posttest). Following the one-way ANOVA, post hoc multiple comparison tests were
performed using the Tukey procedure.
3. Results and discussion
Table 3 is a summary of the results of multilevel analyses of change. Model Ais the unconditional means model, and it is the first step to confirm that it is
justifiable to employ the multilevel analysis (Singer & Willett, 2003). Especially, the
18 Mizumoto: Self-efficacy in Vocabulary Learning
Vocabulary Learning and Instruction, 2 (1), 15�24.

intraclass correlation coefficient (r) shows the relative magnitude of total variation,
which is derived from the between-person variance component (Level 2).
Estimation of r can be obtained from the following equation:
q ¼ r20
r20 þ r2
eð Þ
For Model A, r is 0.72, indicating large variation in self-efficacy can be explained
with differences among individuals. This result warrants subsequent analyses with
the multilevel modeling.
Model B is the unconditional growth model with time (i.e., Time 1, 2, and 3)
as the only predictor. The result suggests that overall self-efficacy of the
participants in the current study steadily increased with the slope of 0.16 (g10)
from the initial intercept of 3.05 (g00). Model C includes intervention (g01 and g11)
as a predictor of initial status and rate of change. Model D adds pretest (g02 andg12) to Model C to control for the effects of pretest on initial status and rate of
change. The inclusion of the vocabulary pretest scores in the model was legitimate
because self-efficacy and proficiency (i.e., vocabulary knowledge) would be related
to each other. In fact, Model D showed the best goodness-of-fit indexes (the smaller
the value, the better fit it is) among all the models. To improve the interpretability
of the parameters, pretest scores were recentered on the sample means (Singer &
Willett, 2003, p. 113). The parameters g11 and g11 in Model D indicate that self-
efficacy among the three groups differs after controlling for the effects of pretest.
The final model (Model D) of the current study can be expressed as follows:
Level 1 within-personð ÞYij ¼ p0i þ p1iTIMEij þ eij
Level 2 between-personð Þp0i ¼ c00 þ c01INTERVENTION þ c02PRETEST þ f0i
p1i ¼ c10 þ c11INTERVENTION þ c12PRETEST þ f1i
Table 3. Results of Multilevel Analyses of Change
Parameter Model A Model B Model C Model D
Fixed effects
Initial status (p0i) Intercept g00 3.21* 3.05* 3.15* 3.24*
Intervention g01 �0.10 �0.19*
Pretest g02 0.05*
Rate of change
(p1i)
Intercept g10 0.16* 0.03 0.01
Intervention g11 0.13* 0.15*
Pretest g12 �0.01*
Random effects (variance components)
Level 1 Within-person r2e 0.21 0.15 0.15 0.15
Level 2 Initial status r20 0.54 0.69 0.68 0.42
Rate of
change
r21 0.03 0.02 0.01
Goodness-of-fit AIC 695.05 662.87 651.31 609.25
BIC 706.58 685.93 682.06 647.69
�2logLik 689.05 650.87 635.31 589.25
*p B 0.05.
Mizumoto: Self-efficacy in Vocabulary Learning 19
Vocabulary Learning and Instruction, 2 (1), 15�24.

where i represents the learner and j the measurement occasion. By using this
equation and the fixed effects in Model D (g00, g01, g02, g10, g11, and g12), the
predicted self-efficacy for each group can be obtained (displayed in Figure 1,bottom panel). As is evident from Figure 1, the treatment group showed a steady
Figure 1. Plotting raw scores (top panel) and displaying the results of the fitted multilevel models
for change (bottom panel).
20 Mizumoto: Self-efficacy in Vocabulary Learning
Vocabulary Learning and Instruction, 2 (1), 15�24.

increase in self-efficacy during the three measurement occasions. Both the contrast
groups stayed almost the same during the period. This result, along with the result
of the multilevel modeling, suggests that self-efficacy in vocabulary learning can be
enhanced by integrating a self-regulated learning approach.
Table 4 presents a summary of the results of a one-way ANOVA of the gain
scores of vocabulary test, and Table 5 the results of post hoc multiple comparison
tests with the Tukey procedure. One-way ANOVAs confirmed that statistically
significant differences were found in the gain scores of the vocabulary test for the
three groups compared. The results of post hoc multiple comparison tests showed
that statistically significant differences existed between the treatment group and the
other two contrast groups. The result indicates that the treatment group exhibited a
greater gain in their vocabulary knowledge than the other two contrast groups.
These trajectories of change in vocabulary knowledge are in line with the patterns
observed in self-efficacy (i.e., the treatment group showed a steady increase
compared with the other two contrast groups).
Taken together, these results provide empirical evidence to answer the
research question of the current study: ‘‘Will self-efficacy in vocabulary learning
be enhanced by integrating a self-regulated learning approach?’’ That is, integrating
a self-regulated learning approach in a regular class sessions will enhance self-
efficacy in vocabulary learning. Furthermore, from the results of the gain scoreanalyses in the vocabulary test, it would be reasonable to assume that the enhanced
self-efficacy through a self-regulated learning approach may lead to a gain in
vocabulary knowledge.
4 Conclusion
The current study is aimed at exploring the effects of integrating a self-
regulated learning approach on self-efficacy with vocabulary learning. The findings
Table 4. Results of One-way ANOVA (Gain Scores in Vocabu-
lary Test)
Source df SS MS F p h2
Intervention 2 162.41 81.21 7.07 0.001 0.11
Residuals 112 1286.34 11.49
Table 5. Results of Multiple Comparisons (Gain Scores in Vocabulary
Test)
95% CI
Comparisons Difference Lower Upper p d
Contrast 1 � Contrast 2 0.45 �1.40 2.30 0.832 0.14
Contrast 1 � Treatment 2.69 0.88 4.51 0.002 0.78
Contrast 2 � Treatment 2.24 0.38 4.10 0.014 0.63
Note. Refer to Table 2 for the gain score means and standard deviations.
Mizumoto: Self-efficacy in Vocabulary Learning 21
Vocabulary Learning and Instruction, 2 (1), 15�24.

from the current longitudinal study suggest that through a self-regulated learningapproach, it would be possible, for teachers and learners alike, to enhance self-
efficacy, which in turn may contribute to the development of vocabulary knowl-
edge.
The pedagogical implication of results of the current study relates to the
importance of measuring self-efficacy as a measure of mastery in vocabulary
learning. Thus, self-efficacy should be measured and teachers are encouraged to
enhance it through the instruction of self-regulated learning or vocabulary learning
strategies as part of the language-focused learning strand (Nation, 2007). With the
enhancement of self-efficacy at its core, teachers can provide instructions for
vocabulary learning strategies, or more encompassing concept self-regulatedlearning, to help the learners become more autonomous.
AcknowledgmentsThis research was made possible by a Grant-in-aid for Scientific Research (No.
24720276) from the Japan Society for the Promotion of Science. I would like to thank theanonymous reviewers of Vocabulary Learning & Instruction for their insightful commentsand suggestions on the manuscript.
References
Ardasheva, Y., & Tretter, T.R. (2012). Contributions of individual differences and
contextual variables to reading achievement of English language learners: An
empirical investigation using hierarchical linear modeling. TESOL Quarterly.
Advance online publication. doi:10.1002/tesq.72
Bandura, A. (1995). Self-efficacy in changing societies. New York: Cambridge
University Press. doi:10.1017/CBO9780511527692
Bembenutty, H. (2011). Introduction: Self-regulation of learning in postsecondary
education. In H. Bembenutty (Ed.), Self-regulated learning (pp. 2�8). San
Francisco, CA: Jossey-Bass, a Wiley Imprint.
Cleary, T.J., & Zimmerman, B.J. (2004). Self-regulation empowerment program:
A school-based program to enhance self-regulated and self-motivated cycles
of student learning. Psychology in the Schools, 41, 537�550. doi:10.1002/pits.
10177
Cohen, A.D., & Macaro, E. (Eds.). (2007). Language learner strategies: Thirty years
of research and practice. Oxford: Oxford University Press.
Cunnings, I. (2012). An overview of mixed-effects statistical models for second
language researchers. Second Language Research, 28, 369�382. doi:10.1177/
0267658312443651
Dornyei, Z. (2005). The psychology of the language learner: Individual differences in
second language acquisition. Mahwah, NJ: Lawrence Erlbaum Associates.
Kozaki, Y., & Ross, S.J. (2011). Contextual dynamics in foreign language learning
motivation. Language Learning, 61, 1328�1354. doi:10.1111/j.1467-9922.2011.00638.x
22 Mizumoto: Self-efficacy in Vocabulary Learning
Vocabulary Learning and Instruction, 2 (1), 15�24.
Mizumoto, A. (2013). Effects of self-regulated vocabulary learning process on self-efficacy. Manuscript submitted for publication.
Mizumoto, A., & Takeuchi, O. (2009). Examining the effectiveness of explicitinstruction of vocabulary learning strategies with Japanese EFL university
students. Language Teaching Research, 13, 425�449. doi:10.1177/136216880
9341511
Nation, I.S.P. (2001). Learning vocabulary in another language. Cambridge:
Cambridge University Press. doi:10.1017/CBO9781139524759
Nation, I.S.P. (2007). The four strands. Innovation in Language Learning and
Teaching, 1, 2�13. doi:10.2167/illt039.0
Nation, I.S.P. (2008). Teaching vocabulary: Strategies and techniques. Boston, MA:
Heinle, Cengage Learning.
Nation, I.S.P. (2012). Is it worth teaching vocabulary? Plenary presentation at the
Independent Learning Association Conference (ILAC) 2012, Wellington, NZ.
Rasekh, Z.E., & Ranjbary, R. (2003). Metacognitive strategy training for
vocabulary learning. Teaching English as a Second or Foreign Language
Electronic Journal, 7 (2). Retrieved from http://tesl-ej.org/ej26/a5.html
Schmitt, N. (2000). Vocabulary in language teaching. Cambridge: Cambridge
University Press.
Schmitt, N., Schmitt, D., & Clapham, C. (2001). Developing and exploring the
behaviour of two new versions of the Vocabulary Levels Test. Language
Testing, 18, 55�88. doi:10.1177/026553220101800103
Schmitt, D., Schmitt, N., & Mann, D. (2011). Focusing on vocabulary 1: Bridging
vocabulary. New York, NY: Longman Education.
Singer, J.D., & Willett, J.B. (2003). Applied longitudinal data analysis: Modeling
change and event occurrence. New York, NY: Oxford University Press. doi:10.
1093/acprof:oso/9780195152968.001.0001
Sonbul, S., & Schmitt, N. (2013). Explicit and implicit lexical knowledge:
Acquisition of collocations under different input conditions. Language
Learning, 63, 121�159. doi:10.1111/j.1467-9922.2012.00730.x
Tseng, W.-T., Dornyei, Z., & Schmitt, N. (2006). A new approach to assessing
strategic learning: The case of self-regulation in vocabulary acquisition.
Applied Linguistics, 27, 78�102. doi:10.1093/applin/ami046
Zaki, H., & Ellis, R. (1999). Learning vocabulary through interacting with a written
text. In R. Ellis (Ed.), Learning a second language through interaction
(pp. 153�169). Amsterdam: John Benjamins.
Zimmerman, B.J. (1989). A social cognitive view of self-regulated academic
learning. Journal of Educational Psychology, 81, 329�339. doi:10.1037/0022-
0663.81.3.329
Zimmerman, B.J., Bonner, S., & Kovach, R. (1996). Developing self-regulated
learners: Beyond achievement to self-efficacy. Washington, DC: American
Psychological Association. doi:10.1037/10213-000
Mizumoto: Self-efficacy in Vocabulary Learning 23
Vocabulary Learning and Instruction, 2 (1), 15�24.

Appendix A: The Questionnaire Items Measuring Self-efficacyin Vocabulary Learning
1. I am good at memorizing vocabulary.2. I know more vocabulary than others.3. I know basic vocabulary to some extent.4. I believe that I can get a good score in the vocabulary test.
Appendix B: Sample Items of the Vocabulary Test Used in theStudy
Choose the best answer for the definition.
1. Work
(A) Benefit (B) Function (C) Labor (D) Structure
2. Part of 100
(A) Percent (B) Period (C) Policy (D) Process
3. General idea used to guide one’s actions
(A) Principle (B) Region (C) Source (D) Survey
4. Money for a special purpose
(A) Circumstance (B) Corporation (C) Fund (D) Layer
5. Skilled way of doing something
(A) Document (B) Immigrant (C) Shift (D) Technique
24 Mizumoto: Self-efficacy in Vocabulary Learning
Vocabulary Learning and Instruction, 2 (1), 15�24.

A Comparison of Lexical Feedback on WritingReceived from Peers and a Teacher
Rachael RueggAkita International University
doi: http://dx.doi.org/10.7820/vli.v02.1.ruegg
Abstract
While a vast number of studies have compared feedback from different
sources, few studies if any have compared feedback on lexis from different
sources. It is therefore unclear whether the amount or type of feedback
given by peers is comparable to that given by a teacher. This study
considers feedback on lexical errors in writing as a method of incidental
vocabulary instruction and compares lexical feedback given by peers and
a teacher over a period of one academic year. While it was found that the
teacher gave significantly more feedback on word choice than the peers
did, there was no significant difference between the amount of feedback
on word use, or the total amount of lexical feedback given by peers and
the teacher. It was also found that both peers and the teacher gave a
considerable amount of feedback on word use and much less on word
choice. If written feedback on writing is to be effective as a form of
incidental vocabulary instruction, it is suggested that both teachers and
peers should focus more on word choice when giving feedback on writing.
1 Introduction
The current study compares lexical feedback on writing received from peers
and a teacher over a period of one academic year. While a vast number of studies
have compared feedback from different sources, few studies if any have comparedfeedback on lexis from different sources. It is therefore unclear whether the amount
or type of feedback given by peers is comparable to that given by a teacher. The
following research question will be addressed: How does the quantity of lexical
feedback received from peers and from the teacher differ?
2 Background
In many curricula, vocabulary learning is considered to be the mandate of
reading courses (e.g. Collins, 2001; Kirkgoz, 2006; Kirschner & Wexler, 2002), while
the improvement of grammatical ability is associated with writing courses (e.g.Beckett, Gonzalez, & Schwartz, 2004; Chimbganda, 2000; Ferris & Hedgcock,
2004). However, it has been found that reading can be facilitative of grammar
knowledge (Krashen, 1982; Trahey & White, 1993). Likewise, it has also been found
that learners are able to improve their lexical performance through practices
employed during writing instruction (Ferris, 2003; Ferris & Roberts, 2001). Indeed,
Swain (1995) argues that pushed output is required for acquisition because when
learners produce output they need to pay attention to language, whereas when they
Vocabulary Learning and Instruction
Volume 2, Issue 1, September 2013
http://vli-journal.org
Please cite this article as: Ruegg, R. (2013). A comparison of lexical feedback on writing received
from peers and a teacher. Vocabulary Learning and Instruction, 2 (1), 25�31. doi: 10.7820/vli.v02.1.ruegg

process input attention only needs to be paid to the meaning. Moreover, Ellis andHe (1999) found that modified output was more effective than modified input for
incidental vocabulary learning and concluded that ‘‘Producing new words helps
learners process them more deeply, whether for comprehension or for acquisition,
than simply hearing (or reading) them’’. (p. 297). As this paper will do, both
Raimes (1985) and Santos (1988) have also appealed for more focus on vocabulary
in writing courses.
Nation (2001) states that ‘‘Teachers can have a direct influence on noticing in
speaking and writing tasks by giving thought to . . . the written input . . .’’ (p. 66).
However, in order to maximise learner motivation it is often suggested that learners
be given freedom to choose their own topics (Benson, 2001; Freeman & Freeman,1989; Hudelson, 1989; Johnson, 1989; Little, 1991; Sayers, 1989; Walker, 2003).
This is especially the case at the university level where learners may be learning to
write in order to prepare for a future course of study in their chosen field. Indeed,
Laufer and Hulstijn (2001) found that in these conditions need was high, search
was moderate and evaluation was high. Of all the language-learning activities
compared in their paper, writing about a self-selected topic resulted in the most
favourable conditions for vocabulary retention.
If teachers are unable to control the input encountered by students, then
providing feedback on output could be the most effective means of facilitating
vocabulary learning. In reviewing the literature on error correction, Truscott (2007)found that studies that included correction of all error types tended to result in
significant effects, whereas studies that focused specifically on grammatical errors,
tended to result in insignificant effects. Specifically, studies that included spelling
errors appear to have found positive effects for error correction. This offers promise
for feedback on vocabulary as a method of facilitating vocabulary instruction.
Many studies have compared feedback from peers with that from teachers.
Most of that research seems to have found that peer feedback is comparable to
teacher feedback in terms of its effect on writing (Caulk, 1994; Donato, 1994),
while Hedgcock and Lefkowitz (1992) and Paulus (1999) found that the final drafts
of essays which had been subject to peer feedback received higher scores than thosewhich had been subject to teacher feedback. Peer feedback has also been found to
have a positive effect on learners’ confidence (Gungle & Taylor, 1989; Mittan, 1989;
Tsui & Ng, 2000; Zhang, 1995). However, it has been stated that peers focus on
different aspects of writing than teachers do (Connor & Asenavage, 1994;
Hedgcock & Lefkowitz, 1992; Yang, Badger & Yu, 2006). Very little research has
been conducted into lexical feedback on writing and it is unclear to what extent
peers and teachers focus on lexical issues when providing feedback on writing.
This study considers feedback on lexical errors in writing as a method of
incidental vocabulary instruction. It compares lexical feedback given by peers and
by a teacher over a period of one academic year.
3 Method and results
The participants in the current study were 51 second-year students in thedepartment of English at a private foreign language university in central Japan. The
26 Ruegg: Comparison of Lexical Feedback
Vocabulary Learning and Instruction, 2 (1), 25�31.

students were in four intact classes, all of which were in the bottom ability stream at
the university. Students were assigned to ability streams on the basis of scores from
the reading and listening sections of TOEFL Institutional Testing Program (ITP)
as well as in-house speaking and writing tests. Within the bottom ability stream,
students had been randomly placed into one of five classes. Therefore, the overall
ability level of each of the four intact classes can be considered to be equal. Two of
the classes constituted the peer feedback group, while the other two constituted the
teacher feedback group.
Over the course of the academic year the students wrote eight essays, for each
of which they were asked to write and submit three drafts; two preliminary drafts
and a final draft, totaling 16 preliminary drafts per student over the one-year
period. Students in the peer feedback group gave and received peer feedback alone
on all preliminary drafts over the academic year, while those in the teacher
feedback group received teacher feedback exclusively on all preliminary drafts for
the same period. All final drafts were read and graded by the teacher, but no
feedback was provided on the final drafts apart from the grades. All the preliminary
drafts written by these students over the period of one academic year were analysed
in terms of the types and amount of lexical feedback they received.
For the purpose of this study, lexical feedback was defined in the same way as
Ferris (2003) defined ‘‘Word choice errors’’. These included word choice and word
use. The lexical feedback was divided into two aspects (word choice and word use)
of lexical knowledge in order to ascertain whether there was a significant difference
in the quantity of feedback of these different types. A checklist was used by both the
peers and the teacher when they provided feedback. The questions on the checklist
that were determined to constitute lexical feedback and the aspect of lexis they were
determined to relate to can be seen in Figure 1.
The descriptive statistics for the number of instances of feedback each learner
in the peer feedback group received over the one-year period can be seen in Table 1.
The descriptive statistics for the number of instances of feedback each learner
in the teacher feedback group received over the one-year period can be seen in
Table 2.
QuestionQuestion AspectAspect
Please suggest more sophisticated vocabulary.Is each word used in the correct context?
Word choice
Is each word used correctly?Is the correct form of each word used?Is each word spelt correctly?
Word use
Figure 1. Questions related to lexis on the feedback checklists.
Ruegg: Comparison of Lexical Feedback 27
Vocabulary Learning and Instruction, 2 (1), 25�31.

One-way ANOVA (2-tailed) was used to measure difference between the
amount of feedback on word choice, word use and the total amount of lexical
feedback given by peers and by the teacher.
The results of the one-way ANOVA showed that there was no significant
difference in terms of the amount of feedback on word use (p�0.815) or total
feedback (p�0.584). On the other hand, the difference between the amount of
feedback on word choice in the two groups [F (1,61) �6.542, p�0.013] was found
to be significant at the 0.05 level.
4 Discussion and conclusions
It can be seen that both peers and the teacher gave a considerable amount of
feedback on word use and much less on word choice. In fact, the maximum number
of comments any student received related to word choice over the entire academic
year was only 16 which is equivalent to one comment on each preliminary draft.
While there was no difference between the amount of feedback given on word use
or total feedback given, the teacher gave significantly more feedback on word
choice than the peer reviewers did.
Although the teacher gave significantly more feedback on word choice than
the peers did, even the amount given by the teacher (which amounted to a
maximum of 16 feedback points over the semester) would appear to be insufficient.
If written feedback on writing is to be effective as a form of incidental vocabulary
instruction, it is suggested that teachers should focus more on word choice when
giving feedback on writing.
Hyland (2003) states that while teacher feedback can only be seen to improve
writing skills, peer feedback can improve learners’ skills doubly: Firstly in the
process of critiquing a peer’s writing and secondly in the process of receiving
feedback from the peer. Training students to focus on word choice to a greater
extent when they take part in peer review may therefore have two possible benefits:
it may increase their attention to word choice in their own writing and also during
the peer review process itself students are likely to search (in their dictionary for
Table 1. Instances of Peer Feedback (n �23)
Feedback Minimum Maximum Mean SD
Word choice 0 7 1.19 2.131
Word use 0 139 18.67 34.735
Total 0 139 19.85 35.003
Table 2. Instances of Teacher Feedback (n �28)
Feedback Minimum Maximum Mean SD
Word choice 0 16 3.61 4.562
Word use 0 88 20.42 24.510
Total 0 89 24.03 25.313
28 Ruegg: Comparison of Lexical Feedback
Vocabulary Learning and Instruction, 2 (1), 25�31.

unknown words) and evaluate (possible alternative words to suggest to their peer).According to Laufer and Hulstijn (2001) such activities are likely to result in
vocabulary retention.
It appears that peer reviewers are able to give as much feedback on word use
as teachers. In future research, it would be worthwhile to evaluate the accuracy of
such feedback given by peers and by the teacher.
This study only investigated the feedback given by one teacher. Therefore, if
this study was reproduced different results may be found. In future research it
would be useful to analyse feedback from a number of different teachers who use
the same feedback checklist to find out how much teachers vary in the amount of
lexical feedback they give their students.
References
Beckett, G., Gonzalez, V., & Schwartz, H. (2004). Content-based ESL writing
curriculum: A language socialization model. NABE Journal of Research and
Practice, 2 (1), 161�175.
Benson, P. (2001). Teaching and researching autonomy in language learning. Harlow:Pearson Education.
Caulk, N. (1994). Comparing teacher and student responses to written work.
TESOL Quarterly, 28, 181�188. doi:10.2307/3587209
Chimbganda, A. (2000). Communication strategies used in the writing of answers
in biology by ESL first-year science students of the University of Botswana.English for Specific Purposes, 19, 305�329. doi:10.1016/S0889-4906(99)00002-2
Collins, M. (2001). The multi-cultural classroom: Immigrants reading the literatureof the immigrant experience. MinneTESOL/WITESOL Journal, 18, 13�22.
Connor, U., & Asenavage, K. (1994). Peer response groups in ESL writing classes:
How much impact on revision? Journal of Second Language Writing, 3, 257�276. doi:10.1016/1060-3743(94)90019-1
Donato, R. (1994). Collective scaffolding in second language learning. In J. Lantolf& G. Appel (Eds.), Vygotskian approaches to second language research
(pp. 33�56). Westport: Ablex Publishing.
Ellis, R., & He, X. (1999). The roles of modified input and output in the incidental
acquisition of word meanings. Studies in Second Language Acquisition, 21 (2),
297�301.
Ferris, D. (2003). Response to student writing: Implications for second language
students. Mahwah, NJ: Lawrence Erlbaum Associates.
Ferris, D., & Hedgcock, J. (2004). Teaching ESL composition: Purpose, process and
practice. Mahwah, NJ: Lawrence Erlbaum Associates.
Ferris, D.R., & Roberts, B. (2001). Error feedback in L2 writing classes. How
explicit does it need to be? Journal of Second Language Writing, 10, 161�184.
doi:10.1016/S1060-3743(01)00039-X
Ruegg: Comparison of Lexical Feedback 29
Vocabulary Learning and Instruction, 2 (1), 25�31.

Freeman, Y., & Freeman, D. (1989). Whole language approaches to writing withsecondary students of English as a second language. In D. Johnson &
D. Roen (Eds.), Richness in writing (pp. 177�192). New York, NY: Longman.
Gungle, B., & Taylor, V. (1989). Writing apprehension and second language writers.
In D. Johnson & D. Roen (Eds.), Richness in writing: Empowering ESL
students (pp. 235�248). New York, NY: Longman.
Hedgcock, J., & Lefkowitz, N. (1992). Collective oral/aural revision in foreign
language writing instruction. Journal of Second Language Writing, 1 (3), 255�276. doi:10.1016/1060-3743(92)90006-B
Hudelson, S. (1989). A tale of two children: Individual differences in ESL children’s
writing. In D. Johnson & D. Roen (Eds.), Richness in writing (pp. 84�99). New
York, NY: Longman.
Hyland, K. (2003). Second language writing. Cambridge: Cambridge University
Press.
Johnson, D. (1989). Enriching task contexts for second language writing: Power
through interpersonal roles. In D. Johnson & D. Roen (Eds.), Richness in
writing (pp. 39�54). New York, NY: Longman.
Kirkgoz, Y. (2006). Designing a corpus based reading course for academic
purposes. The Reading Matrix, 6 (3), 281�298. Retrieved from http://www.
readingmatrix.com/articles/kirkgoz/article.pdf
Kirschner, M., & Wexler, C. (2002). Caravaggio: A design for an interdisciplinary
content-based EAP/ESP unit. Journal of English for Academic Purposes, 1 (2),
163�183. doi:10.1016/S1475-1585(02)00014-0
Krashen, S. (1982). Principles and practice in second language acquisition. Oxford:
Pergamon.
Laufer, B., & Hulstijn, J. (2001). Incidental vocabulary acquisition in a second
language: The construct of task-induced involvement. Applied Linguistics, 22
(1), 1�26.
Little, D. (1991). Learner autonomy: Definitions, issues and problems. Dublin:
Authentik.
Mittan, R. (1989). The peer review process: Harnessing students’ communicative
power. In D. Johnson & D. Roen (Eds.), Richness in writing: Empowering ESL
students (pp. 207�219). New York, NY: Longman.
Nation, I.S.P. (2001). Learning vocabulary in another language. Cambridge:
Cambridge University Press.
Paulus, T. (1999). The effect of peer and teacher feedback on student writing.
Journal of Second Language Writing, 8, 265�289. doi:10.1016/S1060-3743(99)
80117-9
Raimes, A. (1985). What unskilled writers do as they write: A classroom study of
composing. TESOL Quarterly, 19, 229�258. doi:10.2307/3586828
Santos, T. (1988). Professors’ reactions to the academic writing of nonnative-
speaking students. TESOL Quarterly, 22 (1), 69�88. doi:10.2307/3587062
30 Ruegg: Comparison of Lexical Feedback
Vocabulary Learning and Instruction, 2 (1), 25�31.

Sayers, D. (1989). Bilingual sister classes in computer writing networks. In D.Johnson & D. Roen (Eds.), Richness in writing (pp. 120�133). New York, NY:
Longman.
Swain, M. (1995). Three functions of output in second language learning. In Cook,
G. & Seidhofer, B. (Eds.). Principles and practices in the study of language
(pp. 125-144). Oxford: Oxford University Press.
Trahey, M., & White, L. (1993). Positive evidence and preemption in the second
language classroom. Studies in Second Language Acquisition, 15 (2), 181�204.
doi:10.1017/S0272263100011955
Trustcott, J. (2007). The effect of error correction of learners’ ability to write
accurately. Journal of Second Language Writing, 16, 255�272. doi:10.1016/j.
jslw.2007.06.003
Tsui, A., & Ng, M. (2000). Do secondary L2 writers benefit from peer comments?
Journal of Second Language Writing, 9, 147�170. doi:10.1016/S1060-3743(00)
00022-9
Walker, B. (2003). The cultivation of student self-efficacy in reading and writing.
Reading and Writing Quarterly, 19, 173�187. doi:10.1080/10573560308217
Yang, M., Badger, R., & Yu, Z. (2006). A comparative study of peer and teacher
feedback in a Chinese EFL writing class. Journal of Second Language Writing,
15, 179�200. doi:10.1016/j.jslw.2006.09.004
Zhang, S. (1995). Reexamining the affective advantage of peer feedback in the ESL
writing class. Journal of Second Language Writing, 4 (3), 209�222. doi:10.
1016/1060-3743(95)90010-1
Ruegg: Comparison of Lexical Feedback 31
Vocabulary Learning and Instruction, 2 (1), 25�31.

Commentary on Four Studies for JALTVocabulary SIG
Paul NationLALS, Victoria University of Wellington
doi: http://dx.doi.org/10.7820/vli.v02.1.nation
Abstract
Four papers by Tomoko Ishii, Emilie Masson, Atsushi Mizumoto and
Rachael Ruegg will be presented in morning session of the Second
Annual JALT Vocabulary SIG Vocabulary Symposium in Fukuoka, Japan
on July 2, 2013. As discussant, it is my pleasure to comment upon each
manuscript. These four lexical researchers originate from all over Japan:
Tokyo, Fukuoka, Osaka and Akita. The range of their lexical topics is
almost as wide: semantically related words; loanword usage difficulties;
self-efficacy and autonomy in vocabulary learning; and, lexical feedback
on writing. After commenting on each paper in turn, I shall present a few
suggestions for their future research.
1 Research on vocabulary
The amount of research focused on the teaching and learning of vocabulary
has increased enormously. Around 30% of the research on vocabulary in the last
100 years has appeared within the last 10 years. In addition, much of this research is
focused on vocabulary learning in a second or foreign language, and we are
probably now at a point where the amount of second language vocabulary research
outnumbers the amount of first language vocabulary research.
In addition, there is now a keener awareness of the various aspects of research
methodology for investigating vocabulary. Two books on research methodology in
vocabulary studies have recently appeared (Nation & Webb, 2011; Schmitt, 2010),
and there is a great deal of innovation in how vocabulary-focused research is
carried out (see Schmitt, 2004 for an excellent example). There is now more
discussion of issues like time-on-task, multiple tests of the same words, test items,
and factors affecting word difficulty.
There is also a growing body of researchers who have made research on
vocabulary their prime focus and who persistently research and publish in this area.
This persistence is important, because it allows for the refinement of research
techniques and the chipping away at an area of research so that findings are
confirmed or challenged, and the research area is looked at in increasing detail.
Some of the areas where this is occurring include multiword units, text coverage
and comprehension, vocabulary-teaching techniques, word lists, and vocabulary
size.
Research on vocabulary has been particularly helped by the very rapid
advances in computer technology. As Tom Cobb puts it, the relationship between
computer technology and vocabulary is a marriage made in heaven.
Vocabulary Learning and Instruction
Volume 2, Issue 1, September 2013
http://vli-journal.org
Please cite this article as: Nation, I.S.P. (2013). Commentary on four studies for JALT Vocabulary
SIG. Vocabulary Learning and Instruction, 2 (1), 32�38. doi: 10.7820/vli.v02.1.nation

The following studies very usefully add to our knowledge of the teaching and
learning of vocabulary. They are very different from each other with differing
focuses and different research methodologies.
2 The four studies
2.1 Re-examining semantic clustering: insight from memorymodels by Tomoko Ishii
This study looks at semantically related words to see if the nature of the
semantic relationship affects the possibility of interference. The study focuses on
visual features � banana and orange are less likely to interfere with each other
because they have very different shapes, whereas apple and oranges are more likely
to interfere because they have a rather similar shape. This likelihood of interference
is of course not limited to shape. The study found some support for the idea.
This is a very worthwhile study indeed. It takes the research on interference to
a new level, adding much needed detail to an area that needs further research like
this. The paper is deliberately short, and I am aware that several of my comments
relate to areas that were probably not mentioned because of space limitations.
Because nonsense words were used, no pre-test was needed. The comparisons
were between the three different relationships so no control group was needed.
I generally recommend three tests for each word when measuring the effects of
vocabulary interventions. Would that recommendation apply to this study?
Probably yes, because it would be interesting to see if strength of knowledge
related in some way to interference. Are partially known words more likely to
interfere because of the fragility of the knowledge? This study used an L1 recall test
(see the L2 word � write its meaning in Japanese). This is a tough test and more
sensitive measures like multiple-choice (with the correct answers to other items as
distractors) and interview (a version of the Vocabulary Knowledge Scale) might
provide useful insights.
It would be good to see an analysis of the relationships between the words in
at least the Tinkham and Waring studies (and perhaps Higa?). My guess is that the
researcher has already done this. My guess is that this analysis might support the
present study.
I agree with the comment about part of speech in the study of Tinkham
(1997). I regard the confounding of part of speech and thematic relationship to be a
weakness of the Tinkham study, resulting in an underestimation of the thematic
effect.
In the present study there is evidence of a ceiling effect with some learners
scoring 18 out of 18, at least initially. I guess this was a small number and did not
greatly affect the results.
The choice was made for the study to be within subjects. I think this was the
best choice. This raises the possibility of interactions between the items in the three
groupings. I wonder if there was evidence of this, for example stone and globe, knife
and chopsticks. I think Japanese like Thai use classifiers for items of various shapes
Nation: Commentary for JALT Vocabulary SIG 33
Vocabulary Learning and Instruction, 2 (1), 32�38.

and functions. I wonder if the classifiers in Japanese affected learning? The studystands or falls on the quality of the operationalisation of the groupings. Was there
any pre-testing that could be done to guarantee the quality of the groupings? This
pretesting could involve some kind of classification activity somewhat similar to
Rosch, Mervis, Gray, Johnson, and Boyes-Braem (1976) studies on prototypicality
to see what items are seen as being more closely related.
Some of the semantically related items share a physical relationship �Japanese radish, cucumber, okra; knife, fork, ladle. Was there evidence of inter-
ference between these items?
The test was a receptive recall test (L2 ] L1). This makes it possible to look
at aspects of the process in the sense that wrong translations can be analysed. I was
pleased to see the researcher do this to a small degree (p. 4), but I wonder if more
analysis is possible with the existing data. Such data provides a compelling evidencefor what is causing the difficulty.
I assume that the items were presented in category groupings during thelearning. If this was so, it is interesting to speculate on the effect of the tests
involving a random ordering. This would certainly increase the difficulty of the task
(where testing conditions match learning conditions, recall is better). Or, would this
lessen the effect of interference?
I greatly enjoyed reading this study and thinking about it. It focuses on an
area where I have special interests, and it takes an innovative question and explores
it carefully and well.
Tinkham and Waring used trials to criterion. When re-reading Tinkham’s
studies a few years ago, I wondered how his subjects would have behaved on a
delayed test. Would those who took more trials to learn have better long-term
retention because of the extra repetitions and heavier learning burden (depth of
processing?) during the learning? I was going to contact Tinkham about this and
found to my dismay that he had died during a medical operation. At least he knewthat I greatly admired his research although I had never met him.
2.2 How L1 loanwords can create a false sense of familiarity withL2 vocabulary meaning and usage by Marie-Emilie Masson
This paper has a very useful focus. It goes beyond looking at form and
meaning relationships and considers the third major aspect of what is involved in
knowing a word, use. It builds very usefully on the work of Frank Daulton (2008).
The study looks at the various types of loanword relationships (true cognates,
convergent cognates, divergent cognates, close false friends and distant false
friends) and their connection with knowledge about how to use the words. Skill at
using the word was measured by getting the learners to write a sentence containing
the word.
The study found that the easiest words from a form and meaning perspective
(true cognates and convergent cognates) were among the worst performing on the
measure of word use. This is a very interesting finding � what we are most confidentabout is our greatest weakness.
34 Nation: Commentary for JALT Vocabulary SIG
Vocabulary Learning and Instruction, 2 (1), 32�38.

The Vocabulary Knowledge Scale as used in the study has come in for a lot ofcriticism (see Nation and Webb (2011, section 14.9) for references). One criticism is
that it is really two scales, in that it combines meaning and use (Step 3: I know more
than one meaning for this word and I can write a sentence using this word). In the
present study it could be argued that having these two aspects present is desirable,
because the study looks at both of them and their relationship. It may however
be considered a little unfair as the subjects cannot choose between knowing the
meaning and using the word. Their choice is both or none.
Two tests are being compared here. The scale test which is a recall test of
receptive knowledge, and a productive recall test of the use of the word. There
should be some agreement between the tests, but they are testing rather differentthings. We have a difference of formats and a difference of types of knowledge.
What is in common is that the tests are of the same word. The reason that I point
out these format differences is that they add to the likelihood of lack of agreement
between the tests. Different formats testing knowledge of word meaning for the
same words correlate at around 0.7. Format has a strong effect. Having said that,
I think that the formats chosen were probably the best ones to use for this study.
I was thinking how this study could also be applied to word card learning.
Presumably there would be similar findings � knowing the receptive meaning does
not mean knowing the use. As with word card learning, having productive
knowledge of the word would probably not mean that the word could be usedcorrectly.
The message of the paper is that receptive knowledge does not meanproductive use. Receptive knowledge may blind learners to needing to learn more
about the word. There needs to be a range of opportunities to learn how to use
loanwords and cognates.
2.3 Enhancing self-efficacy in vocabulary learning: a self-regulated learning approach by Atsushi Mizumoto
This is an interesting study. It has the strong points of being a longitudinal
study and involving more than one measure of learning. It also provides me with an
opportunity to comment on a couple of features of research that I consider
important.
The first is pedagogical significance. Researchers are well aware of statistical
significance. Statistical significance is related to the size of the difference between
treatments particularly with regard to whether the difference could have occurredby chance without there being any real connection between the treatments being
compared and the measure. Pedagogical significance goes a step further and asks if
the size of the difference between treatments is large enough for a teacher or learner
to get excited about. So it is possible to have statistical significance without
pedagogical significance. In the studies on interference, the difference in the number
of learning trials for interfering items and non-interfering items is 50�100%. This is
a very big difference and is one that teachers and learners would see as having a big
effect on learning. If the difference was only one or two trials out of 20, then itwould be less recent to get excited about the effect. Pedagogical significance is
Nation: Commentary for JALT Vocabulary SIG 35
Vocabulary Learning and Instruction, 2 (1), 32�38.

important because even if research shows that there is a significant differencebetween two treatments, if that difference means virtually no change in the amount
of effort or work that the learner has to do, then there is no strong reason for
adopting the findings.
Let us now look at pedagogical significance in the present study. The amount
of learning involved was 10�15 minutes each time for 30 times, around 5�7 hours in
total. On the vocabulary measure, this resulted in an increase of 3.74 out of 19
(41 out of 60 were already known) which is approximately a one-fifth increase. This
compares with the controls with a 1 out of 19 (approximately one-twentieth)
increase. This seems to me enough for pedagogical significance.
Pedagogical significance also involves looking at cost/benefit. That is how
much work was needed to achieve how much increase? There are studies where
large amounts of time were spent achieving learning rates of around one word perhour (see for example Carlo et al., 2004). It does not make sense to make such a
calculation in the present study because the aim was primarily to develop self-
efficacy, not just learn vocabulary. However, this study used a text containing
vocabulary exercises (I assume that the Schmitt, Schmitt and Mann text was used
for the 30 weeks). Vocabulary exercises are generally not very efficient as a means of
vocabulary learning. Results from the various involvement load studies for example
give a receptive learning return of B50%. Word cards may have been more efficient
than the book. What I am calling pedagogical significance consists of effect sizeand efficiency.
The second issue I want to focus on is the use of questionnaires. While I thinkthat in this study a questionnaire was an appropriate measure, in many studies it is
often adopted because of its convenience rather than its validity. Questionnaires
typically measure opinions and attitudes. The big problem I have with them is that
opinions and attitudes are one step at least away from action. That is, people can
say that they believe in certain things, but it is their actions that count and it is not
uncommon for stated beliefs and actions to disagree with each other. It seems to me
that one of the real challenges in measuring self-efficacy is finding measures that
most validly measure self-efficacy. I have no doubt it can be done, but it is likelythat the most valid measures will involve individual observation of some kind.
I think the focus on self-efficacy and autonomy in vocabulary learning is very
important. Because there are so many words to learn and because deliberatelearning will play an important role in this learning because of its efficiency,
learners need to take responsibility for their own vocabulary learning.
2.4 A comparison of lexical feedback on writing from peers and ateacher by Rachael Ruegg
This study looked at feedback on vocabulary in writing over several pieces of
writing. Is this an experimental or quasi-experimental study? Intact classes were
used but the assigning of classes was the result of random placement. Becauseintact classes were used it is probably quasi-experimental.
In the review of the literature, Laufer and Hulstijn’s rating for writtenassignments is mentioned. This involvement load rating refers to the particular type
36 Nation: Commentary for JALT Vocabulary SIG
Vocabulary Learning and Instruction, 2 (1), 32�38.

of task they used. It is likely that academic writing of the kind involved in this studywould be rated even higher.
The major weakness of the study is that we have the amount of feedback butnot amount of error. Were lexical errors noticed? What proportions were noticed?
In terms of actual errors, what was the proportion of word choice error to word use
error? Without this information we cannot assess if the balance of feedback (word
choice versus word use) was appropriate or not. The feedback ratio on word choice
versus word use was 1:6 by the teacher. Does this reflect the proportion of error or
is this out of line with the errors in the writing?
Ideally the judgement of errors would need to be made twice, once by the
teacher involved and once by external raters.
The conclusions of the study assume sophisticated vocabulary is better than
more frequent vocabulary and that collocational error largely goes unnoticed. The
study does not provide evidence for this. There is some research however that
supports the idea that more sophisticated vocabulary is seen as a sign of goodwriting.
3 Future research
The research included in this review covers a wide range of topics. This is a
reflection that research on vocabulary is alive and well and that researchers are
finding topics that can be usefully researched. I thought I would conclude thisreview by suggesting avenues for further vocabulary-focused research. Let me do
this by using the four studies in this review as starting points.
Research on interference is still really in its infancy. We have the beginning of
a range of potentially interfering relationships including lexical sets, opposites and
near synonyms. Only the research on lexical sets has been replicated. Higa’s
findings on near synonyms and opposites have not been replicated. Are there other
negative relationships? It would be interested to look at near synonyms in the same
detailed way that lexical sets were investigated in Tomoko Ishii’s research. Besides
Tinkham’s (1997) study, there has been no investigation of relationships facilitating
learning. Taking such a positive approach could provide useful guidelines forteaching and learning.
Research on loanwords has rarely gone beyond learning isolated lexical items.
Marie-Emilie Masson’s research suggests very useful directions, namely looking atwhat other learning needs to occur. Stuart Webb’s (2007) research comparing
learning with and without context found that a lot of knowledge about a newly
learned L2 word could be carried over from L1 and previous L2 knowledge and
commonsense. For example, if a learner has some understanding of the countable/
uncountable distinction from earlier study of English, this may not need much if any
attention when a new uncountable noun is learned. Does this work with loanwords
or is the influence of the L1 so strong that L1 rules and patterns dominate? Does this
make loanwords in some ways more difficult than completely new words?
Research on self-efficacy shows great promise for vocabulary learning.
Learners need to know a lot of vocabulary and incidental learning needs to beaccompanied by more efficient deliberate learning. Vocabulary teaching and
Nation: Commentary for JALT Vocabulary SIG 37
Vocabulary Learning and Instruction, 2 (1), 32�38.

vocabulary activities can only deal with a very small proportion of the words thatneed to be learned. Atsushi Mizumoto’s research shows that with time learners can
take on much of the responsibility for deliberate vocabulary learning. We need to
know more about what motivates learners to take responsibility for their learning.
Change theory suggests that law, reason and involvement are major avenues for
bringing about complex change. However, we need to see what practical options in
each of these avenues are most effective.
Rachael Ruegg’s research is in a virtually unexplored area. While there are
many studies of grammatical features in writing, there are very few that focus on
vocabulary. The lexical richness studies using the Lexical Frequency Profile (Laufer
& Nation, 1995) need to be enriched by discourse studies that examine the role ofthe vocabulary in texts. I see a relationship between studies like this that look at
production and studies that look at lexical coverage for comprehension. Looking at
what the words contribute or do not contribute to a particular text is important.
Vocabulary is no longer a neglected area of research and the studies reviewed
here testify to the range of focuses that are possible. I look forward to seeing the
research reviewed here being published and thus adding more broadly to our
knowledge of the field.
References
Carlo, M.S., August, D., McLaughlin, B., Snow, C.E., Dressler, C., Lippman,
D.N., . . . White, C.E. (2004). Closing the gap: addressing the vocabulary needs
of English-language learners in bilingual and mainstream classrooms.Reading Research Quarterly, 39 (2), 188�215. doi:10.1598/RRQ.39.2.3
Daulton, F.E. (2008). Japan’s built-in lexicon of English-based loanwords. Clevedon:Multilingual Matters.
Laufer, B., & Nation, P. (1995). Vocabulary size and use: lexical richness in L2
written production. Applied Linguistics, 16 (3), 307�322. doi:10.1093/applin/16.3.307
Nation, I.S.P., & Webb, S. (2011). Researching and analyzing vocabulary. Boston:Heinle Cengage Learning.
Rosch, E., Mervis, C.B., Gray, W.D., Johnson, D.M., & Boyes-Braem, P. (1976).Basic objects in natural categories. Cognitive Psychology, 8, 382�439. doi:10.
1016/0010-0285(76)90013-X
Schmitt, N. (Ed.). (2004). Formulaic sequences. Amsterdam: John Benjamins.
Schmitt, N. (2010). Researching vocabulary: a vocabulary research manual.
Basingstoke: Palgrave Macmillan.
Tinkham, T. (1997). The effects of semantic and thematic clustering on the learning
of second language vocabulary. Second Language Research, 13 (2), 138�163.doi:10.1191/026765897672376469
Webb, S. (2007). The effects of synonymy on second-language vocabulary learning.
Reading in a Foreign Language, 19 (2), 120�136.
38 Nation: Commentary for JALT Vocabulary SIG
Vocabulary Learning and Instruction, 2 (1), 32�38.
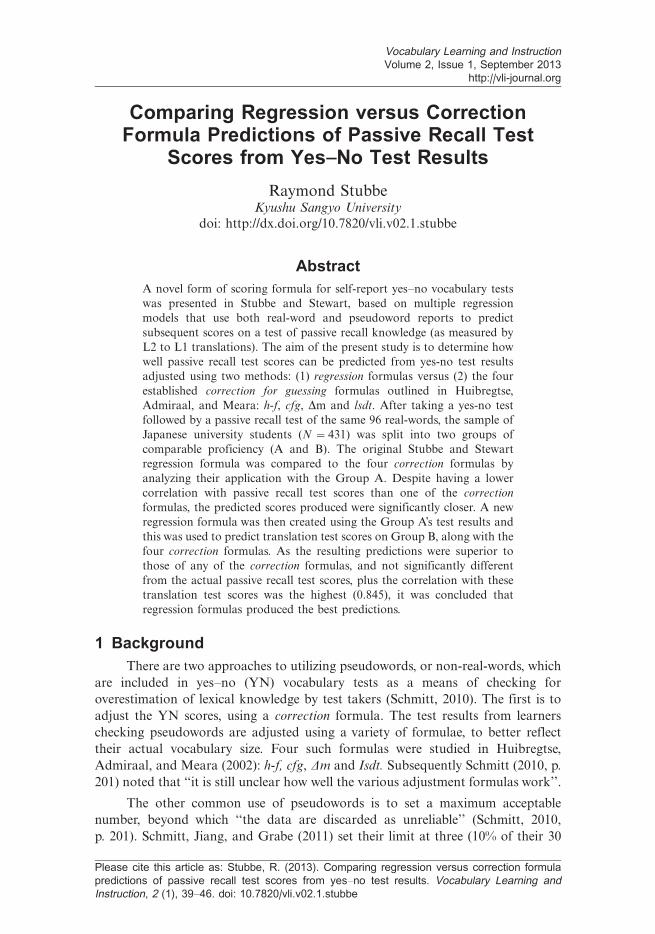
Comparing Regression versus CorrectionFormula Predictions of Passive Recall Test
Scores from Yes�No Test Results
Raymond StubbeKyushu Sangyo University
doi: http://dx.doi.org/10.7820/vli.v02.1.stubbe
Abstract
A novel form of scoring formula for self-report yes�no vocabulary tests
was presented in Stubbe and Stewart, based on multiple regression
models that use both real-word and pseudoword reports to predict
subsequent scores on a test of passive recall knowledge (as measured by
L2 to L1 translations). The aim of the present study is to determine how
well passive recall test scores can be predicted from yes-no test results
adjusted using two methods: (1) regression formulas versus (2) the four
established correction for guessing formulas outlined in Huibregtse,
Admiraal, and Meara: h-f, cfg, Dm and lsdt. After taking a yes-no test
followed by a passive recall test of the same 96 real-words, the sample of
Japanese university students (N �431) was split into two groups of
comparable proficiency (A and B). The original Stubbe and Stewart
regression formula was compared to the four correction formulas by
analyzing their application with the Group A. Despite having a lower
correlation with passive recall test scores than one of the correction
formulas, the predicted scores produced were significantly closer. A new
regression formula was then created using the Group A’s test results and
this was used to predict translation test scores on Group B, along with the
four correction formulas. As the resulting predictions were superior to
those of any of the correction formulas, and not significantly different
from the actual passive recall test scores, plus the correlation with these
translation test scores was the highest (0.845), it was concluded that
regression formulas produced the best predictions.
1 Background
There are two approaches to utilizing pseudowords, or non-real-words, which
are included in yes�no (YN) vocabulary tests as a means of checking for
overestimation of lexical knowledge by test takers (Schmitt, 2010). The first is to
adjust the YN scores, using a correction formula. The test results from learners
checking pseudowords are adjusted using a variety of formulae, to better reflect
their actual vocabulary size. Four such formulas were studied in Huibregtse,
Admiraal, and Meara (2002): h-f, cfg, Dm and Isdt. Subsequently Schmitt (2010, p.
201) noted that ‘‘it is still unclear how well the various adjustment formulas work’’.
The other common use of pseudowords is to set a maximum acceptable
number, beyond which ‘‘the data are discarded as unreliable’’ (Schmitt, 2010,
p. 201). Schmitt, Jiang, and Grabe (2011) set their limit at three (10% of their 30
Vocabulary Learning and Instruction
Volume 2, Issue 1, September 2013
http://vli-journal.org
Please cite this article as: Stubbe, R. (2013). Comparing regression versus correction formula
predictions of passive recall test scores from yes�no test results. Vocabulary Learning and
Instruction, 2 (1), 39�46. doi: 10.7820/vli.v02.1.stubbe

pseudowords), as did Barrow, Nakanishi, and Ishino (1999). Stubbe (2012b)demonstrated that a cut-off point of four (12.5% of the pseudowords) better suited
those YN test results. Stubbe and Stewart (2012) present a novel usage for YN test
pseudoword data (also referred to as false alarms, FAs) � the creation of a standard
least squares (multiple regression) model and formula which can be used to predict
PR test scores using self-reports of lexical knowledge on a YN test. PR is the
second most advanced of the four degrees of word knowledge studied in Laufer and
Goldstein (2004), along with (in descending order of difficulty) active recall, active
recognition and passive recognition. The final two degrees of word knowledge,active and passive recognition are normally tested using a multiple-choice format
(for example, the Vocabulary Levels Test, Nation, 1990; Schmitt, Schmitt, &
Clapham, 2001). Finally, the use of regression analysis with YN test results, though
not that common, is not unprecedented in the literature (Mochida & Harrington,
2006).
2 Aim
The aim of this study is to determine which better adjusts yes-no test results
to predict passive recall test scores: regression formulas as outlined in Stubbe andStewart (2012) or correction formulas, such as the four considered in Huibregtse et
al. (2003).
3 Method
3.1 Test preparation
For this study a yes-no test was prepared consisting of 96 real-words [six
loanwords and six non-loanwords from each of the eight JACET 8000 (2003) levels]
plus 32 pseudowords. The nine best pseudowords as well as the top 40 real-wordsidentified in Stubbe and Stewart (2012), plus four more non-loanwords from the
pilot to this study (Stubbe & Yokomitsu, 2012) were included in this item pool. The
remaining 52 real-words were randomly selected as required from the various
JACET 8000 (2003) levels, and the 23 additional pseudowords were randomly
selected from Tests 101�106 of the EFL Vocabulary Tests (Meara, 2010). Both real
words and pseudowords were randomly distributed throughout the test. A passive
recall test (L2 to L1 translations) of the same 96 real-words, all randomly
distributed, was also created.
3.2 Testing procedure and sample
Participants took the yes-no test at the beginning of one class in July orAugust 2012. This was a paper test in which the students signaled whether they
knew a word by filling in either a yes bubble or a no bubble beside each item. The
same 455 students took a paper passive recall test towards the end of that same
class in order to maximize test pairings. The yes-no test was scored by means of an
optical scanner; the passive recall test was hand-marked by three native Japanese
raters. Inter-rater reliability was 92%, and Facets analysis (Linacre, 2012) revealed
40 Stubbe: Regression versus Correction Formula Predictions
Vocabulary Learning and Instruction, 2 (1), 39�46.

that the raters were basically equal with overall measures of 0.02, 0.02 and �0.04logits. Participants were all students enrolled in one of four Japanese universities,
with Test of English for International Communication (TOEIC†), Educational
Testing Service (ETS), scores ranging from about 200 through 450. Of the 455
participants, 24 had checked more than eight pseudowords each, which is greater
than two standard deviations (SDs) above the original false alarm mean of 2.17.
These 24 outliers will not be included in this study as they could skew the results of
any regression formula application (Tabachnick & Fidell, 2007), leaving a sample
size of 431.
3.3 The RF and analysis procedure
Stubbe and Stewart (2012, p. 6) improved their original RF by utilizing itemanalysis to select 40 of the 120 real-words on the YN test which had the highest phi
correlations to PR test results, and the 9 pseudowords with the highest negative-
point biserial correlations to overall translation test scores. The resulting RF was
reported as ‘‘True knowledge of tested words �3.26 � (0.51�YN Score) � (2.39�FAs)’’, hereinafter referred to as the ‘‘S&S RF’’ (Stubbe & Stewart Regression
Formula). This formula was based on a sample size of 69 of the original 71, as two
outliers with high FA counts (also more than two SDs above the FA mean) were
removed because they could have seriously skewed the any application of a RF. Notreported in that study (because of space limitations) was that the four correction
formulas had correlations with translation test scores ranging from 0.676 through
0.768, while the S&S RF had a correlation of 0.769.
The results of applying the S&S RF and the four correction formulas will be
compared using half of our data set by first sorting the 455 participants by PR test
scores (highest to lowest), and then by FAs (lowest to highest), and removing the
bottom 24 false alarm outliers (discussed above) leaving the sample size of 431. This
dual sorting removed the outliers and should ensure the creation of two groups of
comparable ability and honesty levels. Finally every second participant was
assigned into Group A, the remainder in Group B (n �215 and 216, respectively).All five formulas were used to predict PR test scores based on YN results (real-
word and pseudoword) for Group A to determine the most useful formula. To
determine if S&S RF can be improved upon, a revised RF was generated based on
regression analysis of Group A’s results. The new RF and four correction formula
will be applied to Group B’s results in a manner replicating the above, to determine
the most useful prediction formula.
3.4 The four correction formulas
The four correction for guessing formulas presented in Huibregtse et al. (2002)
and used in this study are h�f, cfg, Dm and Isdt. With the first formula, h-f,
(Anderson & Freebody, 1983) the proportion of FAs relative to the total number of
pseudowords (the FA rate, f), is subtracted from the proportion of hits relative tothe total number of real-word items (the hit rate, h) to create the formula: true hit
rate � (h�f). The remaining increasingly more complicated correction formulas are
all based on this hit rate and FA rate (h and f):
Stubbe: Regression versus Correction Formula Predictions 41
Vocabulary Learning and Instruction, 2 (1), 39�46.

a) cfg (correction for guessing: Anderson & Freebody, 1983; Meara & Buxton,1989),
b) Dm (Meara, 1992),
c) Isdt (Huibregtse et al., 2002).
4 Results and discussion
Means and standard deviations (SDs) for the YN test and the PR test results
are presented in Table 1. The nearly 43% drop in item mean (47.94 versus 27.42,
YN and PR tests, respectively) can be interpreted as students overestimating their
lexical knowledge on the YN test. However, PR versus recognition of word formsand meanings offers another explanation. Considering this recall versus recognition
dichotomy, Laufer and Goldstein (2004, p. 408) explained that ‘‘recalling a word’s
meaning or form can be considered a more advanced degree of knowledge than
recognizing it’’. Additionally, Nation and Webb (2011) suggest that partial word
knowledge may also contribute to such a gap.
Table 2 reports the results of applying the S&S RF and four correction
formulas to Group A’s YN test results (n �215). Similar to the full 431
participants, the drop between the recognition YN test results and the PR test
results was about 43%. YN results correlated quite strongly with PR test scores (r�0.783) but false alarm counts did not (r ��0.059), suggesting that FA rates did
Table 1. Summary of Yes�No and Translation Tests
Test Mean SD Range Low High Reliability
YN Items 47.94 16.96 78 5 83 0.95
YN FAs 1.58 1.76 8 0 8 n/a
PR Items 27.42 12.14 58 3 61 0.92
Note. Reliability �Cronbach’s alpha; n �431; k � ;96 real-words and 32pseudowords on the yes�no test and 96 real-words on the translation tests.
Table 2. Means, SDs, Correlations and Residuals of Applying the
Regression Formula and the Four Correction Formula to Group A
(n �215)
mean SD r residual
PR Score 27.44 12.00 1 �YN Score 48.45 16.71 0.783 �FA Total 1.57 1.75 �0.059 �S&S RF 24.36 8.46 0.825 7.65
h-f 43.73 16.07 0.834 18.60
cfg 46.10 16.99 0.817 21.14
Dm 36.68 22.09 0.770 17.52
Isdt 51.73 12.11 0.789 25.52
Note. r �correlation (Pearson Product-Moment) with translation test scores.Residuals were calculated by squaring the differences between each PR testscore and each of the five predictions, summing those squares, calculating themean and finally acquiring the square root. Closest mean (to PR score mean),highest correlation and smallest residual are in bold.
42 Stubbe: Regression versus Correction Formula Predictions
Vocabulary Learning and Instruction, 2 (1), 39�46.

not substantially increase as ability level decreased, a finding shared by Stubbe
(2012a). The highest correlation with PR test scores was the h�f correction formula,
with S&S RF placing second (0.834 and 0.825, respectively). Using Chen and
Popovich’s (2002, p. 23) t (difference) formula for paired t-tests as adapted by Field
(2009, p. 192), the difference between the S&S RF and the h�f RF correlations were
found to be not statistically significant (t �1.270, df �212, p �0.206, two-tailed).
Based solely on these correlations with translation test scores, it appears as if the h�f formula was a slightly better predictor than the S&S RF, and significantly better
than any of the other three correction formulas (for example, the h�f and cfg
correlations were significantly different (t �2.651, df �212, p �0.0086, two-
tailed).
The means and residuals in Table 2 suggest a totally different interpretation,
however. The S&S RF mean of 24.36 when compared to the translation test mean
of 27.64 suggests that any prediction based on S&S RF would be much closer than
one based on any of the correction formulas. The residuals of 7.65 versus the higher
residuals for the correction formulas (17.52�25.52) confirm this observation. The
significance of the difference between the S&S RF mean and the mean of the
closest correction formula, Dm (23.89 and 36.68, respectively) was confirmed using
a paired t-test (t �3.461, df �214, p �0.0006, two-tailed). The effect size (Cohen,
1988) between the two means was almost large (d �0.765; r �0.357, respectively).
As only 51 of the 128 real-words and pseudowords included in this YN test
originated from Stubbe and Stewart’s (2012) reduced item set, plus the sample was
greatly increased in terms of numbers and English proficiency levels, the correlation
of 0.825 and much closer mean and lower residual (compared to any of the four
correction formulas) suggest that the S&S RF appears to predict translation test
results reasonably well.
Group A was then analyzed using multiple regression analysis to create a
revised regression formula (New RF). This was created by including the YN real-
word scores and false alarm counts as the independent variables in a multiple
regression analysis, with PR test scores as the dependent variable. Residuals
appeared randomly distributed, and there was not substantial collinearity between
the two predictor variables (r �0.277). The new RF, which was used to predict
Group B’s PR test scores, became: ‘‘passive recall knowledge of tested words �0.536 � (0.622�YN) � (2.044�FA)’’.
Group B appears to be a little weaker than Group A with lower YN and PR
test means, while the FA mean remained constant. The correlations with PR test
score are lower for the YN results, but higher for the FA counts (see Table 3). The
New RF had the highest correlation, closest mean to the PR test scores as well as
the smallest residual compared to any of the correction formulas. Using the t
(difference) formula for paired t-tests again, the difference between the New RF and
h�f correlations (0.845 and 0.842) was found to be statistically significant (t �2.382, df �213, p �0.0181) because the collinearity between the two correlations
approached 1 (r �0.999526).
As the New RF and PR test means were so close (26.82 and 27.21,
respectively), it was decided to run a one-way ANOVA comparing the Translation
test scores, the New RF predicted scores and the lowest of the correction formula
Stubbe: Regression versus Correction Formula Predictions 43
Vocabulary Learning and Instruction, 2 (1), 39�46.

predicted scores, Dm. Significant differences were found between the three
[F(2,642) �16.51, pB0.0001]. Post hoc analysis (Tukey’s HSD) revealed significant
differences between the PR test scores and the Dm predicted scores, as
well as between the New RF predicted scores and those of Dm(t �5.347 and 5.302,
pB0.0001, respectively). The significance level for the tests was set at
alpha �0.0397, using a partial Bonferroni adjustment for multiple comparisons
(3) on correlated scores (r �0.789) (Uitenbroek, 1997). The Cohen’s d effect size
between the two prediction formula means was small (d �0.450, r �0.220).However, a significant differences was not found between the translation test scores
and the New RF predicted scores (t �1.317, p �0.189, in the same post hoc
analysis), and the Cohen’s d effect size between these two means was negligible
(d �0.034, r �0.017). These findings support the suggestion that the New RF is a
significantly stronger predictor of PR scores than any of the correction formulas.
5 Conclusion
The ability to grade yes-no tests using an optical scanner makes them
considerably more convenient than traditional translation tests, which must be
hand-marked by the teacher or researcher. Developing the ability to reliably predictpassive recall ability based upon yes-no test scores could be a valuable contribution
to the field of lexical development. The correlations arrived at in this study (0.825�0.845) and especially the closeness of the new regression formula’s predicted scores
to the actual translation test scores in the second analysis (Group B) suggest that
using yes-no test real-word and pseudoword results to predict passive recall ability
holds promise. The improved prediction ability of the New RF (R2 �70.56%) over
the original S&S formula (R2 �68.56%) confirms that testing similar populations
with items similar to those from which the RF(s) were derived also appears to beimportant for predictions. It may also suggest that caution should be exercised
when using this approach with different test items or sample populations.
Table 3. Means, SDs, Correlations and Residuals of Applying the
Regression Formula and the Four Correction Formulas to Group B
(n �216)
Mean SD r Residual
PR Score 27.21 12.53 1 �YN Score 47.63 17.56 0.769 �FA Total 1.57 1.75 �0.086 �New RF 26.82 10.17 0.845 6.61
h�f 42.70 16.35 0.842 17.70
Cfg 45.05 17.41 0.816 20.41
Dm 35.05 23.78 0.780 17.68
Isdt 50.89 12.49 0.816 24.66
Note. r �correlation (Pearson Product-Moment) with translation test scores.Residuals were calculated by squaring the differences between each PR testscore and each of the five predictions, summing those squares, calculating themean and finally acquiring the square root. Closest mean (to PR score mean),highest correlation and smallest residual are in bold.
44 Stubbe: Regression versus Correction Formula Predictions
Vocabulary Learning and Instruction, 2 (1), 39�46.

Directions for future research include improving the YN test items using theitem analysis approach outlined in Stubbe and Stewart (2012) and to continue
testing and refining the prediction formulas with other samples. Regression analysis
could also be used to determine whether the optimal the cut-off point for false
alarm outliers is the greater than two SDs above the false alarm mean utilized in this
study.
AcknowledgmentsI would like to thank Shintaro Hoke and the staff of the Language Education and
Testing Center (LERC) of Kyushu Sangyo University for marking the translation tests. I alsothank and acknowledge Jeffrey Stewart for his original idea of applying regression analysisto YN real-word and pseudoword results for predicting receptive vocabulary knowledge, aswell as for his invaluable editing of this paper.
References
Anderson, R.C., & Freebody, P. (1983). Reading comprehension and the
assessment and acquisition of word knowledge. In Hutson, B.A. (Ed.),
Advances in Reading/Language Research, Vol. 2 (pp. 231�256). Greenwich,
CT: JAI Press.
Barrow, J., Nakanishi, Y., & Ishino, H. (1999). Assessing Japanese college students’
vocabulary knowledge with a self-checking familiarity survey. System, 27 (2),
223�247. doi:10.1016/S0346-251X(99)00018-4
Chen, P., & Popovich, P. (2002). Correlation: Parametric and non-parametric
measures. In Lewis-Beck, M. (Ed.), Sage university papers series on
quantitative applications in the social sciences (pp. 7�139). Thousand Oaks,
CA: Sage.
Cohen, J. (1988). Statistical power analysis for the behavioral sciences (2nd ed).
Hillsdale, NJ: Lawrence Erlbaum.
Field, A. (2009). Discovering statistics using SPSS (3rd ed.). London: Sage.
Huibregtse, I., Admiraal, W., & Meara, P. (2002). Scores on a yes�no vocabulary
test: Correction for guessing and response style. Language Testing, 19, 227�245. doi:10.1191/0265532202lt229oa
JACET Basic Word Revision Committee. (2003). JACET list of 8000 basic words.
Tokyo: Japan Association of Language Teachers.
Laufer, B., & Goldstein, Z. (2004). Testing vocabulary knowledge: Size, strength,
and computer adaptiveness. Language Learning, 54, 399�436. doi:10.1111/j.
0023-8333.2004.00260.x
Linacre, J.M. (2012). Facets computer program for many-facet Rasch measurement,
version 3.70.0. Beaverton, Oregon: Winsteps.com. Retrieved from
http://www.winsteps.com//index.htm
Meara, P. (1992). New approaches to testing vocabulary knowledge. Draft paper.
Swansea: Centre for Applied Language Studies, University College Swansea.
Stubbe: Regression versus Correction Formula Predictions 45
Vocabulary Learning and Instruction, 2 (1), 39�46.

Meara, P. (2010). EFL vocabulary tests. Swansea: _lognostics second edition 2010.Retrieved from http://www.lognostics.co.uk/vlibrary/meara1992z.pdf
Meara, P., & Buxton, B. (1987). An alternative to multiple choice vocabulary tests.Language Testing, 4 (2), 142�154.
Mochida, A., & Harrington, M. (2006). Yes/No test as a measure of receptivevocabulary. Language Testing, 23, 73�98. doi:10.1191/0265532206lt321oa
Nation, I.S.P. (1990). Teaching and learning vocabulary. Boston, MA: Heinle andHeinle.
Nation, I.S.P., & Webb, S. (2011). Researching and analyzing vocabulary. Boston,
MA: Heinle.
Schmitt, N. (2010). Researching vocabulary: A vocabulary research manual. New
York, NY: Palgrave Macmillan. doi:10.1057/9780230293977
Schmitt, N., Jiang, X., & Grabe, W. (2011). The percentage of words known in a
text and reading comprehension. Modern Language Journal, 95, 26�43.doi:10.1111/j.1540-4781.2011.01146.x
Schmitt, N., Schmitt, D., & Clapham, C. (2001). Developing and exploring the
behavior of two new versions of the vocabulary levels test. Language Testing,18, 55�88. doi:10.1177/026553220101800103
Stubbe, R. (2012a). Do pseudowords false alarm rates and overestimation rates inYes/No vocabulary tests change with Japanese university students’ English
ability levels? Language Testing, 29 (4), 471�488. doi:10.1177/02655322
11433033
Stubbe, R. (2012b). Searching for an acceptable false alarm maximum. Vocabulary
Education & Research Bulletin, 1 (2), 7�9. Retrieved from http://jaltvocab.
weebly.com/uploads/3/3/4/0/3340830/verb-vol1.2.pdf
Stubbe, R., & Stewart, J. (2012). Optimizing scoring formulas for yes/no vocabulary
checklists using linear models. Shiken Research Bulletin, 16 (2), 2�7. Retrieved
from http://teval.jalt.org/node/12
Stubbe, R., & Yokomitsu, H. (2012). English loanwords in Japanese and the
JACET 8000. Vocabulary Education & Research Bulletin, 1 (1), 10�11.
Retrieved from http://jaltvocab.weebly.com/uploads/3/3/4/0/3340830/verb-
vol1.1.pdf
Tabachnick, B., & Fidell, L. (2007). Using multivariate statistics (5th ed.). Boston,
MA: Pearson Education Inc.
Uitenbroek, D.G. (1997). SISA binomial. D.G. Uitenbroek. Retrieved from
http://www.quantitativeskills.com/sisa/calculations/bonfer.htm
46 Stubbe: Regression versus Correction Formula Predictions
Vocabulary Learning and Instruction, 2 (1), 39�46.

Sources of Differential Item Functioning betweenKorean and Japanese Examinees on a Second-
Language Vocabulary Test
Tim Stoeckel and Phil BennettMiyazaki International College
doi: http://dx.doi.org/10.7820/vli.v02.1.stoeckel.bennett
Abstract
The use of item response theory in equating or creating computer-
adaptive tests relies on the assumption of invariance of item parameters
across populations. This assumption can be assessed with an analysis of
differential item functioning (DIF). The purpose of this study was (a) to
ascertain whether DIF between two native language groups was present
on a 90-item multiple-choice English vocabulary test and (b) to explore
the causes of DIF, should it exist. Participants were 184 Korean and 146
Japanese undergraduate students learning English as a foreign language
in their home countries. A separate calibration t-test approach was used
to identify DIF, with the criteria set at p B 0.01 and effect size �1 logit,
calculated as the difference in Rasch item-difficulty between the two
groups. Twenty-one items displayed DIF. The causes of DIF in nine of
those items were tentatively identified as relating to their status as
loanwords in the L1. When a tested word was a loanword in both Korean
and Japanese, differences in both the frequency and range of use of the
loanword in the two languages predicted the direction of DIF. Similarly,
phonological/orthographic overlap between two separate English loan-
words in the L1 was found to be a possible cause of DIF. Implications for
test development and further research in this area are discussed.
1 Background
In the area of second-language vocabulary test development, item response
theory (IRT) has been used in attempts to create equivalent forms of well-known
tests such as the Vocabulary Levels Test (VLT) (Beglar & Hunt, 1999) and for the
calibration of item banks for computer-adaptive tests such as the Lexxica Word
Engine (Browne, 2008). In both of these IRT applications, an underlying
assumption is the invariance of item parameters. That is, the difficulty of test
items should remain stable in relation to other items for any sample of the intended
test population (Hambleton & Jones, 1993). It is this assumption that enables test
developers to balance equivalent test forms with a range of items of similar
difficulties, and in computer-adaptive tests, it enables statements regarding the
probability of correctly answering un-administered test items once a person’s ability
is estimated.
The degree to which test items meet the IRT assumption of invariance can be
assessed with an analysis of differential item functioning (DIF). DIF is present
when two or more groups of examinees perform differently on a test item even after
Vocabulary Learning and Instruction
Volume 2, Issue 1, September 2013
http://vli-journal.org
Please cite this article as: Stoeckel, T., & Bennett, P. (2013). Sources of differential item
functioning between Korean and Japanese examinees on a second-language vocabulary test.
Vocabulary Learning and Instruction, 2 (1), 47�55. doi: 10.7820/vli.v02.1.stoeckel.bennett

differences in ability have been accounted for (Zumbo, 1999). When DIF analysisidentifies such items, the source of DIF is investigated, and items displaying DIF
thought to be caused by true differences in the latent construct (construct-relevant
causes) can be retained while those with clear sources of bias such as differences
resulting from gender, race, or ethnicity are either discarded or revised (Zieky,
2006).
Though there is a growing body of literature describing DIF analyses in
second-language testing (e.g., Abbott, 2007; Pae, 2012; Park, 2008), few studies
have investigated DIF between different native language groups in ESL vocabulary
testing, and to our knowledge only two of those explored the causes of DIF when it
was detected. Chen and Henning (1985) and Sasaki (1991) both compared nativespeakers of Spanish and Chinese and found that items testing English words which
were cognates in Spanish were more difficult for the Chinese group.
The existence of cognates (words with a common etymological origin) or
loanwords (words borrowed into a language) may lead to DIF, but this is due to
natural language evolution and should not be considered item bias. Japanese and
Korean are two languages which have adopted a large number of English-derived
loanwords into their lexicons (Baker, 2008b; Daulton, 2008). Daulton has shown,
however, that multiple factors complicate loanword status, including the degree of
conceptual overlap between the loanword and its English equivalent (e.g., the
Japanese feminisuto referring to both feminist and gentleman) and the effects ofshortening (e.g., department store becoming depaato) or compounding (e.g., personal
computer becoming pasocon) that may occur when a word is borrowed into another
language. These factors are likely to affect whether the presence of a loanword in the
first language (L1) will lead to knowledge of its counterpart in a second language
(L2). As the frequency with which a learner encounters a word is a powerful
predictor of word knowledge (Milton, 2009), the frequency of a loanword in the L1
may also affect the likelihood of knowing the corresponding word in the L2.
2 Purpose of the study
The objective of this study was to ascertain whether DIF was present on amultiple-choice English vocabulary test administered to Japanese and Korean
learners. If DIF were found, the study would then explore factors which could
explain the differing response patterns between the two native-language subgroups,
including (but not limited to) the frequency and range of use of loanwords as well
as construct-irrelevant difficulty leading to item bias.
3 Method
The (convenience) sample included 184 Korean and 146 Japanese college
students residing in their home countries at the time of the study. The instrument
was a 90-item multiple-choice test designed to assess receptive written knowledge ofgeneral and academic vocabulary; it took approximately 30 minutes to complete.
To ensure that the test was representative of the content domain (Messick, 1989), it
was constructed by randomly sampling 30 words from each of the first and second
1,000 words of the General Service List (available at http://www.lextutor.ca/freq/
48 Stoeckel and Bennett: Sources of differential item functioning between Korean and
Japanese examinees
Vocabulary Learning and Instruction, 2 (1), 47�55.

lists_download/) and 30 from the Academic Word List (Coxhead, 2000). The resultsof the test did not affect participants’ course grades.
A separate calibration t-test approach was used to identify items displayingDIF between the Korean and Japanese groups. To account for any initial
differences in group ability, Rasch-based person measures were calculated from
the entire data set, and these values were anchored when items were calibrated
separately for each group. The criteria for DIF was set at p B 0.01 and effect size
�1 logit, calculated as the difference in Rasch item-difficulty between the two
groups. This design was considered appropriate given the sample size and unknown
levels of group ability (Linacre, 1994; Riley, 2011).
For each DIF item, the frequency with which the tested word occurs as a
loanword in each of the Korean and Japanese languages was estimated. This count
included all related inflected and derived forms of the word as defined by Bauer andNation’s (1993) level seven criteria for word family membership. It also included
loaned compound words which retain a clear sense of the tested word. This
approach was taken because research has suggested that the combined frequency of
all members of a word family is a better predictor of word recognition than the
frequency of only the word itself (Nagy, Anderson, Schommer, Scott, & Stallman,
1989).
Possible loanword forms were initially identified using bilingual English�Korean (Baker, 2008a) and English�Japanese (Daulton, 2008) loanword lists and
Google Translate (http://translate.google.com/). One Korean and two Japanese
informants, all highly English-proficient, confirmed loanword status and providedinformation regarding the range of use of each loanword in their native language as
compared to English. Frequencies of these loanword forms were then retrieved
from a Japanese list based on a 253-million word web-crawled corpus (University of
Leeds, Center for Translation Studies, n.d.) and a Korean list based on a 3-million
word corpus (The National Institute of the Korean Language, as cited by Schmitt
Youngberg, 2006). Low-frequency loanwords encountered primarily in such
contexts as media titles and blogs were not included in these counts if they were
unknown to our informants and occurred less than once per million words ofrunning text. Examples include loanwords in both languages for collector, used in
movie titles, and globalism, found principally in blogs or minor online news venues.
The informants were also shown each DIF item and asked to identify possiblesources of confusion and to speculate on whether any aspect of the item would
make it particularly easy or difficult for members of their L1 group. These
informants were not shown the direction of DIF. Finally, the authors reviewed each
of these items for possible sources of DIF.
4 Results
Preliminary Rasch analysis indicated satisfactory person fit, item fit, and
construct dimensionality. Twenty-one of the 90 test items displayed DIF. Ten of
these were classified as loanwords in either Korean or Japanese and are shown with
their frequency counts and DIF orientations in Table 1. The words tested in theremaining 11 DIF items are shown together with their DIF orientations in Table 2.
Stoeckel and Bennett: Sources of differential item functioning between Korean and
Japanese examinees 49
Vocabulary Learning and Instruction, 2 (1), 47�55.

In examining causes of DIF, the frequency of the tested word’s loan
equivalent in the native language predicted the direction of DIF in all of the
words in Table 1 except room and pose.
Three additional and overlapping causes of DIF were tentatively identified.
First, the range of use of the tested word’s loan equivalent in each L1 helped explain
the DIF orientation of room and provided additional insight into response patterns
for hall. In Japanese, loan forms of room and hall appear by themselves and in
numerous compounds (e.g., bedroom, living room; concert hall, wedding hall), and
Table 1. Loanword DIF Items with Loanword
Frequency in the L1
Frequencya
Tested word Japanese Korean
Easier for Japanese
Link 276.6 B1.0
Zero 28.6 2.5
Hall 27.5 18.6
Globe 20.4 B1.0
Room 15.2 29.2
Sheet 12.8 6.7
Collection 12.3 1.8
Device 11.5 B1.0
Mixed 6.1 2.5
Easier for Koreans
Pose 5.9 4.6
Note. Bold font denotes test items whose difficultieswere not predicted by frequency.aFrequency (per million words of running text) ofloanwords which are family members or compoundderivations of the tested word.
Table 2. Non-Loanword DIF Items
Tested word
Easier for Japanese
Interval
Rise
Easier for Koreans
Contemporary
Compound
Dominant
Erode
Solution
Crucial
Formula
Complain
Bias
50 Stoeckel and Bennett: Sources of differential item functioning between Korean and
Japanese examinees
Vocabulary Learning and Instruction, 2 (1), 47�55.

the range of use of these loanwords is similar to that of English. By contrast, the
Korean loanwords for room and hall are used in fewer compounds, and their
meanings are more restricted. Specifically, the Korean loan for room refers nearly
exclusively to a room in a hotel or inn. Similarly, the Korean loan for hall, though
retaining the English sense of ‘‘large room,’’ is associated with something akin to a
lobby or vestibule. This limited range of use of the Korean loanwords for room and
hall may have contributed to item difficulty. In fact, despite the high frequency of
these words in English, the Rasch-based difficulty estimates for the items testing
these words were higher than for any other items for the Korean examinees.
Knowing these disparate usage patterns for room and hall, it became apparent
that the wording of distractors was another possible source of DIF. For room,
distractor b, a place to play (shown in Table 3), attracted many high-ability Korean
respondents. Perhaps these individuals associated room with the loanword meaning
hotel room, which in turn was associated with leisure. The interpretation is less clear
for hall, but our Korean informant suggested that perhaps distractor b, a place
under a building, was attractive because lobbies are typically on the first floor, under
the rest of the building. Though it is possible that DIF would not have been present
in these items if different distractors had been used, it is difficult to conclude that
these items are biased because the difficulty that Korean respondents appear to
experience cannot be considered construct irrelevant.
A final potential cause of DIF was phonological/orthographic overlap
between the tested word and another English loanword in the L1. The loanword
for hall in both Korean and Japanese is identical in written and spoken form to the
loanword for hole. This could explain the relatively high number of respondents in
both groups who chose distractor b, a place under a building (Table 3).
No cause of DIF was evident for pose in Table 1 or for any of the words listed
in Table 2. Neither the informants nor the authors detected sources of bias in item
Table 3. Items with DIF from Multiple Causes
Responses
Korean Japanese
Ability Ability
Item n M n M
Room: How many rooms are there?
a. Something to sleep on 18 0.55 6 �0.20
b. A place to play 84 2.90 9 0.28
c. Something for drawing with 4 �1.27 1 �1.44
d. A space in a building 75 2.56 130 1.21
Hall: We went into the hall.
a. A large building 63 2.89 87 1.31
b. A place under a building 96 2.56 38 1.08
c. An office in a school 8 0.43 7 0.32
d. A house in a garden 9 0.77 5 0.19
Note. Bold font denotes the correct answer.
Stoeckel and Bennett: Sources of differential item functioning between Korean and
Japanese examinees 51
Vocabulary Learning and Instruction, 2 (1), 47�55.

wording, and a post hoc analysis of non-uniform DIF resulted in no discernible
pattern of differences between learners of high and low ability for these items.
In summary, linguistic (i.e., construct-relevant) sources of DIF were found for
each loanword in Table 1 except pose, and no apparent sources of bias were found
in the remaining items. The items for room and hall pose measurement-related
problems in that one distractor in each item attracts examinees of unduly high
ability, and for this reason, these items could be improved with revision.
5 Discussion
These findings reveal causes of difficulty in items assessing knowledge of words
which are loanwords in the L1. Whereas previous research has found that yes/no
cognate status could explain DIF between native language groups (Chen & Henning,
1985; Sasaki, 1991) and that items testing loanwords are generally easier than other
words of similar frequency in the L2 (Beglar, 2010), we have found evidence that item
difficulty may be mediated by both the frequency and the usage patterns of the L1
loanword aswell as phonological/orthographic overlap with other loanwords in the L1.
The findings of this study have clear implications for development of second-
language vocabulary tests for use in cross-cultural contexts. Even when bias is not
present, test items which consistently demonstrate DIF require special attention if
multiple versions of a test are purported to be of equivalent difficulty, or if item
calibrations are used in computer-adaptive testing. In these cases, we concur with
Brown and Iwashita (1996) in that best practice entails separately calibrating test
items for each native language group. In the case of multiple versions, separate sets
of equivalent forms could then be made for each native language group, and in the
case of computer-adaptive testing, a prompt for examinees to enter their native
language could be used to determine which set of item calibrations is applied.
The alternative approach would be to discard DIF items, but this is problematic
for several reasons. First, there would be a risk of compromising construct
representativeness in that it would disregard the principle of random sampling from
word-frequency bands which is common in L2 vocabulary test construction. Second,
it would overlook real linguistic differences between the groups. Third, it appears that
DIF in L2 vocabulary items is relatively common between native language groups,
making it impractical to discard such items in tests used with diverse populations.
This study was limited in that our native informants were those people
available to us at the time of the study. As such, we had only one Korean and two
Japanese informants, and none of them had expertise in language testing. A second
limitation was that the Korean corpus was small. Though the texts in the corpus
were representative of seven separate genres, and we needed only to determine
whether loanword frequency was greater than that in Japanese, a larger corpus
would have provided more certainty in those determinations.
Further research would help to clarify causes of DIF in L2 vocabulary testing.
The present study has found that for items displaying DIF, the frequency and range
of use of an L1 loanword equivalent are good predictors of the direction of DIF.
However, an examination of the same variables for items not displaying DIF would
52 Stoeckel and Bennett: Sources of differential item functioning between Korean and
Japanese examinees
Vocabulary Learning and Instruction, 2 (1), 47�55.

also be useful, since it could offer insights as to whether loanword frequency canonly explain DIF or whether it can also predict in which items it will occur.
Another research design that would help to clarify sources of DIF would be toengage speakers of Korean and Japanese in a think-aloud study. The informants
used in this study provided some indication of how different L1 groups approach test
items, and the possible sources of DIF described here might be confirmed if a greater
number of informants explained their thought processes as they took each item. It
would also be informative to conduct DIF analyses for popular instruments such as
the VLT to ascertain whether multiple forms which have been found to be equivalent
with one language group (e.g., Beglar & Hunt, 1999) remain so with others.
Author Note
Tim Stoeckel, Department of Comparative Culture, Miyazaki International
College; Phil Bennett, Department of Comparative Culture, Miyazaki Interna-tional College.
Correspondence concerning this article should be addressed to Tim Stoeckel,
Department of Comparative Culture, Miyazaki International College, 1405 Kano,Kiyotake, Miyazaki 889-1605. E-mail: [email protected],
References
Abbott, M.L. (2007). A confirmatory approach to differential item functioning on
an ESL reading assessment. Language Testing, 24 (1), 7�36. doi:10.1177/
0265532207071510
Baker, K. (2008a). English�Korean Transliteration List (v0.1). Electronic
document. Retrieved from http://purl.oclc.org/net/kbaker/data
Baker, K. (2008b). Multilingual distributional lexical similarity (Doctoral
dissertation). Retrieved from http://www.ling.ohio-state.edu/~kbaker/Kirk
BakerDissertation.pdf
Bauer, L., & Nation, P. (1993). Word families. International Journal of
Lexicography, 6 (4), 253�279. doi:10.1093/ijl/6.4.253
Beglar, D. (2010). A Rasch-based validation of the Vocabulary Size Test. Language
Testing, 27 (1), 101�118. doi:10.1177/0265532209340194
Beglar, D., & Hunt, A. (1999). Revising and validating the 2000 Word Level and
University Word Level Vocabulary Tests. Language Testing, 16 (2), 131�162.
doi:10.1177/026553229901600202
Brown, A., & Iwashita, N. (1996). Language background and item difficulty:
The development of a computer-adaptive test of Japanese. System, 24 (2),
199�206. doi:10.1016/0346-251X(96)00004-8
Browne, C. (2008). A research-based approach to developing portable technology
software for testing and teaching high frequency vocabulary. In I. Koch (Ed.),
CamTESOL Conference on English Language Teaching: Selected Papers:
Volume 4, 2008 (pp. 8�18). Retrieved from http://www.camtesol.org/Download/Earlier_Publications/Selected_Papers_Vol.4_2008.pdf
Stoeckel and Bennett: Sources of differential item functioning between Korean and
Japanese examinees 53
Vocabulary Learning and Instruction, 2 (1), 47�55.

Chen, Z., & Henning, G. (1985). Linguistic and cultural bias in languageproficiency tests. Language Testing, 2 (2), 155�163. doi:10.1177/
026553228500200204
Coxhead, A. (2000). A new academic word list. TESOL Quarterly, 34 (2), 213�238.
doi:10.2307/3587951
Daulton, F.E. (2008). Japan’s built-in lexicon of English-based loanwords. Clevedon,
UK: Multilingual Matters.
Hambleton, R.K., & Jones, R.W. (1993). Comparison of classical test theory and
item response theory and their applications to test development. Educational
Measurement: Issues and Practice, 12 (3), 38�47. Retrieved from http://ncme.
org/publications/items/
Linacre, J.M. (1994). Sample size and item calibration (or person measure) stability.
Rasch Measurement Transactions, 7 (4), 328. Retrieved from http://www.
rasch.org/rmt/contents.htm
Messick, S. (1989). Meaning and values in test validation: The science and ethics of
assessment. Educational Researcher, 18 (2), 5�11. doi:10.3102/0013189X018
002005
Milton, J. (2009). Measuring second language vocabulary acquisition. Clevedon, UK:
Multilingual Matters.
Nagy, W., Anderson, R.C., Schommer, M., Scott, J.A., & Stallman, A.C. (1989).
Morphological families in the internal lexicon. Reading Research Quarterly,
24 (3), 262�282. doi:10.2307/747770
Pae, T.I. (2012). Causes of gender DIF on an EFL language test: A multiple-data
analysis over nine years. Language Testing, 29 (4), 533�554. doi:10.1177/
0265532211434027
Park, G.P. (2008). Differential item functioning on an English listening test across
gender. TESOL Quarterly, 42 (1), 115�123.
Riley, B. (2011). Considering large group differences in ability in DIF analysis.
Rasch Measurement Transactions, 25 (2), 1326. Retrieved from http://www.
rasch.org/rmt/contents.htm
Sasaki, M. (1991). A comparison of two methods for detecting differential item
functioning in an ESL placement test. Language Testing, 8 (2), 95�111.
doi:10.1177/026553229100800201
Schmitt Youngberg, K. (2006). Vocabulary lists from the National Academy of the
Korean Language. Available from: https://docs.google.com/file/d/0B1k1KSQ
CJJUKdFBvUGVqSzBLMVk/edit
University of Leeds, Center for Translation Studies. (n.d.). Japanese frequency lists:
Lemmas from the Internet corpus. [Data file]. Retrieved from http://corpus.
leeds.ac.uk/frqc/internet-jp.num
Zieky, M.J. (2006). Fairness review in assessment. In S.M. Downing, & T.M.
Haladyna (Eds.), Handbook of test development (pp. 359�376). Mahwah, NJ:Lawrence Erlbaum Associates.
54 Stoeckel and Bennett: Sources of differential item functioning between Korean and
Japanese examinees
Vocabulary Learning and Instruction, 2 (1), 47�55.

Zumbo, B.D. (1999). A handbook on the theory and methods of differential item
functioning (DIF): Logistic Regression Modeling as a Unitary Framework for
Binary and Likert-Type (Ordinal) Item Scores. Ottawa, ON: Directorate of
Human Resources Research and Evaluation, Department of National
Defense. Retrieved from http://educ.ubc.ca/faculty/zumbo/DIF/index.html
Stoeckel and Bennett: Sources of differential item functioning between Korean and
Japanese examinees 55
Vocabulary Learning and Instruction, 2 (1), 47�55.

Difficulties in Reading English Words: How doJapanese Learners Perform on a Test of
Phonological Deficit?
David Coulson, Mayumi Ariiso, Rina Kojima and Masami TanakaUniversity of Niigata Prefecture
doi: http://dx.doi.org/10.7820/vli.v02.1.coulson.et.al
Abstract
The motivation for this research is the observation of frequent read-aloud
miscues among Japanese university students, and the slow rate of reading
on simplified graded readers by many post-secondary learners. We
investigate what components of the second-language reading complex
may remain undeveloped. Word recognition in different languages
employs different phonological processes; so inadequately developed skill
in the foreign language processes may lead to poor decoding. This
situation requires formal assessment. However, practical tests of word-
recognition skill for second-language learners are not well developed.
Therefore, we adapted a test from Wydell and Kondo, replicating their
methodology to test the phonological skill of a Japanese�English
bilingual diagnosed with dyslexia. We do not assume dyslexia among
Japanese English learners. Rather, the use of this test format aims to
elucidate the state of phonological skill of word-recognition ability in
ordinary learners. The subjects were university students at discrete
proficiency levels. The results show that this skill can be remarkably
underdeveloped. The average skill of subjects with lower proficiency was
similar to the objective standard of Wydell and Kondo’s English-reading
disabled subject. Higher-proficiency subjects performed much better. The
results do not imply dyslexia, although some lower-proficiency students
may, in fact, be English-dyslexic. Instead, they focus attention on the lack
of appropriate reading skills development in English education in Japan,
and its possible effect on overall proficiency. This situation principally
indicates a need for prolonged phonics training and more extensive L2
reading.
1 Introduction
Extensive reading (ER) is essential for L2 acquisition (e.g. Hunt & Beglar,2005). However, it is not easy to develop the component skills to read freely, and
enjoyably, in a foreign language, especially when the L1 and L2 writing systems are
typologically different. Unfortunately, the Japanese curriculum devotes insufficient
time to ER, or even decoding skills. Reading in any L2 can be tiring when the
writing systems are similar, before considering the effort necessary when they are
not. Due to the ‘‘Matthew Effect’’ (Stanovich, 1985), whereby people read more if
they find it comfortable and less if they do not, a gap opens between more- and less-
able learners. Those left behind may never catch up. Ongoing practice to develop
Vocabulary Learning and Instruction
Volume 2, Issue 1, September 2013
http://vli-journal.org
Please cite this article as: Coulson, D., Ariiso, M., Kojima, R., & Tanaka, M. (2013). Difficulties in
reading English words: How do Japanese learners perform on a test of phonological deficit?
Vocabulary Learning and Instruction, 2 (1), 56�63. doi: 10.7820/vli.v02.1.coulson.et.al

automatic decoding is essential. This is because early gains in reading fluency
development are not robust. Indeed, many Japanese students’ reading skill of basic
words actually regresses upon entering high school after early, rapid progress
towards word-decoding fluency in junior high school (Coulson, Forthcoming in
2014). The lexically dense texts used in high schools do not promote fluent. Overall,
due to a lack of cumulative consolidation, even the skill of reading the highest-
frequency vocabulary, learned in junior high school, rapidly erodes. This is likely to
be one of the causes of many reading miscues. Reading speed is also found wanting
in many Japanese EFL learners. Grabe (2009) recommends that ESL learners aim
for 300 words per minute. Even on graded readers, most Japanese students read
significantly more slowly, at about 180 words per minute. This tardiness indicates
considerable effort, and hence rapid fatigue and possible loss of motivation.
Vocabulary instruction, and assessment, must take account of the decoding
challenges faced by Japanese students. Nation’s description (2001, p. 27) of what it
means to know a word creates three basic categories of Form, Meaning and Use.
Nation further subdivided each of these categories into active and passive
components. One example is knowing what a word looks like (passive) and how
it is spelled (active). Although tests for Nation’s other categories, such as size and
association, have become well known (e.g. the Vocabulary Levels Test; Nation,
1990), research on practical L2 word-recognition assessment has yet to make a
similar impact (e.g. Coulson, 2010).
Concerning the points above, this paper asks what assessing English L2
learners with tests of reading sub-skills, commonly applied for testing dyslexia, will
reveal.
1.1 Characteristics of dyslexia in L1 and L2
Dyslexia symptoms usually include delayed and poor reading, with persistent
confusion over the direction of similarly shaped letters (e.g. ‘‘b’’ and ‘‘d’’)
(e.g. Wolf, 2008). This leads to mistaken identification of words in reading and
transposition of letters in writing (e.g. ‘‘pot’’ for ‘‘top’’). According to the British
Dyslexia Association, about 10% of the population of the United Kingdom is
dyslexic, and 4% severely so in some form. Dyslexia is associated with loss of self-
esteem, and possibly a loss of motivation in education. If difficulties appear in
reading English as a foreign language, caused by similar phonological deficits as
those seen in true dyslexia, it could well have an impact on motivation and interest
in English.
Concerning such problems, it is possible for people to be apparently normal
readers of their first language, but to display dyslexic symptoms in another
language. (e.g. Meara, Coltheart, & Masterson, 1985). This is especially the case
where the L1 uses a transparent writing system with a consistent correspondence
between sound and spelling, such as Spanish, and where the L2 uses a much
more opaque writing system, such as English. Japanese is a complicated case, but
the syllabic ‘‘kana’’ system does employ a highly regular correspondence between
sounds and symbols. No estimate exists for how many Japanese L2 English learners
may be English-dyslexic, but it is plausible the figure is similar to that in English-
Coulson et al.: Difficulties in Reading English Words 57
Vocabulary Learning and Instruction, 2 (1), 56�63.

speaking countries. According to Meara et al. (1985) ‘‘it seems reasonable to guessthe incidence of severe reading problems of . . . [dyslexia]. . . will be about the same
as it is for native English speakers.’’ (p. 34).
However, the concern in this paper is principally with undeveloped, rather
than disabled, reading. Nevertheless, the two problems can both be assessed using a
test of phonological processing to check for deficits.
1.2 The importance of phonology in reading
A study on profoundly deaf children (Hanson, Liberman, & Shankweiler,
1984) found that few were skilled readers. The common point of these children was,
obviously, their inability to hear. However, reading deaf children were shown to
have phonological awareness of words. Consequently, reading involves not only
orthographic and semantic activation stemming from visual input, but also the
ability to ‘‘establish and make use of linguistically recoded representations of thelanguage’’ (p. 378).
1.3 Dyslexia testing for L2 English learners
We suggest that the skills required for fluent decoding by L2 English learnersmay be assessed by dyslexia tests. For Japanese learners, L1 reading occurs at the
syllable level and is highly consistent. In English, reading requires the mapping of
graphemes onto sub-syllable units in which there is much contextual variation.
Whichever system we learn first has a persistent effect on reading in new writing
systems, resulting in a sub-optimal sound conversion.
Further, comparison to the single subject in Wydell and Kondo’s study is
warranted as this represents an established, objective standard.
1.4 The replicated paper
Wydell and Kondo (2003) investigated AS, a bilingual English-Japanese who
previously confirmed (Wydell & Butterworth, 1999) as severely dyslexic in English.
He was raised in Japan and his Japanese reading skill was unaffected. AS studied in
Britain for a degree. After this period, the researchers tested his ability. He, and
other normal-reading subjects (English native speakers and Japanese graduatestudents in Britain), read aloud target stimuli and decided whether these were real
or non-words. Second, they were shown items which do not exist in English but
resemble the sound of actual words (e.g. ‘‘neym’’ for ‘‘name’’). Since they do not
exist in memory, such ‘‘pseudohomophones’’ require the ability to apply English
grapheme�phoneme rules to letter strings to create a phonological match to the real
English word. Poor performance, a classic symptom of dyslexia, results in a faulty
phonological code, and this can prevent the subject from realizing the item is
identical in pronunciation to a real English word. Finally, they also used a‘‘spoonerising’’ task where the task is to transpose the initials of two words and
pronounce them (e.g. ‘‘tilk mea’’ for ‘‘milk tea’’). This task requires the
manipulation of phonemes, so this task effectively reflects the state of English
58 Coulson et al.: Difficulties in Reading English Words
Vocabulary Learning and Instruction, 2 (1), 56�63.

reading development. A summary of Wydell and Kondo, whose methodology thispaper replicates, is shown in the Results section (Table 1).
2 Method
2.1 Subjects
Thirty-three Japanese first-year university students participated in this study.
They had all taken a placement test (TOEFL ITP; score range: 310�677) and beenassigned to three levels for English classes. Two of the levels were selected for this
investigation: fourteen participants in the ‘‘advanced’’ class and nineteen in the
‘‘basic’’ class. The mean TOEFL score gap between the groups was 80 points. The
stimulus words were chosen from English textbooks for Japanese junior high school
students (New Horizon 2, years 1, 2, and 3, 2008). Participants were assumed to
have studied these words and to know them as translation equivalents.
2.2 Test instrument
The test battery consisted of three parts. Test 1 had 120 high-frequency words
mixed with 40 pronounceable non-words (e.g. yake, quisp). Forty items were printedon each page. Subjects read these words aloud and judged whether they were real
words. If the subject thought the word was real, he/she marked it with a circle. The
test had 40 words per page over 4 pages. Test 2 had 150 pseudohomophones
(resembling real words when read aloud; e.g. sitty, eniwan, muvee) mixed with
pronounceable nonwords. Subjects were asked to read these words aloud. If they
thought a word is a pseudohomophone, they marked it with a circle. Test 3 was a
spoonerising test where the initial phonemes of a compound word had to be
exchanged. The researchers pronounced each compound word and subjectsanswered. There were 10 items.
Student researchers sat with each participant in a quiet room. They instructedthem to proceed quickly and accurately. The number of correctly pronounced items
and errors was recorded. Each interview required about 20 minutes.
3 Results
Table 1 shows data from AS, the single subject in Wydell and Kondo (2003),
and Table 2 shows the corresponding data for the 33 subjects in our replicated
investigation.
AS (148 points) scored less than other Japanese subjects whose score (156)
was almost identical to native speakers (158). In Test 2, the pseudohomophone task
was difficult for the Japanese participants and especially so for AS. He fell far
behind the other Japanese students, with 30 errors in 50 items. Japanese students in
turn were far behind native speakers, for whom the test posed almost no difficulty.
Moving onto Table 2, the two groups of university subjects in this
investigation performed statistically similarly to each other in Test 1. However,the mean score of the Basic Class (7.8 points) was closer to AS than to the Advanced
Coulson et al.: Difficulties in Reading English Words 59
Vocabulary Learning and Instruction, 2 (1), 56�63.

Class. In Test 2, the mean number of mistakes of the Basic Class (19.7 mistakes in
50 items) was significantly more than the Advanced class (pB0.01, t�2.4).
Regarding the score of the Basic Class in Test 2, a noticeable aspect is the very
large degree of variation in their performance (SD �11.1) on pseudohomophones
in comparison to the Advanced Class. They performed in a much narrower range
(SD �2.2). Notably, four students from the Basic Class had a lower score than AS.
The spoonerising test results are largely consistent with the results above.
Table 3 shows that the Basic Class mean is more similar to AS than to the
Advanced Class. English native speakers have an advantage over all groups.
Table 2. The Results from the Present Investigation (n.�33)
Non-words
(40) # of
mistakes
Test 1
(160 items)
Real-words
(120) # of
mistakes
Total
score
Pseudo-
words (50) #
of mistakes
Test 2
(200 items)
Non-words
(150) # of
mistakes
Total
score
Basic class
n.�19
7.8
SD 3.3
2.6
SD 1.9
149.5
SD 4.0
19.7
SD 11.1
8.1
SD 2.2
161.8
SD 24.4
Advanced
Class
n.�14
5.3
SD 2.4
0.8
SD 0.9
153.9
SD 2.2
11.1
SD 2.2
9.9
SD 2.2
180.8
SD 5.2
Table 3. Spoonerising Task: All Results
Test 3 (10 items)
Score
(Wydell & Kondo)
AS 5
English Native Speakers 9.3
(This study)
Basic Class 4.7
Advanced Class 7.8
Table 1. A Summary of the Results Reported by Wydell and Kondo (2003) (n.�13)
Non-words
(40) # of
mistakes
Test 1
(160 items)
Real-words
(120) # of
mistakes
Total
score
Pseudo-
words (50)
# of
mistakes
Test 2
(200 items)
Non-words
(150) # of
mistakes
Total
score
AS 7 5 148 30 11 159
Native Japanese
n.�6
3 1 156 16 5 178
Native English
n.�6
2 0 158 1 1 198
60 Coulson et al.: Difficulties in Reading English Words
Vocabulary Learning and Instruction, 2 (1), 56�63.

4 Discussion
In this paper, we aimed to assess the phonological sub-skills of the lowest-
proficiency students in contrast to the highest. There was a very significant
difference in phonological-processing skills. The Basic Class performance was lower
on each test, but in particular there was a distinct difference between the results of
Test 1 and Test 2. In Test 2, the pseudohomophones require well-developed
phonological ability. In Test 1, the use of Real Words did not cause nearly as much
trouble for the Basic Class members. It can be concluded that the very high-
frequency words selected for this task were recognized as sight vocabulary by both
groups, albeit with a slight advantage for the Advanced Class (Ehri, 2005). Wade-
Woolley (1999) demonstrated that Japanese learners of English are able to
strategically bypass the use of phonological processing in reading English words
and still rapidly recognize words. However, based on our findings, it would not be
true to claim that Japanese can do without processing skill without incurring some
cost in word-reading efficiency. As shown, weaker phonological ability coincides
with lower proficiency in English. Specifically, there is a clear gap between the
more-proficient and the less-proficient class on the tasks which need automatic
phonological processing. Overall, this skill is difficult for Japanese people to
develop in English reading, and even Japanese graduate students capable of doing
research through the medium of English exhibit a persistent deficit in such
processing. It is probable that such individuals, and students of the Advanced
Class, have some aptitude in developing coping strategies. As for the Basic Class
students, on average they perform on our replicated test as if they were dyslexic to
some degree.
It does not follow that any subject reported here is dyslexic. However, the
Basic Class showed a remarkably high level of variation on the pseudohomophone
task. This was mainly due to the poor performance of five individuals (confirmed as
outliers by the Smirnov-Grubbs method). Importantly, the scores of four of these
five students were worse than AS on the corresponding pseudohomophone task in
Wydell and Kondo’s study. Removing their data brings the mean score of the Basic
Class into a similar range as the Advanced Class (11.9 points, SD 5.2 versus 11.1
points, SD 2.2). Therefore, a much smaller deficit than that shown in Table 2
separates most of the students in our investigation.
Nevertheless, this still leaves a disparity in phonological processing between
students who are more and less capable in English. Measures, such as earlier and
long-lasting phonics training, are clearly required. Specifically, a systematic focus
on decoding should considerably increase. We believe elementary school is the
appropriate stage to start this. Especially, in-service training would be ideal to raise
teachers’ awareness of the difficulties of learning to read English. An early start
would help prevent many Japanese students falling into a persistent low-level of
English decoding as shown in our data.
The lack of ability of students, especially, in the Basic Class, probably stems
also from a lack of ER practice. In fact, the results of Test 2 suggest all students in
this study would benefit from much more reading practice. ER is essential for
developing speed in reading, and it can be considered that this is based on rapid
decoding efficiency, making use of both phonological and orthographic processes.
Coulson et al.: Difficulties in Reading English Words 61
Vocabulary Learning and Instruction, 2 (1), 56�63.

A discussion of educational responses to improving word-reading fluency insecondary schools is available in Coulson (forthcoming in 2014).
Finally, concerning the outliers in the Basic Class, the gap in performancefrom their peers is so wide that the notion that they may be dyslexic can be
considered. Their number in the group 5/33 (15%) exceeds only slightly the
proportion the British Dyslexia Association considers as being affected. However, a
formal evaluation would be necessary to assess this.
5 Conclusion
Greater awareness of the difficulties in learning to read in English is needed
by primary and secondary-school teachers, especially regarding the special
challenges of learning to read in a new writing system. Intervention for struggling
students is also essential. Chronic lack of ER practice, typical in Japanesesecondary education, likely explains a large part of underdeveloped phonological
processing skills seen in all students. This should be addressed by allowing students
ample time to master the basics of English reading (i.e. through systematic phonics
training), recognizing the fundamental differences between the Japanese and
English orthographies.
If the five students identified as having a level of phonological processing
equivalent to the dyslexic individual in Wydell and Kondo’s study were to some
degree dyslexic, they would have likely found learning English dispiriting without the
adequate English L2 input from reading required to steadily acquire the language.
However, we make no claims for their actual status since we are not qualified to makesuch a diagnosis. Generally, students with very limited print exposure are likely have
delayed reading competence, in addition to poor decoding skills.
In future research, we will interview testees prior to a similar testing round to
understand more about their schooling, and personal learning histories which may
have influenced the development of their reading skill. This may reveal pertinent
details skill that are not reflected by our purely quantitative approach.
AcknowledgementMy thanks go to Howard Brown for making class time available for this research.
References
British Dyslexia Association. Retrieved from http://www.bdadyslexia.org.uk/
Coulson, D. (2010). Q_Lex: A Quick Test of Visual Recognition for Learners of
English. Unpublished PhD Dissertation. University of Wales.
Coulson, D. (Forthcoming in 2014). The development of word reading skill in
secondary schools in East Asia. In R. Al Marooqi & R. Roscoe (Eds.),
Focusing on EFL Reading: Theory and Practice. Newcastle upon Tyne:
Cambridge Scholars Publishing.
62 Coulson et al.: Difficulties in Reading English Words
Vocabulary Learning and Instruction, 2 (1), 56�63.

Ehri, L.C. (2005). Development of sight word reading: phases and findings. InM.J. Snowling & C. Hulme (Eds.), The Science of Reading (pp. 135�152).
Oxford: Blackwell Publishing.
Grabe, W. (2009). Reading in a second language. Moving from theory to practice.
Cambridge: Cambridge University Press.
Hanson, V.L., Liberman, I.Y., & Shankweiler, D. (1984). Linguistic coding by deaf
children in relation to beginning reading success. Journal of Experimental Child
Psychology, 37, 378�393. doi:10.1016/0022-0965(84)90010-9
Hunt, A., & Beglar, D. (2005). A framework for developing EFL reading
vocabulary. Reading in a Foreign Language 1. Retrieved from http://nflrc.
hawaii.edu/rfl/april2005/hunt/hunt.html
Meara, P., Coltheart, M., & Masterson, J. (1985). Hidden Reading Problems in
ESL Learners. TESL Canada Journal, 3 (1), 29�36.
Nation, I.S.P. (1990). Teaching and Learning Vocabulary. New York, NY: Newbury
House Publishers.
Nation, I.S.P. (2001). Learning Vocabulary in Another Language. Cambridge:
Cambridge University Press. doi:10.1017/CBO9781139524759
New Horizon 2 (1, 2 & 3). (2008). Tokyo Shoseki Kabushiki Kaisha.
Stanovich, K.E. (1985). Matthew effects in reading: Some consequences ofindividual differences in the acquisition of fluency. Reading Research
Quarterly, 21 (4), 360�407. Retrieved from http://www.psychologytoday.com/
files/u81/Stanovich__1986_.pdf
Wade-Woolley, L. (1999). First language influences on second language word
reading: All roads lead to Rome. Language Learning, 49 (3), 447�471.
doi:10.1111/0023-8333.00096
Wolf, M. (2008). Proust and the Squid. Thriplow, Cambridge: Icon Books.
Wydell, T.N., & Butterworth, B.L. (1999). A case study of an English-Japanese
bilingual with monolingual dyslexia. Cognition, 70, 273�305. doi:10.1016/
S0010-0277(99)00016-5
Wydell, T.N. & Kondo, T. (2003). Phonological deficit and the reliance on
orthographic approximation for reading: a follow-up study on an English-
Japanese bilingual with monolingual dyslexia. Journal of Research in Reading,
26, 33�48. doi:10.1111/1467-9817.261004
Coulson et al.: Difficulties in Reading English Words 63
Vocabulary Learning and Instruction, 2 (1), 56�63.

Validating a Pictorial Vocabulary Size Test via the3PL-IRT Model
Wen-Ta TsengNational Taiwan Normal University
doi: http://dx.doi.org/10.7820/vli.v02.1.tseng
Abstract
The paper presented a newly conceived vocabulary size test based on
pictorial cues: Pictorial Vocabulary Size Test (PVST). A model-based
(1-2-3 parameter logistic item response theory model comparisons)
approach was taken to check which model could absorb the most
information from the data. Junior high school and primary school
students participated in the study (N � 1,354). Subjects’ ability estimates
and item parameter estimates were computed based on expected a
posteriori (EAP) method, one type of Bayesian method. BILOG-MG 3
was adopted to execute parameter estimates and model comparisons. The
results showed that the 3PL-IRT model best fit the empirical data. It was
then argued that test takers’ English vocabulary size could be best
captured under the 3PL-IRT model, as not only the discrimination
parameter, but also the guessing parameter has a fundamental role to
play in consideration of the test format adopted in the PVST. The article
concluded that the PVST could have positive washback effects on test
development and English vocabulary instruction.
1 Introduction
Vocabulary size is a key indicator of lexical ability and language proficiency.
A wide range of research has consistently indicated that certain and different
vocabulary sizes are necessary to complete different language tasks (e.g. Adolphs &
Schmitt, 2003; Hazenberg & Hulstijn, 1996; Laufer, 1988; Nation & Waring, 1997).
For example, 2,000�3,000 word families are required for basic daily conversation
(Laufer, 1988), and 5,000 word families are the threshold to embark on independent
reading of authentic texts (Laufer, 1988). Furthermore, to match the lexicon of a
native university graduate, a vocabulary size approaching 20,000 word families is
needed (Goulden, Nation, & Read, 1990). Carter (1998) remarks that non-native
speakers need to obtain 1,000 word families per year to catch up with the level of an
educated native speaker. Although it is not a realistic aim for most foreign learners
to fully reach the level of an educated native speaker, it is nevertheless essential for
foreign learners to commit themselves to sustained vocabulary study in order to
reach the vocabulary requirements for even daily conversation and the modest
reading of authentic materials.
Given the significance of acquiring sufficient English vocabulary size, the
Ministry of Education in Taiwan has also paid close attention to the significant role
vocabulary size plays in English language learning. In the year of 2003, the Ministry
of Education in Taiwan published the 1,000 Words List (now 1,200 Words List),
Vocabulary Learning and Instruction
Volume 2, Issue 1, September 2013
http://vli-journal.org
Please cite this article as: Tseng, W.-T. (2013). Validating a pictorial vocabulary size test via the
3PL-IRT model. Vocabulary Learning and Instruction, 2 (1), 64�73. doi: 10.7820/vli.v02.1.tseng

which are all high-frequency words. The reason for compiling the word list was to
create a list that can serve as a guideline for different textbook publishers to refer to
when developing texts for primary and junior high school students (Ministry of
Education, 2007).
2 Aims
The existence of the word list notwithstanding, it is however noted that thus
far there are few attempts made to develop a reliable and valid vocabulary size test
on the basis of this word list. To be specific, none of the currently available
vocabulary size tests referenced to the word list have been developed under Item
Response Theory (IRT) (See below for more information). Thus, the purpose of
this project is to develop a multiple-choice vocabulary size test via IRT. In
particular, in this initial validation study, it is intended to examine the extent to
which the discrimination and guessing parameter should be included for estimating
test takers’ vocabulary size.
2.1 Operational definition of the trait to be measured
The Pictorial Vocabulary Size Test (PVST) is designed as a diagnostic test,
requiring test takers to recognize and match the correct target word forms with a
series of pictorial cues. This test format is designed in such a way that the required
knowledge of grammar and reading can be minimized and thus can avert the
potential risks of measuring something other than the ability to recognize the
meanings of the target word forms. Likewise, the use of pictorial cues for test takers
to elicit correct word meanings can also receive its validity and has been
underpinned by vocabulary researchers such as Nation (1990, 2001). As he states,
In recognition tests, we want to see if the learners know the meaning of a word afterthey hear or see it. In such tests the learners hear or see an English word and then. . . .(c) choose one from a set of pictures, mother-tongue words, or English synonyms ordefinition. (Nation, 1990, pp. 79�80)
The use of pictorial cues as indications of meanings of words, it is argued, is
particularly useful regarding the target population considered in the current test
project. Considering the need that primary school students can comprehend the
test format without problems, it is believed that colorful and vivid pictures which
unequivocally represent the underlying concepts of target words can help them,
if they know the answers, match the correct word forms with the pictures
(meanings) immediately. Arguably, this test feature enables the PVST to obtain
strong contextual validity through ‘‘an instance of the meaning’’ (Nation, 2001,
p. 85) without recourse to reading sentence stems. In other words, the use of
pictures can not only establish the contextual validity of the test but also avoid the
possibility that the ability to recognize the meanings of word forms may be
contaminated by the ability to read sentence stems.
Tseng: Validating a Pictorial Vocabulary Size Test 65
Vocabulary Learning and Instruction, 2 (1), 64�73.

3 Specifications of the pictorial vocabulary size test
(i) Inferences: To estimate Taiwanese students’ receptive vocabulary size
knowledge through pictorial cues during their primary and
junior high education.
(ii) Decisions: (a) To determine the extent to which the target students have
succeeded or failed to master the words that are prescribed bythe Ministry of Education in Taiwan.
(b) To track the trajectory of the target students’ vocabulary size
over time.
(iii) Impacts: The test is a low-stakes test. It is designed in a way that the target
students’ motivation toward learning the 1,200-word list can be
greatly enhanced though taking the test.
3.1 Format of the test
To ensure the statistical property of local independence assumed in the IRT,
the author adopted a multiple-choice format: a picture prompt with four options. A
sample item is shown in Figure 1.
In total, 180 items were sampled from the 1,200-word list and pooled as an
initial item bank, roughly one-in-seven. The 180 items were then further dividedinto two forms, with 90 items included in each form.
4 Methods
4.1 Participants
The participants came from four junior high schools and three primary
schools in Taiwan. In total there were 1,354 students participating in the study. The
average time spent learning English of this sampling ranged between 0 and 5 years.
4.2 Software
BILOG-MG 3 was adopted to execute parameter estimates and model
comparisons. BILOG-MG 3 was a popular IRT program designed for analyzing
Figure 1. Sample item of the PVST.
66 Tseng: Validating a Pictorial Vocabulary Size Test
Vocabulary Learning and Instruction, 2 (1), 64�73.

dichotomous response test data. It was developed by Zimowski, Muraki, Mislevy,and Bock (2003).
4.3 Item response theory
A model-based (1-2-3 parameter logistic item response theory model
comparisons model comparisons) approach was followed to check which model
could absorb the most information from the data. The 1PL-IRT model is primarily
concerned with the calibration of item difficulty parameter. The 2PL-IRT model
take into account not only item difficulty parameter but also item discrimination
parameter. Like the Rasch model, no allowance is made for the guessing behaviors
of examinees in the 2PL-IRT model. By contrast, the 3PL-IRT model incorporates
yet another item parameter � guessing � into the 2PL-IRT model. The reason forincluding the guessing parameter into the model is to take into account the
likelihood of guessing behaviors as likely observed on the examinees at the lower
end of the ability continuum.
Subjects’ ability to estimate and item parameter estimate were computed
based on expected a posteriori (EAP) method, a type of Bayesian methods. In
practice, the three IRT models are often used to score examinees on a latent-trait in
conjunction with three different scoring methods: (1) maximum likelihood (MLE),
(2) maximum a posteriori (MAP), and (3) EAP. (Embretson & Reise, 2000;
Hambleton & Swaminathan, 1985). The scoring procedure of MLE is an iterative
searching process to find out the value of theta (u) � latent trait � that canmaximize the likelihood of an examinee’s response pattern for all the items taken.
MLE method has several psychometric strengths. With large samples, it is unbiased
and efficient, and the measurement errors with this estimator are normally
distributed. However, MLE estimation fails to achieve a solution on all-correct
or all-wrong response patterns due to its statistical property. Hence, to solve the
underlying problems of MLE scoring method, the other two scoring estimators are
further proposed. Both MAP method and EAP method are developed under
Bayesian Theory, which does not need to rely on large samples but instead takesadvantage of any prior information of test items or test takers. Through the help of
some prior information, the problem of MLE’s inability to find the u that
maximizes the likelihood function can be delicately addressed. In other words, all-
correct and all-wrong response patterns can be estimated by the two alternatives.
However, IRT literature suggested that EAP is a better estimation method than
MAP, due to EAP’s convenience and speed of achieving solution for u estimation,
‘‘EAP is perhaps the most easily implemented scoring strategy across a range of
IRT models and testing contexts’’ (Embretson & Reise, 2000, p. 182).
5 Results
Table 1 reports the model fit indices for the three IRT models. The results
showed that the 3PL-IRT model consistently obtained the lowest values of �2Log-
likelihood, Akaike information criterion (AIC), and Bayesian information criterion
(BIC) fit indices on the two test forms, suggesting that the 3PL-IRT model
absorbed the most of information from the data. Table 2 reports the results of
Tseng: Validating a Pictorial Vocabulary Size Test 67
Vocabulary Learning and Instruction, 2 (1), 64�73.

model comparisons among the three models. Regarding D �2LL, which refers to
the contrasted value of �2Log-likelihood between two IRT models, it could be
seen that all the D �2LL values were above 113.145, the threshold to reach
statistical significance, and that the values of AIC and BIC became smaller as the
parameters of models increased. In summary, the results showed that the 3PL-IRT
model fit significantly better than the 2PL-IRT model and the 2PL-IRT model fit
significantly better than the 1PL-IRT model, which suggested that difficulty,
discrimination, and guessing parameters should be all kept in the model to precisely
measure the targeted population’s vocabulary size.
Based on the results calibrated by the 3PL IRT model, reliability of the two
test forms was computed, respectively. The results showed that both of the test
forms obtained high-reliability indices up to 0.95, indicting a high level of
measurement precision across the latent trait continuum.
Figure 2 indicates the nonlinear relationship between expected number
correct and theta when the two test forms are combined into a whole test.
According to Figure 2, around 45 test items � one-fourth of the whole test � could
be answered correctly by the test takers with theta less than �2.5, whereas when
theta was greater than 1, nearly all the 180 items could be answered correctly.
Hence, to instruct on how to calculate vocabulary size, a straightforward
three-step approach can be taken. First, obtain theta on the horizontal axis.
Second, find the expected number correct which corresponds to the theta on the
nonlinear curve. Third, calculate the proportion of expected number correct out of
180 items and multiply that proportion by 1,200 words. For instance, for the theta
less than �2.5, 45 is the corresponding value on the curve. Then, divide 45 by 180
and multiply by 1,200. This leads to 300 words. Likewise, for the theta at 0, 150 is
the intersecting value on the curve. Divide 150 by 180 and multiply by 1,200.
Hence, test takers whose theta is found at 0 should know 1,000 words.
It can be seen from Table 3 that test takers with theta less than �1.5
recognize fewer than 400 words, whereas those with theta larger than 0 could have
acquired more than 1,000 words. For the theta values between �1.5 and 0, there is
Table 2. Contrast of Fit Indices of the Three IRT Models
Form 1 Form 2
D �2LL DAIC DBIC D �2LL DAIC DBIC1PL � 2PL 2,447.91 2,269.91 1,791.18 3,366.08 3,188.08 2,709.35
2PL � 3PL 1,100.09 920.09 435.98 729.43 549.43 1,065.32
Table 1. Fit Indices of �2LL, AIC, and BIC for the Three IRT Models
Form 1 Form 2
�2LL AIC BIC �2LL AIC BIC
1PL Model 95,109.59 95,291.59 95,781.08 87,182.50 87,364.50 87,853.99
2PL Model 92,661.68 93,021.68 93,989.90 83,816.42 84,176.42 85,144.64
3PL Model 91,561.59 92,101.59 93,553.92 83,086.99 83,626.99 84,079.32
68 Tseng: Validating a Pictorial Vocabulary Size Test
Vocabulary Learning and Instruction, 2 (1), 64�73.

a linear correspondence between theta estimates and words, as every 0.5 unit
increase on theta corresponds to an increase of around 200 words; meanwhile such
a linear mapping is not observed at the two ends of the nonlinear curve.
Table 4 further shows the means and standard deviations of the three IRT
parameters for the entire set of 180 items. The mean difficulty of the whole test
was �0.518; the mean discrimination, 2.26; the mean guessing, 0.210.
Table 4. Means and Standard Deviations
of the Three IRT Parameters
Mean SD
Difficulty �0.518 0.417
Discrimination 2.260 0.687
Guessing 0.210 0.086
Figure 2. Expected number correct corresponding to theta level.
Table 3. Correspondence Table of Theta, Expected Number Correct,
and Vocabulary Size
Theta Expected number correct (items) Vocabulary size (words)
�3 45 300
�2.5 45 300
�2 50 333
�1.5 58 387
�1 85 567
�0.5 120 800
0 150 1,000
0.5 160 1,067
1 178 1,187
1.5 180 1,200
Tseng: Validating a Pictorial Vocabulary Size Test 69
Vocabulary Learning and Instruction, 2 (1), 64�73.

As each test item had four options, the threshold for incurring guessing was set
at 0.25. Following this criterion, it was found that there were in total 34 items whose
guessing parameter went beyond 0.25. The item which was most easily subject to
guessing was Q10, as shown in Figure 3. The guessing parameter observed on Q10 was
found to be 0.418, and its associated item characteristic curve is shown in Figure 4.
The c value marked in Figure 4 indicates the probability of guessing by Q10.
Figure 3. Test item: Q10.
Figure 4. Item characteristic curve of Q10.
70 Tseng: Validating a Pictorial Vocabulary Size Test
Vocabulary Learning and Instruction, 2 (1), 64�73.

6 Discussion
The current study utilizes an IRT model-driven approach to developing and
validating a newly conceived English vocabulary size test. The targeted word list is
derived from an EFL educational context. It includes the most high-frequency
words in any word bank such as BNC. Due to the high-frequency property of the
word list, pictorial cues are designed as the prompts for test takers to connect
the word meanings to the corresponding word forms. The results of the study
demonstrate that the newly conceived PVST can be successfully developed and
validated by the 3PL-IRT model. The 3PL-IRT model acquires the best fit to the
empirical data. On the validation basis of the 3PL-IRT model, the test forms of the
PVST can also obtain a high level of measurement precision.
In consideration of the mean difficulty, discrimination, and guessing
parameters, the PVST can be considered moderately easy for test takers to
accomplish, highly discriminating in differentiating test takers’ vocabulary size, and
efficiently capable of modeling the chances of item guessing phenomena. In other
words, it is argued that test takers’ English vocabulary size can be best captured
under the 3PL-IRT model, as not only the discrimination parameter, but also the
guessing parameter has a fundamental role to play regarding the multiple-choice
test format adopted in the PVST.
Measuring EFL learners’ English vocabulary size is possible via both classical
test theory (CTT) and IRT (Stewart & White, 2011). Under CTT, the estimation of
vocabulary size is made possible through a balanced sampling from different
frequency bands of a word list. Although this classical testing procedure appears
intuitive and straightforward, it does not account for the discrepancy between raw
scores and item responses. This is because CTT models raw scores, whereas IRT
models item responses. In the case where test takers obtain the same raw scores,
they will be thought to have the same vocabulary size. However, it is very likely that
the same raw scores are derived from different item responses. This is often
observed on long tests. Using raw scores to estimate vocabulary size may hence
incur a high chance of miscalculating the true value to be measured. In a typical
vocabulary size test that adopts the multiple-choice format such as the PVST and
the Vocabulary Levels Test (Nation, 1990), the overall length of the test tends to go
beyond 100 items. Modeling item responses rather than raw scores in such tests not
only greatly increases the likelihood of capturing the true value of vocabulary size,
but also makes it possible to model the guessing phenomena of the test items.
Measuring English vocabulary size via IRT clearly possesses significant psycho-
metric strengths over CTT.
Developing an IRT-based vocabulary size test has important theoretical,
instructional, and social implications and consequences. Theoretically, it is
enlightening to see the extent to which IRT can be applied to modeling the
development of the whole test. Pedagogically, Ryan (1997), on discussing the ability
to recognize word form, argues that ‘‘failures at the word level can severely hamper
reading ability, and reading ability is a key skill in using English for academic or
professional purposes’’ (p. 187). Hence, the PVST can be used to diagnose or
identify both primary and junior high school Taiwanese learners’ strengths and
Tseng: Validating a Pictorial Vocabulary Size Test 71
Vocabulary Learning and Instruction, 2 (1), 64�73.

weaknesses regarding the words in the list. Then, appropriate and effectivevocabulary learning programs can be further established.
7 Conclusion
In conclusion, the results of this validation study suggest that the 3PL-IRT
Model is a superior psychometric model over both the 1PL- and 2PL-IRT model in
the data-model-fitting process. A conversion formula transforming IRT scores to
vocabulary size estimates is also successfully acquired. Further equating work
should be undertaken to ensure the equivalence of the two test forms developed.
The article concludes that the PVST can have positive washback effects on testdevelopment and English vocabulary instruction.
AcknowledgementThis project was funded by National Science Council Research Grant (99-2410-H-
003-081-MY2). The author is indebted to Prof. Yuh-show Cheng for her critical feedback onthe design of the pictorial cues as well as the distracters during the process of testdevelopment.
References
Adolphs, S., & Schmitt, N. (2003). Lexical coverage of spoken discourse. Applied
Linguistics, 24, 425�438. doi:10.1093/applin/24.4.425
Carter, R. (1998). Vocabulary: applied linguistic perspective (2nd ed.). London:
Routledge.
Embretson, S.E., & Reise, S.P. (2000). Item response theory for psychologists.
Mahwah, NJ: Lawrence Erlbaum Associates.
Goulden, R., Nation, I.S.P., & Read, J. (1990). How large can a receptive
vocabulary be?. Applied Linguistics, 11, 341�363. doi:10.1093/applin/11.4.341
Hambleton, R.K., & Swaminathan, H. (1985). Item response theory: Principles and
applications. Norwell, MA: Kluwer Academic.
Hazenberg, S., & Hulstijn, J.H. (1996). Defining a minimal receptive second
language vocabulary for non-native university students: An empirical
investigation. Applied Linguistics, 17, 145�163. doi:10.1093/applin/17.2.145
Laufer, B. (1988). What percentage of text-lexis is essential for comprehension?
In C. Lauren & M. Nordmann (Eds.), Special language: From humans to
thinking machines (pp. 316�323). Clevedon: Multilingual Matters.
Ministry of Education. (2007). Basic 1200 English words. Taipei: Ministry of
Education.
Nation, I.S.P. (1990). Teaching and learning vocabulary. Boston, MA: Newbury
House.
Nation, I.S.P. (2001). Learning vocabulary in another language. Cambridge:
Cambridge University Press. doi:10.1017/CBO9781139524759
72 Tseng: Validating a Pictorial Vocabulary Size Test
Vocabulary Learning and Instruction, 2 (1), 64�73.

Nation, I.S.P., & Waring, R. (1997). Vocabulary size, text coverage and word lists.In N. Schmitt & M. McCarthy (Eds.), Vocabulary: Description, acquisition,
and pedagogy. Cambridge: Cambridge University Press.
Ryan, A. (1997). Learning the orthographical form of L2 vocabulary � A receptive
and a productive process. In N. Schmitt & M. McCarthy (Eds.), Vocabulary:
description, acquisition, and pedagogy. Cambridge: Cambridge University
Press.
Stewart, J., & White, D.A. (2011). Estimating guessing effects on the vocabulary
levels test for differing degrees of word knowledge. TESOL Quarterly, 56,
370�380.
Zimowski, M., Muraki, E., Mislevy, R., & Bock, E. (2003). BILOG-MG 3. In
du Toit, M. (Ed.), IRT from SSI. Lincolnwood: Scientific Software
International. Inc.
Tseng: Validating a Pictorial Vocabulary Size Test 73
Vocabulary Learning and Instruction, 2 (1), 64�73.

Second-Language Vocabulary AssessmentResearch: Issues and Challenges
Yo In’namiShibaura Institute of Technology
doi: http://dx.doi.org/10.7820/vli.v02.1.innami
Abstract
The four papers on second-language vocabulary assessment reviewed
below are exemplary works that merit close scrutiny. Therefore, this paper
provides a brief summary of each study, followed by comments and
suggestions, particularly in regard to the experimental designs and
analyses used in the studies.
1 Introduction
I am honored to have the opportunity to closely read the four papers
appearing in this issue, which each represent high-quality research in a second-language (L2) vocabulary assessment. Each of the papers makes an important
contribution to the field. In what follows, I offer constructive criticism and
suggestions regarding the experimental designs and analyses used in the studies.
2 Regression approach by Stubbe
Stubbe compares the relative effectiveness of regression methods versus
correction formulas when applied to scores on a yes�no vocabulary test in order topredict scores on a passive L2-to-L1 recall test. The yes�no test included 96 real
words and 32 pseudowords. The recall test measured L2-to-L1 translations of the
same 96 real words. The two tests were administered to the same learners. The
results show that the recall scores were best predicted by the regression-based
yes�no scores for the real words and pseudowords (the latter of which are called
false alarms), with an R2 variance reaching 71%, when compared with the four
correction formulas previously discussed in the literature. Stubbe concludes
by advocating a regression approach to predicting a learner’s passive recall ofvocabulary from yes�no vocabulary tests.
The role of pseudowords in L2 has been researched since Meara and Buxton(1987), and Stubbe’s current paper, along with Stubbe (2012a), is among the most
recent works on this topic. In particular, four points regarding Stubbe’s paper merit
discussion. First, one strength of the study is that the sample size was large enough
to split the data into two groups: A and B. Group A was first analyzed using the
regression formula reported in Stubbe and Stewart (2012) and comparing those
results with the application of the four correction formulas. Group A was then used
to develop a new regression formula, and Group B was used to test whether the
revised regression formula would work even better. This was a sensible approachgiven the relatively large sample size (N �431) (see In’nami & Koizumi, 2012, for
Vocabulary Learning and Instruction
Volume 2, Issue 1, September 2013
http://vli-journal.org
Please cite this article as: In’nami, Y. (2013). Second-language vocabulary assessment research:
Issues and challenges. Vocabulary Learning and Instruction, 2 (1), 74�81. doi: 10.7820/vli.v02.1.innami

such an approach). One plausible weakness � although not uniquely inherent in
the study and not intended as a criticism of Stubbe’s paper in particular � is that
since the two groups were similar (at least in terms of the passive recall test scores),
the high applicability of the new regression formula with Group B is not surprising.
After all, Groups A and B were similar in many ways; thus, if the regression
formula was derived from Group A, it could be predicted to work well with Group
B. In other words, the study has high internal, ecological validity, but it does not
guarantee a high generalizability of the finding beyond the present context.
It would certainly be of great interest to investigate to what extent the current
regression formula works with different samples.
A related issue in the comparison is that Stubbe and Stewart (2012) examined
the proportion of variance in their translation test score explained by the yes�no
test scores and false alarm scores, while retaining all items or only those with high
discriminability. As Table 1 shows, prediction was most successful with the yes�no
scores and false alarm scores were used as predictors when only high discriminatory
items were included. As I understand, Stubbe’s current regression includes the yes�no scores and false alarm scores as predictors while using all items. The predicted
percentage of 70.56% in the study is higher than the figure of 45.2% in Stubbe and
Stewart (2012). The prediction would have been even higher if only the high
discriminatory items had been included in the analysis. This points to the
effectiveness of regression-based approaches with high discriminatory items.
Second, an equally important issue is to conduct an item analysis both
quantitatively and qualitatively on pseudowords to identify whether any particular
kinds of pseudowords are more attractive to learners. The quantitative analysis may
include an examination of item difficulty and discrimination, while the qualitative
analysis may include an examination of the test-taking processes. As yes�no test
formats simply require learners to signal dichotomously whether they know or
do not know a particular word, the reasons for their responses remain unclear.
To resolve this issue, we could ask them to think aloud their answering processes
(e.g., Bowles, 2010; Ericsson & Simon, 1993) while engaging in the yes�no test.
If collecting think-aloud data is not possible due to logistic constraints, we could
instead create several small sets of pseudowords, randomly assign learners any one
of these sets, and ask them to write the reasons for their judging the words as
pseudowords. Alternatively, we could interview them about their responses. Stubbe
and Stewart (2012) compared learners’ responses to the same real words appearing
in a yes�no test and translation test. Although some words (e.g., salmon and chapel)
were correctly reported as known across the tests, others (e.g., convenience and
overall) were falsely reported as known. According to the authors, this could be due
to factors such as the loanword konbini ‘‘convenience store’’ and the multiple
Table 1. R2 Values Before and After Entry of the Pseudoword Predictor Variable in
Stubbe and Stewart (2012)
Predictor variables R2 (all items) R2 (discriminating items only)
Yes�no scores only 35.6% 47.8%
Yes�no scores�false alarm
scores
45.2% 59.1%
In’nami: Second Language Vocabulary Assessment Research 75
Vocabulary Learning and Instruction, 2 (1), 74�81.

meanings of the word overall (including everything; a piece of clothing), suggestingthat the efficacy of pseudowords may change depending on learners’ L1 and the
number of dimensions of a word’s meaning. These effects can be more deeply
examined through an analysis of think-aloud protocols. The results will provide
insight into the structure of learners’ vocabulary knowledge and into a more sound
construction and inclusion of pseudowords for yes�no tests while adjusting the
efficacy of pseudowords as distractors.
Third, with regard to the use of pseudowords as a measure of false alarms,
Stubbe (2012b) examined the score divergence between (1) a yes�no receptive
vocabulary test and (2) a translation test of the same items. He reported that the
cut-off point for false alarm in yes�no tests should be set at four (i.e., 12.5% of the32 pseudowords in the study). In other words, if a learner reports knowledge of five
or more pseudowords, s/he may be falsely claiming (i.e., overestimating) knowledge
of real words. Impressive as setting the cut-off is, it is not clear why the cut-off is not
used in Stubbe’s current study. This may be due to the particular nature of the
sample on which the cut-off is based (e.g., small sample size and test items). If this
is the case, further research with different samples is warranted.
Finally, another issue regarding the use of pseudowords is the number of
pseudowords in a yes�no test and its percentage of the total number of items.
Stubbe (this issue) includes 96 real words and 32 pseudowords (3:1 ratio). Both
Stubbe and Stewart (2012) and Stubbe (2012b) included 120 real words and 32pseudowords (3.75:1). Given the central and ubiquitous role of vocabulary in
almost all aspects of language learning, the representativeness of words taken
randomly from the domain to which study findings are expected to generalize, and
the relative easiness of administering a vocabulary test, few would argue against
including, for example, over 100 real words in a test. However, things are less clear
for pseudowords because, unlike real words, they are not part of language learning
and do not have a population to which they can be generalized. It remains
unknown how many and what kind of pseudowords should be included in a test,according to my reading of recent books such as Nation and Webb (2011). Schmitt
(2010) argued that pseudowords usually account for 25�33% of the total items
(p. 200), but this percentage may change depending on the aforementioned efficacy
of pseudowords and the cut-off point for false alarms (the second and third points
above). The use of yes�no tests with pseudowords as a proxy of passive recall tests
is valuable and merits further research.
3. Differential item functioning (DIF) analysis by Stoeckel andBennett
Stoeckel and Bennett attempt to clarify the sources of DIF across learners of
different L1 backgrounds on a 90-item, multiple-choice, receptive written test of L2English vocabulary. The test consisted of 30 randomly sampled words from each of
the first and second 1,000 words of the General Service List and another 30 from
the Academic Word List. The test was administered to Japanese and Korean
university students. A total of 21 of the 90 items (23%) were flagged as DIF; 10
were considered to display DIF due to their word frequency and usage as
loanwords in each language � particularly, phonological and/or orthographic
76 In’nami: Second Language Vocabulary Assessment Research
Vocabulary Learning and Instruction, 2 (1), 74�81.

similarities between the word and an English loanword in the L1 � and also due tothe function of distractors. The authors conclude that the word frequency and
usage as a loanword in the L1 are responsible for DIF, in addition to cognate status,
as previously reported.
This study is a good contribution to the DIF literature, particularly given, as
the authors claim, the availability of only a small number of L2 studies investigating
sources of DIF in cross-cultural settings (for a recent review of DIF, see Ferne &
Rupp, 2007; McNamara & Roever, 2006: Chapter 4). While the word frequency and
usage as a loanword in the L1 can be causes of DIF for the 10 words, the causes of
DIF for the other 11 words remain unknown. These words include interval and rise,
favoring Japanese examinees, and contemporary and compound, favoring Koreanexaminees. These DIF items do not seem to be related to their frequency or usage
as loanwords in the L1 or to cognate status, and an attempt to identify explanatory
variables, for example, by using a think-aloud protocol or expert content analysis, is
a good avenue for future research. In this regard, in conducting research to identify
sources of DIF, Ercikan, et al. (2010) recommended, for example, (1) examining
both content expert reviews and think-aloud protocols and (2) examining both
concurrent and retrospective verbalizations.
4. L2 word recognition analysis by Coulson, Ariiso, Kojima,and Tanaka.
Coulson et al. seek to identify factors related to reading difficulty among
Japanese learners of English as a foreign language (EFL), particularly focusing on
L2 word recognition. Their test battery consisted of three tests: (1) 120 high-
frequency real words mixed with 40 pronounceable nonwords, (2) 50 pseudo-
homophones mixed with 150 pronounceable nonwords, and (3) a 10-item spooning
test. The results show that the Basic (low) Class performed significantly worse thanthe Advanced Class with the 50-item pseudo-homophones, with an average number
of mistakes of 19.7 and 11.1, respectively, and standard deviations of 11.1 and 2.2.
Although statistical significance did not seem to be found in the remaining tasks,
the Basic Class consistently scored lower, except with the 150 pronounceable
nonwords, where the Basic Class scored slightly higher. Coulson et al. conclude that
low-proficiency learners lack word-recognition ability but may be able to overcome
this inability through extensive reading.
Coulson et al.’s study is unique in that it methodologically replicates Wydell
and Kondo (2003). That is, it develops and uses tests designed to measure the same
constructs studied by Wydell and Kondo. The results are similar across the studies:the Basic Class consistently scored lower than the Advanced Class in almost all
tasks in Coulson et al., and the Japanese EFL students consistently scored lower
than the native speakers of English in all tasks in Wydell and Kondo. The stability
of the results across the two studies suggests the high quality of the tests developed
in Coulson et al. and the robust effects of a lack of L2 word recognition for
Japanese EFL learners. In particular, Coulson et al.’s replication can be viewed as
an approximate (or systematic or operational) replication consisting of an exact
duplication of some of the essential variables (e.g., experimental procedures) of theoriginal study (for details see, e.g., Lykken, 1968). Approximate replication seeks to
In’nami: Second Language Vocabulary Assessment Research 77
Vocabulary Learning and Instruction, 2 (1), 74�81.

examine whether one can duplicate a result using the same/similar methodsreported in the original study. The results show how dependent a finding is on the
particular research conditions. Given the long-standing paucity of replication
studies in the field of language learning (Porte, 2012), Coulson et al.’s study is
highly welcome.
As Coulson et al. discuss in the last paragraph of their paper, it would be of
great interest to know more about the backgrounds of the five students who
underperformed on the pseudohomophone task. For example, did they have any
experience doing extensive reading in their prior English language learning?
Assuming they went through Japanese secondary education, where extensive
reading is not common, we could expect them to develop their word-recognitionability with the aid of extensive reading. If these students had done extensive
reading and yet still underperformed on the pseudohomophone task, this suggests
the need to examine the type of extensive reading they did, including the amount of
exposure (e.g., number of books/words they read, book levels), duration, use of
comprehension tasks, and instructor support availability.
Coulson et al. seem to assume that extensive reading helps learners develop
word-recognition ability. However, this assumption itself deserves close empirical
investigation. One recent � and perhaps the most comprehensive � study is
Nakanishi’s (2013) dissertation on a meta-analysis of extensive reading. It reports
on a meta-analysis of 34 primary studies that provided 43 unique effect sizes with atotal sample size of 3,942. Nakanishi finds that extensive reading improved
university students’ overall performance (Cohen’s d �0.48 [95% confidence
interval �0.22, 0.74] for between-group designs and 1.12 [0.23, 2.01] for pre-post
designs). While studies on word recognition in relation to extensive reading seem to
be under-researched and were not included in the meta-analysis, reading speed was
found to improve for between-group designs (0.98 [0.64, 1.33]) but not for pre-post
designs (0.61 [�2.79, 4.02]). The statistically nonsignificant effect for pre-post
designs may be partly due to test�retest effects: The learners improved or feltdemotivated by their second exposure to the same instrument. Also, the pre- and
post-tests were not of equal difficulty. As Nakanishi describes, it was not possible to
meta-analyze the effect of extensive reading on university students’ reading speed,
because further subdivision of the studies would have reduced the number of the
studies in the meta-analysis, yielding unstable results. However, the tentative
finding from the between-group designs described above shows that extensive
reading leads to progress in reading speed. Since reading speed is considered closely
related to word recognition, it is possible that extensive reading leads toimprovement in word recognition. This speculation needs to be empirically studied.
Nakanishi lists the individual studies included in the meta-analysis, with informa-
tion on moderated variables coded. The list shows which studies measured the
reading speed of university students after extensive reading. These studies merit
close scrutiny.
5. Item response theory (IRT) analysis by Tseng
Tseng aims to develop a multiple-choice pictorial vocabulary test for primary
and junior high school Taiwanese students based on the 1,200 word list compiled
78 In’nami: Second Language Vocabulary Assessment Research
Vocabulary Learning and Instruction, 2 (1), 74�81.

by the Taiwanese Ministry of Education. A total of 180 words was selected from the
list, subdivided into two forms (90 items each), and administered to students as
vocabulary test items. The results from the IRT analysis showed that the three-
parameter model, which includes item difficulty, item discrimination, and guessing
parameters, best fit the data. A formula was constructed to convert the parameter
estimates into vocabulary size estimates. Tseng concludes that developing a
vocabulary test using IRT is theoretically (i.e., psychometrically) and pedagogically
meaningful: Theoretically, it can benefit from the advantages of IRT over classical
test theory, and pedagogically, it can bring good washback effects on vocabulary
learning by helping diagnose learners’ strengths and weaknesses.
The line of studies connecting assessment and learning is timely and essential,
and, in this regard, Tseng’s research deserves great attention. To best benefit from
Tseng’s findings, we should consider two important issues. First, given Tseng’s dual
focus on assessment and learning, it will be necessary to provide fine-grained
pedagogical information on vocabulary learning in the Taiwanese context. For
example, learners and teachers would be interested to know not only individual
learners’ vocabulary sizes but also the average vocabulary size of students in each
school grade (e.g., up to 500 words by Grade 5), longitudinal change in vocabulary
size, and feedback on how to learn unmastered words and expand vocabulary size.
While having a better understanding of one’s vocabulary size would enhance
learning, this can only happen if we help students and teachers make the best use of
the information from vocabulary tests. In many cases, it is highly likely that
students and teachers merely glance at score reports without reflecting on the
various implications. This may be because the score reports contain too much or
too little information that is useful for learning. Therefore, educators should think
carefully about designing score reports (see Kunnan & Jang, 2009; Roberts & Gierl,
2010) and also examine how students and teachers use them.
Second, related to the first point and particularly unique to Tseng’s study is
the need to consider how to conduct a validation study. In his elucidating
commentary on Kane’s (2013) argument-based approach to validation, Brennan
(2013) summarized that Kane’s approach consists of (1) specifying the intended
purpose of a test and (2) evaluating empirical evidence and logical arguments. To
the extent that the intended purpose of the test is clearer, this should be explicitly
stated. For example, following this framework and the aims of Tseng’s study, we
can articulate that the pictorial vocabulary size test in Tseng’s study was developed
to measure and diagnose primary and junior high school Taiwanese students’
vocabulary size in accordance with the 1,200 high-frequency word list compiled by
the Ministry of Education. Since the list was created for textbook publishers to
follow as guidelines on developing textbooks for primary and junior high school
Taiwanese students, we can also articulate that the list (and the test results) is
expected to assist textbook publishers in creating textbooks.
Brennan’s (2013) second phase calls for conducting validation studies in
accordance with various types of inferences: inferences consist of scoring, general-
ization, extrapolation, and decision rules. The reliability and item analysis as
currently reported in Tseng belong to scoring. We also need to collect validity
evidence for: a) generalization of the scores obtained to the well-defined target
domain (for example by conducting a generalizability theory analysis of the items
In’nami: Second Language Vocabulary Assessment Research 79
Vocabulary Learning and Instruction, 2 (1), 74�81.

and the test versions); b) extrapolation to a wider and less well-defined targetdomain (by correlating the scores to other criterion measures, for example), and c)
decision rules (i.e., test uses and consequences, for instance by examining whether
diagnostic feedback benefits learners and teachers as intended and whether the
word list [and the test results] benefits textbook publishers). Washback effects may
or may not come in intended forms (e.g., Cheng, Watanabe, & Curtis, 2004). These
pieces of evidence are all needed to argue for the validity of interpretation and use
based on Tseng’s test scores.
6. Conclusion
While the four studies reviewed above have different focuses and purposes,
they each make an important contribution to the literature on vocabulary
assessment. Future research based on these works will allow us to gain a more
detailed and sophisticated understanding of L2 vocabulary and the appropriate
methods of assessing it.
AcknowledgementI would like to thank Rie Koizumi and Raymond Stubbe for their valuable comments
on earlier versions of this paper.
References
Bowles, M.A. (2010). The think-aloud controversy in second language research. New
York, NY: Routledge.
Brennan, R.L. (2013). Commentary on ‘‘Validating the interpretations and uses of
test scores.’’ Journal of Educational Measurement, 50, 74�83. doi:10.1111/
jedm.12001
Cheng, L., Watanabe, Y.J., & Curtis, A. (2004). Washback in language testing:
Research contexts and methods. Mahwah, NJ: Erlbaum.
Ercikan, K., Arim, R., Law, D., Domene, J., Gagnon, F., & Lacroix, S. (2010).
Application of think aloud protocols for examining and confirming sources of
differential item functioning identified by expert reviews. Educational
Measurement: Issues and Practice, 29, 24�35. doi:10.1111/j.1745-3992.2010.
00173.x
Ericsson, K.A., & Simon, H.A. (1993). Protocol analysis: Verbal reports as data
(Rev. ed.). Cambridge, MA: MIT Press.
Ferne, T., & Rupp, A.A. (2007). A synthesis of 15 years of research on DIF in
language testing: Methodological advances, challenges, and
recommendations. Language Assessment Quarterly, 4, 113�148.
In’nami, Y., & Koizumi, R. (2012). Factor structure of the revised TOEIC† test:
A multiple-sample analysis. Language Testing, 29, 131�152. doi:10.1177/
0265532211413444
80 In’nami: Second Language Vocabulary Assessment Research
Vocabulary Learning and Instruction, 2 (1), 74�81.

Kane, M.T. (2013). Validating the interpretations and uses of test scores. Journal of
Educational Measurement, 50, 1�73. doi:10.1111/jedm.12000
Kunnan, A.J., & Jang, E.E. (2009). Diagnostic feedback in language assessment.In M.H. Long., & C.J. Doughty (Eds.), The handbook of language teaching
(pp. 610�627). Oxford, UK: Wiley-Blackwell. doi:10.1002/9781444315783.
ch32
Lykken, D.T. (1968). Statistical significance in psychological research.
Psychological Bulletin, 70, 151�159. doi:10.1037/h0026141
McNamara, T., & Roever, C. (2006). Language Testing: The Social Dimension.
Malden, MA: Blackwell.
Meara, P., & Buxton, B. (1987). An alternative to multiple choice vocabulary tests.
Language Testing, 4, 142�154.
Nakanishi, T. (2013). A meta-analysis of extensive reading research.
Nation, I.S.P., & Webb, S. (2011). Researching and analyzing vocabulary. Boston,MA: Heinle, Cengage Learning.
Porte, G. (Ed.). (2012). Replication research in applied linguistics. Cambridge, UK:
Cambridge University Press.
Roberts, M.R., & Gierl, M.J. (2010). Developing score reports for cognitive
diagnostic assessments. Educational Measurement: Issues and Practice, 29,25�38. doi:10.1111/j.1745-3992.2010.00181.x
Schmitt, N. (2010). Researching vocabulary: A vocabulary research manual.Hampshire, UK: Palgrave Macmillan.
Stubbe, R. (2012a). Do pseudoword false alarm rates and overestimation rates in
Yes/No vocabulary tests change with Japanese university students’ Englishability levels? Language Testing, 29, 471�488. doi:10.1177/02655322114
33033
Stubbe, R. (2012b). Searching for an acceptable false alarm maximum. Vocabulary
Education & Research Bulletin, 1 (2), 7�9. Retrieved from http://jaltvocab.
weebly.com/uploads/3/3/4/0/3340830/verb-vol1.2.pdf
Stubbe, R., & Stewart, J. (2012). Optimizing scoring formulas for yes/no vocabulary
checklists using linear models. Shiken Research Bulletin, 16 (2), 2�7. Retrieved
from http://teval.jalt.org/node/12
Wydell, T.N., & Kondo, T. (2003). Phonological deficit and the reliance on
orthographic approximation for reading: A follow-up study on an English-
Japanese bilingual with monolingual dyslexia. Journal of Research in Reading,
26, 33�48. doi:10.1111/1467-9817.261004
In’nami: Second Language Vocabulary Assessment Research 81
Vocabulary Learning and Instruction, 2 (1), 74�81.