VMworld 2015: vRealize Operations Insight: Manage vSphere and Your Entire Data Center… All In One...
56
vRealize Operations Insight: Manage vSphere and Your Entire Data Center… All In One Place! Himanshu Singh, Product Line Marketing Manager, VMware Hicham (he-sham) Mourad, Group Technical Marketing Manager, VMware MGT5245 #MGT5245
-
Upload
vmworld -
Category
Technology
-
view
190 -
download
0
Transcript of VMworld 2015: vRealize Operations Insight: Manage vSphere and Your Entire Data Center… All In One...
vRealize Operations Insight:Manage vSphere and Your Entire Data Center…
All In One Place!Himanshu Singh, Product Line Marketing Manager, VMware
Hicham (he-sham) Mourad, Group Technical Marketing Manager, VMware
MGT5245
#MGT5245

CONFIDENTIAL 2
• This presentation may contain product features that are currently under development.
• This overview of new technology represents no commitment from VMware to deliver these features in any generally available product.
• Features are subject to change, and must not be included in contracts, purchase orders, or sales agreements of any kind.
• Technical feasibility and market demand will affect final delivery.
• Pricing and packaging for any new technologies or features discussed or presented have not been determined.
Disclaimer

3
Agenda
1 How Does IT Become Even More Awesome
2 What is vROI?
4 What’s Included & What Can You Do With It
5 Demo

IT at theSpeed of Business
Customers Need Help Bridging Between Existing and New IT to Support the Business and ALL Workloads
* Source: Gartner, 2013: “Hunting and Harvesting in a Digital World: The 2013 CIO Agenda”
IT Technology Eras
Mainframe Client-Server Mobile-Cloud
$ $ $ $ $ $
Ability of IT to Deliver
Steady IT Budgets*
Business Expectations
4

The Transformative Opportunity for IT
Provide Solutions at the Speed the Business Operates
Move from being Reactive to Proactive
Become a Strategic Partner to the Business
• Quickly deliver reliable services and applications and be more flexible to business requests
• Enable higher performance and availability of infrastructure and applications
• Deliver not just operational efficiency, but improve the way the business operates and add value and differentiation along the way.
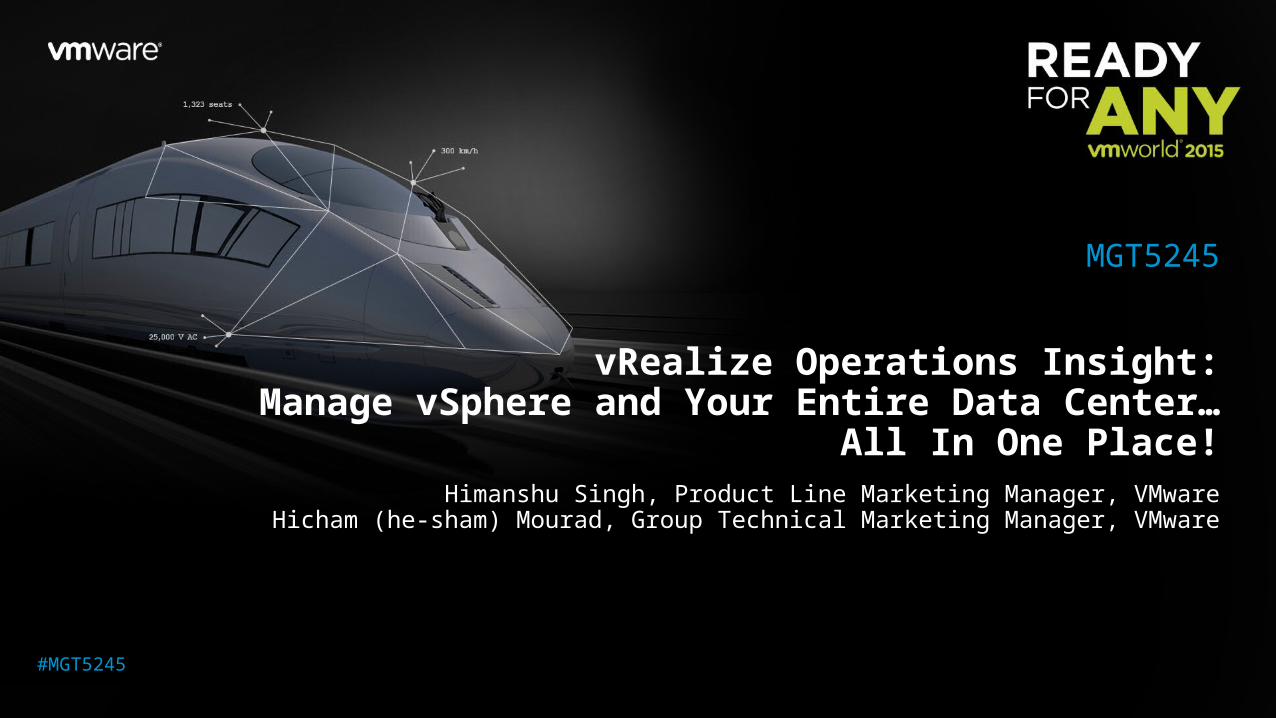
What Does IT Need to Fuel this Transformation
#1 - Match Speed of the Business
Consistent management and automation for the virtual data center
Optimize infrastructure
efficiency and IT productivity
Infrastructure designed for
mobile, social, big data and hybrid
cloud apps

What Does IT Need to Fuel this Transformation
#2 – Become Proactive
Get meaningful insights in one
place, covering the entire stack
Get better visibility into dependencies
of apps to infra
Improve performance and
reduce downtimes
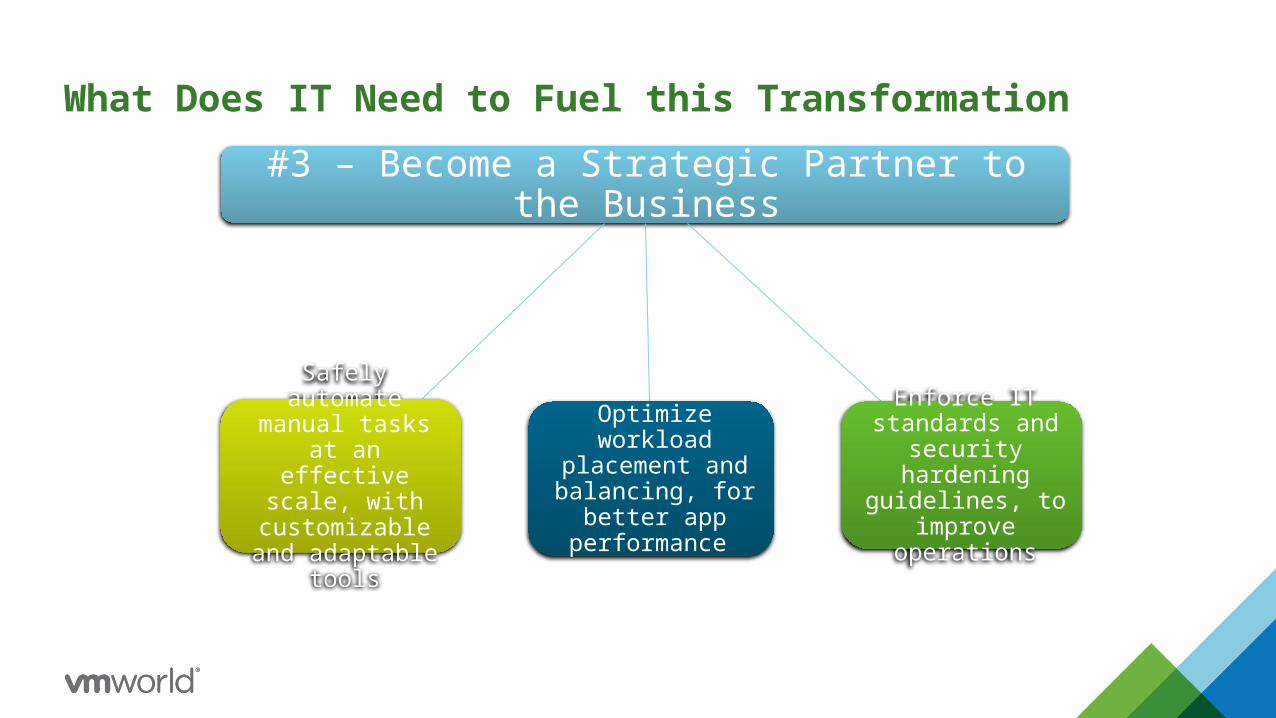
What Does IT Need to Fuel this Transformation
#3 – Become a Strategic Partner to the Business
Optimize workload placement and
balancing, for better app performance
Enforce IT standards and
security hardening guidelines, to
improve operations
Safely automate manual tasks at an effective scale, with customizable and adaptable tools
CONFIDENTIAL 9
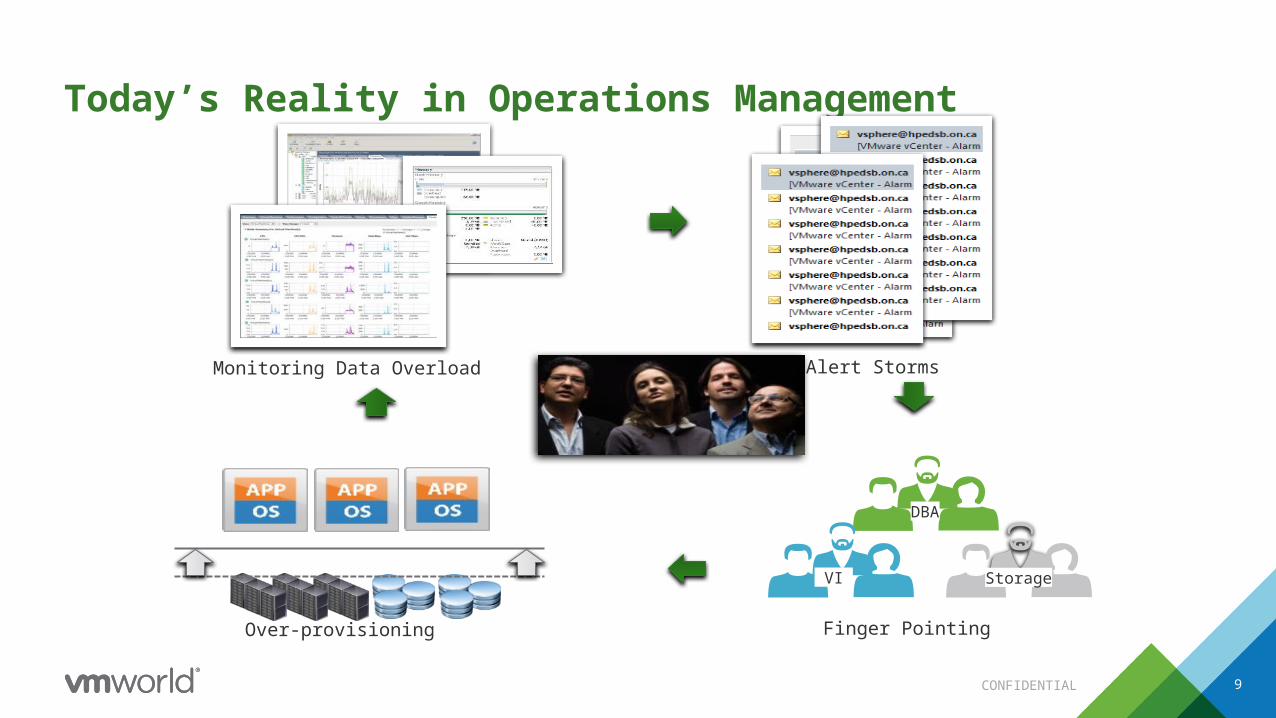
Today’s Reality in Operations Management
Monitoring Data Overload Alert Storms
Finger Pointing
DBA
VI Storage
Over-provisioning
CONFIDENTIAL 10
Silo-ed Operations Management with no single
solution
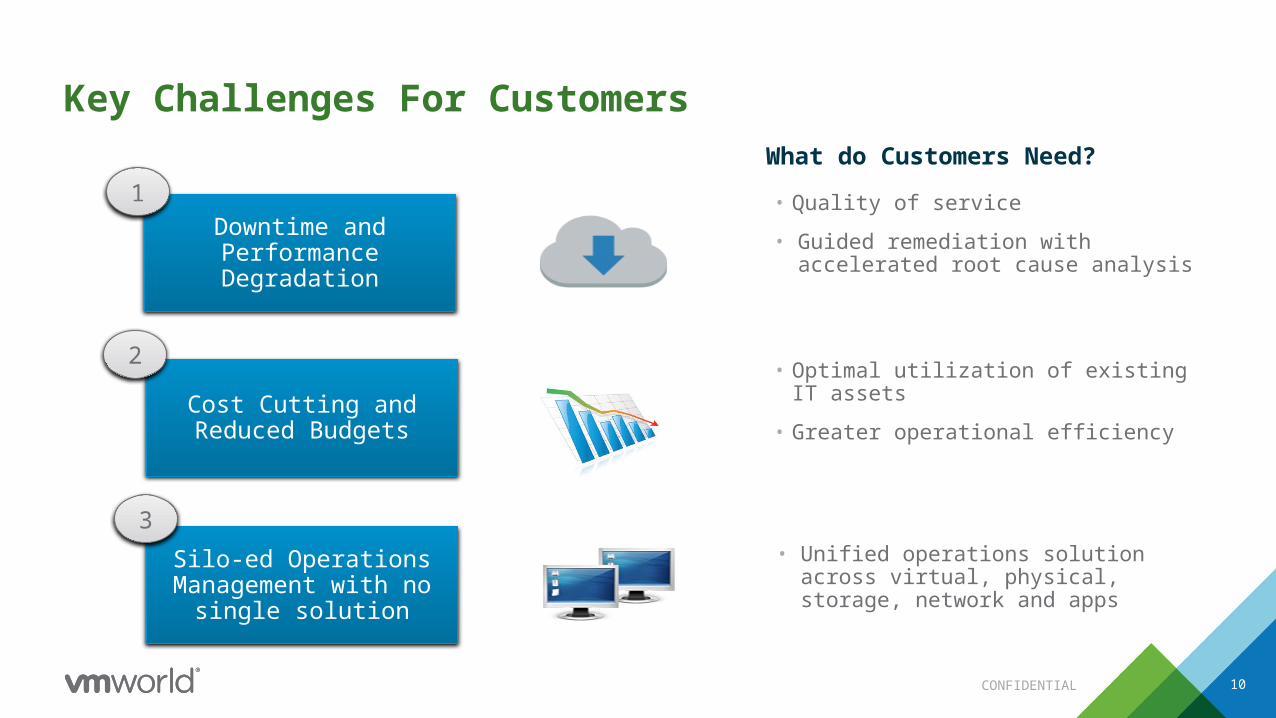
Downtime and Performance Degradation
• Unified operations solution across virtual, physical, storage, network and apps
• Quality of service
• Guided remediation with accelerated root cause analysis
Key Challenges For Customers
Cost Cutting and Reduced Budgets
1
2
3
• Optimal utilization of existing IT assets
• Greater operational efficiency
What do Customers Need?

CONFIDENTIAL
The Five Pillars of Operational Analytics
11
Operational Analytics
Performance & Availability
Logs & Unstructured
Data
Topology Analysis
Configuration Health
Capacity Consumption
CONFIDENTIAL 12
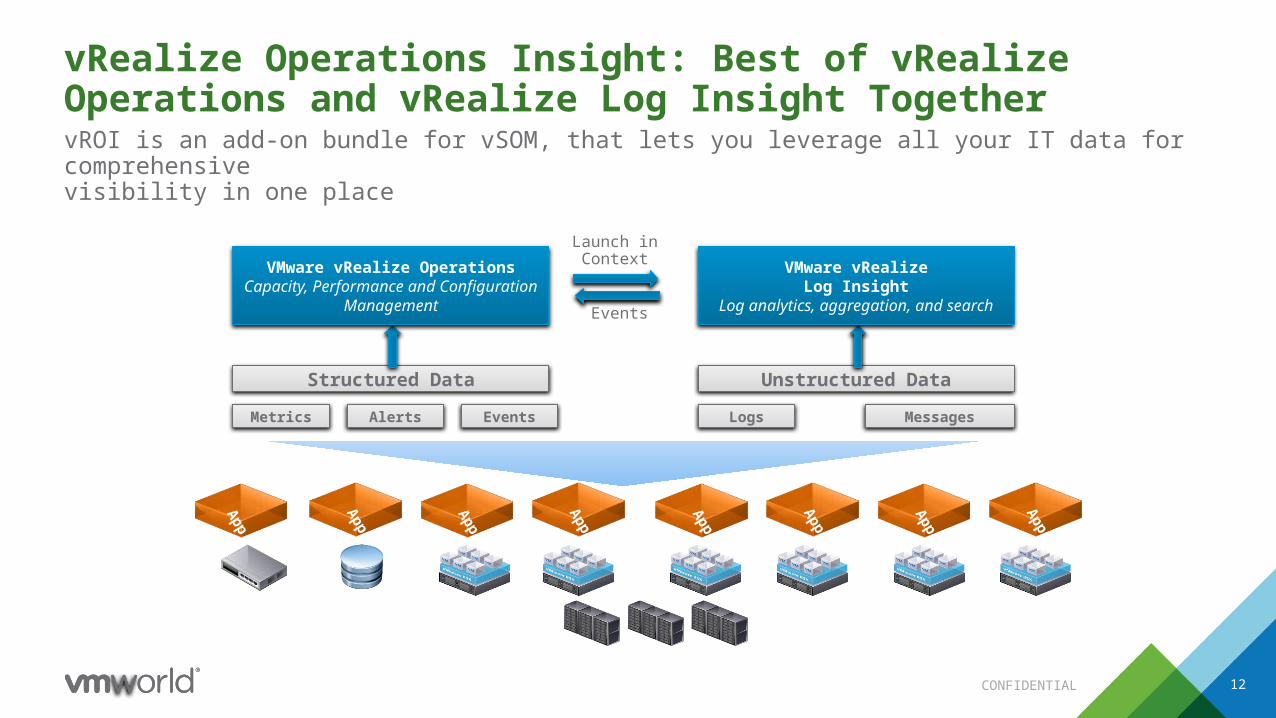
vRealize Operations Insight: Best of vRealize Operations and vRealize Log Insight TogethervROI is an add-on bundle for vSOM, that lets you leverage all your IT data for comprehensivevisibility in one place
Structured Data
Metrics Alerts Events
VMware vRealize OperationsCapacity, Performance and Configuration
Management Events
Launch in Context
Unstructured Data
Logs Messages
VMware vRealizeLog Insight
Log analytics, aggregation, and search
App
App
App
App
App
App
App
App
App
App
App

vRealize Operations Insight Partner Ecosystem
This is not an exhaustive list
VMware Solutions
Amazon Web Services
vCloud Air
Storage Devices
NSX
vCloud Networking & Security
EMC Smarts
Partner Solutions
EMC Storage Analytics
HP OneView
VCE Vision
Dell Compellent Storage
HP StoreFront
Cisco UCS
NetFlow Logic
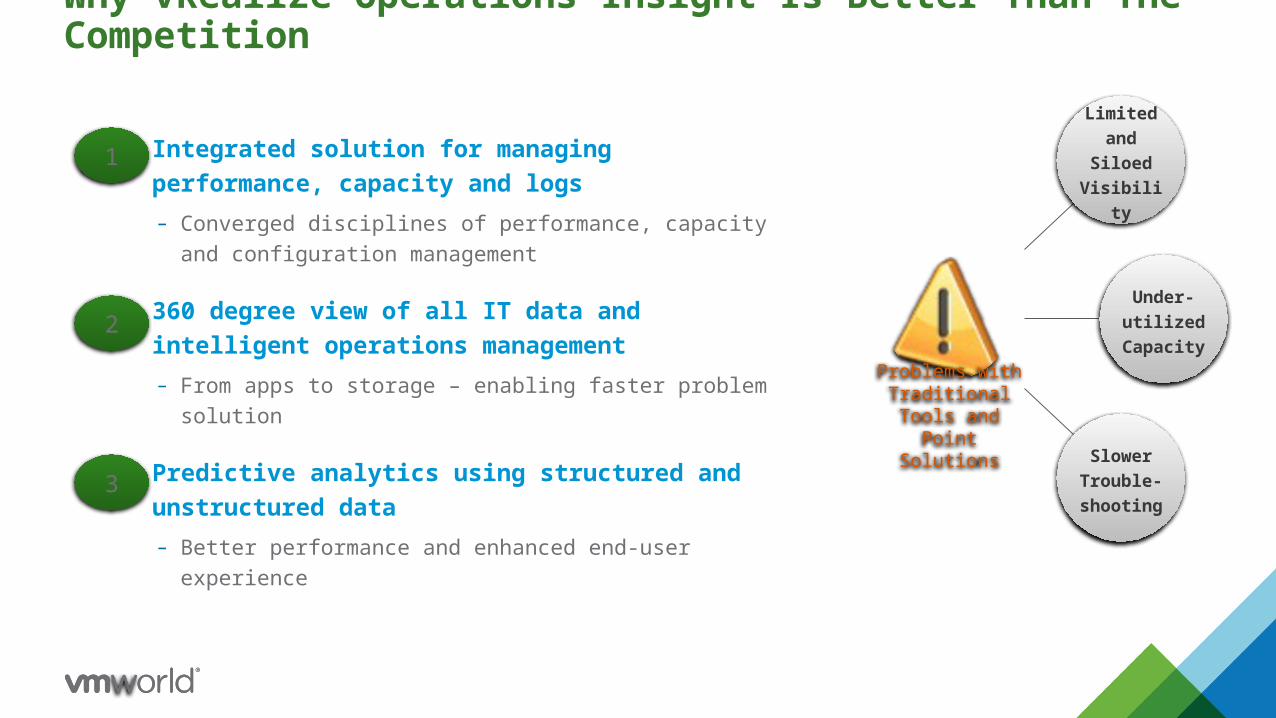
Integrated solution for managing performance, capacity and logs– Converged disciplines of performance, capacity and
configuration management
360 degree view of all IT data and intelligent operations management– From apps to storage – enabling faster problem solution
Predictive analytics using structured and unstructured data– Better performance and enhanced end-user experience
1
2
3
Why vRealize Operations Insight Is Better Than The Competition
Limited and Siloed Visibility
Under-utilized
Capacity
Slower Trouble-shooting
Problems with Traditional Tools
and Point Solutions
CONFIDENTIAL 15
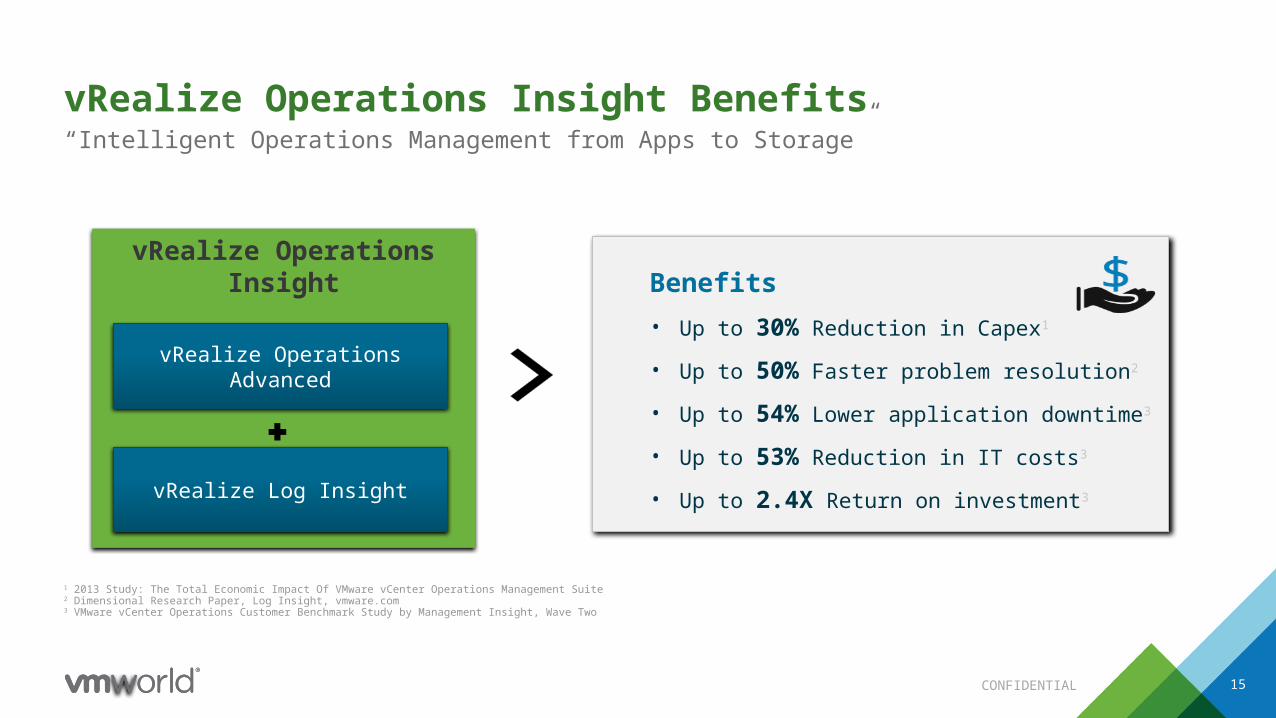
Benefits• Up to 30% Reduction in Capex1
• Up to 50% Faster problem resolution2
• Up to 54% Lower application downtime3
• Up to 53% Reduction in IT costs3
• Up to 2.4X Return on investment3
vRealize Operations Insight Benefits“Intelligent Operations Management from Apps to Storage”
vRealize Operations Insight
vRealize Log Insight
vRealize Operations Advanced
1 2013 Study: The Total Economic Impact Of VMware vCenter Operations Management Suite2 Dimensional Research Paper, Log Insight, vmware.com3 VMware vCenter Operations Customer Benchmark Study by Management Insight, Wave Two
✚
vRealize Operations Insight 6.1

What’s New: Intelligent Workload Management
17CONFIDENTIAL
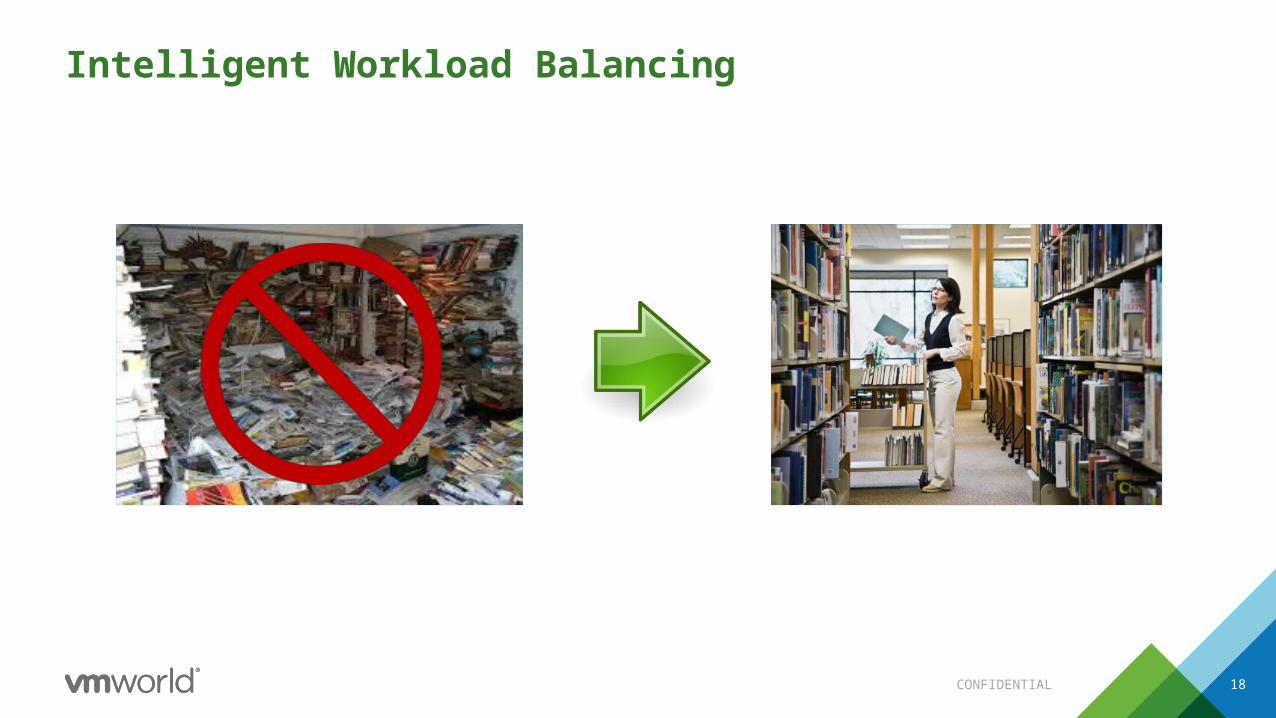
Intelligent Workload Balancing Integrated OS Monitoring
Problem: • Workloads are often placed sub-
optimally, resulting in inefficient usage of clusters.
• Ongoing balancing of resources is a difficult, time-consuming, and non-strategic activity.
Solution: • Visualize how your clusters are
loaded with workloads across clusters, vCenters, data centers.
• Get a Balancing Plan that recommends optimal placement of the workloads and balances the workloads across clusters.
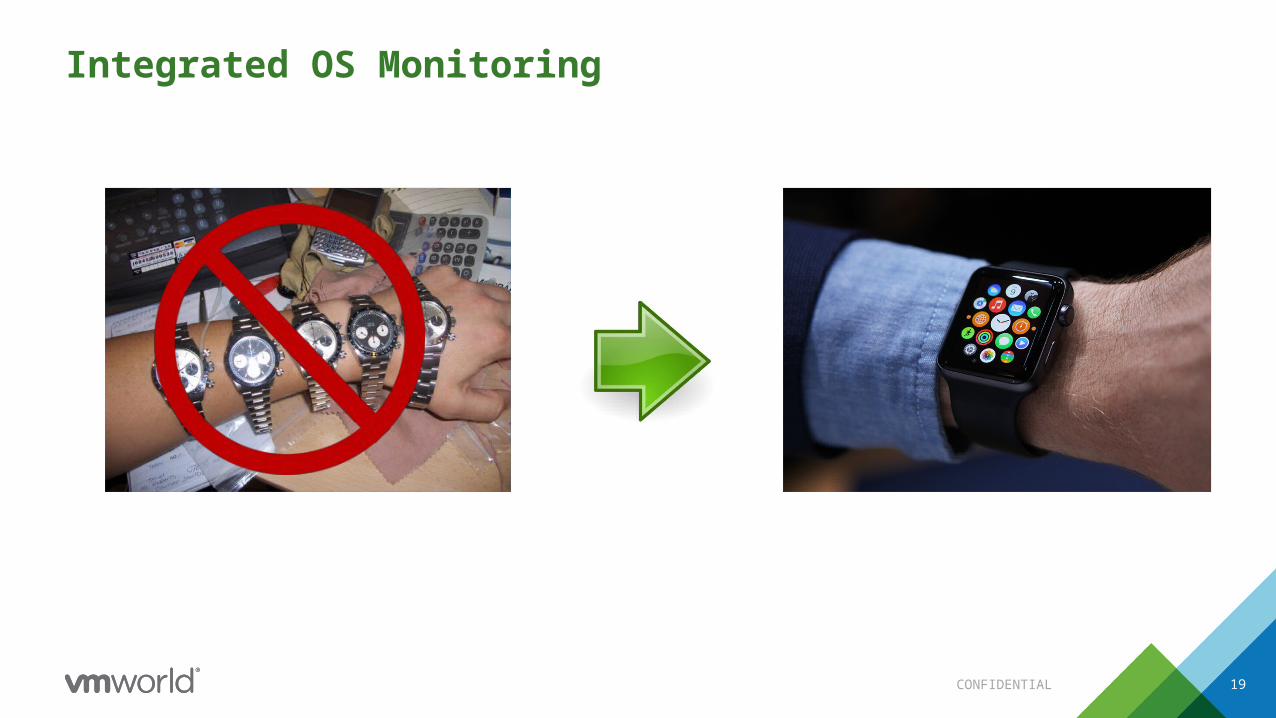
Problem: • Monitoring OS and infrastructure is
complex, requires multiple tools, and can lead to blind spots
Solution: • OS monitoring is now available
natively in vRealize Operations.• Predictive analytics help IT to
proactively identify and avoid potential issues across infrastructure and application stacks in one place.
18
Intelligent Workload Balancing
CONFIDENTIAL
19
Integrated OS Monitoring
CONFIDENTIAL
20
Alright…Details.
What’s Included, andWhat Can You Do With It?

Custom Data Center
Understand capacity across vCenter boundaries• Custom Data Centers (CDC) span clusters and vCenter
server environments
• Combine Hosts, Clusters, and Data Center’s from one or more vCenter environments
• Simple wizard driven CDC creation process
• Full Capacity management / planning for the Custom Data Center
• “Is my West Coast CDC running short on Capacity?”
• Support for all analysis badges• Looks like a “real” vSphere data center
• “What is the Health of my Production-East CDC?”
Technical Overview
New container that spans the SDDC to provide new levels of visibility

Reserve Capacity Now
Committing & Reserving Capacity/Capacity Planning• Plan a Project – A proposal showing change in demand or
resources• E.g. Add 10 new Oracle VMs and 5 new Hosts on July 1
• Commit a Project – Affect Future Capacity• Lets vR Ops/Users know there is a future planned project
• Reflects the project’s impact at a certain set date
• Affects Time Remaining badge & capacity trends (on the implementation date)
• New - Commit a Project (DEFAULT) – Reserve Capacity Now• Tells vR Ops to set aside the capacity for the project NOW
• Reserved Capacity affects vR Ops capacity analysis
• Affects the Time and Capacity Remaining badges
Technical Overview
Reserve Capacity
Affect Future Capacity
Reserve Capacity Now
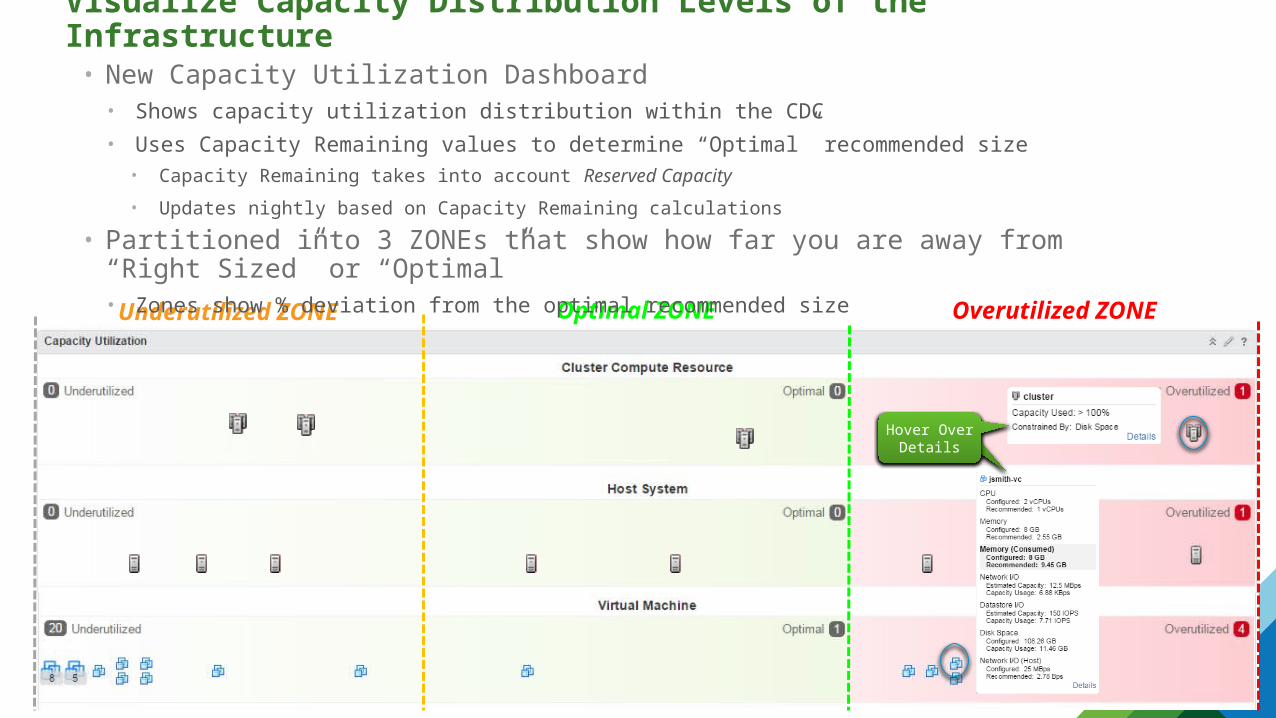
Visualize Capacity Distribution Levels of the Infrastructure
Underutilized ZONE Optimal ZONE Overutilized ZONE
• New Capacity Utilization Dashboard• Shows capacity utilization distribution within the CDC• Uses Capacity Remaining values to determine “Optimal” recommended size
• Capacity Remaining takes into account Reserved Capacity
• Updates nightly based on Capacity Remaining calculations
• Partitioned into 3 ZONEs that show how far you are away from “Right Sized” or “Optimal”• Zones show % deviation from the optimal recommended size
Hover Over Details
Hover Over Details

• What does it mean?– Host and Clusters Overutilized – High Capacity Risk– Hosts and Clusters Underutilized – Space available– Workloads improperly distributed in the CDC
• What should you do?– Better distribute workloads – Avoid Capacity Risk – Distribute workloads, but how?
Distribute WorkloadsDistribute Workloads
Visualize Capacity Distribution Levels of the InfrastructureExample 1: Imbalanced Infrastructure
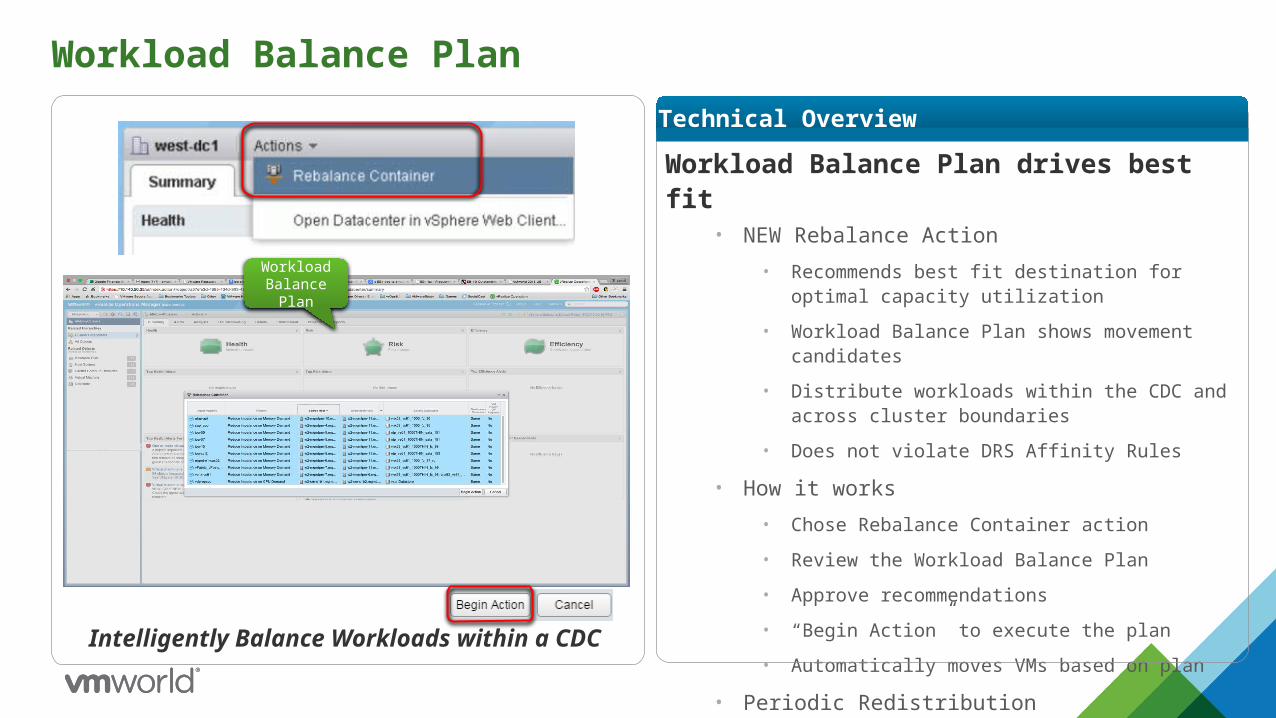
Workload Balance Plan
Workload Balance Plan drives best fit • NEW Rebalance Action
• Recommends best fit destination for optimal capacity utilization
• Workload Balance Plan shows movement candidates
• Distribute workloads within the CDC and across cluster boundaries
• Does not violate DRS Affinity Rules
• How it works• Chose Rebalance Container action
• Review the Workload Balance Plan
• Approve recommendations
• “Begin Action” to execute the plan
• Automatically moves VMs based on plan
• Periodic Redistribution
Technical Overview
Intelligently Balance Workloads within a CDC
Workload Balance Plan

Workloads under Stress
• What does it mean?– VMs are improperly sized – Too small– VMs starving for resources due to contention – High Demand and Stress
• What should you do?– Rightsize VM UP to give it enough resources – Meet workload Demand and remove Stress– View Stress & Capacity Remaining badges and run Rightsize action to quickly resolve issue
• Example: Set CPU Count and Memory for VM
– Run Rebalance Action Review Workload Balance Plan Approve “Begin Action”
Visualize Capacity Distribution Levels of the InfrastructureExample 2: Overutilized workloads

• What does it mean?– Host and Clusters Overutilized due to current or future reserved capacity – High Capacity Risk– No Hosts and Clusters Underutilized – No space available
• What should you do?– Remove some unneeded workloads– Obtain more HW
Nothing Underutilized
Everything Overutilized
Visualize Capacity Distribution Levels of the InfrastructureExample 3: Overutilized Infrastructure

• What does it mean?– VMs are improperly sized – Too big– Resources are being wasted – Available Reclaimable Capacity
• What should you do?– Rightsize DOWN to reclaim capacity – Save on future HW spend $$$– View Stress data and run Rightsize action to quickly resolve issue
• Example: Set CPU Count and Memory for VM
Visualize Capacity Distribution Levels of the Infrastructure
Example 4: Identify unused resources
Reclaim Capacity
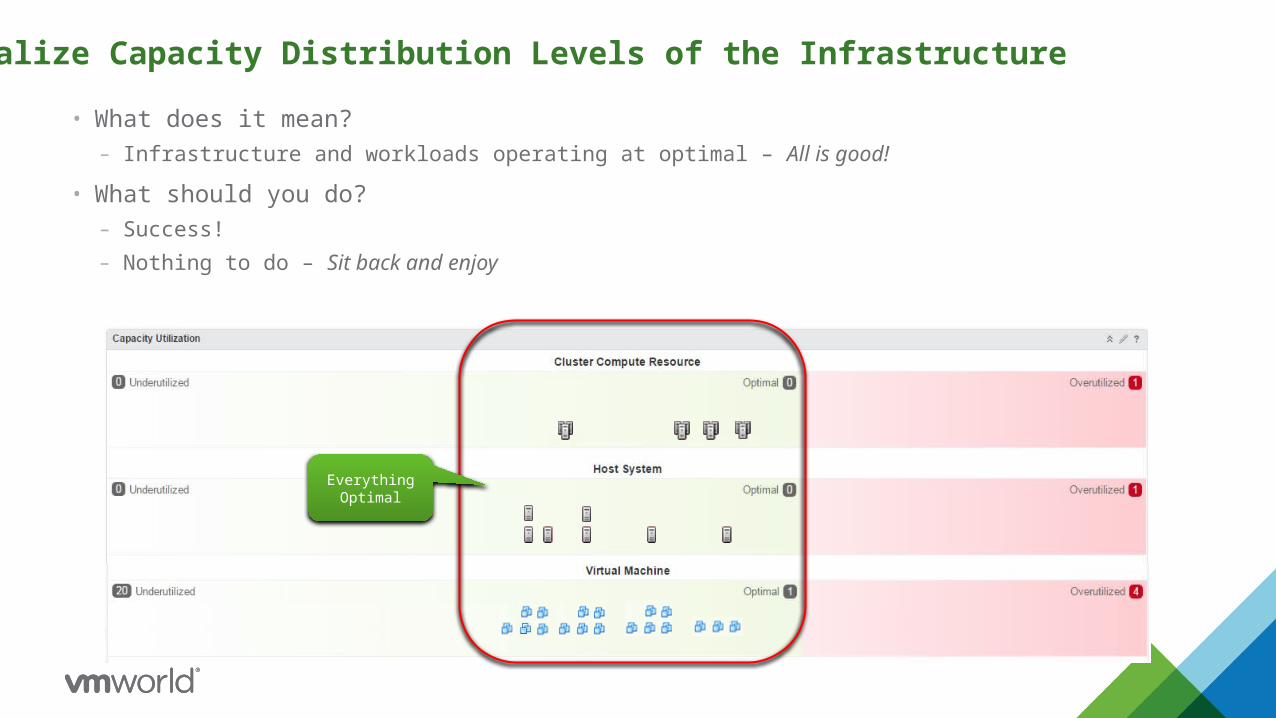
• What does it mean?– Infrastructure and workloads operating at optimal – All is good!
• What should you do?– Success!– Nothing to do – Sit back and enjoy
Everything Optimal
Visualize Capacity Distribution Levels of the Infrastructure

Custom Profiles
Understand capacity based on your important workload sizes• User defined workloads for capacity modeling
• Understand capacity based on your important workload sizes
• Publish Capacity Remaining results in a user-defined profile size
• Example: “10 VM’s of ACME DB profile”
• Copy Metrics from an existing workload, or create new
• Capacity planning in projects using user-defined custom profiles
• Use Custom Profiles in project scenarios
Technical Overview
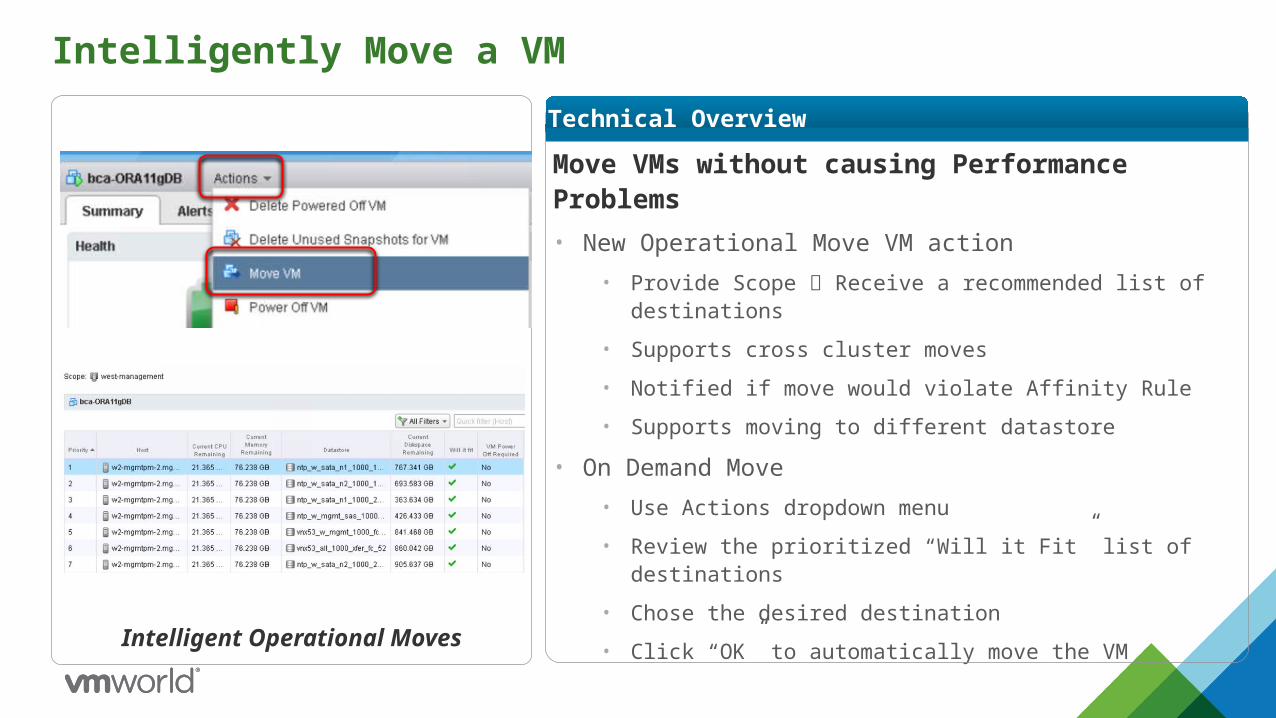
Intelligently Move a VM
Move VMs without causing Performance Problems• New Operational Move VM action
• Provide Scope Receive a recommended list of destinations
• Supports cross cluster moves
• Notified if move would violate Affinity Rule
• Supports moving to different datastore
• On Demand Move• Use Actions dropdown menu
• Review the prioritized “Will it Fit” list of destinations
• Chose the desired destination
• Click “OK” to automatically move the VM
Technical Overview
Intelligent Operational Moves

Dashboard & Widgets Enhancements
Dashboard Flexibility and Enhanced Design
• Dashboard Enhancements• Customizable widget sizing and layout changes on dashboard• Rows can span columns
• Widget Enhancements• Improved widget visualization and look-n-feel
• Scoreboard• Sparkline • Top-N widget• Pie chart• Bar charts*
Technical Overview
Better dashboard flows
Custom widget layout re-sizing
Rows Can Now Span Columns
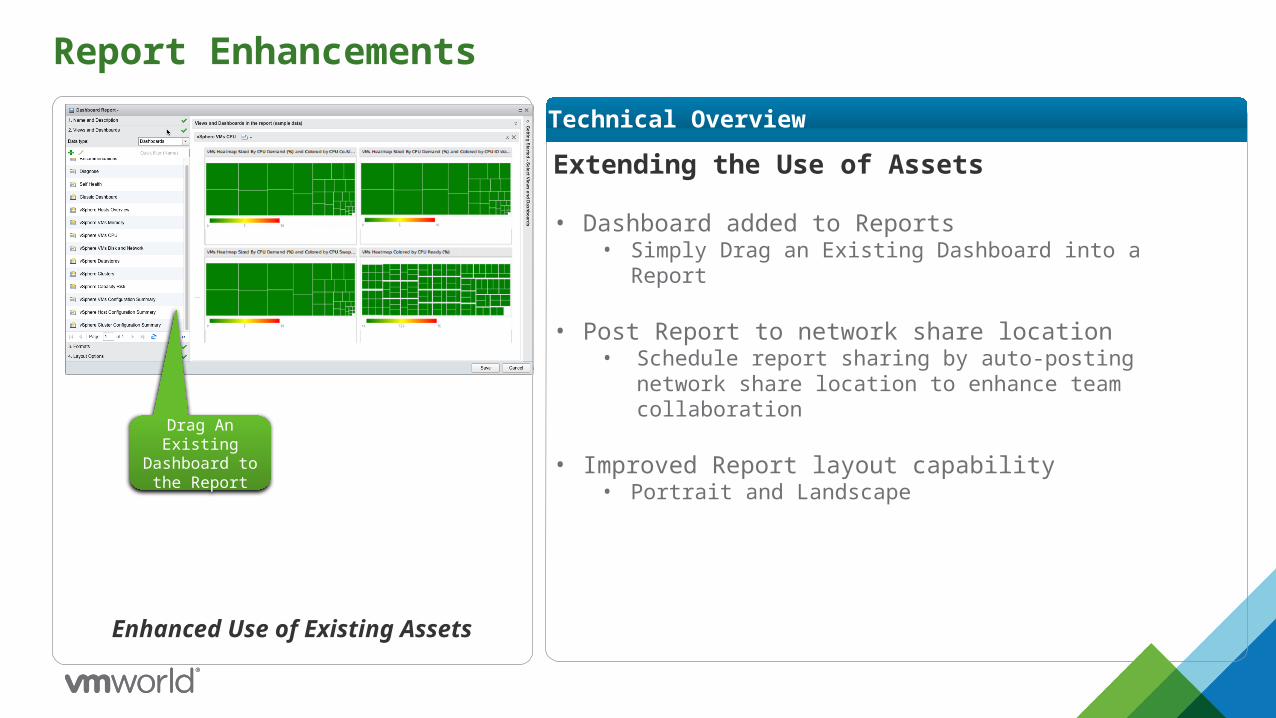
Report Enhancements
Extending the Use of Assets
• Dashboard added to Reports• Simply Drag an Existing Dashboard into a Report
• Post Report to network share location• Schedule report sharing by auto-posting network
share location to enhance team collaboration
• Improved Report layout capability • Portrait and Landscape
Technical Overview
Enhanced Use of Existing Assets
Drag An Existing Dashboard to the
Report
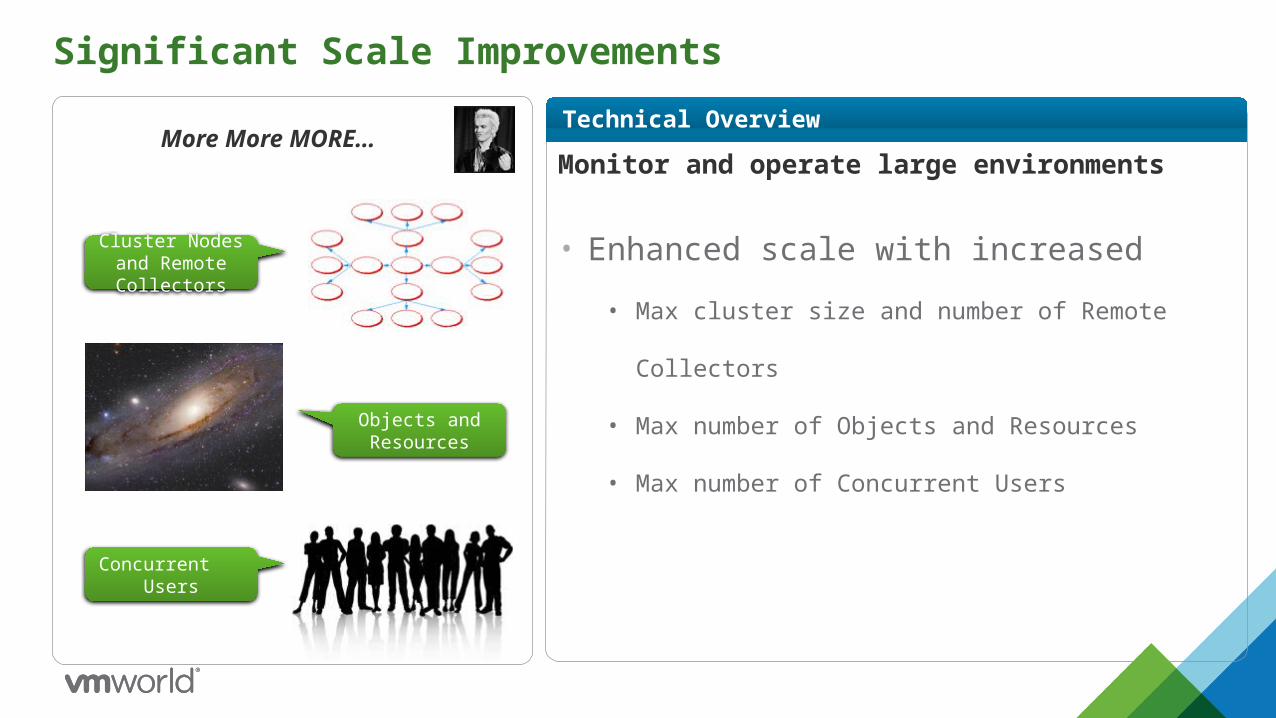
Significant Scale Improvements
Monitor and operate large environments
• Enhanced scale with increased
• Max cluster size and number of Remote Collectors
• Max number of Objects and Resources
• Max number of Concurrent Users
Technical OverviewMore More MORE…
Cluster Nodes and Remote Collectors
Objects and Resources
Concurrent Users
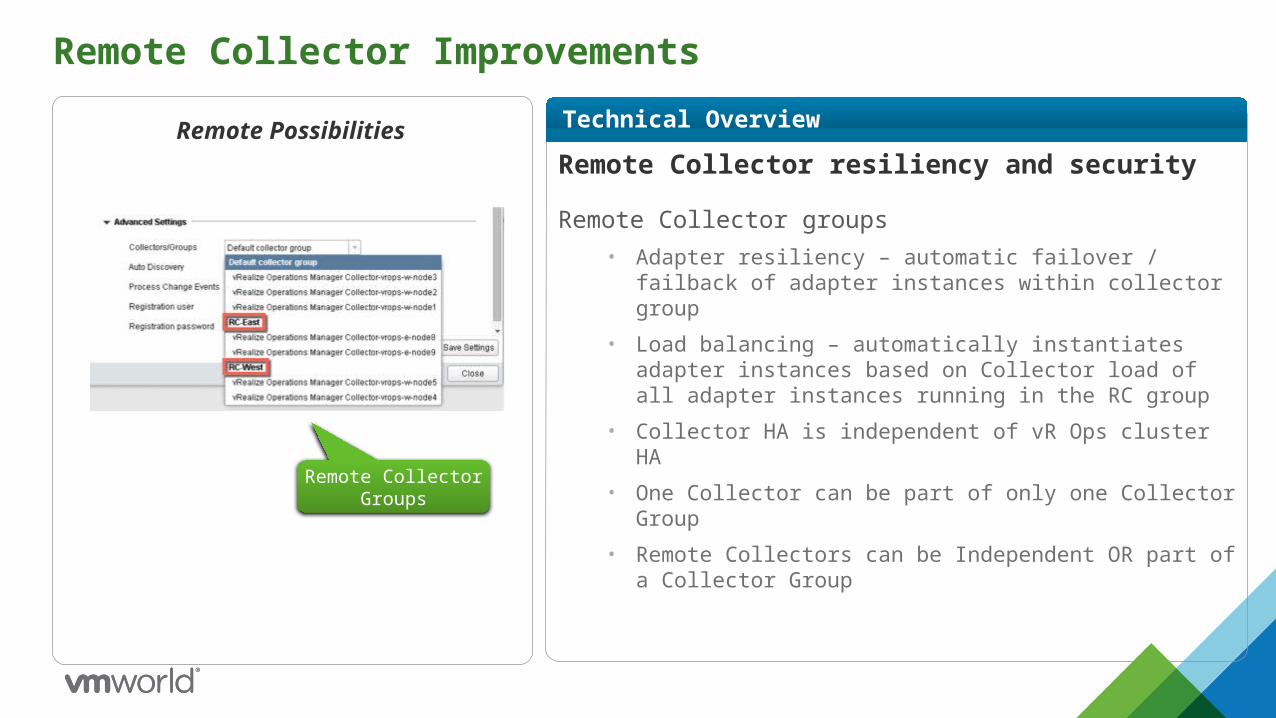
Remote Collector Improvements
Remote Collector resiliency and security
Remote Collector groups• Adapter resiliency – automatic failover / failback of adapter
instances within collector group
• Load balancing – automatically instantiates adapter instances based on Collector load of all adapter instances running in the RC group
• Collector HA is independent of vR Ops cluster HA
• One Collector can be part of only one Collector Group
• Remote Collectors can be Independent OR part of a Collector Group
Technical OverviewRemote Possibilities
Remote Collector Groups
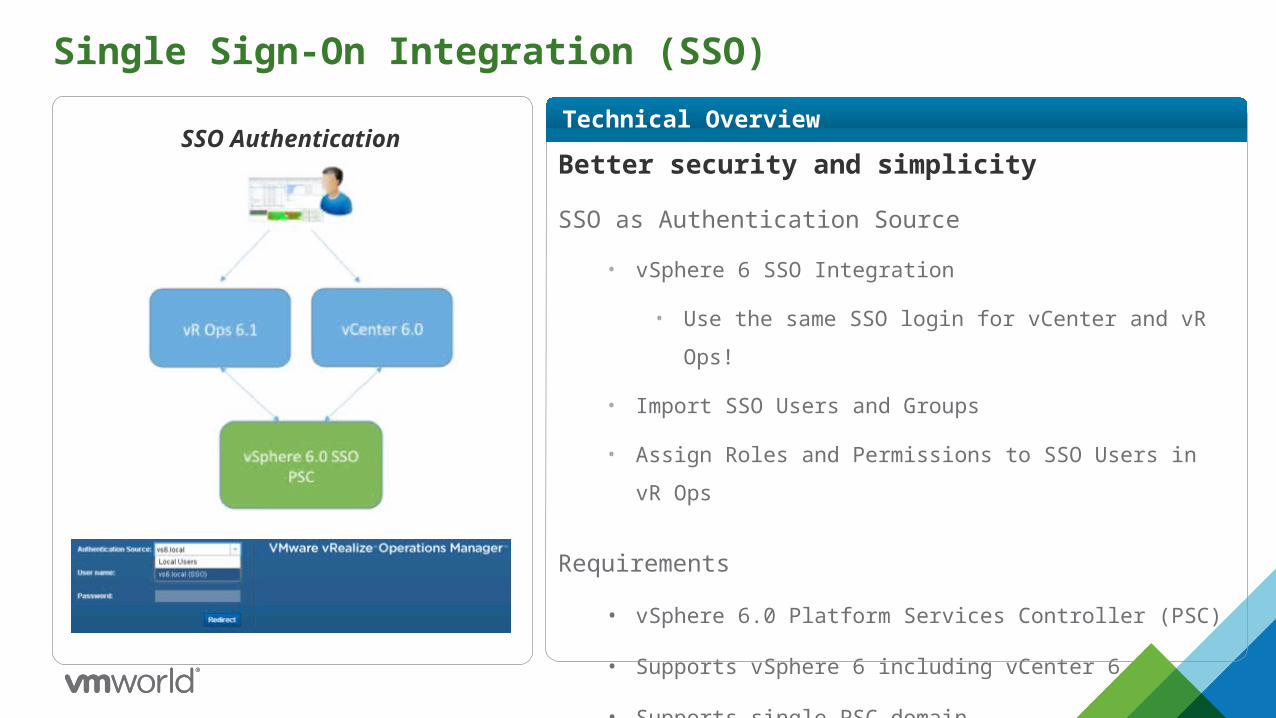
Single Sign-On Integration (SSO)
Better security and simplicity
SSO as Authentication Source
• vSphere 6 SSO Integration
• Use the same SSO login for vCenter and vR Ops!
• Import SSO Users and Groups
• Assign Roles and Permissions to SSO Users in vR Ops
Requirements
• vSphere 6.0 Platform Services Controller (PSC)
• Supports vSphere 6 including vCenter 6
• Supports single PSC domain
Technical OverviewSSO Authentication
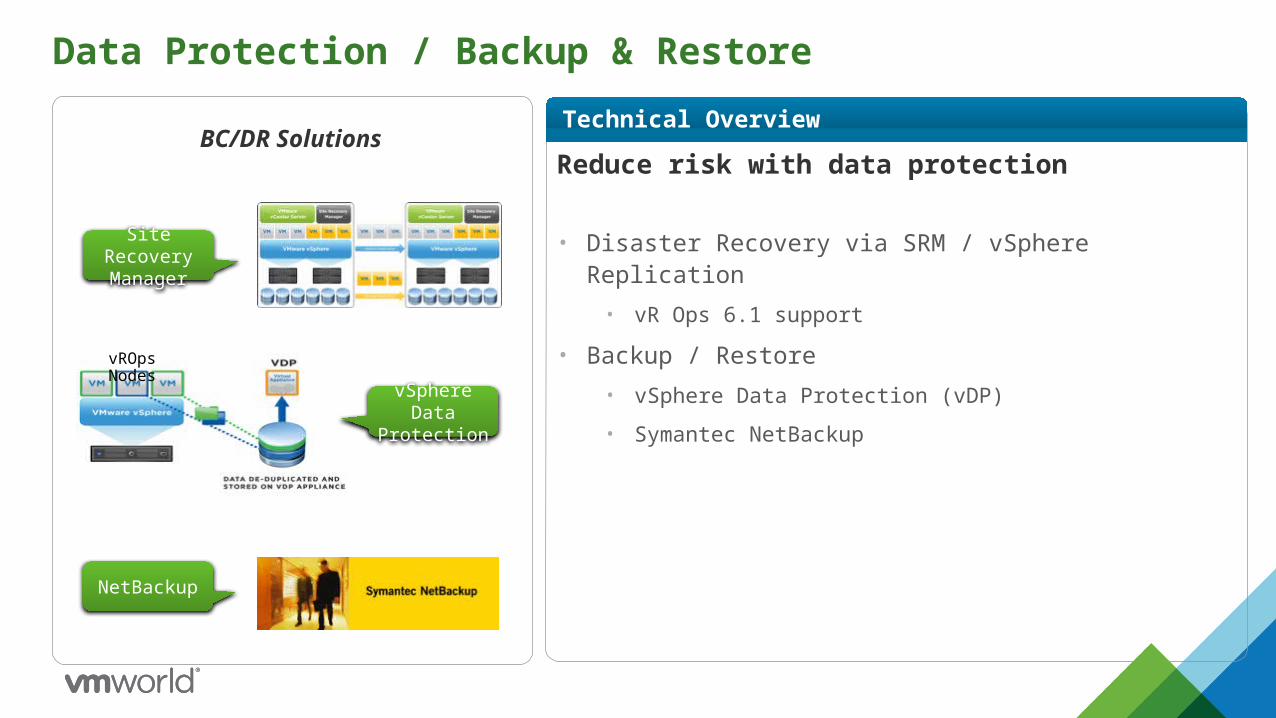
Data Protection / Backup & Restore
Reduce risk with data protection
• Disaster Recovery via SRM / vSphere Replication• vR Ops 6.1 support
• Backup / Restore• vSphere Data Protection (vDP)
• Symantec NetBackup
Technical Overview
vROps Nodes
BC/DR Solutions
Site Recovery Manager
vSphere Data Protection
NetBackup

Telemetry
Product improvements driven by customer
Deployment and usage reporting
• Secure upload over HTTPS• Sensitive data is one-way hashed
• Proxy servers can be automatically detected
• Phase 1 – Configuration (6.1)• Deployment details, version, edition, scale, policies
• Phase 2 – Performance and errors (post-6.1)• Latency of user activities / processing times
• Associated errors and exceptions
Technical Overview
Phone Home DB and Reporting
vROps Nodes
Application Feedback
Miscellaneous Enhancements
• Notes can now be added to Alerts• IPv6 support in vR Ops• Windows 2012 R2 support for vR Ops Installable• There's no plan to ship 6.x Foundation• Direct upgrade path from 6.0 or migrate 5.8 to 6.0, then upgrade to 6.1
39
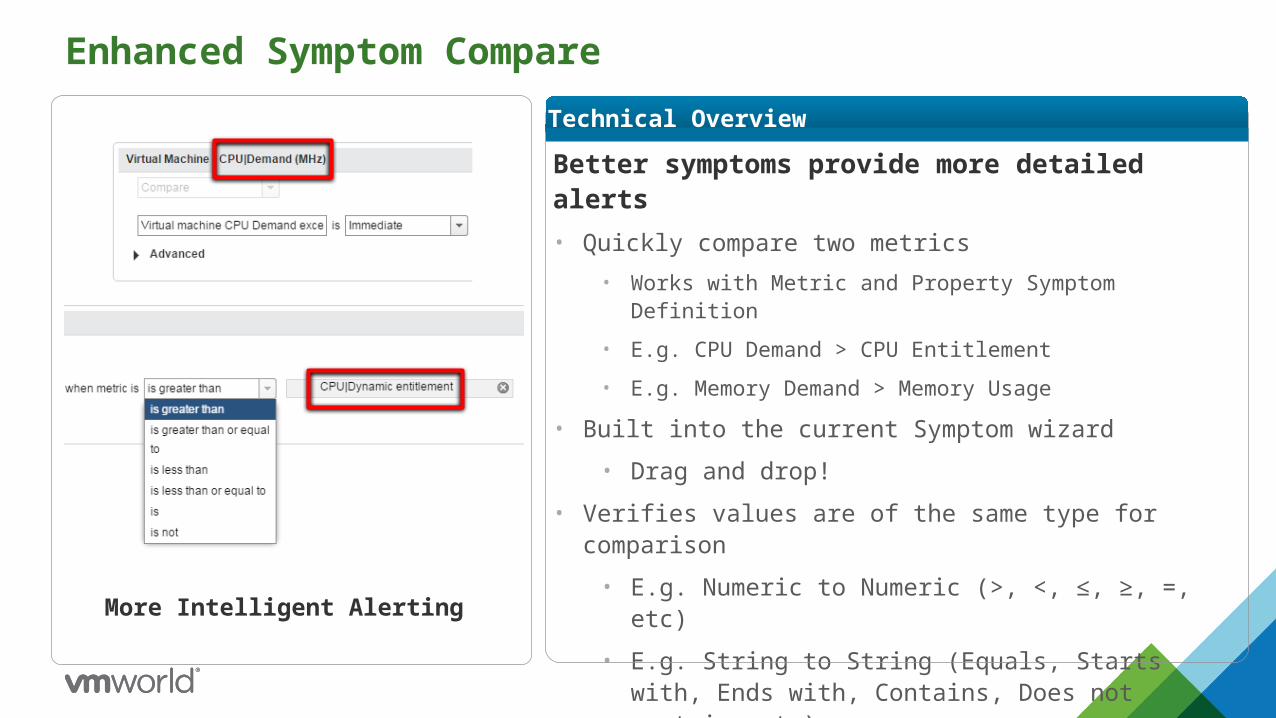
Enhanced Symptom Compare
Better symptoms provide more detailed alerts• Quickly compare two metrics
• Works with Metric and Property Symptom Definition
• E.g. CPU Demand > CPU Entitlement
• E.g. Memory Demand > Memory Usage
• Built into the current Symptom wizard
• Drag and drop!
• Verifies values are of the same type for comparison
• E.g. Numeric to Numeric (>, <, ≤, ≥, =, etc)
• E.g. String to String (Equals, Starts with, Ends with, Contains, Does not contain, etc)
Technical Overview
More Intelligent Alerting

vR Ops – Integrated Compliance
Integrated Compliance Framework• vSphere Hardening Content included with vSphere
Management Pack.
• Symptoms, Alerts, Views, Dashboards
• Managed per object/group via policies (ie, rule exceptions for group).
• Users may tweak and enforce their own compliance property symptoms
• Configuration properties and changes assessed near real-time
• Compliance Framework will allow for future content
Technical Overview
New, Integrated Compliance Framework
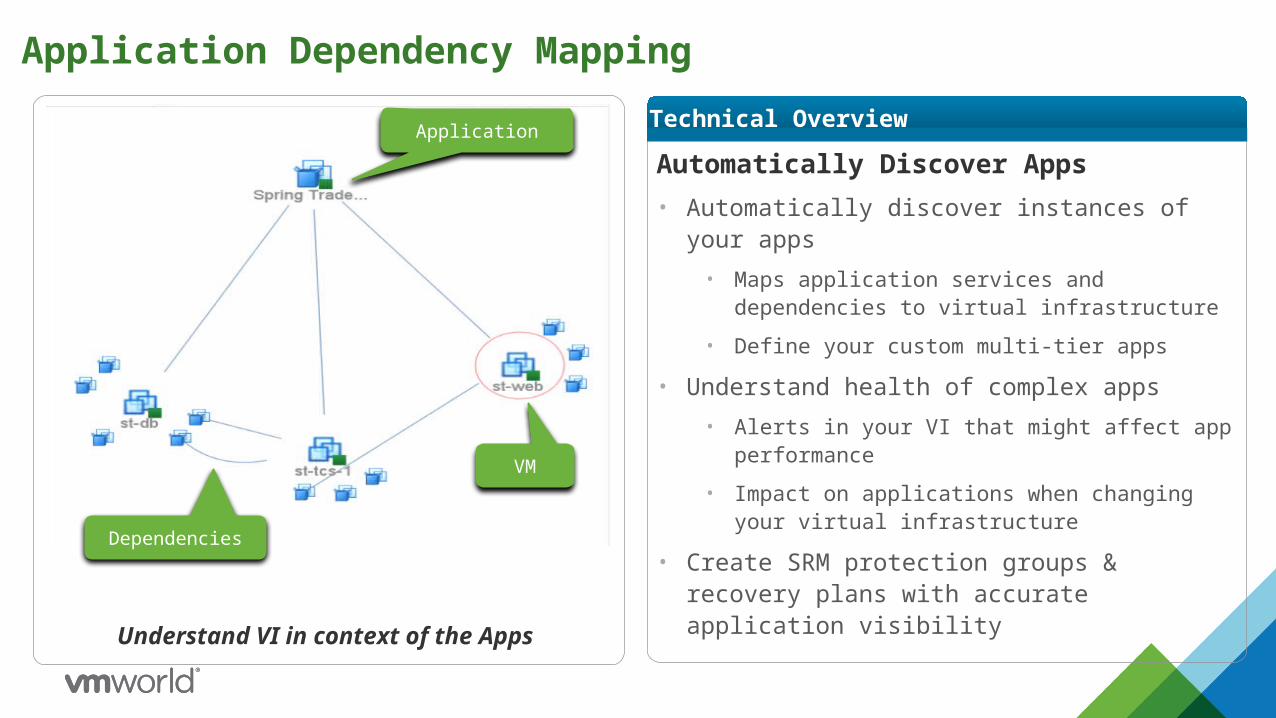
Application Dependency Mapping
Automatically Discover Apps• Automatically discover instances of your apps
• Maps application services and dependencies to virtual infrastructure
• Define your custom multi-tier apps
• Understand health of complex apps • Alerts in your VI that might affect app performance
• Impact on applications when changing your virtual infrastructure
• Create SRM protection groups & recovery plans with accurate application visibility
Technical Overview
Understand VI in context of the Apps
Application
Dependencies
VM
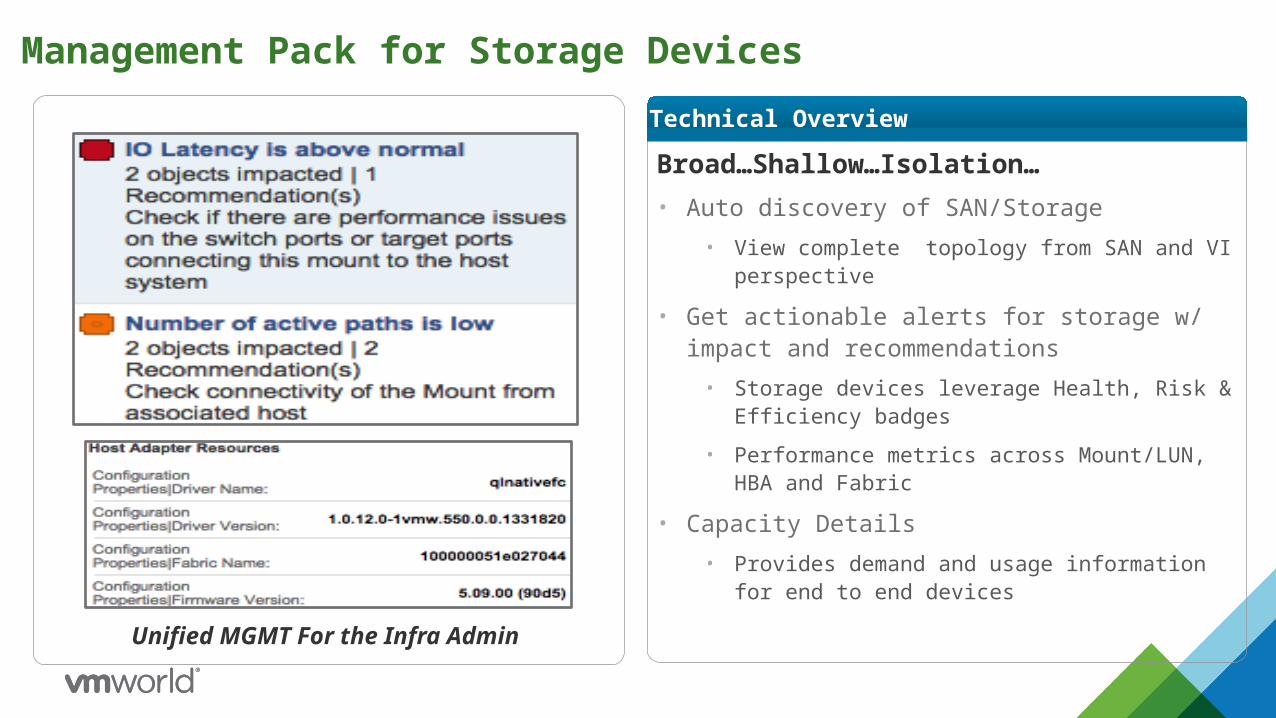
Management Pack for Storage Devices
Broad…Shallow…Isolation…• Auto discovery of SAN/Storage
• View complete topology from SAN and VI perspective
• Get actionable alerts for storage w/ impact and recommendations
• Storage devices leverage Health, Risk & Efficiency badges
• Performance metrics across Mount/LUN, HBA and Fabric
• Capacity Details• Provides demand and usage information for end to
end devices
Technical Overview
Unified MGMT For the Infra Admin
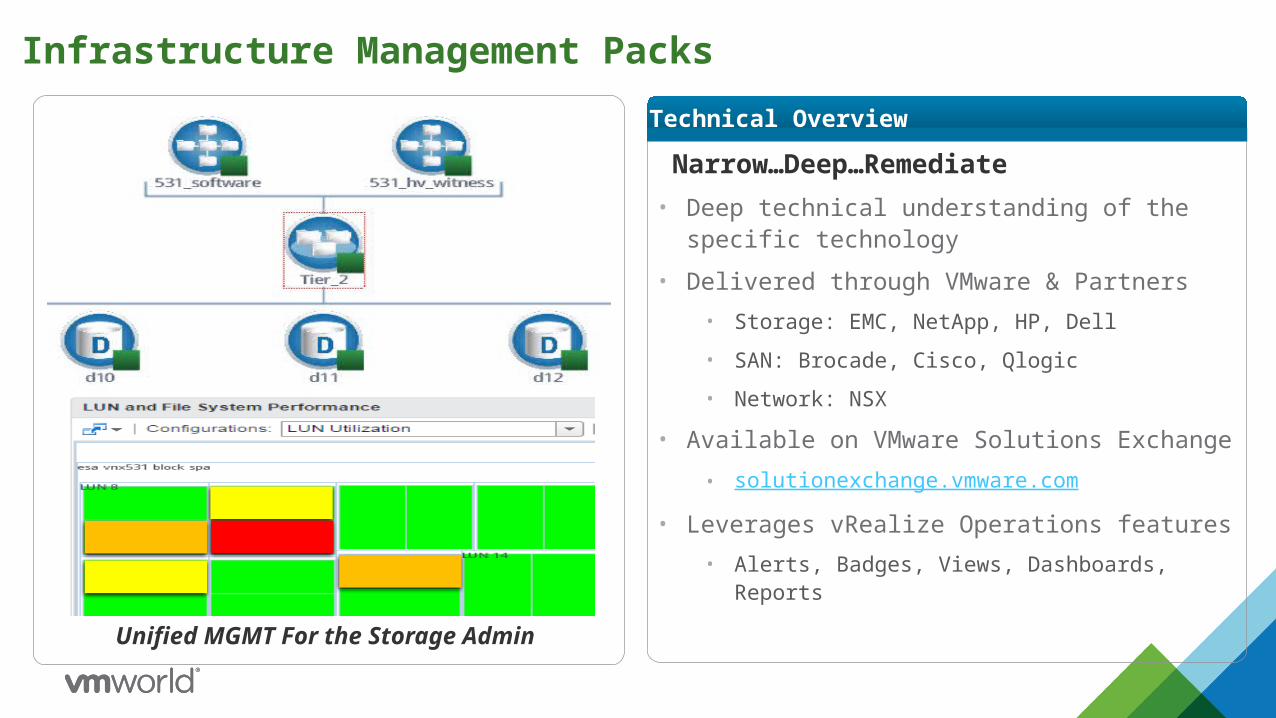
Infrastructure Management Packs
Narrow…Deep…Remediate • Deep technical understanding of the specific
technology
• Delivered through VMware & Partners • Storage: EMC, NetApp, HP, Dell
• SAN: Brocade, Cisco, Qlogic
• Network: NSX
• Available on VMware Solutions Exchange• solutionexchange.vmware.com
• Leverages vRealize Operations features• Alerts, Badges, Views, Dashboards, Reports
Technical Overview
Unified MGMT For the Storage Admin
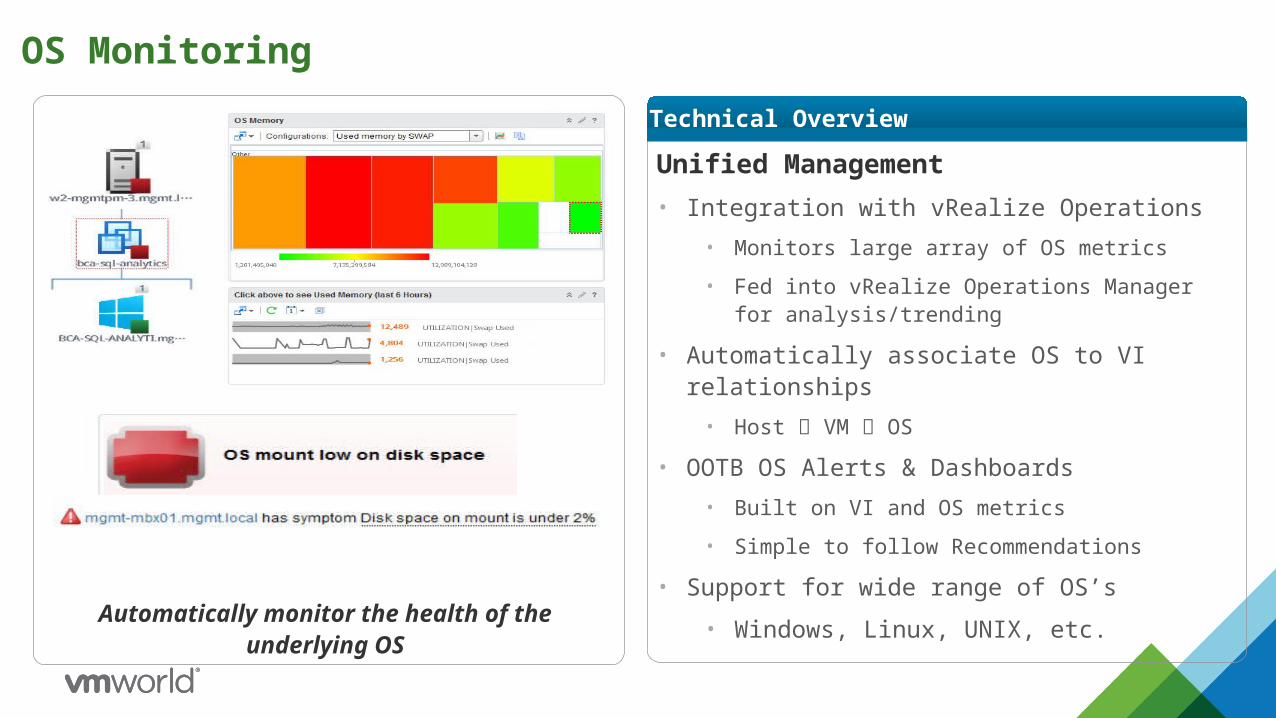
OS Monitoring
Unified Management• Integration with vRealize Operations
• Monitors large array of OS metrics
• Fed into vRealize Operations Manager for analysis/trending
• Automatically associate OS to VI relationships• Host VM OS
• OOTB OS Alerts & Dashboards• Built on VI and OS metrics
• Simple to follow Recommendations
• Support for wide range of OS’s
• Windows, Linux, UNIX, etc.
Technical Overview
Automatically monitor the health of the underlying OS
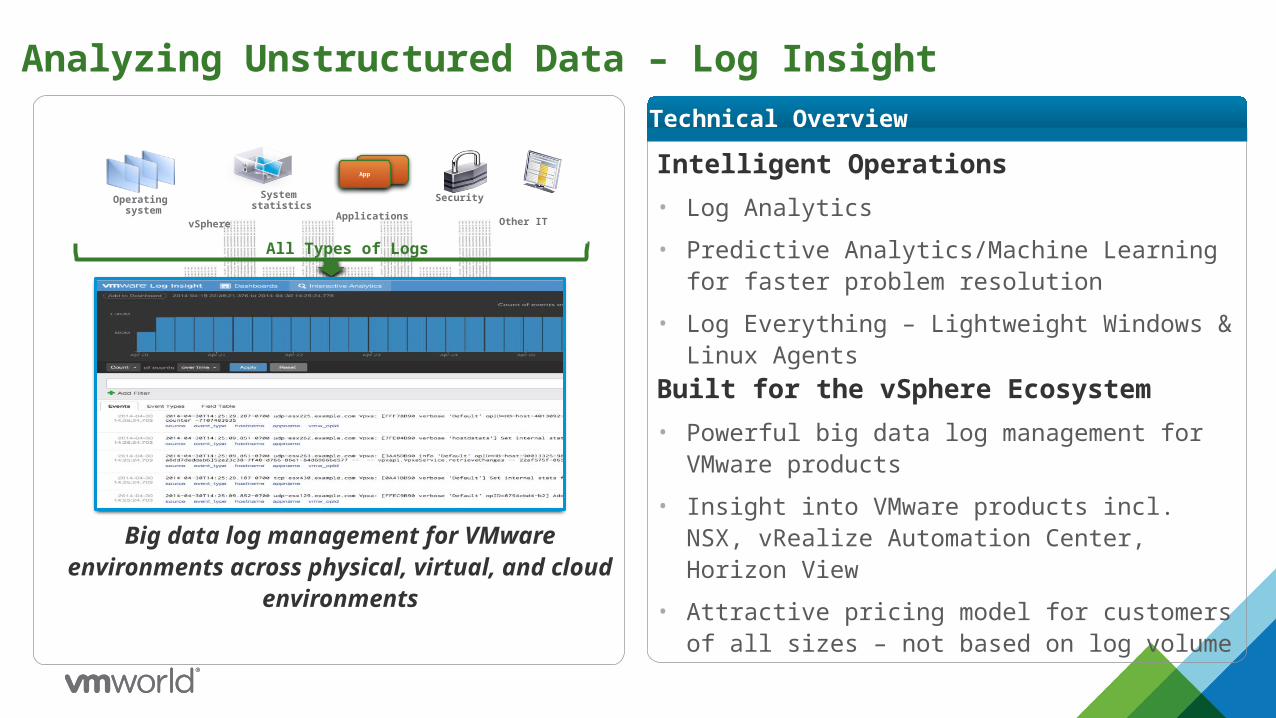
Analyzing Unstructured Data – Log Insight
Intelligent Operations• Log Analytics
• Predictive Analytics/Machine Learning for faster problem resolution
• Log Everything – Lightweight Windows & Linux Agents
Built for the vSphere Ecosystem• Powerful big data log management for VMware
products
• Insight into VMware products incl. NSX, vRealize Automation Center, Horizon View
• Attractive pricing model for customers of all sizes – not based on log volume
Technical Overview
Big data log management for VMware environments across physical, virtual, and cloud
environments
Operating system
vSphere
System statistics
Applications
Security
Other IT
All Types of Logs
Log Insight 2.0
AnalyzeDiscover
SearchVisualize
IT Operations
Security
Compliance
40B events 10 event types…by machine learning
AppApp
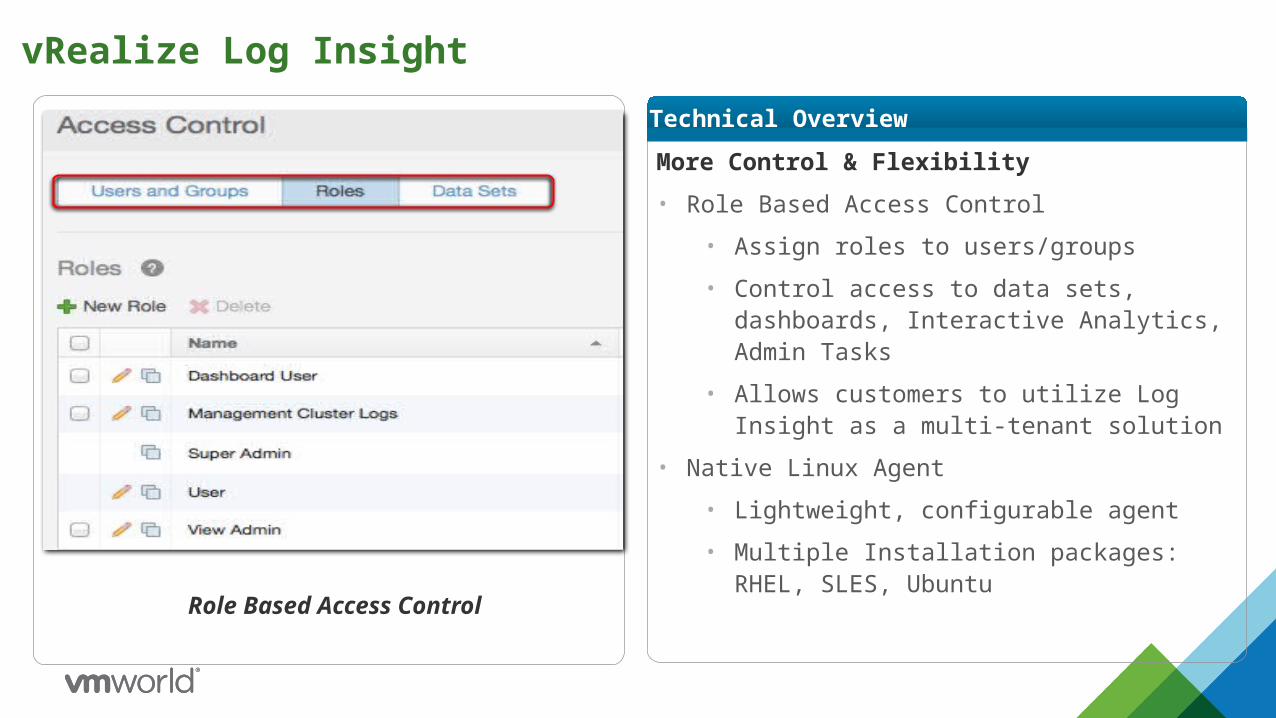
vRealize Log Insight
More Control & Flexibility• Role Based Access Control
• Assign roles to users/groups
• Control access to data sets, dashboards, Interactive Analytics, Admin Tasks
• Allows customers to utilize Log Insight as a multi-tenant solution
• Native Linux Agent
• Lightweight, configurable agent
• Multiple Installation packages: RHEL, SLES, Ubuntu
Technical Overview
Role Based Access Control
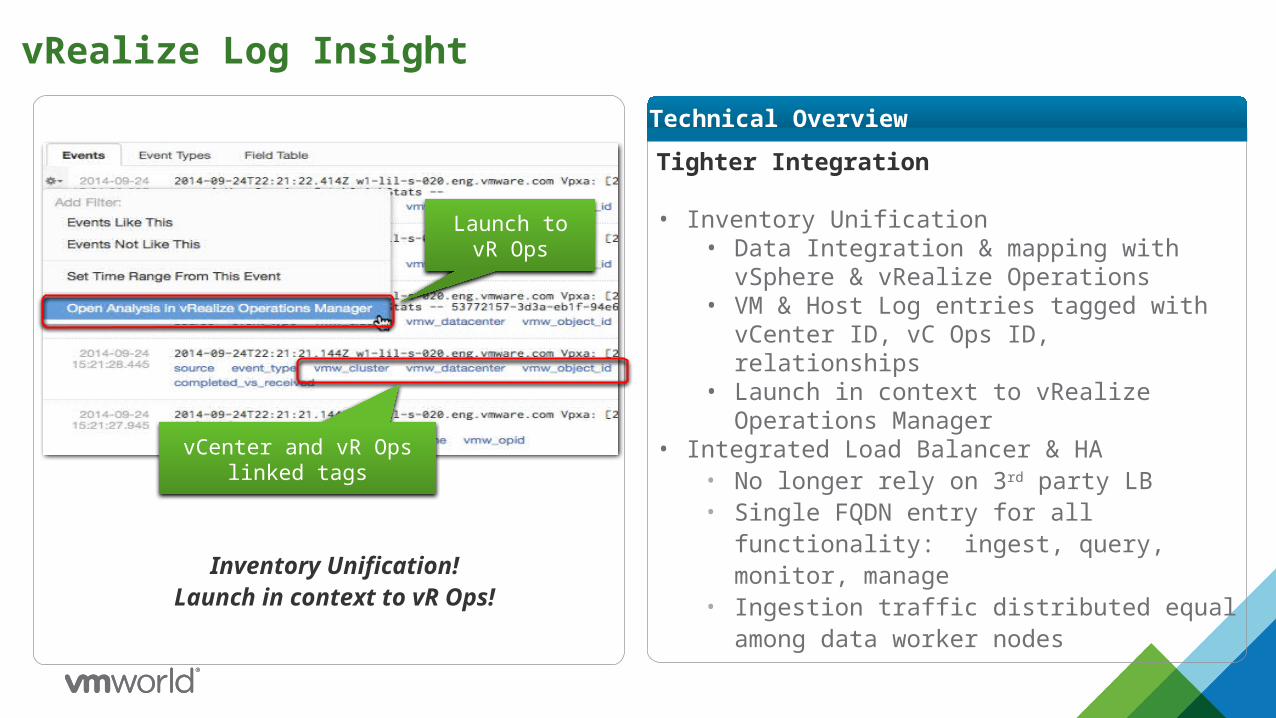
vRealize Log Insight
Tighter Integration
• Inventory Unification• Data Integration & mapping with vSphere &
vRealize Operations• VM & Host Log entries tagged with vCenter ID,
vC Ops ID, relationships• Launch in context to vRealize Operations
Manager • Integrated Load Balancer & HA
• No longer rely on 3rd party LB• Single FQDN entry for all functionality: ingest,
query, monitor, manage• Ingestion traffic distributed equal among data
worker nodes
Technical Overview
Inventory Unification!Launch in context to vR Ops!
Launch to vR Ops
vCenter and vR Ops linked tags
vRealize Log Insight
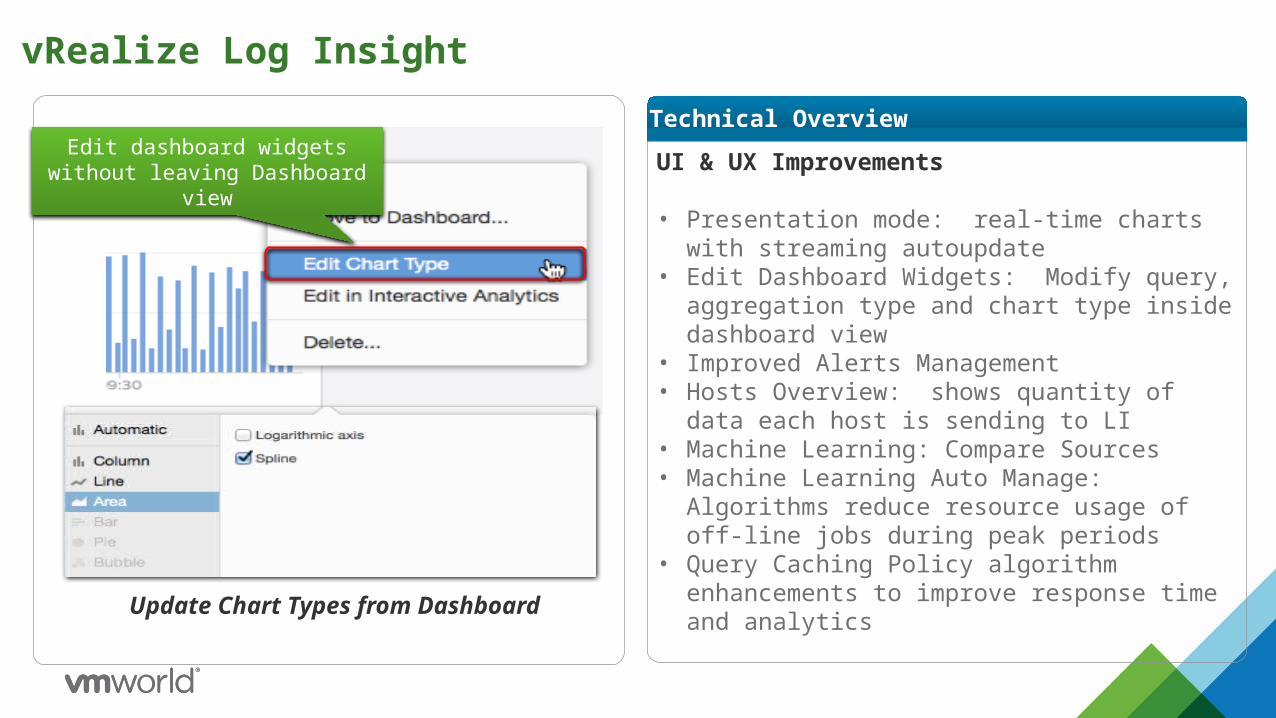
UI & UX Improvements
• Presentation mode: real-time charts with streaming autoupdate
• Edit Dashboard Widgets: Modify query, aggregation type and chart type inside dashboard view
• Improved Alerts Management• Hosts Overview: shows quantity of data each host
is sending to LI• Machine Learning: Compare Sources• Machine Learning Auto Manage: Algorithms reduce
resource usage of off-line jobs during peak periods• Query Caching Policy algorithm enhancements to
improve response time and analytics
Technical Overview
Update Chart Types from Dashboard
Edit dashboard widgets without leaving Dashboard view

vRealize Log Insight Technical Overview
Extensibilty Enhancements
• Integrated Content Pack Marketplace• Enhanced User Experience: search and install
content without leaving vRealize Log Insight UI• Syslog Forwarding to 3rd party
• Customer feature request for DR, SIEM, silos, other use cases
• Internationalization/Localization support
*Integrated* Content Marketplace
Streamlined Content Pack Install from UI

What’s New
vRealize Log Insight for Large Environments• Faster - Each node can ingest two times more data - up to 15,000
events per second.
• Bigger - The number of nodes that can be included in a Log Insight cluster is doubled, from 6 to 12.
• Better - A cluster of twelve nodes can process an astounding 2.4 TB of data per day.
Improved Analytics Engine
Low Touch Administration• Masterless Architecture. for High Availability
• Seamless Rolling Upgrade
More Powerful Agents
Enhanced Charting
vRealize Log Insight 3.0

Demonstration
CONFIDENTIAL 53
Learn More
Try the Hands-on Lab. Nothing to download!
Visit the website for resources, 60-day free trial, and purchasing
information.
#vROI@vRealizeOps@VMLogInsight
vmware.com/go/vROI
vmware.com/go/vRealize-Ops-Insight-HOL
Website:
Hands-on Lab:


vRealize Operations Insight:Manage vSphere and Your Entire Data Center…
All In One Place!Himanshu Singh, Product Line Marketing Manager, VMware
Hicham (he-sham) Mourad, Group Technical Marketing Manager, VMware
MGT5245
#MGT5245