VMA Market Outlook Workshop Omni Parker …...East Asia $1,163 bn 6,832 projects Southeast Asia $659...
22
VMA Market Outlook Workshop Omni Parker House, Boston, MA CONFIDENTIAL - No portion of this presentation may be reproduced without prior written consent. © 2017 Industrial Info Resources, Inc. 1-713-783-5147 Presented By: Industrial Info Resources, Inc. August 3, 2017
Transcript of VMA Market Outlook Workshop Omni Parker …...East Asia $1,163 bn 6,832 projects Southeast Asia $659...

VMA Market Outlook WorkshopOmni Parker House, Boston, MA
CONFIDENTIAL - No portion of this presentation may be reproduced without prior written consent. © 2017 Industrial Info Resources, Inc. 1-713-783-5147
Presented By:
Industrial Info Resources, Inc.
August 3, 2017

Britt BurtVP of Global Research,Power Industry
26 Years Tenure with IIR
Britt Burt leads teams of global researchers responsible for the traditional Power market and Industrial Energy Producers (IEP) in other industries. He is also responsible for a team of researchers that identify planned and unplanned unit outages for energy traders. Prior to joining IIR, Mr. Burt worked for Brown & Root, Zachry Construction and Bay Offshore Limited.
CONFIDENTIAL - No portion of this presentation may be reproduced without prior written consent. © 2017 Industrial Info Resources, Inc. 1-713-783-5147
VMA Market Outlook WorkshopOmni Parker House, Boston, MA
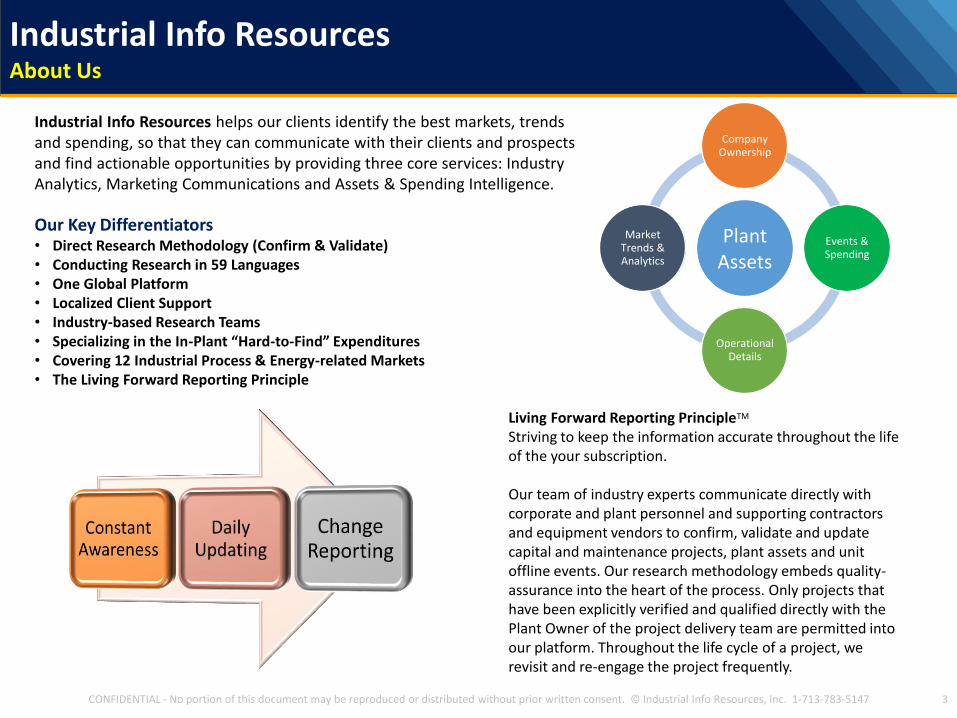
Industrial Info Resources helps our clients identify the best markets, trends and spending, so that they can communicate with their clients and prospects and find actionable opportunities by providing three core services: Industry Analytics, Marketing Communications and Assets & Spending Intelligence.
Our Key Differentiators • Direct Research Methodology (Confirm & Validate)• Conducting Research in 59 Languages • One Global Platform• Localized Client Support• Industry-based Research Teams • Specializing in the In-Plant “Hard-to-Find” Expenditures • Covering 12 Industrial Process & Energy-related Markets• The Living Forward Reporting Principle
3CONFIDENTIAL - No portion of this document may be reproduced or distributed without prior written consent. © Industrial Info Resources, Inc. 1-713-783-5147
PlantAssets
Company Ownership
Events & Spending
Operational Details
Market Trends & Analytics
Living Forward Reporting PrincipleStriving to keep the information accurate throughout the life of the your subscription.
Our team of industry experts communicate directly with corporate and plant personnel and supporting contractors and equipment vendors to confirm, validate and update capital and maintenance projects, plant assets and unit offline events. Our research methodology embeds quality-assurance into the heart of the process. Only projects that have been explicitly verified and qualified directly with the Plant Owner of the project delivery team are permitted into our platform. Throughout the life cycle of a project, we revisit and re-engage the project frequently.
TM
Industrial Info ResourcesAbout Us
Industrial Info ResourcesIndustry Coverage
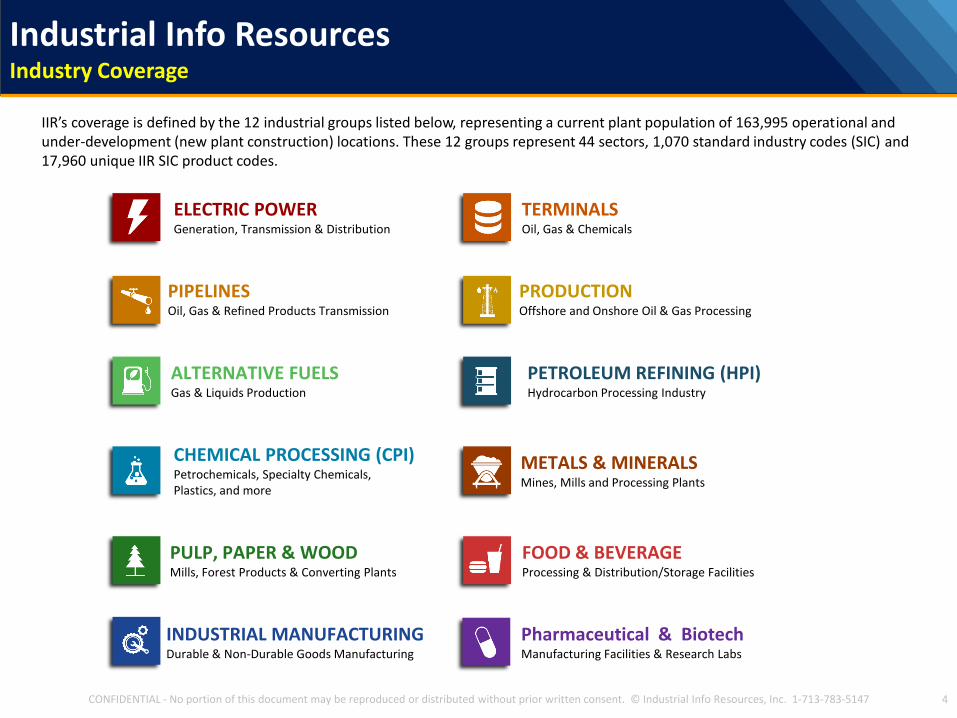
IIR’s coverage is defined by the 12 industrial groups listed below, representing a current plant population of 163,995 operational and under-development (new plant construction) locations. These 12 groups represent 44 sectors, 1,070 standard industry codes (SIC) and 17,960 unique IIR SIC product codes.
4CONFIDENTIAL - No portion of this document may be reproduced or distributed without prior written consent. © Industrial Info Resources, Inc. 1-713-783-5147
ELECTRIC POWERGeneration, Transmission & Distribution
TERMINALSOil, Gas & Chemicals
CHEMICAL PROCESSING (CPI)Petrochemicals, Specialty Chemicals, Plastics, and more
METALS & MINERALSMines, Mills and Processing Plants
PRODUCTION Offshore and Onshore Oil & Gas Processing
PIPELINESOil, Gas & Refined Products Transmission
ALTERNATIVE FUELSGas & Liquids Production
PETROLEUM REFINING (HPI)Hydrocarbon Processing Industry
FOOD & BEVERAGEProcessing & Distribution/Storage Facilities
PULP, PAPER & WOODMills, Forest Products & Converting Plants
INDUSTRIAL MANUFACTURINGDurable & Non-Durable Goods Manufacturing
Pharmaceutical & BiotechManufacturing Facilities & Research Labs
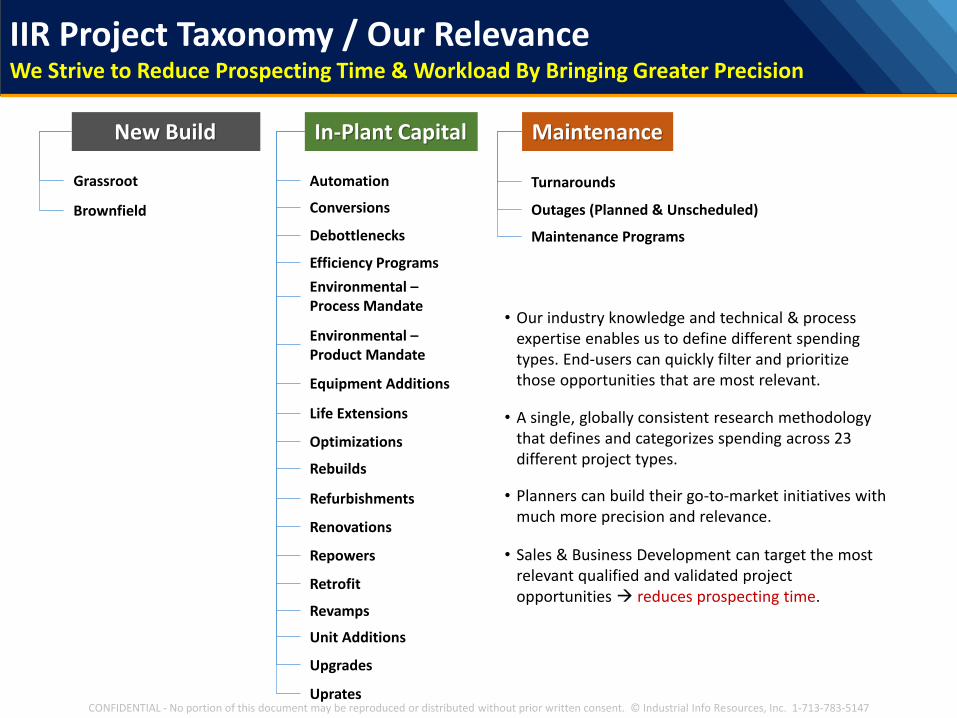
IIR Project Taxonomy / Our RelevanceWe Strive to Reduce Prospecting Time & Workload By Bringing Greater Precision
New Build In-Plant Capital Maintenance
Grassroot
Brownfield
Turnarounds
Outages (Planned & Unscheduled)
Maintenance Programs
• Our industry knowledge and technical & process expertise enables us to define different spending types. End-users can quickly filter and prioritize those opportunities that are most relevant.
• A single, globally consistent research methodology that defines and categorizes spending across 23 different project types.
• Planners can build their go-to-market initiatives with much more precision and relevance.
• Sales & Business Development can target the most relevant qualified and validated project opportunities reduces prospecting time.
Automation
Conversions
Debottlenecks
Efficiency Programs
Environmental –Process Mandate
Environmental –Product Mandate
Equipment Additions
Life Extensions
Optimizations
Rebuilds
Refurbishments
Renovations
Repowers
Retrofit
Revamps
Unit Additions
Uprates
Upgrades
CONFIDENTIAL - No portion of this document may be reproduced or distributed without prior written consent. © Industrial Info Resources, Inc. 1-713-783-5147
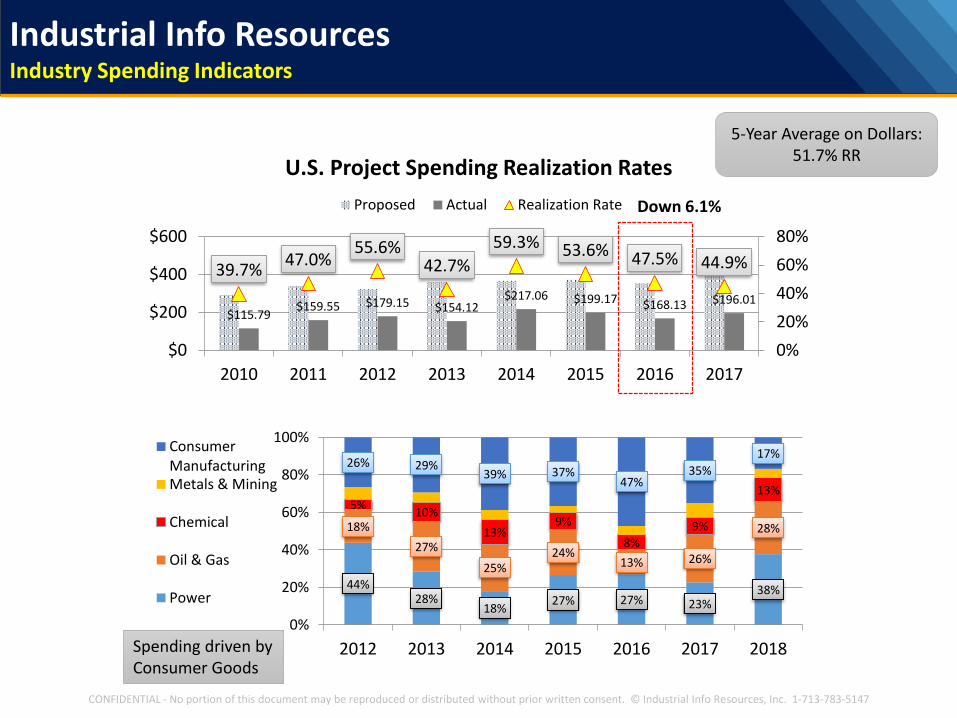
$115.79$159.55 $179.15 $154.12
$217.06 $199.17 $168.13 $196.01
39.7%47.0%
55.6%42.7%
59.3% 53.6% 47.5% 44.9%
0%
20%
40%
60%
80%
$0
$200
$400
$600
2010 2011 2012 2013 2014 2015 2016 2017
U.S. Project Spending Realization Rates
Proposed Actual Realization Rate Down 6.1%
Spending driven byConsumer Goods
5-Year Average on Dollars: 51.7% RR
44%28%
18%27% 27% 23%
38%
18%
27%
25%24%
13% 26%
28%
5%10%
13%9%
8%
9%
13%
26% 29%39% 37%
47%35%
17%
0%
20%
40%
60%
80%
100%
2012 2013 2014 2015 2016 2017 2018
ConsumerManufacturingMetals & Mining
Chemical
Oil & Gas
Power
Industrial Info ResourcesIndustry Spending Indicators
CONFIDENTIAL - No portion of this document may be reproduced or distributed without prior written consent. © Industrial Info Resources, Inc. 1-713-783-5147
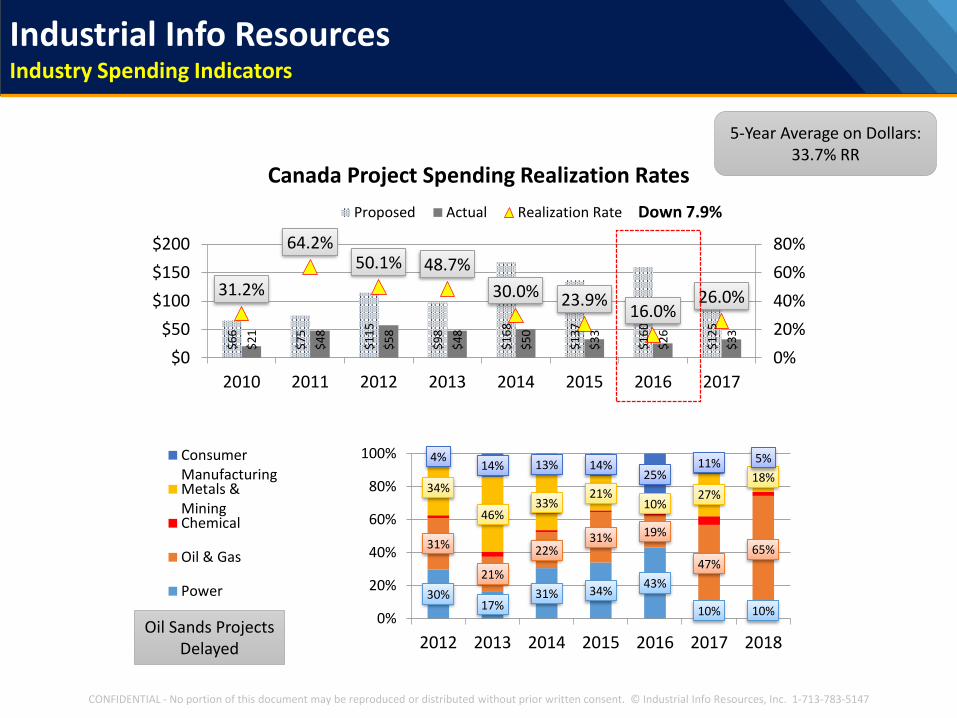
$6
6
$7
5
$1
15
$9
8
$1
68
$1
37
$1
60
$1
25
$2
1
$4
8
$5
8
$4
8
$5
0
$3
3
$2
6
$3
3
31.2%
64.2%50.1% 48.7%
30.0% 23.9%16.0%
26.0%
0%
20%
40%
60%
80%
$0
$50
$100
$150
$200
2010 2011 2012 2013 2014 2015 2016 2017
Canada Project Spending Realization Rates
Proposed Actual Realization Rate Down 7.9%
Oil Sands ProjectsDelayed
5-Year Average on Dollars: 33.7% RR
30%17%
31% 34%43%
10% 10%
31%
21%
22%31% 19%
47%65%
34%
46%33%
21%10%
27%
18%
4%14% 13% 14%
25%11% 5%
0%
20%
40%
60%
80%
100%
2012 2013 2014 2015 2016 2017 2018
ConsumerManufacturingMetals &MiningChemical
Oil & Gas
Power
Industrial Info ResourcesIndustry Spending Indicators
CONFIDENTIAL - No portion of this document may be reproduced or distributed without prior written consent. © Industrial Info Resources, Inc. 1-713-783-5147

Current Active ProjectsPlanning & Engineering Stage only
& MaintenanceStart/Kick-off Date – ALL DATES
Source: IIR PowerProject Database
Global Power Generation Project 24-Month OutlookActive Capital & Maintenance Projects
4,065 Projects - $1,105 trillion Under Construction
N. America
$712 bn4,188
Middle Am
$17.2 bn278
Europe
$945 bn7,126
Oceania
$46.7 bn615 projects
Africa
$405 bn1,645
South America
$322 bn2,949
Global Planned Projects32,558 Active Projects - $5.43 Trillion TIV
Planning & Engineering Stage Construction Starts - ALL DATES
South Asia
$733 bn4,720 projects
Central Asia
$21.3 bn246 projects
Western Asia
$265 bn1,115 projects
East Asia
$1,163 bn6,832 projects
Southeast Asia
$659 bn2,791 projects
Russia
$74 bn816 projects
$5.8bn
$7.7bn
$8.6bn
$13.7bn
$37bn
$49bn
$68bn
$69bn
$82bn
$86.5bn
$92bn
$101bn
$113bn
$368bn
Southern Europe
Middle America
Central Asia
Russia
Eastern Europe
Latin America
Southeast Asia
Western Europe
Africa
Western Asia
North Europe
South Asia
North America
East Asia
Total Active Power Under Construction Projects
All Years
CONFIDENTIAL - No portion of this document may be reproduced or distributed without prior written consent. © Industrial Info Resources, Inc. 1-713-783-5147

Global Power Generation Project Outlook By Fuel TypeStart Date 2017-2018
0% 20% 40% 60% 80% 100%
Middle America
Russia
Oceania
Central Asia
Western Asia
North America
South America + MX
Africa
Southeast Asia
Europe
South Asia
East Asia
Next 2 Years Project Spending By Fuel TypeStart Dates 2017-2018
Grassroot, Unit Additions, Other In-plant Capital & Maintenance
Coal Natural Gas Fuel Oil
Nuclear Hydro Solar
Wind Other Renewables
$14.3bn
$26.3bn
$39bn
$39.2bn
$183.5bn
$218.8bn
$223.4bn
$235bn
$284bn
$316bn
$489bn
$800bn
Market Region Total2017-18
CONFIDENTIAL - No portion of this document may be reproduced or distributed without prior written consent. © Industrial Info Resources, Inc. 1-713-783-5147

• Natural gas the dominant fuel for electricity generation.
• Multiple drivers, including federal tax credits, are driving growth in renewables.
• Future generation mix will be defined by natural gas prices and electricity.
North American Power Industry OutlookGeneration, Transmission & Distribution
CONFIDENTIAL - No portion of this document may be reproduced or distributed without prior written consent. © Industrial Info Resources, Inc. 1-713-783-5147
• Challenging business climate for nuclear sector.
• Environmental regulations continue to target coal-fired power plants.
• In-plant capital and maintenance for aging fleet.
• Ongoing investment for transmission and distribution.
North American Power Industry OutlookGeneration, Transmission & Distribution
CONFIDENTIAL - No portion of this document may be reproduced or distributed without prior written consent. © Industrial Info Resources, Inc. 1-713-783-5147

0
5,000
10,000
15,000
20,000
25,000
20
12
20
13
20
14
20
15
20
16
20
17
20
18
20
19
20
20
20
21
20
22
Coal, Nuclear, Gas & Oil
Coal Nuclear Natural Gas Fuel Oil
Tota
l Meg
awat
ts
• Over 85 Gigawatts retired since 2012
• 67 Gigawatts 2017-2022
North American (USA & Canada) Power IndustryUnit Closures from 2012-2022
CONFIDENTIAL - No portion of this document may be reproduced or distributed without prior written consent. © Industrial Info Resources, Inc. 1-713-783-5147
0
5,000
10,000
15,000
20,000
25,000
30,000
35,000
Unit Closure by Region & Fuel
Coal Nuclear Natural Gas Fuel Oil

2012 2013 2014 2015 2016 2017 *2018 *2019
Landfill 174 121 56 3 54 34 58 46
Biomass 292 658 282 73 73 197 191 192
Coal 3,668 1,530 160 0 0 35 0 0
Fuel Oil 254 165 15 281 39 68 12 76
Geothermal 148 104 15 30 70 0 39 33
Hydro 1,285 1,639 2,190 2,226 872 1,800 1,906 1,399
Natural Gas 11,296 7,795 9,729 6,728 8,757 13,383 18,599 11,728
Nuclear 0 0 0 0 1,150 0 0 0
Solar 693 2,483 2,561 3,550 5,629 3,865 6,809 8,566
Wind 14,164 2,687 5,904 10,455 9,215 7,714 13,343 28,040
0
10,000
20,000
30,000
40,000
50,000
60,000
31,974 17,182 20,912 23,346 25,859 27,096 40,957 50,080
Tota
l Meg
awat
tsNorth American Power Industry (USA & Canada)Unit Startups by Energy Source (2012 – 2019 Total MW)
CONFIDENTIAL - No portion of this document may be reproduced or distributed without prior written consent. © Industrial Info Resources, Inc. 1-713-783-5147

2012 2013 2014 2015 2016 *2017* *2018* 2019
Landfill 89 50 49 52 0 3 33 0
Biomass 403 80 181 42 65 331 154 66
Coal/ Pet Coke 160 0 0 0 35 240 0 0
Fuel Oil 116 38 134 34 45 213 72 42
Geothermal 41 30 30 0 70 63 91 266
Hydro 1,825 1,008 2,472 88 1,692 893 2,372 4,374
Natural Gas 8,717 7,423 13,770 16,985 11,839 12,822 18,503 17,871
Nuclear 4,451 0 0 0 0 0 0 0
Solar 2,041 2,259 3,202 4,102 3,619 5,996 11,781 4,707
Wind 6,336 7,646 5,868 9,132 8,886 9,490 16,908 21,459
0
10,000
20,000
30,000
40,000
50,000
60,000
Tota
l Meg
awat
ts
24,179 18,534 25,706 30,435 26,437 30,051 49,914 48,785
North American Power Industry (USA & Canada)Unit Construction Start by Energy Source (2012 – 2019 Total MW)
CONFIDENTIAL - No portion of this document may be reproduced or distributed without prior written consent. © Industrial Info Resources, Inc. 1-713-783-5147
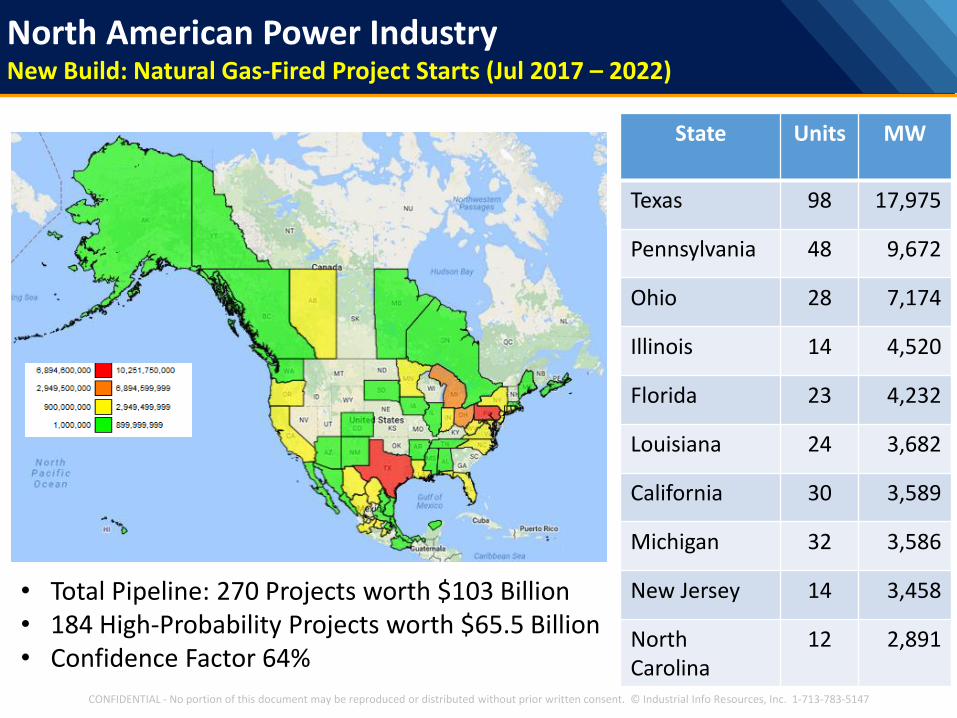
State Units MW
Texas 98 17,975
Pennsylvania 48 9,672
Ohio 28 7,174
Illinois 14 4,520
Florida 23 4,232
Louisiana 24 3,682
California 30 3,589
Michigan 32 3,586
New Jersey 14 3,458
NorthCarolina
12 2,891
• Total Pipeline: 270 Projects worth $103 Billion• 184 High-Probability Projects worth $65.5 Billion• Confidence Factor 64%
North American Power IndustryNew Build: Natural Gas-Fired Project Starts (Jul 2017 – 2022)
CONFIDENTIAL - No portion of this document may be reproduced or distributed without prior written consent. © Industrial Info Resources, Inc. 1-713-783-5147
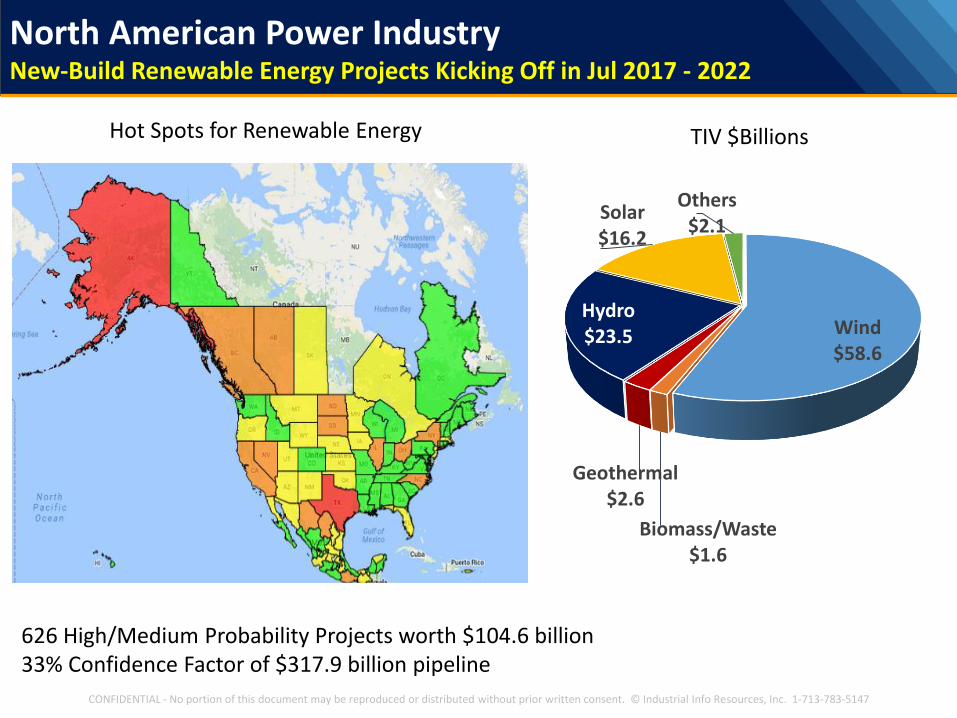
North American Power IndustryNew-Build Renewable Energy Projects Kicking Off in Jul 2017 - 2022
CONFIDENTIAL - No portion of this document may be reproduced or distributed without prior written consent. © Industrial Info Resources, Inc. 1-713-783-5147
Wind $58.6
Biomass/Waste$1.6
Geothermal $2.6
Hydro$23.5
Solar$16.2
Others$2.1
TIV $BillionsHot Spots for Renewable Energy
626 High/Medium Probability Projects worth $104.6 billion33% Confidence Factor of $317.9 billion pipeline

327 High-Probability Projects worth $25.9 Billion70%+ Confidence factor of $38.3 Billion Pipeline
North American Power IndustryIn-Plant Capital Projects – Construction Start 2017 - 2022
Market Region Environmental Modernization Repower Closure Other In-Plant Capital
West Coast $41 $54 $3,261 $1,423 $2,096
Ontario $600 $8,413 $2,418
Great Lakes $2,296 $150 $669 $239 $1,202
Southeast $1,974 $612 $228 $49 $737
Rocky Mountains $1,714 $25 $15 $72 $1,049
Midwest $1,300 $520 $104 $154
Western Canada $980 $430 $30 $708
Southwest $376 $3 $37 $2 $353
Mid Atlantic $674 $60 $25 $200 $275
Northeast $143 $252 $32 $640
New England $344 $1,260 $93
Atlantic Canada $38
Total $10,442 $10,267 $4,517 $3,381 $9,763
TIV $ Millions
CONFIDENTIAL - No portion of this presentation may be reproduced without prior written consent. © 2017 Industrial Info Resources, Inc. 1-713-783-5147
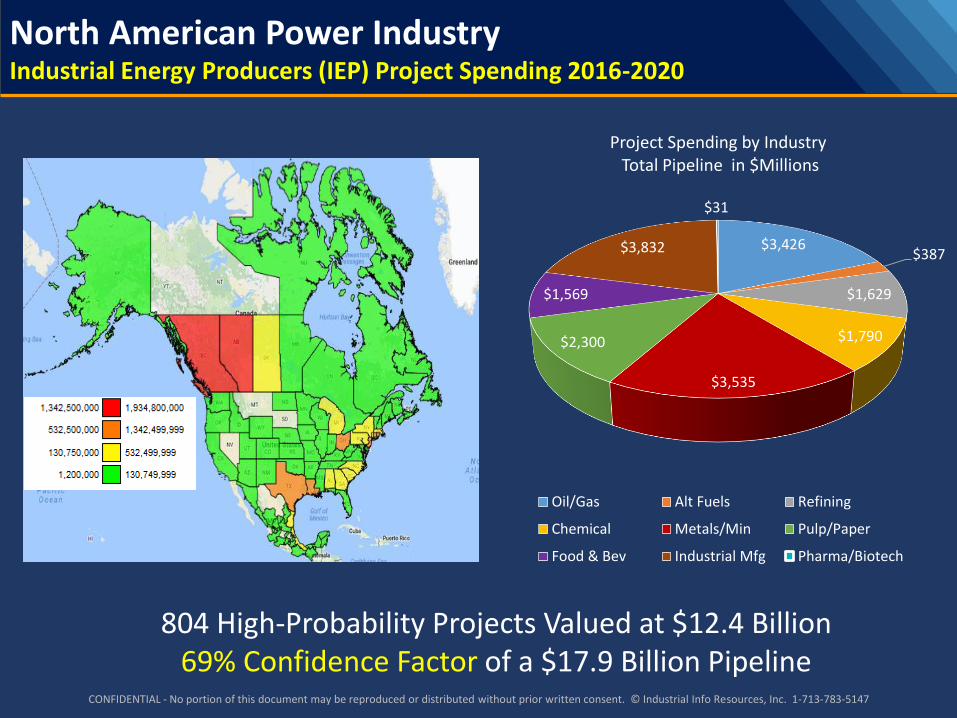
$3,426$387
$1,629
$1,790
$3,535
$2,300
$1,569
$3,832
$31
Project Spending by IndustryTotal Pipeline in $Millions
Oil/Gas Alt Fuels Refining
Chemical Metals/Min Pulp/Paper
Food & Bev Industrial Mfg Pharma/Biotech
804 High-Probability Projects Valued at $12.4 Billion69% Confidence Factor of a $17.9 Billion Pipeline
North American Power IndustryIndustrial Energy Producers (IEP) Project Spending 2016-2020
CONFIDENTIAL - No portion of this document may be reproduced or distributed without prior written consent. © Industrial Info Resources, Inc. 1-713-783-5147

$2.9$3.2
$4.2
$3.5$3.6
$3.2
0
100
200
300
400
500
600
700
800
$0.0
$0.5
$1.0
$1.5
$2.0
$2.5
$3.0
$3.5
$4.0
$4.5
2013 2014 2015 2016 2017 2018
Scheduled Outages
TIV Project Count
504 516 513323
147
466633 557
696
315
325
490 500 572
180
0
2
4
6
8
10
12
14
0
500
1,000
1,500
2,000
2013 2014 2015 2016 2017
Coal NuclearNatural Gas RenewablesFuel Oil
Unplanned Outages
$ B
illio
ns
Pro
ject
Co
un
t
Tota
l Ou
tage
s
Avg
Day
s O
fflin
e
• Maintenance activity for scheduled outages trending upward for 2017
• Extended maintenance cycles and deferred outages becoming more common
US Power IndustryScheduled and Unplanned Outage Activity
CONFIDENTIAL - No portion of this document may be reproduced or distributed without prior written consent. © Industrial Info Resources, Inc. 1-713-783-5147
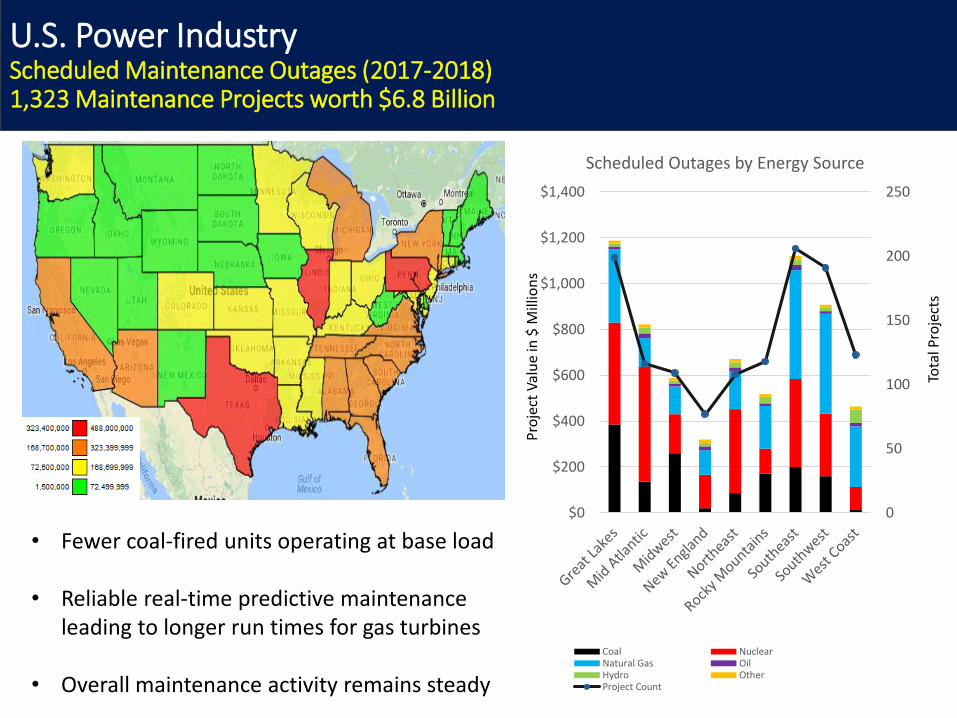
U.S. Power IndustryScheduled Maintenance Outages (2017-2018)1,323 Maintenance Projects worth $6.8 Billion
0
50
100
150
200
250
$0
$200
$400
$600
$800
$1,000
$1,200
$1,400
Scheduled Outages by Energy Source
Coal NuclearNatural Gas OilHydro OtherProject Count
Pro
ject
Val
ue
in $
Mill
ion
s
Tota
l Pro
ject
s
• Fewer coal-fired units operating at base load
• Reliable real-time predictive maintenance leading to longer run times for gas turbines
• Overall maintenance activity remains steady

• Industrial, Commercial, Educational Institutions and Government entities are expanding micro-grid capabilities.
• Healthy outlook for energy storage technologies.
• Development of distributed generation continues to increase.
• More development of combined heat and power sources on the horizon.
• Grid operators and generation companies alike continue with cybersecurity programs.
• Development of small modular reactors proceeds for future beyond 2020.
North American Power IndustryOngoing and Emerging Trends
CONFIDENTIAL - No portion of this document may be reproduced or distributed without prior written consent. © Industrial Info Resources, Inc. 1-713-783-5147

• Transformation of the power industry continues.
• New-build generation continues to be led by natural gas-fired power plants and renewable energy sources.
• Investment in the coal and nuclear sectors continues to be centered around in-plant capital and maintenance.
• More project spending directed toward environmental regulations.
• Emerging trends continue to open new doors.
North American Power IndustryOutlook Conclusions
CONFIDENTIAL - No portion of this document may be reproduced or distributed without prior written consent. © Industrial Info Resources, Inc. 1-713-783-5147