


VIZBI 2015 Tutorial: Cytoscape, IPython, Docker, and Reproducible Network Data Visualization...
178
VIZBI 2015 Tutorial Session 3/24/2015 @Broad Institute Keiichiro Ono UCSD Trey Ideker Lab Cytoscape Core Team Cytoscape, IPython, Docker, and Reproducible Network Data Visualization Workflows
-
Upload
keiichiro-ono -
Category
Data & Analytics
-
view
885 -
download
1
Transcript of VIZBI 2015 Tutorial: Cytoscape, IPython, Docker, and Reproducible Network Data Visualization...

VIZBI 2015 Tutorial Session 3/24/2015 @Broad Institute
Keiichiro Ono UCSD Trey Ideker Lab Cytoscape Core Team
Cytoscape, IPython, Docker, and Reproducible Network Data Visualization Workflows

Thanks for Attending!
You will learn a lot today….
REST

Who am I?

Keiichiro Ono
BackgroundBioinformatics
Computer ScienceWork
ResearchBioinformatics workflow
Visualization pipeline
Data
VisualizationNetworks
Other Biological Data
Integration
Molecular Interactions
Pathways
Annotations
Software Development
CytoscapeNeXO
Cyberinfrastructure
All kinds of small tools
Like
ArtKandinsky
Mondrian
Music
Electronica
TechnoMinimal
Detroit
Jazz
Sci-fiMovie
Novel
Life
US
San DiegoSan Francisco Bay Area
Los Angeles
Orange County
JapanGifu
Tokyo

Computer Science Biology

Agenda
Cytoscape, IPython, Docker, and Reproducible Workflow
Overview of Cytoscape 3.2

Cytoscape, IPython, Docker, and Reproducible Workflow
Overview of Cytoscape 3.2

Overview of Cytoscape 3.2

Quick Introduction to Cytoscape

What is Cytoscape?

An Open Source Platform for Biological Network Data Integration, Analysis and Visualization
Cytoscape

Cytoscape- Open Source (LGPL)
- Free for both commercial and academic use - Developed and maintained by universities, companies, and research institutions
- De-facto standard software in biological network research community
- Expandable by Apps

Is it really a de-facto standard?


Basic Workflow
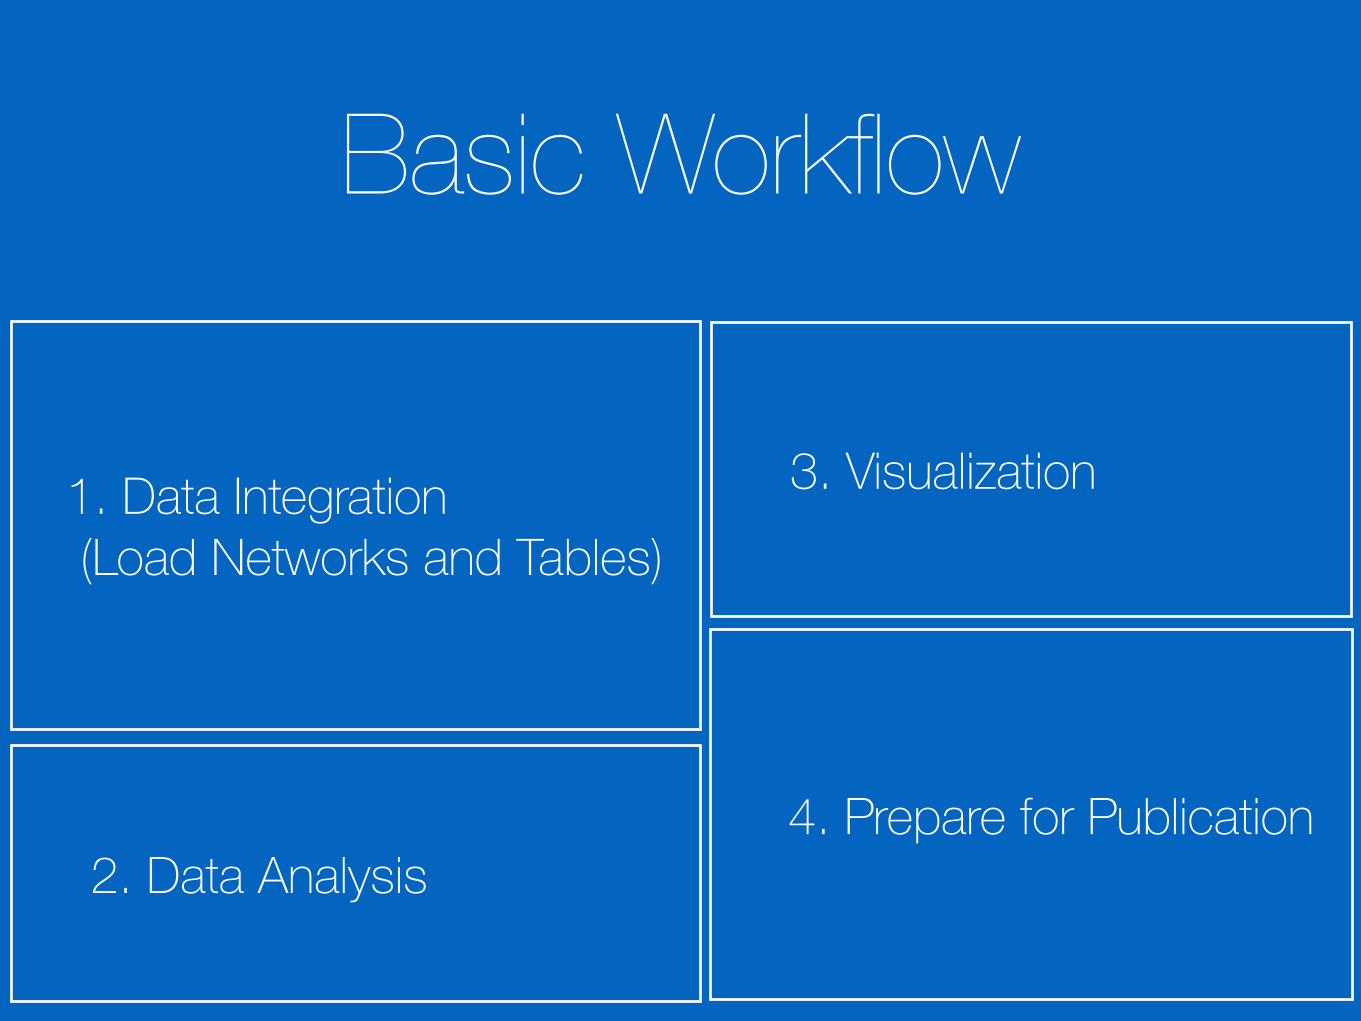
1. Data Integration (Load Networks and Tables)
2. Data Analysis
3. Visualization
Basic Workflow
4. Prepare for Publication

Network Data
Annotated Networks
Attributes
Analyzed Data

Real World Use Cases
http://cytoscape-publications.tumblr.com/
Introduction to v3.2
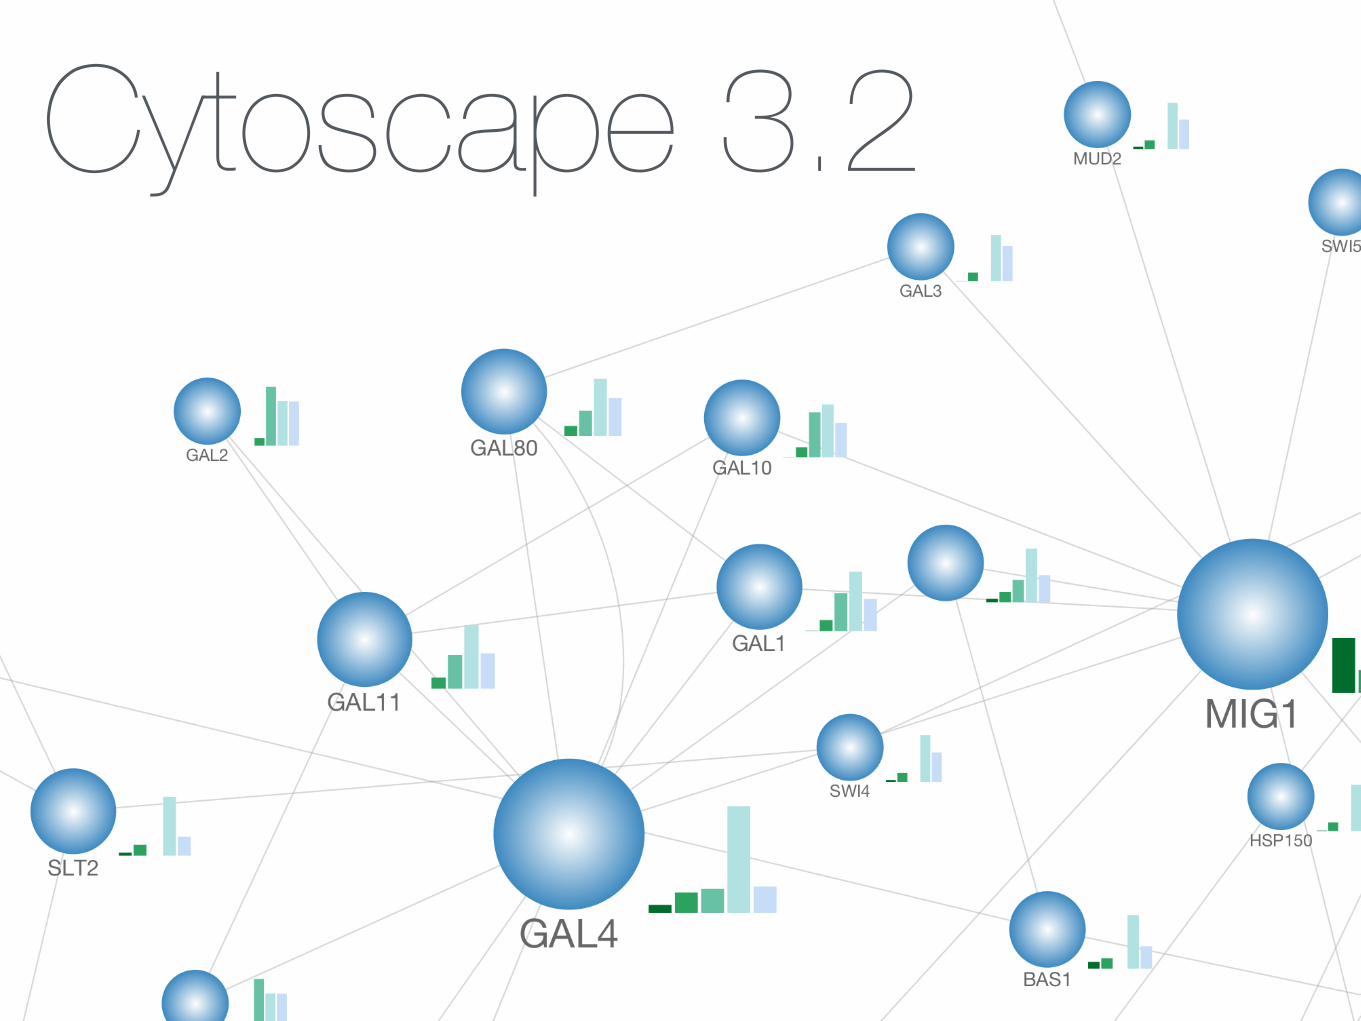
Cytoscape 3.2

Cytoscape 3.2
- New Features:
- Export as Web Application
- Chart Editor
- Performance Improvements
- Lots of bug fixes

Export as Web Application
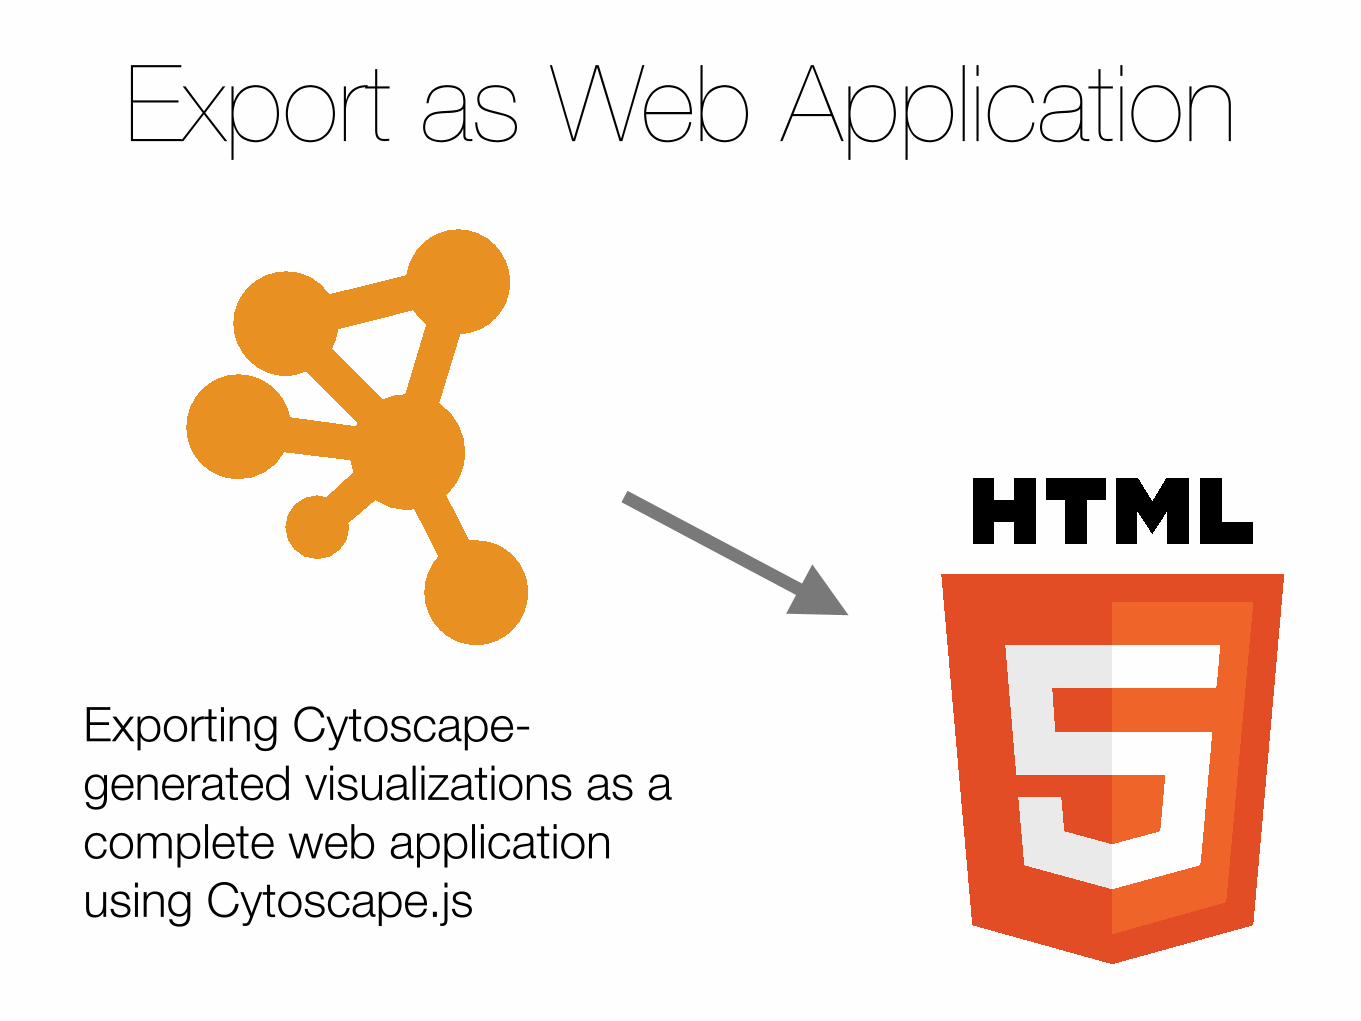
Export as Web Application
Exporting Cytoscape-generated visualizations as a complete web application using Cytoscape.js

Cytoscape.js?


Exercise: Export as Web Application

Export View As Web App- Open Cytoscape
- Load a sample network (Small ones)
- Apply layout
- File → Export → Network Views as Web Page…
- Open in browser
- python -m SimpleHTTPServer 8000

Chart Editor

Chart Editor

Chart Editor- Visualize multiple data points
to a single view
- Time series data
- Multiple GO terms
- Chart types: Bar, Box, Pie, Heat Map, Ring
- Part of standard Visual Style Editor
- Everything will be saved into session files

Gradient Editor

Exercise: Create a Simple Chart
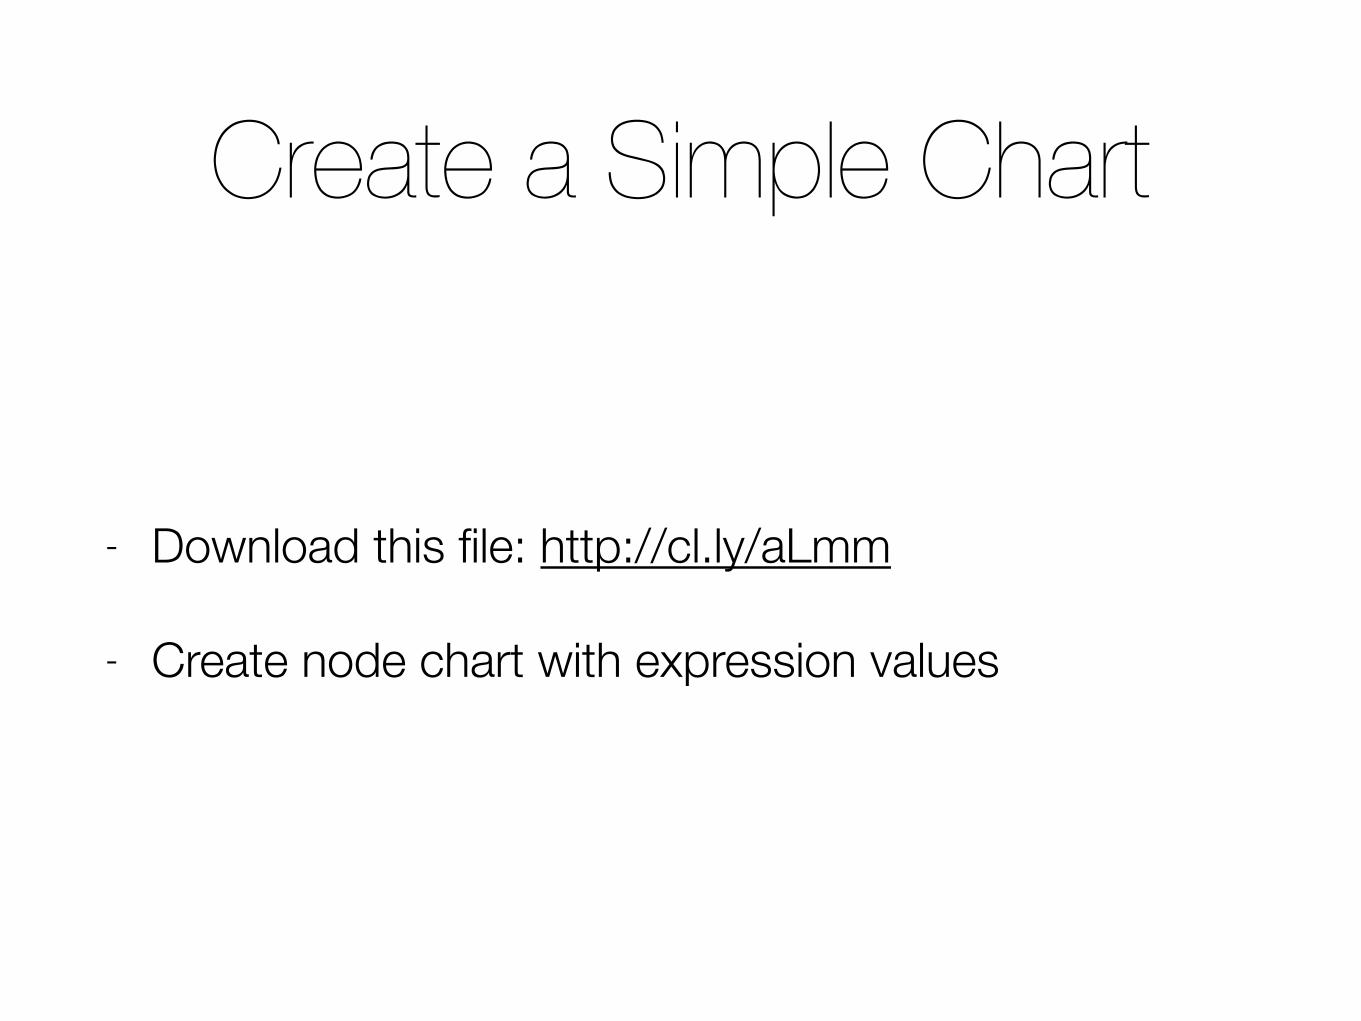
Create a Simple Chart
- Download this file: http://cl.ly/aLmm
- Create node chart with expression values


Part I Summary- Cytoscape 3.2 includes new features for advanced
network visualization
- More integration to Cytoscape.js
- Build prototype web-based visualization in Cytoscape
- v3.3
- Not finalized yet… Feature preview in summer

Cytoscape, IPython, Docker, and Reproducible Workflow
Overview of Cytoscape 3.2

Cytoscape, IPython, Docker, and Reproducible Workflow

Background

Illumina HiSeqX (http://systems.illumina.com/content/dam/illumina-marketing/documents/products/datasheets/datasheet-hiseq-x-ten.pdf)

Biology = Data-Driven Science
Problems in Bioinformatics- No more free lunch
- Even if you buy expensive machines, you cannot get free performance gain anymore. You have to design your code for massively distributed environment. (From Scale-up to Scale-out)
- Complex Data Analysis Pipeline
- Need to build pipeline by connecting multiple resources, or services
- Needs for complex, customized data visualization
- Reproducibility
➡ But building, deploying, and maintaining reproducible pipeline is not straight-forward

Goal: Reproducible Science
>gi|10313991|ref|NC_002549.1| Zaire ebolavirus isolate Ebola virus/H.sapiens-tc/COD/1976/Yambuku-Mayinga, complete genome CGGACACACAAAAAGAAAGAAGAATTTTTAGGATCTTTTGTGTGCGAATAACTATGAGGAAGATTAATAA TTTTCCTCTCATTGAAATTTATATCGGAATTTAAATTGAAATTGTTACTGTAATCACACCTGGTTTGTTT CAGAGCCACATCACAAAGATAGAGAACAACCTAGGTCTCCGAAGGGAGCAAGGGCATCAGTGTGCTCAGT TGAAAATCCCTTGTCAACACCTAGGTCTTATCACATCACAAGTTCCACCTCAGACTCTGCAGGGTGATCC AACAACCTTAATAGAAACATTATTGTTAAAGGACAGCATTAGTTCACAGTCAAACAAGCAAGATTGAGAA TTAACCTTGGTTTTGAACTTGAACACTTAGGGGATTGAAGATTCAACAACCCTAAAGCTTGGGGTAAAAC ATTGGAAATAGTTAAAAGACAAATTGCTCGGAATCACAAAATTCCGAGTATGGATTCTCGTCCTCAGAAA ATCTGGATGGCGCCGAGTCTCACTGAATCTGACATGGATTACCACAAGATCTTGACAGCAGGTCTGTCCG TTCAACAGGGGATTGTTCGGCAAAGAGTCATCCCAGTGTATCAAGTAAACAATCTTGAAGAAATTTGCCA ACTTATCATACAGGCCTTTGAAGCAGGTGTTGATTTTCAAGAGAGTGCGGACAGTTTCCTTCTCATGCTT TGTCTTCATCATGCGTACCAGGGAGATTACAAACTTTTCTTGGAAAGTGGCGCAGTCAAGTATTTGGAAG GGCACGGGTTCCGTTTTGAAGTCAAGAAGCGTGATGGAGTGAAGCGCCTTGAGGAATTGCTGCCAGCAGT ATCTAGTGGAAAAAACATTAAGAGAACACTTGCTGCCATGCCGGAAGAGGAGACAACTGAAGCTAATGCC GGTCAGTTTCTCTCCTTTGCAAGTCTATTCCTTCCGAAATTGGTAGTAGGAGAAAAGGCTTGCCTTGAGA AGGTTCAAAGGCAAATTCAAGTACATGCAGAGCAAGGACTGATACAATATCCAACAGCTTGGCAATCAGT AGGACACATGATGGTGATTTTCCGTTTGATGCGAACAAATTTTCTGATCAAATTTCTCCTAATACACCAA GGGATGCACATGGTTGCCGGGCATGATGCCAACGATGCTGTGATTTCAAATTCAGTGGCTCAAGCTCGTT TTTCAGGCTTATTGATTGTCAAAACAGTACTTGATCATATCCTACAAAAGACAGAACGAGGAGTTCGTCT CCATCCTCTTGCAAGGACCGCCAAGGTAAAAAATGAGGTGAACTCCTTTAAGGCTGCACTCAGCTCCCTG GCCAAGCATGGAGAGTATGCTCCTTTCGCCCGACTTTTGAACCTTTCTGGAGTAAATAATCTTGAGCATG GTCTTTTCCCTCAACTATCGGCAATTGCACTCGGAGTCGCCACAGCACACGGGAGTACCCTCGCAGGAGT AAATGTTGGAGAACAGTATCAACAACTCAGAGAGGCTGCCACTGAGGCTGAGAAGCAACTCCAACAATAT GCAGAGTCTCGCGAACTTGACCATCTTGGACTTGATGATCAGGAAAAGAAAATTCTTATGAACTTCCATC AGAAAAAGAACGAAATCAGCTTCCAGCAAACAAACGCTATGGTAACTCTAAGAAAAGAGCGCCTGGCCAA

Goal: Reproducible Science
REST

Why Reproducibility is Important?
- Saving your time
- Reusability
- Make your sponsors (funding agencies) happy
We (the NIH) Are Working On, But As Yet Do Not Have Good Answers To:
1. Today, how much are we actually spending on data and software related activities?
2. How much should we be spending to achieve the maximum benefit to biomedical science relative to what we spend in other areas?
Biomedical Research as an Open Digital Enterprise by Philip E. Bourne Ph.D.Associate Director for Data Science (NIH)

Reproducibility
! Most of the 27 Institutes and Centers of the NIH are currently reviewing the ability to reproduce research they are funding
! The NIH recently convened a meeting with publishers to discuss the issue – a set of guiding principles arose
Biomedical Research as an Open Digital Enterprise by Philip E. Bourne Ph.D.Associate Director for Data Science (NIH)

Reproducible or Lose your Funding
(maybe)

Overview of Modern Computing Resources

Modern Computing= Stratum
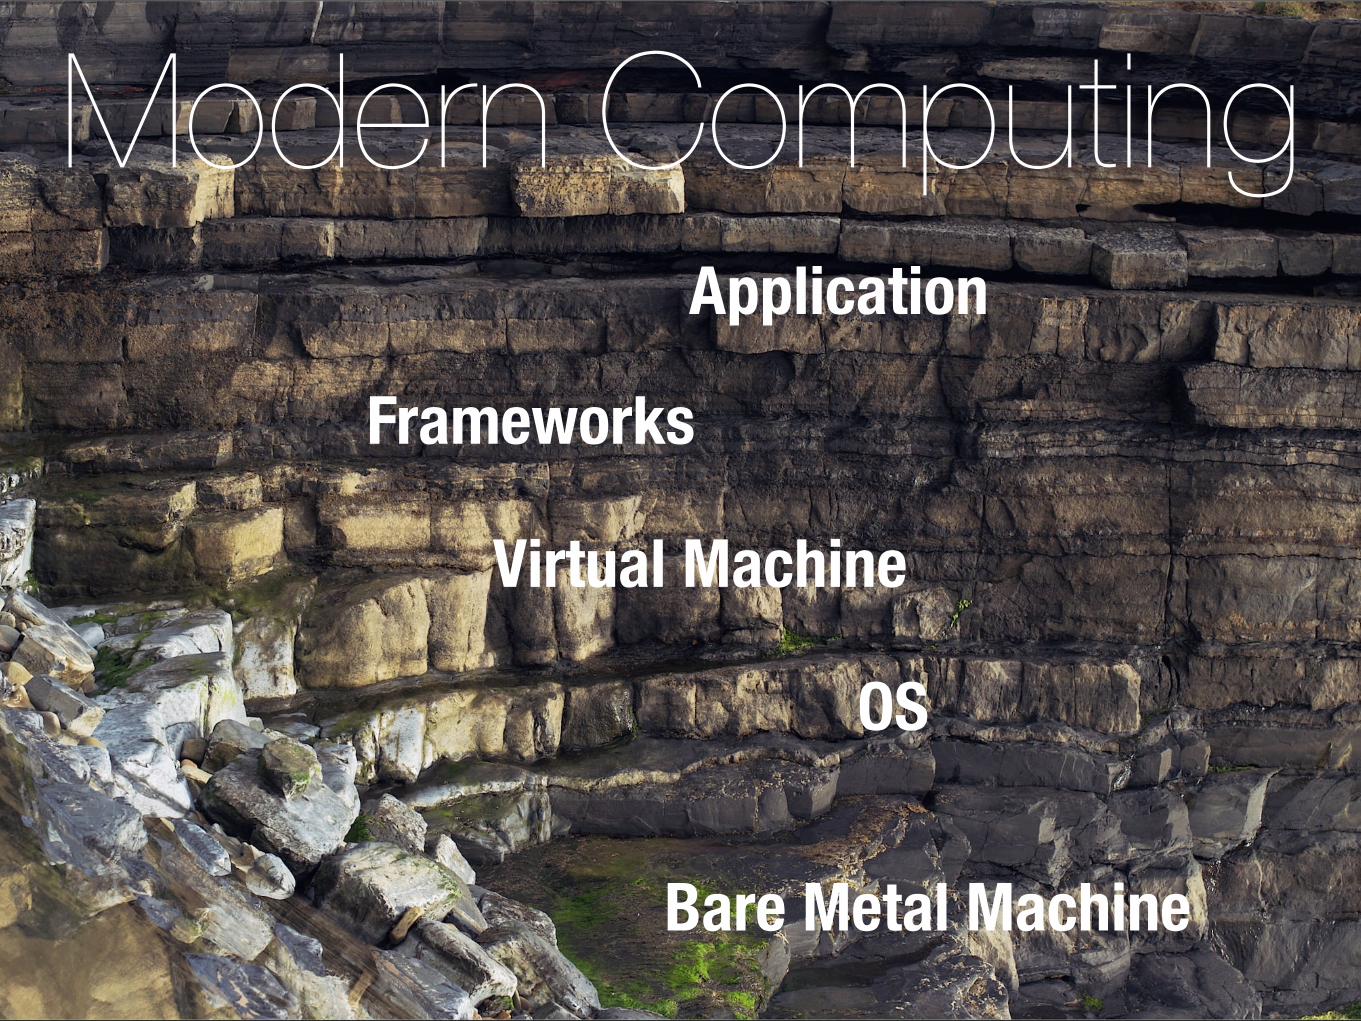
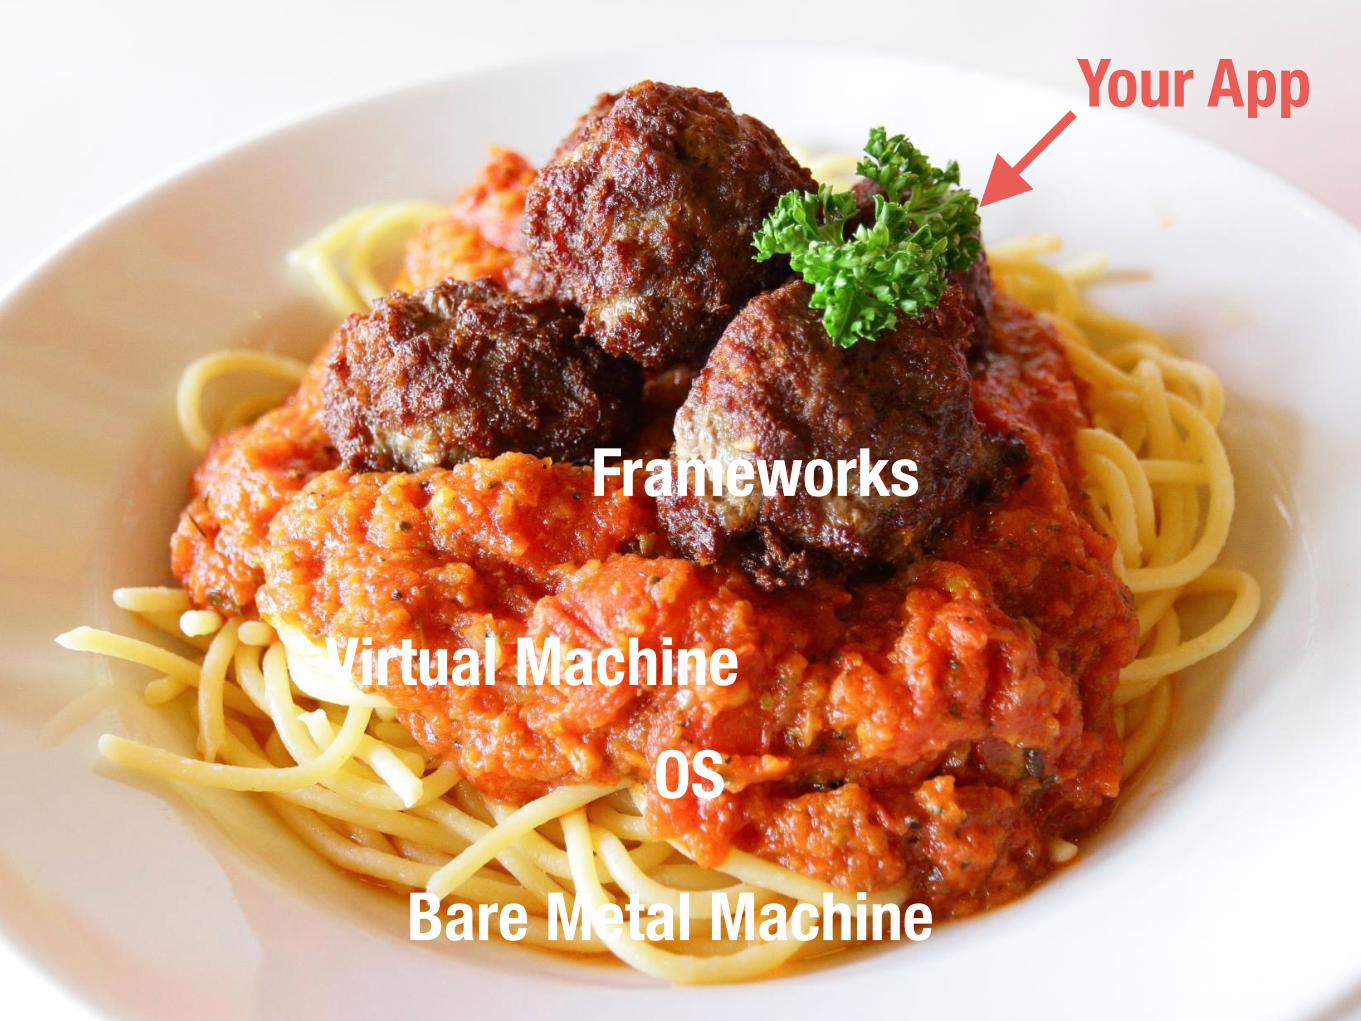
Modern Computing
Bare Metal Machine
OS
Virtual Machine
Frameworks
Application

Bare Metal Machine
OSVirtual Machine
Frameworks
Your App

Problems- Complex Dependency
- OS-dependent code
- Network of dependencies to run popular library X
- Library version numbers
- It-worked-on-my-machine syndrome
- Installation Hell

Software Distribution Problem
- “It-worked-on-my-machine” syndrome
- This is a serious problem especially when you want to share your workflow with collaborators.


Setting up Software is not Trivial Anymore…

Basic Workflow of Data Visualization

Data Preparation Analysis Visualization
Data Preparation
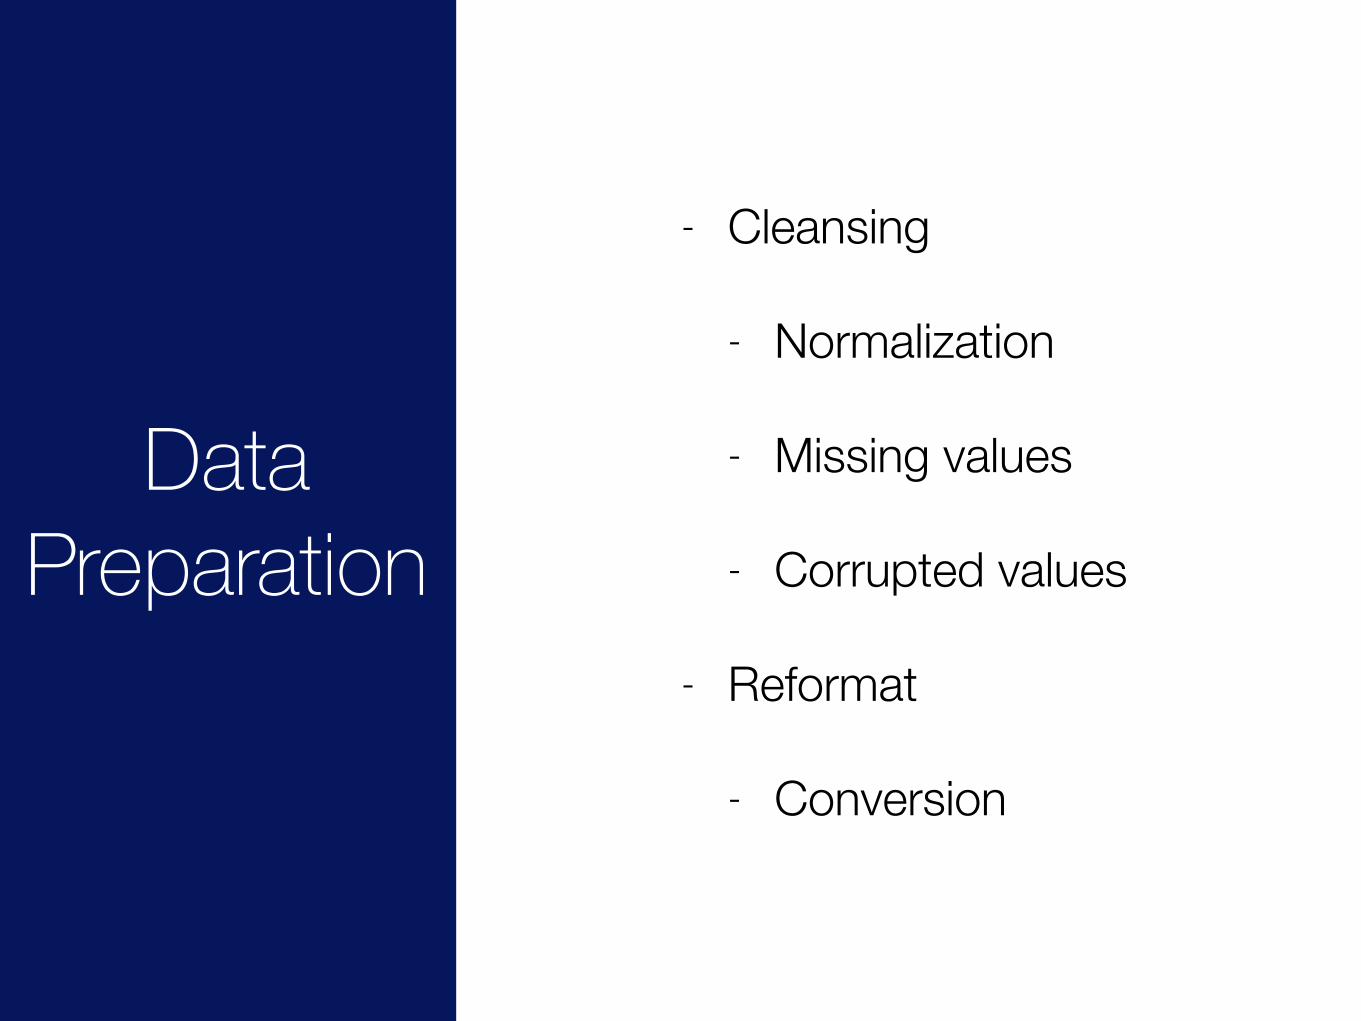
Data Preparation
- Cleansing
- Normalization
- Missing values
- Corrupted values
- Reformat
- Conversion

Data Preparation Analysis Visualization
Analysis
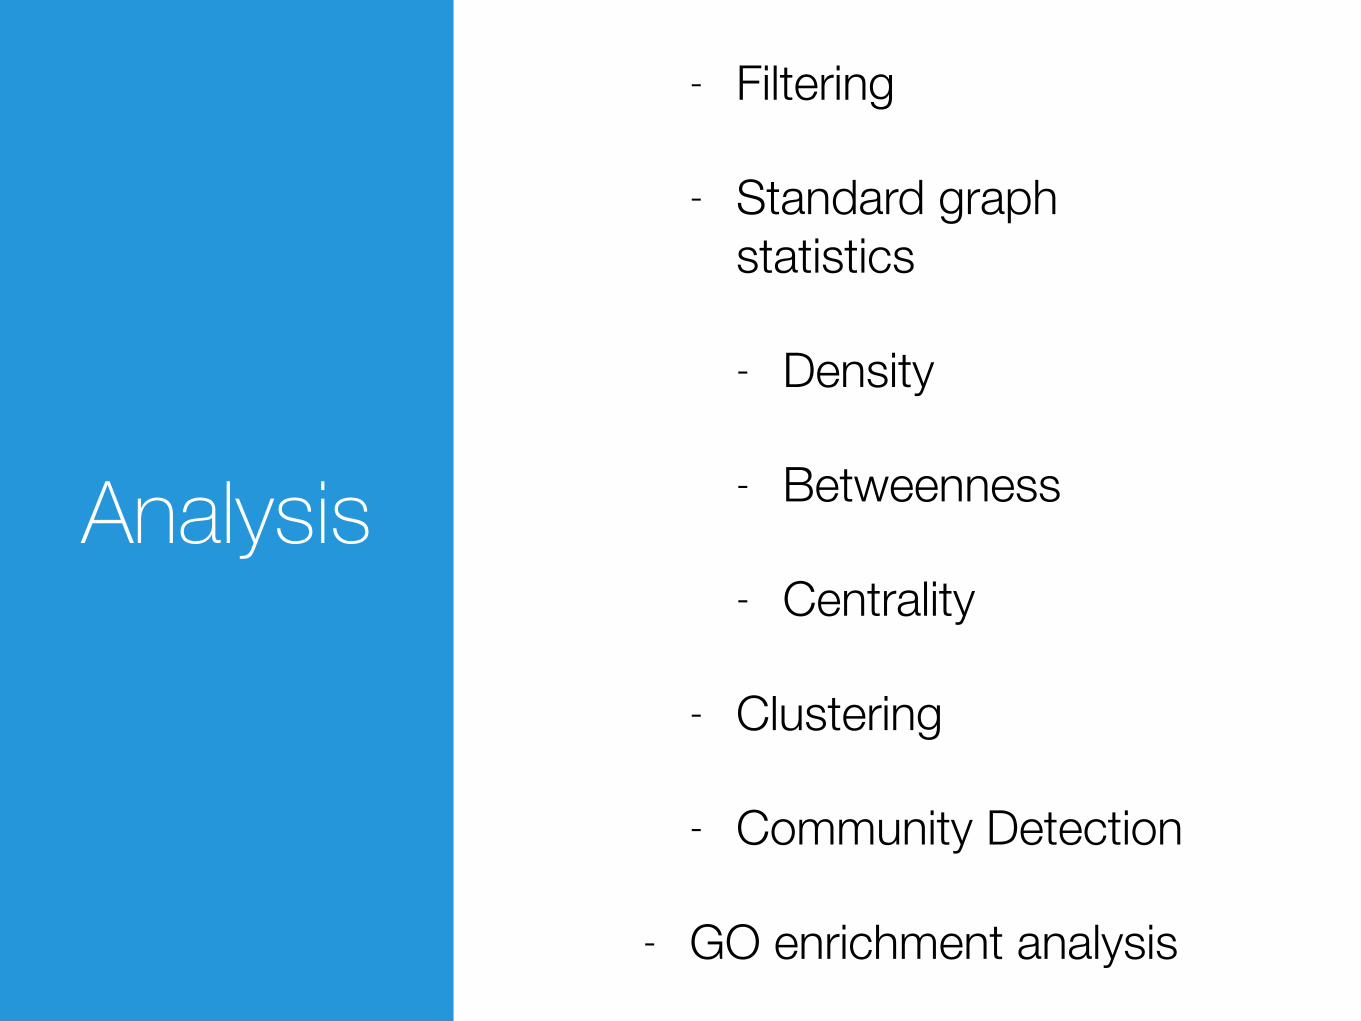
Analysis
- Filtering
- Standard graph statistics
- Density
- Betweenness
- Centrality
- Clustering
- Community Detection
- GO enrichment analysis
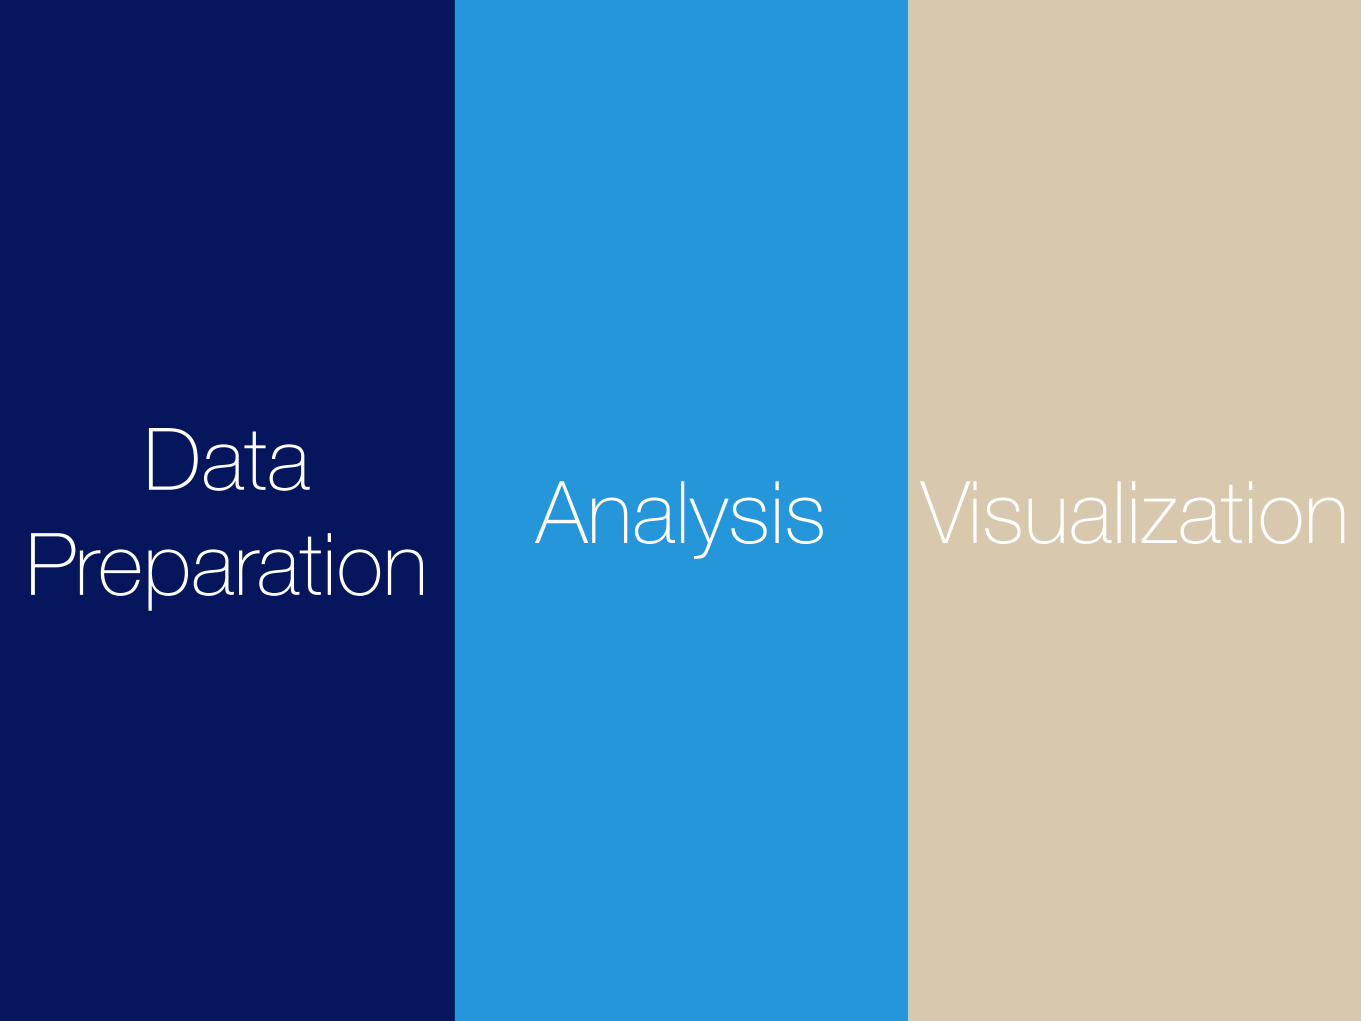
Data Preparation Analysis Visualization
Visualization

Visualization
- Mapping
- Data points to visual variables
- Layout
- For graphs:
- Force-directed
- Tree

Data Preparation Analysis Visualization

Data Preparation
Analysis Visualization

Data Preparation
Analysis Visualization

Data Preparati
on
Analysis Visualization

Preparation Analysis
Visualization
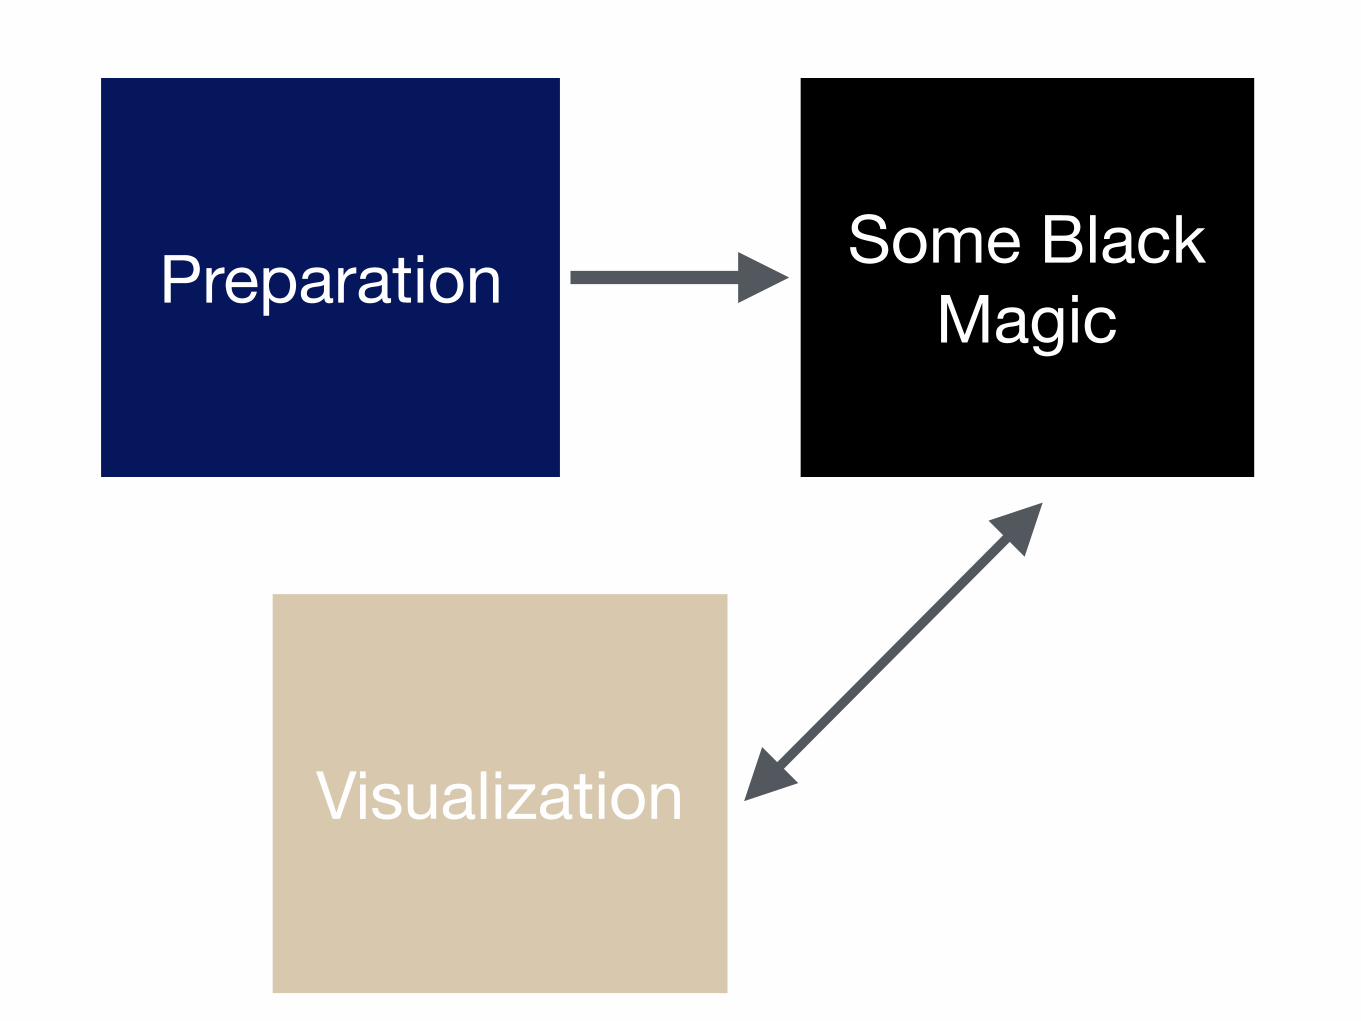
Preparation Some Black Magic
Visualization

Preparation ?
Visualization

Sharing Results
😐

Sharing Results and Process
😃

Technology for Reproducibility

可視化技術のレイヤ
Source Code
Environment
Data

可視化技術のレイヤData

Source Code
Environment
Data

Source Code

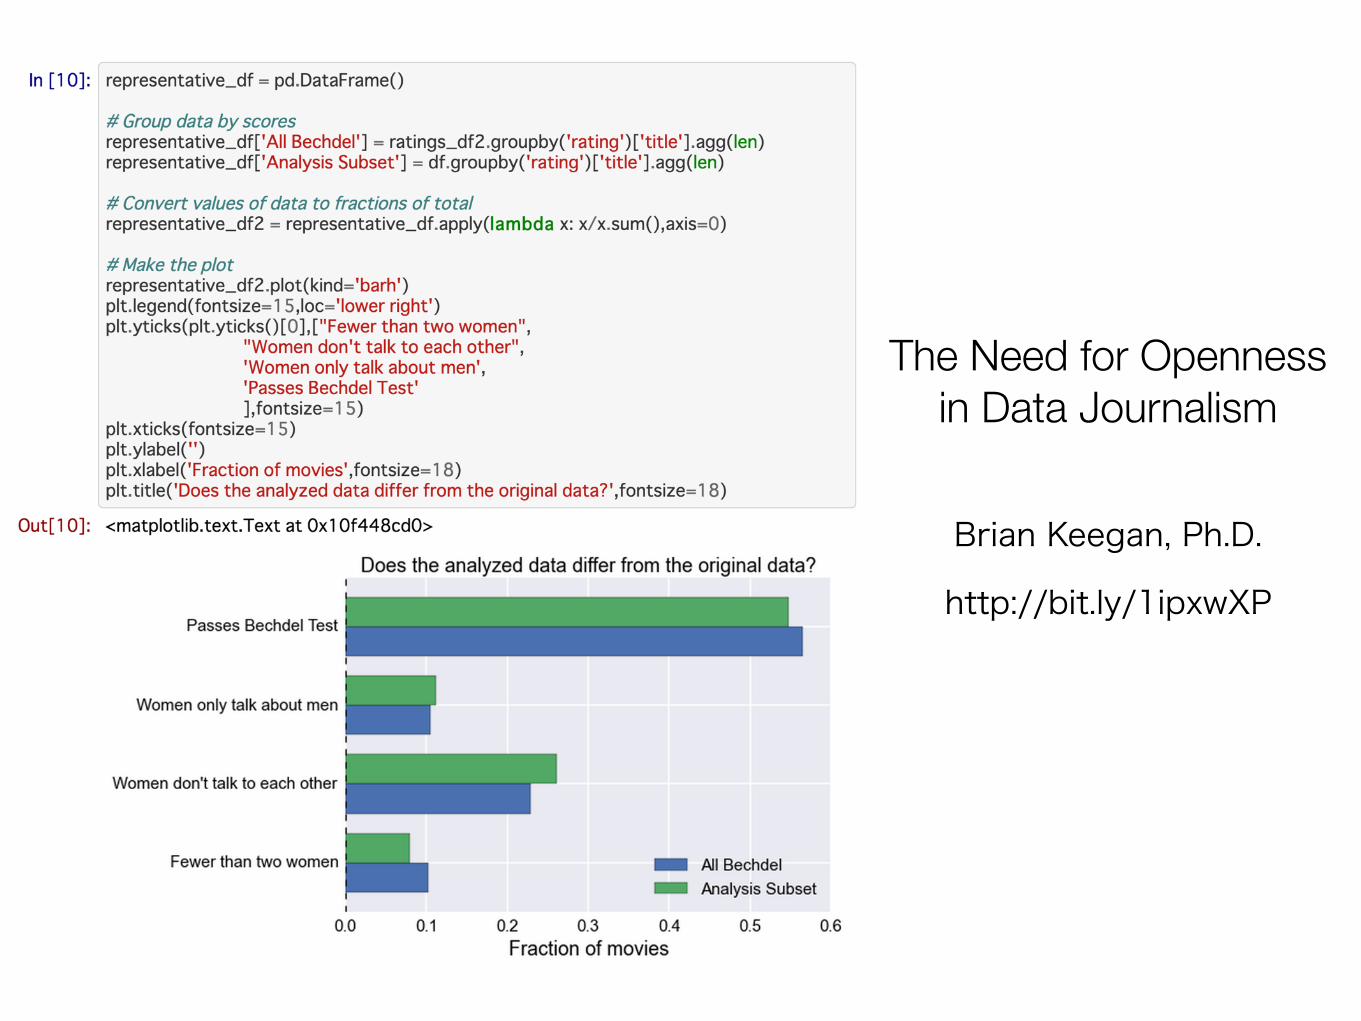
The Need for Openness in Data Journalism
http://bit.ly/1ipxwXP
Brian Keegan, Ph.D.

Source Code
Environment
Data

Environment

REST

Git/GitHub For Sharing Code/Notebooks
Git/GitHub For Sharing Code/Notebooks
- Git - Distributed Source Code Management System
- GitHub - (Public) Remote repository + great user interface for working with OSS code

- Create a new repository from existing one
- Complete copy of the original + your full access
- Pull Request
Forking

Exercise: Fork Repository

REST

Docker as Portable Data Analysis Environment
Bare Metal Machine
OSVirtual Machine
Frameworks
Your App

Bare Metal MachineOS (Linux)
Docker
FrameworksApplication
FrameworksApplication
FrameworksApplication
FrameworksApplication
FrameworksApplication

What is Docker?
- Container to run applications in an isolated environment
- Application = Layer of images
- Sharable Environments
- Environments as code

Virtual Machine vs Container
Low Performance Penalty Efficient Use of Resource

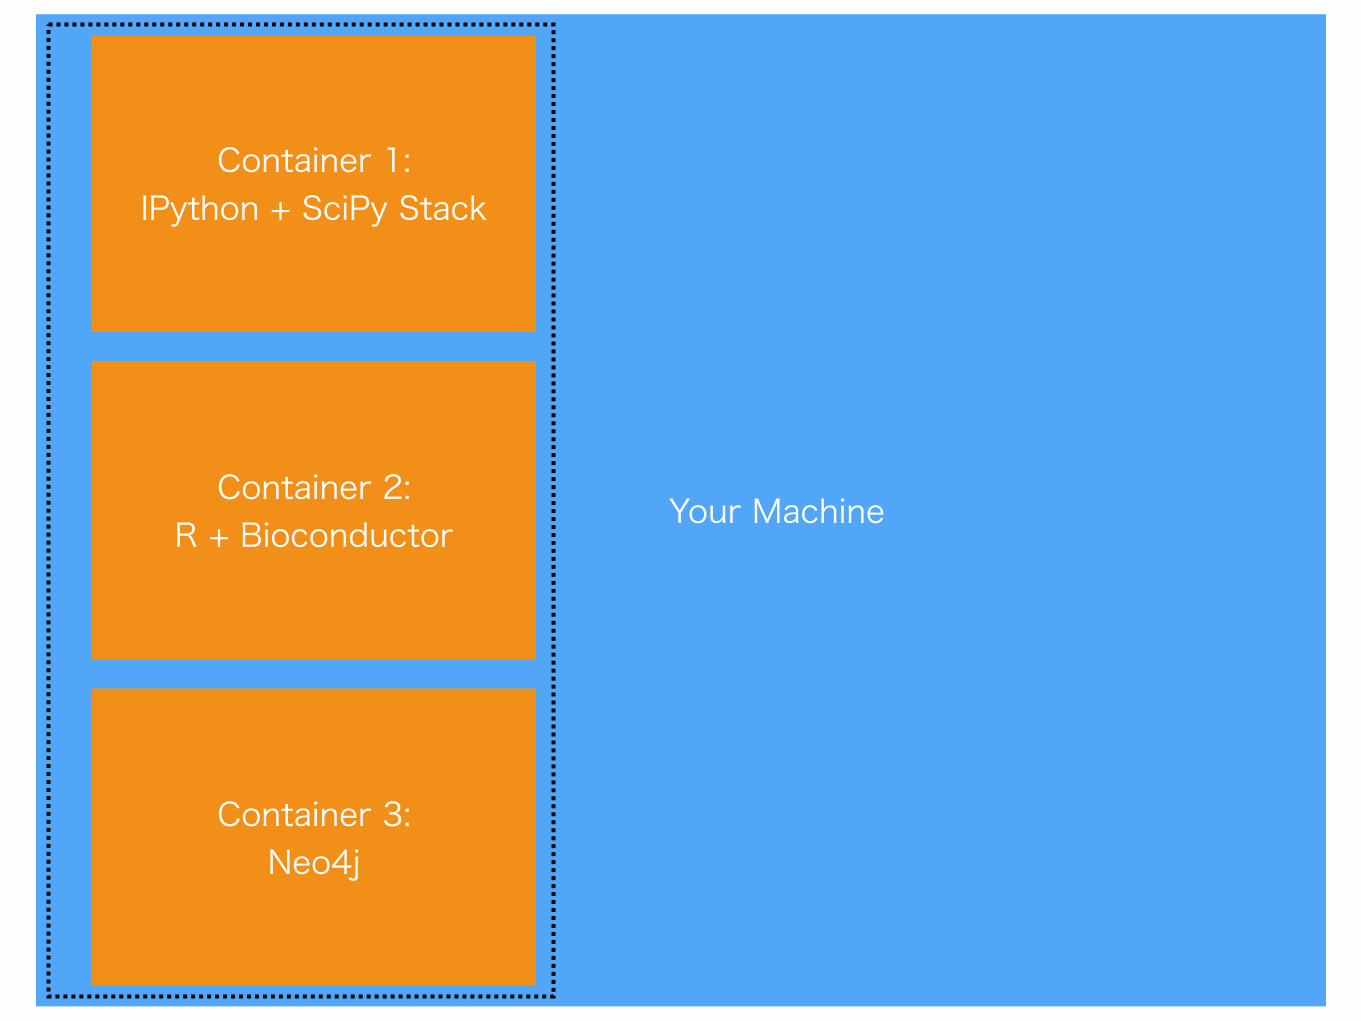
How Docker-nized World Works?
Container 1: IPython + SciPy Stack
Your Machine
Container 2: R + Bioconductor
Container 3: Neo4j
Your Machine
Container 1: IPython + SciPy Stack
Container 2: R + Bioconductor
Container 3: Neo4j

Your Machine
Container 1: IPython + SciPy Stack
Container 2: R + Bioconductor
Container 3: Neo4j

Docker Hub
- Sharing environments as code!
- Dockerfile - Definition of your container
- “GitHub of Images”

Union File System

https://docs.docker.com/terms/layer/

Our Dockerfile# # Docker image for VIZBI 2015 Tutorial # # This is a generic setup for network data analysis and visualization. # This Distribution includes: # - Python # - IPython Notebook # - Standard data analysis tools # - NetworkX, igraph, and graph-tool # FROM ipython/scipyserver MAINTAINER Keiichiro Ono <[email protected]>
RUN mkdir /graph-tool WORKDIR /graph-tool ADD . /graph-tool
RUN echo "deb http://downloads.skewed.de/apt/trusty trusty universe" >>/etc/apt/sources.list RUN echo "deb-src http://downloads.skewed.de/apt/trusty trusty universe" >>/etc/apt/sources.list RUN apt-key add graph-tool-pub-key.txt
RUN apt-get update && \ apt-get install -y build-essential libxml2-dev libxslt1-dev \ python-dev libzmq3-dev libcurl4-openssl-dev python3-graph-tool
RUN pip install networkx python-igraph py2cytoscape requests bokeh
WORKDIR /notebooks

FROM ipython/scipyserver
Extend this image from existing one in Docker Hub

Image B
Image C
Image A

Data Analyst’s Toolbox
Basic Python
Graph Analysis

Docker in Practice

Run a Container

Run Options
- -p: Publish port
- -p 80:8080 - Publish container’s port 8080 to 80
- -v: Mount local volume
- -v $PWD:/myapp - Mount current working directory to container’s /myapp directory

Run Options
- -n: Name the instance
- -n graph-analysis
- -d: Run in background (as daemon)

docker run -p 80:3000 -d \ -v $PWD:/webapp/contents node
Example

Exercise: Run a Docker Image

Run Docker Image- Publish port 80
- Run in background
- Mound forked repository to /notebook
- Add environment variables
- Password

docker run -d -v $PWD:/notebooks -p 80:8888 -e "PASSWORD=yourpass" -e "USE_HTTP=1" idekerlab/vizbi-2015
Actual Command to Run Our Image (one-line)
Current directory should be under your home (e.g. /Users/foo/Documents/vizbi-2015)
Exercise: Build a Docker Image
docker build -t network .

Exercise: Edit Dockerfile

Build Docker Image
- Add a instruction to install new software
- For example, wget
- Build it

REST

Jupyter as a Lab Notebook for Dry Experiments

Interactive Command-Line +
Markdown-based Documents

IPython Notebook? Jupyter?
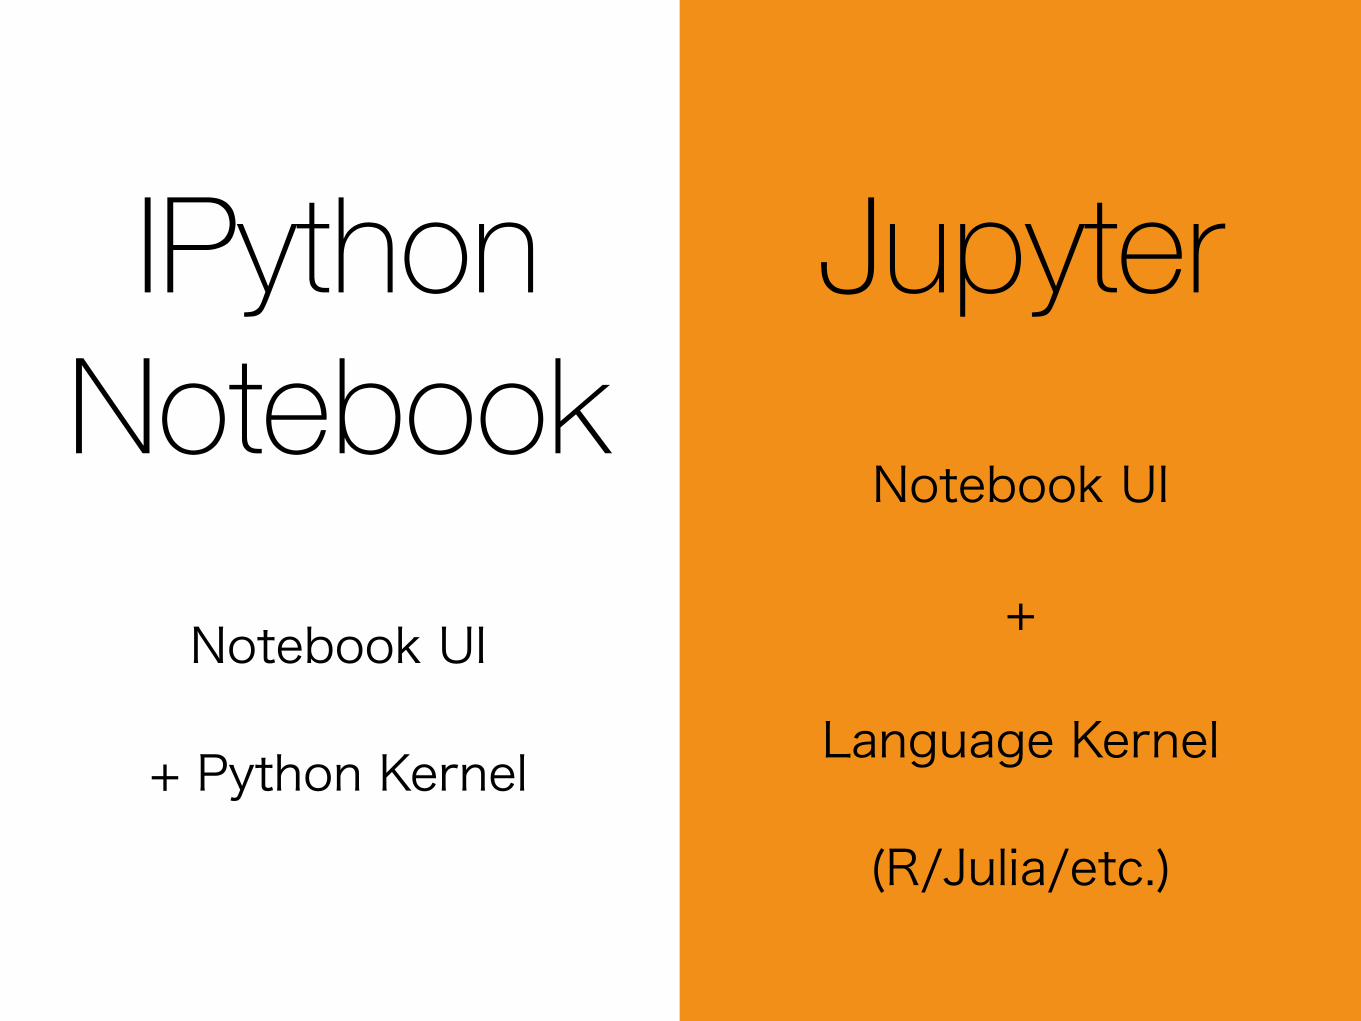
IPython Notebook
Notebook UI
+ Python Kernel
Jupyter Notebook UI
+
Language Kernel
(R/Julia/etc.)

Language-Agnostic
- From next version (4.x), Python Notebook will be an implementation of Jupyter
- You can switch to other language kernels


Exercise: Learn Jupyter Basics

Access Notebook Server Running in a Docker Container
- We will use a extended version of official ipython/SciPy server image
- By default, it uses secure connection (https)
- /notebooks is the root directory of notebooks
- Mount local file system to share Notebooks between container and your laptop

Try Lesson 0

REST

REST
cyREST for Cytoscape-as-a-service

REST Why We Need cyREST?
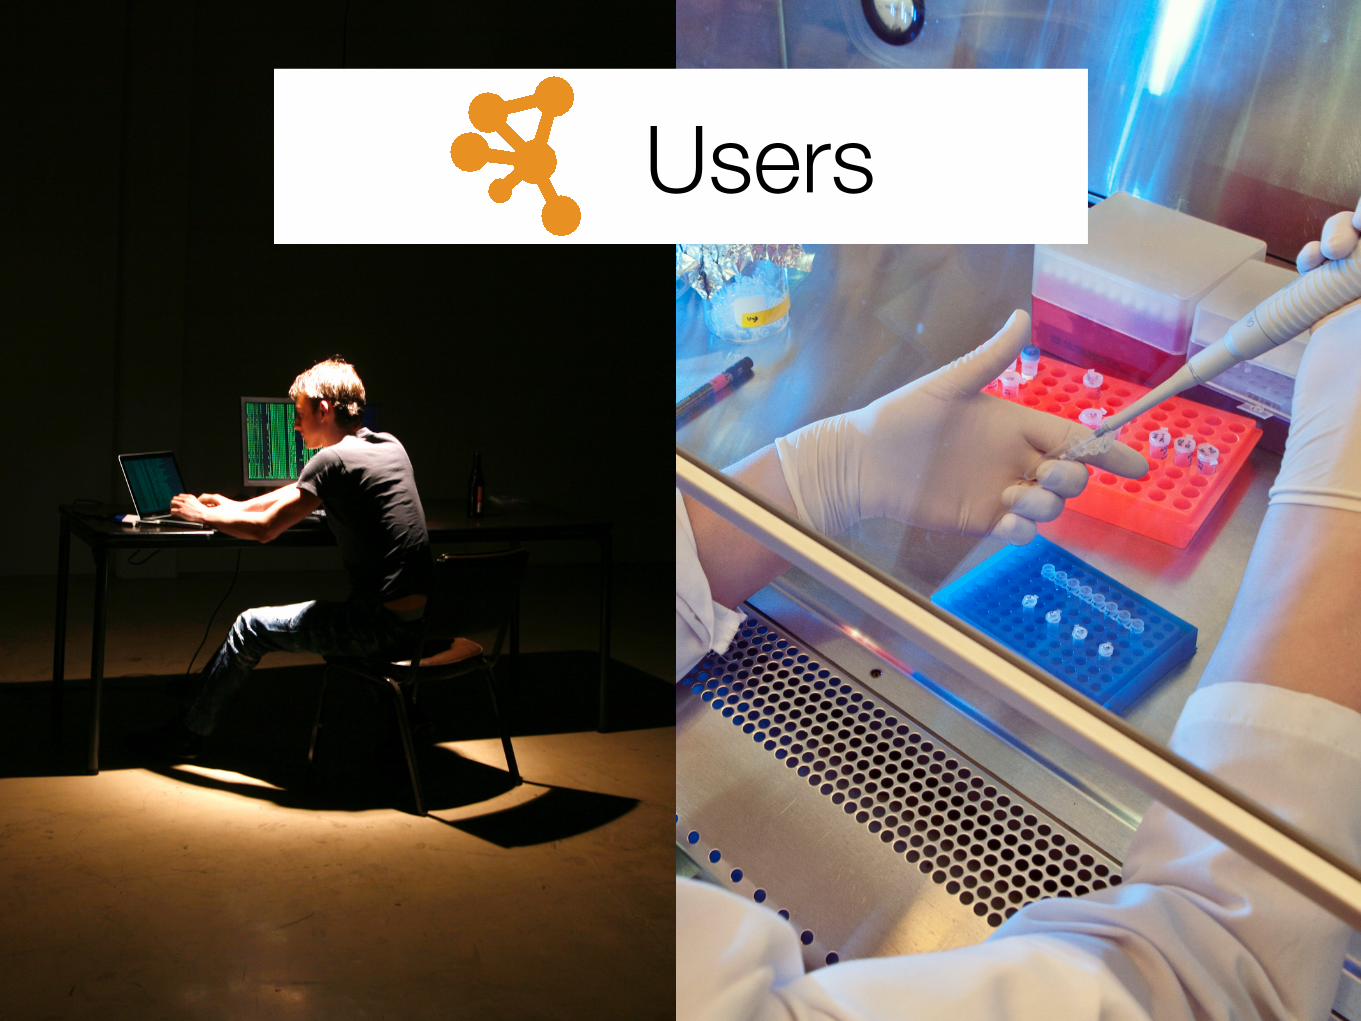
Users

User Type I- Average computing skills
- Use Excel as their primary workbench for data analysis
- For them, bioinformatics means using some of NCBI/EBI web tools or DAVID
- Have tons of data not analyzed / visualized yet
- Excel is my friend.

User Type II- Advanced computing skills
- Use Python + SciPy /NumPy, R + Bioconductor, or MATLAB every day
- If necessary, write their own packages
- Use HPC technologies a lot
- Manual operation is evil.
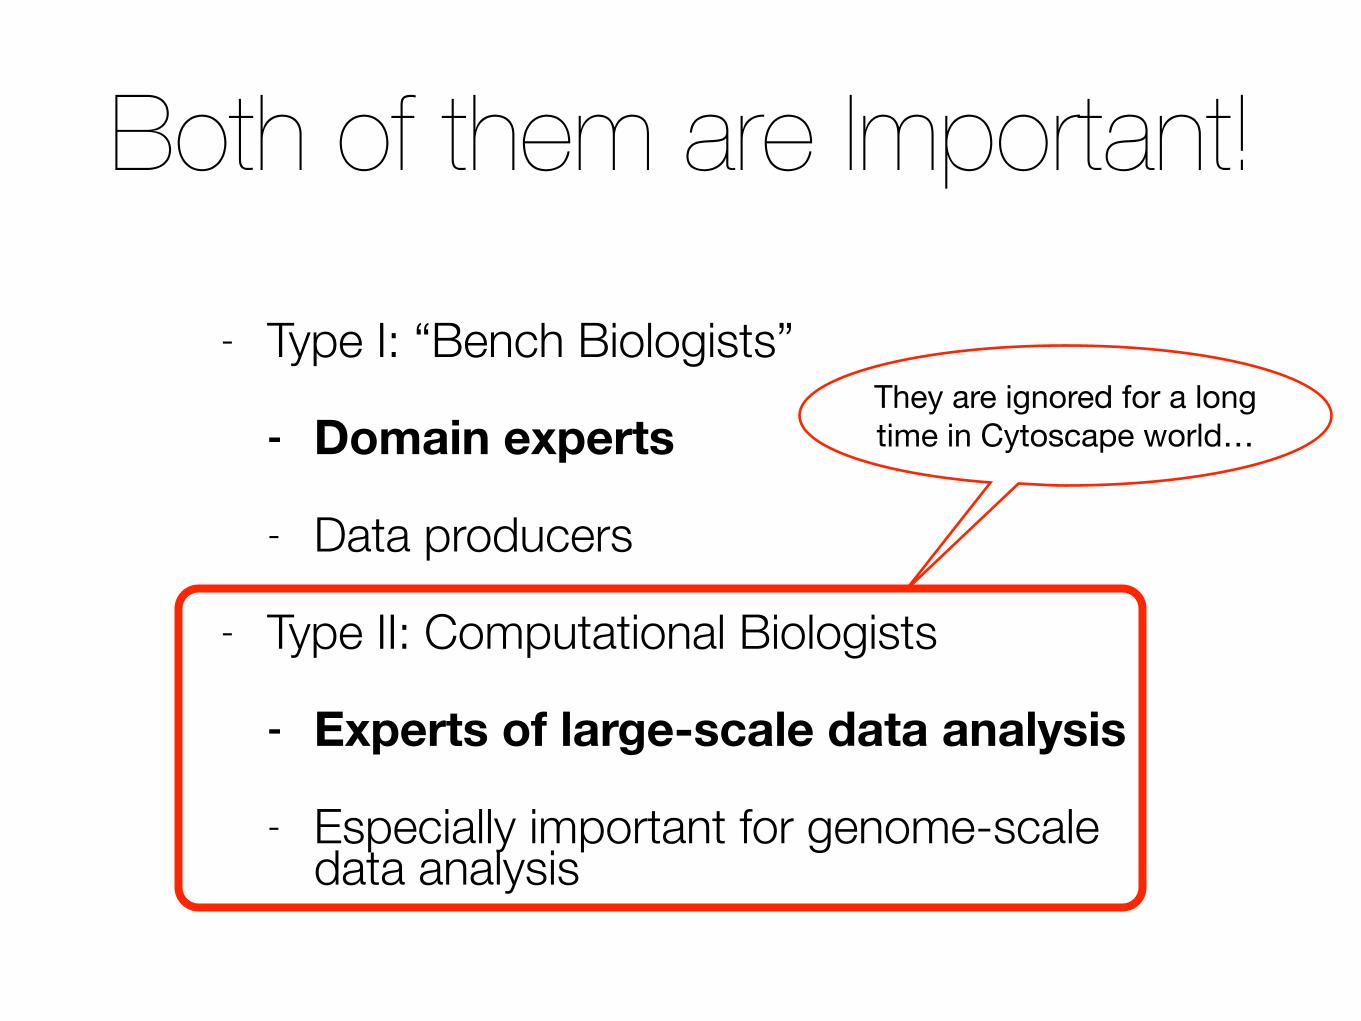
Both of them are Important!- Type I: “Bench Biologists”
- Domain experts
- Data producers
- Type II: Computational Biologists
- Experts of large-scale data analysis
- Especially important for genome-scale data analysis
They are ignored for a long time in Cytoscape world…

User Type II - Advanced computing skills
- Use Python + SciPy /NumPy, R + Bioconductor, or MATLAB every day
- If necessary, write their own packages
- Use HPC technologies a lot
- Manual operation is evil.

Requests from Type II Users- I have 200 networks in my session and I need to create
one PDF per view. How can I do it with Cytoscape?
- I need to use igraph for network analysis, but its visualization feature is limited. I want to use Cytoscape as an external visualization engine for R.
- Usually I use IPython Notebook to record my work. How can I integrate Cytoscape into my workflow?
- I want to generate Style for each time point and create small multiples of networks.

REST
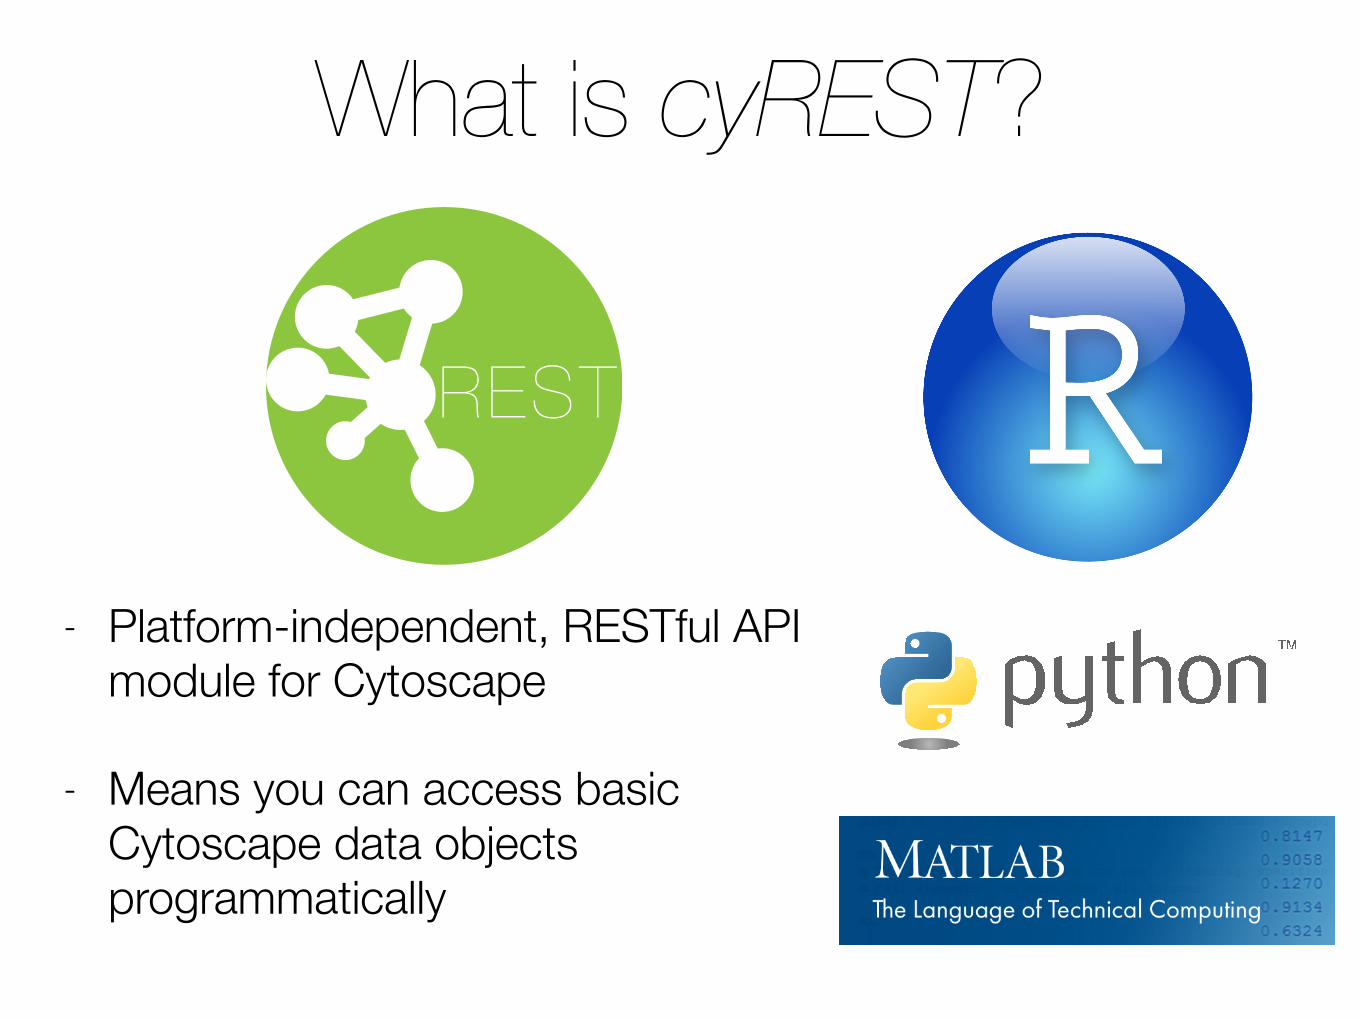
What is cyREST?
- Platform-independent, RESTful API module for Cytoscape
- Means you can access basic Cytoscape data objects programmatically
REST
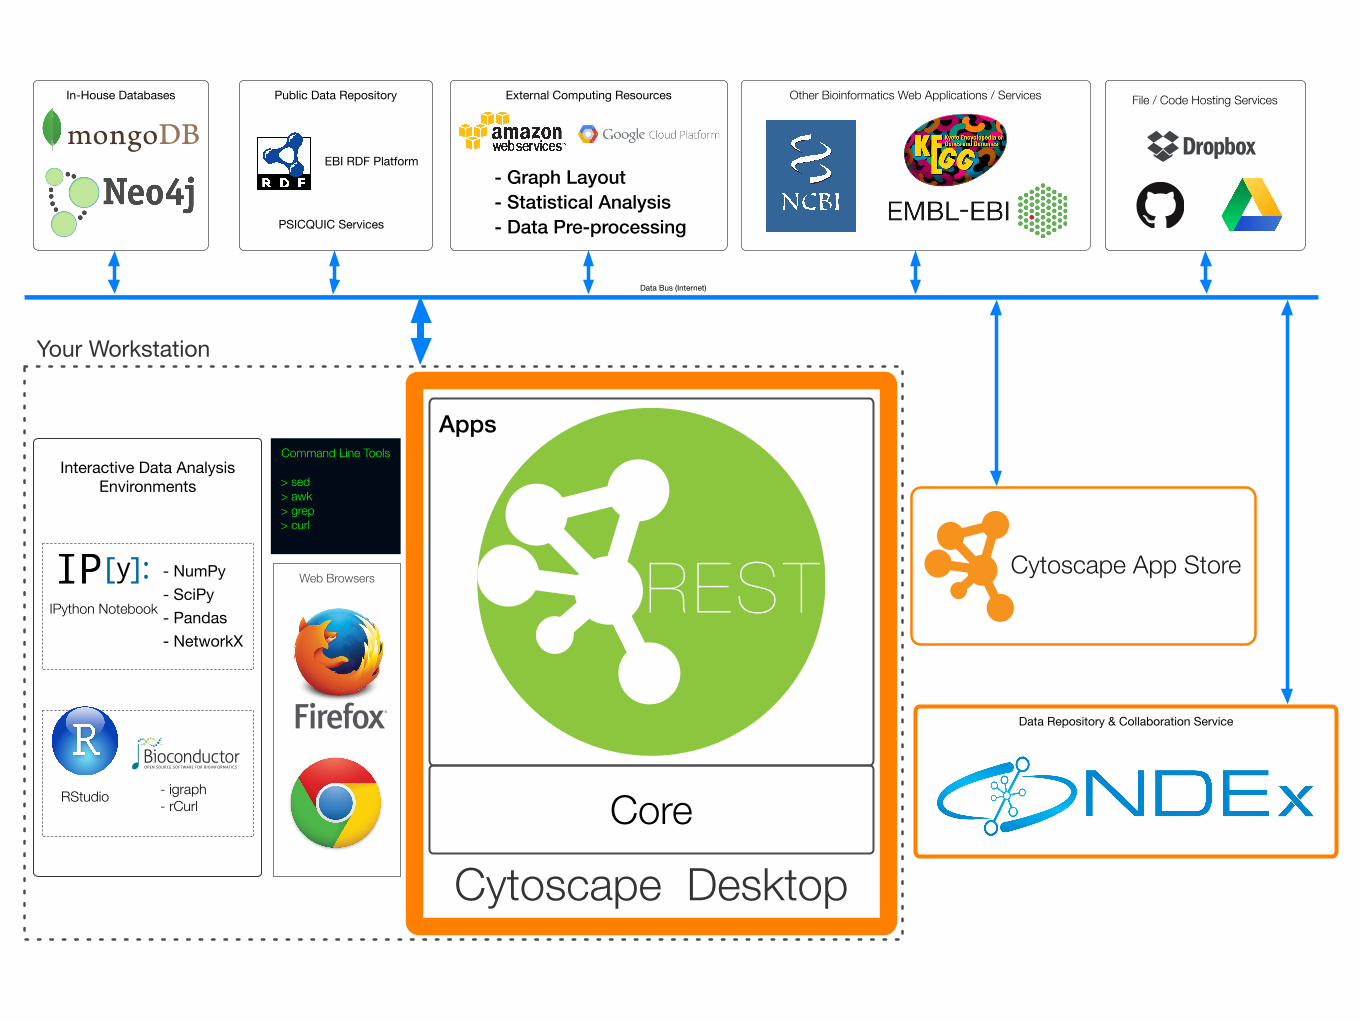
Interactive Data Analysis Environments
In-House Databases External Computing Resources
- Graph Layout- Statistical Analysis- Data Pre-processing
RStudio
- NumPy- SciPy- Pandas- NetworkX
IPython Notebook
File / Code Hosting ServicesPublic Data Repository
PSICQUIC Services
EBI RDF Platform
Other Bioinformatics Web Applications / Services
- igraph- rCurl
Command Line Tools
> sed> awk> grep> curl
Web Browsers
Data Repository & Collaboration Service
Data Bus (Internet)
Your Workstation
Cytoscape App Store
Cytoscape Desktop
Apps
Core
REST

REST
Cytoscape 3.1+Clients
POST
PUT
DELETE
GET

Mapping Cytoscape API to HTTP Methods
Create
Read
Update
Delete
Cytoscape Operations
POST
GET
PUT
DELETE
HTTP Methods

Get full network with unique ID 52 as JSON
GET http://localhost:1234/v1/networks/52

Try Lesson 1, 3, and then 2

Future

History

2005


2005
- Cytoscape 2.2: Simple Java Application
- Google released an application called Google Maps beta
- “Re-discovery” of JavaScript, or Ajax

2014

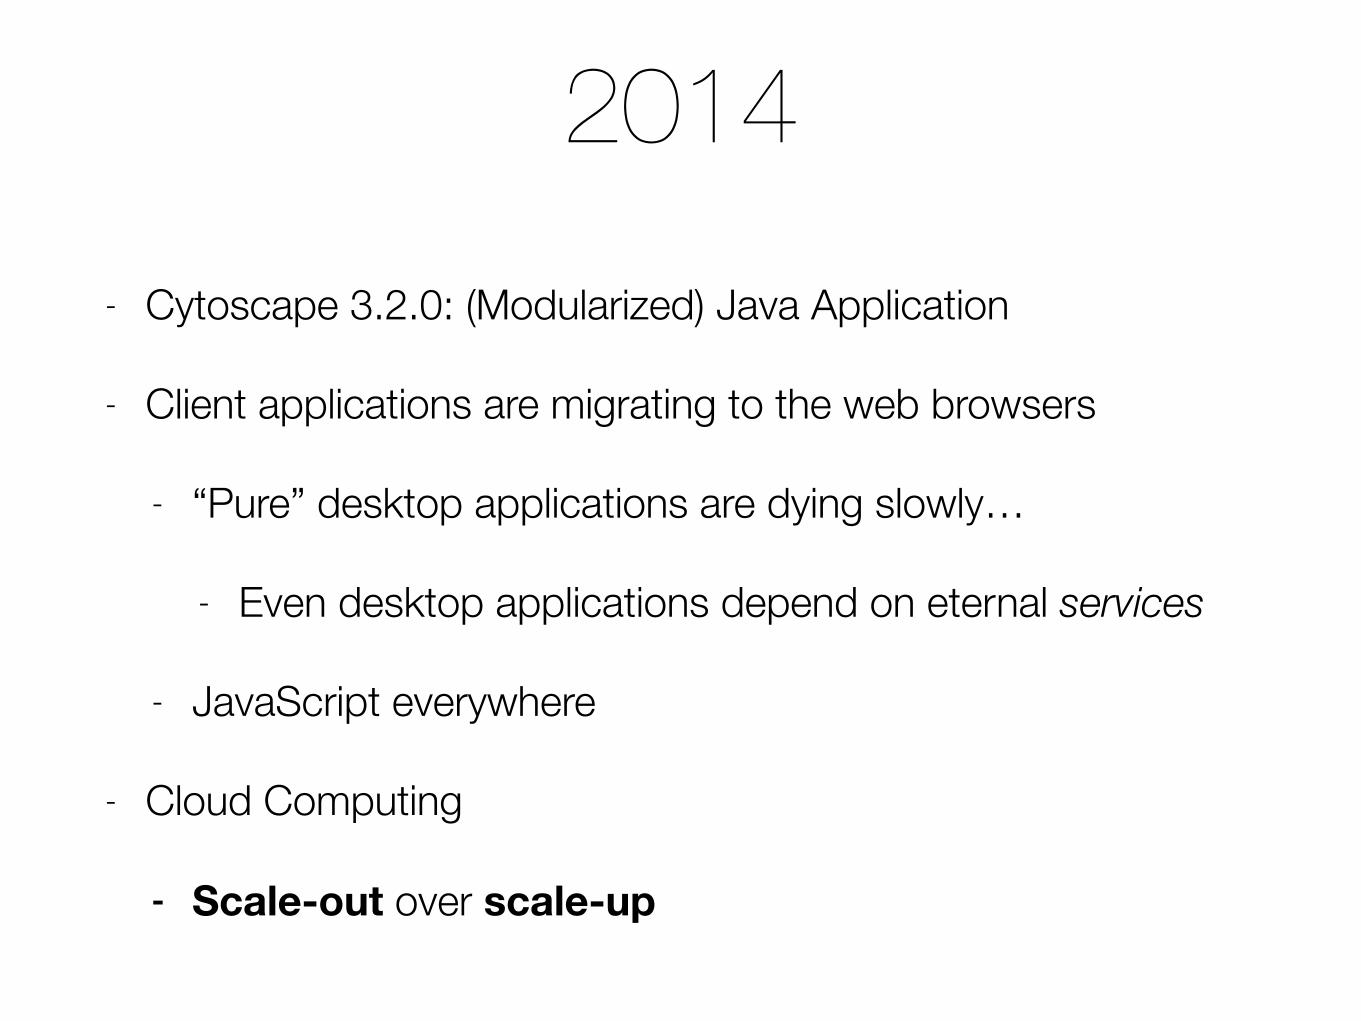
2014- Cytoscape 3.2.0: (Modularized) Java Application
- Client applications are migrating to the web browsers
- “Pure” desktop applications are dying slowly…
- Even desktop applications depend on eternal services
- JavaScript everywhere
- Cloud Computing
- Scale-out over scale-up

Trend in Software Design
- An application is a collection of smaller services
- JavaScript is a first-class citizen in the world of programming languages
- Design application with cloud services in mind

In the modern era, software is commonly delivered as a service: called web apps, or software-as-a-service. The twelve-factor app is a methodology for building software-as-a-service apps that:
• Use declarative formats for setup automation, to minimize time and cost for new developers joining the project
• Have a clean contract with the underlying operating system, offering maximum portability between execution environments
• Are suitable for deployment on modern cloud platforms, obviating the need for servers and systems administration
• Minimize divergence between development and production, enabling continuous deployment for maximum agility
• And can scale up without significant changes to tooling, architecture, or development practices.


This MANIFESTO counters current trends in bioinformatics where institutes and companies are creating monolithic software solutions aimed mostly at end-users.

by Peter Wang @PyData 2014

• https://flic.kr/p/bFZpyg
• https://flic.kr/p/bmXUz1
Photo Credits

• https://www.flickr.com/photos/23629083@N03/15409436041/in/photolist-ptFotK-9uS2gj-hypkSp-hypk9F-hypjha-99c472-9Xkuuc-huNmqB-7NMxMz-rg2Xh2-qYABcA-qjnGoB-rg2WVF-rdQYMf-qjaxy7-rg5Aoo-rg2Wre-qYAAt1-rg2Wev-qYAAaA-rg2W1V-rdQXT1-qjawtS-rg9ePH-rg5zb3-qjnEtV-qYHAvc-qYBA9d-rg2V7F-qYHAeF-qYAySA-rg5ys9-rg9dLF-rg2Utg-rg9drH-qYAyew-rg9dmc-rg5xP5-rg5xDA-qYAxV5-rg2TLe-rg5xp7-rg5xfQ-aq32tC-hba7em-hbafzE-gbeABq-gck7Dv-7PoYg1-fkisQL
• https://www.flickr.com/photos/nebulux/10000066526/in/photolist-geEXo7-58r1VP-6GioJH-9juEda-53HFiR-4sq7n3-4gyg7e-8ag9VV-8uqK43-4E89Gc-iWDeiJ-9G47M4-9G71KC-9waYuP-5FWSrX-87Mhxi-9G71XY-7Ai8hs-48vd2B-7B7o6n-6D9uWd-6hffXv-gYExNx-7defC1-66ygvB-4LsWSN-6D5n5k-6hfg5z-eucXAh-8uyuuG-aAY6cH-76QCEX-7f6mdp-RntfW-eFuVBC-5nY8Vc-7utTA2-brdj8F-92k6n3-5KdCfh-83uVKy-8unxG8-3d3zxi-cdz8S7-4HT5qQ-99SwEn-7Akbcb-8y7ds9-fvo9zH-9zZky3
• https://www.flickr.com/photos/stratman2/8613731520/in/photolist-e8aChq-7LLUoQ-8s8eBL-6uGRmE-77wKJF-dqo6ar-6hffGK-7rykRT-6fG8WV-8unyFa-8AeF8A-93Xpo2-9XLXCj-7GVMym-5Tu3dJ-7v58RC-5K9nBF-2MbvpL-2M77nV-et54Ce-6hfgvr-6hffQa-67wNj5-9FDGTz-49NmoE-eFXB7u-76QB7H-brdbSP-brcYHT-22zYYv-6fFZoM-ckuXNC-a8UZ3D-dzGXYU-6nf4MN-4j7TzA-47fYur-2kutoV-56catX-apUJgr-cSJHkG-88w1ie-6Nbj1a-8MYxve-6xL3SF-6fL87j-4G6x71-dUL16b-7auq8Q-6hwbVB
• https://www.flickr.com/photos/gcwest/281385801/in/photolist-5mFJtX-4o3Ria-hD9E92-qSbck-9abnoA-7hsWoU-ntEmgy-oSAQtv-nx5Chg-iuZJCa-j7eWKk-hD7JTZ-4iECHX-j8M2r7-bSrWHc-prpFcX-db7xd-jLmzoF-75mqRx-pnSzL-6gVcao-9F5bop-j77HEs-73Umq1-5kRyNp-hD9cR2-mTvNB8-gyXWaf-Lkro7-idQBY4-fRYu1-5eR2cn-3EK4k-nnxH8u-9uDMLx-4NY3Yi-kDQagt-ioGRSb-75qid1-82RzYt-5qQuwt-n8hvL6-ifemz5-3iYUQG-aJnNiX-mzirX2-23rDNy-qx3KEd-h5UnGW-hD7Jqz