
Vitrification and Product Testing of AW-101 and AN … · PNNL-13372 WTP-RPT-003, Rev. 0 (Formerly...
75
PNNL-13372 WTP-RPT-003, Rev. 0 (Formerly BNFL-RPT-035) Vitrification and Product Testing of AW-101 and AN-107 Pretreated Waste G. L. Smith L. R. Greenwood G. F. Piepel M. J. Schweiger H. D. Smith M. W. Urie J. J. Wagner October 2000 Prepared for CH2M Hill Hanford Group, Inc. under Project Number 41503
Transcript of Vitrification and Product Testing of AW-101 and AN … · PNNL-13372 WTP-RPT-003, Rev. 0 (Formerly...

PNNL-13372WTP-RPT-003, Rev. 0
(Formerly BNFL-RPT-035)
Vitrification and Product Testing of AW-101 and AN-107 Pretreated Waste
G. L. SmithL. R. Greenwood G. F. PiepelM. J. SchweigerH. D. SmithM. W. UrieJ. J. Wagner
October 2000
Prepared for CH2M Hill Hanford Group, Inc.under Project Number 41503

PNNL-13372WTP-RPT-003, Rev. 0
(Formerly BNFL-RPT-035)
Vitrification and Product Testing of AW-101 and AN-107 Pretreated Waste
G. L. SmithL. R. Greenwood G. F. PiepelM. J. SchweigerH. D. SmithM. W. UrieJ. J. Wagner
October 2000
Prepared forCH2M Hill Hanford Group, Inc.under Project Number 41503
Pacific Northwest National Laboratory Richland, Washington 99352

iii
Summary
The U.S. Department of Energy (DOE) Office of River Protection (ORP) is acquiring Hanford tank waste treatment services at a demonstration scale. The River Protection Project Waste Treatment Plant (RPP-WTP) team is responsible for producing an immobilized (vitrified) low-activity waste (ILAW) waste form. Pacific Northwest National Laboratory, hereafter referred to as PNNL, has been contracted to produce and test a vitrified ILAW waste form from the Envelope A and C low activity (LAW) samples previously supplied to the RPP-WTP project by DOE.
The primary objective for vitrifying the LAW samples is to generate glass products for subsequent product testing. The work presented in this report is divided into 5 work elements: 1) Glass Fabrication, 2) Chemical Composition, 3) Radiochemical Composition, 4) Crystalline and Non-crystalline Phase Determination, and 5) Release Rate (Modified PCT). These work elements will helpdemonstrate the RPP-WTP projects ability to satisfy the product requirements concerning, chemical and radionuclide reporting, waste loading, identification and quantification of crystalline and non-crystallinephases, and waste form leachability. VOA, SVOA, dioxins, furans, PCBs, and total cyanide analyses will be reported in as separate document (WTP-RPT-005).
Two pretreated tank supernates, low-activity wastes (241-AW-101 and 241-AN-107) along with a process simulant (termed the Process Blank) were prepared as melter feeds for vitrification. The analyzed compositions of the pretreated AW-101 and AN-107 wastes were used by Catholic University of America’s (CUA) Vitreous State Laboratory (VSL) to calculate the target glass composition.
The two supernate tank samples, i.e. 241-AW-101 and 241-AN-107, hereafter referred to as AW-101 and AN-107, were processed through pretreatment chemical separation processes, and the decontaminated supernates were converted to low-activity waste (LAW) glass. The AW-101 supernate sample was processed through the following unit operations to simulate the RPP-WTP project flowsheet: 1) dilution of the feed; 2) ultrafiltration to remove entrained solids; 3) removal of 137Cs by ion exchange; and 4) removal of 99Tc by ion exchange. The AN-107 supernate sample was processed through the following unit operations to simulate the RPP-WTP project flowsheet: 1) dilution of the feed; 2) removal of Sr/TRU by precipitation; 3) ultrafiltration to remove entrained solids and precipitated Sr/TRU; 4) removal of 137Cs by ion exchange; 5) removal of 99Tc by ion exchange; and 6) removal of sulfate (SO4)by precipitation. Product testing of the LAW waste forms, as prescribed by the RPP-WTP project, was performed by PNNL to support Phase 1B deliverables.
Glass former additives (Kyanite (Al2SiO5); Orthoboric acid, (H3BO3); Wollastonite (CaSiO3);Red Iron Oxide Pigment (Fe2O3); Olivine (Mg2SiO4); Silica sand (SiO2); Rutile Ore (TiO2); Zinc Oxide (ZnO); Zircon sand (ZrSiO4); and sugar) were added to each pretreated waste to produce a melter feed.The AW-101 and AN-107 melter feeds were dried, calcined, and melted at 1150°C for one hour. Each melt was then poured onto a stainless steel plate, cooled, crushed to a fine powder, mixed, and added back into the crucible, and melted for an additional hour at 1150°C. The final AW-101 melt pour was excellent, estimated viscosity of about 5 Pa· s based on visual observation coupled with past experience, and bubbles present in the meniscus burst while being poured. The final AN-107 melt pour was excellent as well, with an estimated viscosity of about 8 to 10 Pa· s, based on visual observation. Some bubbles present in the meniscus were observed during pouring and a slight vapor of volatile components was observed when the lid was removed from the crucible during pouring. The first portion of each pour went into a platinum crucible for the canister centerline cooling test and the remainder of the melt was quenched on a stainless steel plate.

iv
Vitrification of slurry melter feed in an actual liquid-fed ceramic melter (LFCM) progresses continuously through 3 distinct stages, drying, calcining and melting. Under steady-state operating conditions, the aqueous slurry that is introduced into the high-temperature melter environment spreads out over an existing cold cap where it dries and becomes part of the melter cold-cap structure. This dried material begins working its way down through the cold-cap as it becomes submerged in incoming feedwhile, at the same time, material, at the molten-glass/cold-cap interface, is dissolving into the glass melt.During this continuous progression through the cold cap, the temperature that the feed is subjected to monotonically increases from the boiling point of water (~100 °C) to molten glass temperatures (~1100 °C). Accompanying this continuous physical and thermal transition, inorganic eutectic salts are slowly converted to their oxide forms (calcined) that are suitable for subsequent incorporation into the melter’s molten glass pool.
All of these discrete phases of liquid-fed ceramic melter feed processing have been faithfully reproduced in the crucible studies performed. What may not be truly represented, however, is the complex stages and nature of the cold-cap chemistry that results in the calcination of the feed material.For non-volatile, inorganic feed constituent, the differences between crucible and melter vitrification conditions are inconsequential. For all other feed components, cold-cap chemistry can influence both partitioning behavior and chemical byproduct yields, which, in turn, can and will affect the resultant glass product.
Consequently to properly represent an LFCM glass product, actual physical and chemical processing conditions need to be replicated. But since this requires the development of a representative cold-cap structure, nothing short of a liquid-fed melting process (e.g., scaled melter or possibly a gradient furnace test) is truly adequate. However, relationships drawn between previous crucible and actual melter testing results, i.e. from VSL and GTS Duratek testing, that were conducted using a fixed feed may be useful in extracting reference glass-product quality parameters from extrapolated crucible test data.
The measured composition of the AW-101 and AN-107 glasses are fairly close to their target compositions. Per the RPP-WTP project LAW glass Task Specification, the concentration of the waste sodium oxide shall be greater than 16 wt%. The target concentration of sodium oxide for both glasses is 20 wt%. The measured wt% sodium oxide content for the AW-101 and AN-107 glasses are 17.7 and 18.3, respectively. As all of the sodium oxide content for the AW-101 glass originated from the initial tank waste, the AW-101 glass exceeds the Task Specification, sodium oxide concentration level of 16 weight percent easily considering only the measured wt% sodium oxide content. Based upon past experience, the measured weight percentage for Na2O is almost always lower than its true weight percentage, which provides an even larger margin of passing the Task Specification requirement. Note that as discussed in Section 4.1.2, Na2O and SiO2 analyzed by ICP-AES are almost always lower than their true weight percentage because of analytical difficulties associated with these elements. However, not all of the sodium oxide content for the AN-107 glass originated from the initial tank waste. As 79.2% of the sodium oxide content for the AN-107 glass originated from the initial tank waste, for the AN-107 glass to meet the Task Specification, sodium oxide concentration level of 16 weight percent the wt% sodium oxide content of the glass would need to be 20 wt% which is the target concentration.Again, based upon past experience, the measured weight percentage for Na2O wt% values are almost always lower than its true weight percentage. For this reason, the target Na2O value is used as the true weight percent oxide value for the ILAW glasses. Therefore, the original, as-received AN-107 waste is determined to meet the Task Specification for waste loading of the AN-107 glass. The ORP Contract Specification 2, Immobilized Low-Activity Waste, Section 2.2.2.2, Waste Loading, states: “The loading of waste sodium from Envelope A in the ILAW glass shall be greater than 14 weight percent based on Na2O. The loading of waste sodium from Envelope B in the ILAW glass shall be greater than 5.0 weight percent based on Na2O. The loading of waste sodium from Envelope C in the ILAW glass shall be

v
greater than 10 weight percent based on Na2O.” Therefore, additionally, both the AW-101 (Envelope A) and AN-107 (Envelope C) glasses easily meet the ORP contract specifications for waste sodium loading.The percent difference in the measured wt% oxide values for components in the AW-101 glass as compared to the targeted wt% oxide values are 0.3% for alumina, 3% for boron oxide, 1.5% for calcium oxide, 8.8% for iron oxide, 19% for potassium oxide, 5.4% for magnesium oxide, 11.7% for soda, 4.3% for silica, 13.7% for titania, 4% for zinc oxide, and 14.4% for zirconia. The percent difference in the measured wt% oxide values for components in the AN-107 glass as compared to the targeted wt% oxide values are 1.9% for alumina, 4.3% for boron oxide, 2% for calcium oxide, 8.8% for iron oxide, 4.9% for magnesium oxide, 8.4% for soda, 4.4% for silica, 6.7% for titania, 2.8% for zinc oxide, and 9.6% for zirconia.
The waste loading was calculated from the dilution factor (decrease in concentration) of elements contained in either the waste or the glass forming additives. The results indicate that the waste fraction of each glass is near their target, i.e. 26.15% for AW-101 (28.64% based on waste dilution and 26.88% based on additive dilution) and 21.4% for AN-107 (26.04 % based on waste dilution and 20.34% based on additive dilution). The measured glass to target composition percent difference comparison of the oxides is small and the calculated waste loading values are very close to or exceed the target.Both support the conclusion that the actual waste loading in each glass met and exceeded the target waste loading.
Based on identification and quantification of radionuclides found in the pretreated wastes and a comparison to radionuclides identified as significant in NUREG/BR-0204 and 49CFR 172.101 (Table 2), the radionuclides to be measured in the AW-101 and AN-107 glasses were determined and analytically measured. In addition, to further demonstrate that the glass product, radionuclide compositional limits were met a radionuclide glass compositional estimate based on sample analysis of the pretreated wastes was completed for both the AW-101 and AN-107 glasses as volatilization of radionuclides may occur during vitrification in crucible melts. 90Sr, 99Tc, 137Cs, and transuranic (TRU) radionuclide values were checked to make sure the glass product met or exceeded the contract success criteria. The estimated glass composition concentrations for 90Sr passed the contract success criteria for both glasses. The estimated glass composition concentrations for 99Tc passed the contract criteria for the AW-101 glass. The estimated glass composition concentrations for 99Tc did not pass the contract criteria for the AN-107 glass. However, Blanchard et al. 1999 have previously shown that an Envelope A waste (e.g. AW-101) can be 99Tc ion exchange decontaminated to a level much below the contract ILAW glass limit. This would allow a sufficient amount of 99Tc to be removed from the AW-101 and AN-107wastes so that the average 99Tc concentration in the ILAW glass produced would meet or exceed the contract specification. The estimated glass composition concentrations for 137Cs passed the contract success criteria for the AW-101 and AN-107 glasses. And finally, the estimated glass compositionconcentration analysis for the transuranic (TRU) radionuclides shows that both glasses pass the contract success criteria.
Identification and quantification of crystalline and non-crystalline phases were completed by using x-ray diffraction (XRD), optical microscopy, and scanning electron microscopy (SEM). Samples of both LAW glasses (AW-101 and AN-107) were given a slow cool down heat treatment which simulated the calculated cooling profile for glass at the centerline of a LAW canister being filled with an 1150ºC waste glass and allowed to cool to ambient temperature. No crystals were observed in any of the glass samples examined as determined by XRD, optical microscopy, and SEM evaluations.
The ultimate objective for immobilization of the low activity waste is to incorporate and convert the radioactive and hazardous components into a solid glassy waste form that will resist their release to the environment in a Hanford near-surface burial ground. This resistance of the waste form to release deleterious environmental components is defined by measuring its chemical durability, i.e. the resistance

vi
of the glass to react with the aqueous environment expected in the glass disposal site. However, to mimic the mean temperature, amount and frequency of available ground waster, etc. expected in the near-surface repository would require a great amount of testing time to be able to detect glass dissolution. Therefore, an accelerated chemical durability test, the Product Consistency Test (PCT), is employed to gauge the ILAW glass chemical durability. The PCT was run at 40 and 90°C, using glasssamples given a slow cool down heat treatment which simulates the cooling profile for glass at the center line of a canister that has been filled with a waste glass and allowed to cool to ambient temperature, to determine the normalized release of sodium, silicon, and boron. The low-activity test reference material (LRM) standard glass was included in these tests to provide a reliable baseline of results by which to judge the quality of the PCT results for the AW-101 and AN-107 glasses. Note: Vapor Hydration Test’s (VHT) were not required as part of the ORP, Part B-1 contractual work and therefore were not part of this scope of work. However, VHT testing of ILAW glasses will be required in the future as another measure of chemical durability .
Both the AW-101 and AN-107 glasses and the LRM glass gave a normalized sodium, silicon, and boron release rates of less than 1 g/m2 for the 90ºC PCT test, which is generally considered to indicate a durable glass. In the present study, the normalized sodium, silicon, and boron 90ºC PCT release rates for the AW-101, AN-107, and LRM glasses are: 1) 0.6 g/m2, 0.2 g/m2, and 0.6 g/m2; 2) 0.4 g/m2, 0.2 g/m2, and 0.4 g/m2; and 3) 0.5 g/m2, 0.2 g/m2, and 0.5 g/m2;, respectively. The normalized sodium, silicon, and boron 40ºC PCT release rates for the AW-101, AN-107, and LRM glasses are: 1) 0.09 g/m2, 0.03 g/m2, and 0.05 g/m2; 2) 0.07 g/m2, 0.03 g/m2, and 0.04 g/m2; and 3) 0.07 g/m2, 0.02 g/m2,and 0.02 g/m2;, respectively, which again indicates that the ILAW glasses from this study are similar in durability to the LRM reference glass indicating good durability. In addition, the normalized release rates of sodium, silicon, and boron from the AW-101 and AN-107 glasses are less than 2.0 g/m2, the contract success criteria.
vii
Terms and Abbreviations
AES Atomic emission spectroscopy
ALO Analytical Laboratory Operations
ARG-1 Analytical Reference Glass-1
ASTM American Society for Testing and Materials
CCC canister centerline cooling
CFR Code of Federal Regulations
CMC Chemical management center
Cs IX cesium ion exchange
CUA Catholic University of America
DI Deionized
DIW deionized water
DL Detection level
DOE U.S. Department of Energy
DOE-RL U.S. Department of Energy-Richland Operations Office
EDS Energy dispersive spectroscopy
EPA Environmental Protection Agency
EQL estimated quantification limit
g gram
GEA Gamma energy analysis
HLW High level waste
IC Ion chromatography
ICP-AES inductively coupled plasma-atomic emission spectroscopy
ICP-MS inductively coupled plasma-mass spectroscopy
ICV initial calibration verification
ILAW immobilized low activity waste
L Liter
LAW Low activity waste
LCS Laboratory control standard
LEPS low-energy photon spectrometry
LRM Low-activity test reference material
MS Mass spectrometry
MSE Mean squared error

viii
NIST National Institute of Standards and Technology
NM not measured
NUREG Nuclear Regulation
ORP Office of River Protection
PCB polychlorinated biphenyls
PCT product consistency test
PND Pacific Northwest Division
PNNL Pacific Northwest National Laboratory
RCRA Resource Conservation Recovery Act
RPD Relative Percent Difference
RPG Radiochemical Processing Group
RPL Radiochemical Processing Laboratory
RPP-WTP River Protection Project Waste Treatment Plant
SBMS Standards Based Management System
SEM Scanning Electron Microscopy
SRTC Savannah River Technology Center
SVOA Semi-volatile organic analysis
TC Total carbon
Tc IX technetium ion exchange
TCLP Toxicity Characteristic Leaching Procedure
TIC Total inorganic carbon
TOC Total organic carbon
TRU Transuranic
µm Micron
UST underground storage tank
VOA volatile organic analysis
vol% Volume percent
VHT Vapor Hydration Test
VSL Vitreous State Laboratory
wt% Weight percent
XRD X-ray diffraction

ix
Contents
1.0 Introduction.......................................................................................................................................1.11.1 Quality Assurance.................................................................................................................... 1.1
2.0 Test Objectives..................................................................................................................................2.1
3.0 Experimental Method........................................................................................................................3.13.1 Glass Fabrication and Analysis................................................................................................ 3.1
3.1.1 Glass Fabrication ............................................................................................................. 3.13.1.2 Chemical Composition..................................................................................................... 3.73.1.3 Radiochemical Composition............................................................................................ 3.7
3.2 Crystalline and Non-Crystalline Phase Determination ............................................................ 3.83.3 Release Rate, Modified Product Consistency Testing ........................................................... 3.10
4.0 Results...............................................................................................................................................4.14.1 Glass Fabrication and Analysis................................................................................................ 4.1
4.1.1 Glass Fabrication ............................................................................................................. 4.14.1.2 Chemical Composition..................................................................................................... 4.74.1.3 Radiochemical Composition.......................................................................................... 4.14
4.2 Crystalline and Non-Crystalline Phase Determination .......................................................... 4.184.3 Release Rate, Modified Product Consistency Testing ........................................................... 4.23
5.0 Conclusions.......................................................................................................................................5.1
6.0 References.........................................................................................................................................6.1
Appendix A: LAW Radioactive Glass Analysis Data ............................................................................A.1
Appendix B: Crystalline and Non-Crystalline Phase Determination Data ............................................. B.1
Appendix C: Release Rate, Modified Product Consistency Test (PCT) Data ........................................ C.1

xi
FiguresFigure 3.1. Density Measurement of AN-107 Pretreated Waste Prior to Feed Preparation. AW-101
Pretreated Waste is in Plastic 1L Container in Center of Picture..........................................3.2Figure 4.1. AW-101 Melter Feed After Drying to Temperatures up to 330°C........................................4.2Figure 4.2. AW-101 Melter Feed in Platinum Crucible After Calcining.................................................4.3Figure 4.3. Final Pour of AW-101 Glass. ................................................................................................4.3Figure 4.4. AN-107 Feed with Foam Which Crusted on Top of the Dried Feed During the Initial
Drying Process. Note the 20-cm Long Stirring Spoon has Foam 80% Up the Handle........4.5Figure 4.5. AN-107 Feed During Exothermic Reaction. Note the Drainage of Material that
Adhered to Beaker Wall and the Cloudy, Frosted Appearance of the Beaker From Condensate During Reaction.................................................................................................4.6
Figure 4.6. The AN-107 Glass in The Process of the Final Pour Onto the Stainless Steel Pour Plate.The 20 ml Crucible for the Canister Centerline Cooling Heat Treatment is Red Hot with Freshly Poured Glass.....................................................................................................4.7
Figure 4.7. XRD Diffraction Profiles for Glasses AW-101 and AN-107 Showing General Amorphous Character with Superimposed Peaks Indicating a Contaminating Crystalline Phase Present in the Powder Sample as SEM and Optical Microscopy Results Showed no Crystalline Phases Present in Either Glass. .........................................4.18
Figure 4.8. XRD Diffraction Profiles for Glass AW-101 Showing General Amorphous Character with Superimposed Peaks Indicating a Crystalline Phase Present in the XRD Powder Sample Compared with the XRD Peaks Observed for a Section of the Poly Glove Material. The position of the peaks are identical indicating that the material ‘dusting’ the gloves is the material contaminating the glass powder. ................................................4.19
Figure 4.9. XRD Diffraction Profile for the Heat Treated AW-101 Glass Showing General Amorphous Character with out the Superimposed Peaks that Indicated a Crystalline Phase Present in the Initial Glass Powder Sample. The lack of sharp XRD peaks indicates that the glass is completely amorphous consistent with optical and SEM evaluations...........................................................................................................................4.20
Figure 4.10. Sodium Volatilization Believed to be Due to Electron Beam Heating of the Glass.The heating intensity of the beam would be inversely proportional to the area being analyzed...............................................................................................................................4.22
Figure B.1. Radioactive AW-101 Glass Powder X-Ray Diffraction Results for Glass Heated to Simulate the Calculated ILAW Centerline Cooling Curve of a LAW Canister of Glass2/5 of the Way from the Bottom of the Canister. Note the completely amorphous character of this profile. ....................................................................................................... B.2
Figure B.2. Radioactive AW-101 and AN-107 Glass Powder X-Ray Diffraction Results for Glass Heated to Simulate the Calculated ILAW Centerline Cooling Curve of a LAW Canister of Glass 2/5 of the Way from the Bottom of the Canister. Note the amorphous character of these profiles with crystal XRD peaks superimposed. These peaks weresubsequently found to match peaks from powder on the glove worn when these powder mounts were made up. See Figure B-3................................................................................. B.3
Figure B.3. Radioactive AW-101 Glass Powder X-Ray Diffraction Results for Glass Heated to Simulate the Calculated ILAW Centerline Cooling Curve of a LAW Canister of Glass 2/5 of the Way from the Bottom of the Canister. This initial XRD profile shows crystalline peaks that are identical with the XRD peaks produced by the mineral powder used to dust the gloves. ........................................................................................... B.4
Figure B.4. Radioactive AW-101 Glass SEM Micrograph from a Glass Sample Heated to Simulate the Calculated ILAW Centerline Cooling Curve of a LAW Canister.................................. B.5
Figure B.5. Radioactive AN-107 Glass SEM Micrograph from a Glass Sample Heated to Simulate the Calculated ILAW Centerline Cooling Curve of a LAW Canister.................................. B.5

xii
Tables
Table 3.1. Composition of Envelope A (AW-101) Cs IX Column Feed.................................................3.4Table 3.2. Composition of AN-107 (Envelope C) Pretreated Waste (Following Sulfate Removal)
from Fiskum et al. 2000 Report. .............................................................................................3.5Table 3.3. AW-101 and AN-107 Glass Former Additives. .....................................................................3.6Table 3.4. Temperature Profile Line Segments Used as Guidelines for Programming the Del Tech
Furnace Controller to Generate the Canister Centerline Cooling Profile. ..............................3.9Table 4.1. Chemical Analyses of AW-101 and AN-107 Radioactive Glasses ......................................4.10Table 4.2. Target Versus Measured Composition of AW-101 and AN-107 Radioactive Glasses ........4.11Table 4.3. Waste Loading/Dilution factors for LAW Waste Glass AW-101 .........................................4.13Table 4.4. Waste Loading/Dilution factors for LAW Waste Glass AN-107 ..........................................4.14Table 4.5. Radiochemical Composition of AW-101 and AN-107 Glasses............................................4.15Table 4.6. Contract Success Criteria Determination: Radionuclide Glass Content of the ILAW
Glass Product. .......................................................................................................................4.17Table 4.7. AN-107 Glass ‘As Measured’ and ‘Normalized’ Values Compared to the AN-107
Re-normalized Target Values. All Values Have Been Re-normalized to 100% Using Only the Ten Oxides Listed Below.......................................................................................4.22
Table 4.8. Comparison of 40°C PCT and 90°C PCT Results from the Low-Activity Test Reference Material (LRM) Glass Round Robin (Ebert and Wolf. 1999) with the Equivalent Values Found for the 40°C and 90°C PCT Tests Described in this Report......................................4.25
Table 4.9. Average 7-Day 40°C PCT Normalized Mass Loss Data Radioactive LAW Glasses from this Study ..............................................................................................................................4.25
Table 4.10. Comparison of Average 7-Day 90°C PCT Normalized Mass Loss Data Between VSL Non-radioactive Simulant Glasses and Actual Radioactive LAW Glass Counterpartsfrom this Study. LAWA23R and LRM Data is Provided for Comparison Purposes. .........4.25
Table A.1. Radioactive AW-101 Glass Chemical Composition Data. ...................................................A.2Table A.2. Radioactive AN-107 Glass Chemical Composition Data. ....................................................A.3Table A.3. Non-radioactive Analytical Reference Glass-1 (ARG-1 Glass Chemical Composition
Data).......................................................................................................................................A.4Table A.4. Radioactive AW-101 and AN-107 Glass Radiochemical Composition Data.......................A.5Table A.5. Radioactive AW-101 and AN-107 Glass Radiochemical Composition Data: GEA
Detection Limits. ...................................................................................................................A.6Table A.6. Radioactive AW-101 and AN-107 Glass Radiochemical Composition Data: ICP-MS. ......A.7Table C.1. Product Consistency Testing (PCT) Leachate Analysis Data. .............................................. C.2Table C.2. Product Consistency Testing (PCT) Leachate Analysis Data. .............................................. C.3Table C.3. Product Consistency Testing (PCT) Leachate Analysis Data. .............................................. C.4Table C.4. Product Consistency Testing (PCT) Leachate Analysis Data. .............................................. C.5Table C.5. Product Consistency Testing (PCT) Leachate Analysis Data. .............................................. C.6

1.1
1.0 Introduction
The U.S. Department of Energy (DOE) Office of River Protection (ORP) is acquiring Hanford tank waste treatment services at a demonstration scale. The River Protection Project Waste Treatment Plant (RPP-WTP) is responsible for producing an immobilized (vitrified) low-activity waste (ILAW) waste form. Pacific Northwest National Laboratory, hereafter referred to as PNNL, has been contracted by the RPP-WTP project to produce and test a vitrified LAW waste form from the Envelope A and C LAW samples previously supplied to the RPP-WTP project by DOE.
The U.S. Department of Energy currently has radioactive waste stored in underground storage tanks (USTs) at the Hanford site in southeastern Washington. One supernatant sample each was taken from two of the USTs. The particular tanks of interest (241-AW-101 and 241-AN-107) are of double-shell construction and are 1-million gallon in capacity. Most of the radioactivity was removed from the two supernate samples through pretreatment chemical separation processes, and the decontaminated supernates were processed into low-activity waste (LAW) glass. The AW-101 supernate sample was processed through the following unit operations to simulate the RPP-WTP project flowsheet: 1) dilution of the feed (Urie et al. 1999); 2) ultrafiltration to remove entrained solids (Brooks et al. 1999); 3) removal of 137Cs by ion exchange (Kurath et al. 2000a); and 4) removal of 99Tc by ion exchange (Blanchard et al. 1999). The AN-107 supernate sample was processed through the following unit operations to simulate the RPP-WTP project flowsheet: 1) dilution of the feed (Urie et al. 1999); 2) removal of Sr/TRU by precipitation (Hallen et al. 2000); 3) ultrafiltration to remove entrained solids and Sr/TRU precipitate (Hallen et al. 2000); 4) removal of 137Cs by ion exchange (Kurath et al. 2000b); 5) removal of 99Tc by ion exchange (Blanchard et al. 2000); and 5) removal of sulfate (SO4) by a precipitation process (Fiskum et al. 2000). Product testing of the LAW glass waste forms, as prescribed by the RPP-WTP project, was performed by PNNL to support Phase 1B deliverables.
The primary objective for vitrifying Envelope A (Tank AW-101) and Envelope C (Tank AN-107)pretreated waste samples was to characterize the glass produced from the crucible melts. Testing of the waste glasses produced from actual tank waste will also show compliance with the RPP-WTP contractual requirements such as chemical and radionuclide reporting, product loading, and dangerous waste limitations and organic content in the glasses.
The scope of this work was divided into 8 work elements: 1) Glass Fabrication, 2) Chemical Composition, 3) Radiochemical Composition, 4) Crystalline and Non-crystalline Phase Determination, 5) Release Rate (Modified PCT), 6) Dangerous Waste Limitations - Toxicity Characteristic Leaching Procedure (TCLP), 7) Total volatile organic and semi-volatile organic analyses, and 8) Regulatory Testing. This report will discuss the results for work elements 1 through 5. Results for work elements 6 through 8, i.e. VOA, SVOA, dioxins, furans, PCBs, and total cyanide analyses, will be presented in a later report (WTP-RPT-005).
1.1 Quality Assurance
This work was performed in PNNL’s Radiochemical Processing Laboratory (RPL), Building 325 and Building 326 in Richland, Washington. To provide the RPP-WTP project with quality products and services, PNNL established and implemented a quality assurance implementation plan for the River Protection Project-Waste Treatment Plant titled “BNFL Phase B-1 Support, Quality Assurance Planning Document,” document number BNFL-QAPjP. The work and results reported herein were conducted under the quality requirements of the Standards-Based Management System (SBMS) as delineated in Section 4.2 of BNFL-QAPjP, Rev. 0 and Section 4.4 of BNFL-QAPjP, Rev. 1. Specific SBMS quality assurance elements (subject areas) applied to this work included: Assessment Closure (Corrective Action Management), Calibration, Document Control, Inspections and Acceptance, Internal Operating

1.2
Procedures, Project Management, Property Management, Purchasing Goods and Services, Records Management for Project Files, Resolving Quality Problems, Suspect/Counterfeit Items and Misrepresented Products, Training and Qualification for Staff, and Work Practice.

2.1
2.0 Test Objectives
This work addresses RPP-WTP contract requirements to demonstrate the contractors ability to satisfy the immobilized low activity waste (ILAW) product requirements (specification 2 of the RPP-WTPcontract) with samples of LAW.
Test Objectives:
The primary objective for vitrifying the LAW sample is to generate a glass product for subsequent product testing. Testing will seek to demonstrate the RPP-WTP projectsability to satisfy the product requirements concerning:
• Chemical and radionuclide reporting.
• Waste loading.
• Identification and quantification of crystalline and non-crystalline phases.
• Waste form leachability.
• Dangerous Waste Limitations.
Success Criteria:
The primary success criteria are associated with the product requirements:
• Identification and quantification of those chemical constituents present at concentrations greater than 0.5 wt%.
• Identification and quantification of those radionuclides (current and indexed to December 31, 2002) identified as significant in NUREG/BR-0204 and 49CFR 172.101 (Table 2). 99Tc shall be considered significant at concentrations greater than 0.003 Ci/m3.
• The concentrations of 137Cs, 90Sr, 99Tc and transuranic (TRU) radionuclides shall be less than 3 Ci/m3, 20 Ci/m3, 0.1 Ci/m3 and 100 nCi/g, respectively. [Note: The ORP Contract Specification 2, Immobilized Low-Activity Waste, Section 2.2.2.8, Radionuclide Concentration Limitations, states: “The average concentrations shall be calculated by summing the actual inventories of each of the above radionuclides in the packages that have been presented to date for acceptance and dividing by the total volume of waste in these packages. The Contractor shall remove on average a minimum of 80% of the 99Tc present in the feed.”]
• The concentration of waste sodium oxide shall be greater than 16 wt%. [Note: The ORP Contract Specification 2, Immobilized Low-Activity Waste, Section 2.2.2.2, Waste Loading, states: “The loading of waste sodium from Envelope A in the ILAW glass shall be greater than 14 weight percent based on Na2O. The loading of waste sodium from Envelope B in the ILAW glass shall be greater than 5.0 weight percent based on Na2O. The loading of waste sodium from Envelope C in the ILAW glass shall be greater than 10 weight percent based on Na2O.”]
• Identification and quantification of crystalline and non-crystalline phases.
• The normalized release rates of sodium, silicon and boron multiplied by the percentage of feed 99Tc remaining in the glass or 20%, whichever is greater, shall be less than those measured for glass LAWA23 from RPP-WTP project, Part A measured at the same conditions (40oC and 90oC).
2.2
• The normalized mass loss of sodium, silicon, and boron shall be measured using a seven-dayPCT run at 90°C as defined in ASTM C1285-98. The test shall be conducted with a glass to water ratio of 1 gram of glass (-100 +200 mesh) per 10 milliliters of water. The normalized mass loss shall be less than 2.0 grams/m2. Qualification testing shall include glass samples subjected to representative waste form cooling curves. The PCT shall be conducted on waste form samples that are statistically representative of the production glass.

3.1
3.0 Experimental Method
3.1 Glass Fabrication and Analysis
Two pretreated tank supernate, low-activity wastes (AW-101 and AN-107) along with a process simulant (termed the Process Blank) were prepared as melter feeds for vitrification. The analyzed compositions of the pretreated AW-101 and AN-107 wastes were used by Catholic University of America’s Vitreous State Laboratory to calculate the target glass composition, which was forwarded to PNNL to prepare the batch processing spreadsheets to prepare the waste glass feed.
3.1.1 Glass Fabrication
Before vitrification of the pretreated AW-101 and AN-107 waste samples a “process blank” simulant glass product was made mimicking the process used to make the AW-101 and AN-107 glass samples.The “process blank” glass was processed using a simulant AW-101 pretreated waste sample and the same glass former minerals that were used to make the actual radioactive AW-101 waste glass. This glass will be analyzed for volatile and non-volatile organics (VOA and SVOAs), dioxins and furans, polychlorinated biphenyls (PCBs), and total cyanide along with both of the actual radioactive AW-101and AN-107 waste glasses to ensure the glass processing procedure did not introduce any organic contaminants. The VOA, SVOA, dioxins, furans, PCBs, and total cyanide analyses will be reported in a separate document (WTP-RPT-005).
The pretreated AW-101 and AN-107 waste was blended with glass forming additives. However, prior to melter feed preparation, the densities of the pretreated LAW solutions were checked to determine any weight change between the pretreatment process and the initiation of vitrification processing (see Figure 3.1). The composition of the pretreated AW-101 waste is provided in Table 3.1; the glass target composition is provided in Table 4.2. See Urie et al. 1999a and 1999b for the analyses of AW-101and AN-107 tank waste prior to pretreatment. The composition of the pretreated AN-107 waste is provided in Table 3.2; the glass target composition is provided in Table 4.2. The glass former minerals used for both LAW glass melts are provided in Table 3.3. Each mineral component was weighed on a balance capable of accurately measuring to 10 mg. The mineral additives were weighed and combined as dry powders and mixed in an agate milling chamber for several minutes. The exact amount of the mineral batch needed to combine with the waste was then weighed out from the blended minerals.

3.2
Figure 3.1. Density Measurement of AN-107 Pretreated Waste Prior to Feed Preparation. AW-101Pretreated Waste is in Plastic 1L Container in Center of Picture.
Combining of the waste and mineral additives together occurred by pouring the liquid LAW slurry in a 2 L glass beaker containing a magnetic stir bar. The slurry was heated and stirred on a hot plate to evaporate water. While heating and stirring, the mineral additives were slowly added into the vortex of the slurry. Mixing was vigorous so solids from the mineral additives could not settle. The heating / stirring process took three to five hours to thicken the batch to the point the stir bar would no longer rotate. Hand blending was used until the batch was dry; this took an additional two to three hours to complete. Each batch was dried further in an oven by slowly increasing the temperature from approximately 100 to 400°C over a 48 to 72 hour period. The dry cake that was produced was hard and brittle. The blended and dried feed was then added to a 500 cc Pt-10% Rh crucible, placed into a furnace at 600ºC and calcined. The calcination process began at 600°C, increased at 25°C intervals to 650°C where it was held for more than two hours. The crucible was removed, the furnace temperature increased to 1150°C and the batch melted approximately 1 hour with lid on. The glass melt was then poured onto a stainless steel plate. The subsequent glass was crushed to a fine powder (<100 µm) and mixed to ensure homogeneity using a tungsten carbide disc mill. The crushed glass was placed back into the Pt-Rhcrucible, covered with a lid, and remelted at 1150ºC for approximately 60 min. During the final molten glass pour, a portion of the pour went into a small crucible (about 20 mL) to be heat treated following the predicted canister centerline cooling (CCC) heat treatment of a LAW canister of glass 2/5 of the way from the bottom of the canister (see Section 3.2 for details). The remaining portion of the glass was quenched on the stainless steel plate, cooled to room temperature, and handled in a manner to keep the glass free of organic contamination. All glass samples were stored in glassware cleaned to EPA standards. Note: There was no CCC heat-treated glass sample for the Process Blank.

3.3
Vitrification of slurry melter feed in an actual liquid-fed ceramic melter (LFCM) progresses continuously through 3 distinct stages, drying, calcining and melting. Under steady-state operating conditions, the aqueous slurry that is introduced into the high-temperature melter environment spreads out over an existing cold cap where it dries and becomes part of the melter cold-cap structure. This dried material begins working it’s way down through the cold-cap as it becomes submerged in incoming feed while, at the same time, material, at the molten-glass/cold-cap interface, is dissolving into the glass melt.During this continuous progression through the cold cap, the temperature that the feed is subjected to monotonically increases from the boiling point of water (~100 °C) to molten glass temperatures (~1150 °C). Accompanying this continuous physical and thermal transition, inorganic eutectic salts are slowly converted to their oxide forms (calcined) that are suitable for subsequent incorporation into the melter’s molten glass pool.
All of these discrete phases of liquid-fed ceramic melter feed processing have been faithfully reproduced in the crucible studies performed. What may not be truly represented, however, is the complex stages and nature of the cold-cap chemistry that results in the calcination of the feed material. For non-volatile,inorganic feed constituent, the differences between crucible and melter vitrification conditions are inconsequential. For all other feed components, cold-cap chemistry can influence both partitioning behavior and chemical byproduct yields, which, in turn, can and will affect the resultant glass product.
Consequently to properly represent an LFCM glass product, actual physical and chemical processing conditions need to be replicated. But since this requires the development of a representative cold-capstructure, nothing short of a liquid-fed melting process (e.g., scaled melter or possibly a gradient furnace test) is truly adequate. However, relationships drawn between previous crucible and actual melter testing results, i.e. from VSL and GTS Duratek testing, that were conducted using a fixed feed may be useful in extracting reference glass-product quality parameters from extrapolated crucible test data.
3.4
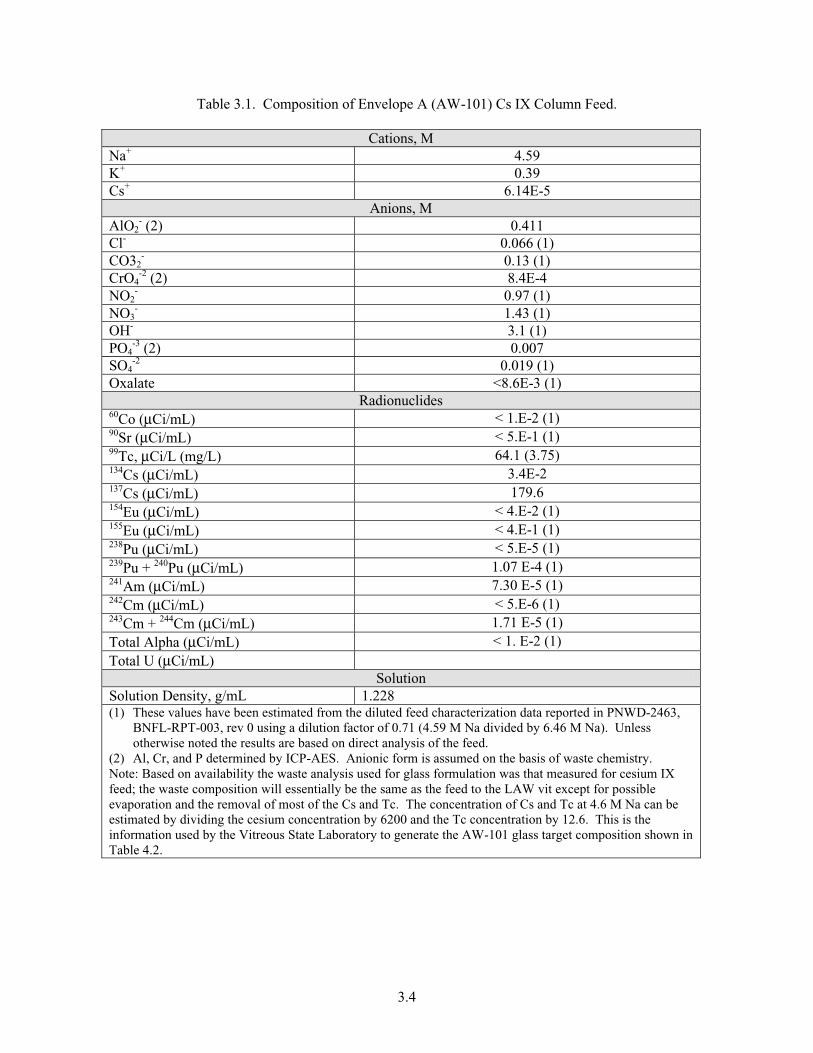
Table 3.1. Composition of Envelope A (AW-101) Cs IX Column Feed.
Cations, MNa+ 4.59K+ 0.39Cs+ 6.14E-5
Anions, MAlO2
- (2) 0.411Cl- 0.066 (1)CO32
- 0.13 (1)CrO4
-2 (2) 8.4E-4NO2
- 0.97 (1)NO3
- 1.43 (1)OH- 3.1 (1)PO4
-3 (2) 0.007SO4
-2 0.019 (1)Oxalate <8.6E-3 (1)
Radionuclides60Co (µCi/mL) < 1.E-2 (1)90Sr (µCi/mL) < 5.E-1 (1)99Tc, µCi/L (mg/L) 64.1 (3.75)134Cs (µCi/mL) 3.4E-2137Cs (µCi/mL) 179.6154Eu (µCi/mL) < 4.E-2 (1)155Eu (µCi/mL) < 4.E-1 (1)238Pu (µCi/mL) < 5.E-5 (1)239Pu + 240Pu (µCi/mL) 1.07 E-4 (1)241Am (µCi/mL) 7.30 E-5 (1)242Cm (µCi/mL) < 5.E-6 (1)243Cm + 244Cm (µCi/mL) 1.71 E-5 (1)Total Alpha (µCi/mL) < 1. E-2 (1)Total U (µCi/mL)
SolutionSolution Density, g/mL 1.228(1) These values have been estimated from the diluted feed characterization data reported in PNWD-2463,
BNFL-RPT-003, rev 0 using a dilution factor of 0.71 (4.59 M Na divided by 6.46 M Na). Unless otherwise noted the results are based on direct analysis of the feed.
(2) Al, Cr, and P determined by ICP-AES. Anionic form is assumed on the basis of waste chemistry.Note: Based on availability the waste analysis used for glass formulation was that measured for cesium IX feed; the waste composition will essentially be the same as the feed to the LAW vit except for possible evaporation and the removal of most of the Cs and Tc. The concentration of Cs and Tc at 4.6 M Na can be estimated by dividing the cesium concentration by 6200 and the Tc concentration by 12.6. This is the information used by the Vitreous State Laboratory to generate the AW-101 glass target composition shown in Table 4.2.

3.5
Table 3.2. Composition of AN-107 (Envelope C) Pretreated Waste (Following Sulfate Removal) from Fiskum et al. 2000 Report.
Inorganic Analytes: Average Pretreated WasteAnalyte µµg/mL Analyte µµg/mL Analyte µµg/mL
AgAlAsBBa
<0.68768<6.81.2109
FeKLaLiMg
2.8751
<1.36<0.82<2.7
SbSeSiSnSr
<13.6<6.8
<13.6<40.8
7.0BeBiCaCdCe
<0.27<2.788622.2<5.4
MnMoNaNdNi
<1.3613.3
94675<2.7176
TeThTiTlU
<40.8<27
<0.68<13.62.9(a)
CoCrCuDyEu
1.76.410.6
<1.36<2.7
PPbPdRhRu
42.522.3
<20.4<8.2
<29.9
VWYZnZr
<1.3658
<1.364.4
<1.36Ion Chromatography & Oxidation Analytes: Average Pretreated Waste
Analyte µµg/mL Analyte µµg/mL Analyte µµg/mLBrClF(b)
NO2
NO3
< 500< 500300029550173000
C2O4
PO4
SO4
TICTOC
< 1000< 1000
9702070
13100
NH3 6.5
Radiochemistry: Average Pretreated WasteAnalyte µµCi/ mL Analyte µµCi/mLCo-60Nb-95Y-88
Sn-113Sb-125
3.96E-021.09E-03< 2.4e-45.59E-05< 8.4e-5
Se-79Sr-90Tc-99
Np-237Pu-239
< 2e-62.43E-034.90E-021.22E-053.88E-04
SnSb-126Cs-137Eu-154Eu-155Am-241
< 3.6e-57.33E-023.10E-032.17E-031.35E-03
Total alpha < 2e-3
<x.xx = indicates that the analyte is below the detection limit, detection limit value is provided for those analytes.(a) = U determined by kinetic phosphorescence. (b) = F results are suspect due to peak distortion and retention time shift.Radioisotope reference date is 11/1/99; data is from Fiskum, et al. 2000.NOTE: Pretreated waste properties: density = 1.2064 g/mL; volume = 484.4 mL; mass = 584.4 g.

3.6
Table 3.3. AW-101 and AN-107 Glass Former Additives
OxideNeeded
Source CompanyAddress & tel.
GradeIdentification
wt% of the oxide
Principalother oxides
present
Al2O3 Raw KyaniteAl2SiO5
Kyanite Mining Corp.Dillwyn VA 23936tel. (804) 983-2043
Raw Kyanite325 MESH
54% Al2O3 43.7% SiO2
0.4% Fe2O3
B2O3 Orthoboric AcidH3BO3
US Borax Inc.26877 Tourney RoadValencia, CA 91355tel. (660) 287-5400
TechnicalGranular
56.3% B2O3 None above 0.01wt%
CaO WollastoniteCaSiO3
NYCO Minerals124 Mountain View Dr.Willsboro, NY 12996tel. (403) 260-9883
Powder untreatedNYAD® 325 47.5% CaO
51.0% SiO2
0.4% Fe2O3
Fe2O3 Red Iron OxidePigmentFe2O3
The Prince Manufacturing Co.1 Prince Plaza, P.O. Box 1009Quincy, IL 62306tel. (217) 222-8854
Red Iron Oxide5001
97% Fe2O3 1.50% Al2O3
1.35% SiO2
MgO Olivinemainly ForsteriteMg2SiO4 plusFayalite Fe2SiO4
UNIMIN Corporation258 Elm StreetNew Canaan, CT 06840(203) 966-8880
OlivineGrade 180Green Mountain, NC
48.01 wt% MgO
42.52 wt% SiO2
7.68 wt% Fe2O3
SiO2 Ground SilicaSandSiO2
US Silica Company P.O. Box 187Berkeley SpringsWV, 25411-0187tel. (800) 243-7500
SIL-CO-SIL® 75 99.5% SiO2 0.3% Al2O3
ZrO2 Zircon SandZirconium silicateZrSiO4
American Minerals Inc.901 E. 8th Ave., Suite #200King of Prussia, PA 19406tel. (610) 337-8030
FLOUR 325 MESH
66% ZrO2
(+HfO2)34 % SiO2
ZnO Zinc Oxide ZnO
Zinc Corporation of America300 Frankfort RoadMonaca, PA 15061tel. (724) 774-1020
KADOX-920 99.8% ZnO None above 0.01wt%
TiO2 Rutile OreTiO2
Chemalloy CompanyP.O. Box 350 Bryn Mawr, PA 19010tel. (610) 527-3700
Premium Grade Rutile OreAirfloated
95.4% TiO2 0.91% SiO2
0.90% ZrO2
0.71% Fe2O3
0.41% V2O5

3.7
Test Equipment
Envelope A and B radioactive, blended waste, and additives feed were dried in a Blue-MStabil-Therm Gravity drying oven, and calcined and melted in a custom-made Del Tech high-temperaturefurnace equipped with a Eurotherm programmer/controller and the temperature monitored with a calibrated Type K thermocouple and an Omega, Model 660 thermocouple readout. Vitrification was completed in a 450-mL platinum/10% rhodium crucible.
The Angstrom Disc Mill with a 100-mL tungsten carbide grinding chamber were used to crush and mix the glass, and 3-in.-diameter stainless-steel sieves were used to sieve glass samples.
3.1.2 Chemical Composition
Chemical composition of the two LAW glasses (i.e., elements {excluding oxygen}) present in concentrations greater than 0.5 percent by weight) were measured in duplicate along with an ARG-1powdered glass reference standard (Smith 1993) using a sodium peroxide (Na2O2) fusion, according to procedure PNL-ALO-114, and a potassium hydroxide (KOH) fusion, according to procedurePNL-ALO-115. Analytical Reference Glass-1 (ARG-1) is a compositionally well-characterized glass and provides an excellent independent check of the analytical processes and results. The KOH fusion uses a nickel crucible and the Na2O2 fusion uses a zirconium crucible. Cation analysis was performed using Inductively Coupled Plasma-Atomic Emission Spectrometry (ICP-AES). An analytical process blank (not to be confused with the AW-101 simulant glass Process Blank) was prepared similarly at the same time as the above samples. Approximately 0.1 grams of sample was processed and diluted to a final volume of about 100 ml (the final solution volume was weighed and density corrected to a volume). All sample material after processing appeared to go into solution (no apparent residue remained in fusion crucibles or as precipitate in final solution). Analytical dilution of 5, 10, and 50-fold were prepared for each fusion preparation and analyzed by ICP-AES. The fusion procedure was modified slightly by including additional hydrochloric acid to assist solubilization of silver, if present. Before ICP-AESanalysis a small amount (0.1 ml) of hydrofluoric acid was added to the prepared samples.
A portion of the ALO-114 (sodium peroxide) fusion prepared samples was submitted for radiochemical analysis and Inductively Coupled Plasma-Mass Spectrometry (ICP-MS) analysis (see Section 3.1.3 Radiochemical Composition). No hydrofluoric acid was added to the aliquots submitted for radiochemistry or ICP-MS analysis.
Test Equipment
Cation analysis of the leachate solutions was completed using a Thermo Jarrell-Ash, Model 61 inductively coupled argon plasma spectrometer according to procedure PNL-ALO-211.
3.1.3 Radiochemical Composition
Radiochemical analyses were performed on each ILAW product, i.e. AW-101 and AN-107glasses. Analyses included 137Cs by gamma emission spectroscopy (GEA), 90Sr, 99Tc, 238Pu, 239Pu, 240Pu,237Np, 241Am and 244Cm. Concentration values of additional gamma emitters (i.e., Cr-51, Fe-59, Se-79,Nb-95, Ru-103, Sn-113, and Eu-152) that may be obtained by GEA, depending on concentrations and detection limits, were also looked for but not detected.
Samples of powdered waste glass AW-101 and AN-107 were analyzed for gamma emitters, 90Sr,Pu, and Am/Cm. Duplicate samples of the powdered waste glass were solubilized in the laboratory using a Na2O2-NaOH fusion in a Zr crucible according to procedure PNL-ALO-114. About 0.1 g of material

3.8
was fused and then dissolved in acid and brought to a volume of 100 ml. This fused material preparation was sampled directly for gamma energy analysis (GEA). A 10-ml aliquot was evaporated to dryness to remove Cl-, then brought back to volume and filtered through a 0.45-micron filter. This matrix-adjustedmaterial was used for Pu, Am, Cm, and Sr analyses. Where appropriate, relatively large sample sizes were taken for analysis to obtain lower detection limits. Ten ml aliquots of the fused sample material were directly gamma counted for 14 hours on high-efficiency Ge detectors according to procedure PNL-ALO-450.
The Pu and Am/Cm separations were performed on a 4-ml fusion aliquot according to procedure PNL-ALO-417. The separated fractions were precipitation plated according to PNL-ALO-496, and the samples were counted by alpha spectrometry according to PNL-ALO-422. Plutonium recovery was traced with 242Pu. The curium is known to follow the americium and both these isotopes were traced with 243Am.
The Sr separation was performed according to PNL-ALO-476 and radiochemical yields were traced with 85Sr. The separated fractions were then beta-counted according to RPG-CMC-408 and gamma counted according to PNL-ALO-450 (for 85Sr determination and 137Cs impurity assessment).
Samples of both AW-101 and AN-107 were analyzed using a radioactively-contained inductively coupled plasma mass spectrometer (ICP-MS) for 99Tc, 237Np, 239Pu, and 240Pu according to PNL-ALO-280, PNL-ALO-281, and PNL-ALO-282. Dilutions of Isotope Products standards for 237Npand 239Pu and an Amersham 99Tc standard were used to generate calibration curves. Independent standards of each analyte were used as the initial calibration verification (ICV) standard. The 1% high-purity nitric acid solution used to dilute the standards and samples was used as a reagent blank.
Test Equipment
Test equipment conformed to that required to carry out the PNL-ALO and RPG-CMC procedures called out above.
3.2 Crystalline and Non-Crystalline Phase Determination
Crystalline and non-crystalline phases were identified and measured using x-ray diffraction (XRD), optical microscopy, and scanning electron microscope (SEM). Twenty grams of heat-treated glass was available. The heat treatment was prescribed by the RPP-WTP project (see below) (Arm, 1999). Thecooling curve, supplied by the RPP-WTP project, required to simulate the calculated ILAW centerline cooling curve of a LAW canister of glass 2/5 of the way from the bottom of the canister was approximated by a series of eight (8) linear time-temperature segments. A programmable furnace was used to duplicate the series of eight (8) linear time-temperature segments.
Each heat-treated glass was examined using optical microscopy, both with a metallurgical microscope (magnification from 10× to 70×) and a transmitting light microscope (magnification at 100×to 250×).
Powder XRD was also used to characterize the heat-treated glass samples. The two-theta scan range was from 5 to 75 degrees at a step size of 0.04 degrees with a minimum of 2-second dwell at each step. Both the AW-101 and AN-107 glasses were powdered in a tungsten carbide grinding chamber using a disc mill. An approximately 100 mg sample of each glass was mounted on a plastic XRD sample mount, leveled to X-ray beam height, encapsulated in Mylar film, transported to XRD facility, and analyzed.

3.9
Scanning electron microscopy (SEM) was also used to characterize the heat-treated AW-101 and AN-107 glass samples. Approximately 1 square cm by 4 mm thick samples of the LAW glasses were polished and then mounted on aluminum SEM specimen holders for microscopy. Both glass samples were polished to a minimum of 600 grit. Each mount was then coated with a gold film and examined at low magnification (15× and 100×) and higher magnifications such as 500×, 1000×, 3000×, 10,000×, and 20,000×.
Canister Centerline Cooling Heat-treatment
Samples of both LAW glasses (AW-101 and AN-107) were given a slow cool down heat treatment which simulates the cooling profile for glass at the center line of a canister been filled with a waste glass and allowed to cool to ambient temperature. The immobilized low activity waste (LAW) stainless steel canisters are basically right circular cylinders 2.29 m in height and 1.22 m in diameter. Glass canister filling was modeled with a batch target fill rate of 2,080 kg/hr (50 MT/day) for 45 minutes at a temperature of 1150ºC. Based on the canister configuration and fill rate, the RPP-WTP project provided a model calculation of the cooling curve for the centerline of a canister of glass 2/5 of the way from the bottom of the canister. This model curve was approximated by a series of linear time-temperature segments that a programmable furnace duplicated. Table 3.4 below gives the set of linear time-temperature segments, which were duplicated by the furnace to within ± 4-5 ºC at all points along the profile.
Table 3.4. Temperature Profile Line Segments Used as Guidelines for Programming the Del Tech Furnace Controller to Generate the Canister Centerline Cooling Profile.
Hours Temperature (ºC) dT/dt(deg./hr)0.06 - 0.6 1021.26 -1000.95 -37.600.6 -1.80 1000.95 - 976.94 -20.01
1.80 - 2.80 976.94 - 969.68 -7.262.80 - 9.00 969.6 - 964.16 -0.89
9.00 - 16.00 964.16 - 909.73 -7.7816.00 - 24.00 909.73 - 780.63 -16.1424.00 - 38.00 780.63 - 536.13 -17.4638.00 - 48.60 536.13 - 396.59 -13.16
The furnace used was the same Del Tech used to melt the glasses originally. The heat treated samples consisted of about 70 grams of glass melt which was poured from the initial melt into a cubic crucible of Pt-Rh foil. These samples were returned to the furnace as soon as it was ready to run the model canister centerline cooling (CCC) profile. After the heat treatment, each sample was sectioned perpendicular to the melt surface. From these sections specimens were produced, which were evaluated by optical microscopy and scanning electron microscopy using an energy dispersive spectroscopy (SEM-EDS) analyzer.

3.10
Testing and Test Sample Evaluation Equipment
Glass samples were cut and polished with a Beuhler diamond saw and polishing equipment.Optical microscopy was completed using an Olympus PMG-3 microscope. An SEM (Model VG Elemental Shielded PQ2) with EDS capabilities was used to look for phase and chemical inhomogeneities. XRD was performed using a model SCINTAG PAD V x-ray diffractometer employing Cu K radiation (1.54056 ) with a scan increment of 0.05° and a dwell time of 40 to 52 seconds.
3.3 Release Rate, Modified Product Consistency Testing
The ultimate objective for immobilization of the low activity waste is to incorporate and convert the radioactive and hazardous components into a solid glassy waste form that will resist their release to the environment in a Hanford near-surface burial ground. This resistance of the waste form to release deleterious environmental components is defined by measuring its chemical durability, i.e. the resistance of the glass to react with the aqueous environment expected in the glass disposal site. However, to mimic the mean temperature, amount and frequency of available ground waster, etc. expected in the near-surfacerepository would require a great amount of testing time to be able to detect glass dissolution. Therefore, an accelerated chemical durability test, the Product Consistency Test (PCT), is employed to gauge the ILAW glass chemical durability. The PCT was run at 40 and 90°C, using glass samples given a slow cool down heat treatment which simulates the cooling profile for glass at the center line of a canister being filled with a waste glass and allowed to cool to ambient temperature, to determine the normalized release of sodium, silicon, and boron. The low-activity test reference material (LRM) standard glass was included in these tests to provide a reliable baseline of results by which to judge the quality of the PCT results for the AW-101 and AN-107 glasses.
PCT on the AW-101, AN-107 and glass samples were completed using ASTM C1285-97“Standard Test Methods for Determining Chemical Durability of Nuclear, Hazardous, and Mixed Waste Glasses: The Product Consistency Test (PCT).” A brief summary of the steps followed is provided here.Crushed glass of a particle size between 75 and 150 µm (-100 to +200 mesh) was used for testing. The glass was ground in a tungsten carbide grinding chamber and then sieved through 100- and 200-meshstainless steel sieves. The crushed glass was cleaned by washing in deionized water (DIW) and ethanol using an ultrasonic cleaner. It was then dried and weighed, and approximately 1.5 g of glass was added to a 22-mL desensitized Type 304L stainless steel container filled with 15 mL of DIW. The glass was precisely weighed and the leachant volume precisely controlled to achieve a solution volume to glass mass ratio of 10 mL/g glass. The ratio of the surface area of the sample to leachant volume is estimated to be 2000 m-1. The container and their contents were held (without agitation) at 40 or 90ºC for 7 days, for each of the two PCT conducted with each glass sample. The initial and final pH values of the solution were taken. Aliquots of the solution were filtered through a 0.45-µm filter and submitted for ICP analysis. Results are reported as normalized elemental mass releases. The low-activity test reference material (LRM) was included in these tests (Ebert and Wolf. 1999). It has been extensively tested for the PCT and gives a reliable baseline of results by which to judge the quality of the PCT that have been run for AW-101 and AN-107.
All tests were run without deviation from the procedure described above except for the temperature profile for the 40°C test. During the first 17 hours the temperature drifted upward to about 46°C before the operator was able to bring the temperature down to 40°C and get the furnace to control at 40°C for the remainder of the test. Since the LRM glass was included in the test, its behavior relative to its expected behavior at 40°C was compared to see if there was significant deviation due to the initial temperature excursion.

3.11
Test Equipment
PCT vessels, made of desensitized 304L stainless steel, were cleaned following ASTM C 1285-97, including the lids. DIW was taken from a Barnstead, Nanopure II water purifier. An Orion Research, Model 7201A digital ion analyzer was used to measure the pH. The pH meter was calibrated using VWR brand buffer solutions of pH 4.00, 7.00, and 10.00. Leach vessels used were 22-mL screw-cap bombs fabricated from 304L stainless steel. Blue M ovens were used for both 40 and 90°C PCT testing.
Analysis of the leachate solutions was completed using a Thermo Jarrell-Ash, Model 61 inductively coupled argon plasma spectrometer according to procedure PNL-ALO-211.

4.1
4.0 Results
4.1 Glass Fabrication and Analysis
Three glass samples (AW-101, AN-107, and the Process Blank) were successfully processed and melted into a LAW glass form. These glasses were prepared for chemical and radiochemical composition determination.
4.1.1 Glass Fabrication
Feed Preparation and Vitrification of the Process Blank Glass
A surrogate AW-101 simulant LAW solution was made from sodium nitrite and nitrate and sodium and potassium hydroxide. These compounds were dissolved in about 350 mL of water in a 2 L glass beaker. The mineral additives (Kyanite (Al2SiO5); orthoboric acid, (H3BO3); Wollastonite (CaSiO3); Red Iron Oxide Pigment (Fe2O3); Olivine (Mg2SiO4); Silica sand (SiO2); Rutile Ore (TiO2);Zinc Oxide (ZnO); Zircon sand (ZrSiO4); and sugar) stirred into the waste solution easily as it was heating to evaporate water. When the feed had caked into a solid material, further drying of the feed took place in an oven over several days starting at about 120°C and ending at about 140°C. Dried clumps were removed from the 2 L beaker , placed into a 400mL beaker put into a furnace, and dried using ramp heating starting at 170°C and slowly increased to 370°C over 46 hours. The dried batch was a tan color, with light and dark shades.
The dried batch was added to a 500 cm3 platinum 10% rhodium crucible and calcined for 2.5 hours starting at 600°C. After several hours at 650°C the calcined material was removed from the furnace and cooled. The furnace was heated to 1150°C and the calcined batch added back into it. Initial melting was vigorous, with large bubbles (3 to 4 cm diameter) rapidly forming and bursting; volatilization was observed, but foaming was minimal. Crucible was covered with a lid, batch melted for one hour then poured at a viscosity of about 5 Pa· s onto a stainless steel plate. The glass was crushed in a 100 cm3
tungsten carbide grinding chamber, added back into the crucible, and melted for another hour. The glass poured well with no observed volatilization or bubbles and with an apparent viscosity of 5 Pa· s based upon past experience. The glass was processed and stored using clean metal and glass tools and containers, with no organic or plastic materials touching the glass.
Feed Preparation and Vitrification of the AW-101 Glass
A density determination was made of AW-101 pretreated waste just before feed preparation. The density was measured to be 1.23 g/cm3, which was the same as the measurement made after pretreatment of the waste. This waste had no precipitate present. A portion of the waste, 604.4 g, was measured into a 2 L glass beaker, stirred and heated for 2.5 hours on a stirrer / hot plate to evaporate water. Glass former additives (Kyanite (Al2SiO5); Orthoboric acid, (H3BO3); Wollastonite (CaSiO3); Red Iron Oxide Pigment (Fe2O3); Olivine (Mg2SiO4); Silica sand (SiO2); Rutile Ore (TiO2); Zinc Oxide (ZnO); Zircon sand (ZrSiO4); and sugar) were added about half way through the heating process. Stirring stopped when slurry became too thick for the magnetic stirrer to spin.

4.2
The batch was dried in an oven at 100°C over night, but a thin elastic film developed which prevented water from evaporating. The batch was continually heated in the oven at about 140°C with occasional hand stirring for six hours. The slurry hardened into a cake, which had to be heated on the hot plate to loosen it from beaker wall. The hard, dry cake was removed from beaker, broken, and placed in a 400 cm3 beaker. The batch was ramp heated to 330°C for 32 hours, cooled to 180°C, and held for about 72 hours. The dried cake was light brown to light tan in color (see Figure 4.1).
Figure 4.1. AW-101 Melter Feed After Drying to Temperatures up to 330°C.
The dried batch was placed into a 500 cc platinum 10% rhodium crucible and calcined for about 2.5 hours starting at 586°C and increasing the temperature to 682°C. At 640°C the batch appeared dark gray in color and had become very dry and brittle, easily crumbling when lightly touched with tongs. At 682°C, the batch began to sinter and foam (see Figure 4.2).
The AW-101 feed was melted at 1150°C. Initially the feed had a difficult time fusing into a melt; there was foaming, volatile fumes observed, thick elastic skin on melt surface, and lots of bubbles thatwere having difficulty bursting. Once the feed had melted, the viscosity of the melt was about 5 Pa· s.After one hour, the melt was poured on a stainless steel plate, cooled, crushed to a fine powder in a 100 cm3 tungsten carbide grinding chamber, added back into the crucible, and melted for an hour. The final melt pour was excellent, with the viscosity of the melt at about 5 Pa· s, bubbles present in the meniscus burst while being poured, and no volatile fumes were observed. The first portion of the pour went into a 2.54 cm3 box crucible for the canister centerline cooling test and the remainder of the melt was quenched on a stainless steel plate (see Figure 4.3). As seen in Figure 4.3, the box crucible for canister centerline cooling heat treatment is glowing red with hot, freshly poured glass. The slab of glass on the stainless steel pour plate has cooled but not broken from thermal shock because it is still above the glass transition temperature.

4.3
Figure 4.2. AW-101 Melter Feed in Platinum Crucible After Calcining.
Figure 4.3. Final Pour of AW-101 Glass.
4.4
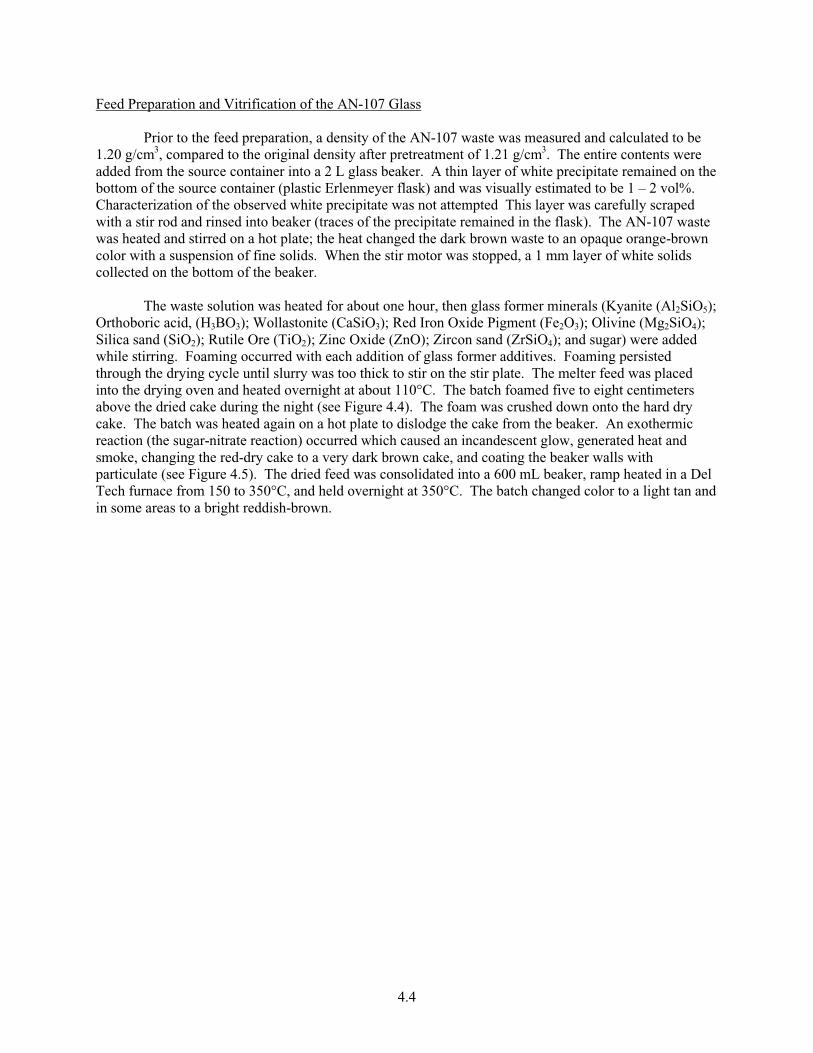
Feed Preparation and Vitrification of the AN-107 Glass
Prior to the feed preparation, a density of the AN-107 waste was measured and calculated to be 1.20 g/cm3, compared to the original density after pretreatment of 1.21 g/cm3. The entire contents were added from the source container into a 2 L glass beaker. A thin layer of white precipitate remained on the bottom of the source container (plastic Erlenmeyer flask) and was visually estimated to be 1 – 2 vol%.Characterization of the observed white precipitate was not attempted This layer was carefully scraped with a stir rod and rinsed into beaker (traces of the precipitate remained in the flask). The AN-107 waste was heated and stirred on a hot plate; the heat changed the dark brown waste to an opaque orange-browncolor with a suspension of fine solids. When the stir motor was stopped, a 1 mm layer of white solids collected on the bottom of the beaker.
The waste solution was heated for about one hour, then glass former minerals (Kyanite (Al2SiO5);Orthoboric acid, (H3BO3); Wollastonite (CaSiO3); Red Iron Oxide Pigment (Fe2O3); Olivine (Mg2SiO4);Silica sand (SiO2); Rutile Ore (TiO2); Zinc Oxide (ZnO); Zircon sand (ZrSiO4); and sugar) were added while stirring. Foaming occurred with each addition of glass former additives. Foaming persisted through the drying cycle until slurry was too thick to stir on the stir plate. The melter feed was placed into the drying oven and heated overnight at about 110°C. The batch foamed five to eight centimeters above the dried cake during the night (see Figure 4.4). The foam was crushed down onto the hard dry cake. The batch was heated again on a hot plate to dislodge the cake from the beaker. An exothermic reaction (the sugar-nitrate reaction) occurred which caused an incandescent glow, generated heat and smoke, changing the red-dry cake to a very dark brown cake, and coating the beaker walls with particulate (see Figure 4.5). The dried feed was consolidated into a 600 mL beaker, ramp heated in a Del Tech furnace from 150 to 350°C, and held overnight at 350°C. The batch changed color to a light tan and in some areas to a bright reddish-brown.

4.5
Figure 4.4. AN-107 Feed with Foam Which Crusted on Top of the Dried Feed During the Initial Drying Process. Note the 20-cm Long Stirring Spoon has Foam 80% Up the Handle.

4.6
Figure 4.5. AN-107 Feed During Exothermic Reaction. Note the Drainage of Material that Adhered to Beaker Wall and the Cloudy, Frosted Appearance of the Beaker From Condensate During Reaction.

4.7
Due to possible segregation during drying, the batch was crushed to a fine powder and mixed.The powder was added to a 500 cm3 platinum 10% rhodium crucible and calcined for two hours at 600°C and two hours at 650°C. Batch remained in crucible and was melted at 1150°C for one hour, poured on stainless steel plate, cooled, crushed in a 100 cm3 tungsten carbide milling chamber, and remelted at 1150°C for an additional hour. The final pour had some bubbles at the meniscus, a slight vapor of volatile components observed when the lid was removed from the crucible, and an estimated viscosity of about 8 to 10 Pa· s, based on visual observation and past experience, during the pour (see Figure 4.6).
Figure 4.6. The AN-107 Glass in The Process of the Final Pour Onto the Stainless Steel Pour Plate. The 20 ml Crucible for the Canister Centerline Cooling Heat Treatment is Red Hot with Freshly Poured Glass.
4.1.2 Chemical Composition
KOH and Na2O2 fusion preparations and ICP-AES analyses were performed on each of the radioactive glasses, AW-101 and AN-107, as well as the glass reference standard, ARG-1 (Smith 1993).This process established elemental composition for contract compliance and allowed calculation of modified PCT normalized releases. Table 4.1 provides analyzed chemical compositions in µg element/gram glass and wt% oxide. The reported wt% oxide values are analytical ‘process blank’ corrected. The ARG-1 analysis is found in Appendix A, Table A.3. The table shows that the analytical wt% values agree with the target values for ARG-1 quite well indicating good analytical results.
Quality control objectives were met for all analytes whose concentration was equal to or greater than 0.5 wt% as required. Concentrations of analytes in the ARG-1 laboratory control standard (LCS) that were present at levels greater than the estimated quantification limits (EQL) were within ± 10% of the values listed for the “Consensus Composition Determined by Round Robin 6” (Table 3.1,
4.8
Smith 1993). Except for zinc, all other analytes detected in the LCS were recovered within the acceptance limits of 75 to 125%. Summation of measured wt% oxides in the LCS was about 98%. The total accountability of mass in the glass by ICP-AES is 94.3% for Envelope A (AW-101) and 93.9% for Envelope C (AN-107). One reason for the approximately 6% discrepancy in total wt% oxides is because certain elements (such as SO3; the halides Br, Cl, and F; and trace metals) were not included in the analyses. Another reason is the lack of complete recovery of SiO2 and Na2O during the preparation of the sample for analysis. It will be shown shortly that when omitted or discrepant components are adjusted, the total wt% values for AW-101 and AN-107 are quite close to 100 wt%.
ARG-1 glass was used as a reference to evaluate potential biases between measured wt% oxide in a glass sample and the true wt% oxide in the glass. Using nominal wt% oxides and associated standard deviations for ARG-1 from the MCC Round Robin (Smith 1993), a 80% prediction interval for a single observation was formed for each oxide as discussed in Hahn and Meeker (1991). If the weight percent for a particular oxide in the ARG-1 glass (measured along with AW-101 and AN-107) was found to be outside the prediction interval for that oxide, then the bias for that oxide was deemed to be statistically significant. CaO, SrO, and ZrO2 were found to have statistically significant biases at the 80% confidence level. An 80% confidence level was used because the fact that ARG-1 was only analyzed once with AW-101 and AN-107 makes it statistically difficult to declare as significant biases ARG-1 measured values that are different from nominal values. Although ARG-1 measured versus nominal differences in Al2O3 and TiO2 were not statistically significant at the 80% confidence level, values of Al2O3 and TiO2 in AW-101 and AN-107 were also bias corrected. The measured values of Al2O3 and TiO2 in AW-101 and AN-107were consistently and non-negligibly below their target values, which agreed with the relative difference in measured ARG-1 values compared to the nominal values. In summary, bias corrections (on a relative basis) were made to the measured wt% oxide values of CaO, SrO, ZrO2, Al2O3, and TiO2 for both AW-101 and AN-107.
Table 4.2 lists adjusted weight percentages for oxides in AW-101 and AN-107, which were obtained in one of several ways. As discussed in the previous paragraph, bias corrections were applied to the measured values of five oxides (CaO, SrO, ZrO2, Al2O3, and TiO2). For other oxides and elements, target values were used as the adjusted values when the oxide or element was not analyzed, or when the analyzed value was less than the detection limit (< DL). For the remainingcomponents (except for Na2O and SiO2, discussed below), the analyzed value was used as the adjusted value (i.e., no adjustment). Based on past experience, the measured weight percentages for Na2O and SiO2 are typically lower than their true weight percentages. The reasons for this are different for each element. For silica, the reason is difficulty in getting silica into solution and keeping it there; and the precipitate is not easily observed. Hence the solution analyzed by the ICP is actually low in silica. For sodium oxide possible reasons include matrix effects (i.e., other elements present with sodium in the plasma flame) in the ICP plasma flame, temperature of the flame, and stability of the flame. Matrix effects are important because they are known to affect the easily ionized elements such as the alkalies and typical standards do not duplicate the matrix effect and as a result the sodium response in the sample and standard are different. The sodium emission is sensitive to the temperature of the plasma, so any shifting of the plasma flame relative to the optical detectors can change the sodium signal. Though the effect of these factors can shift the sodium-analyzed value up or down, the shift is generally down. Therefore, the target values for Na2O and SiO2 were used as their adjusted values. Notice that this action is supported by the fact that the increase of Na2O and SiO2 to their target values increases the oxide total for the adjusted analyses closer to 100% without overshooting 100%. After all adjustments, the total wt% values for AW-101 and AN-107 are 99.8546% and 99.2689, respectively.

4.9
Table 4.2 compares the measured and the adjusted compositions to target glass compositions and shows that both the AW-101 and AN-107 glasses are fairly close to their target compositions. Because the total wt% values for the adjusted AW-101 and AN-107 compositions are quite close to 100 wt%, it is appropriate to renormalize the adjusted compositions to total 100 wt%. The renormalized, adjustedcompositions of AW-101 and AN-107 are shown in Table 4.2. Renormalization of measured compositions to 100 wt% can be inappropriate, in that: (1) biases are not properly addressed by the renormalization, and (2) renormalization to 100 wt% can induce biases in unbiased measured values.However, after appropriate bias corrections or adjustments, if total wt% values are close enough to 100 wt% to suggest that all significant biases have likely been addressed, then renormalizing the adjusted compositions to 100 wt% is appropriate. (In fact, it has been shown in the statistics literature that renormalization in such a case actually reduces the uncertainty in the estimated composition.)

4.10
Table 4.1. Chemical Analyses of AW-101 and AN-107 Radioactive Glasses
ElementAW-101
(µg element/g)AN-107
(µg element/g) OxideAW-101
(wt% oxide)AN-107
(wt% oxide)AgAlAs
<13032100<1300
<13032350<1300
Ag2OAl2O3
As2O3
0.006.060.00
0.006.110.00
BBaBe
29250<50<50
26450240<51
B2O3
BaOBeO
9.420.000.00
8.520.030.00
BiCaCd
<50014450<75
<51014100<76
Bi2O3
CaOCdO
0.002.020.00
0.001.970.00
CeCoCr
<1000<250245
<1000<250235
CeO2
Co2O3
Cr2O3
0.000.000.04
0.000.000.03
CuDyEu
<130<250
<500<
<130<250<510
CuODy2O3
Eu2O3
0.000.000.00
0.000.000.00
FeKLa
3533025500<250
44780<10000
<250
Fe2O3
K2OLa2O3
5.053.070.00
6.400.000.00
LiMgMn
<1509395<250
<15012750<250
Li2OMgOMnO2
0.001.560.00
0.002.110.00
MoNaNd
<250131000<500
<250136000<510
MoO3
Na2ONd2O3
0.0017.660.00
0.0018.330.00
NiPPb
<150635
<500
430<510<510
NiOP2O5
PbO
0.000.150.00
0.050.000.00
PdRhRu
<3800<1500<5500
<3800<1500<5600
PdORh2O3
RuO2
0.000.000.00
0.000.000.00
SbSeSi
<2500<1300197000
<2500<1300200000
Sb2O3
SeO3
SiO2
0.000.00
42.16
0.000.00
42.80SnSrTe
<750020
<7500
<760035
<7600
SnO2
SrOTeO2
0.000.00240.00
0.000.00410.00
ThTiTl
<500010300<2500
<510011200<2500
ThO2
TiO2
Tl2O3
0.001.720.00
0.001.870.00
UVW
<10000<250
<10000
<10000<250
<10000
UO2
V2O3
WO3
0.000.000.00
0.000.000.00
YZnZr
<2502275018950
<2502340020150
Y2O3
ZnOZrO2
0.002.832.56
0.002.912.72
Total 94.3 93.85wt% oxide = Weight percent of elements converted to their listed, respective oxides. Note that 0.00% indicates undetected elements and will contribute to the fact that the oxides do not add up to 100%<x.xx = indicates that the analyte is below the detection limit, detection limit value is provided for those analytes.

4.11
Table 4.2. Target Versus Measured Composition of AW-101 and AN-107 Radioactive Glasses
AW-101 Radioactive Glass AN-107 Radioactive GlassOxide or Element Target
(wt%)Measured
(wt%)Adjusted(a)
(wt%)NormalizedAdjusted(b)
(wt%)
Target(wt%)
Measured(wt%)
Adjusted(a)
(wt%)NormalizedAdjusted(b)
(wt%)Al2O3
B2O3
BaO
6.089.710.0
6.069.42
<0.005
6.2198(e)
9.420.0(c)
6.22899.4337
0.0
6.23118.94330.0191
6.118.520.03
6.2682(e)
8.520.03
6.31448.58270.0302
CaOCdOCo2O3
1.990.00.0
2.02<0.008<0.033
1.8387(e)
0.0(c)
0.0(c)
1.84130.00.0
2.00950.0040.0003
1.97<0.008<0.033
1.7941(e)
0.004(c)
0.0003(c)
1.80730.00400.0003
Cr2O3
Cs2OCuO
0.0090.0012
0.0
0.04NM
<0.015
0.040.0012(c)
0.0(c)
0.04010.0012
0.0
0.00290.0
0.0021
0.030.0
<0.015
0.030.0
0.0021(c)
0.03020.0
0.0021Fe2O3
K2OMgO
5.542.581.48
5.053.071.56
5.053.071.56
5.05743.07451.5623
7.0180.14182.0117
6.40<1.138
2.11
6.400.1418(c)
2.11
6.44710.12482.1255
MoO3
Na2ONiO
0.020.00.0
0.017.66
0.0
0.020.0(d)
0.0
0.020.0291
0.0
0.003120.0
0.0351
<0.03518.330.05
0.0031(c)
20.0(d)
0.05
0.003120.14730.0504
P2O5
PbOSO3
0.06990.0
0.2139
0.15<0.050
NM
0.150.0(c)
0.2139(c)
0.15020.0
0.2142
0.01530.00380.1267
<0.108<0.051
NM
0.0153(c)
0.0038(c)
0.1267(c)
0.01540.00380.1276
Sb2O3
SiO2
SrO
0.044.05
0.0
0.042.160.0024
0.044.05(d)
0.0029(e)
0.044.11410.0029
0.044.78410.0013
0.042.800.0041
0.044.7841(d)
0.0049(e)
0.045.11390.0050
TiO2
WO3
ZnOZrO2
1.99390.0
2.952.99
1.72<1.181
2.832.56
1.8698(e)
0.0(c)
2.833.1963(e)
1.87250.0
2.83413.2010
2.00390.01152.99493.0097
1.87<1.190
2.912.72
2.0332(e)
0.0115(c)
2.913.3988(e)
2.04820.01162.93143.4239
BrClFUnknown
0.00.0784
0.00.2637
NMNMNMNM
0.0(c)
0.0784(c)
0.0(c)
0.2637(c)
0.00.0785
0.00.2641
0.07840.07840.4701
0.0
NMNMNMNM
0.0784(c)
0.0784(c)
0.4701(c)
0.0(c)
0.07900.07900.4736
0.0Total 100.0000 94.3 99.8546 100.0000(f) 100.0001 93.85 99.2689 100.0000(f)
(a) See text for description of how adjusted values were determined.(b) Adjusted values normalized to total 100 wt%.(c) Values less than detection limits or not measured (NM) values were adjusted to target values.(d) Set to target value as best available estimate of actual value.(e) Bias correction based on ARG-1 applied to measured value.(f) Total is 100.0000 prior to rounding entries to four decimal places. <x.xx = indicates that the analyte is below the detection limit, detection limit value is provided for those analytes.

4.12
Per the RPP-WTP project LAW glass Task Specification, the concentration of the waste sodium oxide shall be greater than 16 wt%. The target concentration of sodium oxide for both glasses is 20 wt%.The measured wt% sodium oxide content for the AW-101 and AN-107 glasses are 17.7 and 18.3, respectively. As all of the sodium oxide content for the AW-101 glass originated from the initial tank waste, the measured sodium oxide content of the AW-101 glass exceeds the Task Specification, sodium oxide concentration level of 16 weight percent. Based upon past experience, the measured weight percentage for Na2O is almost always lower than its true weight percentage, which provides an even larger margin of passing the Task Specification requirement. The ORP Contract Specification 2, Immobilized Low-Activity Waste, Section 2.2.2.2, Waste Loading, states: “The loading of waste sodium from Envelope A in the ILAW glass shall be greater than 14 weight percent based on Na2O. The loading of waste sodium from Envelope B in the ILAW glass shall be greater than 5.0 weight percent based onNa2O. The loading of waste sodium from Envelope C in the ILAW glass shall be greater than 10 weight percent based on Na2O.” Therefore, additionally, the AW-101 (Envelope A) glass easily meets the ORP contract specification for waste sodium loading. However, not all of the sodium oxide content for the AN-107 glass originated from the initial tank waste. Therefore, the amount of sodium from the original, as-received AN-107 waste in needed to allow the determination of the waste loading of the AN-107 glass.
The sodium concentration in the as-received AN-107 waste was 9.26M. The as-received waste (1.57-L) was combined with 0.16-L of decanted supernatant (9.0M Na) to give 1.73-L of waste with a sodium concentration of 9.2M. The diluted feed was prepared by adding 0.13-L of 19M NaOH and 0.44-L of 0.1M NaOH to the 1.73-L of waste. The AN-107 diluted feed has a calculated sodium concentration of 8.1M. The diluted feed was 75 vol% as-received waste. The AN-107 diluted feed was characterized as two individual components, supernatant and centrifuged solids (Urie et al. 1999B). The data from each component was used to calculate the starting composition of the diluted feed. The data from the individual samples were averaged, and the density was used for the supernatant, along with the percent centrifuged solids data to calculate the initial composition of the diluted feed. The calculated composition of the starting AN-107 diluted feed is shown in Table 2.1 contained in report number PNWD-3035 (Hallen et al 2000). The sodium concentration reported for the supernatant fraction, 7.5M, appears much lower than expected 8.1M. However, the analyses conducted on the treated waste samples, reported in Section 3.0 of this report, also suggest the sodium concentration reported in Table 2.1, report number PNWD-3035 (Hallen et al 2000), is too low. The sodium concentration of the diluted feed must be close to the calculated sodium concentration of 8.1M. So the Diluted feed is 75 vol % as-receivedwaste. Calculation of sodium in the original waste compared to the amount in the final Sr/TRU treated supernatant shows that 86.4% of the sodium in the diluted feed was from the original waste; however, the waste could not be treated at this high a concentration so an additional dilution/caustic adjustment was completed before the addition of the Sr and sodium permanganate solutions were added to complete the Sr/TRU precipitation process. The Sr/TRU removal process was demonstrated on 1.4-L of the diluted feed and 0.4-L was saved for future studies. Stock solutions of the reagents (NaOH, Sr(NO3)2, and NaMnO4) were prepared outside the hot cells for addition to the waste. Sodium hydroxide solution, 3.52M, was added to adjust the sodium and hydroxide concentrations. The strontium solution was made up as the nitrate salt in 1M concentration. The experiment used 1M sodium permanganate. The data show that the final treated waste contained 75 vol% of the diluted feed. The amount of original waste sodium in the Sr/TRU treated waste now takes into account this final dilution factor, i.e. 91.66%.Therefore, the final sodium concentration in the Sr/TRU treated supernatant from the original waste is 79.2%. The other sodium is from the NaOH used for caustic adjustment and a small amount, 1%, from the sodium permanganate. One must be careful using this concentration data as an additional dilution of 25% was done to facilitate filtering tests, but this did not change the ratio, or amount of sodium in the waste that was from the original, as-received AN-107 waste.

4.13
As 79.2% of the sodium oxide content for the AN-107 glass originated from the initial tank waste, for the AN-107 glass to exceed the Task Specification target, sodium oxide concentration level of 16 weight percent the wt% sodium oxide content of the glass would need to be 20 wt% which is the target glass concentration. Again, based upon past experience, the measured weight percentage for Na2O wt% values are almost always lower than its true weight percentage and we previously discussed the validity of using the target Na2O value as the true glass value. Therefore, the amount of sodium from the original, as-received AN-107 waste is determined to meet the Task Specification for the waste loading of the AN-107 glass. And, per the ORP Contract Specification 2.2.2.2, “…The loading of waste sodium from Envelope C in the ILAW glass shall be greater than 10 weight percent based on Na2O.” therefore, the AN-107 (Envelope C) glass easily meets the ORP contract specification for waste sodium loading.
The waste or additive loading fraction in the glass can be calculated from the dilution (decrease in concentration) of the element oxide concentrations contained either in the waste or in the glass forming additives in the final glass. The calculation is particularly simple when the diluted element oxide is contained in only one of the two components. For this calculation, the concentration of the element oxide in the glass is divided by the concentration of the element oxide in either the waste component or the additive component. As the AW-101 glass had no chemical additions made to it through the various unit operations these calculations can be readily used. For the AW-101 glass, the boron oxide level in the glass has a normalized value of 9.43 wt % and its concentration as part of the additives was 13.15 wt% and their ratio is 0.7171. Again for AW-101, using an element oxide contributed only by the waste such as potassium oxide, the ratio is found to be 0.3109. Table 4.3 summarizes these calculations for the AW-101 glass. Note that the dilution factors for the additive dilution and the waste dilution theoretically will add up to 1.00. The average factors and their sum, based on the measured oxide values for the AW-101 glass is 0.7312 + 0.2864 = 1.0176. The results indicate that the waste fraction for the AW-101glass is near or exceeds the target value of 26.15%.
Table 4.3. Waste Loading/Dilution factors for LAW Waste Glass AW-101
AW-101Waste Additives Glass Waste Dilution Additive dilution
Oxide wt% oxide wt% oxide Normalizedwt% oxide
(Glass/Waste) (Glass/Additive)
B2O3 13.15 9.43 0.7171CaO 2.70 2.02 0.7481
Fe2O3 7.50 5.06 0.6747K2O 9.876 3.07 0.3109MgO 2.00 1.56 0.7800Na2O 76.477 20.029 0.2619SiO2 59.65 44.11 0.7394TiO2 2.70 1.87 0.6926ZnO 4.00 2.83 0.7075ZrO2 4.05 3.20 0.7901
Average Dilution of Waste and Additive Components
0.2864 (target 0.2615)
0.7312 (target 0.7385)
A straightforward calculation of the original waste loading fraction in the AN-107 glass (Table 4.4) cannot be calculated from the dilution (decrease in concentration) of the element oxide concentrations. This is because a number of element concentrations were changed by chemical additions needed to facilitate the Sr/TRU and sulfate precipitation processing performed on this waste prior to being incorporated in the waste glass. Therefore, the waste loading has been computed on the basis of the processed waste composition as derived from the data given in Table 3.2. As before, only elements were used which were found in significant quantities in either the additives or the processed waste but not both.

4.14
The only waste dilution factor based on more than one significant digit is that for sodium, which gives a value that is likely statistically equal to the target loading for the waste of 21.4%. The other element (Ni) is present in both the waste and the waste glass in small quantities limiting the precision of the dilution factor of this oxide. In addition, the dilution of the additive elements, 79.7% , indicates that the waste loading is at the target level.
Table 4.4. Waste Loading/Dilution factors for LAW Waste Glass AN-107
AN-107Processed Waste Additives Glass Waste Dilution Additive dilution
Oxide wt% oxide wt% oxide Normalizedwt% oxide
(Glass/ Waste) (Glass/Additive)
Al2O3 7.64 6.31 0.8259B2O3 11.38 8.58 0.7487
CaO 2.31 1.81 0.7835Fe2O3 8.93 6.45 0.7223MgO 2.56 2.13 0.8320Na2O 93.3814 20.15 0.2158NiO 0.1639 0.05 0.3051SiO2 56.99 45.11 0.7915TiO2 2.55 2.05 0.8039ZnO 3.81 2.93 0.7690ZrO2 3.83 3.42 0.8930Average Dilution of Waste and Additive Components 0.2604 (target
0.214)0.7966 (target
0.786)
Summarizing, the waste loading was calculated from the dilution factor (decrease in concentration) of elements contained in either the waste or the glass forming additives. The results indicate that the waste fraction of each glass is near their target, i.e. 26.15% for AW-101 (measured 28.64% based on waste dilution and 26.88% based on additive dilution) and 21.4% for AN-107(measured 26.04% based on waste dilution and 20.34% based on additive dilution). The measured glass to target composition percent difference comparison of the oxides is small and the calculated wasteloading values are very close to or exceed the target. Both support the conclusion that the actual waste loading in each glass met or exceeded the target waste loading.
4.1.3 Radiochemical Composition
Samples of powdered waste glass AW-101 (sample ID: AW-101-QC-1) and AN-107 (sample ID: AN-107-QC-1) were analyzed for gamma emitters, 90Sr, Pu, and Am/Cm. Table 4.5 and Appendix A list measured analyte activities in the original material in units of µCi/gram. The reported errors (1-σ)represent the total propagated error including counting, dilution, yield, and calibration errors, as appropriate. Laboratory and process blank values given with each analysis are the best indicators of the method detection limits, taking into account the actual sample sizes and counting times used for each analysis.
Table 4.5 provides radiochemical data from the Envelope A (AW-101) and C (AN-107) glasses and comparisons with compositional predictions from the waste. The first column of data provides radionuclide estimates based on sample analysis of the pretreated wastes. The second column of data provides analyzed radionuclide values from the actual waste glasses produced by vitrification of the waste. Percent recoveries in the glass are calculated and presented in the last column.

4.15
Table 4.5. Radiochemical Composition of AW-101 and AN-107 GlassesExpected Loading (a)
(µCi/g glass)Analysis of Glass
(µCi/g glass)Waste Analysis(% Recovery)
AW-101 GlassCo-60Se-79Y-88Sr-90Nb-95Tc-99Sn-113Sb-125SnSb-126Cs-134Cs-137Eu-154Eu-155Pu-236Np-237Pu-238Pu-239Pu-239 + Pu-240Pu-240Am-241Cm-242Cm-243 + Cm-244
<1.41E-2NMNM
<7.03E-1NM
7.15E-03NMNMNM
4.78E-024.07E-02<5.6E-2<5.6E-1
NMNM
<8.63E-05NM
1.85E-04NM
1.03E-04<7.03E-062.40E-05
<2.E-3NMNM
1.63E-01<1.E-037.14E-03<2.E-3<4.E-3
<2.E-3<2.E-38.65E-02<3.E-3
<4.E-3<3.E-6<5.6E-5<5.E-6
<7.8E-33.55E-05<1.4E-13.80E-05<7.E-6<2.E-5
100
213
2437
AN-107 Glass
Co-60Se-79Y-88Sr-90Nb-95Tc-99Sn-113Sb-125SnSb-126Cs-134Cs-137Eu-154Eu-155Pu-236Np-237Pu-238Pu-239Pu-240Pu-239 + Pu-240Am-241Cm-242Cm-243 + Cm-244
6.23E-02<3.13E-6<3.75E-43.80E-031.70E-037.66E-028.74E-05<1.31E-4<5.63E-5
NM1.15E-014.85E-033.39E-03
NM1.91E-05
NM6.07E-04
NMNM
2.11E-03NMNM
5.64E-02NMNM
<2.E-3<2.E-3
4.82E-02<3.E-3<5.E-3<2.E-3<2.E-3
1.09E-015.40E-03<2.E-3<8.E-6
<6.9E-051.00E-04<9.6E-3
<1.7E-24.1E-04
1.95E-03<7.E-6
3.08E-05
90
63
95111
92
(a) Radionuclide composition of glass is estimated from the waste compositional analysis and does not account for volatilization. Actual quantities of Cs and Tc in the glass are expected to be lower, due to volatilization.
<x.xx = indicates that the radioisotope is below the detection limit, detection limit value is provided for those radioisotopes.NM = not measured

4.16
All of the fused samples directly gamma counted showed 137Cs. The AN-107 samples also showed significant activities of 60Co and 154Eu. The duplicate results for both samples are in good agreement with relative percent difference (RPD) values < 5%. Other requested analytes including 51Cr,59Fe, 95Nb, 103Ru, 113Sn, and 152Eu were not detected in any of the samples. The detection limits for the AW-101 samples in units of µCi/g glass are: 51Cr <1.E-2, 59Fe <2.E-3, 95Nb <1.E-3, 103Ru <2.E-3, 113Sn<2.E-3, and 152Eu <5.E-3. The detection limits for the AN-107 samples in units of µCi/g glass are: 51Cr<2.E-2, 59Fe <4.E-3, 95Nb <2.E-3, 103Ru <2.E-3, 113Sn <2.E-3, and 152Eu <7.E-3. No gamma activity was detected in the preparation blank.
Radiochemical yields for Am/Cm were depressed, probably due in part to the high salt content.Yields for Pu were within the expected range of > 80%. For sample AW-101, only 239+240Pu and 241Amwere detected weakly. No 238Pu or Cm were detected and the detection limits are listed. For sample AN-107, 239+240Pu, 238Pu, 241Am, and 243+244Cm were detected. The duplicate results are in good agreement except for the high RPD value of 36% for 238Pu for sample AN107, where the 1-sigma measurement uncertainties were 10-13%. The calculated mean difference (MD) value is 1.14 indicating that the results are in statistical agreement. Neither Pu, Am nor Cm were detected in the preparation blank. Although very weak, 241Am activity was seen in the laboratory blank representing about 20% of the AW-101sample activity. The LCS and matrix spikes for Pu and Am/Cm resulted in 95% to 107% yield-correctedrecoveries. This indicates the chemistry and analyses were not biased.
90Sr was detected in sample AW-101 and the duplicate results are in good agreement (4% RPD).However, 90Sr could not be detected in sample AN-107 and the detection limits are listed. Strontium-90was not found in the preparation blank or the laboratory blank. The LCS and matrix spike recoveries were 94% and 86%, respectively, within the control limits established by the SBMS QA exhibit.
Table 4.5 provides radiochemical data from the Envelope A (AW-101) and C (AN-107) glasses andcomparisons with compositional predictions from the waste. The first column of data provides radionuclide estimates based on sample analysis of the pretreated wastes. The second column of data provides analyzed radionuclide values from the actual waste glasses produced by vitrification of the waste. Percent recoveries in the glass are calculated from the ratio of the analytical values in the glass to the expected values based on the analyses of the waste components and the fraction of each waste in the final glass feed batch and presented in the last column. However, it should be noted that the AW-101radiochemical analytical error in the “Expected Loading” column of Table 4.5 is much greater than the actual glass analysis data as the radiochemical data supplied by the Cs IX and Tc IX tasks only included 99Tc, 134Cs, and 137Cs. The other radionuclide data came from the AW-101 “Diluted Feed” report (Urie et al., 1999b) using a dilution factor of 0.71 (4.59 M Na divided by 6.46 M Na) to account for the unitoperations, i.e. Cs IX and Tc IX, after analysis of the “Diluted Feed”. 99Tc recoveries indicate 0 to approximately 40% volatilization from the melt in the AW-101 and AN-107 glasses respectively and are typical for this element in oxidizing environments such as crucible melts. 137Cs recoveries indicate approximately 5% volatilization in the AN-107 glass with an erroneous increase in 137Cs for the AW-101glass. Again, the AW-101 percent recovery value is believed to be an artifact due to the high uncertaintyassociated with the “Expected Loading” value. It is assumed that if the final AW-101 Tc IX effluent, which was vitrified, had been analyzed for the same suite of radioisotopes as the AN-107 pretreated waste that was vitrified, the percent recovery would have been much closer to unity. Analytical uncertainties of the gamma energy analysis values are 2-3% due to the gamma counting and do not contribute to the large variance in percent recovery. As for the apparent increase in 154Eu in the AN-107 glass, the analytical uncertainty is 20% at the 1-sigma confidence level. This uncertainty is much larger than the apparent over recovery of 154Eu and should not be misconstrued. Lastly, the apparent under recovery in the AW-101 glass for 239+240Pu and 241Am cannot be attributed to analytical uncertainties as they are about 17% at the 1-sigma confidence level for AW-101 glass values. The uncertainties are only 7% for both 241Am and 239+240Pu glass analysis values for AN-107. Again, the low percent recovery for plutonium and

4.17
americium in the AW-101 glass is almost certainly due to the high uncertainty associated with the “Expected Loading” value, as these refractory elements should not volatilize during glass production. In any case, as will be shown below, both the “Estimated Glass Analysis” and the “Measured Glass Analysis” data show that the glasses easily meet all contract specification limits in spite of the disagreement on percent recovery numbers.
One of the primary success objectives for this work was that for the ILAW glasses, “The concentrations of 137Cs, 90Sr, 99Tc and transuranic (TRU) radionuclides shall be less than 3 Ci/m3, 20 Ci/m3, 0.1 Ci/m3 and 100 nCi/g, respectively.” Table 4.6 below summarizes the radiochemical data from this work so that this glass data is directly comparable with these success criteria. The amount of each of these radionuclides was determined by multiplying the weight of a cubic meter of glass by the measured and estimated (based on sample analysis of the pretreated wastes) concentration of the radionuclide per gram. The criteria for 90Sr and 137Cs are met by any method of calculation in both glasses. In spite of the disagreement on the percent recovery of 137Cs for AW-101, the 137Cs level is one order of magnitudelower than the contract specification limit. AW-101 also passes for 99Tc and transuranic (TRU) radioisotopes. AN-107 passes for (TRU) radioisotopes and fails for 99Tc. The failure of AN-107 for 99Tcwas not unexpected because the pretreatment process for removing 99Tc selectively removes the pertechnetate anion from LAW solutions and the AN-107 waste only contains approximately 15 to 20% of its 99Tc as the pertechnetate anion (Blanchard et al. 2000). However, the ORP Contract Specification 2.2.2.8, states: “The average concentrations shall be calculated by summing the actual inventories of each of the above radionuclides in the packages that have been presented to date for acceptance and dividing by the total volume of waste in these packages. The Contractor shall remove on average a minimum of 80% of the 99Tc present in the feed.” therefore, it is believed that the RPP-WTP will be able to meet or exceed the contract 99Tc ILAW glass content requirements by decontaminating the Envelope A and B wastes to a greater extent than needed to meet the contract ILAW requirements so that on average the 99Tc concentration in the combined ILAW glasses produced, i.e. Envelope A, B, and C waste glasses, will be less than or equal to the contract ILAW glass limit.
Table 4.6. Contract Success Criteria Determination: Radionuclide Glass Content of the ILAW Glass Product
Radionuclide Concentration in Glass (Ci/m3)Estimated Glass Analysis Measured Glass Analysis
Radionuclide Contract Limit AW-101(a) AN-107(b) AW-101(a) AN-107(b)
Sr-90 20 0.75(c) 0.012 0.435 0.005Tc-99 0.1 0.023 0.206 0.019 0.129Cs-137 3 0.133 0.308 0.231 0.292
TRU 100 nCi/g < 0.436 nCi/g 2.88 nCi/g < 0.16 nCi/g < 2.6 nCi/g(a) = assumes the AW-101 LAW glass density to be 2.668 g/cm3 which is the measured density of the simulant
LAWA88 glass, reporting temperature of 20ºC per ASTM D854-83; density corrected to 25ºC would be less than 0.005 g/cm3 lower than this number. Data supplied by I. Muller of VSL on June 22, 2000.
(b) = assumes the AN-107 LAW glass density to be 2.677 g/cm3 which is the measured density of the simulant LAWC15 glass, reporting temperature of 20ºC per ASTM D854-83; density corrected to 25ºC would be less than 0.005 g/cm3 lower than this number. Data supplied by I. Muller of VSL on June 22, 2000.
(c) = assumes the AW-101 LAW glass has approximately the same Sr-90 loading as the Envelope A glass produced by Ferrara et al., 1998a, 1998b.
TRU = transuranics

4.18
4.2 Crystalline and Non-Crystalline Phase Determination
Crystallization Evaluation of AW-101 and AN-107 Heat Treated LAW Glass Samples
The samples were examined with transmitting light microscope at magnifications up to 250x. No crystals were observed in the samples in any mode of examination including polarized light though numerous bubbles were present in all samples. Very occasional irregular opaque particles (10-30 µm) were observed but not identified. See Appendix B for detailed powder XRD plots and SEM micrographs.
XRD was used to analyze the samples for crystallinity. Initial XRD scans showed amorphous patterns (see Figure 4.7), with a few sharp peaks superimposed. These peaks indicated the presence of a crystalline phase at about 2 volume percent. If a crystalline phase is truly present, it should have been observed optically. The observed peaks indicate a mineral with a large “d” spacing such as a clay or mica mineral. None of these are expected to form these glasses under the heat treatment conditions. This suggested contamination of the samples, which was further investigated.
Figure 4.7. XRD Diffraction Profiles for Glasses AW-101 and AN-107 Showing General Amorphous Character with Superimposed Peaks Indicating a Contaminating Crystalline Phase Present in the Powder Sample as SEM and Optical Microscopy Results Showed no Crystalline Phases Present in Either Glass.
0
10000
20000
30000
40000
50000
60000
0 20 40 60 80
degrees, 2
raw
cou
nts
AN-107
AW-101

4.19
Figure 4.8. XRD Diffraction Profiles for Glass AW-101 Showing General Amorphous Character with Superimposed Peaks Indicating a Crystalline Phase Present in the XRD Powder Sample Compared with the XRD Peaks Observed for a Section of the Poly Glove Material. The position of the peaks are identical indicating that the material ‘dusting’ the gloves is the material contaminating the glass powder.
XRD analysis of the protective gloves used during preparation of the initial glass powder samples was performed to determine if the observed contamination was from the mineral powder phase applied by the glove manufacturer to facilitate insertion of ones hands. Figure 4.8 shows the XRD pattern of the ‘powdered’ poly glove material below the initial XRD scan of the AW-101 glass heat treated to mimic the ILAW canister centerline cooling curve. The position of the ‘contamination’ peaks is identical indicating that the mineral material used to ‘dust’ the poly gloves is the same material contaminating the glass powder samples. To confirm this observation, a new sample of AW-101 glass, heat treated to mimic the ILAW canister centerline cooling curve, was prepared using different protective gloves that did not use any type of ‘powder’. Figure 4.9 shows the new XRD pattern of the heat treated AW-101 glass powder.This XRD pattern shows only broad amorphous peaks indicating that the heat treated glass is completely amorphous consistent with the optical microscopy and SEM results.
10 20 30 40 50 60 70
2-Theta(°)
x10^3
5.0
10.0
15.0
20.0
Inte
nsity
(Cou
nts)
Poly Glove
AW-101-CCC-2 Powdered Glass Sample

4.20
Figure 4.9. XRD Diffraction Profile for the Heat Treated AW-101 Glass Showing General Amorphous Character with out the Superimposed Peaks that Indicated a Crystalline Phase Present in the Initial Glass Powder Sample. The lack of sharp XRD peaks indicates that the glass is completely amorphous consistent with optical and SEM evaluations.
Each glass sample was examined using SEM at magnifications up to 20,000x. No crystallites were detected in any of the AW-101 and AN-107 LAW glass samples. Contamination particles, e.g. ‘dust’, are found on the surface of the glass samples, but no separate phases were found in the glasses.Therefore, no crystals were observed in the glass samples as determined by optical microscopy, SEM, and XRD evaluations.
Non-Crystalline Chemical Homogeneity of AW-101 and AN-107 Heat Treated LAW Glass Samples
SEM–EDS analyses were performed of various regions of the polished section of each centerline cooled sample. These regions were arranged both vertically and horizontally. The size region scanned for each analysis ranged from less than one square micron to as much as 1600 square microns. The reason for scanning different sized areas was to see if liquid-liquid phase separation might be occurring.Unfortunately the glasses are susceptible to alkali volatilization when heated by the SEM electron beam.Figure 4.8 below shows how the measured sodium level decreases with decreasing analytical area. At the largest area measured the sodium values are about 5% low.
To make a judgment about the affect of the sodium volatilization on the resulting SEM-EDSanalysis of the glasses, several analyses from the AN-107 glass sample were recalculated assuming the original amount of sodium remained in the glass. To do this, the target composition of AN-107 was recalculated to 100% based just on the 10 elements reported for the SEM-EDS analyses. This is the
10 20 30 40 50 60 70
2-Theta(°)
x10^3
2.0
4.0
6.0
8.0
10.0
Inte
nsity
(Cou
nts)
4.21
AN-107 target calculated and shown in Table 4.7. The columns headed with “Meas.” are SEM-EDSanalyses. The columns headed by “Norm.” are columns containing the SEM-EDS analyses renormalized to 100% where the sodium oxide content has been increased to the sodium oxide target value for AN-107(normalized to the same ten elements). Also two different sized analytical areas (1 and 4 µm2) are included in the evaluation and the different areas result in about the same re-normalized numbers. This adjustment process over compensates for some elements such as calcium and iron, but the overall adjustment is good. It is concluded that the SEM-EDS survey did not observe any phase separation or glass heterogeneity due to poor mixing.

4.22
Figure 4.10. Sodium Volatilization Believed to be Due to Electron Beam Heating of the Glass. The heating intensity of the beam would be inversely proportional to the area being analyzed.
Table 4.7. AN-107 Glass ‘As Measured’ and ‘Normalized’ Values Compared to the AN-107Re-normalized Target Values. All Values Have Been Re-normalized to 100% Using Only the Ten
Oxides Listed Below.
Weight Percent OxideArea 1, EDS Beam Spot Size Area 2, EDS Beam Spot Size
1 µm2 4 µm2 1 µm2 4 µm2
OxidesAN-107Target(a) Meas. Norm. Meas. Norm. Meas. Norm. Meas. Norm.
Na2O 22.17 9.53 22.17 15.52 22.17 7.82 22.17 10.42 22.17MgO 2.23 2.69 2.32 2.47 2.27 2.65 2.23 2.61 2.27Al2O3 6.91 8.48 7.29 7.88 7.26 8.31 7.01 8.29 7.20SiO2 49.65 58.08 49.97 54.43 50.15 59.42 50.17 57.72 50.15K2O 0.16 0.18 0.15 0.17 0.16 0.13 0.11 0.20 0.18CaO 2.23 2.40 2.06 2.25 2.07 2.53 2.14 2.40 2.08TiO2 2.22 2.59 2.23 2.39 2.20 2.64 2.23 2.50 2.18Fe2O3 7.78 7.93 6.82 7.49 6.90 8.60 7.26 8.07 7.01ZnO 3.32 3.90 3.35 3.45 3.18 3.87 3.27 3.80 3.30ZrO2 3.34 4.23 3.64 3.94 3.63 4.04 3.41 3.97 3.45
Total 100 100 100 100 100 100 100 100 100(a) = AN-107 target composition re-normalized to the ten oxides measured by SEM-EDS.Meas. = ‘As Measured’ EDS analytical value.Norm. = ‘Recalculated’ analytical value normalized to the AN-107 sodium oxide target value of 22.17 wt% and
the remaining oxides proportionally adjusted to make the total oxide add to 100%.
Sodium Volatilization from AN-107
0.00
5.00
10.00
15.00
20.00
25.00
-2.00 -1.00 0.00 1.00 2.00 3.00 4.00
Log ( scanned ana l y s i s a r ea ) ( squa r e mi c r o n s )
Mea
sure
d W
t% S
odiu
m
Oxi
de

4.23
4.3 Release Rate, Modified Product Consistency Testing
The ultimate objective for immobilization of the low activity waste is to incorporate and convert the radioactive and hazardous components into a solid glassy waste form that will resist their release to the environment in a Hanford near-surface burial ground. This resistance of the waste form to release deleterious environmental components is defined by measuring its chemical durability, i.e. the resistance of the glass to react with the aqueous environment expected in the glass disposal site. However, to mimic the mean temperature, amount and frequency of available ground waster, etc. expected in the near-surfacerepository would require a great amount of testing time to be able to detect glass dissolution. Therefore, an accelerated chemical durability test, the Product Consistency Test (PCT), is employed to gauge the ILAW glass chemical durability. The PCT was run at 40 and 90°C, using glass samples given a slow cool down heat treatment which simulates the cooling profile for glass at the center line of a canister been filled with a waste glass and allowed to cool to ambient temperature, to determine the normalized release of sodium, silicon, and boron. The low-activity test reference material (LRM) standard glass was included in these tests to provide a reliable baseline of results by which to judge the quality of the PCT results for the AW-101 and AN-107 glasses.
After the glass particles were cleaned of adhering fines, the crushed glass (a minimum of 1 g) was tested per ASTM C1285-97 “Standard Test Methods for Determining Chemical Durability of Nuclear, Hazardous, and Mixed Waste Glasses: The Product Consistency Test (PCT).” For testing the crushed glass (a minimum of 1 g) was placed in a Type 304 L stainless steel vessel (22 mL volume) into which an amount of ASTM Type I water, equal to 10 cm3 per gram of glass, was added. The vessel was sealed and placed into a constant temperature device at 40 or 90 ± 2°C. After 7 days, the vessel was cooled to ambient temperature. The pH was measured on an aliquot of the leachate and the temperature of the aliquot at the time of the pH measurement was recorded. The remaining leachate was filtered to remove suspended solids and sent for analysis. Analyses of boron, alkali metal, and silicon concentrations were performed, which were then used as a measure of the extent of glass corrosion. The concentrations of elements (C) are normalized to glass composition and glass surface area (S) to solution volume (V) according to:
)/( VSfCr
i
ii = , (1)
where ri, Ci, and fi are the ith element normalized release, concentration in solution, and mass fraction in glass, respectively.
All tests were run without serious deviation from the procedure described above except for the temperature profile for the 40°C test. During the first 17 hours the temperature drifted upward to about 46°C before the operator was able to bring the temperature down to 40°C and get the furnace to control at 40°C for the remainder of the test. Since the LRM glass was included in the test, its behavior relative to its expected behavior at 40°C could be compared to see if there was significant deviation due to the initial temperature excursion.

4.24
Table 4.8 compares the “measured” PCT leachate concentration and pH with the “round robin” PCT results for the LRM glass as reported by Ebert and Wolf. 1999. This comparison provides an evaluation of how accurately the test followed the ASTM procedure and whether or not any deviation had a significant impact on the results. For instance, since all of the “measured” 40°C PCT results agree within the 95% confidence interval with the “round robin” PCT results, it is assumed that an early 6°C temperature excursion did not seriously affect the 40°C PCT results. At 90°C the leachate composition values for the LRM glass all fall within the 95% confidence interval and the temperature is known to have been well controlled, so even though the final pH was about 0.27 units low, the data are believed to be good.
Tables 4.9 and 4.10 give the average release rates found for glasses AW-101, AN-107, and LRMat 40°C and 90°C. Data for glasses LAWA23R, LAWA88 (simulant AW-101 glass), and LAWC15(simulant AN-107 glass) provided by VSL at 90°C is included in Table 10 for comparison. For PCT-A,the S/V was assumed to be 2000 m-1 based on assumptions on the size and shape distribution of the ground glass and verified through considerable surface area measurements (ASTM 1998). Normalized releases of Na, Si, and B were calculated using Equation 1 and are based on a seven-day test period. As is readily observed, all of the glasses easily meet the ORP contract requirement from Specification 2, Section 2.2.2.17.2, which requires that the normalized mass loss of the LAW waste glasses produced be < 2 g/m2.

4.25
Table 4.8. Comparison of 40°C PCT and 90°C PCT Results from the Low-Activity Test Reference Material (LRM) Glass Round Robin (Ebert and Wolf. 1999) with the Equivalent Values Found for the
40°C and 90°C PCT Tests Described in this Report.
LRM at 40°C LRM at 90°C
Element Reported(a)
(mg/L)Measured
(mg/L)Reported(a)
(mg/L)Measured
(mg/L)[B] 2.30 ± 1.25 1.11 – 1.13 26.7 ± 7.2 24.6 – 24.8[Na] 19.7 ± 7.3 19.2 – 19.5 160 ± 13 149 – 150[Si] 13.7 ± 4.2 12.1 –12.2 82.0 ± 12.7 83.1 – 83.7
Final pH 9.86 ± 0.96 8.93 – 8.97 10.92 ± 0.43 10.19 – 10.22(a) = Values reported from Ebert and Wolf report dated 1999.
Table 4.9. Average 7-Day 40°C PCT Normalized Mass Loss Data Radioactive LAW Glasses from this Study
Average 7-DAY 40ºC PCT Normalized Mass Loss (g/m2)Element
Glass B Na SiAW-101 (leachate pH range = 9.08 – 9.17) 0.0481 0.0877 0.0330AN-107 (leachate pH range = 9.00 – 9.04) 0.0373 0.0708 0.0267LRM 0.0230 0.0653 0.0240Note: ORP contract requirement from Specification 2, Section 2.2.2.17.2 requires that the normalized mass loss of
the LAW waste glasses produced be < 2 g/m2.
Table 4.10. Comparison of Average 7-Day 90°C PCT Normalized Mass Loss Data Between VSL Non-radioactive Simulant Glasses and Actual Radioactive LAW Glass Counterparts from this Study.
LAWA23R and LRM Data is Provided for Comparison Purposes.
Average 7-DAY 90ºC PCT Normalized Mass Loss (g/m2)Element
Glass B Na SiLAWA23R(a) 0.503 0.669 0.217LRM 0.506 0.504 0.165LAWA88 (simulant AW-101 glass) 0.434 0.426 0.171AW-101 (leachate pH range = 10.27 – 10.33) 0.569 0.589 0.196LAWC15 (simulant AN-107 glass) 0.329 0.335 0.161AN-107 (leachate pH range = 10.02 – 10.05) 0.354 0.422 0.191Note: ORP contract requirement from Specification 2, Section 2.2.2.17.2 requires that the normalized mass loss of the LAW waste glasses produced be < 2 g/m2.(a) = PCT data provided by VSL; data is from testing completed from March through June 1999, all triplicate sampling in accordance with ASTM C1285-97.

5.1
5.0 Conclusions
The primary objective for vitrifying the LAW samples was to demonstrate the RPP-WTP projects ability to satisfy the ILAW product ORP contract requirements concerning, chemical and radionuclide reporting, waste loading, identification and quantification of crystalline and non-crystalline phases, and waste form leachability. Two pretreated tank supernates, low-activity wastes (241-AW-101 and 241-AN-107) along with a process simulant (termed the Process Blank) were prepared as melter feeds for vitrification. The analyzed compositions of the pretreated AW-101 and AN-107 wastes were used by Catholic University of America’s (CUA) Vitreous State Laboratory (VSL) to calculate the target glass composition. The two supernate tank samples, i.e. 241-AW-101 and 241-AN-107, referred to as AW-101and AN-107, were processed through pretreatment chemical separation processes, and the decontaminated supernates were converted to low-activity waste (LAW) glass after addition of glass former additives.
The measured wt% sodium oxide content for the AW-101 and AN-107 glasses are 17.7 and 18.3, respectively. As all of the sodium oxide content for the AW-101 glass originated from the initial tankwaste, the AW-101 glass exceeds the Task Specification, sodium oxide concentration level of 16 weight percent easily considering only the measured wt% sodium oxide content. Based upon past experience, the measured weight percentage for Na2O are almost always lower than its true weight percentage, which provides an even larger margin of passing the Task Specification requirement. Note that as discussed in Section 4.1.2, Na2O and SiO2 analyzed by ICP-AES are almost always lower than their true weight percentage because of analytical difficulties associated with these elements. However, not all of the sodium oxide content for the AN-107 glass originated from the initial tank waste. As 79.2% of the sodium oxide content for the AN-107 glass originated from the initial tank waste, for the AN-107 glass to exceed the contract, sodium oxide concentration level of 16 weight percent the wt% sodium oxide content of the glass would need to be 20 wt% which is the target concentration. Again, based upon past experience, the measured weight percentage for Na2O wt% values are almost always lower than its true weight percentage. For this reason, the target Na2O value is used as the true weight percent oxide value for the ILAW glasses. Therefore, the original, as-received AN-107 waste is determined to meet the Task Specification for waste loading of the AN-107 glass. The ORP Contract Specification 2, Immobilized Low-Activity Waste, Section 2.2.2.2, Waste Loading, states: “The loading of waste sodium from Envelope A in the ILAW glass shall be greater than 14 weight percent based on Na2O. The loading of waste sodium from Envelope B in the ILAW glass shall be greater than 5.0 weight percent based on Na2O. The loading of waste sodium from Envelope C in the ILAW glass shall be greater than 10 weight percent based on Na2O.” Therefore, additionally, both the AW-101 (Envelope A) and AN-107(Envelope C) glasses easily meet the ORP contract specifications for waste sodium loading.
The waste loading was calculated from the dilution factor (decrease in concentration) of elements contained in either the waste or the glass forming additives. The results indicate that the waste fraction of each glass is near their target, i.e. 26.15% for AW-101 (28.64% based on waste dilution and 26.88%based on additive dilution) and 21.4% for AN-107 (26.04 % based on waste dilution and 20.34% based on additive dilution). The measured glass to target composition percent difference comparison of the oxides is small and the calculated waste loading values are very close to or exceed the target. Both support the conclusion that the actual waste loading in each glass met and exceeded the target waste loading.
To demonstrate that the glass product, radionuclide compositional limits were met a radionuclideglass compositional estimate based on sample analysis of the pretreated wastes was completed for both the AW-101 and AN-107 glasses as volatilization of radionuclides may occur during vitrification in crucible melts. 90Sr, 99Tc, 137Cs, and transuranic (TRU) radionuclide values were checked to make sure

5.2
the glass product met or exceeded the contract success criteria. The estimated glass composition concentrations for 90Sr passed the contract success criteria for both glasses. The estimated glass composition concentrations for 99Tc passed the contract criteria for the AW-101 glass. The estimated glass composition concentrations for 99Tc did not pass the contract criteria for the AN-107 glass.However, Blanchard et al. 1999 have previously shown that an Envelope A waste (e.g. AW-101) can be 99Tc ion exchange decontaminated to a level much below the contract ILAW glass limit. This would allow a sufficient amount of 99Tc to be removed from the AW-101 and AN-107 wastes so that the average 99Tc concentration in the ILAW glass produced would meet or exceed the contract specification. The estimated glass composition concentrations for 137Cs passed the contract success criteria for the AW-101and AN-107 glasses. Is in spite of the disagreement on the percent recovery of 137Cs for AW-101, the 137Cs level is one order of magnitude lower than the contract specification limit. And finally, the estimated glass composition concentration analysis for the transuranic (TRU) radionuclides shows that both glasses pass the contract criteria.
Identification and quantification of crystalline and non-crystalline phases were completed by using x-ray diffraction (XRD), optical microscopy, and scanning electron microscopy (SEM) on samplesgiven a slow cool down heat treatment which simulated the calculated cooling profile for glass at the centerline of a LAW canister during filling. No crystals were observed in the samples during both SEM and optical examination though bubbles were present in all samples and a few irregularly shaped, opaque particles (10-30 µm) were observed but could not be identified. However, initial powder XRD samples used to analyze the glass samples for crystallinity showed broad amorphous patterns with a few sharp ‘crystalline’ peaks superimposed on the amorphous curve. These crystalline peaks were suggestive of contamination of the ILAW glass powder XRD samples and investigated further. XRD analysis of the protective gloves, used during preparation of the initial powder XRD samples, showed conclusively that the crystalline peaks were due to contamination by the mineral phase applied by the glove manufacturer to facilitate insertion of ones hands. One of the heat treated glass samples, AW-101, was prepared for XRD using different protective gloves and reanalyzed. This XRD pattern showed only broad amorphous peaks indicating that the glass is completely amorphous consistent with the optical and SEM results.
The Product Consistency Test (PCT) was employed to gauge the ILAW glass chemical durability.The PCT was run at 40 and 90°C, using glass samples given a slow cool down heat treatment which simulates the cooling profile for glass at the center line of a canister being filled with waste glass, todetermine the normalized release of sodium, silicon, and boron. The low-activity test reference material (LRM) standard glass was included in these tests to provide a reliable baseline of results by which to judge the quality of the PCT results for the AW-101 and AN-107 glasses. Both the AW-101 and AN-107glasses and the LRM glass gave a normalized sodium, silicon, and boron release rates of less than 1 g/m2
for the 90ºC PCT test, which is generally considered to indicate a durable glass. The normalized sodium, silicon, and boron 90ºC PCT release rates for the AW-101, AN-107, and LRM glasses are: 1) 0.6 g/m2,0.2 g/m2, and 0.6 g/m2; 2) 0.4 g/m2, 0.2 g/m2, and 0.4 g/m2; and 3) 0.5 g/m2, 0.2 g/m2, and 0.5 g/m2;,respectively. The normalized sodium, silicon, and boron 40ºC PCT release rates for the AW-101,AN-107, and LRM glasses are: 1) 0.09 g/m2, 0.03 g/m2, and 0.05 g/m2; 2) 0.07 g/m2, 0.03 g/m2, and 0.04 g/m2; and 3) 0.07 g/m2, 0.02 g/m2, and 0.02 g/m2, respectively. More importantly, the normalized release rates of sodium, silicon, and boron from the AW-101 and AN-107 glasses are less than 2.0 g/m2,the ORP contract criteria.
Finally, the ILAW product testing results from the AW-101 and AN-107 glasses show that in all cases they meet or exceed ORP contract specifications for waste loading, chemical compositiondocumentation, radionuclide concentration limitations, and waste form testing (i.e. chemical durability).

6.1
6.0 References
American Society for Testing and Materials, ASTM C1285-97 “Standard Test Methods for Determining Chemical Durability of Nuclear, Hazardous, and Mixed Waste Glasses: The Product Consistency Test (PCT),” West Conshohoken, Pennsylvania.
Arm, Stuart T, BNFL, E-mail to Gary L. Smith, Battelle, dated November 16, 1999, titled “ILAW Cooling Curve”, CHG reference number: 015928C.
Blanchard Jr., D. L., D. E. Kurath, and J. R. Bontha. 1999. Small Column Testing of Superlig 639 for Removal of 99Tc from Hanford Tank Waste Envelope A (Tank 241-AW-101). PNWD-3004, Battelle, Pacific Northwest Division, Richland, Washington.
Blanchard Jr., D. L., D. E. Kurath, and B. M. Rapko. 2000. Small Column Testing of Superlig 639 for Removing 99Tc from Hanford Tank Waste Envelope C (Tank 241-AN-107). PNWD-3028, Battelle, Pacific Northwest Division, Richland, Washington.
Brooks, K. P., P. R. Bredt, G. R. Golcar, S. A. Hartley, M. W. Urie, J. M. Tingey, K. G. Rappe, and L. K. Jagoda. 1999. Ultrafiltration and Characterization of AW-101 Supernatant and Entrained Solids.PNWD-3000, Battelle, Pacific Northwest Division, Richland, Washington.
Ebert, W. L. and S. F. Wolf. 1999. Round-Robin Testing of a Reference Glass for Low-Activity Waste Forms. ANL-99/22, Argonne National Laboratory, Argonne, Illinois.
Ferrara, D. M., C. L. Crawford, B. C. Ha, and N. E. Bibler. 1998a. Vitrification of Three Low-ActivityRadioactive Waste Streams from Hanford, in Proceedings of the International Conference on “Decommissioning and Decontamination and on Nuclear and Hazardous Waste Management,” pp. 706-713. Spectrum ’98 Vol. 1, American Nuclear Society, Inc., La Grange Park, Illinois.
Ferrara, D. M., C. L. Crawford, B. C. Ha, N. E. Bibler and A. S. Choi. 1998b. Vitrification of Four Radioactive Hanford Waste Samples (U). SRTC-BNFL-023, Rev. 2. Savannah River Technology Center, Aiken, South Carolina.
Fiskum, S. K., D. E. Kurath, and B. M. Rapko. 2000. Development and Demonstration of a Sulfate Precipitation Process for Hanford Waste Tank 241-AN-107. BNFL-RPT-029, PNWD-3050 (to be published), Battelle, Pacific Northwest Division, Richland, Washington.
Hallen, R. T., P. R. Bredt, K. P. Brooks, and L. K. Jagoda. 2000. Combined Entrained Solids and Sr/TRU Removal from AN-107 Diluted Feed. BNFL-RPT-027, PNWD-3035 (to be published), Battelle, Pacific Northwest Division, Richland, Washington.
Kim, D. S., P. R. Hrma, S. E. Palmer, and D. E. Smith. 1995. “Effect of B2O3, CaO, and Al2O3 on the Chemical Durability of Silicate Glasses for Hanford Low-Level Waste Immobilization,” in Proceedings of the International Symposium on �Environmental Issues and Waste Management Technologies in the Ceramic and Nuclear Industries,” pp. 531-538. Ceramic Transactions, Vol. 61, The American Ceramic Society, Westerville, Ohio.
Kurath, D. E., D. L. Blanchard, and J. R. Bontha. 2000a. Small Column Ion Exchange Testing of Superlig 644 for Removal of 137Cs from Hanford Tank Waste Envelope C (Tank 241-AW-101),PNWD-3001, Battelle, Pacific Northwest Division, Richland, Washington.

6.2
Kurath, D. E., D. L. Blanchard, and JR Bontha. 2000b. Small Column Ion Exchange Testing of Superlig 644 for Removal of 137Cs from Hanford Tank Waste Envelope C (Tank 241-AN-107), PNWD-3039,Battelle, Pacific Northwest Division, Richland, Washington.
PNNL Operating Procedure, PNL-ALO-103, Rev. 1, 1990. “Water Leach of Sludges and Soils,” Pacific Northwest National Laboratory, Richland, Washington.
PNNL Operating Procedure, PNL-ALO-114, Rev 1, 1995. "Solubilization of Metals from Solids Using Na2O2 Fusion," Pacific Northwest National Laboratory, Richland, Washington.
PNNL Operating Procedure, PNL-ALO-115, Rev 1, 1995. "Solubilzatioin of Metals from Solids Using KOH-KNO3 Fusion," Pacific Northwest National Laboratory, Richland, Washington.
PNNL Operating Procedure, PNL-ALO-211, Rev. 0, 1991. “Determination of Elements by Inductively Coupled Argon Plasma Atomic Emission Spectrometry,” Pacific Northwest National Laboratory, Richland, Washington.
PNNL Operating Procedure, PNL-ALO-212, Rev. 1, 1992. “Determination of Inorganic Anions by Ion Chromatography,” Pacific Northwest National Laboratory, Richland, Washington.
PNNL Operating Procedure, PNL-ALO-280, Rev. 1, 1993. “Inductively Coupled Argon Plasma Atomic Emission Spectrometry (ICP/MS) Analysis,” Pacific Northwest National Laboratory, Richland, Washington.
PNNL Operating Procedure, PNL-ALO-281, Rev. 1, 1993. “(ICP/MS) Determination of 99Tc,” Pacific Northwest National Laboratory, Richland, Washington.
PNNL Operating Procedure, PNL-ALO-282, Rev. 1, 1996. “Determination of Uranium Concentration/Isotopic Composition Using ICP/MS,” Pacific Northwest National Laboratory, Richland,Washington.
PNNL Operating Procedure, PNL-ALO-381, Rev. 1, 1995. “Direct Determination of TC, TOC, and TIC in Radioactive Sludges and Liquids by Hot Persulfate Method,” Pacific Northwest National Laboratory, Richland, Washington.
PNNL Operating Procedure, RPG-CMC-408, Rev 0, 1999. "Total Alpha and Beta Analysis," Pacific Northwest National Laboratory, Richland, Washington.
PNNL Operating Procedure, PNL-ALO-417, Rev 2. 1996. "Separation of U, Am/Cm, and Pu and Actinide Screen by Extraction Chromatography," Pacific Northwest National Laboratory, Richland, Washington.
PNNL Operating Procedure, PNL-ALO-422, Rev 0, 1992. "Solution Analysis: Alpha Spectrometry," Pacific Northwest National Laboratory, Richland, Washington.
PNNL Operating Procedure, PNL-ALO-432, Rev. 0, 1992. “Separation of Technetium by Cation Exchange and Solution Extraction Prior to Measurement by Beta Counting,” Pacific Northwest National Laboratory, Richland, Washington.

6.3
PNNL Operating Procedure, PNL-ALO-450, Rev. 1, 1993. “Gamma Energy Analysis (GEA) and Low-Energy Photon Spectrometry (LEPS),” Pacific Northwest National Laboratory, Richland, Washington.
PNNL Operating Procedure, PNL-ALO-476, Rev. 1, 1995. “Strontium Determination Using SR-SPEC,”Pacific Northwest National Laboratory, Richland, Washington.
PNNL Operating Procedure, PNL-ALO-496, Rev 1, 1994. "Precipitation Plating of Actinides for High-Resolution Alpha Spectrometry," Pacific Northwest National Laboratory, Richland, Washington.
Smith, G. L. 1993. Characterization of Analytical Reference Glass-1 (ARG-1). PNL-8992, Pacific Northwest National Laboratory, Richland, Washington.
Urie, M. W., J. J. Wagner, L. R. Greenwood, O. T. Farmer, S. K. Fiskum, R. T. Ratner, C. Z. Soderquist. 1999a. Inorganic and Radiochemical Analysis of AW-101 and AN-107 Tank Waste. PNWD-2462,Battelle, Pacific Northwest Division, Richland, Washington.
Urie, M. W., J. J. Wagner, L. R. Greenwood, O. T. Farmer, S. K. Fiskum, R. T. Ratner, C. Z. Soderquist. 1999b. Inorganic and Radiochemical Analysis of AW-101 and AN-107 �Diluted Feed� Materials.PNWD-2463, Battelle, Pacific Northwest Division, Richland, Washington.

A.1
Appendix A: LAW Radioactive Glass Analysis Data

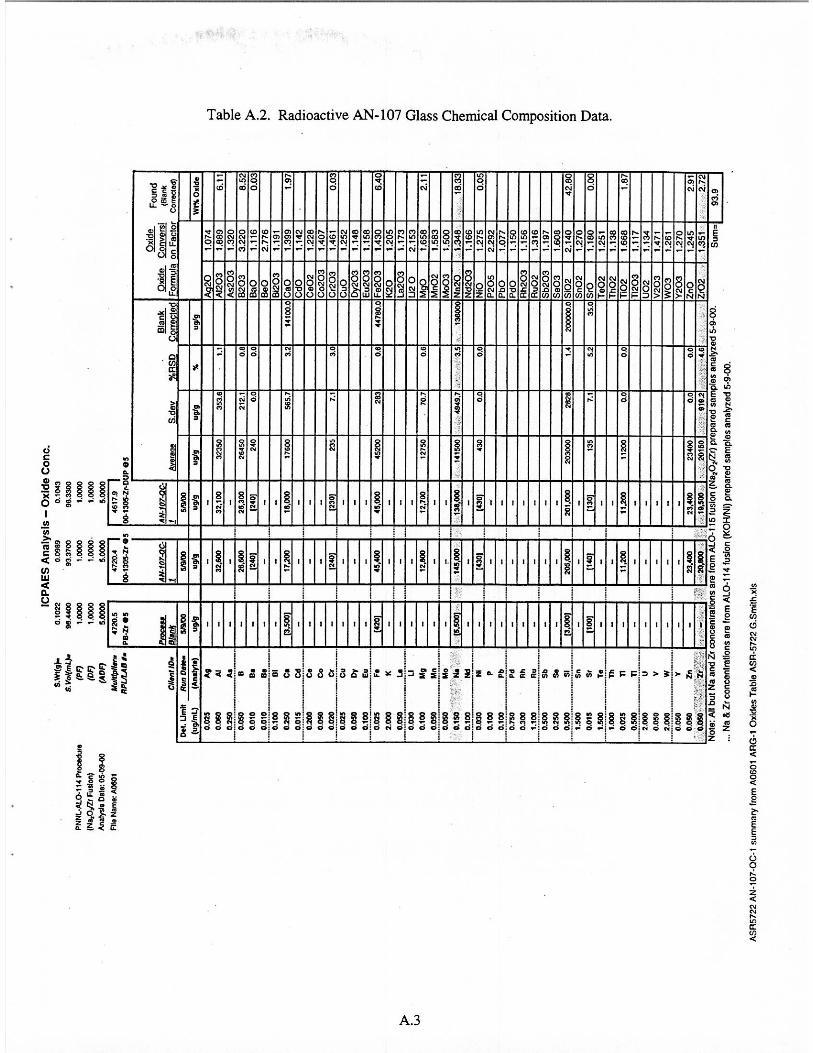


B.1
Appendix B: Crystalline and Non-Crystalline Phase Determination Data

B.2
Figure B.1. Radioactive AW-101 Glass Powder X-Ray Diffraction Results for Glass Heated to Simulate the Calculated ILAW Centerline Cooling Curve of a LAW Canister of Glass 2/5 of the Way from the
Bottom of the Canister. Note the completely amorphous character of this profile.
10 20 30 40 50 60 70
2-Theta(°)
x10^3
2.0
4.0
6.0
8.0
10.0
Inte
nsity
(Cou
nts)

B.3
Figure B.2. Radioactive AW-101 and AN-107 Glass Powder X-Ray Diffraction Results for Glass Heated to Simulate the Calculated ILAW Centerline Cooling Curve of a LAW Canister of Glass 2/5 of the Way
from the Bottom of the Canister. Note the amorphous character of these profiles with crystal XRD peaks superimposed. These peaks were subsequently found to match peaks from powder on the glove worn
when these powder mounts were made up. See Figure B-3.
0
10000
20000
30000
40000
50000
60000
0 20 40 60 80
degrees, 2
raw
cou
nts
AN-107
AW-101

B.4
Figure B.3. Radioactive AW-101 Glass Powder X-Ray Diffraction Results for Glass Heated to Simulate the Calculated ILAW Centerline Cooling Curve of a LAW Canister of Glass 2/5 of the Way from the
Bottom of the Canister. This initial XRD profile shows crystalline peaks that are identical with the XRD peaks produced by the mineral powder used to dust the gloves.
10 20 30 40 50 60 70
2-Theta(°)
x10^3
5.0
10.0
15.0
20.0
Inte
nsity
(Cou
nts)
Poly Glove
AW-101-CCC-2 Powdered Glass Sample

B.5
SEM Micrographs
Figure B.4. Radioactive AW-101 Glass SEM Micrograph from a Glass Sample Heated to Simulate the Calculated ILAW Centerline Cooling Curve of a LAW Canister.
Figure B.5. Radioactive AN-107 Glass SEM Micrograph from a Glass Sample Heated to Simulate the Calculated ILAW Centerline Cooling Curve of a LAW Canister.
C.1
Appendix C: Release Rate, Modified Product Consistency Test (PCT) Data


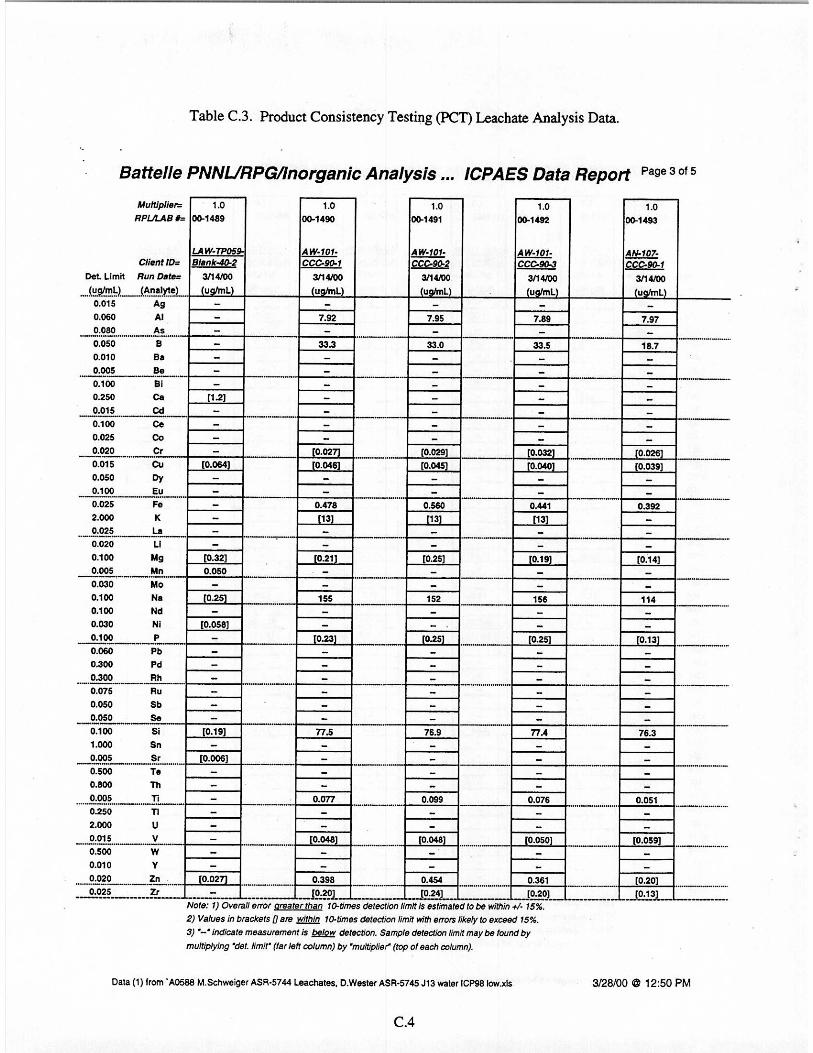
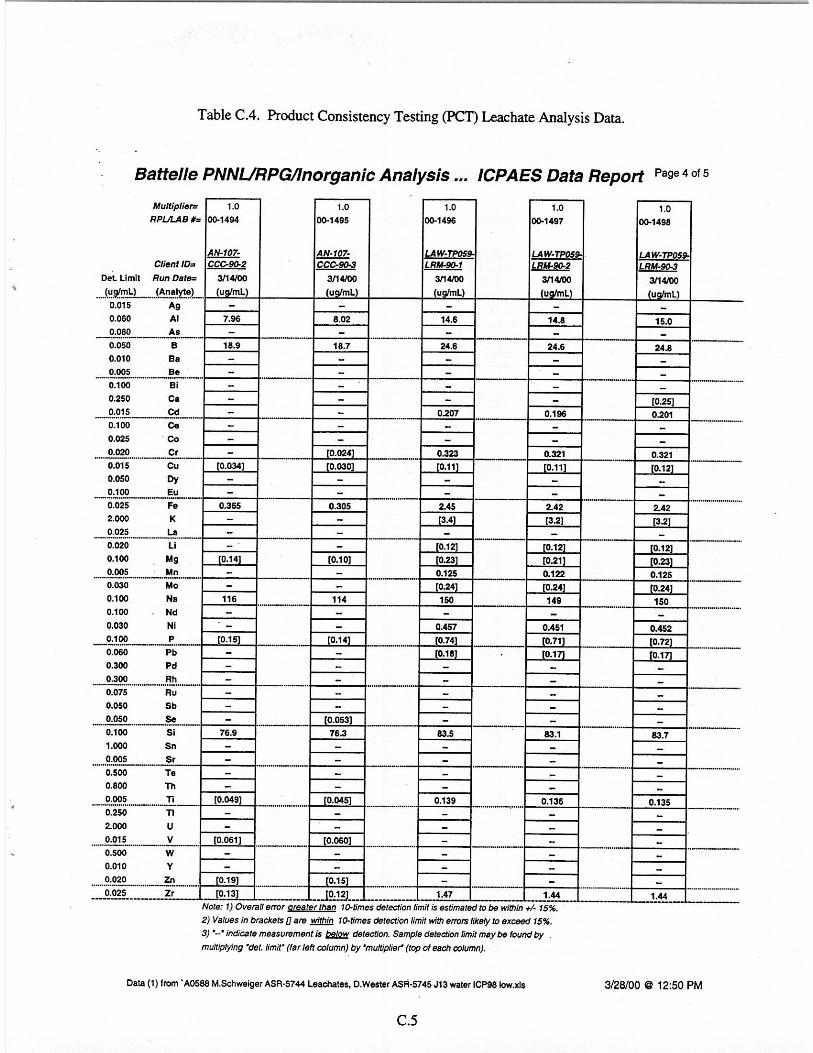

PNNL-13372WTP-RPT-003, Rev. 0
(Formerly BNFL-RPT-035)
Distr. 1
Distribution
No. ofCopies
OFFSITE
No. ofCopies
ONSITE
2 DOE/Office of Scientific and Technical Information
1 Harold SturmSavannah River Technology CenterPO Box 616, Road 1Building 773-A, Room A-233Aiken, SC 29808
1 Paul TownsonBNFL, Inc3000 George Washington WayRichland, WA 99352
1 Ed HigginbothamBNFL, Inc3000 George Washington WayRichland, WA 99352
7 CH2M Hill Hanford Group, Inc.S. T. Arm H4-02T. W. Crawford H4-02M. E. Johnson (4) H4-02A. Thompson H4-02
15 Pacific Northwest National LaboratoryL. R. Greenwood P7-22G. F. Piepel K5-12M. J. Schweiger K6-24H. D. Smith K6-24G. L. Smith (3) K6-24M. W. Urie P7-22J. J. Wagner P7-22Project Office P7-28Technical Report Files (5) K1-06


