Vitamin C Effects on Stressed Microbes Michael Limbacher Central Catholic High School February 4,...
24
Vitamin C Effects on Stressed Microbes Michael Limbacher Central Catholic High School February 4, 2012
-
Upload
dora-walsh -
Category
Documents
-
view
215 -
download
1
Transcript of Vitamin C Effects on Stressed Microbes Michael Limbacher Central Catholic High School February 4,...
Vitamin C Effects on Stressed MicrobesMichael Limbacher
Central Catholic High School
February 4, 2012
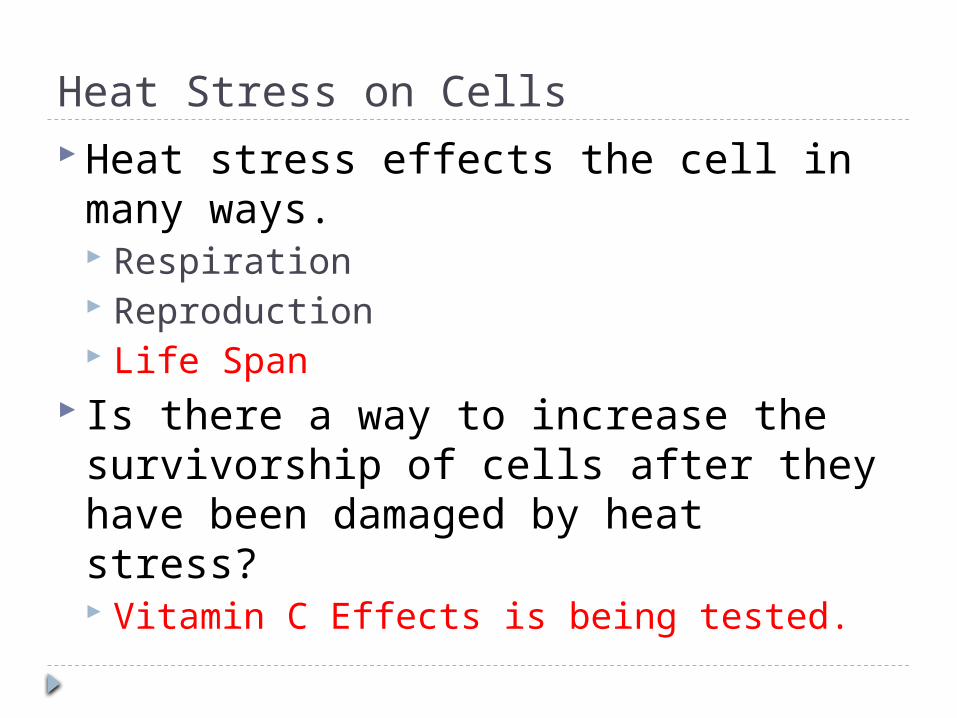
Heat Stress on Cells Heat stress effects the cell in many
ways. Respiration Reproduction Life Span
Is there a way to increase the survivorship of cells after they have been damaged by heat stress? Vitamin C Effects is being tested.

Ways Cells Respond to Stress In sudden emergencies, cells create
stress proteins that are programed to repair damage that the stress induces.
Stress proteins often restore damaged proteins to normal shape, thus restoring function. These proteins also are programed to
cope against infection, autoimmune disease, and in some cases cancer.

Pure Vitamin C One of the safest and most effective
nutrients Available in production in liquid and
solid form Benefits for Humans
Prevents immune system deficiencies Prevents eye disease and skin wrinkling Protects against cardiovascular disease Helps prevent free radicals

Orange First cultivated in China at c. 2500
B.C. Is best grown in tropical to
semitropical places 70 mg of Vitamin C per orange Nutritional benefits for humans
Resistance against infectious agents Helps maintain healthy skin and mucus
membrane Also possibly prevents the body from lung
and oral cavity cancers

Escherichia coli (E. coli) Gram-negative bacteria Commonly found in the lower intestine of
warm-blooded animals Most E. coli strains are harmless to
humans; however, some are very harmful.
Commonly used in biological experiments Easy manipulation Easy adaption to cultivation in a laboratory
environment

Staphylococcus epidermidis (Staph e.) Gram-positive bacteria Typically harmless skin-dwelling
microorganisms Commonly used in microbiological
experiments, due to variety of strain types within species Each strain has different features and
toxins

Purpose
Determine if 1% and 10% of Vitamin C and Orange Extract can increase the survivorship of stressed and unstressed microbes.

Hypotheses Null: Addition of Pure Vitamin C and
Orange Extract will not have an effect on the survivorship of stressed or unstressed microbes, E. coli and Staph e.
Alternate: Addition of Vitamin C and Orange Extract will increase survivorship of heat stressed or unstressed microbes, E. coli and Staph e.

Materials Sterile test tubes Test tube rack Micropipettes Pipette tips Klett Spectrophotometer
and sidearm flasks Escherichia coli Staphylococcus epidermidis LB agar plates (0.5% yeast
extract, 1% tryptone, 1% sodium chloride)
Sterile Dilution Fluid [SDF] (100mM KH2PO4, 100mM K2HPO4, 10mM MgSO4, 1mM NaCl)
California Naval Orange Extract
Pure Liquid Vitamin C (Ingredients: Vitamin C (300 mg) Purified Water, Sucrose, Glycerin, Methylparaben, Propylparaben
Filter Paper 55°C Water Spreader Bar Vortex Beaker Thermometer Incubator

Procedures (1)1. Bacteria (E. coli and Staph) were grown
overnight in sterile LB media.2. Samples of the overnight cultures were added
to fresh media in sterile sidearm flasks.3. The cultures were placed in an incubator
(37°C) until a density of 50 Klett spectrophotometer units was reached. This represents a cell density of approximately 108 cells/mL.
4. The cultures were diluted in sterile dilution fluid to a concentration of approximately 105 cells/mL.

Procedures (2)
5. Vitamin C/Orange Extract, SDF, and Microbes were added to sterile tubes to create the desired experimental concentrations.
Microbe SDFVitamin
C/OrangeTotal
0% Vit C/Orange 0.1 mL 9.9 mL 0 mL 10 mL
1% Vit C/Orange 0.1 mL 9.8 mL 0.1 mL 10 mL
10% Vit C/ Orange 0.1 mL 8.9 mL 1 mL 10 mL
Concetration Chart

Procedures (3)6. The solutions were vortexed and allowed to
sit at room temperature (Unstressed) or bathed at 55ºCelsius (Stressed) for 15 minutes.
7. After vortexing to evenly suspend the cells, 100 µL aliquots were removed from the tubes and spread on LB agar plates.
8. Plates (144 total) were incubated at room temperature for 48 hours.
9. Colonies were counted. Each colony was assumed to have arisen from one cell.

Supplement Effects on Unstressed E coli
Control (0%) 1% 10%0
100
200
300
400
500
600
Orange Extract
Vita-min C
Concentration
Nu
mb
er
of
Cells
Orange P Value= .405278 Vitamin C P Value= .364967

Supplement Effects on Unstressed Staph e
Control (0%) 1% 10%0
100
200
300
400
500
600
700
Orange ExtractVitamin C
Concentration
Nu
mb
er
of
Cells
Orange P Value= .000127Vitamin C P Value= .342471
Staph e. T-crit= 2.86
Concentration T Value Interpretation
Orange 1% 5.594 Significant
Orange 10% 4.376 Significant
T>T crit T>T crit

Supplement Effects on Stressed E coli
Control 0% 1% 10%0
5
10
15
20
25
30
35
40
45
Or-ange Extract
Concentration
Nu
mb
er
of
Cells
Vitamin C P Value = 8.26E-12 Orange P Value = 1.98E-11

Supplement Effects on Stressed Staph e
Control (0%) 1% 10%0
5
10
15
20
25
30
35
Orange ExtractVitamin C
Concentration
Nu
mb
er
of
Cells
Orange P Value= 2.16E-05 Vitamin C P Value= 7.27E-11

Dunnett’s Stat Test
E coli T crit= 2.86 Staph e T crit= 2.86
Concentration T Value Interpretation Concentration T Value Interperetation
Orange 1% 4.119 Significant Orange 1% 2.11 Not Significant
Orange 10% 18.697 Significant Orange 10% 6.763 Significant
Vitamin C 1% 3.472 Significant Vitamin C 1% 3.849 Significant
Vitamin C 10% 19.563 Significant Vitamin C 10% 17.108 Significant
STRESSED

Conclusions Vitamin C and Orange Extract did not have a
significant effect on survivorship of E. coli in unstressed conditions. (Accept Null)
Orange Extract appeared to adversely effect Staph e. survivorship in unstressed conditions. (Reject Null) Vitamin C, however, did not have a significant effect. (Accept Null)
Vitamin C and Orange Extract appeared to significantly increase the survivorship of stressed E. coli and Staph e. (Reject Null) (Insufficient evidence for stressed protection for 1% Orange Extract in Staph e.)

Limitations/Extensions Limitations
Lag time in plating Only 3 concentrations were used. Only one temperature for stress was used.
Extensions Increase Sample Size Use different types of antioxidants (Lycopene,
Vitamin A, Vitamin E) Expose to a different type stress (UV) Increase exposure time to the Vitamin C

References “Lysogeny Broth” Protocols Online. Web. 24 Dec 2011.
<http://protocolsonline.com/molecular-biology/lysogeny-broth/>.
“What Is E. Coli? (Escherichia Coli).” Medical News Today. Web. 24 Dec 2011.
<http://www.medicalnewstoday.com/articles/68511.php> “Staph Infection (Staphylococcus aureus) MedicineNet.
Web. 24 Dec 2011. <http://www.medicinenet.com/staph_infection/article.htm>
“Orange Fruit Nutrition Facts.” Power Your Diet. Web. 24 Dec 2011 <http://www.nutrition-and-you.com/orange-fruit.html>
“The Benefits of Vitamin C.” WebMD. Web. 24 Dec 2011. http://www.webmd.com/diet/guide/the-benefits-of-
vitamin-c

COLONY COUNT (1)
0% 1% 10% 0% Stress 1% Stress 10% Stress504 526 527 0 14 41511 515 542 7 22 39515 502 504 0 12 42516 495 515 2 10 38525 522 497 0 6 45522 482 522 4 5 44
515.5 507 517.8333 2.166667 11.5 41.5
Ecoli + Orange Extract
Ecoli + Vitamin C
0% 1% 10% 0% Stress 1% Stress 10% Stress532 541 546 1 7 44497 538 539 1 6 42519 532 541 0 11 32548 535 527 0 8 46528 539 522 0 9 36534 527 531 4 6 37
526.3333 535.3333 534.3333 1 7.833333 39.5

COLONY COUNT (2)
0% 1% 10% 0% Stress 1% Stress 10% Stress621 558 538 2 7 36616 512 555 2 8 24609 579 542 0 13 12589 538 563 1 11 27582 548 560 3 15 33598 514 571 2 9 48
602.5 541.5 554.8333 1.666667 10.5 30
Staph + Orange Extract
Staph + Vitamin C
0% 1% 10% 0% Stress 1% Stress 10% Stress625 609 620 1 8 22556 586 571 0 5 18657 592 592 0 4 26623 601 632 0 5 20598 572 609 3 4 21619 595 639 2 7 19613 592.5 610.5 1 5.5 21

ANOVA Sample
SUMMARYGroups Count Sum Average Variance
Column 1 6 13 2.166667 8.166667Column 2 6 65 10.83333 24.16667Column 3 6 249 41.5 7.5
ANOVASource of VariationSS df MS F P-value F crit
Between Groups5125.333 2 2562.667 193.0042 1.98E-11 3.68232Within Groups199.1667 15 13.27778
Total 5324.5 17