Vitamin Analysis in Food by UPLC–MS · 245 Vitamin Analysis in Food by UPLC–MS TABLE 10.1 List...
36
243 Vitamin Analysis in Food by UPLC–MS Ahmad Aqel, Kareem Yusuf, Asma’a Al-Rifai, and Zeid Abdullah Alothman 10.1 INTRODUCTION 10.1.1 VITAMIN STRUCTURE AND FUNCTION Vitamins are defined as a biologically active group of organic compounds that have a relatively low molecular weight. They are minor, but essential for an organism’s normal health and growth. Humans need to obtain them from food or supplements [1,2]. These nutrients facilitate the metabolism of proteins, carbohydrates, and fats. They are reported to reduce damage from free radicals [3], and insufficient levels may result in deficiency diseases [4]. Vitamins are relatively labile compounds that are affected by factors such as heat, light, air, pH, other food components, and food processing conditions [5–7]. Most vitamins and their related compounds are now synthetically produced and widely used as food or feed additives, medical or therapeutic agents, health aids, or cosmetic and technical aids [8]. 10.1.2 CLASSIFICATION OF VITAMINS Vitamins are classified by their biological and chemical activity, not their structure. Thus, there are 13 vitamins identified that are classified according to their solubil- ity into fat-soluble vitamins (A, E, D, and K) and water-soluble vitamins (B-group 10 CONTENTS 10.1 Introduction .................................................................................................. 243 10.1.1 Vitamin Structure and Function ....................................................... 243 10.1.2 Classification of Vitamins ................................................................ 243 10.2 Methods of Vitamin Analysis ....................................................................... 244 10.2.1 Importance of Analysis .................................................................... 244 10.2.2 Methods of Analysis ......................................................................... 244 10.3 Impetus behind Development of UPLC ....................................................... 251 10.4 UPLC–MS for Vitamins Analysis in Food .................................................. 253 Acknowledgment ................................................................................................... 273 References .............................................................................................................. 273
Transcript of Vitamin Analysis in Food by UPLC–MS · 245 Vitamin Analysis in Food by UPLC–MS TABLE 10.1 List...

243
Vitamin Analysis in Food by UPLC–MS
Ahmad Aqel, Kareem Yusuf, Asma’a Al-Rifai, and Zeid Abdullah Alothman
10.1 INTRODUCTION
10.1.1 Vitamin Structure and Function
Vitamins are defined as a biologically active group of organic compounds that have a relatively low molecular weight. They are minor, but essential for an organism’s normal health and growth. Humans need to obtain them from food or supplements [1,2]. These nutrients facilitate the metabolism of proteins, carbohydrates, and fats. They are reported to reduce damage from free radicals [3], and insufficient levels may result in deficiency diseases [4].
Vitamins are relatively labile compounds that are affected by factors such as heat, light, air, pH, other food components, and food processing conditions [5–7]. Most vitamins and their related compounds are now synthetically produced and widely used as food or feed additives, medical or therapeutic agents, health aids, or cosmetic and technical aids [8].
10.1.2 claSSiFication oF VitaminS
Vitamins are classified by their biological and chemical activity, not their structure. Thus, there are 13 vitamins identified that are classified according to their solubil-ity into fat-soluble vitamins (A, E, D, and K) and water-soluble vitamins (B-group
10
CONTENTS
10.1 Introduction .................................................................................................. 24310.1.1 Vitamin Structure and Function ....................................................... 24310.1.2 Classification of Vitamins ................................................................ 243
10.2 Methods of Vitamin Analysis .......................................................................24410.2.1 Importance of Analysis ....................................................................24410.2.2 Methods of Analysis .........................................................................244
10.3 Impetus behind Development of UPLC ....................................................... 25110.4 UPLC–MS for Vitamins Analysis in Food .................................................. 253Acknowledgment ................................................................................................... 273References .............................................................................................................. 273

244 Ultra Performance Liquid Chromatography Mass Spectrometry
vitamins and vitamin C) [9]. Table 10.1 shows the vitamin classes and their chemical name, structure, sources, functions, and deficiency diseases.
10.2 METHODS OF VITAMIN ANALYSIS
10.2.1 importance oF analySiS
Vitamin analysis in food has a variety of purposes; it is used to provide quality assur-ance for supplemented products; to study changes in vitamin content attributable to food processing, packing, and storage; to provide data for food composition tables; and to check compliance with contract specifications and nutrient labeling regulation [16]. This section gives a short overview of techniques for the analysis of the vitamin content in food and some of the problems associated with these techniques.
10.2.2 methodS oF analySiS
Many vitamins have sensitivity to different conditions, regardless of the type of assay applicable. Therefore, certain precautions need to be taken to prevent any dete-rioration throughout the analytical process. For example, in bioassays, some steps need to be followed with the test material throughout the feeding period, while in microbiological and physicochemical methods, they are required during extraction and analytical procedure [4,9].
Various vitamins belong to different classes of organic substances, so analysis of vitamins is performed by different chemical, physical, and biological methods [17]. Vitamin analysis methods can be classified as follows [18]:
• Bioassays involving humans and animals• Microbiological assays using organisms, bacteria, and yeast• Physicochemical assays, including spectrophotometric, fluorometric, chro-
matographic, enzymatic, immunological, and radiometric methods
• Bioassay methods Bioassays are procedures that can determine the con-centration of purity or biological activity of a substance such as vitamin, hormone, and plant growth factor [19]. They measure the enzyme under the influence of a vitamin and the phenotypic effects of their deficiency [18]. Bioassay methods are rarely used clinically for vitamin analysis; they are most commonly used for the analysis of vitamins B12 and D [20]. There are two types of bioassays:• In vivo bioassays Although this method is close to reality, it has many
disadvantages, including that it is not applicable for all vitamins, is time consuming, is an indirect method, is expensive, and has no clini-cal application [21].
• In vitro bioassays Compared with in vivo bioassays, this method is easier, is less time consuming, is inexpensive, can be used to analyze several vitamins, and is not close to reality, and the cell cultures are at risk of contamination [22].
Dow
nloa
ded
by [
Ahm
ad I
fsei
ai]
at 0
0:45
04
Apr
il 20
14

245V
itamin
An
alysis in Fo
od
by U
PLC–M
S
TABLE 10.1List of Vitamins with Their Chemical Name, Structure, Sources, Functions, and Deficiency Diseases
Vitamin Generic Descriptor Name
Vitamer Chemical Name Chemical Structure Solubility Food Sources Function
Deficiency Diseases
Vitamin A Retinol
HO
Fat Orange, ripe yellow fruits, leafy vegetables, carrots, milk, cheese, ice cream, liver
Necessary for normal vision, immune function, reproduction
Night blindness, hyperkeratosis, keratomalacia
Vitamin B1 Thiamine
HO H2N
N+
Cl–
S
N
N
Water Oatmeal, brown rice, vegetables, potatoes, liver, eggs
Allows the body to process carbohydrates and some protein
Beriberi, Wernicke–Korsakoff syndrome
Vitamin B2 Riboflavin
NNH
O
NOH
OH
OH
OH
N O
Water Dairy products, bananas, popcorn, green beans, asparagus
Key in the metabolism and the conversion of food into energy, helps produce red blood cells
Ariboflavinosis
continued
Dow
nloa
ded
by [
Ahm
ad I
fsei
ai]
at 0
0:45
04
Apr
il 20
14

246U
ltra Perform
ance Liq
uid
Ch
rom
atograp
hy M
ass Spectro
metry
TABLE 10.1 (continued)List of Vitamins with Their Chemical Name, Structure, Sources, Functions, and Deficiency Diseases
Vitamin Generic Descriptor Name
Vitamer Chemical Name Chemical Structure Solubility Food Sources Function
Deficiency Diseases
Vitamin B3 Niacin
N
OH
O Water Meat, fish, eggs, many vegetables, mushrooms, tree nuts
Assists in digestion and the conversion of food into energy, important in the production of cholesterol
Pellagra
Vitamin B5 Pantothenic acidHNHO
HO O
O
OH
Water Meat, broccoli, avocados
Important in fatty acid metabolism
Paresthesia
Vitamin B6 Pyridoxine
NHO
HO OH Water Meat, vegetables, tree nuts, bananas
Important for the nervous system, helps the body metabolize proteins and sugar
Anemia peripheral neuropathy
Vitamin B7 Biotin
OH
NHO H
HN
H
S
O
Water Raw egg yolk, liver, peanuts, certain vegetables
Helps with the synthesis of fats, glycogen, and amino acids
Dermatitis, enteritis
Dow
nloa
ded
by [
Ahm
ad I
fsei
ai]
at 0
0:45
04
Apr
il 20
14
247V
itamin
An
alysis in Fo
od
by U
PLC–M
S
Vitamin B9 Folic acid
O
HO
HN
O
HN
N
OHN
H2N
NN
O
HO
Water Leafy vegetables, pasta, bread, cereal, liver
Key for the development of cells, protein metabolism, and heart health, and in pregnant women, helps prevent birth defects
Megaloblast and deficiency during pregnancy is associated with birth defects, such as neural tube defects
Vitamin B12 Cyanocobalamin
CONH2
CONH2
CONH2
H2NOC
H2NOC
H
H2NOC
O
O
O–
OO
R = 5′-deoxyadenosyl, me, OH, CN
PO
HO
NN
N N
N
N
RCo+
HO
NH
Water Meat and other animal products
Important in the production of red blood cells
Megaloblastic anemia
continued
Dow
nloa
ded
by [
Ahm
ad I
fsei
ai]
at 0
0:45
04
Apr
il 20
14

248U
ltra Perform
ance Liq
uid
Ch
rom
atograp
hy M
ass Spectro
metry
TABLE 10.1 (continued)List of Vitamins with Their Chemical Name, Structure, Sources, Functions, and Deficiency Diseases
Vitamin Generic Descriptor Name
Vitamer Chemical Name Chemical Structure Solubility Food Sources Function
Deficiency Diseases
Vitamin C Ascorbic acid OH
OH
HO
OO
HOWater Many fruits and
vegetables, liver
Antioxidant that protects against cell damage, boosts the immune system, and forms collagen in the body
Scurvy
Vitamin D Cholecalciferol
HO
Fat Fish, eggs, liver, mushrooms, milk
Crucial in metabolizing calcium for healthy bones
Rickets, osteomalacia
Dow
nloa
ded
by [
Ahm
ad I
fsei
ai]
at 0
0:45
04
Apr
il 20
14

249V
itamin
An
alysis in Fo
od
by U
PLC–M
S
Vitamin E Tocopherols O
HO
Fat Many fruits and vegetables, nuts and seeds, apples
Antioxidant that protects cells against damage
Deficiency is very rare, mild hemolytic anemia in newborn infants
Vitamin K PhylloquinoneO
O
*3
Fat Leafy green vegetables, egg, liver, kiwi
Important in blood clotting and bone health
Bleeding diathesis
Source: Adapted from AIN (American Institute of Nutrition). 1990. J. Nutr. 120:643–644; Booher, L., Hartzler, E, and Hewston, E. 1942. U.S. Dept. Agric. Cir. 638:1–244; Booth, S. et al. 1993. J. Food Comp. Anal. 6:109–120; Kamal-Eldin, A. and Appelqvist, L. 1996. Lipids. 31:671–701; Sheppard, A. and Pennington, J. 1993. Analysis and Distribution of Vitamin E in Vegetable Oils and Foods. Marcel Dekker, New York; Rucker, R. et al. 2001. Handbook of Vitamins. 3rd Ed. Marcel Dekker, New York.
Dow
nloa
ded
by [
Ahm
ad I
fsei
ai]
at 0
0:45
04
Apr
il 20
14

250 Ultra Performance Liquid Chromatography Mass Spectrometry
• Microbiological assay methods This is a method of measuring com-pounds, such as vitamins and amino acids, using microorganisms. It determines or estimates the concentration or potency of an antibiotic by means of measuring and comparing the area of zone of inhibition or tur-bidity produced by the test substance with that of standard over a suitable microbe under standard conditions. The applicability of microbiological assays is limited to water-soluble vitamins; they are most commonly applied to niacin, cyanocobalamin, and pantothenic acid [4]. These methods are highly sensitive and specific for each vitamin. Although they are somewhat time consuming, they can generally be used for the analysis of a relatively wide array of biological matrices without major modifications [4]. An example of microbiological assays mentioned in the literature is for the determination of vitamins in tarhana [23].
• Physicochemical assay methods Because of their relative simplicity, accuracy, and precision, the physicochemical methods, in particular the chromatographic methods using high-performance liquid chromatogra-phy (HPLC), are the preferred method for vitamin analysis.
HPLC has been used increasingly in the analysis of food samples to separate and detect additives and contaminants. HPLC can separate a large number of compounds both rapidly and at high sensitivity, reduce separation times, and reduce the volume of sample needed. HPLC is ideally suited for compounds of limited thermal stability, but requires sample pretreatment such as extraction and filtration. In addition, HPLC requires careful selection of mobile phase and sample pumping rate [24].
Today, HPLC is used as a reference technique to analyze any type of vitamin [25]. This technique possesses simultaneous detection and determination of vitamins in one sample [17]. HPLC is often used for the simultaneous qualitative and quantitative analysis of water-soluble vitamin and fat-soluble vitamin in biological matrices such as plasma and urine [26–28].
A reversed-phase HPLC chromatographic procedure has been developed for the determination of water-soluble vitamins. As fat-soluble vitamins are highly lipo-philic molecules, they are analyzed by normal-phase or even reversed-phase HPLC with a methanol/acetonitrile mobile phase [29–33].
Nowadays, coupling mass spectrometer (MS) to HPLC has added a new dimen-sion to vitamin analysis since it enables the analysis of nonvolatile compounds. In general, LC–MS methods are now available for each fat- and water-soluble vita-min. The LC–MS assays are characterized by high sensitivity and high specificity [34,35]. In the last few years, the trend within the industry has been the adoption of multianalyte methods to improve lab efficiency and productivity. Modern HPLC systems have been improved to work at much higher pressures, and therefore be able to use much smaller particle sizes in the columns (<2 μm). The use of these systems allows for faster analyses, with significant improvements in sensitivity as well as in resolution compared to traditional HPLC methods [36]. These are ultraperformance liquid chromatography systems (UPLCs) [37,38]. The term UPLC is a trademark
Dow
nloa
ded
by [
Ahm
ad I
fsei
ai]
at 0
0:45
04
Apr
il 20
14

251Vitamin Analysis in Food by UPLC–MS
technology of the Waters Corporation, but people sometimes use it as a general term for the overall technique.
In addition to chromatographic techniques, several methods have been used for the determination and analysis of vitamins in different samples, such as immunoas-says [34] and electrochemical [6] and capillary electrophoresis [39].
10.3 IMPETUS BEHIND DEVELOPMENT OF UPLC
HPLC is a well-known technique that has proven to be the predominant analytical technology used in laboratories worldwide during recent years. HPLC is well estab-lished as a routine separation technique, this is in large part due to the many features offered by state-of-the-art HPLC such as robustness, ease of operation, well-under-stood separation principles, sensitivity, and tunable selectivity. However, although many chromatographers feel that HPLC is a mature analytical technology, the evolu-tions of HPLC are still ongoing. The main limitation of HPLC has long been known to be the lack of high efficiency, especially when compared to gas chromatography (GC) and capillary electrophoresis (CE) [40–42].
The primary driver factor responsible for the growth and development of this technique has been the evolution of packing materials used to effect the separation. The underlying principles of this evolution are governed by the van Deemter equa-tion, which describes the relationship between linear velocity and plate height.
Since particle size is one of the variables, a van Deemter curve can be used to investigate chromatographic performance. According to the van Deemter equation, when the particle size of the chromatographic sorbent is decreased, the efficiency of the separation process increases and the efficiency does not diminish at higher flow rates or linear velocities [43–45]. By using smaller particles, speed and peak capac-ity can be extended to new limits, termed UPLC. As shown in Figure 10.1, smaller
00.00
5.00
10.00
15.00
20.00
25.00
30.00
35.00
2 4 6 8 10Linear velocity (mm/s)
HET
P (μ
m)
12 14
dp = 3 μm
dp = 5 μm
dp = 10 μm
dp = 1.7 μm
FIGURE 10.1 Van Deemter curves for different particle sizes (10, 5, 3, 1.7 μm). (Adapted from Novakova, L., Matysova, L., and Solich, P. 2006. Talanta. 68:908–918. With permission.)
Dow
nloa
ded
by [
Ahm
ad I
fsei
ai]
at 0
0:45
04
Apr
il 20
14

252 Ultra Performance Liquid Chromatography Mass Spectrometry
particles provide increased efficiency as well as the ability to work at increased linear velocity without a loss of efficiency, providing both resolution and speed [46].
UPLC technology takes full advantage of chromatographic principles to run separations using columns packed with smaller particles and higher flow rates for increased speed, with superior resolution and sensitivity [45,47]. Working with smaller particles (<2.5 μm) provide both resolution and speed. Efficiency is the pri-mary separation parameter behind UPLC since it relies on the same selectivity and retentivity as HPLC.
The resolution is proportional to the square root of plate numbers. However, since plate numbers are inversely proportional to particle size (as the particle size is low-ered by a factor of three, from, e.g., 5 μm [HPLC scale] to 1.7 μm [UPLC scale]), plate numbers are increased by three and the resolution is increased by the square root of three, or 1.7. Plate numbers are also inversely proportional to the square of the peak width. This illustrates that the narrower the peaks, the easier they are to separate from each other.
Also, peak height is inversely proportional to peak width, so, as the particle size decreases to increase plate numbers and subsequently the resolution, an increase in sensitivity is obtained, since narrower peaks are taller peaks. Narrower peaks also mean more peak capacity per unit time. Efficiency is proportional to column length and inversely proportional to the particle size [45,48]. Therefore, the column can be shortened by the same factor as the particle size without loss of resolution.
In practice, the design and development of sub-2 μm particles is a significant challenge. As particle size decreases, the optimum flow to reach maximum plate numbers increases and the use of smaller particles is then substantially limited by a rapid increase in pressure drop [49]. Standard HPLC instruments have a maximum operating pressure of about 400 bar (6000 psi), and these systems simply do not have the capability to take full advantage of sub-2 μm particles.
Other factors and instrument parts should also be taken into account to take full advantage of UPLC separations. A completely new system design with advanced tech-nology in the solvent and sample manager, packing method, introduction method, injec-tion valves, detector sampling rate, data system, and service diagnostics is required [50].
In order to overcome the pressure limitations and the other challenges, Waters Corporation introduced Acquity UPLC™, the first commercially available system that addresses the challenge of using elevated pressure and sub-2 μm particles, which makes it a particularly attractive and promising analysis tool [51]. The UPLC instrumentation is designed to deliver mobile phase at pressures up to 1034 bar (15,000 psi). The researchers were very active in this area for some time to manufac-ture columns that can withstand these rigorous pressures [52,53].
Using sub-2 μm particles, half-height peak widths of less than 1 s can be obtained, posing significant challenges for the detector. In order to accurately and reproducibly integrate an analyte peak, the detector sampling rate must be high enough to capture enough data points across the peak. In addition, the detector cell must have minimal dispersion volume to preserve separation efficiency.
Mass detection is significantly enhanced by UPLC; increased peak concentrations with reduced chromatographic dispersion at lower flow rates promotes increased source ionization efficiencies (reduced ion suppression) for improved sensitivity.
Dow
nloa
ded
by [
Ahm
ad I
fsei
ai]
at 0
0:45
04
Apr
il 20
14

253Vitamin Analysis in Food by UPLC–MS
Enhanced selectivity and sensitivity, and rapid generic gradients made LC–MS the predominate technology for both quantitative and qualitative analyses [54–56].
UPLC can be regarded as a new invention for liquid chromatography. Compared with conventional HPLC, UPLC can offer significant improvements in speed, sen-sitivity, and resolution, which also mean reduced solvent consumption and analysis cost. Figure 10.2 shows an HPLC versus UPLC separation comparison of a ginger root extract sample, where both speed and resolution are improved, and sensitivity is increased [57].
With the increasing number, diversity, and complexity of compounds being ana-lyzed, UPLC presents the possibility to extend and expand the utility of separation science. Today, UPLC is widely used for metabolite identification; analysis of natural products and herbal medicines; pharmacokinetic, toxicity, degradation, bioanalysis, and bioequivalence studies; quality control and in drug discovery; determination of pesticides; and separation of various pharmaceutical-related small organic mol-ecules, proteins, and peptides. UPLC is also used for impurity profiling, method development, and validation performed in quality assurance and quality control laboratories [46,47,56–69].
10.4 UPLC–MS FOR VITAMINS ANALYSIS IN FOOD
The determination of vitamins in food represents a complex analytical problem. Vitamins naturally present in foods at very low levels and in very complex matrixes. Furthermore, vitamins are easily destroyed by strong acids or alkali; affected by many factors such as pH, heat, light, air, extraction solvent, and time; and also affected by other food components.
0.8 AUFS
2.1 AUFS
Time in minutes
UPLCTM
5 μL injection
HPLC10 μL
injection
Time in minutes
10.0
6.0
FIGURE 10.2 Comparison of HPLC and UPLC for the separation of a ginger root extract. (Adapted from Swartz, E. 2005. J. Liq. Chromatogr. Related Technol. 28:1253–1263. With permission.)
Dow
nloa
ded
by [
Ahm
ad I
fsei
ai]
at 0
0:45
04
Apr
il 20
14

254 Ultra Performance Liquid Chromatography Mass Spectrometry
Despite the development of several HPLC and LC–MS methods for vitamin anal-ysis in food [6,70,71], there is still a need for better resolution and sensitivity when analyzing complex food matrices containing different vitamin derivatives. Owing to its high resolution and sensitivity, as well as its high sample throughput, UPLC is particularly attractive in the area of food analysis where sample matrices are very complex. However, research in this field is still limited, and much efforts and time are needed in order to provide more information and to improve the existing meth-ods. Table 10.2 summarizes the most significant recently published UPLC methods for the determination of vitamins in different food samples.
The content of vitamin C in food commodities (the sum of the contents of l-ascor-bic acid and dehydroascorbic acid) is used as an index of health-related quality of products, since, as compared with other beneficial compounds, it is more sensitive for degradation by processing and storage. Therefore, interest in the simultaneous analysis of these molecules has increased greatly in food analysis [72–74]. Spinola et al. [75] determined the total vitamin C content in several fruits and vegetables (lemons, passion fruits, papayas, strawberries, broccoli, green and red peppers) using UPLC-photodiode array (PDA) system.
The system was equipped with a trifunctional high-strength silica (100% silica particle) analytical column (Acquity HSS T3; 100 × 2.1 mm i.d., 1.8 μm particle size), using an isocratic mobile phase composed of aqueous 0.1% (v/v) formic acid at a flow rate of 250 μL/min. The injection volume was 20 μL, while the detection wavelength for the PDA was set at 245 nm, and the analytical column was kept at room temperature [75].
The flow rate and the mobile phase composition significantly influenced l-ascor-bic acid retention time. Careful selection of the eluent systems demonstrated that the chromatographic separation of the l-ascorbic acid could be achieved within 2 min. The best flow value (250 μL/min) was compromised between the backpressure (approximately 5800 psi), retention times, and peak resolution. The combination of the shorter running time with a smaller flow rate also reduced drastically the solvent consumption and thus is more environmental friendly than conventional HPLC [75].
Vitamin C refers to all compounds exhibiting equivalent biological activity of l-ascorbic acid, including its oxidation products, esters, and synthetic forms [73,76]. l-Ascorbic acid is the main biologically active form of vitamin C and is reversibly oxidized to dehydroascorbic acid, due to the presence of two hydroxyl groups in its structure [77–79], or diketogulonic acid, which has no biological function, and the reaction is no longer reversible [72,76]. The type of extraction medium is therefore very important in order to prevent the irreversible oxidation of l-ascorbic acid.
The use of a high ionic strength acidic extraction solvent is required to suppress metabolic activity upon disruption of the cell and to precipitate proteins. A metal chelator such as ethylenediaminetetraacetic acid (EDTA) is also usually required. The use of metaphosphoric acid is the best way to extract and stabilize l-ascorbic acid, as suggested by various authors [72,78,80,81]. For this reason, the samples were extracted with 3% metaphosphoric acid–8% acetic acid–1 mM EDTA solution, which is known to limit l-ascorbic acid degradation to less than 5% [82].
The l-ascorbic acid content ranged between 27.8 ± 2.3 and 223.7 ± 16.5 mg/100 g of edible portion in the different horticultural products. Peppers (red and green) and
Dow
nloa
ded
by [
Ahm
ad I
fsei
ai]
at 0
0:45
04
Apr
il 20
14

255V
itamin
An
alysis in Fo
od
by U
PLC–M
S
TABLE 10.2UPLC Methods for Determination of Vitamins in Different Food Samples
Analytes Food Sample Sample Preparation Column Mobile Phase LOD
Flow Rate
(mL/min)
Run Time (min) Ref.
l-Ascorbic acid and dehydroascorbic acid
Lemons, passion fruits, papayas, strawberries, broccoli, green and red peppers
Extraction with 3% metaphosphoric acid–8% acetic acid–1 mM EDTA
HSS T3 (100 × 2.1 mm, 1.8 μm)
Aqueous 0.1% (v/v) FA
22 ng/mL 0.25 2 [75]
Cis- and trans-phylloquinone
Infant formula (milk-, rice-, and soy-based)
Digest samples with lipase, extract with methanol, sodium hydroxide solution, and n-hexane mixture
BEH Shield RP18, BEH C18, T3 (100 × 2.1, 1.7 μm), YMC30 (150 × 4.6 mm, 3 μm)
0.025% FA and 2.5 mmol/L NH4HCO2 in CH3OH
0.011 μg/100 g for trans-form and 0.01 μg/100 g for cis-form
0.6 13.5 [83]
Vitamins B5, B8, B9, and B12
Fortified infant foods (milk and rice)
Proteins and lipids removal with chloroform, extraction with 10 mmol/L ammonium acetate
BEH C18 column (100 × 2.1 mm, 1.7 μm)
Gradient elution of CH3CN and H2O
5, 30, 6, and 6 ng/L for vitamin B5, B8, B9, and B12
0.2 6 [85]
Thiamine, riboflavin, nicotinamide and pyridoxal
Human milk Proteins removal by acetonitrile and trichloroacetic acid and Amicon Ultra-0.5 centrifugal filters, extraction with water and methanol, extraction of the nonpolar constituents with diethyl ether
HSS T3 column (50 × 2.1 mm, 1.8 μm)
Gradient of 10 mM NH4HCO2 and CH3CN
0.01, 0.1, 0.5, and 4 μg/L for thiamine, riboflavin, nicotinamide, and pyridoxal
0.3 2 [86]
continued
Dow
nloa
ded
by [
Ahm
ad I
fsei
ai]
at 0
0:45
04
Apr
il 20
14

256U
ltra Perform
ance Liq
uid
Ch
rom
atograp
hy M
ass Spectro
metry
TABLE 10.2 (continued)UPLC Methods for Determination of Vitamins in Different Food Samples
Analytes Food Sample Sample Preparation Column Mobile Phase LOD
Flow Rate
(mL/min)
Run Time (min) Ref.
Thiamine, riboflavin, pantothenic acid, pyridoxine, pyridoxal, biotin, folic acid, cyanocobalamin, ascorbic acid, l-carnitine, choline, and taurine
Fortified infant formula (rice flour and wheat powder)
Extraction with 10 mM aqueous ammonium acetate
BEH Shield RP18 (100 × 2.1 mm, 1.7 μm)
CH3OH and 10 mM aqueous NH4C2H3O2
Ranged between 0.0042 ng/mL for riboflavin and 28.872 ng/mL for ascorbic acid
0.2 10 [91]
Vitamins D2 and D3
NIST 1849, ready-to-eat cereal, bread, mushrooms, eggs, yogurt, cheese, fish, butter, milk (RTF infant formula), and premix
Saponification (hot), extraction of unsaponifiables with hexane
HSS C18 (100 × 2.1 mm, 1.8 μm)
Gradient elution of CH3OH and NH4HCO2
0.20 and 0.47 μg/100 g for vitamins D2 and D3
0.4 6 [92]
Dow
nloa
ded
by [
Ahm
ad I
fsei
ai]
at 0
0:45
04
Apr
il 20
14

257V
itamin
An
alysis in Fo
od
by U
PLC–M
S
Vitamins D2 and D3
Infant formula and adult/pediatric nutritional supplements
Saponification (ambient), extraction of unsaponifiables with hexane
Hypersil GOLD and GOLD aQ (100 × 2.1 mm, 1.9 μm)
Gradient elution of 0.1% FA CH3OH and H2O
0.65 and 0.83 ng/g for vitamins D3 and D2
0.25–0.5 10 [94]
5-CH3-H4folate, H4folate, 5-HCO-H4folate, 10-HCO-folic acid, and folic acid
Egg yolk, pickled beetroots, strawberries, orange juice, soft drink, and dry baker’s yeast
Extraction with 0.1 M phosphate buffer pH 6.1, 2% sodium ascorbate and 0.1% 2,3-dimercaptopropanol. Extract purification by SPE on SAX Isolute cartridges. Elution with 0.1 M sodium acetate, 10% sodium chloride, 1% ascorbic acid, and 0.1% 2,3-dimercaptopropanol
BEH C18 (100 × 2.1 mm, 1.7 μm)
Gradient elution of 30 mM KH2PO4 buffer at pH 2.3 and CH3CN
Ranged from 0.02 to 2.5 ng/mL
0.5–0.7 3.5 [95]
Folic acid and 5-CH3-H4folate
Fortified breads Hydrolysis with α-amylase in a water bath at 75°C, extraction with phosphate buffer (pH 6.1), concentration using SPE on styrene divinylbenzene cartridges
HSS T3 (100 × 0.1 mm, 1.8 μm)
Gradient elution of 0.1% FA in H2O and CH3CN
9.0 ng/g for folic acid and 4.3 ng/g for 5-CH3-H4folate
0.2 6 [101]
continued
Dow
nloa
ded
by [
Ahm
ad I
fsei
ai]
at 0
0:45
04
Apr
il 20
14

258U
ltra Perform
ance Liq
uid
Ch
rom
atograp
hy M
ass Spectro
metry
TABLE 10.2 (continued)UPLC Methods for Determination of Vitamins in Different Food Samples
Analytes Food Sample Sample Preparation Column Mobile Phase LOD
Flow Rate
(mL/min)
Run Time (min) Ref.
H4folate, 5-CH3-H4folate, 10- CH3-H4folate, 10-HCO-folic acid, 5-HCO-H4folate, and folic acid
Rice Hydrolysis with α-amylase, protease, and deconjugase, extraction with phosphate buffer at pH 7.5
HSS T3 (150 × 2.1 mm, 1.8 μm)
Gradient elution of 0.1% FA in H2O and CH3CN
Ranged between 0.06 and 0.45 μg/100 g
0.6 8 [108]
Retinol, α-, δ-, γ- tocopherols
Milk Lipophilic components extraction by n-hexane/ethyl acetate, extraction of xanthophylls and vitamin E by ethanol/water, saponification hexanic phase (hot), purification by n-hexane/ethyl acetate
HSS T3 (150 × 2.1 mm, 1.8 μm)
Gradient elution of CH3CN–CH2Cl2–CH3OH (75–10–15) and NH4C2H3O2 0.05 M in H2O
0.8 and 2.6 ng/injection for retinol and α-tocopherol
0.4 46 [110]
Dow
nloa
ded
by [
Ahm
ad I
fsei
ai]
at 0
0:45
04
Apr
il 20
14

259Vitamin Analysis in Food by UPLC–MS
papayas were the species with the highest initial vitamin C contents. The food com-modities with the lowest content of total vitamin C were passion fruits [75].
Good linearity was achieved in both ranges of concentrations tested, with cor-relation coefficients higher than 0.999 in all cases. The proposed method showed a good sensitivity, with limit of detection (LOD) and limit of quantification (LOQ) of 22 and 67 ng/mL, respectively. The method also showed satisfactory precision. All relative standard deviation (RSD) values achieved for peak areas were lower than 4%. The results obtained showed that the applied method has a good reproducibility and that is stable and reliable. The recovery rate of l-ascorbic acid and total vitamin C was evaluated to assess the extraction efficiency of the proposed method and matrix effects. Satisfactory results were obtained for l-ascorbic acid (96.6 ± 4.4%) and total vitamin C (103.1 ± 4.8%) [75].
The results demonstrated by Spinola and his coworkers revealed an attractive and very promising approach for the analysis of total vitamin C and l-ascorbic acid and for routine use in laboratory. The major improvement of this methodology makes use of a very simple but very effective mobile phase that promotes ion suppres-sion at very high pressures with a trifunctional high-strength silica column specially designed for polar compounds, overcomes the problems normally encountered in HPLC systems, and is suitable for the analysis of large batches of samples without l-ascorbic acid degradation.
Infant food such as human milk and fortified formula provide an essential source of nutrition for baby feed. This nutrition is essential for normal growth and function-ing of the human body; therefore, particular attention should be paid to ensure an adequate and balanced intake of vitamins. Several methods have been developed for the analysis of vitamins in infant foods. Huang and coworkers determined vitamin K1 isomers (cis- and trans-forms) in infant formulas using UPLC–MS/MS [83].
Vitamin K1 (phylloquinone) exists naturally only in the trans-form. Trans- and cis-isomers are formed during UV light exposure or synthetic production of vitamin K1. This cis-isomer is considered to have low bioactivity [84]. Therefore, inactive cis-vitamin K1 is necessary to measure individually to evaluate the true nutritional status of fortified foods. The developed method proved to be rapid and sensitive, which allows cis- and trans-vitamin K1 extracted from milk-based, rice-based, and soy-based infant formula to be simultaneously determined by UPLC–MS/MS [83].
Sample preparation procedure mainly involves the lipase hydrolysis and the liquid-to-liquid extraction. After hydrolysis at 37°C for 2 h, the sample was extracted with a mixture solution of methanol, sodium hydroxide solution, and n-hexane. The upper phase was then washed with distilled water. The upper phase, contain-ing n-hexane with nitrogen, is evaporated to near dryness and reconstituted with methanol. After the filtration, 5 μL of the vitamin K1-enriched extract was directly injected into the UPLC–MS/MS for analysis.
Four columns and several mobile phases were compared in this study. Acquity UPLC BEH Shield RP18 (100 × 2.1 mm i.d., 1.7 μm particle size), Acquity UPLC BEH C18 (100 × 2.1 mm i.d., 1.7 μm particle size), Acquity UPLC T3 (100 × 2.1 mm i.d., 1.7 μm particle size), and YMC30 (150 × 4.6 mm i.d., 3 μm particle size) were used for comparisons to the separation capability in vitamin K1 isomers. The type of column plays an important role in the separation of vitamin K1 isomers. As a result,
Dow
nloa
ded
by [
Ahm
ad I
fsei
ai]
at 0
0:45
04
Apr
il 20
14

260 Ultra Performance Liquid Chromatography Mass Spectrometry
the biggest peak areas of vitamin K1 isomers were obtained when using 0.025% formic acid and 2.5 mmol/L ammonium formate in methanol as a mobile phase [83].
The study showed that the level of lipase use and enzymatic hydrolysis time play key roles in vitamin K1 quantification in infant formulas. Chromatograms of vita-min K1 standards and a sample were shown in Figure 10.3.
Trans-vitamin K1 was separated from cis-isomer through YMC30 column (150 × 4.6 mm, 3 μm particle size), and vitamin K1-d7 was used as an internal stan-dard. The components were detected using electrospray ionization (ESI) in a positive ion and quantified by multiple reaction monitoring (MRM) mode. The transition m/z 451.2 → 186.9 was selected for vitamin K1, and the transition m/z 458.2 → 194.0 was selected for vitamin K1-d7. Calibration curves were linear over the range of 9.3–464.75 ng/mL for trans-vitamin K1 (r2 > 0.999) and 1.71–85.25 ng/mL for cis-vitamin K1 (r2 > 0.999). The limit of detection for trans- and cis-vitamin K1 was 0.011 μg/100 g and 0.01 μg/100 g, respectively, while the limit of quantifica-tion was 0.037 μg/100 g and 0.031 μg/100 g, respectively. The intra- and interbatch variations in terms of RSD were less than 5%. The cis-vitamin K1 isomer contrib-utes to 7.05–17.21% of the total vitamin K1 in certain infant formulas [83].
Reversed-phase UPLC separation system was also used for the determination of four water-soluble B vitamins, including B5, B8, B9, and B12 in fortified infant foods using Waters Acquity UPLC BEH C18 column (100 × 2.1 mm i.d., 1.7 μm particle size), and a binary gradient, acetonitrile–water mobile phase [85].
Prior to analysis, the coextracted proteins and lipids should be removed from the prepared solution. Out of the tested solvents (chloroform, acetonitrile, and ethyl
FV-20120523-024 Smooth(Mn, 1×2)vK1 std-10ng
(a) (b)
FV-20120523-024 Smooth(Mn, 1×2)vK1 std-10ng
FV-20120523-025 Smooth(Mn, 1×2)0523QC-1
FV-20120523-025 Smooth(Mn, 1×2)0523QC-1
vK1-trans11.39
vK1-d7-transvK1-d7-trans11.14
12.757.88
MRM of 5 channels, ES-451.3 > 186.8
4.376e+004
MRM of channels, ES-458.4 > 193.9
2.212e+005
MRM of 5 channels, ES+451.3 > 186.8
1.56e+005
MRM of 5 channels, ES+458.4 > 193.9
1.013e+005
Trans-vitamin K1
Trans-vitamin K1-d7
Cis-vitamin K1-d7
Cis-vitamin K1
11.32
12.66
min min
min
12.50
100
0
%
100
02.0 4.0 6.0 8.0
Vitamin K1 standard10.0 12.0 14.0 16.0 18.0 2.0 4.0 6.0 8.0
Milk-based infant formula sample10.0 12.0 14.0 16.0 18.0
min
%
100
0
%
100
0
%
11.09 12.48
FIGURE 10.3 MRM diagrams of standards and a sample: (a) vitamin K1 and vitamin K1-d7 standards and (b) a milk-based infant formula sample. (Adapted from Huang, B. et al. 2012. Eur. Food Res. and Technol. 235:873–879. With permission.)
Dow
nloa
ded
by [
Ahm
ad I
fsei
ai]
at 0
0:45
04
Apr
il 20
14

261Vitamin Analysis in Food by UPLC–MS
acetate), chloroform precipitated proteins and lipids more effectively than acetoni-trile and ethyl acetate did. Thus, chloroform was used as a solvent for eliminating proteins and lipids.
In order to obtain complete extraction of the vitamins from food samples, three extraction media including water, 0.1% formic acid aqueous solution, and 10 mmol/L ammonium acetate aqueous solution were tested. Methotrexate was selected as an internal standard because it is usually absent in fortified infant foods, its molecular structure is similar to vitamin B9 (MW = 454), and it has a suitable retention time (4.78 min) according to the retention times of the four vitamins in this LC system. Recovery tests showed that recoveries of methotrexate were similar to those of the concerned vitamins [85].
Formic acid is spiked into the mobile phase to enhance the ionization effi-ciency. Tandem MS–MS analysis is performed in MRM. Product ion traces at m/z 220.1 → 89.9 for vitamin B5, 245.1 → 227.1 for vitamin B8, 442.3 → 295.2 for vita-min B9, and 678.9 → 147.0 for vitamin B12 are used for quantitation of the cor-responding vitamins, and traces at m/z 455.5 → 308.0 are used for methotrexate (internal standard). LOQs are 0.016, 0.090, 0.020, and 0.019 μg/L for vitamin B5, B8, B9, and B12, respectively. LODs are 0.005, 0.030, 0.006, and 0.006 μg/L for vitamin B5, B8, B9, and B12, respectively. Intra- and interday precisions for the determination of the four vitamins are better than 6.84% and 12.26% in RSD, and recoveries for the four vitamins are in the range of 86.0 ~ 101.5% [85].
From the three tested extraction media, it was found that 10 mmol/L ammonium acetate aqueous solutions gave the best recoveries, corresponding to 93.6%, 99.1%, 85.3%, and 95.0% for vitamins B5, B8, B9, and B12, respectively.
In preliminary tests, four ODS C18 columns with different column size and/or different particle size were compared regarding the separation of the four vitamins and methotrexate internal standard. Column A is a Waters Atlantis C18 column (150 × 2.1 mm i.d., 5 μm particle size), column B is a Waters Sunfire C18 column (150 × 2.1 mm i.d., 5 μm particle size), column C is a Waters Acquity UPLC BEH C18 column (50 × 2.1 mm i.d., 1.7 μm particle size), and column D is a Waters Acquity UPLC BEH C18 column (100 × 2.1 mm i.d., 1.7 μm particle size).
It was found (as shown in Figure 10.4) that columns A and B, two frequently used columns for LC–MS, could neither separate the four vitamins and methotrex-ate effectively, nor generate reproducible peak areas in parallel runs, while column C could not separate methotrexate and vitamin B12. Only column D could sepa-rate the vitamins and methotrexate and support constant retention times and peak areas in parallel experiments. Therefore, column D was selected for the real sample studies.
The developed method was applied to analyze 10 brands of fortified milk powders and 9 brands of fortified rice powders, which were purchased from a local food mar-ket (Hangzhou, China). The obtained results are consistent with those claimed by the producers. So, the method can be applied successfully to analyze vitamins B5, B8, B9, and B12 in the fortified rice and milk powders [85].
Hampel et al. described simultaneous determination of several B vitamins (thia-mine, riboflavin, nicotinamide, and pyridoxal) in human milk samples using the UPLC–MS/MS method [86].
Dow
nloa
ded
by [
Ahm
ad I
fsei
ai]
at 0
0:45
04
Apr
il 20
14

262 Ultra Performance Liquid Chromatography Mass Spectrometry
Sample preparation of human milk depends strongly on the vitamins in ques-tion and limits the number of different vitamins that can be analyzed simultane-ously [87–89]. Sample preparation was carried out under subdued light and on ice to protect the analytes from degradation. Targeted vitamins were extracted by water and methanol after several dilution, centrifugation, dryness, and filtration steps. The nonpolar constituents of the matrix were then extracted with diethyl ether [90].
Additional sample preparation steps included protein removal by acetonitrile and trichloroacetic acid and Amicon Ultra-0.5 centrifugal filters, while hexane was used to remove the nonpolar constituents. Amicon Ultra-0.5 centrifugal filters were used for the efficiency of protein removal. Choosing an appropriate molecular weight cut-off allows the vitamins as small molecules (MW < 1000) to elute through the filter unit and to be recovered in the flow through, while the protein fraction with a high molecular weight (MW > 10,000) is retained in the filter unit.
Using Acquity UPLC HSS T3 column (50 × 2.1 mm i.d., 1.8 μm particle size) reversed-phase chromatography, water, 10 mM ammonium formate, 0.1% ammo-nium formate, 10 mM ammonium acetate, and 10 mM formic acid were tested for the aqueous buffer component of the mobile phase, while methanol and acetonitrile were examined as the organic constituent. Best peak shape, resolution, and signal-to-noise ratio was achieved using a shallow gradient of 10 mM ammonium formate and acetonitrile with an initial ratio of 95:5. Optimal chromatographic separations occurred at a flow rate of 0.3 mL/min, and a column temperature of 40°C. The mass spectrometer was operated via positive ion mode ESI, and the vitamins were
1.00 2.00 3.00 4.00 5.00 6.00 7.00 8.00 9.00
1.00 2.00 3.00 4.00 5.00 6.00 7.00 8.00 9.00
1.00 2.00 3.00 4.00 5.00 6.00 7.00 8.00 9.00
1.00
100
0
1%
100
0
%
100
0
%Re
lativ
e int
ensit
y (%)
100
0
%
1
2
2
3
3
4
4 & 5
56
6
1 23
4 & 5 6
1 2 3, 4, 5 & 6
Time (min)
MRM of 6 channels ES+TIC
8.33e5
MRM of 6 channels ES+TIC
1.15e6
MRM of 6 channels ES+TIC
6.20e5
MRM of 6 channels ES+TIC
4.79e5
2.00 3.00 4.00 5.00 6.00 7.00 8.00 9.00
FIGURE 10.4 The LC–MS/MS chromatograms obtained with four different LC columns. (Adapted from Lu, B. et al. 2008. J. Chromatogr. Sci. 46:225–232. With permission.)
Dow
nloa
ded
by [
Ahm
ad I
fsei
ai]
at 0
0:45
04
Apr
il 20
14

263Vitamin Analysis in Food by UPLC–MS
detected in MRM. Resolution by retention time or MRM for the vitamins has been optimized within 2 min. Figure 10.5 shows the extracted ion chromatogram of the analytes and system control standard [86].
Intra- and interassay variability for all analytes ranged from 0.4% to 7.9% and from 2.2% to 5.2%, respectively. Quantification was done by ratio response to the stable isotope-labeled internal standards. 13C4-Thiamine hydrochloride, 13C4, 15N2-riboflavin, and 2H3-pyridoxal hydrochloride were added to the samples as inter-nal standards for quantification. The standard addition method determined recovery rates for each vitamin (73.0–100.2%). The limit of quantitation for all vitamins was between 0.05 and 5 μg/L depending on the vitamin.
The method was applied to 80 human milk samples from Cameroon, China, India, Malawi, and the United States [86]. The results show that the vitamin content of human milk varies depending on the geographic origin, most likely due to differ-ences in diet and fortification that remains to be explored; moreover, the influence of the lactation stage during sample collection needs to be investigated and its contribu-tion to the variation of concentration determined.
4.0 e5(a) (b)
(c) (d)
(e) (f )
3.5 e53.0 e52.5 e52.0 e51.5 e51.0 e5
0.05.0 e4
1.0 e41.2 e41.4 e4
800060004000
0.0
50001.0 e41.5 e4
2.0 e4
2.5 e4
0.00.9 1.0 1.1 1.2 1.3 1.4 1.5 1.6 1.7
0.9 1.0 1.1 1.2 1.3 1.4 1.5 1.6 1.7 0.9 1.0 1.1 1.2 1.3 1.4 1.5 1.6 1.7
1.8 1.9 2.0 2.3 2.4 2.5 2.6 2.7 2.8
1.8 1.9 2.0 2.3 2.4 2.5 2.6 2.7 2.80.9 1.0 1.1 1.2 1.3
H3C
NH3CH3
Cl–
NOH
SN
N+
H3C
H3CNH
NH3
NH+ NH+
N OH
OH
OHH
N
N
N
N
H
OOOO
O O
HO
HO
O
O
N
N
O––O
H3C
H3C
OH
OH
OH
NH
O
O
NN
N
HO
13CH3
H3 13C
13CH3
O
O N
NN
N
HO
CH3N
OH
OHO
NH3
N
O
1.4 1.5 1.6 1.7
1.0 e55.0 e5
1.5 e52.0 e52.5 e53.0 e5
0.0
1.0 e42.0 e43.0 e44.0 e45.0 e46.0 e4
0.0
20000.0
2.0 e4
4.0 e4
6.0 e4
8.0 e49.3 e4
FIGURE 10.5 Extracted ion chromatogram of the analytes and system control standard (A: thiamine, B: riboflavin, C: flavin adenine dinucleotide, D: nicotinamide, E: pyridoxal, F: 13C3-caffeine). (Adapted from Hampel, D., York, E., and Allen, L. 2012. J. Chromatogr. B. 903:7–13. With permission.)
Dow
nloa
ded
by [
Ahm
ad I
fsei
ai]
at 0
0:45
04
Apr
il 20
14

264 Ultra Performance Liquid Chromatography Mass Spectrometry
The UPLC–MS/MS method has also been developed for fast simultaneous sep-aration and determination of 14 different water-soluble vitamins and vitamin-like compounds in infant formula (thiamine, riboflavin, pantothenic acid, nicotinic acid, nicotinamide, pyridoxine, pyridoxal, biotin, folic acid, cyanocobalamin, ascorbic acid, l-carnitine, choline, and taurine) [91]. Methotrexate was also used as an inter-nal standard for riboflavin, cyanocobalamin, biotin, and folic acid, while nicotin-amide was used as an internal standard for the other compounds.
Choosing a chromatographic column gives the possibility to perform various water-soluble vitamin and vitamin-like compound separations in one run and with better resolution. Chromatographic separation was performed using Waters Acquity UPLC BEH Shield RP18 column (100 × 2.1 mm i.d., 1.7 μm particle size) at a flow rate of 0.2 mL/min, and the injection volume was 10 μL. The mobile phase also has a significant effect on peak shape, sensitivity, and resolution. Methanol with 10 mM aqueous ammonium acetate gave the best overall performance and was deemed to be most suitable when all 14 compounds were considered.
Identification and quantification were performed by using MRM with one parent ion, one daughter ion for each analyte, and ESI in positive ion scan mode. Under these conditions, a chromatographic separation within 10 min was achieved. Recoveries at three concentration levels (low, medium, and high) for all analytes ranged between 81.8% and 106.1%. The limit of detection ranged between 0.0042 ng/mL for ribofla-vin and 28.872 ng/mL for ascorbic acid, with an RSD of 1.17% to 5.09% for intraday and 2.61% to 7.43% for interday analysis [91].
Different infant formula, rice flour and wheat powder commercial samples were tested using the developed method. The results demonstrated that the proposed method is both sensitive and selective enough to be applied for the fast determination of these compounds at a wide range of concentration levels in real samples. Vitamin C was not detected from all the samples. The values for riboflavin and nicotinamide were 103 times higher than the value for cyanocobalamin. The vitamin compounds were also found at different low concentration-level ng/mL.
Stevens and Dowell reported a method for the determination of vitamin D (total vitamins D2 and D3) in infant formula and adult nutritionals by UPLC–MS/MS [92]. Vitamin D2, ergocalciferol, and vitamin D3, cholecalciferol, are two forms of vita-min D found in the body. Because vitamin D is not readily available in many foods, the main source remains fortified foods [93]. Because of the importance of vitamin D levels in foods, methods that produce accurate results in a timely manner are needed.
Vitamin D has been analyzed in different food samples, including NIST 1849 (infant/adult nutritional formula), ready-to-eat cereal, bread, mushrooms, eggs, yogurt, cheese, fish, butter, milk (RTF infant formula), and premix (mixture of vita-mins). After saponification with ethanol and potassium hydroxide, and sequential liquid–liquid extraction steps using ethanol, water, and n-heptane, the food samples were eluted through a disposable SPE silica gel column. The extracted samples were assayed using a methanol and ammonium formate gradient on a UPLC–MS/MS system equipped with an HSS C18 UPLC (100 × 2.1 mm i.d., 1.8 μm particle size) column at 0.4 mL/min flow rate. The injection volume was 20 μL [92].
Dow
nloa
ded
by [
Ahm
ad I
fsei
ai]
at 0
0:45
04
Apr
il 20
14

265Vitamin Analysis in Food by UPLC–MS
Under these conditions, the chromatographic separation for the two vitamins was achieved within 6 min. The method was established in the range of 0.005–50 μg/mL. The recovery range was 93.4–100.9% for vitamin D2 and 102.4–106.2% for vitamin D3. The LOD and LOQ for vitamin D2 were reported as 0.20 and 0.61 μg/100 g, respectively; for vitamin D3, the reported values were 0.47 and 1.44 μg/100 g, respectively [92].
Vitamin D has also been measured in infant formula and adult/pediatric nutri-tional supplements using UPLC–MS/MS and compared with conventional HPLC–MS/MS [94]. The accuracy of this method was evaluated by the analysis of NIST selected reaction monitoring (SRM) 1849 infant formula reference material. Both saponification and liquid–liquid extraction procedures have been applied for the extraction of vitamins prior to analysis.
The mass spectrometer was operated via APCI at 21 V collision energy, 50 psi ion gas pressure, and 320°C ionization temperature. Under gradient elution of meth-anol and water with both including 0.1% formic acid at a flow rate 0.25–0.5 mL/min with 5 μL injection volume, and using Hypersil GOLD and GOLD aQ columns (100 × 2.1 mm i.d., 1.9 μm particle size), all the previtamins of vitamin D3, D2, and isotope-labeled vitamin D3 were baseline separated from their corresponding vitamins.
The average concentration of vitamin D3 was 0.251 ± 0.012 μg/g, which was in an excellent agreement with the certified value of 0.251 ± 0.027 μg/g. In addition, the spike recovery from a commercial infant formula matrix was in the range 100–108% for both vitamins D3 and D2. The LOQ values determined were 0.0022 and 0.0028 μg/g for vitamins D3 and D2, respectively, while the LOD values were 0.65 and 0.83 ng/g for vitamins D3 and D2, respectively. Precision ranged from 3.7% to 8.2% for vitamin D2 and 3.7% to 7.0% for vitamin D3 [94].
The analytical range was determined to be 0.0015–1.350 μg/g. This range made the method flexible and useful to deal with the wide concentration range of vita-min D in various samples. The method was robust; measured values generally fell below 5% based on the results of changing the parameters of LC separation and MS measurement. This accurate and reliable vitamin D method significantly increased instrument efficiency and analysis productivity [94].
Compared to the HPLC method, the run time of the chromatographic separation was shorted by 50% (from 20 min in HPLC–MS/MS to 10 min in UPLC–MS/MS) [94], while equal or better separation efficiency was achieved to deal with complex food matrixes.
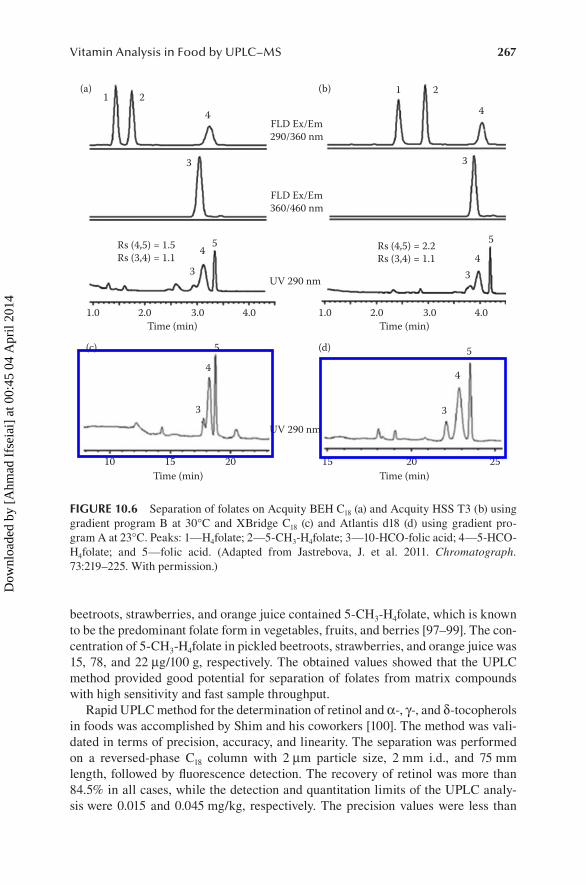
Jastrebova and his coworkers compared both UPLC and HPLC for the separa-tion and determination of the most common dietary folates (a group of derivatives of folic acid); 5-methyltetrahydrofolate (5-CH3-H4folate), tetrahydrofolate (H4folate), 5- formyltetrahydrofolate (5-HCO-H4folate), 10-formylfolic acid (10-HCO-folic acid), and folic acid [95]. Four alkyl-bonded columns, two UPLC columns—Acquity BEH C18 and Acquity HSS T3, 100 × 2.1 mm i.d., 1.7 μm particle size—and two HPLC columns—Xbridge C18 and Atlantis d18, 150 × 4.6 mm i.d., 3.5 μm particle size—were tested for this purpose. In respect to the surface chemistry, the Acquity BEH C18 column is similar to the XBridge C18 column, while the Acquity HSS T3 column is similar to the Atlantis d18 column.
Dow
nloa
ded
by [
Ahm
ad I
fsei
ai]
at 0
0:45
04
Apr
il 20
14
266 Ultra Performance Liquid Chromatography Mass Spectrometry
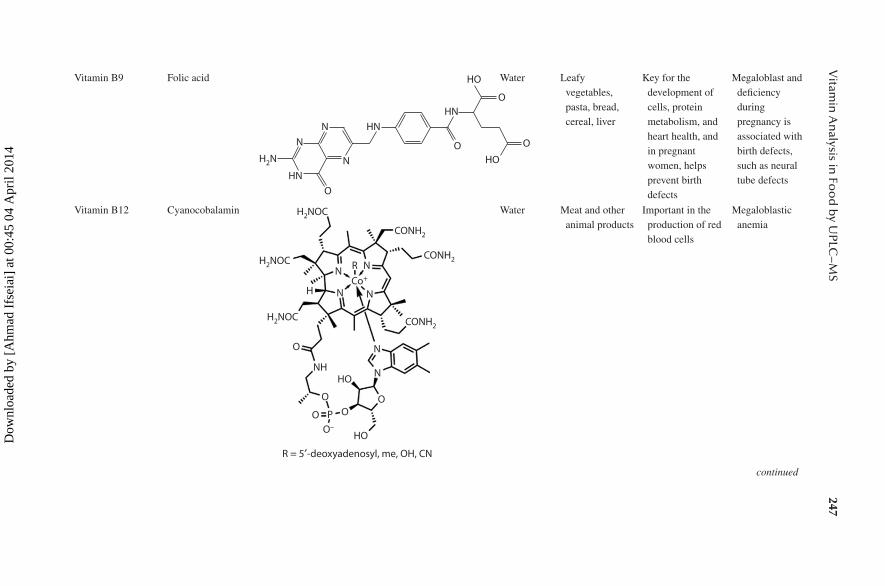
The separation of folates by HPLC was conducted at 23°C column temperature, 0.4 mL/min flow rate, and 20 μL injection volume. On the other hand, UPLC analy-sis was conducted at 30°C for the first column and 60°C for the second one, and the flow rate was 0.5 or 0.7 mL/min and 10 μL sample injection volume [95].
In both systems, the mobile phase was a binary gradient mixture of 30 mM potas-sium phosphate buffer at pH 2.3 and acetonitrile. In the UPLC system, a binary mixture of 10 mM formic acid and acetonitrile was also tested at the mobile phase. Folic acid was quantified using UV detection at 290 nm, whereas other forms were quantified by using fluorescence detection: excitation 290 nm and emission 360 nm for H4folate, 5-CH3-H4folate, and 5-HCO-H4folate, and excitation 360 nm and emis-sion 460 nm for 10-HCO-folic acid.
Folate samples included egg yolk, pickled beetroots, strawberries, orange juice, a soft drink, and dry baker’s yeast. Samples were prepared as described by Patring and Jastrebova [96] and purified as described by Jastrebova et al. [97]. An extraction buffer containing 0.1 M phosphate buffer pH 6.1 with 2% sodium ascorbate (w/v) and 0.1% 2,3-dimercaptopropanol (v/v) was added for each sample. Purification of the obtained extracts was performed by SPE on strong anion exchange (SAX) Isolute cartridges. The retained folates were eluted at low flow rate (not exceeding one drop/s), with 0.1 M sodium acetate containing 10% (w/v) sodium chloride, 1% (w/v) ascorbic acid, and 0.1% (v/v) 2,3-dimercaptopropanol. The purified extracts were finally stored at 0°C overnight prior to analysis.
Figure 10.6 shows the comparison between both UPLC and HPLC for folate analysis using different columns [95]. Both UPLC and HPLC provided high-quality chromatograms. Using UPLC showed a great advantage in terms of the signal-to-noise ratio, which could be improved by a factor of 2–50 for different folate deriva-tives, and the run time that could be reduced fourfold without sacrificing separation efficiency.
The BEH C18 column at 30°C provided the best LOD values ranging from 0.02 to 2.5 ng/mL followed by HSS T3 column at 30°C, while the LOQ values were the low-est (0.2–30 ng/mL) with the BEH C18 column and HSS T3 column at 30°C. Linearity tests revealed marked differences between all columns tested at low concentrations. The BEH C18 column provided the best linearity, followed by the HSS T3 column, whereas deviations from linearity were considerably greater for the HSS T3 column at 60°C and HPLC columns XBridge and Atlantis d18 at 23°C. At higher concentra-tions, the linearity was good for all columns and gradients tested. In conclusion, the obtained results showed that the application of a UPLC for determining folates in foods is of great interest, because it can provide much higher resolution, lower detec-tion limits, and shorter analysis time compared with traditional HPLC.
The best performance column (BEH C18 column) was used for the determina-tion of folates in real samples at optimum chromatographic conditions. It was found that the fortified drink contained only synthetic folic acid in a concentration of 48 μg/100 mL, whereas two folate derivatives, 5-CH3-H4folate and 10-HCO-folic acid, were found in egg yolk. The concentrations of 5-CH3-H4folate and 10-HCO-folic acid in the egg yolk were 226 and 46 μg/100 g, respectively. Three folate derivatives, H4folate, 5-CH3-H4folate, and 10-HCO-folic acid, were found in dry baker’s yeast in concentrations of 697, 2.520, and 212 μg/100 g, respectively. Pickled
Dow
nloa
ded
by [
Ahm
ad I
fsei
ai]
at 0
0:45
04
Apr
il 20
14
267Vitamin Analysis in Food by UPLC–MS
beetroots, strawberries, and orange juice contained 5-CH3-H4folate, which is known to be the predominant folate form in vegetables, fruits, and berries [97–99]. The con-centration of 5-CH3-H4folate in pickled beetroots, strawberries, and orange juice was 15, 78, and 22 μg/100 g, respectively. The obtained values showed that the UPLC method provided good potential for separation of folates from matrix compounds with high sensitivity and fast sample throughput.
Rapid UPLC method for the determination of retinol and α-, γ-, and δ-tocopherols in foods was accomplished by Shim and his coworkers [100]. The method was vali-dated in terms of precision, accuracy, and linearity. The separation was performed on a reversed-phase C18 column with 2 μm particle size, 2 mm i.d., and 75 mm length, followed by fluorescence detection. The recovery of retinol was more than 84.5% in all cases, while the detection and quantitation limits of the UPLC analy-sis were 0.015 and 0.045 mg/kg, respectively. The precision values were less than
1 24
1 2
4
33
FLD Ex/Em290/360 nm
FLD Ex/Em360/460 nm
UV 290 nm
UV 290 nm
Rs (4,5) = 1.5Rs (3,4) = 1.1
Rs (4,5) = 2.2Rs (3,4) = 1.1
3
1.0
10 15 20 20 2515
2.0 3.0 4.0Time (min)
1.0 2.0 3.0 4.0Time (min)
Time (min) Time (min)
3
44
5
3
4
5
3
4
5
5
(b)(a)
(d)(c)
FIGURE 10.6 Separation of folates on Acquity BEH C18 (a) and Acquity HSS T3 (b) using gradient program B at 30°C and XBridge C18 (c) and Atlantis d18 (d) using gradient pro-gram A at 23°C. Peaks: 1—H4folate; 2—5-CH3-H4folate; 3—10-HCO-folic acid; 4—5-HCO-H4folate; and 5—folic acid. (Adapted from Jastrebova, J. et al. 2011. Chromatograph. 73:219–225. With permission.)
Dow
nloa
ded
by [
Ahm
ad I
fsei
ai]
at 0
0:45
04
Apr
il 20
14

268 Ultra Performance Liquid Chromatography Mass Spectrometry
9.12% based on intraday and interday measurements. The recoveries of α-, γ-, and δ-tocopherols were more than 81.3%; the LODs were 0.014, 0.002, and 0.001 mg/kg, respectively, and the LOQs were 0.042, 0.005, and 0.004 mg/kg, respectively. All calibration curves had good linearity (r2 = 0.99) within the test ranges. This method can provide significant improvements in terms of speed, sensitivity, and resolution compared with conventional HPLC methods [100].
Folic acid and 5-CH3-H4folate have also been accurately measured in fortified breads by the UPLC–MS/MS method [101]. Reversed-phase Waters Acquity HSS T3 column (100 × 0.1 mm i.d., 1.8 μm particle size) has been eluted with a gradient mobile phase of 0.1% (v/v) formic acid in Milli-Q water and acetonitrile, the mobile phase delivered at 200 μL/min, and the sample injection volume fixed at 20 μL. Under these chromatographic conditions, the total run time was 6 min.
Using isotope dilution MS method, folates were detected in positive ESI SRM mode and accurately quantified by internal standards [102–104]. 13C5 formic acid and 13C5 5-CH3-H4folate were added into various food matrices as internal standards for the quantification of folic acid and 5-CH3-H4folate, respectively [102–107]. For quan-titative purposes, the CID transitions monitored were m/z 442 → 295, 447 → 295, 460 → 313, and 465 → 313 for folic acid, 13C5 folic acid, 5-CH3-H4folate, and 13C5 5-CH3-H4folate, respectively.
Samples of boiled rice, corn starch, and tapioca starch were analyzed in the search for a folate-free food matrix. These samples were treated with α-amylase in a water bath at 75°C for 1 h and then extracted with phosphate buffer (pH 6.1). Folates were then selectively concentrated using SPE on styrene divinylbenzene cartridges, which have a broad hydrophobic selectivity for both polar and apolar organics but exhibit enhanced interaction with aromatic compounds when compared with traditional C18 reversed-phase sorbents. In addition, the assay has been used to measure the two folate levels in commercially produced bread samples from different brands in Australia [101].
Standard calibration curves for the two analytes were linear over the range of 0.018–14 μg folic acid/g of fresh bread (r2 = 0.997) and 9.3–900 ng 5-CH3-H4folate/g of fresh bread (r2 = 0.999). The absolute recoveries were 90% and 76% for folic acid and 5-CH3-H4folate, respectively. Inter- and intraday coefficients of variation were 2.6% and 3% for folic acid and 17.1% and 18% for 5-CH3-H4folate, respectively [101].
The LOD determined using preextracted tapioca starch as the blank matrix was 9.0 ng/g for folic acid and 4.3 ng/g for 5-CH3-H4folate. The assay is rugged, fast, accurate, and sensitive; applicable to a variety of food matrices; and is capable of the detection and quantification of the naturally occurring low levels of 5-CH3-H4folate in wheat breads. The findings of this study revealed that the folic acid range in Australian fortified breads was 79–110 μg/100 g of fresh bread and suggest that the flour may not have the mandated folic acid fortification level (200–300 μg/100 g of flour), though this cannot be determined conclusively from experimental bread data alone, as variable baking losses have been documented by other authors [101].
Brouwer and his coworkers applied a UPLC method for rapid and sensitive quan-titative determination of folates in rice. Six monoglutamate folates in rice have been examined, including tetrahydrofolate, 5-methyltetrahydrofolate, 10-methenyltetra-hydrofolate, 10-formylfolic acid, 5-formyltetrahydrofolate, and folic acid [108].
Dow
nloa
ded
by [
Ahm
ad I
fsei
ai]
at 0
0:45
04
Apr
il 20
14

269Vitamin Analysis in Food by UPLC–MS
UPLC was performed under gradient conditions consisting of 0.1% of formic acid in water and acetonitrile. Ten microliter of samples were injected on a Waters Acquity HSS T3 column (150 × 2.1 mm i.d., 1.8 μm particle size), followed by tan-dem mass spectrometry detection. The instrument was operated in the ESI positive mode and the data were acquired in MRM mode.
Sample preparation was carried out under subdued light. The folate samples were treated with α-amylase, protease, and deconjugase and then extracted with phosphate buffer at pH 7.5. Matrix effects were compensated by use of isotopically labelled internal standards.
The developed UPLC–MS/MS method has been fully validated and was found to be suitable for determining the concentrations of the six folates in a total time of 8 min. The applicability of this analytical method was demonstrated by analyzing two types of rice; wild-type and genetically modified rice samples (biofortified with folates).
The method was found to have good accuracy and reproducibility for all analytes. Accuracy varied between 90.3% and 104.3%, while the intra- and interday precision had variation coefficients lower than 15%, except for folic acid (17.6%). LOD and LOQ varied between 0.06, 0.45, 0.12, and 0.91 μg/100 g, respectively. With a total run time of 8 min, this method is more sensitive for every single folate (up to 10 times) and offers faster separation than other developed HPLC methods (LOQ rang-ing from 0.6 to 4.0 μg/100 g, with a total run time of 20 min) [109].
The validated method has been successfully applied to determine folates in real rice samples. 5-Methyltetrahydrofolate was the predominant natural folate form in both wild-type (60%) and transgenic (90%) rice. The analysis of the distribution and levels of folates in wild-type and folate-biofortified rice showed up to 50-fold enrichment in biofortified rice, with total folate levels of up to 900 μg/100 g rice. Figure 10.7 shows the UPLC–MS/MS chromatogram for the folates in the two dif-ferent samples. Some biofortified lines yielded folate levels of up to 900 μg/100 g, whereas levels in wild-type rice were around 20 μg/100 g [108].
One more study was developed by Chauveau-Duriot and his coworkers for the determination of vitamins A and E in milk by UPLC [110]. Fifty-six milk samples were collected from cows fed rations known to contain a broad variation of micronu-trient contents [111]. Milk samples were stored in the dark at −20°C until extraction.
Each sample was deproteinized by adding the same volume of ethyl alcohol (con-taining internal standards). n-Hexane/ethyl acetate (9/1, v/v) was added to extract lipo-philic components, and the resulting organic phases were collected. In the resulting organic phase, ethanol/water (90/10, v/v) was added to extract xanthophylls and vita-min E and preserve them from saponification. The lower ethanolic phase was collected in a new tube. The remaining upper hexanic phase was saponified in a solution of 10% KOH in ethyl alcohol (w/v) for 1 h at 60°C under darkness. Then, n-hexane/ethyl ace-tate (9/1, v/v) was added for vitamin purification. The final dry residue was dissolved in tetrahydrofuran (THF) and diluted with acetonitrile–dichloromethane–methanol (75–10–15) prior to automatic sampling, using 40 μL for HPLC and 10 μL for UPLC.
In all samples, internal standards were added as calibrants to compensate for losses in handling. Retinyl acetate and tocopheryl acetate were not used as internal standards for both vitamins because they are hydrolyzed by the saponification step
Dow
nloa
ded
by [
Ahm
ad I
fsei
ai]
at 0
0:45
04
Apr
il 20
14

270 Ultra Performance Liquid Chromatography Mass Spectrometry
performed to disrupt dairy fat during the extraction procedures. Hence, echinenone and δ-tocopherol were used as internal standard for vitamin A and E, respectively.
HPLC separation used two columns in series: 150 × 4.6 mm i.d., RP C18, 3 μm particle size Nucleosil column coupled with a 250 × 4.6 mm i.d. RP C18, 5 μm particle size 201 Vydac TP54 column. The isocratic mobile phase was a mix of
0.50.0
2000.0
4000.0
6000.0
8000.0
1.0e4
1.2e4
1.4e4
1.6e4(b)
0.0
5000.0
1.0e4
1.5e4
2.0e4
2.5e4
3.0e4
3.5e4(a)
5-MTHF
10-CHOFA
5-CHOTHF
FATHF
5,10-CH *THF
1.0 1.5 2.0 2.5 3.0 3.5 4.0 4.5Time (min)
5.0 5.5 6.0 6.5 7.0 7.5 8.0
0.5 1.0 1.5 2.0 2.5 3.0 3.5 4.0 4.5Time (min)
5.0 5.5 6.0 6.5 7.0 7.5 8.0
5-MTHF 10-CHOFA
THF: Tetrahydrofolate
FA: Folic acid5-CHOTHF: 5-Formyltetrahydrofolate
5-MTHF: 5-Methyltetrahydrofolate5-10,CH* THF: 5, 10-Methenyltetrahydrofolate5-CHOFA: 10-Formylfolic acid
5-CHOTHF
FATHF
5,10-CH *THF
FIGURE 10.7 UPLC–MS/MS chromatogram (a) of a standard mixture of the six monoglu-tamate folates spiked to a 10 times diluted rice matrix (concentration of the individual folates varying between 4 and 5 μg/100 g) and (b) of a wild-type rice sample (total folate content is 19 μg/100 g) for the chromatographic conditions on the HSS T3 column. (Adapted from Brouwer, V. et al. 2010. J. Chromatogr. B. 878:509–513. With permission.)
Dow
nloa
ded
by [
Ahm
ad I
fsei
ai]
at 0
0:45
04
Apr
il 20
14

271Vitamin Analysis in Food by UPLC–MS
acetonitrile–dichloromethane–ammonium acetate 0.05 M in methanol–water (70–10–15–5). The flow rate applied was 2 mL/min and all analysis was performed at room temperature. A 150 × 2.1 mm i.d. Acquity UPLC HSS T3, 1.8 μm particle size column was used with a gradient of acetonitrile–dichloromethane–methanol (75–10–15) and ammonium acetate 0.05 M in water. The flow rate was 0.4 mL/min. Column temperature was maintained at 35°C using a column oven. Vitamins A and E were detected at 325 and 292 nm, respectively [110].
The UPLC allowed a better resolution, an equal or better sensitivity according to gradient, and a better reproducibility of peak areas and retention times, but did not reduce the time required for analysis. Figures 10.8 and 10.9 show chromato-grams of pure standards of vitamins A and E, respectively, obtained with HPLC and UPLC.
0
0.000.020.040.060.080.100.120.140.160.180.200.220.240.26(a)
(b)
13
12
12 13
AU
0.000.020.040.060.080.100.120.140.160.180.200.22
AU
2 4 6 8 10 12 14 16 18 20Minutes
22 24 26 28 30 32 34
0 5 10 15 20Minutes
25 30 35
36
FIGURE 10.8 Chromatograms of a mix of standard vitamin A obtained with either HPLC (a) or UPLC (b). Detection was performed at 325 nm: (12) retinol and (13) retinyl acetate. AU: absorbance units. (Adapted from Chauveau-Duriot, B. et al. 2010. Anal. Bioanal. Chem. 397:777–790. With permission.)
Dow
nloa
ded
by [
Ahm
ad I
fsei
ai]
at 0
0:45
04
Apr
il 20
14

272 Ultra Performance Liquid Chromatography Mass Spectrometry
Retinol was detected in all milks. α-Tocopherol was the most commonly observed form of vitamin E in these samples, but γ-tocopherol was sometimes detected with the UPLC but not by HPLC, due to the better (10-fold higher) sensitivity of UPLC for this molecule. Retinol concentrations ranged from 0.03 to 0.6 μg/mL, and the mean values for α-tocopherol ranged from 0 to 0.9 μg/mL. Extraction recoveries for all analytes were up to 70%. Vitamin resolution was similar and higher to 1 with both methods for vitamin E (α, δ, γ tocopherols and tocopheryl acetate), and was much higher with UPLC than with HPLC for vitamin A [110].
The UPLC system did not offer shorter analysis times. This could be explained by the difference in the column’s chemistry, as well as the proportion of water in the mobile phase. However, it gave the best reproducibility of retention time
0 2 4 6
17
16
15
14
17
16
15
14
8 10 12 14 16 18 20Minutes
22 24 26 28 30 32 34 36
0.00
0.02
0.04
0.06
0.08
0.10
0.12
AUAU
0
0.00
0.05
0.10
0.15
0.20
0.25
0.30
5 10 15 20Minutes
25 30 4035 45
(a)
(b)
FIGURE 10.9 Chromatograms of a mix of standard vitamin E obtained with either (a) HPLC or (b) UPLC. Detection was performed at 292 nm: (14) δ-tocopherol, (15) γ-tocopherol, (16) α-tocopherol, and (17) tocopheryl acetate. AU: absorbance units. (Adapted from Chauveau-Duriot, B. et al. 2010. Anal. Bioanal. Chem. 397:777–790. With permission.)D
ownl
oade
d by
[A
hmad
Ifs
eiai
] at
00:
45 0
4 A
pril
2014

273Vitamin Analysis in Food by UPLC–MS
due to temperature control, and the best peak area due to better chromatographic resolution.
In conclusion, the arrival of the UPLC in laboratories has permitted the improve-ment of the quality and the productivity of analyses, with an increased sensitivity, a better selectivity, a high throughput, and simplification of sample preparation. To increase the productivity of mass spectrometers, UPLC can also be a solution, with a reduction of run time, a better resolution, and better sensitivity, in comparison to classical HPLC systems.
ACKNOWLEDGMENT
This work was supported by King Saud University, Deanship of Scientific Research, College of Science Research Center.
REFERENCES
1. Moreno, P. and Salvado, V. 2000. Determination of eight water- and fat-soluble vitamins in multi-vitamin pharmaceutical formulations by high-performance liquid chromatogra-phy. J. Chromatogr. A. 870:207–215.
2. Finglas, P., Faure, U., and Wagstaffe, P. 1993. Improvements in the determination of vitamins in food through intercomparisons and preparation of RMs for vitamin analysis within the BCR1 programme. Fresenius J. Anal. Chem. 345:180–184.
3. Jacab, R. and Sotoudeh, G. 2002. Vitamin C function and status in chronic disease. Nutri. Clin. Care. 5:66–74.
4. Blake, C. 2007. Analytical procedures for water-soluble vitamins in foods and dietary supplements: A review. Anal. Bioanal. Chem. 389:63–76.
5. Ottaway, P. 1993. The Technology of Vitamins in Food. Chapman & Hall, New York. 6. Nollet, L. 1992. Food Analysis by HPLC. 2nd Ed. Marcel Dekker, New York. 7. Machlin, L. 1991. Handbook of Vitamins. 2nd Ed. Marcel Dekker, New York. 8. Anthea, M., Hopkins, J., McLaughlin, C., Johnson, S., Warner, M., LaHart, D., and
Wright, J. 1993. Human Biology and Health. Prentice Hall, Englewood Cliffs, New Jersey, USA.
9. Ball, G. 2006. Vitamins in Foods. Analysis, Bioavailability, and Stability. CRC Press, Boca Raton, Florida.
10. AIN (American Institute of Nutrition). 1990. Nomenclature policy: Generic descriptors and trivial names for vitamins and related compounds. J. Nutr. 120:643–644.
11. Booher, L., Hartzler, E., and Hewston, E. 1942. A compilation of the vitamin values of foods in relation to processing and other variants, U.S. Dept. Agric. Cir. 638:1–244.
12. Booth, S., Sadowski, J., Weihrauch, J., and Ferland, G. 1993. Vitamin K1 (phylloqui-none) content of foods: A provisional table. J. Food Comp. Anal. 6:109–120.
13. Kamal-Eldin, A. and Appelqvist, L. 1996. The chemistry and antioxidant properties of tocopherols and tocotrienols. Lipids. 31:671–701.
14. Sheppard, A. and Pennington, J. 1993. Analysis and Distribution of Vitamin E in Vegetable Oils and Foods. Marcel Dekker, New York.
15. Rucker, R., Suttie, J., McCormick, D., and Machlin, L. 2001. Handbook of Vitamins. 3rd Ed. Marcel Dekker, New York.
16. Nollet, L. 2000. Food Analysis by HPLC. 2nd Ed. Marcel Dekker, New York. 17. Kozlov, E., Solunina, I., Lyubareva, M., and Nadtochii, M. 2003. HPLC determination
of Vitamins A, D, and E in multivitamin composition. Pharm. Chem. J. 37:560–562.
Dow
nloa
ded
by [
Ahm
ad I
fsei
ai]
at 0
0:45
04
Apr
il 20
14

274 Ultra Performance Liquid Chromatography Mass Spectrometry
18. Pegg, R., Landen, W., and Eitenmiller, R. 2010. Vitamin Analysis. Springer Science + Business Media, New York.
19. United States Environmental Protection Agency (EPA). 2002. Methods for Measuring the Acute Toxicity of Effluents and Receiving Waters to Fresh water and Marine Organisms. Washington, DC. Document No. EPA-821-R-02-012.
20. Ball, G. 1998. Bioavailability & Analyzsis of Vitamins in Foods. Chapman & Hall, London. 21. Carlucci, A. and Bowes, P. 1972. Determination of vitamin B12, thiamine, and biotin in
Lake Tahoe waters using modified marine bioassay techniques. National Agricultural Library. 17:774–777.
22. Gregory, J. and Litherland, S. 1986. Efficacy of the rat bioassay for the determination of biologically available vitamin B-612. J. Nutr. 116:87–97.
23. Ibanoglu, S., Ainsworth, P., Wilson, G., and Hayes, G. 1995. Effect of formulation on protein breakdown, in vitro digestibility, rheological properties and acceptability of tar-hana, a traditional Turkish cereal food. Int. J. Food Sci. 30:579–585.
24. Lee, H. 2000. HPLC Analysis of Phenolic Compounds. 1st Ed. Marcel Dekker, New York. 25. De Leenheer, A., Lambert, W., and De Ruyter, M. 1985. Modern Chromatographic Analysis
of the Vitamins, Chromatographic Science Series. 2nd Ed. Marcel Dekker, New York. 26. Gentili, A., Caretti, F., D’Ascenzo, G., Marchese, S., Perret, D., Corcia, D., and Rocca,
L. 2008. Simultaneous determination of water-soluble vitamins in selected food matri-ces by liquid chromatography/electrospray ionization tandem mass spectrometry. Rapid Commun. Mass Spectrom. 22:2029–2043.
27. Luttseva, A. and Maslov, L. 1999. Methods of control and standardization of drugs con-taining water-soluble vitamins (a review). J. Pharma. Chem. 33:490–498.
28. Luttseva, A., Maslov, L., and Seredenko, V. 2001. Methods of control and standardiza-tion of drugs containing fat-soluble vitamins (a review). J. Pharma. Chem. 35: 567–572.
29. Ekinci, R. and Kadakal, C. 2005. Determination of seven water-soluble vitamins in tar-hana, a traditional Turkish cereal food, by high-performance liquid chromatography. Acta Chromatogr. A. 15:289–297.
30. Rongjie, F., Jianzhong, L., and Wang, Y. 2010. Fat-Soluble Vitamins Analysis on an Agilent ZORBAX Eclipse PAH Polymeric C18 Bonded Column. Application Note. Agilent Technologies, USA.
31. Giorgi, M., Howland, K., Martin, C., and Bonner, A. 2012. A novel HPLC method for the concurrent analysis and quantitation of seven water-soluble vitamins in biological fluids (plasma and urine): A validation study and application. Scientific World Journal. 2012:1–8.
32. Doughty, E., Herwehe, K., and Yearick, V. 1996. Fat soluble vitamin analyses by HPLC. The Reporter. 15:4–5.
33. Laura, A., Armas, G., Hollis, B., and Heaney, R. 2004. Vitamin D2 is much less effective than vitamin D3 in humans. J. Clin. Endocrinol. Metab. 89:5387–5391.
34. Strathmann, F., Laha, T., and Hoofnagle, A. 2011. Quantification of 1α,25 dihydroxy vitamin D by immunoextraction and liquid chromatography-tandem mass spectrometry. Clin. Chem. 57:1279–1285.
35. Leporati, A., Catellani, D., Suman, M., Andreoli, R., Manini, P., and Niessen, W. 2005. Application of a liquid chromatography tandem mass spectrometry method to the analy-sis of water-soluble vitamins in Italian pasta. Anal. Chim. Acta 531:87–95.
36. 2nd International Vitamin Conference, 23–25 May 2012, Copenhagen. 37. Swartz, M. 2005. Principal Scientist, Waters Corporation, Milford, Massachusetts,
Separation Science Redefined. on-line. Available: www.chromatographyonline.com. 38. Villiers, A., Lestremau, F., Szucs, R., Gelebart, S., David, F., and Sandra, P. 2006.
Evaluation of ultra-performance liquid chromatography. Part I: Possibilities and limita-tions. J. Chromatogr. A. 1127:60–69.
39. Heiger, D. 2000. High Performance Capillary Electrophoresis—An Introduction. Agilent Technologies, Germany.
Dow
nloa
ded
by [
Ahm
ad I
fsei
ai]
at 0
0:45
04
Apr
il 20
14
275Vitamin Analysis in Food by UPLC–MS
40. Welsch, T. and Michalke, D. 2003. (Micellar) electrokinetic chromatography: An interesting solution for the liquid phase separation dilemma. J. Chromatogr. A. 1000:935–951.
41. Zhang, Y., Gong, X., Zhang, H., Larock, R., and Yeung, E. 2000. Combinatorial screen-ing of homogeneous catalysis and reaction optimization based on multiplexed capillary electrophoresis. J. Comb. Chem. 2:450–452.
42. Zhou, C., Jin, Y., Kenseth, J., Stella, M., Wehmeyer, K., and Heineman, W. 2005. Rapid pka estimation using vacuum-assisted multiplexed capillary electrophoresis (VAMCE) with ultraviolet detection. J. Pharmac. Sci. 94:576–589.
43. Van Deemter, J., Zuiderweg, E., and Klinkenberg, A. 1956. Longitudinal diffusion and resistance to mass transfer as causes of non-ideality in chromatography. Chem. Eng. Sci. 5:271–289.
44. Jerkovich, A., Mellors, J., and Jorgenson, J. 2003. The use of micron-sized particles in ultrahigh-pressure liquid chromatography. LCGC. 21:600–610.
45. Swartz, M. 2005. Ultra Performance Liquid Chromatography (UPLC): An introduction, separation science re-defined. LCGC. 23:8–14.
46. Novakova, L., Matysova, L., and Solich, P. 2006. Advantages of application of UPLC in pharmaceutical analysis. Talanta. 68:908–918.
47. Swartz, M. 2004. Ultra performance liquid chromatography: Tomorrow’s HPLC tech-nology today. LabPlus Int. 18:6–8.
48. Lars, Y. and Honore, H. 2003. On-line turbulent-flow chromatography–high-perfor-mance liquid chromatography–mass spectrometry for fast sample preparation and quan-titation. J. Chromatogr. A. 1020:59–67.
49. Swartz, M., Murphy, B., and Sievers, D. 2004. UPLC: Expanding the limits of HPLC. GIT Lab J. 8:43–45.
50. Wu, N., Lippert, J., and Lee, M. 2001. Practical aspects of ultrahigh pressure capillary liquid Chromatography. J. Chromatogr. A. 911:1–12.
51. MacNair, J., Patel, K., and Jorgenson, J. 1999. Ultrahigh-pressure reversed-phase capil-lary liquid chromatography: Isocratic and gradient elution using columns packed with 1.0 mm particles. Anal. Chem. 71:700–708.
52. Patel, K., Jerkovich, A., Link, J., and Jorgenson, J. 2004. In-depth characteriza-tion of slurry packed capillary columns with 1.0-microm nonporous particles using reversed-phase isocratic ultrahigh-pressure liquid chromatography. Anal. Chem. 76:5777–5786.
53. De Villiers, A., Lestremau, F., Szucs, R., Gelebart, S., David, F., and Sandra, P. 2006. Evaluation of ultra-performance liquid chromatography. Part I. Possibilities and limita-tions. J. Chromatogr. A. 1127:60–69.
54. Plumb, R., Dear, G., Mallett, D., and Ayrton, J. 2001. Direct analysis of pharmaceutical compounds in human plasma with chromatographic resolution using an alkyl-bonded silica rod column. Rapid Commun. Mass Spectrom. 15:986–993.
55. Bayliss, M., Little, D., Mallett, D., and Plumb, R. 2000. Parallel ultra-high flow rate liquid chromatography with mass spectrometric detection using a multiplex electrospray source for direct, sensitive determination of pharmaceuticals in plasma at extremely high throughput. Rapid Commun. Mass Spectrom. 14:2039–2045.
56. Castro-Perez, J., Plumb, R., Granger, J., Beattie, I., Joncour, K., and Wright, A. 2005. Increasing throughput and information content for in vitro drug metabolism experiments using ultra-performance liquid chromatography coupled to a quadrupole time-of-flight mass spectrometer. Rapid Commun. Mass Spectrom. 19:843–848.
57. Swartz, E. 2005. UPLCTM: An introduction and review. J. Liq. Chromatogr. Related Technol. 28:1253–1263.
58. Guoyu, D. and Xiangru, Z. 2009. A picture of polar iodinated disinfection byproducts in drinking water by (UPLC/) ESI-tqMS, SAR. Environ. Sci. Technol. 43:9287–9293.
Dow
nloa
ded
by [
Ahm
ad I
fsei
ai]
at 0
0:45
04
Apr
il 20
14

276 Ultra Performance Liquid Chromatography Mass Spectrometry
59. Srivastava, B., Sharma, B., Baghel, U., Want, Y., and Sethi, N. 2010. Ultra performance liquid chromatography (UPLC): A chromatography technique. Int. J. Pharm. Quality Assur. 2:19–25.
60. Broske, A. 2004. Agilent Technologies Application Note. 5988EN. 61. Goodwin, L., White, S., and Spooner, N. 2007. Evaluation of ultra-performance liq-
uid chromatography in the bioanalysis of small molecule drug candidates in plasma. J. Chromatogr. Sci. 45:298–304.
62. Plumb, R., Castro-Perez, J., Granger, J., Beattie, I., Joncour, K., and Wright, A. 2004. Ultra-performance liquid chromatography coupled to quadrupole-orthogonal time-of-flight mass spectrometry. Rapid Commun. Mass Spectrom. 18:2331–2337.
63. Wang, L., Yuan, K., and Yu, W. 2010. Studies of UPLC fingerprint for the identification of Magnolia officinalis cortex processed. Pharmacognosy Magazine. 6:83–88.
64. Mazzeo, J., Wheat, T., Gillece-Castro, B., and Lu, Z. 2006. Next generation peptide mapping with ultra performance liquid chromatography. BioPharm. Int. 19:22–25.
65. Novakova, L., Solichova, D., and Solich, P. 2006. Advantages of ultra-performance liq-uid chromatography over high-performance liquid chromatography: Comparison of dif-ferent analytical approaches during analysis of diclofenac gel. J. Sep. Sci. 29:2433–2443.
66. Wilson, I., Plumb, R., Granger, J., Major, H., Williams, R., and Lenz, E. 2005. HPLC-MS-based methods for the study of metabonomics. J. Chromatogr. B. 817:67–76.
67. Plumb, R. and Wilson, I. 2004. High throughput and high sensitivity LC/MS-OA-TOF and UPLC/TOF-MS for the identification of biomarkers of toxicity and disease using a metabonomics approach. Abstr. Pap. Am. Chem. Soc. 228:189.
68. Castro-Perez, J., Plumb, R., Granger, J., Beattie, I., Joncour, K., and Wright, A. 2005. Increasing throughput and information content for in vitro drug metabolism experiments using ultra-performance liquid chromatography coupled to a quadrupole time-of-flight mass spectrometer. Rapid Commun. Mass Spectrom. 19:843–848.
69. Wilson, I., Nicholson, J., Castro-Perez, J., Granger, J., Johnson, K., Smith, B., and Plumb, R. 2005. High resolution “ultra-performance” liquid chromatography coupled to oa-TOF mass spectrometry as tool for differential metabolic pathway profiling in functional genomic studies. J. Proteome. Res., 4:591–598.
70. Wilfried, M. 2006. Liquid Chromatography–Mass Spectrometry. 3rd Ed. CRC Press, Taylor & Francis Group, LLC, London.
71. De Leenheer, A., Lambert, W., and Van Bocxlaer, J. 2000. Modern Chromatographic Analysis of Vitamins. Marcel Dekker, New York.
72. Novakova, L. and Solich, P. 2008. HPLC methods for simultaneous determination of ascorbic and dehydroascorbic acids. TraC. Trends Anal. Chem. 27:942–958.
73. Fenoll, J. and Martínez, A. 2011. Simultaneous determination of ascorbic and dehy-droascorbic acids in vegetables and fruits by liquid chromatography with tandem-mass spectrometry. Food Chem. 127:340–344.
74. Odriozola-Serrano, I. and Hernández-Jover, T. 2007. Comparative evaluation of UV-HPLC methods and reducing agents to determine vitamin C in fruits. Food Chem. 105:1151–1158.
75. Spinola, V., Mendes, B., Camara, J., and Castilho, P. 2012. An improved and fast UHPLC-PDA methodology for determination of l-ascorbic and dehydroascorbic acids in fruits and vegetables. Evaluation of degradation rate during storage. Anal. Bional. Chem. 403:1049–1058.
76. Lee, S. and Kader, A. 2000. Preharvest and postharvest factors influencing vitamin C content of horticultural crops. Postharvest Biol. Technol. 20:207–220.
77. Johnston, C. and Bowling, D. 2007. Ascorbic acid. In: Handbook of Vitamins. 4th Ed. Zempleni, J., Rucker, R.B., McCormick, D.B., and Suttie, J.W. (Eds.) CRC Press, Boca Raton, Florida.
Dow
nloa
ded
by [
Ahm
ad I
fsei
ai]
at 0
0:45
04
Apr
il 20
14

277Vitamin Analysis in Food by UPLC–MS
78. Phillips, K. and Tarrago-Trani, M. 2010. Stability of vitamin C in frozen raw fruit and vegetable homogenates. J. Food Compos. Anal. 23:253–259.
79. Valente, A. and Albuquerque, T. 2011. Ascorbic acid content in exotic fruits: A contribu-tion to produce quality data for food composition databases. Food Res. Int. 44:2237–2242.
80. Hernández, Y. and Lobo, M. 2006. Determination of vitamin C in tropical fruits: A com-parative evaluation of methods. Food Chem. 96:654–664.
81. Frenich, A. and Torres, M. 2005. Determination of ascorbic acid and carotenoids in food commodities by liquid chromatography with mass spectrometry detection. J. Agric. Food Chem. 53:7371–7376.
82. Eitenmiller, R., Ye, L., and Landen, W. 2008. Ascorbic acid: Vitamin C. In: Vitamin Analysis for the Health and Food Sciences. 2nd Ed. CRC Press, Boca Raton, Florida.
83. Huang, B., Zheng, F., Fu, S., Yao, J., Tao, B., and Ren, Y. 2012. UPLC-ESI-MS/MS for determining trans- and cis-vitamin K1 in infant formulas: Method and applications. Eur. Food Res. and Technol. 235:873–879.
84. Report of the 30th Session of the Codex Committee on Nutrition and Foods for Special Dietary Uses Cape Town. 2008. pp 65–66. www.codexalimentarius.org.
85. Lu, B., Ren, Y., Huang, B., Liao, W., Cai, Z., and Tie, X. 2008. Simultaneous determina-tion of four water-soluble vitamins in fortified infant foods by ultra-performance liquid chromatography coupled with triple quadrupole mass spectrometry. J. Chromatogr. Sci. 46:225–232.
86. Hampel, D., York, E., and Allen, L. 2012. Ultra-performance liquid chromatography tandem mass-spectrometry (UPLC–MS/MS) for the rapid, simultaneous analysis of thiamin, riboflavin, flavin adenine dinucleotide, nicotinamide and pyridoxal in human milk. J. Chromatogr. B. 903:7–13.
87. Sakurai, T., Furukawa, M., Asoh, M., Kanno, T., Kojima, T., and Yonekubo, A. 2005. Fat-soluble and water-soluble vitamin contents of breast milk from Japanese women. J. Nutr. Sci. Vitaminol. 51:239–247.
88. Stuetz, W., Carrara, V., McGready, R., Lee, S., Erhardt, J., Breuer, J., Biesalski, H., and Nosten, F. 2011. Micronutrient status in lactating mothers before and after introduction of fortified flour: Cross-sectional surveys in Maela refugee camp. Eur. J. Nutr. 51:425–434.
89. Greer, F. 2001. Do breastfed infants need supplemental vitamins? Pediatr. Clin. North Am. 48:415–423.
90. Van Herwaarden, A., Wagenaar, E., Merino, G., Jonker, J., Rosing, H., Beijnen, J., and Schinkel, A. 2007. Multidrug transporter ABCG2/breast cancer resistance protein secretes riboflavin (vitamin B2) into milk. Mol. Cell. Biol. 27:1247–1253.
91. Zhang, H., Chen, S., Liao, W., and Ren, Y. 2009. Fast simultaneous determination of multiple water-soluble vitamins and vitamin like compounds in infant formula by UPLC-MS/MS. J. Food Agric. Environ. 7:88–93.
92. Stevens, J. and Dowell, D. 2012. Determination of vitamins D2 and D3 in infant formula and adult nutritionals by ultra-pressure liquid chromatography with tandem mass spec-trometry detection (UPLC-MS/MS): First action 2011.12. J. AOAC Int. 95:577–582.
93. Centers for Disease Control and Prevention. July 2008. http://www.cdc.gov/nutritionre-port/part_2b.html.
94. Huang, M. and Winters, D. 2011. Application of ultra-performance liquid chromatog-raphy/tandem mass spectrometry for the measurement of vitamin D in foods and nutri-tional supplements. J. AOAC. Int. 94:211–223.
95. Jastrebova, J., Strandler, H., Patring, J., and Wiklund, T. 2011. Comparison of UPLC and HPLC for analysis of dietary folates. Chromatograph. 73:219–225.
96. Patring, J. and Jastrebova, J. 2007. Application of liquid chromatography-electrospray ion-isation mass spectrometry for determination of dietary folates: Effects of buffer nature and mobile phase composition on sensitivity and selectivity. J. Chromatogr. A. 1143:72–82.
Dow
nloa
ded
by [
Ahm
ad I
fsei
ai]
at 0
0:45
04
Apr
il 20
14

278 Ultra Performance Liquid Chromatography Mass Spectrometry
97. Jastrebova, J., Witthoft, C., Grahn, A., Svensson, U., and Jagerstad, M. 2003. HPLC determination of folates in raw and processed beetroots. Food Chem. 80:579–588.
98. Vahteristo, L., Lehikoinen, K., Ollilainen, V., and Varo, P. 1997. Application of an HPLC assay for the determination of folate derivatives in some vegetables, fruits and berries consumed in Finland. Food Chem. 59:589–597.
99. Stralsjo, L., Ahlin, H., Witthoft, C., and Jastrebova, J. 2003. Folate determination in berries by radioprotein-binding assay (RPBA) and high performance liquid chromatog-raphy (HPLC). Eur. Food Res. Technol. 216:264–269.
100. Shim, Y., Kim, K., Seo, D., Ito, M., Nakagawa, H., and Ha, J. 2012. Rapid method for the determination of vitamins A and E in foods using ultra-high-performance liquid chromatography. J. AOAC. Int. 95:517–522.
101. Chandra-Hioe, M., Bucknall, M., and Arcot, J. 2011. Folate analysis in foods by UPLC-MS/MS: Development and validation of a novel, high throughput quantitative assay; folate levels determined in Australian fortified breads. Anal. Bioanal. Chem. 401:1035–1042.
102. Freisleben, A., Schieberle, P., and Rychlik, M. 2002. Syntheses of labeled vitamers of folic acid to be used as internal standards in stable isotope dilution assays. J. Agric. Food Chem. 50:4760–4768.
103. Freisleben, A., Schieberle, P., and Rychlik, M. 2003. Specific and sensitive quantifica-tion of folate in foods by stable isotope dilution assays using high-performance liquid chromatography-tandem mass spectrometry. Anal. Bioanal. Chem. 376:149–156.
104. Freisleben, A., Schieberle, P., and Rychlik, M. 2003. Comparison of folate quantifi-cation in foods by high-performance liquid chromatography-fluorescence detection to that by stable isotope dilution assays using high-performance liquid chromatography-tandem mass spectrometry. Anal. Biochem. 315:247–255.
105. Pawlosky, R., Flanagan, V., and Pfeiffer, C. 2001. Determination of 5-methyltetrahydro-folic acid in human serum by stable-isotope dilution high-performance liquid chroma-tography-mass spectrometry. Anal. Biochem. 298:299–305.
106. Pawlosky, R., Flanagan, V., and Doherty, R. 2003. A mass spectrometric validated high-performance liquid chromatography procedure for the determination of folates in foods. J. Agric. Food Chem. 51:3726–3730.
107. Pawlosky, R., Hertrampf, E., Flanagan, V., and Thomas, P. 2003. Mass spectral determi-nations of the folic acid content of fortified breads from Chile. J. Food Compos. Anal. 16:281–286.
108. Brouwer, V., Storozhenko, S., Stove, C., Daele, J., Straeten, D., and Lambert, W. 2010. Ultra-performance liquid chromatography–tandem mass spectrometry (UPLC–MS/MS) for the sensitive determination of folates in rice. J. Chromatogr. B. 878:509–513.
109. De Brouwer, V., Storozhenko, S., Van De Steene, J., Wille, S., Stove, C., Van Der Straeten, D., and Lambert, W. 2008. Optimisation and validation of a liquid chromatography-tandem mass spectrometry method for folates in rice. J. Chromatogr. A. 1215:125–132.
110. Chauveau-Duriot, B., Doreau, M., Nozière, P., and Graulet, B. 2010. Simultaneous quantification of carotenoids, retinol, and tocopherols in forages, bovine plasma, and milk: Validation of a novel UPLC method. Anal. Bioanal. Chem. 397:777–790.
111. Citova, I., Havlikova, L., Urbanek, L., Solichova, D., Novakova, L., and Solich, P. 2007. Comparison of a novel ultra-performance liquid chromatographic method for determi-nation of retinol and alpha-tocopherol in human serum with conventional HPLC using monolithic and particulate columns. Anal. Bioanal. Chem. 388:675–681.
Dow
nloa
ded
by [
Ahm
ad I
fsei
ai]
at 0
0:45
04
Apr
il 20
14