VITAL STATISTICS OF THE UNITED STATES 2004 - … · This report supplements the “Technical Notes...
84
TECHNICAL APPENDIX FROM VITAL STATISTICS OF THE UNITED STATES 2004 NATALITY U.S. DEPARTMENT OF HEALTH AND HUMAN SERVICES CENTERS FOR DISEASE CONTROL AND PREVENTION NATIONAL CENTER FOR HEALTH STATISTICS Hyattsville, Maryland: September 2006 Version 9-12-06
Transcript of VITAL STATISTICS OF THE UNITED STATES 2004 - … · This report supplements the “Technical Notes...
TECHNICAL APPENDIX FROM
VITAL STATISTICS OF THE UNITED STATES
2004
NATALITY
U.S. DEPARTMENT OF HEALTH AND HUMAN SERVICES
CENTERS FOR DISEASE CONTROL AND PREVENTION
NATIONAL CENTER FOR HEALTH STATISTICS Hyattsville, Maryland: September 2006 Version 9-12-06

ACKNOWLEDGMENTS The technical appendix preparation was coordinated by Sharon Kirmeyer in the Division of Vital Statistics (DVS) under the general direction of Joyce A. Martin, Lead Statistician, Reproductive Statistics Branch (RSB), DVS, and Stephanie J. Ventura, Chief of the Reproductive Statistics Branch. The vital statistics computer file on which it is based was prepared by DVS staff. The Division of Vital Statistics, Charles J. Rothwell, Director, and James A. Weed, Deputy Director, managed the Vital Statistics Cooperative Program, through which the vital registration offices of all states, the District of Columbia, New York City, Puerto Rico, Virgin Islands, Guam, American Samoa, and the Commonwealth of the Northern Mariana Islands provided the data to the National Center for Health Statistics (NCHS). This Division also processed computer edits, designed and programmed the tabulations, reviewed the data, prepared documentation for this publication, and was responsible for receipt and processing of the basic data file. The following management staff provided overall direction: Rajesh Virkar, Nicholas F. Pace, and Delton Atkinson. Important contributors were Judy M. Barnes, Faye Cavalchire, Candace Cosgrove, Connie M. Gentry, Brenda A. Green, Bonita Gross, Brady E. Hamilton, Kathy B. Holiday, Christina K. Jarman, Millie B. Johnson, David W. Justice, Virginia J. Justice, Julia L. Kowaleski, Kryn Krautheim, Annie Liu, Marian MacDorman, T.J. Mathews, Susan L. McBroom, Fay Menacker, Jaleh Mousavi, Martha Munson, Yashu Patel, Adrienne L. Rouse, Jordan Sacks, Manju Sharma, Steven Steimel, Pam Stephenson, Charles Sirc, Paul Sutton, George C. Tolson, James G. Williams, Jiaquan Xu and Serguey Yagodin. Thomas D. Dunn reviewed and verified the report. Senior Editor was Demarius Miller. NCHS acknowledges the essential role of the vital registration offices of all states and territories in maintaining the system through which vital statistics data are obtained and their cooperation in providing the information on which this publication is based.
2

For a list of reports published by the National Center for Health Statistics, contact: Information Dissemination Branch National Center for Health Statistics Centers for Disease Control and Prevention 3311 Toledo Road, Room 5420 Hyattsville, MD 20782 (301) 458–4636 Internet: www.cdc.gov/nchs
3

Table of Contents Introduction 7
Definition of Live Birth 7
History of Birth-Registration Area 8
Sources of Data 8
Natality statistics 8
Standard certificates of live birth 9
1989 revision 9
2003 revision 9
The 2004 Natality Data File 11
Occurrence and residence 12
Geographic classification 13
Demographic Characteristics 13
Hispanic origin, race and national origin 13
Age of mother 17
Age of father 19
Live birth order and parity 19
Marital Status 20
Educational attainment 21
Maternal and Infant Characteristics 22
Weight gain during pregnancy 22
Pregnancy risk factors 23
Tobacco use during pregnancy 23
Alcohol use during pregnancy 24
Prenatal care 24
Obstetric procedures 25
Characteristics of labor and/or delivery 26
Place of delivery and attendant at birth 27
Method of Delivery 27
4
Period of gestation 28
Birthweight 30
Apgar score 31
Plurality 31
Abnormal conditions of the newborn 32
Congenital anomalies of child 32
Quality of Data 33
Completeness of registration 33
Completeness of reporting 33
Quality control procedures 33
Computation of Rates and Other Measures 34
Population bases 34
Cohort fertility tables 37
Total fertility rates 38
Seasonal adjustment of rates 38
Computation of percentages, percentage distributions, and means 38
Computation of measures of variability 38
Random variation and significance testing for natality data 38
Random variation and significance testing for population subgroups 48
References 53
5

Figure 4-A. U.S. Standard Certificate of Live Birth: 1989 Revision 4-B. U.S. Standard Certificate of Live Birth: 2003 Revision Text Tables A. Percentage of birth records on which specified items were not stated: United States
and each state and territory, 2004 B. Births by place of occurrence and residence for births occurring in the 50 states, the
District of Columbia, U.S. territories, and other countries, 2004 C. Lower and upper 95 percent and 96 percent confidence limit factors for a birth rate
based on a Poisson variable of 1 through 99 births, B D. Sources for the resident population and population including Armed Forces abroad:
Birth-and death-registration states, 1900–1932, and United States, 1900–2004 E. Percentage net undercount, by age, sex, and race/Hispanic origin: United States,
April 1, 2000 Population Tables 4-1. Population of birth-and death-registration states, 1900–1932, and United States,
1900–2004 4-2. Estimated total population by race and estimated female population by age and race:
United States, 2004 4-3. Estimated total population by specified Hispanic origin and estimated female
population by age and specified Hispanic origin and by race for women of non-Hispanic origin: United States, 2004
4-4. Estimated total population and female population aged 15–44 years: United States,
each state, and territory, July 1, 2004
6
Introduction This Technical Appendix, published by the Centers for Disease Control and
Prevention’s National Center for Health Statistics (NCHS), is reprinted from “Vital
Statistics of the United States, 2004, Volume I, Natality” [1]. Reference will be made to
the “1999 Technical Appendix” for historical context and a more lengthy discussion of
some variables, as well as the quality and completeness of the birth data [2]. This report
supplements the “Technical Notes” section of “Births: Final data for 2004” [3] and is
recommended for use with the public-use file for 2004 births, available on CD-ROM
from NCHS [4], and the tabulated data of “Vital Statistics of the United States, 2004
Volume I, Natality” [1], in addition to the Internet publication of tables for variables not
included in the 2004 natality report.
Definition of Live Birth Every product of conception that gives a sign of life after birth, regardless of the
length of the pregnancy, is considered a live birth. This concept is included in the
definition set forth by the World Health Organization in 1950 [5]. A slightly expanded
definition of live birth was recommended by the 1992 revision of the Model State Vital
Statistics Act and Regulations [6], based on recommendations of a 1988 working group
formed by the American Academy of Pediatrics and the American College of
Obstetricians and Gynecologists [7] and is consistent with that currently used by the
WHO in the ICD-10 [8] and the United Nations:
“Live birth” means the complete expulsion or extraction from its mother of a
product of human conception, irrespective of the duration of pregnancy, which,
after such expulsion or extraction, breathes, or shows any other evidence of life,
such as beating of the heart, pulsation of the umbilical cord, or definite movement
of voluntary muscles, whether or not the umbilical cord has been cut or the
placenta is attached. Heartbeats are to be distinguished from transient cardiac
contractions; respirations are to be distinguished from fleeting respiratory efforts
or gasps.
7

This definition distinguishes in precise terms a live birth from a fetal death [9,10].
Forty-eight registration areas use definitions of live births similar to this definition; five
areas use a shortened definition; four have no formal definition of live birth. [9]. All
states require the reporting of live births regardless of length of gestation or birth weight.
History of Birth-Registration Area Currently the birth-registration system of the United States includes the 50 states,
the District of Columbia, the independent registration area of New York City, and Puerto
Rico, the U.S. Virgin Islands, Guam, American Samoa, and the Commonwealth of the
Northern Mariana Islands (referred to as Northern Marianas). However, in the statistical
tabulations, “United States” refers only to the aggregate of the 50 states (including New
York City) and the District of Columbia. Information on the history and development of
the birth-registration area is available elsewhere [2, 11].
Sources of Data Natality statistics
Since 1985, natality statistics for all states and the District of Columbia have been
based on information from the total file of records. The information is received on
electronic files consisting of individual records processed by the states, the District of
Columbia, New York City, Puerto Rico, the Virgin Islands, American Samoa, and the
Northern Marianas. NCHS receives these files from the registration offices of all states,
the two cities and four territories through the Vital Statistics Cooperative Program.
Information for Guam is obtained from paper copies of original birth certificates which is
coded and keyed by NCHS. Data from American Samoa first became available in 1997;
data from the Northern Marianas in 1998.
U.S. natality data are limited to births occurring within the United States,
including those occurring to U.S. residents and nonresidents. Births to nonresidents of the
United States have been excluded from all tabulations by place of residence beginning in
1970 (for further discussion see “Classification by occurrence and residence”). Births
occurring to U.S. citizens outside the United States are not included in the natality file.
Data for Puerto Rico, the Virgin Islands, Guam, American Samoa, and the Northern
8
Marianas are limited to births registered in these areas.
Standard certificates of live birth
The U.S. Standard Certificate of Live Birth, issued by the U.S. Department of
Health and Human Services, has served for many years as the principal means for
attaining uniformity in the content of the documents used to collect information on births
in the United States. Every 10-15 years, the U.S. Standard Certificate of Live Birth is
revised. Most state certificates conform closely in content to the standard certificate, but
are modified to the extent required by the particular state's needs or by special provisions
of the state's vital statistics law.
1989 revision—Effective January 1, 1989, a revised U.S. Standard Certificate of
Live Birth (figure 4-A) replaced the 1978 revision. This revision provided a wide variety
of new information on maternal and infant health characteristics, representing a
significant departure from previous versions in both content and format. The most
significant format change was the use of checkboxes to obtain detailed medical and
health information about the mother and child. Details of the nature and content of the
1989 revision are available elsewhere [2, 11].
2003 revision — In 2003, a revised U.S. Standard Certificate of Live Birth was
adopted, with initial implementation in two states (Pennsylvania and Washington). Five
states, Idaho, Kentucky, New York (excluding New York City), South Carolina, and
Tennessee implemented the revised birth certificate as of January 1, 2004. Two additional
states, Florida and New Hampshire, implemented the revised birth certificate in 2004, but
after January 1. The nine revised states represent 20 percent of all 2004 births; the seven
states which revised as of January 1, 2004 represent 14 percent of all 2004 births. Full
implementation in all states of the revised certificate will be phased in over several years.
There are numerous new items on the 2003 certificate and modifications of old items.
Examples of modified items include multiple race, educational attainment, smoking
during pregnancy, and prenatal care. A few examples of new checkbox categories for old
items are infertility treatment, NICU admission, and trial of labor prior to a cesarean
delivery. The process of the 2003 revision and the revision contents are described
elsewhere. [12,13].
9

A key aspect of the 2003 Revision of the United States Standard Certificate has
been the re-engineering of the data collection and transmission system. The intent of the
re-engineering is to improve data quality, speed of data collection and transmission, and
to enhance standardization of data [14]. To encourage collection of data from the best
sources, two worksheets have been developed: the Mother’s Worksheet and the Facility
Worksheet. In the Mother’s Worksheet, data are directly obtained from the mother and
include such data as race, Hispanic origin, educational attainment, etc. In the Facility
Worksheet, data are obtained directly from medical records of the mother and infant for
items such as date of last normal menses, risk factors, method of delivery, etc. To assist
hospital staff in completing the Facility Worksheet, a comprehensive instruction manual
was developed: Guide to Completing the Facility Worksheets for the Certificate of Live
Birth and Report of Fetal Death (2003 Revision) [15].
The medical and health check boxes -- Both the 1989 and 2003 Standard
Certificates of Live Birth use a checkbox format for collecting much of the medical and
health information available on the birth certificate. This information includes items on
pregnancy/medical risk factors, method of delivery, obstetric procedures, characteristics
of labor and/or delivery, abnormal conditions of the newborn, and congenital anomalies
of the child. However, a number of individual checkbox items included on the 1989
certificate were dropped from the revised certificate in 2003 (such as Rh sensitization,
incompetent cervix, and amniocentesis). In addition, specifications for some check box
items were modified for the 2003 revision resulting in data which are not comparable
across revisions (for example: premature rupture of membranes and prolonged labor.)
See table A and 2004 file documentation for reporting areas [4].
The report “Births: Final Data for 2004” includes items which are reported in both
the 1989 and the 2003 Standard Certificate of Live Birth. Data items exclusive to either
the 1989 (e.g. maternal anemia, ultrasound, and alcohol use) or the 2003 birth certificate
revision (e.g. such as the use of infertility treatment and NICU admission) are not shown.
Supplemental 2004 tables for data exclusive to the 1989 Revision are available on the
NCHS website (www.cdc.gov/nchs). A forthcoming report will present selected
information exclusive to the 2003 Revision.
10

The 2004 Natality Data File The 2004 data file includes data items which are comparable between the 1989
and 2003 revisions of the U.S. Standard Certificate of Live Birth. The file also includes
all data which are exclusive to the 1989 revision, such as febrile infant and cord prolapse.
Additionally, the 2004 file also includes new checkbox response categories for selected
items, such as number of previous cesarean deliveries and surfactants to newborn. Certain
new data items exclusive to the 2003 revised certificate are not available on the file:
- date of last prenatal care visit - matching number for plural births
- 10-minute Apgar score - source of payment for delivery
- mother’s height - WIC food receipt
- infections present (5 items) - maternal morbidity (7 items)
- whether infant was alive at time - whether infant was breastfed at
of report discharge.
The 1989 certificate was used in 41 states, the District of Columbia and the
territories for all of 2004. Seven states used the 2003 certificate throughout the 2004
data year: Idaho, Kentucky, New York (excluding New York City), Pennsylvania, South
Carolina, Tennessee and Washington. Florida used the 1989 revision during January and
February, 2004; New Hampshire used the 1989 revision until July 19; starting March 1,
Florida implemented the 2003 revision; New Hampshire did so on July 20.
One of the principal values of vital statistics data is realized through the
presentation of rates that are computed by relating the vital events of a class to the
population of a similarly defined class. Vital statistics and population statistics, therefore,
must be tabulated in comparable groups. Even when the variables common to both, such
as geographic area, age, race, and sex, have been similarly classified and tabulated,
significant discrepancies may result from differences between the enumeration method of
obtaining population data and the registration method of obtaining vital statistics data.
The general rules used to classify characteristics of live births are set forth in two
NCHS manuals [16, 17]. The instruction materials are for states to use in coding the data
items; they do not include NCHS recodes. Therefore, the file layout [4] is a better source
of information on the code structure because it provides the exact codes, recodes and
reporting flags that are available. Classification of certain important items is discussed in
11
the following pages. Information on the completeness of reporting of birth certificate data
is shown in table A, which presents a listing of items and the percentage of records that
were not stated for each state, Puerto Rico, the Virgin Islands, Guam, American Samoa,
and the Northern Marianas.
Occurrence and residence
In tabulations by place of residence, births occurring within the United States to
U.S. citizens and to resident aliens are allocated to the usual place of residence of the
mother in the United States, as reported on the birth certificate. Beginning in 1970, births
to nonresidents of the United States occurring in the United States are excluded from
these tabulations. Births to U.S. residents occurring outside this country are not included
in tabulations by place of residence.
The total count of births for the United States by place of residence and by place
of occurrence will not be identical. Births to nonresidents of the United States are
included in data by place of occurrence but excluded from data by place of residence, as
previously indicated. See table B for the number of births by residence and occurrence
for the 50 states and the District of Columbia for 2004.
Residence error—A nationwide test of birth-registration completeness in 1950
provided measures of residence error for natality statistics. According to the 1950 test
(which has not been repeated), errors in residence reporting for the country as a whole
tend to overstate the number of births to residents of urban areas and to understate the
number of births to residents of other areas [18]. Recent experience suggests that this is
still a concern based on anecdotal evidence from the states. This tendency has assumed
special importance because of a concomitant development—the increased utilization of
hospitals in cities by residents of nearby places—with the result that a number of births
are erroneously reported as having occurred to residents of urban areas. Another factor
that contributes to this overstatement of urban births is the customary practice of using
city addresses for persons living outside the city limits. Residence error should be taken
into consideration in interpreting data for small areas and for cities. Both birth and infant
mortality patterns can be affected.
Incomplete residence—Beginning in 1973, where only the state of residence is
reported with no city or county specified and the state named is different from the state of
12
occurrence, the birth is allocated to the largest city of the state of residence. Before 1973,
such births were classified according to the exact place of occurrence.
Geographic classification
The rules followed in the classification of geographic areas for live births are
contained in the instruction manual mentioned previously. The geographic code structure
for the 2004 file is given in two manuals, “Vital Records Geographic Classification,
2003,” and “Vital Records Geographic Classification, 2004. Federal Information
Processing Standards (FIPS).” NCHS Instruction Manual, Part 8, [17] and [19]. The
geographic code structure on the 2004 file is based on results of the 2000 Census of
Population.
United States— In the statistical tabulations “United States” refers only to the
aggregate of the 50 states and the District of Columbia. Alaska has been included in the
U.S. tabulations since 1959 and Hawaii since 1960.
Details of the classification of births for metropolitan statistical areas,
metropolitan and non-metropolitan counties, and population size groups for cities and
urban places are presented elsewhere [2].
Places with a population of less than 100,000 are not separately identified on the
public-use file because of confidentiality limitations.
Demographic Characteristics Hispanic origin, and race
Hispanic origin—Hispanic origin and race are reported separately on the birth
certificate. Data for Hispanic subgroups are shown in most cases for five specific groups:
Mexican, Puerto Rican, Cuban, Central and South American, and “other and unknown
Hispanic.” In tabulations of birth data by race and Hispanic origin, data for persons of
Hispanic origin are not further classified by race because the vast majority of births to
Hispanic women in 2004 are reported as white as in previous years. In tabulations of birth
data by race only, data for persons of Hispanic origin are included in the data for each
race group according to the mother’s reported race. In tabulations that include Hispanic
origin, data for non-Hispanic persons are classified according to the race of the mother
because there are substantial differences in fertility and maternal and infant health
13

between Hispanic and non-Hispanic white women. A recode variable is available that
provides cross tabulations of race by Hispanic origin.
Items asking for the Hispanic origin of the mother and the father have been
included on the birth certificates of all states and the District of Columbia, the Virgin
Islands, and Guam since 1993 [3]. Puerto Rico, American Samoa, and the Northern
Marianas do not collect this information. In addition, Florida (for births occurring from
March 1, 2004 only), Idaho, Kentucky, New Hampshire (for births occurring as of July
19, 2004 only), New York State (excluding New York City), Pennsylvania, South
Carolina, Tennessee, and Washington, which used the 2003 revision of the U.S. Standard
Certificate of Live Birth, permitted respondents to select one or more Hispanic origin
categories [Figure 4-B]. Minnesota, which used the 1989 revised certificate, also allowed
reporting of multiple Hispanic groups. These 10 revised states accounted for 13 percent
of Hispanic births in the United States in 2004. The percentage of records for which
Hispanic origin of the parents was not reported in 2004 is shown by state in table A.
The new Hispanic origin question asks that the respondent "check the box that
best describes whether the mother or father is Spanish/Hispanic/Latina/o." Although
only one response is asked for, multiple responses to this item are sometimes given.
Therefore, the electronic State birth registration systems are designed to capture multiple
responses to this item. If more than one box is checked, or if there is a literal entry and
one or more boxes checked, the code for "Multiple Hispanic" is applied. These records
are classified as "Other Hispanic" in NCHS data. The percentage of Hispanic mothers in
the 10 revised states reporting more than one Hispanic origin group was 1.5 percent in
2004.
In computing birth and fertility rates for the Hispanic population, births with
origin of mother not stated are included with non-Hispanic births rather than being
distributed. Thus, rates for the Hispanic population are underestimates of the true rates
[20] to the extent that the births with Hispanic origin of mother not stated (0.8 percent in
2004) were actually to Hispanic mothers. The population with origin not stated was
imputed. The effect on the rates is believed to be small.
Single, Multiple and “Bridged” race of mother and father—In 1997, the Office
of Management and Budget (OMB) issued ‘‘Revisions to the Standards for the
14

Classification of Federal Data on Race and Ethnicity’’ which revised the ‘‘1977
Statistical Policy Directive 15, Race and Ethnic Standards for Federal Statistics and
Administrative Reporting’’ [21, 22, 23]. These documents specify guidelines for
collection, tabulation, and presentation of race and ethnicity data within the Federal
statistical system. The 1997 revised standards incorporated two major changes designed
to reflect the changing racial profile of the United States. First, the revision increased
from four to five the minimum set of categories to be used by Federal agencies for
identification of race. The 1977 standards required Federal agencies to report race-
specific tabulations using a minimum set of four single-race categories: American Indian
or Alaska Native (AIAN), Asian or Pacific Islander (API), Black, and White. The five
categories for race specified in the 1997 standards are: American Indian or Alaska
Native, Asian, Black or African American, Native Hawaiian or Other Pacific Islander,
and White. The revised standards called for reporting of Asians separately from Native
Hawaiians or Other Pacific Islanders. Collection of additional detail on race and
ethnicity is permitted, as before, so long as the additional categories can be aggregated
into the minimum categories. The revised standards also require Federal data collection
programs to allow respondents to select one or more race categories.
For the 2000 decennial census, the U.S. Census Bureau collected race and
ethnicity data in accordance with the 1997 revised standards. However, the National
Vital Statistics System, which is based on data collected by the states, will not be fully
compliant with the new standards until all of the states revise their birth certificates to
reflect the new standards. Thus, beginning with the 2000 data year, the numerators
(births) for birth rates are incompatible with the denominators (populations) (see
“Population denominators”). In order to compute rates, it is necessary to ‘‘bridge’’
population data for multiple-race persons to single-race categories. This has been done
for birth rates by race presented in this report. Once all states revise their birth
registration systems to be compliant with the 1997 OMB standards, the use of ‘‘bridged’’
populations can be discontinued.
For the 2004 data year, multiple-race was reported by Florida (for births occurring
from March 1, 2004 only), Idaho, Kentucky, New Hampshire (for births occurring from
15

July 19, 2004 only), New York State (excluding New York City), Pennsylvania, South
Carolina, Tennessee and Washington, which used the 2003 revision of the U.S. Standard
Certificate of Live Birth, as well as by California, Hawaii, Michigan (for births at
selected facilities only), Minnesota, Ohio, and Utah, which used the 1989 revision of the
U.S. Standard Certificate of Live Birth. These 15 states, which account for 43.0 percent
of U.S. births in 2004, reported 1.8 percent of mothers as multiracial, with levels varying
from 0.5 percent (New Hampshire) to 34.4 percent (Hawaii). Data from the vital records
of the remaining 35 states and the District of Columbia followed the 1977 OMB
standards in which a single race is reported [21]. In addition, these areas also report the
minimum set of four races as stipulated in the 1977 standards [21], compared with the
minimum of five races for the 1997 [22] standards.
In order to provide uniformity and comparability of the data during the transition
period, before multiple-race data are available for all reporting areas, it is necessary to
“bridge” the responses of those who reported more than one race to a single-race. The
bridging procedure for multiple-race mothers and fathers is based on the procedure used
to bridge the multiracial population estimates (see “Population denominators”) [23, 24].
Multiple-race is imputed to a single race (one of the following: AIAN, API, Black, or
White) according to the combination of races, Hispanic origin, sex, and age indicated on
the birth certificate of the mother or father. The imputation procedure is described in
detail elsewhere [25, 26].
As noted previously, the bridging procedure imputes multiple-race of mothers to
one of the four minimum races stipulated in the 1977 OMB standards, that is, AIAN,
API, Black, or White. Mothers of a specified Asian or Pacific Islander subgroup (that is,
Chinese, Japanese, Hawaiian, or Filipino) in combination with another race (that is,
AIAN, Black, and/or White) or another API subgroup cannot be imputed to a single API
subgroup. API mothers are disproportionately represented in the 15 states reporting
multiple-race (54.8 percent in 2004.) For both reports: “Births: Final Data for 2003” and
“Births: Final Data for 2004”, data are not shown for the specified API subgroups
because the bridging technique cannot be applied in this detail [3, 23, 24]. However, data
for the API subgroups, reported alone or in combination with other races and/or API
subgroups, are available in the 2004 natality public-use data file. A forthcoming [27]
16

report describes characteristics of births in 2003 to single and multiple-race women
Race of mother is reported by 35 states and the District of Columbia in at least
eight single-race categories: White, Black, American Indian or Alaska Native, Chinese,
Japanese, Hawaiian, Filipino, and “other Asian or Pacific Islander” (API). Of these, six
states (Illinois, Missouri, New Jersey, Texas, Virginia, and West Virginia) report data on
the expanded API subgroups included in the “other API category” (Asian Indian, Korean,
Samoan, Vietnamese, Guamanian, and remaining API). Finally, the fifteen states which
report multiple-race data (California, Hawaii, Ohio, Pennsylvania, Utah, and
Washington) report a minimum of fourteen categories (White, Black, American Indian or
Alaska Native, Asian Indian, Chinese, Filipino, Japanese, Korean, Vietnamese, other
Asian, Hawaiian, Guamanian, Samoan, and other Pacific Islander). For this report, as
discussed above, the multiple-race combinations (for example, White and AIAN or Black
and Chinese) were bridged to one of four broad categories (bridged White, bridged
Black, bridged AIAN, and bridged API). Detailed data on race (single or multiple) as
reported in these 15 states are available from the 2004 natality public use file.
In 2004, race of mother was not reported for 0.9 percent of births. In these cases,
if the race of the father was known, the race of the father was assigned to the mother.
When information was not available for either parent, the race of the mother was imputed
according to the specific race of the mother on the preceding record with a known race of
mother. This was necessary for just 0.7 percent of births in 2004.
Beginning with the 1989 data year, NCHS started tabulating its birth data
primarily by race of the mother. In 1988 and prior years, births were tabulated by the
race of the child, which was determined from the race of the parents as entered on the
birth certificate. The reasons for this change are summarized in the 1999 Technical
Appendix [2]. Trend data by race shown in this report are by race of mother for all years
beginning with the 1980 data year. Text references to white births and white mothers or
black births and black mothers are used interchangeably for ease in writing.
Age of mother Beginning in 1989 a “Date of birth” item on the birth certificate replaced the “Age
(at time of this birth)” item. Not all states revised this item, and, therefore, the age of
mother either is derived from the reported month and year of birth or coded as stated on
17

the certificate. In 2004 age of mother was reported directly by four states (Nevada, North
Dakota, Virginia, and Wyoming) and American Samoa.
From 1964 to 1996, births reported to occur to mothers younger than age 10 or
older than age 49 years had age imputed according to the age of mother from the previous
record with the same race and total birth order (total of live births and fetal deaths).
Beginning in 1997, age of mother is imputed for ages 9 years or under and 55 years and
over. A review and verification of unedited birth data for 1996 showed that the vast
majority of births reported as occurring to women aged 50 years and older were to
women aged 50-54 years. The numbers of births to women aged 50-54 years are too
small for computing age-specific birth rates. These births have been included with births
to women aged 45-49 years for computing birth rates [2].
Age–specific birth rates are based on populations of women by age, prepared by
the U.S. Census Bureau. In census years the decennial census counts are used. In
intercensal years, estimates of the population of women by age are published by the U.S.
Census Bureau in Current Population Reports. The 2000 Census of Population derived
age in completed years as of April 1, 2000, from responses to questions on age at last
birthday and month and year of birth, with the latter given preference. In the 1960, 1970,
1980, and 1990 Census of Population, age was also derived from month and year of birth.
Age in completed years was asked in censuses before 1960. This was nearly the
equivalent of the former birth certificate question, which the 1950 test of matched birth
and census records confirmed by showing a high degree of consistency in reporting age
in these two sources [28]. More recently, reporting of maternal age on the birth certificate
was compared with reporting of age in a survey of women who had recently given birth.
Reporting of age was very consistent between the two sources [29].
Median age of mother—Median age is the value that divides an age distribution
into two equal parts, one-half of the values being less and one-half being greater. Median
ages of mothers for 1960 to the present have been computed from birth rates for 5–year
age groups rather than from birth frequencies. This method eliminates the effects of
changes in the age composition of the childbearing population over time. Changes in the
median ages from year to year can thus be attributed solely to changes in the age–specific
birth rates. Trend data on the median age are shown in table 1-5 of “Vital Statistics of the
18
United States, 2001, Volume 1, Natality” [30], which is available on the Internet at:
http://www.cdc.gov/nchs/datawh/statab/unpubd/natality/natab2001.htm
Not stated age or date of birth of mother— In 2004, age of mother was not
reported on 0.02 percent of the records. Beginning in 1964 birth records with date of birth
of mother and/or age of mother not stated have had age imputed according to the age of
mother from the previous birth record of the same race and total-birth order (total of fetal
deaths and live births). (See NCHS Instruction Manual, Part 12, page 9) [31]. Editing
procedures for 1963 and earlier years are described elsewhere [2].
Age of father
Age of father is derived from the reported date of birth or coded as stated on the
birth certificate. If the age is under 10 years, it is considered not stated and grouped with
those cases for which age is not stated on the certificate. Information on age of father is
often missing on birth certificates of children born to unmarried mothers, greatly inflating
the number in the “Not stated” category in all tabulations by age of father. In computing
birth rates by age of father, births tabulated as age of father not stated are distributed in
the same proportions as births with known age within each 5–year-age classification of
the mother. This procedure is followed because, while father’s age is missing on 13.6
percent of the birth certificates in 2004, one-quarter of these were on records where the
mother is a teenager. This distribution procedure is done separately by race. The resulting
distributions are summed to form a composite frequency distribution that is the basis for
computing birth rates by age of father. This procedure avoids the distortion in rates that
would result if the relationship between age of mother and age of father were
disregarded. Births with age of father not stated are distributed only for rates, not for
frequency tabulations [3].
Live-birth order and parity
Live-birth order and parity classifications refer to the total number of live births
the mother has had including the 2004 birth. Fetal deaths are excluded.
Live-birth order indicates what number the present birth represents; for example,
a baby born to a mother who has had two previous live births (even if one or both are not
now living) has a live-birth order of three. Parity indicates how many live births a mother
has had. Before delivery, a mother having her first baby has a parity of zero, and a mother
19
having her third baby has a parity of two. After delivery the mother of a baby who is a
first live birth has a parity of one, and the mother of a baby who is a third live birth has a
parity of three.
Live-birth order and parity are determined from two items on the birth certificate,
“Live births now living” and “Live births now dead.” Editing procedures for live birth
order are summarized elsewhere [2, 14, 31].
Not stated birth order—All births tabulated in the “Not stated birth order”
category are excluded from the computation of percentages. In computing birth rates by
live-birth order, births tabulated as birth order not stated are distributed in the same
proportion as births of known live-birth order.
Marital status
National estimates of births to unmarried women are based on two methods of
determining marital status. For 1994 through 1996 birth certificates in 45 states and the
District of Columbia included a question about the mother's marital status. For the other
states, marital status is inferred from information on the birth certificate. Beginning in
1997, the marital status of women giving birth in California and Nevada was determined
by a direct question in the birth registration process. New York City also changed its
procedures for inferring marital status in 1997. Beginning June 15, 1998, Connecticut
discontinued inferring the mother’s marital status and added a direct question on mother’s
marital status to the state’s birth certificate.
In the two states (Michigan and New York) which used inferential procedures to
compile birth statistics by marital status in 2004, a birth is inferred as nonmarital if either
of these factors, listed in priority-of-use order, is present: a paternity acknowledgment
was received or the father’s name is missing. In recent years, a number of states have
extended their efforts to identify the fathers when the parents are not married in order to
enforce child support obligations. The presence of a paternity acknowledgment,
therefore, is the most reliable indicator that the birth is nonmarital in the states not
reporting this information directly; this is now the key indicator in the nonreporting
states. Details of the changes in reporting procedures and the impact of the procedures on
the data are described in previous reports [32, 33].
The mother’s marital status was not reported in 2004 on 0.04 percent of the birth
20

records in the 48 states and the District of Columbia where this information is obtained
by a direct question. Marital status was imputed for these records. If status was unknown
and the father’s age was known, then the mother was considered married. If the status
was unknown, and the father’s age unknown, then the mother was considered unmarried.
This represents a change from the procedures in effect for 2002 and previous years. Prior
to 2003, marital status for records with marital status not reported was imputed as
“married.” Because of the small number of records affected (2,216 births in 2004), the
change in imputation procedures had essentially no impact on measures of nonmarital
births.
When births to unmarried women are reported as second or higher order births, it
is not known whether the mother was married or unmarried when the previous deliveries
occurred because her marital status at the time of these earlier births is not available from
the birth record.
Educational attainment
Information on educational attainment is reported on both the 2003 Standard
Certificate of Live Birth (revised) and 1989 Standard Certificate of Live Birth
(unrevised). However, the format of the education item on the revised standard certificate
substantively differs from that of the unrevised standard certificate.
The 2003 Certificate item asks for the highest degree or level of school completed
at the time of the birth (e.g., high school diploma, some college credit but no degree,
bachelor degree, etc.). By contrast, the 1989 Certificate asks for the highest grade of
school completed by the mother. Only those years completed in regular schools are
counted, that is, a formal educational system of public schools or the equivalent in
accredited private or parochial schools. Business or trade schools, such as beauty and
barber schools, are not considered regular schools for the purposes of this item. No
attempt has been made to convert years of school completed in foreign school systems,
ungraded school systems, and so forth, to equivalent grades in the American school
system. Such entries are included in the “Not stated” category.
Women who have completed only a partial year in high school or college are
tabulated as having completed the highest preceding grade or level. For those certificates
on which a specific degree is stated, years of school completed is coded to the level at
21

which the degree is most commonly attained; for example, women reporting B.A., A.B.,
or B.S. degrees are considered to have completed 16 years of school
In sum, education data for the states that have implemented the revised
certificates are not directly comparable with the data for the states that are not yet using
the revised certificate. For 2004, unrevised data are available for 41 states, New York
City and the District of Columbia and part of the year for Florida and New Hampshire.
Revised data are available for all of 2004 for 7 states (Idaho, Kentucky, New York State
(excluding New York City), Pennsylvania, South Carolina, Tennessee, and Washington)
and part of the year for Florida and New Hampshire.
“Births: Final Data for 2004,” provides separate tabulations for the revised and
unrevised educational attainment items; see table D. Table A of this Appendix indicates
that education was not stated in 2.0 percent of the unrevised states; among the revised
states, levels ranged from 0.8 to 7.5%.
Data on educational attainment are currently available only for the mother [2].
Beginning in 1995, NCHS discontinued collecting information on the educational
attainment of the father.
Maternal and Infant Health Characteristics Weight gain during pregnancy
Information on maternal weight gain is available from both the 1989 (unrevised)
and the 2003 (revised) Standard Certificate of Live Birth. However, the item was
modified. The unrevised question asks for “weight gained during pregnancy ____ lbs.”,
compared with the revised question, which asks for the pre-pregnancy weight of the
mother and her weight at delivery.
In the 2004 file, unrevised data are available through the data year for 40 states,
New York City, and the District of Columbia, while revised data are available for 7
states. Two states which had mid-year revisions, reported both revised and unrevised
data. California did not report weight gain information.
The data from the revised certificate were combined with the data based on the
1989 revision to produce tabulations shown in tables 22 and 23 of the report “Birth: Final
Data 2004” [3].
22

Weight gain in pregnancy is reported in pounds. A reported loss of weight is
recorded as zero gain.
Pregnancy risk factors
Both the 2003 and 1989 certificates collect pregnancy risk information in the
check box format. Ten medical risks which can affect pregnancy outcome are separately
identified on the 2003 Standard Certificate of Live Birth (revised); sixteen on the 1989
Standard Certificate of Live Birth (unrevised). The format allows for the designation of
more than one risk factor and includes a choice of “None.” Accordingly, if the item is not
completed, it is classified as not stated.
Four risk factors are comparable between certificates: diabetes, chronic
hypertension, gestational hypertension, and eclampsia. Selected risk factors are shown in
tables 23 to 25 of the report “Births: Final Data for 2004” [3]. Supplemental 2004 tables
for risk factor data exclusive to the 1989 Revision are available on the NCHS website
(www.cdc.gov/nchs); a forthcoming report will present risk factor information exclusive
to the 2003 Revision.
The percent of birth records in which pregnancy risk factor items were not stated
was 0.4. Definitions for revised and unrevised items are available elsewhere [3, 15].
Tobacco use during pregnancy
Information on smoking during pregnancy was reported on both the 2003
Certificate of Live Birth (revised) and the 1989 Certificate of Live Birth (unrevised). The
format of the tobacco use item differs between certificates. Briefly stated, the 1989
revision asks a simple “yes/no” question on tobacco use during pregnancy and the
average number of cigarettes per day with no specificity on timing during the pregnancy.
In contrast, the 2003 revision asks for number of cigarettes smoked at different intervals
before and during the pregnancy. If the mother reported smoking in any of the three
trimesters of pregnancy she was recorded as a smoker.
In the file, for 40 States, New York City, and the District of Columbia, smoking
status was based on the 1989 U.S. Standard Certificate (unrevised), while data for 6 states
are drawn from the 2003 revision of the birth certificate (revised). Florida had a unique
smoking use question in its 2003 revision which differed from both the standard revised
23

and unrevised version; resulting data were not comparable to either version. Florida used
the standard 1989 revision question during January and February, 2004; New Hampshire
used the 1989 revision until July 19; starting March 1, Florida implemented its own
revised question; New Hampshire implemented the standard revised tobacco use question
on July 20. California did not report tobacco use in 2004.
The births occurring where the unrevised question was used accounted for 67
percent of US births in 2004. The overall percent of birth records where tobacco use was
not stated for the unrevised item was 1.1 percent.
In the report, Births: Final Data for 2004” [3] data are shown separately in table
E for the areas using the unrevised certificate and for the areas using the revised
certificate.
Alcohol use during pregnancy
Data on alcohol use are not collected in the 2003 Standard Certificate of Live
Birth. Data on alcohol use during pregnancy from the 1989 Standard Certificate are
available for 40 states for the full data year of 2004 and the initial months of 2004 for
Florida and New Hampshire. Alcohol use data are not collected on California’s birth
certificate. Supplemental 2004 tables for data exclusive to the 1989 Revision, including
alcohol use during pregnancy, are available on the NCHS website (www.cdc.gov/nchs).
Alcohol use during pregnancy is a major, independent risk factor and it is
implicated as well in delayed infant and child development [34, 35]. Unfortunately,
alcohol use is substantially underreported on the birth certificate, compared with data
collected in nationally representative surveys of pregnant women. The birth certificate
question on alcohol use from the 1989 revision is evidently not sensitive enough to
measure this behavior accurately. The question’s wording as well as the lack of specific
time reference for the birth certificate questions are probable factors contributing to the
underreporting. In addition, the stigma of maternal alcohol use likely contributes to the
underreporting [36, 37].
Prenatal care
Information on the timing of prenatal care is available for both the revised and
unrevised Certificates of Live Birth. However, the 2003 revision of the birth certificate
introduced substantive changes in item wording and also to the sources of prenatal
24

information. The wording of the prenatal care item was modified to “Date of first
prenatal visit” from “Month prenatal care began.” In addition, the 2003 revision process
resulted in recommendations that the prenatal care information be gathered from the
prenatal care or medical records, whereas the 1989 revision did not recommend a source
for these data. Accordingly, prenatal care data for the two revisions are not directly
comparable.
For the complete data year 2004, unrevised data on prenatal care are available for
41 states, New York City and the District of Columbia. Revised data for 7 states (Idaho,
Kentucky, New York State (excluding New York City), Pennsylvania, South Carolina,
Tennessee, and Washington) are available for all of 2004. Florida and New Hampshire
implemented the revised certificate after January 1, 2004.
As noted above, the revised prenatal care item is substantively different from the
unrevised question. One result is that levels of utilization of prenatal care based on
revised data are substantially lower than those based on unrevised data. For example,
unrevised 2003 data for Kentucky indicate that 87.0 of residents began care in the first
trimester of pregnancy in 2003. This compares with a level of 74.5 percent based on
2004 revised data. Much, if not all of the difference between 2003 and 2004 for
Kentucky and other revised states, is related to changes in reporting and not to changes in
prenatal care utilization. Prenatal care utilization results are shown separately according
to the two revisions in tables E, 26(a) and 26(b) of the report “Birth: Final Data for 2004”
[3].
The 2004 natality data file includes a variable, The Adequacy of Prenatal Care
Utilization Index (APNCU). The APNCU is an alternative measure of prenatal care
timing which takes into account the number of prenatal care visits and gestational age of
the newborn at delivery [38, 39]. The index in the file is a 4 point scale ranging from
“inadequate” to “adequate plus care”. See table G of the report “Birth: Final Data for
2004” [3].
Tabulations of the number of prenatal visits were presented for the first time in
1972. Beginning in 1989, these data were collected from the birth certificates of all states.
25
Obstetric procedures
The 2003 Standard Certificate of Live Birth (revised) includes three specific
check boxes for obstetric procedures; the 1989 certificate includes six procedures. Both
certificates have a format which permits the selection of multiple procedures. Birth
records with “Obstetric procedures” left blank are considered “not stated.” Definitions
for the unrevised procedures are adapted and abbreviated from a set of definitions
compiled by a committee of Federal and State health statistics officials for the National
Association for Public Health Statistics and Information Systems (NAPHSIS) [3].
Definitions for the revised items are included in the detailed facility worksheet guidebook
for the 2003 revised certificate only [15]. Reporting areas and reporting completeness
for obstetric procedures are indicated in table A of this Appendix.
Tables H and 25 of the report: “Births: Final Data for 2004” [3] provide data for
the two procedures comparable to both certificates – tocolysis and induction of labor.
Supplemental 2004 tables for obstetric procedures exclusive to the 1989 Revision are
available on the NCHS website (www.cdc.gov/nchs). A forthcoming report will present
selected obstetric procedure tables exclusive to the 2003 Revision.
Characteristics of labor and of delivery
The 2003 Standard Certificate of Live Birth (revised) includes nine specific check
boxes for characteristics of labor and delivery; fifteen characteristics are reported on the
1989 (unrevised) certificate. Both certificates have a format which allows for the
reporting of more than one characteristic and includes a choice of “none”. Birth records
with “characteristics” left blank are considered “not stated.” Three characteristics:
precipitous labor, breech position, and meconium staining are comparable between the
two certificates. The percent of records on which labor and delivery items were not
stated and notes on reporting areas are found in table A.
The complication rates for selected labor/delivery characteristics and their
respective reporting areas are given in table 25 in the report “Birth: Final Data for 2004”
[3]. Supplemental 2004 tables for characteristics of labor and delivery exclusive to the
1989 revision are available on the NCHS website (www.cdc.gov/nchs). A forthcoming
report will present selected labor and delivery information exclusive to the 2003 revision.
26
Definitions for revised and unrevised items are available elsewhere [3, 15].
Place of delivery and attendant at birth
Both the 1989 and 2003 revisions of the U.S. Standard Certificate of Live Birth
include separate categories for hospitals, freestanding birthing centers, residence, and
clinic or doctor's office as the place of birth. In addition, the 2003 certificate queries
whether the home birth was planned to be a home delivery.
For both the revised and unrevised certificates, four professional categories of
attendants are medical doctors, doctors of osteopathy, certified nurse midwives, and other
midwives. Procedures in some hospitals may require that a physician be listed as the
attendant for every birth and that a physician sign each birth certificate, even if the birth
is attended by a midwife and no physician is physically present. Therefore, the number of
live births attended by midwives may be understated.
Additional information on births occurring outside of hospitals, and on birth
attendants can be found elsewhere [2].
Tabulations of place of birth and birth attendant are found in table 27 of the
report: “Births Final Data for 2004” [3].
Method of delivery
Information on the method of delivery is collected on both the 2003 Standard
Certificate of Live Birth (revised) and the 1989 Standard Certificate of Live Birth
(unrevised). However, the 2003 revised item is substantially modified from the 1989
item. The 1989 certificate includes, among others, direct questions on vaginal birth after
previous cesarean section (VBAC), and primary or repeat cesarean delivery. In contrast,
the revised certificate includes a direct question on previous cesarean delivery; whether
the delivery was a primary cesarean or was a VBAC must be derived from a question on
previous cesarean deliveries under the separate item “Risk Factors in this Pregnancy”.
Despite substantive changes to the method of delivery item, the total numbers and
percents of vaginal and cesarean deliveries appear to be very consistent between
revisions. (See tables 28-30 from the report: “Birth: Final Data for 2004” [3]). However,
information on whether the delivery is a VBAC, primary cesarean, or repeat cesarean
appears to be less comparable. In brief, data for the revised states show higher- than-
27

expected VBAC and primary cesarean rates, and lower- than- expected repeat cesarean
rates. These discontinuities are likely due to wording and formatting changes to the
method of delivery item on the 2003 Revision of the U.S. Standard certificate of live
birth. The changes to the method of delivery item appear to have a small impact (2-3
percent) on the national primary and VBAC rates shown in the 2004 natality report [3].
Measures which incorporate these data to compare changes across revisions for
individual states should be interpreted with caution. Information on forceps and vacuum delivery are also available from both
revisions of the birth certificate; these data appear to be comparable between revisions.
The 2003 revision item was also expanded to include questions on whether attempted
forceps or vacuum deliveries were successful, and whether a trial of labor was attempted
prior to cesarean delivery. These and other new data on method of delivery are available
on the 2004 file and will be presented in a forthcoming report.
Several rates are computed for method of delivery. The overall cesarean section
rate or total cesarean rate is computed as the proportion of all births that were delivered
by cesarean section. The primary cesarean rate is a measure that relates the number of
women having a primary cesarean birth to all women giving birth who have never had a
cesarean delivery. The denominator for this rate is the sum of women with a vaginal birth
excluding VBACs and women with a primary cesarean birth. The VBAC delivery rate is
computed by relating all VBAC deliveries to the sum of VBAC and repeat cesarean
deliveries, that is, to women with a previous cesarean section.
Period of gestation
The period of gestation is defined as beginning with the first day of the last
normal menstrual period (LMP) and ending with the day of the birth. The LMP is used as
the initial date because it can be more accurately determined than the date of conception,
which usually occurs 2 weeks after the LMP. LMP measurement is subject to error for
several reasons, including imperfect maternal recall or misidentification of the LMP
because of post-conception bleeding, delayed ovulation, or intervening early miscarriage.
Births occurring before 37 completed weeks of gestation are considered to be
preterm for purposes of classification. At 37–41 weeks gestation, births are considered to
be term, and at 42 completed weeks and over, post-term. These distinctions are according
28

to the ICD–9 and ICD–10 [8] definitions. See tables 31 and 32 in the 2004 natality report.
Before 1981, the period of gestation was computed only when there was a valid
month, day, and year of LMP. However, length of gestation could not be determined
from a substantial number of live-birth certificates each year because the day of LMP was
missing. Beginning in 1981, weeks of gestation have been imputed for records with
missing day of LMP when there is a valid month and year. The imputation procedure and
its effect on the data are described elsewhere [2, 40]. But reporting problems for this item
persist and may occur more frequently among some subpopulations and among births
with shorter gestations. Changes in reporting of this measure over time have apparently
affected trends in preterm birth rates, particularly by race [41].
The 1989 revision of the U.S. Standard Certificate of Live Birth includes an item,
“Clinical estimate of gestation” (CE); in the 2003 revision of the certificate, the item is
“Obstetric estimate of gestation” (OE) – see definitions [15]. Both measures are in
completed weeks. The OE and the CE are compared with length of gestation computed
from the LMP date when the latter appears to be inconsistent with birthweight. This is
done for normal weight births of apparently short gestations and very low birthweight
births reported to be full term. The procedures are described in the NCHS instruction
manuals, part 12, (see NCHS [31] for the 1989 revision; NCHS [42] for the 2003
revision). The clinical/obstetric estimate is reported by all areas except California for
2004.
The period of gestation for 5.9 percent of the births in 2004 was based on the
clinical estimate of gestation. For 97 percent of these records, the clinical/obstetric
estimate was used because the LMP date was not reported. For the remaining 3 percent,
the clinical/obstetric estimate was used because it was compatible with the reported
birthweight, whereas the LMP-based gestation was not. In cases where the reported
birthweight was inconsistent with both the LMP-computed gestation and the clinical
estimate of gestation, the LMP-computed gestation was used and birthweight was
reclassified as "not stated." This was necessary for 1,302 births or 0.04 percent of all
birth records in 2004, significantly higher than for 2003. Despite these edits, substantial
incongruities in these data persist; research is ongoing to address these data deficiencies.
Gestational age data are shown in tables 31 and 32 of the report: “Births: Final Data for
29

2004.”
Birthweight
In some areas birthweight is reported in pounds and ounces rather than in grams.
However, the metric system has been used in tabulating and presenting the statistics to
facilitate comparison with data published by other groups. The categories for birthweight
are consistent with the recommendations in the International Classification of Diseases,
Ninth Revision (ICD–9) and the International Classification of Diseases, Tenth Revision
(ICD–10) [8]. The categories in gram intervals and their equivalents in pounds and
ounces are as follows:
Less than 500 grams = 1 lb 1 oz or less 500–999 grams = 1 lb 2 oz–2 lb 3 oz 1,000–1,499 grams = 2 lb 4 oz–3 lb 4 oz 1,500–1,999 grams = 3 lb 5 oz–4 lb 6 oz 2,000–2,499 grams = 4 lb 7 oz–5 lb 8 oz 2,500–2,999 grams = 5 lb 9 oz–6 lb 9 oz 3,000–3,499 grams = 6 lb 10 oz–7 lb 11 oz 3,500–3,999 grams = 7 lb 12 oz–8 lb 13 oz 4,000–4,499 grams = 8 lb l4 oz–9 lb l4 oz 4,500–4,999 grams = 9 lb 15 oz–11 lb 0 oz 5,000 grams or more = 11 lb l oz or more ICD–9 and ICD–10 define low birthweight as less than 2,500 grams. This is a
shift of 1 gram from the previous criterion of 2,500 grams or less, which was
recommended by the American Academy of Pediatrics in 1935 and adopted in 1948 by
the World Health Organization in the International Lists of Diseases and Causes of
Death, Sixth Revision [43]. Very low birthweight is defined as less than 1,500 grams.
To establish the continuity of class intervals needed to convert pounds and ounces
to grams, the end points of these intervals are assumed to be half an ounce less at the
lower end and half an ounce more at the upper end. For example, 2 lb 4 oz–3 lb 4 oz is
interpreted as 2 lb 3 ½ oz–3 lb 4 ½ oz. Births for which birthweights are not reported are
excluded from the computation of percentages. The panel that proposed the 2003 Revised
Certificate recommended that birthweight be reported in grams rather than pounds for
data entry [12].
Birthweight data are shown in tables 31, 32, 34-36 of the 2004 natality report [3].
30

Apgar score The 1– and 5–minute Apgar scores were added to the U.S. Standard Certificate of
Live Birth in 1978 to evaluate the condition of the newborn infant at 1 and 5 minutes
after birth. The 2003 revised certificate asks for a 10 minute score if the 5 minute score
was less than 6. The Apgar score is a measure of the need for resuscitation and a
predictor of the infant's chances of surviving the first year of life. It is a summary
measure of the infant's condition based on heart rate, respiratory effort, muscle tone,
reflex irritability, and color. Each of these factors is given a score of 0, 1, or 2; the sum of
these 5 values is the Apgar score, which ranges from 0 to 10. A score of 0 to 3 indicates
an infant in need of resuscitation; a score of 4 to 6 is considered intermediate; a score of 7
or greater indicates that the neonate is in good to excellent physical condition.
Beginning in 1995, NCHS collected information only on the 5–minute Apgar
score. Since 1991, the reporting area for the 5–minute Apgar score has been comprised of
48 states and the District of Columbia. California and Texas did not collect information
on Apgar scores on their birth certificates. For 0.5 percent of the births in the reporting
area, there were no Apgar scores reported. Five minute Apgar sores are given in Table L
of the report: “Birth: Final Data for 2004” [3]. Revised data for the 10 minute score are
not available in the 2004 file.
Plurality
Comparable plurality data are reported in the 2003 and 1989 Standard Certificates
of Live Birth. In this file, plurality is classified as single, twin, triplet, quadruplet, and
quintuplet and higher order births. Each record in the natality file represents an individual
birth. For example, a record coded as a twin represents one birth in a twin delivery.
Pairs or sets of twins or higher order multiple births are not identified in this file. The
Matched Multiple Birth File 1995-2000 [44] includes information on sets of twin, triplet
and quadruplets, thus allowing for the analysis of characteristics of sets of births and fetal
deaths in multiple deliveries.
Numbers and rates of births by plurality are given in tables 37 -- 39 of the report:
“Birth: Final Data for 2004” [3]. Records for which plurality is unknown are imputed as
singletons. This occurred for 0.003 percent of all records for 2004.
31

Abnormal conditions of the newborn
Information on abnormal conditions of the newborn is obtained from the
checkboxes on the 1989 and 2003 certificate revisions. There are seven specific abnormal
conditions included on the 2003 revised birth certificate; eight are included on the 1989
certificate. More than one abnormal condition may be reported for a given birth or
“None” may be selected. If the item is not completed it is tabulated as not stated.
There are no comparable abnormal conditions between the 1989 and 2003
certificate. However, both unrevised and revised items are included in the 2004 Natality
Public Use File. Supplemental 2004 tables for abnormal conditions of the newborn
exclusive to the 1989 Revision are available on the NCHS website (www.cdc.gov/nchs).
A forthcoming report will present selected abnormal conditions information exclusive to
the 2003 Revision. Definitions are available elsewhere [3, 15]. For information on
reporting areas and for percent of birth records with conditions not stated, see table A. Congenital anomalies of the newborn
Twelve specific anomalies or anomaly groups are collected on the 2003 Standard
Certificate of Live Birth, 21 anomalies are collected on the 1989 Standard Certificate of
Live Birth. The checkbox format allows for the identification of more than one anomaly
including a choice of “None” should no anomalies be evident. The “not stated” category
includes birth records for which the item is not completed.
There are five congenital anomalies in common to the two revisions of the birth
certificate: anencephalus, spina bifida/meningocele, omphalocele/gastroschisis, cleft
lip/palate and Downs syndrome; see table 25 of the report “Births: Final Data for 2004”
[3].
It is well documented that congenital anomalies, except for the most visible and
most severe, are incompletely reported on birth certificates [45]. The completeness of
reporting specific anomalies depends on how easily they are recognized in the short time
between birth and birth-registration. For 1.2 of the birth records, there were incomplete
check boxes for congenital anomalies.
Definitions for the revised and unrevised congenital anomalies are available
elsewhere [3,15]. See table A for reporting areas and for percent of records for which
data on congenital anomalies is not stated.
32

Quality of Data
Although vital statistics data are useful for a variety of administrative and scientific
purposes, they cannot be correctly interpreted unless various qualifying factors and
methods of classification are taken into account. The factors to be considered depend on
the specific purposes for which the data are to be used. It is not feasible to discuss all the
pertinent factors in the use of vital statistics tabulations, but some of the more important
ones should be mentioned.
Most of the factors limiting the use of data arise from imperfections in the original
records or from the impracticability of tabulating these data in very detailed categories.
These limitations should not be ignored, but their existence does not lessen the value of
the data for most general purposes.
Completeness of registration
It is estimated that more than 99 percent of all births occurring in the United
States in 2004 were registered. These estimates are based on the results of a national
1964–68 test of birth-registration completeness according to place of delivery (in or out
of hospital) and race (white and non-white). This test has not been conducted more
recently. A detailed discussion of the method and results of the 1964–68
birth-registration test is available [46]. Information on procedures for adjusting births for
under registration (for cohort fertility tables) is presented elsewhere [2].
Completeness of reporting
Interpretation of these data must include evaluation of item completeness. The
“Not stated” percentage is one measure of the quality of the data. Completeness of
reporting varies among items and states. See table A for the percentage of birth records
on which specified items were not stated. Data users should note that levels of incomplete
or inaccurate reporting for some of the items are quite high in some states. The 2004 data
for Alaska and the District of Columbia are of particular concern.
Quality control procedures
As electronic files are received at NCHS, they are automatically checked for
completeness, individual item code validity, and unacceptable inconsistencies between
data items. The registration area is notified of any problems. In addition, NCHS staff
33

reviews the files on an ongoing basis to detect problems in overall quality such as
inadequate reporting for certain items, failure to follow NCHS coding rules, and systems
and software errors. Traditionally, quality assurance procedures were limited to the
review and analysis of differences between NCHS and registration area code assignments
for a small sample of records. In recent years, as electronic birth registration became
prevalent, this procedure was augmented by analyses of year-to-year and area-to-area
variations in the data. These analyses are based on preliminary tabulations of the data that
are cumulated by state on a year-to-date basis each month. NCHS investigates all
differences that are judged to have consequences for quality and completeness. In the
review process, statistical tests are used to call initial attention to differences for possible
follow-up. As necessary, registration areas are informed of differences encountered in the
tables and asked to verify the counts or to determine the nature of the differences.
Missing records (except those permanently voided) and other problems detected by
NCHS are resolved, and corrections are transmitted to NCHS in the same manner as for
those corrections identified by the registration area.
Computation of Rates and Other Measures Population bases
Estimation by age, sex, race and Hispanic origin—Birth and fertility rates for
2004 shown in tables 1, 3–5, 7-9, 11, 14-15, 21, A, and B in the report: “Births: Final
Data for 2004” [3] are computed using 2000 census-based post-censal (population)
estimates as of July 1, 2004. These populations are shown in tables 4-2 and 4-3. The
population estimates have been provided by the U.S. Census Bureau [47] and are based
on the 2000 census counts by age, sex, race, and Hispanic origin, which have been
modified to be consistent with Office of Management and Budget racial categories as of
1977 and historical categories for birth data. The modification procedures are described
in detail elsewhere [48].
Birth and fertility rates by state shown in table 10 of the report: “Births: Final
Data for 2004” [3] use 2000 census-based state-level post-censal population estimates
provided by the U.S. Census Bureau [47]. Rates by state shown in this report may differ
from rates computed on the basis of other population estimates. Birth and fertility rates
34
by month shown in table 16 of the 2004 natality final report [3] are based on monthly
population estimates. Rates for unmarried women shown in tables 18 and 19 of the 2004
natality final report [3] are based on distributions of the population by marital status as of
March 2004 as reported by the U.S. Census Bureau in the March Current Population
Survey (CPS) [49], which have been adjusted to July 2004 population levels [47] by the
Division of Vital Statistics, NCHS [3]. Birth and fertility rates for the Hispanic
population, shown in tables 5, 7, 8, 9, and 15 of the 2004 natality final report [3], are
based on estimates of the total Hispanic population as of July 1, 2004 [47]. Rates for
Hispanic subgroups are based on special population estimates that are presented in table
4-3. Information about allocation to Hispanic subgroups is presented elsewhere [50].
The populations by race used in this report were produced under a collaborative
arrangement with the U.S. Census Bureau and are 2000 census-based post-censual
estimates. Reflecting the new guidelines issued in 1997 by the Office of Management
and Budget (OMB), the 2000 census included an option for individuals to report more
than one race as appropriate for themselves and household members [22]. In addition,
the 1997 OMB guidelines called for reporting of Asian persons separately from Native
Hawaiians or other Pacific Islanders. In the 1977 OMB guidelines, data for Asian or
Pacific Islander persons were collected as a single group [21]. Except for fifteen states,
birth certificates currently report only one race for each parent in the categories specified
in the 1977 OMB guidelines (see “Hispanic origin, race and national origin”). In
addition, unrevised birth certificate data do not report Asians separately from Native
Hawaiians or other Pacific Islanders. Thus, birth certificate data by race (the numerators
for birth and fertility rates) currently are incompatible with the population data collected
in the 2000 census (the denominators for the rates).
To produce birth and fertility rates for 2000 through 2004, it was necessary to
‘‘bridge’’ the population data for multiple race persons back to single race categories. In
addition, the postcensal estimates were modified to be consistent with the 1977 OMB
racial categories, that is, to report the data for Asian persons and Native Hawaiians or
other Pacific Islanders as a combined category Asian or Pacific Islanders [51]. The
procedures used to produce the ‘‘bridged’’ populations are described in separate
publications [23,24]. In 2003, six states began reporting multiple race data; and in 2004,
35

15 states. Once all states revise their birth certificates to be compliant with the 1997
OMB standards, the use of ‘‘bridged’’ populations can be discontinued.
Populations used to calculate the rates for 1991–99 are based on population
estimates as of July 1 of each year and were produced by the U.S. Census Bureau, with
support from the National Cancer Institute [23, 47, 52, 53]. These intercensal population
estimates for 1991-99 are based on the April 1, 2000 Census. The bridged rates for 1990
and 2000 are based on populations from the censuses in those years as of April 1.
Readers should keep in mind that the population data used to compile birth and
fertility rates by race and ethnicity shown in this report are based on special estimation
procedures, and are not actual counts. This is the case even for the 2000 populations that
are based on the 2000 census. As a result, the estimation procedures used to develop
these populations may contain some errors. Smaller populations, for example, American
Indians, are likely to be affected much more than larger populations by potential
measurement error [23]. While the nature and magnitude of error is unknown, the
potential for error should be kept in mind when evaluating trends and differentials.
As more accurate information becomes available, further revisions of the
estimates may be necessary. Additional information on the revised populations is
available at: http://www.cdc.gov/nchs/about/major/dvs/popbridge/popbridge.htm .
Residential population base— Birth rates for the United States, individual states,
and metropolitan areas are based on the total resident populations of the respective areas
(table 4-4). Except as noted, these populations exclude the Armed Forces abroad but
include the Armed Forces stationed in each area. The residential population of the birth-
and death-registration states for 1900–1932 and for the United States for 1900–2004 is
shown in table 4-1. In addition, the population including Armed Forces abroad is shown
for the United States. Table D shows the sources for these populations. A detailed
discussion of historical population bases is presented elsewhere [2].
Small populations as denominators— An asterisk (*) is shown in place of any
derived rate based on fewer than 20 births in the numerator, or a population denominator
of less than 50 (unweighted) for decennial years and 75,000 (weighted) for all other years
for the Hispanic subgroups. Rates based on populations below these minimum levels lack
36

sufficient reliability for analytic purposes.
Net census undercounts and overcounts— Studies conducted by the U.S. Census
Bureau indicate that some age, race, and sex groups are more completely enumerated
than others. Census miscounts can have consequences for vital statistics measures. For
example, an adjustment to increase the population denominator would result in a smaller
rate compared to the unadjusted rate. A more detailed discussion of census undercounts
and overcounts can be found in the “1999 Technical Appendix” [2]. Adjusted rates for
2000 can be computed by multiplying the reported rates by ratios from the 2000 census-
level population adjusted for the estimated age-specific census over- and undercounts,
which are shown in table E.
Cohort fertility tables
Various fertility measures for cohorts of women are computed from births
adjusted for underregistration and population estimates corrected for under enumeration
and misstatement of age. Data published after 1974 use revised population estimates
prepared by the U.S. Census Bureau and have been expanded to include data for the two
major racial groups. Heuser [54] has prepared a detailed description of the methods used
in deriving these measures as well as more detailed data for earlier years. The series of
cohort fertility tables are being revised to incorporate rates for black women and the
revised intercensal population estimates of the 1990s. A publication is forthcoming.
Parity distribution—The percentage distribution of women by parity (number of
children ever born alive to mother) is derived from cumulative birth rates by order of
birth. The percentage of 0-parity women is found by subtracting the cumulative first birth
rate from 1,000 and dividing by 10. The proportions of women at parities one through six
are found from the following formula:
Percent at N parity = ((cum. rate, order N)-(cum. rate, order N + 1))/10
The percentage of women at seventh and higher parities is found by dividing the
cumulative rate for seventh-order births by 10.
Birth probabilities—Birth probabilities indicate the likelihood that a woman of a
certain parity and age at the beginning of the year will have a child during the year. Birth
probabilities differ from central birth rates in that the denominator for birth probabilities
is specific for parity as well as for age.
37

Total fertility rates
The total fertility rate is the sum of the birth rates by age of mother (in 5–year age
groups) multiplied by 5. It is an age–adjusted rate because it is based on the assumption
that there is the same number of women in each age group. The rate of 2,045.5 in 2004,
for example, means that if a hypothetical group of 1,000 women were to have the same
birth rates in each age group that were observed in the actual childbearing population in
2004, they would have a total of 2,046 children by the time they reached the end of the
reproductive period (taken here to be age 50 years), assuming that all of the women
survived to that age.
Seasonal adjustment of rates
The seasonally adjusted birth and fertility rates are computed from the X–11
variant of Census Method II [55]. This method, used since 1964, differs slightly from the
U.S. Bureau of Labor Statistics (BLS) Seasonal Factor Method, which was used for Vital
Statistics of the United States, 1964. The fundamental technique is the same in that it is
an adaptation of the ratio-to-moving-average method. Before 1964, the method of
seasonal adjustment was based on the X–9 variant and other variants of Census Method
II. A comparison of the Census Method II with the BLS Seasonal Factor Method shows
the differences in the seasonal patterns of births to be negligible.
Computations of percentages, percentage distributions, and means
Births for which a particular characteristic is unknown were subtracted from the
figures for total births that were used as denominators before percentages, percentage
distributions, and means were computed. The percentage of records with missing
information for each item is shown by state in table A. The mean age of mother is the
arithmetic average of the age of mothers at the time of birth, computed directly from the
frequency of births by age of mother. An asterisk is shown in place of any derived
statistic based on fewer than 20 births in the numerator or denominator.
Computation of Measures of Variability Random variation and significance testing for natality data
This detailed discussion of random variation and significance testing for natality
38

data is similar to that in the “Technical Notes” of “Births: Final data for 2004” [3]. The
number of births reported for an area is essentially a complete count, because more than
99 percent of all births are registered. Although this number is not subject to sampling
error, it may be affected by nonsampling errors such as mistakes in recording the
mother’s residence or age during the registration process.
When the number of births is used for analytic purposes (that is, for the
comparison of numbers, rates, and percents over time, for different areas, or between
different groups), the number of events that actually occurred can be thought of as one
outcome in a large series of possible results that could have occurred under the same (or
similar) circumstances. When considered in this way, the number of births is subject to
random variation and a probable range of values estimated from the actual figures,
according to certain statistical assumptions.
The confidence interval is the range of values for the number of births, birth rates,
or percent of births that you could expect in 95 out of 100 cases. The confidence limits
are the end points of this range of values (the highest and lowest values). Confidence
limits tell you how much the number of events or rates could vary under the same (or
similar) circumstances.
Confidence limits for numbers, rates, and percents can be estimated from the
actual number of vital events. Procedures differ for rates and percents and also differ
depending on the number of births on which these statistics are based. Below are detailed
procedures and examples for each type of case.
When the number of vital events is large, the distribution is assumed to follow a
normal distribution (where the relative standard error is small). When the number of
events is small and the probability of the event is small, the distribution is assumed to
follow a Poisson probability distribution. Considerable caution should be observed in
interpreting the occurrence of infrequent events.
95-percent confidence limits for numbers less than 100 -- When the number of
births is less than 100 and the rate is small, the data are assumed to follow a Poisson
probability distribution [56]. Confidence limits are estimated using the following
formulas:
39

LB×=limitLower UB×=limitUpper
where:
B = number of births
L = the value in table C that corresponds to the number B
U = the value in table C that corresponds to the number B
Example
Suppose that the number of first births to American Indian women 40-44 years of
age was 47. The confidence limits for this number would be:
3573476.047limitLower
=×=
6332979.147limitUpper
=×=
This means that the chances are 95 out of 100 that the actual number of first births
to American Indian women 40-44 years of age would lie between 35 and 63.
95-percent confidence limits for numbers of 100 or more –– When the number of
events is greater than 100, the data are assumed to approximate a normal distribution.
Formulas for 95-percent confidence limits are:
( )BB ×−= 96.1limitLower
( )BB ×+= 96.1limitUpper where:
B = number of births
Example
Suppose that the number of first births to white women 40-44 years of age was
40

14,108. The 95-percent confidence limits for this number would be:
( )
875,13233108,14
108,1496.1108,14limitLower
=−=
×−=
( )
341,14233108,14
108,1496.1108,14limitLower
=+=
×+=
This means that the chances are 95 out of 100 that the actual number of first births
to white women 40-44 years of age would fall between 13,875 and 14,341.
Computing confidence intervals for rates -- The same statistical assumptions can
be used to estimate the variability in birth rates. Again, one formula is used for rates
based on numbers of events less than 100, and another formula for rates based on
numbers of 100 or greater. For our purposes, assume that the denominators of these rates
(the population estimates) have no error. While this assumption is technically correct
only for denominators based on the census that occurs every 10 years, the error in
intercensal population estimates is usually small, difficult to measure, and therefore not
considered. (See, however, earlier discussion of population denominators in the section
on “population bases”.)
95-percent confidence limits for rates based on fewer than 100 events –– As
stated earlier, when the number of events in the numerator is less than 20 (or the
population denominator is less than 50 for decennial years and 75,000 for all other years
for an estimated subgroups), an asterisk (*) is shown in place of the rate because there
were too few births or the population is too small to compute a statistically reliable rate.
When the number of events in the numerator is greater than 20 but less than 100 (and the
population denominator for the subgroups is above the minimum), the confidence interval
for a rate can be estimated using the two formulas which follow and the values in table C.
LR×=limitLower
41

UR×=limitUpper
where:
R = birth rate
L = the value in table C that corresponds to the number of events B
U = the value in table C that corresponds to the number of events B
Example
Suppose that the first birth rate for American Indian women 40-44 years of age
was 0.50 per thousand, based on 47 births in the numerator. Using table C:
37.073476.050.0limitLower
=×=
66.032979.150.0limitUpper
=×=
This means that the chances are 95 out of 100 that the actual first birth rate for
American Indian women 40-44 years of age would be between 0.37 and 0.66.
95-percent confidence limits for rates when the numerator is 100 or more -- In
this case, use the following formula for the birth rate R based on the number of births B:
( )( )BRR /96.1limitLower ×−=
( )( )BRR /96.1limitUpper ×+=
where:
R = birth rate
B = number of births
Example
42

Suppose that the first birth rate for white women 40-44 years of age was 1.55 per
thousand, based on 14,108 births in the numerator. Therefore, the 95-percent confidence
interval would be:
( )( )
52.1026.055.1
108,14/55.196.155.1limitLower
=−=
×−=
( )( )
58.1026.055.1
108,14/55.196.155.1limitUpper
=+=
×+=
This means that the chances are 95 out of 100 that the actual first birth rate for
white women 40-44 years of age lies between 1.52 and 1.58.
Computing 95-percent confidence intervals for percents -- In many instances we
need to compute the confidence intervals for percents. Percents derive from a binomial
distribution. As with birth rates, an asterisk (*) will be shown for any percent which is
based on fewer than 20 births in the numerator. We easily compute a 95-percent
confidence interval for a percent when the following conditions are met:
5 and 5 ≥×≥× qBpB
where:
B = number of births in the denominator
p = percent divided by 100
q = 1 - p
For natality data, these conditions will be met except for very rare events in small
subgroups. If the conditions are not met, the variation in the percent will be so large as to
render the confidence intervals meaningless. When these conditions are met the 95-
percent confidence interval can be computed using the normal approximation of the
43
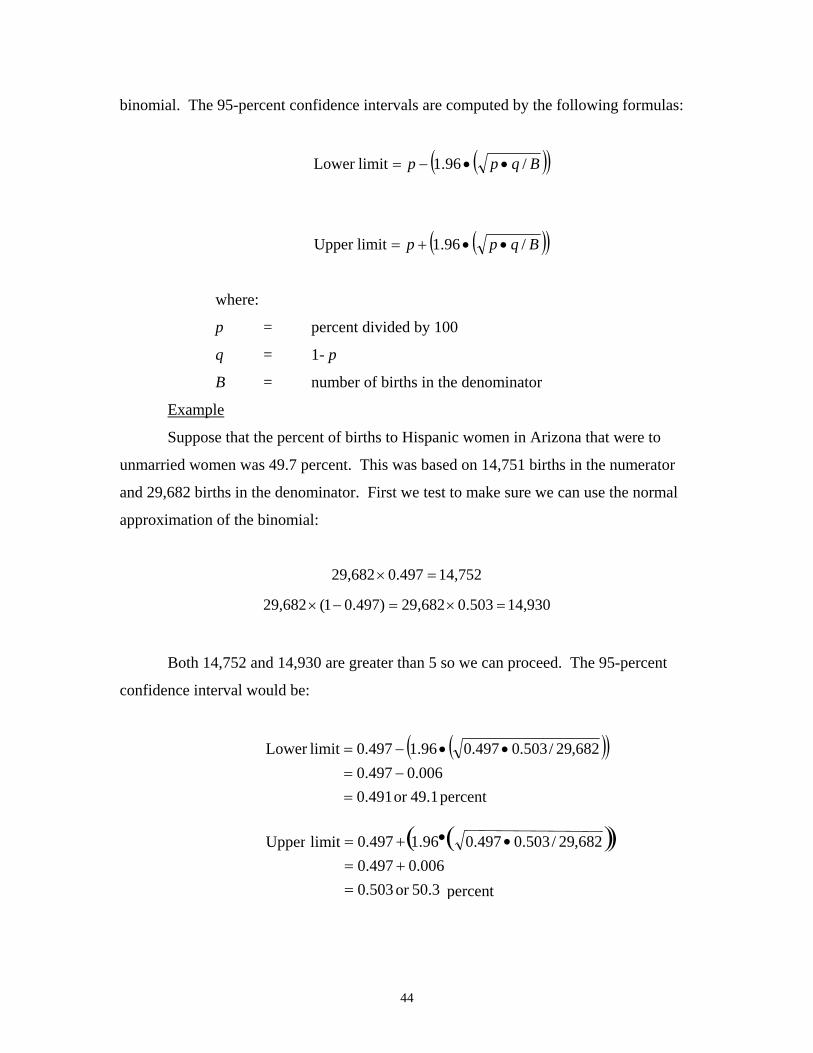
binomial. The 95-percent confidence intervals are computed by the following formulas:
( )( )Bqpp /96.1limitLower ••−=
( )( )Bqpp /96.1limitUpper ••+=
where:
p = percent divided by 100
q = 1- p
B = number of births in the denominator
Example
Suppose that the percent of births to Hispanic women in Arizona that were to
unmarried women was 49.7 percent. This was based on 14,751 births in the numerator
and 29,682 births in the denominator. First we test to make sure we can use the normal
approximation of the binomial:
752,140.49729,682 =× 930,14503.0682,290.497)1(29,682 =×=−×
Both 14,752 and 14,930 are greater than 5 so we can proceed. The 95-percent
confidence interval would be:
( )( )
percent 49.1or .4910006.0497.0
682,29/503.0497.096.1497.0limitLower
=−=
••−=
( )( )
percent 50.3or .5030006.0497.0
682 , 29 /503.0497.096.1497.0limitUpper
=+=
••+=
44

This means that the chances are 95 out of 100 that the actual percent of births to
unmarried Hispanic women in Arizona is between 49.1 and 50.3 percent.
Significance testing when one or both of the rates is based on fewer than 100
cases -- To compare two rates, when one or both of those rates are based on less than 100
cases, you first compute the confidence intervals for both rates. Then you check to see if
those intervals overlap. If they do overlap, the difference is not statistically significant at
the 95-percent level. If they do not overlap, the difference is indeed statistically
significant.
Example
Suppose that the first birth rate for American Indian women 40-44 years of age
was 0.70 per 1,000 in year X and 0.57 in year Y. Is the rate for year X significantly
higher than the rate for year Y? The two rates are based on 63 events in year X and 54
events in year Y. Both rates are based on fewer than 100 events; therefore, the first step
is to compute the confidence intervals for both rates.
Lower Limit Upper Limit
Year X 0.54 0.90
Year Y 0.43 0.74
These two confidence intervals overlap. Therefore, the first birth rate for
American women 40-44 in year X is not significantly higher (at the 95-percent
confidence level) than the rate in year Y.
This method of comparing confidence intervals is a conservative test for statistical
significance. That is, the difference between two rates may, in fact, be statistically
significant even though confidence intervals for the two rates overlap [57]. Thus, caution
should be observed when interpreting a non-significant difference between two rates,
especially when the lower and upper limits being compared overlap only slightly.
Significance testing when both rates are based on 100 or more events -- When
both rates are based on 100 or more events, the difference between the two rates,
irrespective of sign (+/-), is considered statistically significant if it exceeds the statistic in
the formula below. This statistic equals 1.96 times the standard error for the difference
between two rates.
45

2
22
1
2196.1
NR
NR
+×
where:
R1 = first rate
R2 = second rate
N1 = first number of births
N2 = second number of births
If the difference is greater than this statistic, then the difference would occur by
chance less than 5 times out of 100. If the difference is less than or equal to this
statistic, the difference might occur by chance more than 5 times out of 100. We say that
the difference is not statistically significant at the 95-percent confidence level.
Example
Is the first birth rate for black women 40-44 years of age (1.08 per 1,000)
significantly lower than the comparable rate for white women (1.55)? Both rates are
based on more than 100 births (1,535 for black women and 14,108 for white women).
The difference between the rates is 1.55 - 1.08 = 0.47. The statistic is then calculated as
follows:
( ) (( ))
06.003.096.1
00093.096.1
00017.000076.096.1
108,14/403.2535,1/166.196.1
108,1455.1
535,108.196.1
22
=×=×=
+×=
+×=
+×=
The difference between the rates (0.47) is greater than this statistic (0.06).
Therefore, the difference is statistically significant at the 95-percent confidence level.
Significance testing differences between two percents -- When testing the
difference between two percents, both percents must meet the following conditions:
46
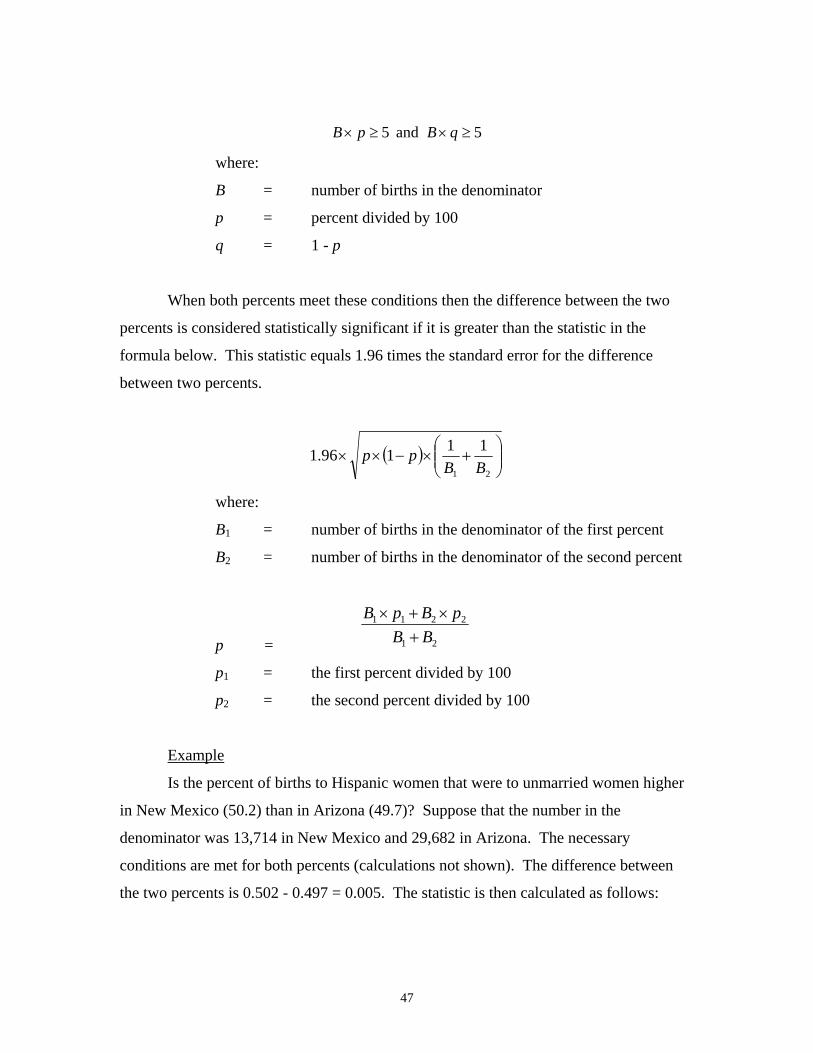
5 and 5 ≥×≥× qBpB where:
B = number of births in the denominator
p = percent divided by 100
q = 1 - p
When both percents meet these conditions then the difference between the two
percents is considered statistically significant if it is greater than the statistic in the
formula below. This statistic equals 1.96 times the standard error for the difference
between two percents.
( ) ⎟⎟⎠
⎞⎜⎜⎝
⎛+×−××
21
11196.1BB
pp
where:
BB1 = number of births in the denominator of the first percent
BB2 = number of births in the denominator of the second percent
p = 21
2211
BBpBpB
+×+×
p1 = the first percent divided by 100
p2 = the second percent divided by 100
Example
Is the percent of births to Hispanic women that were to unmarried women higher
in New Mexico (50.2) than in Arizona (49.7)? Suppose that the number in the
denominator was 13,714 in New Mexico and 29,682 in Arizona. The necessary
conditions are met for both percents (calculations not shown). The difference between
the two percents is 0.502 - 0.497 = 0.005. The statistic is then calculated as follows:
47

( ) ( )
010.0005162563.096.1
000026652.096.1
000106609.0501.0499.096.1
=×=×=
×××
The difference between the percents (0.005) is less than this statistic (0.010).
Therefore, the difference is not statistically significant at the 95-percent confidence level.
Random variation and significance testing for population subgroups
This section presents information relevant to Hispanic subgroups (or generally
speaking, any subgroup of the population for which survey data has been used for
estimation of the denominator.) Birth and fertility rates for Mexicans, Puerto Ricans,
Cubans, and “Other” Hispanic subgroups for 2004 are shown in tables 5,6, 8, and 15 of
2004 natality final report [3] and in tables 1-4 and 1-12 of “Vital Statistics of the United
States, 2004, Part 1, Natality” (in preparation). Population estimates for Hispanic
subgroups are derived from the U.S. Census Bureau’s Current Population Survey (CPS)
and adjusted to resident population control totals as shown in table 4-3 [47, 50]. As a
result, the rates are subject to the variability of the denominator as well as the numerator.
For these Hispanic subgroups (but not for all origin, total Hispanic, total non-Hispanic,
non-Hispanic white, or non-Hispanic black populations), the following formulas are used
for testing statistical significance in trends and differences:
Approximate 95-percent confidence interval: 100 or more births -- When the
number of events in the numerator is greater than 100, the confidence interval for the
birth rate can be estimated from the following formulas: For crude and age–specific birth
rates,
⎟⎠⎞
⎜⎝⎛ ++⎟
⎠⎞
⎜⎝⎛−=
Pbaf
BRR 1**96.1limitLower
⎟⎠⎞
⎜⎝⎛ ++⎟
⎠⎞
⎜⎝⎛+=
Pbaf
BRR 1**96.1limitUpper
48

where:
R = rate (births per 1,000 population) B = total number of births upon which rate is based f = the factor which depends on whether an entire or a sampled population (like
one from a Current Population Survey – CPS) is used, and the span of years represented. f equals 0.670 for a single year
a and b of the example are single year averages of the 2002 and 2003 CPS standard error parameters [58, 59]
a = -0.000096 b = 3,809 P = total estimated population upon which rate is based
Example
Suppose that the fertility rate of Cuban women 15–44 years of age was 51.2 per 1,000
based on 13,088 births in the numerator and an estimated resident population of 255,399
in the denominator. The 95-percent confidence interval would be:
( )
16.41100024.0*2.51*96.12.51
01000475.0*2.51*96.12.51
014914.0*670.0000076406.0*2.51*96.12.51
399,255809,3000096.0*670.0
088,131*2.51*96.12.51limitLower
=−=−=
+−=
⎥⎦
⎤⎢⎣
⎡⎟⎠
⎞⎜⎝
⎛+−+⎟⎠
⎞⎜⎝
⎛−=
( )
24.61100024.0*2.51*96.12.51
01000475.0*2.51*96.12.51
014914.0*670.0000076406.0*2.51*96.12.51
399,255809,3000096.0*670.0
088,131*2.51*96.12.51limit Upper
=+=+=
++=
⎥⎦
⎤⎢⎣
⎡⎟⎟⎠
⎞⎜⎜⎝
⎛+−+⎟⎟
⎠
⎞⎜⎜⎝
⎛+=
This means that the chances are 95 out of 100 that the actual fertility rate of Cuban
women 15–44 years of age is between 41.16 and 61.24.
Approximate 95-percent confidence interval: less than 100 births -- When the
number of events in the numerator is less than 20, an asterisk is shown in place of the
rate. When the number of events in the numerator is greater than 20 but less than 100, the
49

confidence interval for the birth rate can be estimated using the formulas that follow and
the values in table C.
For crude and age–specific birth rates,
( ) ⎟⎟⎠
⎞⎜⎜⎝
⎛⎟⎠⎞
⎜⎝⎛ +−=−=
PbafBLR 576.21*,96.1*limitLower α
( ) ⎟⎟⎠
⎞⎜⎜⎝
⎛⎟⎠⎞
⎜⎝⎛ ++=−=
PbafBUR 576.21*,96.1*limitUpper α
where:
R = rate (births per 1,000 population) B = total number of births upon which rate is based L = the value in table C that corresponds to the number B, using the 96 percent
CI column U = the value in table C that corresponds to the number B, using the 96 percent
CI column f = the factor which depends on whether an entire or a sampled population (like
one from a Current Population Survey – CPS) is used, and the span of years represented. f equals 0.670 for a single year
a and b are CPS standard error parameters (see previous section on 95-percent confidence interval for 100 or more births for description and specific values)
P = total estimated population upon which the rate is based NOTE: In the formulas above, the confidence limits are estimated from the non-
sampling error in the number of births, the numerator, and the sampling error in the
population estimate, the denominator. A 96 percent standard error is computed for the
numerator and a 99 percent standard error is computed for the denominator in order to
compute a 95-percent confidence interval for the rate.
Example
Suppose that the birth rate of Puerto Rican women 45–49 years of age was 0.4 per 1,000,
based on 35 births in the numerator and an estimated resident population of 87,892 in the
denominator. Using table C, the 95-percent confidence interval would be:
50

( )( )
154.0561536.0*68419.0*4.0
)170211.0*576.2(1*68419.0*4.0028972.0576.21*68419.0*4.0
892,87809,3000096.0670.0576.21*68419.0*4.0limitLower
==
−=−=
⎟⎟
⎠
⎞
⎜⎜
⎝
⎛⎟⎟⎠
⎞⎜⎜⎝
⎛⎟⎠
⎞⎜⎝
⎛+−−=
( )( )
812.0438464.1*41047.1*4.0
)170211.0*576.2(1*41047.1*4.0028972.0576.21*41047.1*4.0
892,87809,3000096.0670.0576.21*41047.1*4.0limitUpper
==
+=+=
⎟⎟
⎠
⎞
⎜⎜
⎝
⎛⎟⎟⎠
⎞⎜⎜⎝
⎛⎟⎠
⎞⎜⎝
⎛+−+=
This means that the chances are 95 out of 100 that the actual birth rate of Puerto Rican
women 45–49 years of age lies between 0.15 and 0.81.
Significance testing for subgroups -- When both rates are based on 100 or more
events, the difference between the two rates is considered statistically significant if it
exceeds the value given by the formula below. This statistic equals 1.96 times the
standard error for the difference between two rates.
⎥⎦
⎤⎢⎣
⎡⎟⎟⎠
⎞⎜⎜⎝
⎛++⎟⎟
⎠
⎞⎜⎜⎝
⎛+⎥
⎦
⎤⎢⎣
⎡⎟⎟⎠
⎞⎜⎜⎝
⎛++⎟⎟
⎠
⎞⎜⎜⎝
⎛=
22
22
11
21
1*1**96.1Pbaf
BR
Pbaf
BRz
If the difference is greater than this statistic, then the difference would occur by chance
less than 5 times out of 100. If the difference is less than this statistic, the difference
might occur by chance more than 5 times out of 100. We would therefore conclude that
the difference is not statistically significant at the 95-percent confidence level.
Example
Suppose the birth rate for Mexican mothers 15–19 years of age (R1) is 94.5, based on
97,744 births and an estimated population of 1,033,878, and the birth rate for Puerto
Rican mothers 15–19 years of age (R2) is 61.4, based on 10,006 births and an estimated
population of 162,899. Using the above formula, the z score is computed as follows:
51

( ) ( )( ) ( )
61.1799.8*96.1
20.59563.21*96.1
015702.0*96.37690024147.0*25.8930*96.1
023287.0*670.000009994.096.3769003589.0*670.0000010231.0*25.8930*96.1
899,162809,3000096.0670.0
006,101*4.61
878,033,1809,3000096.0670.0
744,971*5.94*96.1 22
==
+=
+=
+++=
⎥⎦
⎤⎢⎣
⎡⎟⎠
⎞⎜⎝
⎛+−+⎟
⎠
⎞⎜⎝
⎛+⎥
⎦
⎤⎢⎣
⎡⎟⎠
⎞⎜⎝
⎛+−+⎟
⎠
⎞⎜⎝
⎛=
Since the difference between the two rates 33.1 is greater than the value above, the two
rates are statistically significantly different at the 0.05 level of significance.
52

References
1 National Center for Health Statistics. Vital statistics of the United States: 2004, volume I, Natality. Forthcoming on the Internet and CD-ROM from Hyattsville, Maryland: National Center for Health Statistics.
2. National Center for Health Statistics. Technical appendix. Vital statistics of the
United States: 1999, vol I, natality. Available on the Internet at www.cdc.gov/nchs/data/techap99.pdf and on CD-ROM from Hyattsville, Maryland: National Center for Health Statistics. 2001
3. Martin JA, Hamilton BE, Sutton PD, Ventura SJ, Menacker F, Kirmeyer S. Births:
Final data for 2004. National vital statistics reports; vol 55 no 1. Hyattsville, Maryland: National Center for Health Statistics. 2006.
4. National Center for Health Statistics. Natality 2004. Public use CD-ROM.
Hyattsville, Maryland: National Center for Health Statistics. Annual product. 2006. 5. United Nations. Handbook of vital statistics. Studies in methods, series F, no. 7.
New York: United Nations. 1955. 6. Centers for Disease Control and Prevention. Model State Vital Statistics Act and
Regulations, 1992 Revision. Publication no. (PHS) 95–1115. Hyattsville, Maryland: National Center for Health Statistics. 1995.
7. American Academy of Pediatrics and American College of Obstetricians and
Gynecologists. Guidelines for perinatal care, (2nd edition). Washington, DC. 308–24. 1988.
8. World Health Organization. Manual of the international statistical classification of diseases, injuries, and causes of death, based on the recommendations of the Tenth Revision Conference, 1987. Geneva: World Health Organization. 1992.
9. Kowaleski J. State definitions and reporting requirements for live births, fetal deaths, and induced terminations of pregnancy (1997 revision). Hyattsville, Maryland: National Center for Health Statistics. 1997.
10. National Center for Health Statistics. Technical appendix. Vital statistics of the
United States: 2001, Fetal Death Detail Record. Available on the Internet: http://wonder.cdc.gov/wonder/sci_data/mort/fetldeth/type_txt/fetal01/TAfetaldeath01.pdf Hyattsville, Maryland: National Center for Health Statistics. 2003.
11. Hetzel, AM. U.S. Vital Statistics System. Major activities and developments, 1950-
95. Hyattsville, Maryland: National Center for Health Statistics. 1997.
53

12. National Center for Health Statistics. Report of the Panel to Evaluate the U.S. Standard Certificates. Hyattsville, Maryland: National Center for Health Statistics. 2000. Available at: http://www.cdc.gov/nchs/data/dvs/panelreport_acc.pdf .
13. National Center for Health Statistics. 2003 revision of the U.S. Standard Certificate
of Live Birth. 2003. Available on the Internet at: http://www.cdc.gov/nchs/data/dvs/birth11-03final-ACC.pdf .
14. National Center for Health Statistics. Birth edit specifications for the 2003 Revision
of the U.S. Standard Certificate of Birth. 2005. Available on the Internet at: http://www.cdc.gov/nchs/data/dvs/FinalBirthSpecs3-24-2005.pdf .
15. National Center for Health Statistics. Guide to completing the facility worksheets
for the Certificate of Live Birth and Report of Fetal Death (2003 revision). 2006 update. Hyattsville, Maryland: National Center for Health Statistics. Available on the Internet at: http://www.cdc.gov/nchs/data/dvs/GuidetoCompleteFacilityWks.pdf
16. Division of Vital Statistics. Instruction manual part 3a: Classification and coding
instructions for birth records, 1999-2001. Hyattsville, Maryland: National Center for Health Statistics. Available on the Internet at www.cdc.gov/nchs/data/dvs/3amanual.pdf .
17. National Center for Health Statistics. Instruction manual, part 8. Vital records,
geographic classification, 2003. Vital statistics, data preparation. Hyattsville, Maryland: National Center for Health Statistics. 2002. Available on the Internet at: http://www.cdc.gov/nchs/data/dvs/IMP8_PrintVersion.pdf .
18. U.S. Department of Health, Education and Welfare, Public Health Service, Office
of Vital Statistics. Birth registration completeness in the United States and geographic areas, 1950; vol 39 no 2. 1954.
19. National Center for Health Statistics. Instruction manual, part 8A. Vital records,
geographic codes, 2004. Federal information processing standards (FIPS). Hyattsville, Maryland: National Center for Health Statistics. 2003. Available on the Internet at: http://www.cdc.gov/nchs/data/dvs/IMP8A_PrintVersion.pdf
20. National Center for Health Statistics. Technical appendix. Vital statistics of the
United States, 2002, vol I, natality. Available on the Internet at: http://www.cdc.gov/nchs/data/techap02.pdf and on CD-ROM from Hyattsville, Maryland: National Center for Health Statistics. 2004 .
21. Office of Management and Budget. Race and ethnic standards for Federal statistics
and administrative reporting. Statistical Policy Directive 15. 1977.
22. Office of Management and Budget. Revisions to the standards for the classification of Federal data on race and ethnicity. Federal Register 62FR58781-58790. October 30, 1997.
54

23. Ingram DD, Parker JD, Schenker N, Weed JA, Hamilton B, Arias E, Madans JH.
United States Census 2000 with bridged race categories. National Center for Health Statistics. Vital Health Stat 2(135). 2003.
24. Schenker N, Parker JD. From single-race reporting to multiple-race reporting:
Using imputation methods to bridge the transition. Stat Med 22(9):1571–87. 2003. 25. Johnson D. Coding and editing multiple race and ethnicity. Presented at the 2004
Joint Meeting of NAPHSIS and VSCP. Portland, Oregon. June 6-10, 2004. Available on the Internet at: http://www.naphsis.org/events/index.asp?bid=699 .
26. Weed JA. NCHS procedures for multiple-race and Hispanic origin data: Collecting,
coding, editing and transmitting. Presented at the 2004 Joint Meeting of NAPHSIS and VSCP. Portland, Oregon. June 6-10, 2004. Available on the Internet at: http://www.cdc.gov/nchs/data/dvs/Multiple_race_docu_5-10-04.pdf .
27. Hamilton BE, Ventura SJ, Martin JA. Characteristics of births to single-race and
multiple-race women, 2003. National vital statistics reports; vol 54 no ??. Hyattsville, Maryland: National Center for Health Statistics. 2006.
28. Schachter J. Matched record comparison of birth certificate and census information
in the United States, 1950. Vital statistics—Special Reports; vol 47 no 12. Washington: Public Health Service. 1962.
29. Schoendorf KC, Parker JD, Batkhan LZ, Kiely JL. Comparability of the birth
certificate and 1988 maternal and infant health survey. Vital Health Statistics 2 (116). Hyattsville, Maryland: National Center for Health Statistics. 1993.
30. National Center for Health Statistics. Vital statistics of the United States, 2001,
volume I, natality. Available on the Internet at: http://www.cdc.gov/nchs/datawh/statabunpubd/natality/natab2001.htm and on CD-ROM from Hyattsville, Maryland: National Center for Health Statistics. 2006.
31. Division of Vital Statistics. Instruction manual part 12: Computer edits for natality
data, effective 1993.Vital statistics, data preparation. Hyattsville, Maryland: National Center for Health Statistics. 1995. Available on the Internet at: www.cdc.gov/nchs/data/dvs/instr12.pdf .
32. Ventura SJ, Bachrach CA. Nonmarital childbearing in the United States, 1940–99. National vital statistics reports; vol 48 no 16. Hyattsville, Maryland: National Center for Health Statistics. 2000.
33. Ventura SJ. Births to unmarried mothers: United States, 1980–92. National Center
for Health Statistics. Vital Health Stat 21(53). 1995.
55

34. Sampson PD, Bookstein FL, Barr HM, Steissguth AP. Prenatal alcohol exposure, birthweight, and measures of child size from birth to 14 years. Am J Public Health 84(9):1421-28. 1994.
35. Roeleveld N, Vingerhoets E, Zielhuis GA, Gabreels F. Mental retardation
associated with parental smoking and alcohol consumption before, during, and after pregnancy. Prev Medicine 21(1):110-19. 1992.
36. Ebrahim SH, Luman ET, Floyd RL, et al. Alcohol consumption by pregnant women
in the United States during 1988-1995. Obstet Gynecol 92(2):187-192. 1998. 37. Chomitz VR, Cheung LWY, Lieberman E. The role of lifestyle in preventing low
birth weight. In: The future of children: Low birthweight. Vol 5(1):121-138. Los Altos, California: Center for the Future of Children, The David and Lucile Packard Foundation. 1995.
38. Kotelchuck M. An evaluation of the Kessner adequacy of prenatal care index and a
proposed adequacy of prenatal care utilization index. Am J Public Health 84 (9):1414-20. 1994.
39. Kogan MD, Martin JA, Alexander GR, et al. The changing pattern of prenatal care
utilization in the United States, 1981-1995, using different prenatal care indices. JAMA 279(20):1623-8. 1998.
40. Taffel S, Johnson D, Heuser R. A method for imputing length of gestation on birth
certificates. National Center for Health Statistics. Vital Health Stat 2(93). Hyattsville, Maryland: National Center for Health Statistics. 1982.
41. Vahratian A, Buekens P, Bennett TA, et al. Preterm delivery rates in North
Carolina: Are they really declining among non-Hispanic African Americans? Am J Epidemiology 159(1):59-63. 2004.
42. Division of Vital Statistics. Instruction manual part 12: Computer edits for natality
data -- 2003 Revised Certificate. Hyattsville, Maryland: National Center for Health Statistics.. Forthcoming on the Internet .
43. World Health Organization. Manual of the international statistical classification of
diseases, injuries and causes of death. Sixth revision. Geneva. 1949. Referenced in: http://www.who.int/classifications/icd/en/HistoryOfICD.pdf . 44. National Center for Health Statistics. Matched Multiple Birth file 1995-2000.
Public use CD-ROM. Hyattsville, Maryland: National Center for Health Statistics. CD Rom series 21. no.17. 2004.
45. Watkins ML, Edmonds L, McClearn A, et al. The surveillance of birth defects: The
usefulness of the revised U.S. standard birth certificate. Am J Public Health
56

86(5):731–4. 1996.
46. U.S. Census Bureau. Test of birth-registration completeness, 1964 to 1968. 1970 census of population and housing; PHC (E)–2. Evaluation and Research Program. Washington: U.S. Department of Commerce. 1973.
47. National Center for Health Statistics. Postcensal estimates of the resident population of the United States as of July 1, 2004, by year, state and county, age, bridged race, sex, and Hispanic origin (vintage 2004). File pcen_v2004.txt (ASCII). Released September 8, 2005. Available on the Internet at: http://www.cdc.gov/nchs/about/major/dvs/popbridge/datadoc.htm
48. U.S. Census Bureau. Age, sex, race, and Hispanic origin information from the 1990
census: A comparison of census results with results where age and race have been modified. 1990 CPH–L–74. Washington, DC: U.S. Department of Commerce. 1991. Available on the Internet at : http://www.wnjpin.net/OneStopCareerCenter/LaborMarketInformation/lmi02/cph-l-74.htm .
49 U.S. Census Bureau. Unpublished data from the March 2004 current population
survey. U.S. Census Bureau. 2004. 50. U.S. Census Bureau. Unpublished tabulations prepared by the Housing and
Household Economic Statistics Division. 2005.
51. U.S. Census Bureau. Census 2000 modified race data summary file. Available on the Internet at: http://www.census.gov/popest/archives/files/MR-CO.txt .
52. Hamilton BE, Sutton PD, Ventura SJ. Revised birth and fertility rates for the 1990s
and new rates for Hispanic populations, 2000 and 2001: United States. National vital statistics reports; vol 51 no 12. Hyattsville, Maryland. 2003.
53. Ventura SJ, Hamilton BE, Sutton PD. Revised birth and fertility rates for the United
States, 2000 and 2001. National vital statistics reports; vol 51 no 4. Hyattsville, Maryland: National Center for Health Statistics. 2003.
54. Heuser R. Fertility tables for birth cohorts by color: United States, 1917–73.
Available on the Internet at http://www.cdc.gov/nchs/data/misc/fertiltbacc.pdf and on CD from Hyattsville, Maryland: National Center for Health Statistics. 1976.
55. Shiskin J, Young A, Musgrove J. The X–11 variant of the Census Method II
Seasonal Adjustment Program. Technical paper; no 15, 1967 rev. Washington: U.S. Census Bureau. 1967.
56. Bailer JC, Ederer F. Significance factors for the ratio of a Poisson variable to its
expectations. Biometrics. 20:639-43. 1964.
57
57. Schenker N, Gentleman JF. On judging the significance of differences by
examining the overlap between confidence intervals. Amer Stat 55:182-86. 2001. 58. U.S. Census Bureau, Demographic Statistical Methods Division. Source and
accuracy of the data for the March 2002 Current Population Survey microdata file. Available on the Internet at: http://www.bls.census.gov/cps/ads/2002/S&A_02.pdf .
59. U.S. Census Bureau, Demographic Statistical Methods Division. Source and
accuracy of the data for the March 2003 Current Population Survey microdata file.
58

24
Figure 4–A. U.S. Standard Certificate of Live Birth: 1989 Revision

24
Figure 4–A. U.S. Standard Certificate of Live Birth: 1989 Revision - Con.
25

U.S. STANDARD CERTIFICATE OF LIVE BIRTH M
othe
r’sN
ame_
____
____
____
____
____
_LOCAL FILE NO. BIRTH NUMBER:
1. CHILD’S NAME (First, Middle, Last, Suffix) 2. TIME OF BIRTH 3. SEX 4. DATE OF BIRTH (Mo/Day/Yr)C H I L D (24hr)
5. FACILITY NAME (If not institution, give street and number) 6. CITY, TOWN, OR LOCATION OF BIRTH 7. COUNTY OF BIRTH
Mot
her’s
Med
ical
8a. MOTHER’S CURRENT LEGAL NAME (First, Middle, Last, Suffix) 8b. DATE OF BIRTH (Mo/Day/Yr) R
ecor
d N
o.__
____
____
____
___
M O T H E R 8c. MOTHER’S NAME PRIOR TO FIRST MARRIAGE (First, Middle, Last, Suffix) 8d. BIRTHPLACE (State, Territory, or Foreign Country)
9a. RESIDENCE OF MOTHER-STATE 9b. COUNTY 9c. CITY, TOWN, OR LOCATION
9d. STREET AND NUMBER 9e. APT. NO. 9f. ZIP CODE 9g. INSIDE CITY LIMITS?
9 Yes 9 No
10a. FATHER’S CURRENT LEGAL NAME (First, Middle, Last, Suffix) 10b. DATE OF BIRTH (Mo/Day/Yr) 10c. BIRTHPLACE (State, Territory, or Foreign Country)
F A T H E R 11. CERTIFIER’S NAME: 12. DATE CERTIFIED 13. DATE FILED BY REGISTRAR _________________________________________
______/ ______ / __________ ______/ ______ / __________ TITLE: 9 MD 9 DO 9 HOSPITAL ADMIN. 9 CNM/CM 9 OTHER MIDWIFE MM DD YYYY MM DD YYYY 9 OTHER (Specify)_____________________________
CERTIFIERINFORMATION FOR ADMINISTRATIVE USE
14. MOTHER’S MAILING ADDRESS: 9 Same as residence, or: State: City, Town, or Location:
M O T H E R Street & Number: Apartment No.: Zip Code:
16. SOCIAL SECURITY NUMBER REQUESTED 17. FACILITY ID. (NPI) 15. MOTHER MARRIED? (At birth, conception, or any time between) 9 Yes 9 No FOR CHILD? 9 Yes 9 No IF NO, HAS PATERNITY ACKNOWLEDGMENT BEEN SIGNED IN THE HOSPITAL? 9 Yes 9 No
18. MOTHER’S SOCIAL SECURITY NUMBER: 19. FATHER’S SOCIAL SECURITY NUMBER:
INFORMATION FOR MEDICAL AND HEALTH PURPOSES ONLY 20. MOTHER’S EDUCATION (Check the 21. MOTHER OF HISPANIC ORIGIN? (Check the 22. MOTHER’S RACE (Check one or more races to indicate what the mother box that best describes the highest box that best describes whether the mother is considers herself to be)M O T H E R degree or level of school completed at Spanish/Hispanic/Latina. Check the “No” box if
9 White the time of delivery) mother is not Spanish/Hispanic/Latina) 9 Black or African American
9 8th grade or less 9 No, not Spanish/Hispanic/Latina 9 American Indian or Alaska Native
(Name of the enrolled or principal tribe)____________________________ 9 9th - 12th grade, no diploma9 Yes, Mexican, Mexican American, Chicana 9 Asian Indian
9 High school graduate or GED 9 Chinese completed 9 Filipino
9 Some college credit but no degree9 Yes, Puerto Rican
9 Japanese 9 Korean
9 Associate degree (e.g., AA, AS) 9 Yes, Cuban 9 Vietnamese
9 Bachelor’s degree (e.g., BA, AB, BS) 9 Other Asian (Specify)__________________________________________ 9 Yes, other Spanish/Hispanic/Latina 9 Native Hawaiian
9 Master’s degree (e.g., MA, MS, MEng, (Specify)_____________________________ 9 Guamanian or Chamorro
MEd, MSW, MBA) 9 Samoan
9 Doctorate (e.g., PhD, EdD) or 9 Other Pacific Islander (Specify)___________________________________ Professional degree (e.g., MD, DDS,
9 Other (Specify)_________________________________________________ DVM, LLB, JD)
23. FATHER’S EDUCATION (Check the 24. FATHER OF HISPANIC ORIGIN? (Check the 25. FATHER’S RACE (Check one or more races to indicate what the father box that best describes the highest box that best describes whether the father is considers himself to be)F A T H E R degree or level of school completed at Spanish/Hispanic/Latino. Check the “No” box if 9 White the time of delivery) father is not Spanish/Hispanic/Latino)
9 Black or African American 9 8th grade or less 9 No, not Spanish/Hispanic/Latino 9 American Indian or Alaska Native
(Name of the enrolled or principal tribe)____________________________ 9 9th - 12th grade, no diploma9 Asian Indian9 Yes, Mexican, Mexican American, Chicano
9 High school graduate or GED 9 Chinese completed 9 Filipino9 Some college credit but no degree 9 Yes, Puerto Rican9 Japanese
9 Associate degree (e.g., AA, AS) 9 Korean
9 Bachelor’s degree (e.g., BA, AB, BS) 9 Yes, Cuban 9 Vietnamese 9 Other Asian (Specify)__________________________________________9 Master’s degree (e.g., MA, MS, MEng,
9 Yes, other Spanish/Hispanic/Latino 9 Native Hawaiian MEd, MSW, MBA) 9 Guamanian or Chamorro (Specify)_____________________________9 Doctorate (e.g., PhD, EdD) or 9 Samoan Professional degree (e.g., MD, DDS,
DVM, LLB, JD) 9 Other Pacific Islander (Specify)___________________________________ 9 Other (Specify)_________________________________________________
26. PLACE WHERE BIRTH OCCURRED (Check one) 27. ATTENDANT’S NAME, TITLE, AND NPI 28. MOTHER TRANSFERRED FOR MATERNAL MEDICAL OR FETAL INDICATIONS FOR DELIVERY? 9 Yes 9 No
9 Hospital NAME: _______________________ NPI:_______ IF YES, ENTER NAME OF FACILITY MOTHER 9 Freestanding birthing center TRANSFERRED FROM: TITLE: 9 MD 9 DO 9 CNM/CM 9 OTHER MIDWIFE 9 Home Birth: Planned to deliver at home? 9 Yes 9 No
9 Clinic/Doctor’s office 9 OTHER (Specify)___________________ ____________________________________________
9 Other (Specify)_______________________
REV. 11/2003

M O T H E R 29a. DATE OF FIRST PRENATAL CARE VISIT ______ /________/ __________ 9 No Prenatal Care M M D D YYYY
29b. DATE OF LAST PRENATAL CARE VISIT
______ /________/ __________ M M D D YYYY
30. TOTAL NUMBER OF PRENATAL VISITS FOR THIS PREGNANCY
___________________________ (If none, enter “0".)
31. MOTHER’S HEIGHT
_______ (feet/inches)
32. MOTHER’S PREPREGNANCY WEIGHT
_________ (pounds)
33. MOTHER’S WEIGHT AT DELIVERY
_________ (pounds)
34. DID MOTHER GET WIC FOOD FOR HERSELF
DURING THIS PREGNANCY? 9 Yes 9 No
35. NUMBER OF PREVIOUS
LIVE BIRTHS (Do not include
this child)
36. NUMBER OF OTHER PREGNANCY OUTCOMES (spontaneous or induced losses or ectopic pregnancies)
37. CIGARETTE SMOKING BEFORE AND DURING PREGNANCY For each time period, enter either the number of cigarettes or the number of packs of cigarettes smoked. IF NONE, ENTER “0". Average number of cigarettes or packs of cigarettes smoked per day. # of cigarettes # of packs Three Months Before Pregnancy _________ OR ________ First Three Months of Pregnancy _________ OR ________ Second Three Months of Pregnancy _________ OR ________ Third Trimester of Pregnancy _________ OR ________
38. PRINCIPAL SOURCE OF PAYMENT FOR THIS DELIVERY 9 Private Insurance 9 Medicaid
9 Self-pay
9 Other (Specify) ____________________
35a.Now Living
Number _____ 9 None
35b. Now Dead
Number ____
9 None
36a. Other Outcomes Number __________ 9 None
35c. DATE OF LAST LIVE BIRTH
_______/________ MM Y Y Y Y
36b. DATE OF LAST OTHER PREGNANCY OUTCOME _______/_______ MM Y Y Y Y
39. DATE LAST NORMAL MENSES BEGAN
_____ /_____/ __________ M M D D Y Y Y Y
40. MOTHER’S MEDICAL RECORD NUMBER
MEDICALAND
HEALTHINFORMATION
41. RISK FACTORS IN THIS PREGNANCY (Check all that apply)
Diabetes 9 Prepregnancy (Diagnosis prior to this pregnancy) 9 Gestational (Diagnosis in this pregnancy)
Hypertension 9 Prepregnancy (Chronic) 9 Gestational (PIH, preeclampsia) 9 Eclampsia
9 Previous preterm birth
9 Other previous poor pregnancy outcome (Includes perinatal death, small-for-gestational age/intrauterine growth restricted birth)
9 Pregnancy resulted from infertility treatment-If yes, check all that apply: 9 Fertility-enhancing drugs, Artificial insemination or Intrauterine insemination 9 Assisted reproductive technology (e.g., in vitro fertilization (IVF), gamete intrafallopian transfer (GIFT))
9 Mother had a previous cesarean delivery If yes, how many __________
9 None of the above
42. INFECTIONS PRESENT AND/OR TREATED DURING THIS PREGNANCY (Check all that apply)
9 Gonorrhea
9 Syphilis 9 Chlamydia
9 Hepatitis B
9 Hepatitis C
9 None of the above
43. OBSTETRIC PROCEDURES (Check all that apply) 9 Cervical cerclage 9 Tocolysis
External cephalic version: 9 Successful 9 Failed
9 None of the above
44. ONSET OF LABOR (Check all that apply)
9 Premature Rupture of the Membranes (prolonged, 12 hrs.)
9 Precipitous Labor (<3 hrs.) 9 Prolonged Labor ( 20 hrs.)
9 None of the above
45. CHARACTERISTICS OF LABOR AND DELIVERY (Check all that apply)
9 Induction of labor
9 Augmentation of labor
9 Non-vertex presentation
9 Steroids (glucocorticoids) for fetal lung maturation received by the mother prior to delivery
9 Antibiotics received by the mother during labor
9 Clinical chorioamnionitis diagnosed during labor or maternal temperature >38°C (100.4°F)
9 Moderate/heavy meconium staining of the amniotic fluid
9 Fetal intolerance of labor such that one or more of the following actions was taken: in-utero resuscitative measures, further fetal assessment, or operative delivery 9 Epidural or spinal anesthesia during labor
9 None of the above
46. METHOD OF DELIVERY
A. Was delivery with forceps attempted but unsuccessful?
9 Yes 9 No
B. Was delivery with vacuum extraction attempted but unsuccessful?
9 Yes 9 No
C. Fetal presentation at birth
9 Cephalic 9 Breech 9 Other
D. Final route and method of delivery (Check one)
9 Vaginal/Spontaneous
9 Vaginal/Forceps
9 Vaginal/Vacuum
9 Cesarean If cesarean, was a trial of labor attempted? 9 Yes 9 No
47.MATERNAL MORBIDITY (Check all that apply) (Complications associated with labor and delivery)
9 Maternal transfusion
9 Third or fourth degree perineal laceration
9 Ruptured uterus
9 Unplanned hysterectomy
9 Admission to intensive care unit
9 Unplanned operating room procedure
following delivery
9 None of the above
NEWBORN INFORMATION
N E W B O R N 48. NEWBORN MEDICAL RECORD NUMBER:
49. BIRTHWEIGHT (grams preferred, specify unit)
______________________ 9 grams 9 lb/oz 50. OBSTETRIC ESTIMATE OF GESTATION:
_________________ (completed weeks)
51. APGAR SCORE:
Score at 5 minutes:_________________________
If 5 minute score is less than 6,
Score at 10 minutes: _______________________
52. PLURALITY - Single, Twin, Triplet, etc.
(Specify)________________________
53. IF NOT SINGLE BIRTH - Born First, Second,
Third, etc. (Specify)____________________
54. ABNORMAL CONDITIONS OF THE NEWBORN (Check all that apply)
9 Assisted ventilation required immediately following delivery
9 Assisted ventilation required for more than six hours
9 NICU admission
9 Newborn given surfactant replacement therapy
9 Antibiotics received by the newborn for suspected neonatal sepsis
9 Seizure or serious neurologic dysfunction
9 Significant birth injury (skeletal fracture(s), peripheral nerve injury, and/or soft tissue/solid organ hemorrhage which requires intervention)
9 None of the above
55. CONGENITAL ANOMALIES OF THE NEWBORN (Check all that apply) 9 Anencephaly 9 Meningomyelocele/Spina bifida 9 Cyanotic congenital heart disease 9 Congenital diaphragmatic hernia 9 Omphalocele 9 Gastroschisis 9 Limb reduction defect (excluding congenital amputation and dwarfing syndromes) 9 Cleft Lip with or without Cleft Palate 9 Cleft Palate alone 9 Down Syndrome 9 Karyotype confirmed 9 Karyotype pending 9 Suspected chromosomal disorder 9 Karyotype confirmed 9 Karyotype pending
9 Hypospadias
9 None of the anomalies listed above
Mot
her’s
Nam
e __
____
____
____
____
Mot
her’s
Med
ical
Rec
ord
No.
___
____
REV. 11/2003
56. WAS INFANT TRANSFERRED WITHIN 24 HOURS OF DELIVERY? 9 Yes 9 No
IF YES, NAME OF FACILITY INFANT TRANSFERRED TO:________________________
57. IS INFANT LIVING AT TIME OF REPORT?
9 Yes 9 No 9 Infant transferred, status unknown
58. IS THE INFANT BEING BREASTFED AT DISCHARGE?
9 Yes 9 No
NOTE: This recommended standard birth certificate is the result of an extensive evaluation process. Information on the process and resulting recommendations as well as plans forfuture activities is available on the Internet at: http://www.cdc.gov/nchs/vital_certs_rev.htm.
≥
≥

Table A. Percent of birth records on which specified items were not stated: United Statesand each State and territory, New York City and the District of Columbia, 2004[By place of residence]
Mother Father
Total of reporting areas 1 4,112,052 0.0 0.2 0.4 13.6 16.0 0.8 14.1
Alabama 59,510 0.0 0.0 0.0 20.8 21.1 0.1 20.8Alaska 10,338 - 0.9 0.5 9.2 14.2 11.6 20.9Arizona 93,663 0.0 0.0 0.1 14.7 18.2 1.9 16.8Arkansas 38,573 - 0.0 0.5 19.0 20.3 0.3 19.1California 544,843 0.0 0.0 0.4 7.3 8.1 1.4 7.7Colorado 68,503 - 0.0 0.5 8.1 8.8 0.0 8.8Connecticut 42,095 0.0 0.1 0.5 10.6 11.8 0.3 10.9Delaware 11,369 - 0.1 0.3 32.6 33.6 0.7 32.6District of Columbia 7,933 - 0.0 0.0 35.7 44.1 0.4 35.7
Florida 2 218,053 0.0 0.1 0.2 15.8 24.5 0.3 18.4Georgia 138,849 0.0 0.0 0.2 17.0 17.7 1.6 18.4Hawaii 18,281 - 0.1 0.2 8.6 12.3 0.2 8.6Idaho 22,532 0.0 0.0 0.4 9.2 15.2 1.3 12.1Illinois 180,778 0.0 0.0 0.2 13.7 15.2 0.1 15.0Indiana 87,142 0.0 0.1 0.0 13.2 13.2 0.4 13.4Iowa 38,438 - - 0.0 14.0 15.5 0.3 15.7Kansas 39,669 - 0.0 0.1 10.6 11.1 1.4 12.1Kentucky 55,720 0.0 0.1 0.6 20.1 24.7 0.1 23.3Louisiana 65,369 0.0 0.0 0.0 19.6 19.7 0.2 19.7Maine 13,944 - 0.0 0.0 9.2 12.7 0.5 12.8Maryland 74,628 0.0 0.0 0.1 13.4 19.4 0.1 15.5Massachusetts 78,484 0.0 - 0.9 7.9 9.4 0.7 8.5Michigan 129,776 0.0 0.1 0.2 14.6 16.9 2.7 18.6Minnesota 70,624 - 0.1 0.3 12.1 18.2 1.4 13.9Mississippi 42,827 0.0 0.1 0.1 20.7 20.7 0.1 20.7Missouri 77,765 - 0.0 0.3 18.0 19.9 0.1 18.5Montana 11,519 - 0.1 0.0 9.2 10.6 1.6 11.9Nebraska 26,332 - - - 13.2 14.9 2.5 15.6Nevada 35,200 - 0.0 0.5 22.4 24.0 1.0 22.8
New Hampshire 2 14,565 - 0.0 0.2 6.4 8.6 3.5 7.6New Jersey 115,253 0.0 0.1 0.1 7.6 9.0 0.1 7.8New Mexico 28,384 - 0.0 1.6 19.7 19.6 0.0 19.6New York(excluding NYC) 130,879 0.0 0.0 0.1 10.8 16.1 0.2 10.9New York City 119,068 0.0 0.0 0.5 15.4 16.1 0.4 15.6North Carolina 119,847 0.0 - 0.0 16.2 16.3 0.1 16.3North Dakota 8,189 - - - 9.3 9.5 2.8 12.1Ohio 148,954 0.4 0.0 0.5 16.2 19.9 0.5 16.9Oklahoma 51,306 - 0.0 0.0 14.6 17.2 0.3 16.8Oregon 45,678 - - 0.1 10.2 4.9 0.3 4.9Pennsylvania 144,748 0.0 4.6 3.9 6.6 11.0 1.2 5.9Rhode Island 12,779 - - 0.2 13.0 14.3 13.8 24.1South Carolina 56,590 - 0.0 0.1 29.5 33.8 0.1 0.7South Dakota 11,338 0.0 0.0 0.1 10.4 11.0 0.1 13.4Tennessee 79,642 0.0 1.2 0.3 16.0 22.2 0.2 15.9Texas 381,293 0.0 0.0 0.4 14.3 14.7 0.3 14.5Utah 50,670 0.0 0.0 0.2 9.9 12.9 0.6 10.8Vermont 6,599 - - 0.4 7.6 10.0 1.1 10.7Virginia 103,933 - 0.0 0.1 15.3 17.0 0.1 15.3Washington 81,747 - 0.1 0.3 9.7 23.6 2.9 15.5West Virginia 20,880 0.0 0.0 0.1 13.0 13.5 0.2 13.4Wisconsin 70,146 0.0 0.0 0.1 30.8 30.9 0.1 30.9Wyoming 6,807 - 0.0 0.1 16.0 16.4 0.3 16.2
Puerto Rico 51,127 - 0.1 - 3.2 4.3 --- ---Virgin Islands 1,574 - 0.3 - 21.0 22.1 4.3 60.7Guam 3,410 0.1 0.4 0.4 22.3 22.6 1.5 27.8American Samoa 1,714 0.2 - 3.9 36.4 36.5 --- ---Northern Marianas 1,355 - 0.5 - 8.9 9.0 --- ---
See footnotes at end of table.
Items common to both the 1989 and 2003 revisions of the U.S. Standard Certificate of Live Birth
Area All births Place of birthMother's birthplace
Attendant at birth
Father's age Father's race Hispanic Origin

Table A. Percent of birth records on which specified items were not stated: United Statesand each State and territory, 2004 -- Con.[By place of residence]
Unrevised 3 Revised 4 Unrevised 3 Revised 4
Total of reporting areas 1 2.0 --- 0.5 1.0 2.5 --- 3.6 5.9
Alabama 0.7 --- 0.0 0.1 0.7 --- 0.2 1.6Alaska 6.7 --- 10.4 0.4 6.8 --- 10.6 8.7Arizona 1.4 --- 0.1 0.1 0.1 --- 0.7 12.5Arkansas 1.9 --- 0.2 0.2 2.7 --- 2.2 8.9
California 5 2.9 --- 0.1 6.8 1.7 --- 2.7 ---Colorado 1.1 --- 0.1 0.0 1.8 --- 2.0 3.0Connecticut 1.2 --- 0.0 0.0 1.5 --- 1.0 1.1Delaware 3.1 --- 0.2 0.1 2.7 --- 0.6 1.1District of Columbia 8.0 --- 0.2 0.2 11.1 --- 15.8 13.7
Florida 2 --- --- 0.7 0.1 --- --- 4.5 8.5Georgia 3.3 --- 0.1 0.1 2.6 --- 1.4 6.5Hawaii 1.2 --- 0.0 0.2 3.4 --- 2.8 13.3Idaho --- 5.1 0.2 0.1 --- 1.3 1.6 8.1Illinois 1.6 --- 0.3 0.2 5.6 --- 5.9 6.4Indiana 1.6 --- 0.1 0.0 2.3 --- 1.8 2.2Iowa 0.2 --- 0.1 0.1 0.2 --- 0.3 0.7Kansas 0.4 --- 0.0 0.1 0.8 --- 0.8 0.2Kentucky --- 4.4 0.1 0.0 --- 1.9 1.6 2.0Louisiana 0.1 --- 0.1 0.1 0.3 --- 0.3 4.4Maine 1.5 --- 0.2 0.1 1.2 --- 0.3 0.9Maryland 1.5 --- 0.1 0.1 1.9 --- 2.3 3.1Massachusetts 0.4 --- 0.2 0.2 2.0 --- 0.7 0.9Michigan 2.6 --- 0.4 0.1 3.7 --- 4.8 7.1Minnesota 1.9 --- 0.5 0.2 4.2 --- 5.3 10.4Mississippi 4.3 --- 0.1 0.2 5.2 --- 3.6 5.7Missouri 1.2 --- 0.5 0.2 2.3 --- 4.0 4.2Montana 0.6 --- 0.1 0.1 0.8 --- 0.5 1.3Nebraska 0.1 --- 0.0 0.0 0.2 --- 0.3 3.1Nevada 2.7 --- 1.3 0.6 7.7 --- 10.3 8.9
New Hampshire 2 --- --- 0.5 0.3 --- --- 2.8 8.7New Jersey 2.2 --- 0.1 0.1 2.0 --- 1.0 0.9New Mexico 3.2 --- 1.0 0.3 6.0 --- 6.3 11.2New York(excluding NYC) --- 7.5 2.0 0.1 --- 4.5 6.0 6.8New York City 4.5 --- 0.0 0.0 5.9 --- 0.7 2.0North Carolina 0.5 --- 0.0 0.0 1.0 --- 0.8 2.6North Dakota 0.3 --- 0.1 0.2 1.1 --- 0.8 2.3Ohio 2.4 --- 0.3 0.1 4.9 --- 9.1 3.8Oklahoma 0.5 --- 0.2 0.2 2.2 --- 2.2 3.6Oregon 2.9 --- 0.0 0.0 1.6 --- 0.2 1.9Pennsylvania --- 3.0 1.3 0.8 --- 6.7 9.6 13.0Rhode Island 2.5 --- 2.0 0.1 6.0 --- 10.7 13.7South Carolina --- 5.3 0.0 0.1 --- 1.2 0.8 1.8South Dakota 0.1 --- 0.0 0.0 0.4 --- 0.4 0.8Tennessee --- 0.8 0.9 0.5 --- 9.6 8.2 8.4Texas 1.4 --- 0.7 0.3 1.5 --- 3.8 8.1Utah 1.8 --- 0.3 0.0 2.6 --- 2.8 4.0Vermont 5.9 --- 0.2 0.0 8.3 --- 0.6 2.0Virginia 2.3 --- 0.0 0.0 1.2 --- 1.7 3.2Washington --- 3.2 2.8 0.3 --- 17.1 16.2 16.6West Virginia 2.5 --- 0.0 0.1 3.8 --- 0.7 2.2Wisconsin 0.4 --- 0.0 0.0 0.3 --- 0.5 2.2Wyoming 1.1 --- 0.0 0.0 0.8 --- 0.5 1.9
Puerto Rico 0.3 --- 0.1 0.0 0.2 --- 0.1 0.0Virgin Islands 1.0 --- 1.3 - 0.1 --- 2.6 13.0Guam 1.4 --- 2.3 0.1 1.1 --- 1.5 2.8American Samoa --- --- - --- --- --- --- ---Northern Marianas 8.1 --- 5.4 0.7 4.4 --- 4.0 ---
See footnotes at end of table.
Items common to both the 1989 and 2003 revisions of the U.S. Standard Certificate of Live Birth
Month prenatal care beganEducational attainment of motherLive-birth order
Length of gestation
Number of prenatal visits
Weight gainArea

Table A. Percent of birth records on which specified items were not stated: United States and each State and territory, 2004 -- Con.[By place of residence]
Unrevised 3 Revised 4
Total of reporting areas 1 0.1 0.5 1.1 --- 0.4
Alabama 0.1 0.2 0.6 --- 0.7Alaska 0.3 0.9 1.4 --- 0.3Arizona 0.1 0.4 1.7 --- 0.4Arkansas 0.1 3.2 1.5 --- 0.5California 0.0 --- --- --- 0.0Colorado 0.0 0.3 0.2 --- 0.0Connecticut 0.0 0.2 0.7 --- 0.2Delaware 0.1 0.2 2.5 --- 0.0District of Columbia 0.1 0.6 0.1 --- 0.1
Florida 2,7 0.0 0.3 --- --- 0.2Georgia 0.0 0.4 1.4 --- 0.6Hawaii 0.1 0.5 0.1 --- 0.5Idaho 0.0 0.6 --- 3.8 0.2Illinois 0.0 0.3 0.3 --- 0.6
Indiana 8 0.4 0.3 1.2 --- 0.6Iowa 0.1 0.3 0.1 --- 0.8Kansas 0.0 0.8 0.1 --- 0.3Kentucky 0.2 0.6 --- 4.3 0.3Louisiana 0.1 0.4 0.2 --- 0.2Maine 0.1 0.2 1.2 --- 0.3Maryland 0.0 0.3 0.4 --- 0.4Massachusetts 0.2 0.2 0.3 --- 0.3Michigan 0.1 0.3 2.9 --- 0.6Minnesota 0.0 0.3 2.3 --- 0.9Mississippi 0.1 0.4 0.4 --- 0.6Missouri 0.0 0.6 4.1 --- 0.8Montana 0.1 0.1 1.0 --- 0.3Nebraska 0.0 0.1 0.1 --- 0.3Nevada 0.0 1.5 2.2 --- 0.9
New Hampshire 2 0.2 0.4 --- --- 0.5New Jersey 0.0 0.2 1.8 --- 0.8New Mexico 0.3 3.7 1.7 --- 0.4New York(excluding NYC) 0.1 0.5 --- 6.8 0.5New York City 0.0 0.2 4.2 --- 0.2North Carolina 0.0 0.3 0.4 --- 0.6North Dakota 0.2 0.3 0.5 --- 2.3Ohio 0.0 0.2 0.9 --- 0.8Oklahoma 0.1 0.9 0.9 --- 1.9Oregon 0.0 0.4 2.5 --- 0.7Pennsylvania 0.4 1.2 --- 4.1 0.1Rhode Island 0.1 0.4 2.7 --- 0.2South Carolina 0.0 0.2 --- 5.1 0.0
South Dakota 9 0.0 0.2 0.1 --- 0.6Tennessee 0.4 3.2 --- 1.0 0.0Texas 0.1 --- 0.2 --- 0.9Utah 0.0 0.2 1.0 --- 0.5Vermont 0.3 0.2 6.2 --- 0.1Virginia 0.1 0.1 1.1 --- 0.6Washington 0.4 0.4 --- 3.2 0.0West Virginia 0.0 0.2 1.9 --- 0.3Wisconsin 0.0 0.4 0.2 --- 0.0Wyoming 0.0 0.3 0.5 --- 0.3
Puerto Rico 0.0 0.1 - --- 0.0Virgin Islands 0.6 1.6 1.5 --- 1.7Guam 0.1 0.6 1.0 --- 0.2American Samoa - --- --- --- ---
Northern Marianas 9 0.4 1.5 6.4 --- 3.4
See footnotes at end of table.
Method of Delivery 6
5-minute apgar score
Tobacco use
Birthweight
Area
Items common to both the 1989 and 2003 revisions of the U.S. Standard Certificate of Live Birth

Table A. Percent of birth records on which specified items were not stated: United Statesand each State and territory, 2004 -- Con.
Total of reporting areas 1 0.4 0.4 0.4 0.4 0.3 0.5 0.4
Alabama 0.0 0.0 0.0 0.0 0.0 0.0 0.0Alaska 9.5 9.5 9.5 9.5 9.5 9.5 9.5Arizona 0.0 0.0 0.0 0.0 0.0 0.0 0.0Arkansas 0.1 0.1 0.1 0.1 0.0 0.0 0.0California 0.0 0.0 0.0 0.0 0.0 0.0 0.0Colorado 0.0 0.0 0.0 0.0 - - -Connecticut 0.1 0.1 0.1 0.1 0.0 0.0 0.0Delaware - - - - - - -District of Columbia 0.0 0.0 0.0 0.0 - - -
Florida 2 0.2 0.2 0.2 0.2 0.2 2.9 0.3Georgia 0.4 0.4 0.4 0.4 0.0 0.0 0.0Hawaii 0.0 0.0 0.0 0.0 - - -Idaho 0.8 0.8 0.8 0.8 0.5 1.9 0.6Illinois 0.0 0.0 0.0 0.0 0.0 0.0 0.0Indiana 0.0 0.0 0.0 0.0 0.0 0.0 0.0Iowa 0.0 0.0 0.0 0.0 0.0 0.0 0.0Kansas 0.1 0.1 0.1 0.1 0.0 0.0 0.0Kentucky 0.4 0.4 0.4 0.4 0.4 0.9 0.8Louisiana 0.1 0.1 0.1 0.1 0.1 0.1 0.1Maine 0.1 0.1 0.1 0.1 0.1 0.1 0.1Maryland 0.0 0.0 0.0 0.0 0.0 0.0 0.0Massachusetts 0.3 0.3 0.3 0.3 0.3 0.3 0.3Michigan 0.0 0.0 0.0 0.0 0.0 0.0 0.0Minnesota 3.0 3.0 3.0 3.0 2.9 2.9 2.9Mississippi 0.1 0.1 0.1 0.1 0.1 0.1 0.1Missouri 0.1 0.1 0.1 0.1 0.1 0.1 0.1Montana - - - - 0.0 0.0 0.0Nebraska 0.0 0.0 0.0 0.0 0.0 0.0 0.0Nevada 2.8 2.8 2.8 2.8 2.9 2.9 2.9
New Hampshire 2 0.0 0.0 0.0 0.0 0.5 1.7 1.1New Jersey 0.3 0.3 0.3 0.3 0.1 0.1 0.1New Mexico 0.0 0.0 0.0 0.0 - - -New York(excluding NYC) 1.5 1.5 1.5 1.5 0.0 1.1 2.9New York City 0.1 0.1 0.1 0.1 0.1 0.1 0.1North Carolina 0.0 0.0 0.0 0.0 0.0 0.0 0.0North Dakota 0.3 0.3 0.3 0.3 0.3 0.3 0.3Ohio 0.0 0.0 0.0 0.0 0.0 0.0 0.0Oklahoma 4.8 4.8 4.8 4.8 5.4 5.4 5.4Oregon 0.7 0.7 0.7 0.7 0.0 0.0 0.0Pennsylvania 0.0 0.0 0.0 0.0 0.0 0.1 0.1Rhode Island 1.9 1.9 1.9 1.9 1.8 1.8 1.8South Carolina 0.0 0.0 0.0 0.0 0.0 0.0 0.0South Dakota - - - - 0.0 0.0 0.0Tennessee 0.0 0.0 0.0 0.0 0.0 0.0 0.0Texas 0.9 0.9 0.9 0.9 0.0 0.0 0.0Utah 0.1 0.1 0.1 0.1 0.0 0.0 0.0Vermont 0.0 0.0 0.0 0.0 0.1 0.3 0.1Virginia 0.0 0.0 0.0 0.0 - 0.0 0.0Washington 2.9 2.9 2.9 2.9 3.2 4.9 3.6West Virginia 0.1 0.1 0.1 0.1 0.1 0.1 0.1Wisconsin 0.0 0.0 0.0 0.0 0.0 0.0 0.0Wyoming - - - - - - -
Puerto Rico 0.0 0.0 0.0 0.0 0.0 0.0 0.0Virgin Islands 4.5 4.5 4.5 4.5 5.7 5.7 5.7Guam 1.1 1.1 1.1 1.1 0.5 0.5 0.5American Samoa --- --- ---Northern Marianas 0.0 0.0 0.0 0.0 6.0 6.0 6.0
See footnotes at end of table.
Characteristics of Labor and Delivery
Precipitous Labor
Menconium BreechChronic
HypertensionEclampsiaDiabetes
P.A. Hypertension
AreaRisk Factors in this Pregnancy
Items common to both the 1989 and 2003 revisions of the U.S. Standard Certificate of Live Birth
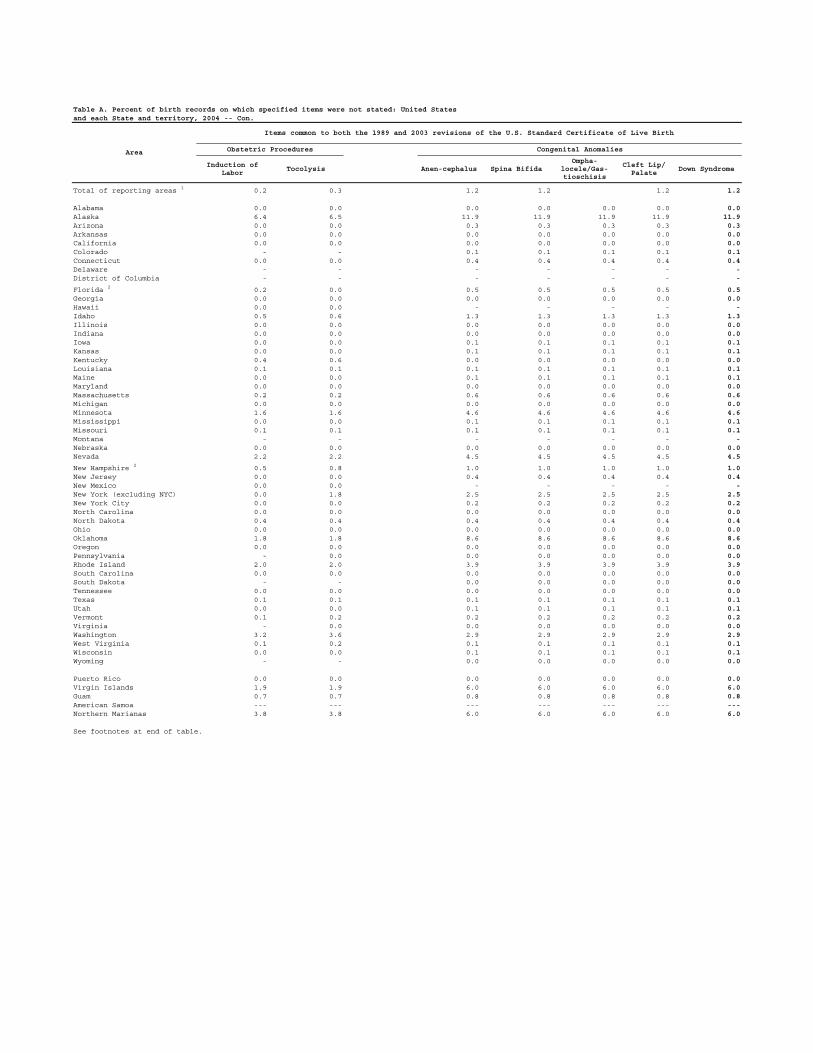
Table A. Percent of birth records on which specified items were not stated: United Statesand each State and territory, 2004 -- Con.
Total of reporting areas 1 0.2 0.3 1.2 1.2 1.2 1.2
Alabama 0.0 0.0 0.0 0.0 0.0 0.0 0.0Alaska 6.4 6.5 11.9 11.9 11.9 11.9 11.9Arizona 0.0 0.0 0.3 0.3 0.3 0.3 0.3Arkansas 0.0 0.0 0.0 0.0 0.0 0.0 0.0California 0.0 0.0 0.0 0.0 0.0 0.0 0.0Colorado - - 0.1 0.1 0.1 0.1 0.1Connecticut 0.0 0.0 0.4 0.4 0.4 0.4 0.4Delaware - - - - - - -District of Columbia - - - - - - -
Florida 2 0.2 0.0 0.5 0.5 0.5 0.5 0.5Georgia 0.0 0.0 0.0 0.0 0.0 0.0 0.0Hawaii 0.0 0.0 - - - - -Idaho 0.5 0.6 1.3 1.3 1.3 1.3 1.3Illinois 0.0 0.0 0.0 0.0 0.0 0.0 0.0Indiana 0.0 0.0 0.0 0.0 0.0 0.0 0.0Iowa 0.0 0.0 0.1 0.1 0.1 0.1 0.1Kansas 0.0 0.0 0.1 0.1 0.1 0.1 0.1Kentucky 0.4 0.6 0.0 0.0 0.0 0.0 0.0Louisiana 0.1 0.1 0.1 0.1 0.1 0.1 0.1Maine 0.0 0.0 0.1 0.1 0.1 0.1 0.1Maryland 0.0 0.0 0.0 0.0 0.0 0.0 0.0Massachusetts 0.2 0.2 0.6 0.6 0.6 0.6 0.6Michigan 0.0 0.0 0.0 0.0 0.0 0.0 0.0Minnesota 1.6 1.6 4.6 4.6 4.6 4.6 4.6Mississippi 0.0 0.0 0.1 0.1 0.1 0.1 0.1Missouri 0.1 0.1 0.1 0.1 0.1 0.1 0.1Montana - - - - - - -Nebraska 0.0 0.0 0.0 0.0 0.0 0.0 0.0Nevada 2.2 2.2 4.5 4.5 4.5 4.5 4.5
New Hampshire 2 0.5 0.8 1.0 1.0 1.0 1.0 1.0New Jersey 0.0 0.0 0.4 0.4 0.4 0.4 0.4New Mexico 0.0 0.0 - - - - -New York (excluding NYC) 0.0 1.8 2.5 2.5 2.5 2.5 2.5New York City 0.0 0.0 0.2 0.2 0.2 0.2 0.2North Carolina 0.0 0.0 0.0 0.0 0.0 0.0 0.0North Dakota 0.4 0.4 0.4 0.4 0.4 0.4 0.4Ohio 0.0 0.0 0.0 0.0 0.0 0.0 0.0Oklahoma 1.8 1.8 8.6 8.6 8.6 8.6 8.6Oregon 0.0 0.0 0.0 0.0 0.0 0.0 0.0Pennsylvania - 0.0 0.0 0.0 0.0 0.0 0.0Rhode Island 2.0 2.0 3.9 3.9 3.9 3.9 3.9South Carolina 0.0 0.0 0.0 0.0 0.0 0.0 0.0South Dakota - - 0.0 0.0 0.0 0.0 0.0Tennessee 0.0 0.0 0.0 0.0 0.0 0.0 0.0Texas 0.1 0.1 0.1 0.1 0.1 0.1 0.1Utah 0.0 0.0 0.1 0.1 0.1 0.1 0.1Vermont 0.1 0.2 0.2 0.2 0.2 0.2 0.2Virginia - 0.0 0.0 0.0 0.0 0.0 0.0Washington 3.2 3.6 2.9 2.9 2.9 2.9 2.9West Virginia 0.1 0.2 0.1 0.1 0.1 0.1 0.1Wisconsin 0.0 0.0 0.1 0.1 0.1 0.1 0.1Wyoming - - 0.0 0.0 0.0 0.0 0.0
Puerto Rico 0.0 0.0 0.0 0.0 0.0 0.0 0.0Virgin Islands 1.9 1.9 6.0 6.0 6.0 6.0 6.0Guam 0.7 0.7 0.8 0.8 0.8 0.8 0.8American Samoa --- --- --- --- --- --- ---Northern Marianas 3.8 3.8 6.0 6.0 6.0 6.0 6.0
See footnotes at end of table.
Spina BifidaOmpha-
locele/Gas-tioschisis
Area
Cleft Lip/ Palate
Down Syndrome
Obstetric Procedures Congenital Anomalies
Induction of Labor
Tocolysis Anen-cephalus
Items common to both the 1989 and 2003 revisions of the U.S. Standard Certificate of Live Birth


Table A. Percent of birth records on which specified items were not stated: United States
and each State and territory, 2004 -- Con.
Total of reporting areas 1 --- --- --- --- --- ---
Alabama --- --- --- --- --- ---Alaska --- --- --- --- --- ---Arizona --- --- --- --- --- ---Arkansas --- --- --- --- --- ---California --- --- --- --- --- ---Colorado --- --- --- --- --- ---Connecticut --- --- --- --- --- ---Delaware --- --- --- --- --- ---District of Columbia --- --- --- --- --- ---
Florida 2 --- --- --- --- --- ---Georgia --- --- --- --- --- ---Hawaii --- --- --- --- --- ---Idaho 3.9 3.7 3.7 3.6 3.3 4.4Illinois --- --- --- --- --- ---Indiana --- --- --- --- --- ---Iowa --- --- --- --- --- ---Kansas --- --- --- --- --- ---Kentucky 4.7 4.9 5.1 4.7 4.6 4.3Louisiana --- --- --- --- --- ---Maine --- --- --- --- --- ---Maryland --- --- --- --- --- ---Massachusetts --- --- --- --- --- ---Michigan --- --- --- --- --- ---Minnesota --- --- --- --- --- ---Mississippi --- --- --- --- --- ---Missouri --- --- --- --- --- ---Montana --- --- --- --- --- ---Nebraska --- --- --- --- --- ---Nevada --- --- --- --- --- ---
New Hampshire 2 --- --- --- --- --- ---New Jersey --- --- --- --- --- ---New Mexico --- --- --- --- --- ---New York(excluding NYC) 8.3 8.6 9.7 6.8 7.3 9.3New York City --- --- --- --- --- ---North Carolina --- --- --- --- --- ---North Dakota --- --- --- --- --- ---Ohio --- --- --- --- --- ---Oklahoma --- --- --- --- --- ---Oregon --- --- --- --- --- ---Pennsylvania 2.2 2.2 2.2 2.2 2.3 2.2Rhode Island --- --- --- --- --- ---South Carolina 5.0 5.0 5.0 5.0 5.0 5.0South Dakota --- --- --- --- --- ---Tennessee 0.6 0.6 0.6 0.6 0.6 0.6Texas --- --- --- --- --- ---Utah --- --- --- --- --- ---Vermont --- --- --- --- --- ---Virginia --- --- --- --- --- ---Washington 4.5 5.1 5.1 4.7 1.5 4.4West Virginia --- --- --- --- --- ---Wisconsin --- --- --- --- --- ---Wyoming --- --- --- --- --- ---
Puerto Rico --- --- --- --- --- ---Virgin Islands --- --- --- --- --- ---Guam --- --- --- --- --- ---American Samoa --- --- --- --- --- ---Northern Marianas --- --- --- --- --- ---
See footnotes at end of table.
Items based on the 2003 US. Standard Certificate of Live Birth
Area Pregnancy Risk Factors
Obstetric Procedures
Congenital Anomalies
Onset of LaborMethod of Delivery
Charac- teristics of Labor and Delivery
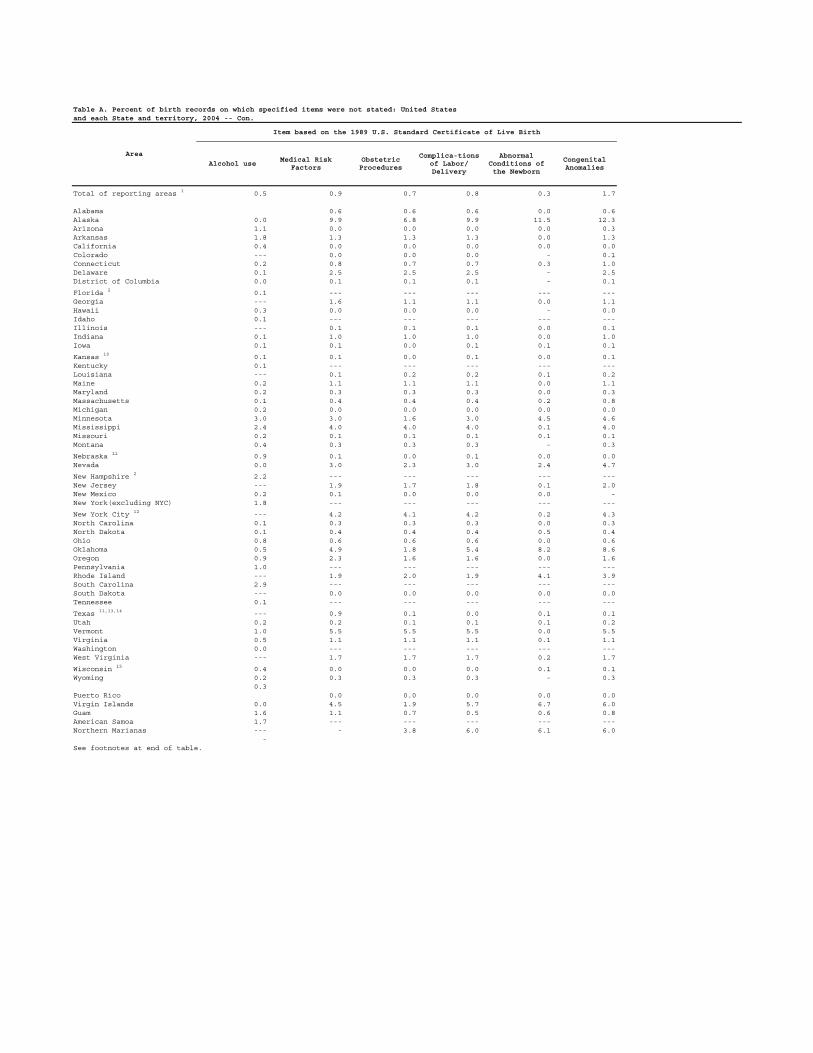
Table A. Percent of birth records on which specified items were not stated: United Statesand each State and territory, 2004 -- Con.
Total of reporting areas 1 0.5 0.9 0.7 0.8 0.3 1.7
Alabama 0.6 0.6 0.6 0.0 0.6Alaska 0.0 9.9 6.8 9.9 11.5 12.3Arizona 1.1 0.0 0.0 0.0 0.0 0.3Arkansas 1.8 1.3 1.3 1.3 0.0 1.3California 0.4 0.0 0.0 0.0 0.0 0.0Colorado --- 0.0 0.0 0.0 - 0.1Connecticut 0.2 0.8 0.7 0.7 0.3 1.0Delaware 0.1 2.5 2.5 2.5 - 2.5District of Columbia 0.0 0.1 0.1 0.1 - 0.1
Florida 2 0.1 --- --- --- --- ---Georgia --- 1.6 1.1 1.1 0.0 1.1Hawaii 0.3 0.0 0.0 0.0 - 0.0Idaho 0.1 --- --- --- --- ---Illinois --- 0.1 0.1 0.1 0.0 0.1Indiana 0.1 1.0 1.0 1.0 0.0 1.0Iowa 0.1 0.1 0.0 0.1 0.1 0.1
Kansas 10 0.1 0.1 0.0 0.1 0.0 0.1Kentucky 0.1 --- --- --- --- ---Louisiana --- 0.1 0.2 0.2 0.1 0.2Maine 0.2 1.1 1.1 1.1 0.0 1.1Maryland 0.2 0.3 0.3 0.3 0.0 0.3Massachusetts 0.1 0.4 0.4 0.4 0.2 0.8Michigan 0.2 0.0 0.0 0.0 0.0 0.0Minnesota 3.0 3.0 1.6 3.0 4.5 4.6Mississippi 2.4 4.0 4.0 4.0 0.1 4.0Missouri 0.2 0.1 0.1 0.1 0.1 0.1Montana 0.4 0.3 0.3 0.3 - 0.3
Nebraska 11 0.9 0.1 0.0 0.1 0.0 0.0Nevada 0.0 3.0 2.3 3.0 2.4 4.7
New Hampshire 2 2.2 --- --- --- --- ---New Jersey --- 1.9 1.7 1.8 0.1 2.0New Mexico 0.2 0.1 0.0 0.0 0.0 -New York(excluding NYC) 1.8 --- --- --- --- ---
New York City 12 --- 4.2 4.1 4.2 0.2 4.3North Carolina 0.1 0.3 0.3 0.3 0.0 0.3North Dakota 0.1 0.4 0.4 0.4 0.5 0.4Ohio 0.8 0.6 0.6 0.6 0.0 0.6Oklahoma 0.5 4.9 1.8 5.4 8.2 8.6Oregon 0.9 2.3 1.6 1.6 0.0 1.6Pennsylvania 1.0 --- --- --- --- ---Rhode Island --- 1.9 2.0 1.9 4.1 3.9South Carolina 2.9 --- --- --- --- ---South Dakota --- 0.0 0.0 0.0 0.0 0.0Tennessee 0.1 --- --- --- --- ---
Texas 11,13,14 --- 0.9 0.1 0.0 0.1 0.1Utah 0.2 0.2 0.1 0.1 0.1 0.2Vermont 1.0 5.5 5.5 5.5 0.0 5.5Virginia 0.5 1.1 1.1 1.1 0.1 1.1Washington 0.0 --- --- --- --- ---West Virginia --- 1.7 1.7 1.7 0.2 1.7
Wisconsin 15 0.4 0.0 0.0 0.0 0.1 0.1Wyoming 0.2 0.3 0.3 0.3 - 0.3
0.3Puerto Rico 0.0 0.0 0.0 0.0 0.0Virgin Islands 0.0 4.5 1.9 5.7 6.7 6.0Guam 1.6 1.1 0.7 0.5 0.6 0.8American Samoa 1.7 --- --- --- --- ---Northern Marianas --- - 3.8 6.0 6.1 6.0
-See footnotes at end of table.
Complica-tions of Labor/ Delivery
Abnormal Conditions of the Newborn
Congenital Anomalies
Obstetric Procedures
AreaMedical Risk
FactorsAlcohol use
Item based on the 1989 U.S. Standard Certificate of Live Birth

0.0 Quantity more than zero but less than 0.05.---Data not available.- Quantity zero.
1 Excludes data for Puerto Rico, Virgin Islands, Guam, American Samoa, and the Commonwealth of the Northern Marianas.2 Florida and New Hampshire implemented the 2003 U.S. Standard Certificate of Live Birth in 2004, but after January 1, 2004.3 Includes data for states based on the 1989 U.S. Standard Certificate of Live birth; excludes data for states based on the 2003 U.S. Standard Certificate of Live Birth.4 Includes data for states based on the 2003 U.S. Standard Certificate of Live birth; excludes data from states based on the 1989 U.S. Standard Certificate of Live Birth.5 California reports date last normal menses began but does not report the clinical estimate of gestation. 6 Not stated levels for states which implemented the 2003 U.S. Standard Certificate of Live Birth are derived from the item "Final route and method of delivery" only. 7 The Florida tobacco use item is not consistent with the tobacco use items on either the 1989 or 2003 U.S Standard Certificates of Live Birth.8 Indiana reports tobacco use but does not report the average number of cigarettes smoked per day in standard categories.9 South Dakota and the Commonwealth of the Northern Marianas report tobacco use but do not report the average number of cigarettes smoked per day.10 Kansas does not report the Medical Risk Factor "Rh sensitization."11 Nebraska and Texas do not report the abnormal condition of the newborn "birth injury."12 New York City does not report the Abnormal Conditions of the Newborn "assisted ventilation less then 30 minutes and assisted ventilation of 30 minutes or more."13 Texas does not report the Medical Risk Factors "genital herpes and uterine bleeding."14 Texas does not report the Abnormal Conditions of the Newborn "anesthetic complications and fetal distress."15 Wisconsin does not report the Abnormal Condition of the Newborn "fetal alcohol syndrome."

Table B. Births by place of occurrence and residence for births occurring in the 50 states, the District of Columbia, and U.S. territories, 2004
Area Number live births
Occurrence ResidenceUnited States 1/ 4,118,907 4,112,052
Alabama 58,383 59,510Alaska 10,268 10,338Arizona 93,876 93,663Arkansas 37,840 38,573California 545,758 544,843Colorado 68,797 68,503Connecticut 42,545 42,095Delaware 12,080 11,369District of Columbia 14,794 7,933Florida 218,218 218,053
Georgia 140,117 138,849Hawaii 18,297 18,281Idaho 21,949 22,532Illinois 177,417 180,778Indiana 87,942 87,142Iowa 38,527 38,438Kansas 40,449 39,669Kentucky 54,085 55,720Louisiana 65,572 65,369Maine 13,733 13,944
Maryland 70,538 74,628Massachusetts 79,405 78,484Michigan 128,585 129,776Minnesota 70,618 70,624Mississippi 41,562 42,827Missouri 78,591 77,765Montana 11,526 11,519Nebraska 26,446 26,332Nevada 34,780 35,200New Hampshire 14,198 14,565
New Jersey 112,232 115,253New Mexico 27,798 28,384New York 251,562 249,947North Carolina 120,588 119,847North Dakota 9,408 8,189Ohio 149,481 148,954Oklahoma 50,223 51,306Oregon 46,454 45,678Pennsylvania 144,498 144,748Rhode Island 13,582 12,779
South Carolina 54,232 56,590South Dakota 11,803 11,338Tennessee 84,855 79,642Texas 387,337 381,293Utah 51,835 50,670Vermont 6,262 6,599Virginia 101,826 103,933Washington 81,390 81,747West Virginia 21,305 20,880Wisconsin 69,014 70,146Wyoming 6,326 6,807
Births occurring to US territorial residents `Puerto Rico - 51127Virgin Islands - 1574Guam - 3410American Samoa - 1714Northern Marianas - 1355
--- Data not available.1/ Excludes data for the territories and foreign residents

Table C. Lower and upper 95 percent and 96 percent confidence limit factors for a birth rate based on a Poisson variable of 1 through 99 births, B
B L(1- a=.95,B ) U(1- a =.95,B ) L(1- a =.96,B ) U(1- a =.96,B )
1 0.02532 5.57164 0.02020 5.833922 0.12110 3.61234 0.10735 3.758303 0.20622 2.92242 0.18907 3.028044 0.27247 2.56040 0.25406 2.645105 0.32470 2.33367 0.30591 2.405406 0.36698 2.17658 0.34819 2.239407 0.40205 2.06038 0.38344 2.116668 0.43173 1.97040 0.41339 2.021649 0.45726 1.89831 0.43923 1.94553
10 0.47954 1.83904 0.46183 1.8829711 0.49920 1.78928 0.48182 1.8304712 0.51671 1.74680 0.49966 1.7856613 0.53246 1.71003 0.51571 1.7468814 0.54671 1.67783 0.53027 1.7129215 0.55969 1.64935 0.54354 1.6828916 0.57159 1.62394 0.55571 1.6561017 0.58254 1.60110 0.56692 1.6320318 0.59266 1.58043 0.57730 1.6102419 0.60207 1.56162 0.58695 1.5904220 0.61083 1.54442 0.59594 1.5723021 0.61902 1.52861 0.60435 1.5556322 0.62669 1.51401 0.61224 1.5402623 0.63391 1.50049 0.61966 1.5260224 0.64072 1.48792 0.62666 1.5127825 0.64715 1.47620 0.63328 1.5004326 0.65323 1.46523 0.63954 1.4888827 0.65901 1.45495 0.64549 1.4780528 0.66449 1.44528 0.65114 1.4678729 0.66972 1.43617 0.65652 1.4582730 0.67470 1.42756 0.66166 1.4492231 0.67945 1.41942 0.66656 1.4406432 0.68400 1.41170 0.67125 1.4325233 0.68835 1.40437 0.67575 1.4248034 0.69253 1.39740 0.68005 1.4174635 0.69654 1.39076 0.68419 1.4104736 0.70039 1.38442 0.68817 1.4038037 0.70409 1.37837 0.69199 1.3974338 0.70766 1.37258 0.69568 1.3913439 0.71110 1.36703 0.69923 1.3855040 0.71441 1.36172 0.70266 1.3799141 0.71762 1.35661 0.70597 1.3745442 0.72071 1.35171 0.70917 1.3693843 0.72370 1.34699 0.71227 1.3644244 0.72660 1.34245 0.71526 1.3596445 0.72941 1.33808 0.71816 1.3550446 0.73213 1.33386 0.72098 1.3506047 0.73476 1.32979 0.72370 1.3463248 0.73732 1.32585 0.72635 1.3421849 0.73981 1.32205 0.72892 1.3381850 0.74222 1.31838 0.73142 1.33431

Table C. Lower and upper 95 percent and 96 percent confidence limit factors for a birth rate based on a Poisson variable of 1 through 99 births, B --Con.
B L(1- a=.95,B ) U(1- a =.95,B ) L(1- a =.96,B ) U(1- a =.96,B )
51 0.74457 1.31482 0.73385 1.3305752 0.74685 1.31137 0.73621 1.3269453 0.74907 1.30802 0.73851 1.3234254 0.75123 1.30478 0.74075 1.3200255 0.75334 1.30164 0.74293 1.3167156 0.75539 1.29858 0.74506 1.3134957 0.75739 1.29562 0.74713 1.3103758 0.75934 1.29273 0.74916 1.3073459 0.76125 1.28993 0.75113 1.3043960 0.76311 1.28720 0.75306 1.3015261 0.76492 1.28454 0.75494 1.2987362 0.76669 1.28195 0.75678 1.2960163 0.76843 1.27943 0.75857 1.2933664 0.77012 1.27698 0.76033 1.2907765 0.77178 1.27458 0.76205 1.2882666 0.77340 1.27225 0.76373 1.2858067 0.77499 1.26996 0.76537 1.2834068 0.77654 1.26774 0.76698 1.2810669 0.77806 1.26556 0.76856 1.2787770 0.77955 1.26344 0.77011 1.2765471 0.78101 1.26136 0.77162 1.2743672 0.78244 1.25933 0.77310 1.2722373 0.78384 1.25735 0.77456 1.2701474 0.78522 1.25541 0.77598 1.2681075 0.78656 1.25351 0.77738 1.2661076 0.78789 1.25165 0.77876 1.2641577 0.78918 1.24983 0.78010 1.2622378 0.79046 1.24805 0.78143 1.2603679 0.79171 1.24630 0.78272 1.2585280 0.79294 1.24459 0.78400 1.2567281 0.79414 1.24291 0.78525 1.2549682 0.79533 1.24126 0.78648 1.2532383 0.79649 1.23965 0.78769 1.2515384 0.79764 1.23807 0.78888 1.2498785 0.79876 1.23652 0.79005 1.2482486 0.79987 1.23499 0.79120 1.2466487 0.80096 1.23350 0.79233 1.2450788 0.80203 1.23203 0.79344 1.2435289 0.80308 1.23059 0.79453 1.2420190 0.80412 1.22917 0.79561 1.2405291 0.80514 1.22778 0.79667 1.2390692 0.80614 1.22641 0.79771 1.2376293 0.80713 1.22507 0.79874 1.2362194 0.80810 1.22375 0.79975 1.2348295 0.80906 1.22245 0.80074 1.2334596 0.81000 1.22117 0.80172 1.2321197 0.81093 1.21992 0.80269 1.2307998 0.81185 1.21868 0.80364 1.2294999 0.81275 1.21746 0.80458 1.22822
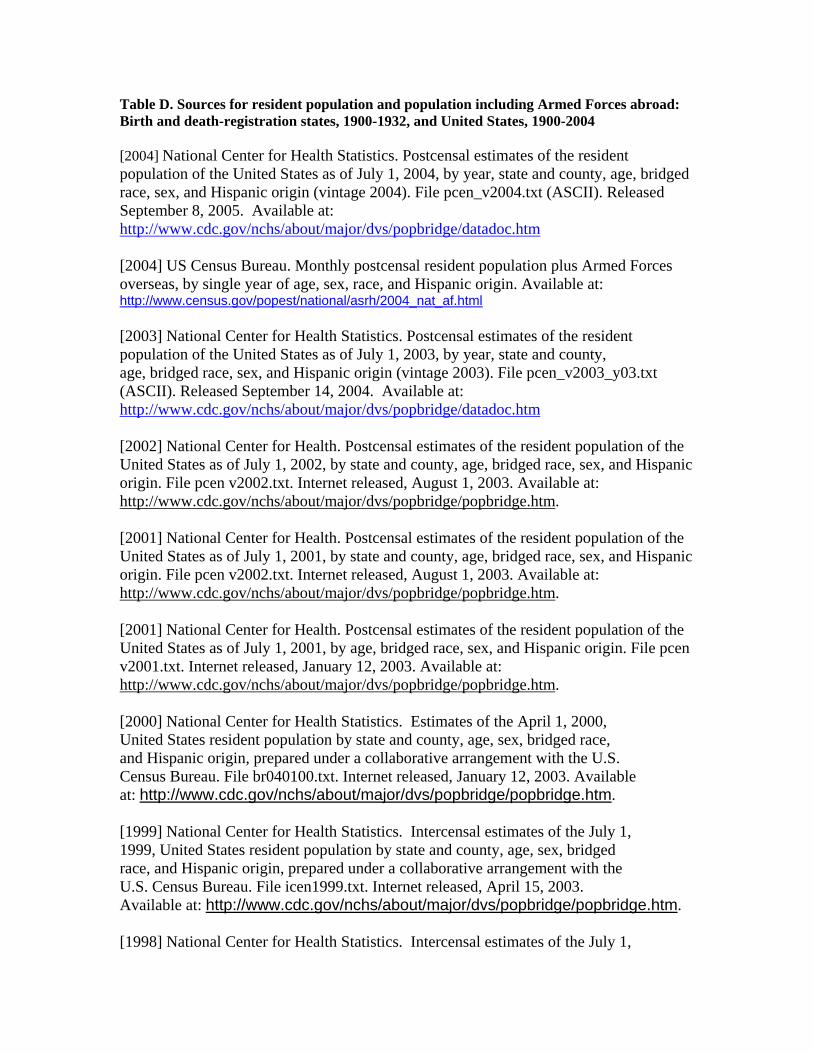
Table D. Sources for resident population and population including Armed Forces abroad: Birth and death-registration states, 1900-1932, and United States, 1900-2004 [2004] National Center for Health Statistics. Postcensal estimates of the resident population of the United States as of July 1, 2004, by year, state and county, age, bridged race, sex, and Hispanic origin (vintage 2004). File pcen_v2004.txt (ASCII). Released September 8, 2005. Available at: http://www.cdc.gov/nchs/about/major/dvs/popbridge/datadoc.htm [2004] US Census Bureau. Monthly postcensal resident population plus Armed Forces overseas, by single year of age, sex, race, and Hispanic origin. Available at: http://www.census.gov/popest/national/asrh/2004_nat_af.html [2003] National Center for Health Statistics. Postcensal estimates of the resident population of the United States as of July 1, 2003, by year, state and county, age, bridged race, sex, and Hispanic origin (vintage 2003). File pcen_v2003_y03.txt (ASCII). Released September 14, 2004. Available at: http://www.cdc.gov/nchs/about/major/dvs/popbridge/datadoc.htm [2002] National Center for Health. Postcensal estimates of the resident population of the United States as of July 1, 2002, by state and county, age, bridged race, sex, and Hispanic origin. File pcen v2002.txt. Internet released, August 1, 2003. Available at: http://www.cdc.gov/nchs/about/major/dvs/popbridge/popbridge.htm. [2001] National Center for Health. Postcensal estimates of the resident population of the United States as of July 1, 2001, by state and county, age, bridged race, sex, and Hispanic origin. File pcen v2002.txt. Internet released, August 1, 2003. Available at: http://www.cdc.gov/nchs/about/major/dvs/popbridge/popbridge.htm. [2001] National Center for Health. Postcensal estimates of the resident population of the United States as of July 1, 2001, by age, bridged race, sex, and Hispanic origin. File pcen v2001.txt. Internet released, January 12, 2003. Available at: http://www.cdc.gov/nchs/about/major/dvs/popbridge/popbridge.htm. [2000] National Center for Health Statistics. Estimates of the April 1, 2000, United States resident population by state and county, age, sex, bridged race, and Hispanic origin, prepared under a collaborative arrangement with the U.S. Census Bureau. File br040100.txt. Internet released, January 12, 2003. Available at: http://www.cdc.gov/nchs/about/major/dvs/popbridge/popbridge.htm. [1999] National Center for Health Statistics. Intercensal estimates of the July 1, 1999, United States resident population by state and county, age, sex, bridged race, and Hispanic origin, prepared under a collaborative arrangement with the U.S. Census Bureau. File icen1999.txt. Internet released, April 15, 2003. Available at: http://www.cdc.gov/nchs/about/major/dvs/popbridge/popbridge.htm. [1998] National Center for Health Statistics. Intercensal estimates of the July 1,

1998, United States resident population by state and county, age, sex, bridged race, and Hispanic origin, prepared under a collaborative arrangement with the U.S. Census Bureau. File icen1999.txt. Internet released, April 15, 2003. Available at: http://www.cdc.gov/nchs/about/major/dvs/popbridge/popbridge.htm. [1997] National Center for Health Statistics. Intercensal estimates of the July 1, 1997, United States resident population by state and county, age, sex, bridged race, and Hispanic origin, prepared under a collaborative arrangement with the U.S. Census Bureau. File icen1997.txt. Internet released, April 15, 2003. Available at: http://www.cdc.gov/nchs/about/major/dvs/popbridge/popbridge.htm. [1996] National Center for Health Statistics. Intercensal estimates of the July 1, 1996, United States resident population by state and county, age, sex, bridged race, and Hispanic origin, prepared under a collaborative arrangement with the U.S. Census Bureau. File icen1996.txt. Internet released, April 15, 2003. Available at: http://www.cdc.gov/nchs/about/major/dvs/popbridge/popbridge.htm. [1995] National Center for Health Statistics. Intercensal estimates of the July 1, 1995, United States resident population by state and county, age, sex, bridged race, and Hispanic origin, prepared under a collaborative arrangement with the U.S. Census Bureau. File icen1995.txt. Internet released, April 15, 2003. Available at: http://www.cdc.gov/nchs/about/major/dvs/popbridge/popbridge.htm. [1994] National Center for Health Statistics. Intercensal estimates of the July 1, 1994, United States resident population by state and county, age, sex, bridged race, and Hispanic origin, prepared under a collaborative arrangement with the U.S. Census Bureau. File icen1994.txt. Internet released, April 15, 2003. Available at: http://www.cdc.gov/nchs/about/major/dvs/popbridge/popbridge.htm. [1993] National Center for Health Statistics. Intercensal estimates of the July 1, 1993, United States resident population state and county, by age, sex, bridged race, and Hispanic origin, prepared under a collaborative arrangement with the U.S. Census Bureau. File icen1993.txt. Internet released, April 15, 2003. Available at: http://www.cdc.gov/nchs/about/major/dvs/popbridge/popbridge.htm. [1992] National Center for Health Statistics. Intercensal estimates of the July 1, 1992, United States resident population by state and county, age, sex, bridged race, and Hispanic origin, prepared under a collaborative arrangement with the U.S. Census Bureau. File icen1992.txt. Internet released, April 15, 2003. Available at: http://www.cdc.gov/nchs/about/major/dvs/popbridge/popbridge.htm. [1991] National Center for Health Statistics. Intercensal estimates of the July 1, 1991, United States resident population by state and county, age, sex, bridged race, and Hispanic origin, prepared under a collaborative arrangement with the U.S. Census Bureau. File icen1991.txt. Internet released, April 15, 2003. Available at: http://www.cdc.gov/nchs/about/major/dvs/popbridge/popbridge.htm.
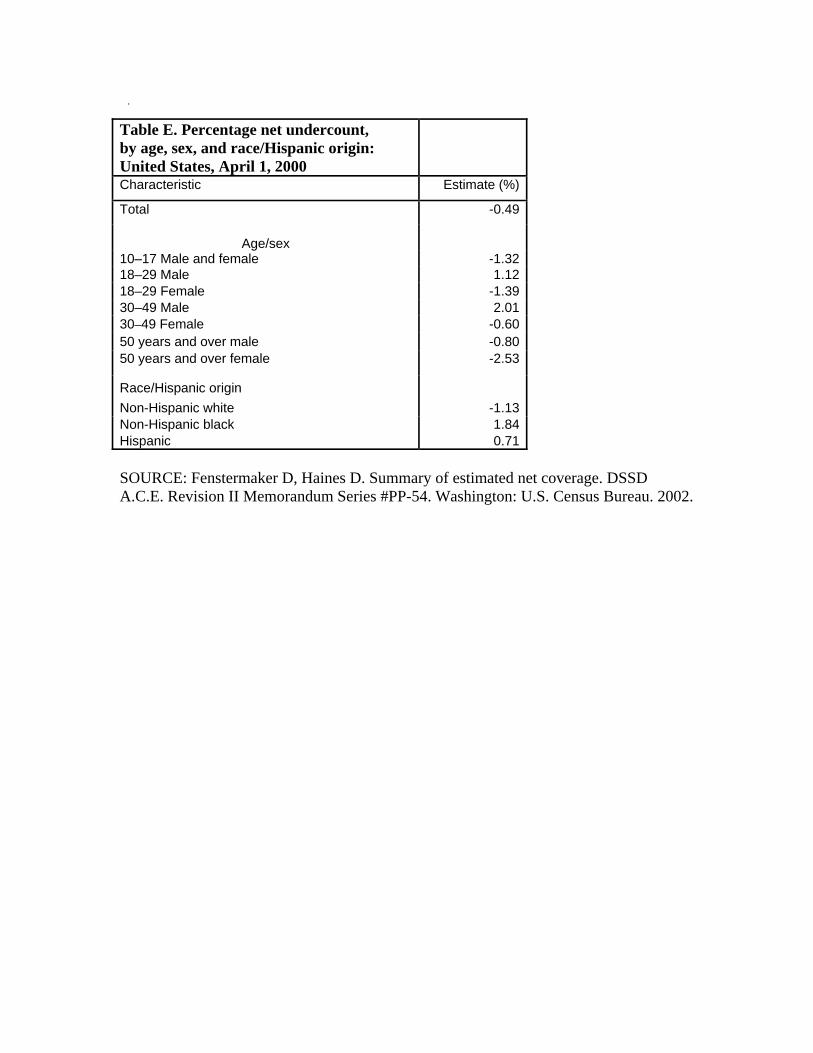
�.
Table E. Percentage net undercount, by age, sex, and race/Hispanic origin: United States, April 1, 2000 Characteristic Estimate (%)
Total -0.49
Age/sex
10–17 Male and female -1.32 18–29 Male 1.12 18–29 Female -1.39 30–49 Male 2.01 30–49 Female -0.60 50 years and over male -0.80 50 years and over female -2.53
Race/Hispanic origin Non-Hispanic white -1.13 Non-Hispanic black 1.84 Hispanic 0.71 SOURCE: Fenstermaker D, Haines D. Summary of estimated net coverage. DSSD A.C.E. Revision II Memorandum Series #PP-54. Washington: U.S. Census Bureau. 2002.

Table 4–1. Population of birth- and death-registration states, 1900–1932,
and United States, 1900–2004 [Population enumerated as of April 1 for 1940, 1950, 1960, 1970, 1980, 1990, and 2000 and estimated as of July 1 for all other years]
United States 1/ United States 1/ Birth-registration States
Death-registration States
Population Population
Population
Year including Armed residing Year including Population Number Population Number Population
Forces abroad in area
Armed Forces abroad
residing in area
of States2/
residing in area
of States2/
residing in area
2004 293,906,517 293,655,404 2003 291,028,156 290,810,789 1950 151,132,000 150,697,361 . . . . . . . . . . . . 2002 288,600,204 288,368,706 1949 149,188,000 148,665,000 . . . . . . . . . . . . 2001 285,024,000 284,796,887 1948 146,631,000 146,093,000 . . . . . . . . . . . . 2000 281,652,000 281,421,906 1947 144,126,000 143,446,000 . . . . . . . . . . . . 1999 279,294,713 279,040,168 1946 141,389,000 140,054,000 . . . . . . . . . . . . 1998 276,115,288 275,854,104 1945 139,928,000 132,481,000 . . . . . . . . . . . . 1997 272,911,760 272,646,925 1944 138,397,000 132,885,000 . . . . . . . . . . . . 1996 269,667,391 269,394,284 1943 136,739,000 134,245,000 . . . . . . . . . . . . 1995 266,557,091 266,278,393 1942 134,860,000 133,920,000 . . . . . . . . . . . . 1994 263,435,673 263,125,821 1941 133,402,000 133,121,000 . . . . . . . . . . . . 1993 260,255,352 259,918,588 1940 131,820,000 131,669,275 . . . . . . . . . . . . 1992 256,894,189 256,514,224 1939 131,028,000 130,879,718 . . . . . . . . . . . . 1991 253,492,503 252,980,941 1938 129,969,000 129,824,939 . . . . . . . . . . . . 1990 249,225,000 248,709,873 1937 128,961,000 128,824,829 . . . . . . . . . . . . 1989 247,342,000 246,819,000 1936 128,181,000 128,053,180 . . . . . . . . . . . . 1988 245,021,000 244,499,000 1935 127,362,000 127,250,232 . . . . . . . . . . . . 1987 242,804,000 242,289,000 1934 126,485,000 126,373,773 . . . . . . . . . . . . 1986 240,651,000 240,133,000 1933 125,690,000 125,578,763 . . . . . . . . . . . . 1985 238,466,000 237,924,000 1932 124,949,000 124,840,471 47 118,903,899 47 118,903,899 1984 236,348,000 235,825,000 1931 124,149,000 124,039,648 46 117,455,229 47 118,148,987 1983 234,307,000 233,792,000 1930 123,188,000 123,076,741 46 116,544,946 47 117,238,278 1982 232,188,000 231,664,000 1929 121,769,939 46 115,317,450 46 115,317,450 1981 229,966,000 229,466,000 1928 120,501,115 44 113,636,160 44 113,636,160 1980 227,061,000 226,545,805 1927 119,038,062 40 104,320,830 42 107,084,532 1979 225,055,000 224,567,000 1926 117,399,225 35 90,400,590 41 103,822,683 1978 222,585,000 222,095,000 1925 115,831,963 33 88,294,564 40 102,031,555 1977 220,239,000 219,760,000 1924 114,113,463 33 87,000,295 39 99,318,098 1976 218,035,000 217,563,000 1923 111,949,945 30 81,072,123 38 96,788,197 1975 215,973,000 215,465,000 1922 110,054,778 30 79,560,746 37 92,702,901 1974 213,854,000 213,342,000 1921 108,541,489 27 70,807,090 34 87,814,447

1973 211,909,000 211,357,000 1920 106,466,420 23 63,597,307 34 86,079,263 1972 209,896,000 209,284,000 1919 105,063,000 104,512,110 22 61,212,076 33 83,157,982 1971 207,661,000 206,827,000 1918 104,550,000 103,202,801 20 55,153,782 30 79,008,412 1970 204,270,000 203,211,926 1917 103,414,000 103,265,913 20 55,197,952 27 70,234,775 1969 202,677,000 201,385,000 1916 101,965,984 11 32,944,013 26 66,971,177 1968 200,706,000 199,399,000 1915 100,549,013 10 31,096,697 24 61,894,847 1967 198,712,000 197,457,000 1914 99,117,567 . . . . . . 24 60,963,309 1966 196,560,000 195,576,000 1913 97,226,814 . . . . . . 23 58,156,740 1965 194,303,000 193,526,000 1912 95,331,300 . . . . . . 22 54,847,700 1964 191,889,000 191,141,000 1911 93,867,814 . . . . . . 22 53,929,644 1963 189,242,000 188,483,000 1910 92,406,536 . . . . . . 20 47,470,437 1962 186,538,000 185,771,000 1909 90,491,525 . . . . . . 18 44,223,513 1961 183,691,000 182,992,000 1908 88,708,976 . . . . . . 17 38,634,759 1960 179,933,000 179,323,175 1907 87,000,271 . . . . . . 15 34,552,837 1959 177,264,000 176,513,000 1906 85,436,556 . . . . . . 15 33,782,288 1958 174,141,000 173,320,000 1905 83,819,666 . . . . . . 10 21,767,980 1957 171,274,000 170,371,000 1904 82,164,974 . . . . . . 10 21,332,076 1956 168,221,000 167,306,000 1903 80,632,152 . . . . . . 10 20,943,222 1955 165,275,000 164,308,000 1902 79,160,196 . . . . . . 10 20,582,907 1954 162,391,000 161,164,000 1901 77,585,128 . . . . . . 10 20,237,453 1953 159,565,000 158,242,000 1900 76,094,134 . . . . . . 10 19,965,446 1952 156,954,000 155,687,000 1951 154,287,000 153,310,000
- - - Data not available. ... Category not applicable. 1/ Alaska included beginning 1959 and Hawaii, 1960. 2/
The District of Columbia is not included in "Number of States," but it is represented in all data shown for each year.
SOURCE: Published and unpublished data from the U.S. Census Bureau; see text and table D.

Table 4-2. Estimated total population by race, and estimated female population by age and race: United States, 2004
[Populations estimated as of July 1]
Asian orAmerican Pacific
Age All races White Black Indian Islander
Total population 293,655,404 238,268,102 38,600,765 3,148,484 13,638,053
Female population
15-44 years 62,033,402 48,758,090 9,115,649 745,279 3,414,38410-14 years 10,314,017 7,970,814 1,749,557 149,173 444,47315-19 years 10,094,408 7,882,326 1,623,541 146,719 441,822 15-17 years 6,074,126 4,730,761 991,660 88,794 262,911 18-19 years 4,020,282 3,151,565 631,881 57,925 178,91120-24 years 10,168,314 7,948,811 1,569,086 137,971 512,44625-29 years 9,566,092 7,424,518 1,427,396 115,539 598,63930-34 years 10,129,814 7,877,175 1,458,754 111,792 682,09335-39 years 10,481,803 8,290,818 1,472,528 111,698 606,75940-44 years 11,592,971 9,334,442 1,564,344 121,560 572,62545-49 years 11,204,882 9,126,191 1,442,853 111,542 524,296
NOTES: These population counts are estimated based on the 2000 census; see "Technical Notes." Race categories are consistent with the 1977 Office of Management and Budget (OMB) standards. The multiple-race population estimates were bridged to the single race categories of the 1977 OMB standards for comparability with the birth data; see "Technical Notes."
SOURCE: U.S. Census Bureau. See reference 41.

[Populations estimated as of July 1]
Hispanic Non-HispanicOther
Age Total Mexican Puerto Rican Cuban Hispanic1 Total2 White Black
Total population 41,322,073 27,239,634 3,796,668 1,615,256 8,670,410 252,333,331 199,775,516 36,921,613
Female population15-44 years 9,675,716 6,342,530 895,458 280,672 2,157,027 52,357,686 39,792,952 8,690,96010-14 years 1,849,239 1,287,209 192,908 47,645 321,475 8,464,778 6,270,957 1,661,36715-19 years 1,610,907 1,063,976 169,131 36,712 341,085 8,483,501 6,398,834 1,550,705 15-17 years 978,802 643,799 101,899 25,850 207,252 5,095,324 3,830,286 946,674 18-19 years 632,105 420,177 67,232 10,862 133,833 3,388,177 2,568,548 604,03120-24 years 1,692,204 1,152,713 140,572 32,568 366,353 8,476,110 6,383,764 1,495,43125-29 years 1,746,376 1,187,946 149,086 42,753 366,575 7,819,716 5,804,787 1,350,32230-34 years 1,707,611 1,143,451 149,322 46,282 368,555 8,422,203 6,289,881 1,384,30335-39 years 1,531,559 958,065 144,142 61,685 367,660 8,950,244 6,868,928 1,405,37740-44 years 1,387,059 836,379 143,205 60,672 346,799 10,205,912 8,046,758 1,504,82245-49 years 1,124,013 632,549 121,460 53,200 316,809 10,080,869 8,082,874 1,394,156
SOURCE: U.S. Census Bureau. See reference 44.
Table 4-3. Estimated total population by specified Hispanic origin and estimated female population by age and specified Hispanic origin and by race for women of non-Hispanic origin: United States, 2004
1 Includes Central and South American and other and unknown Hispanic.2 Includes races other than white and black.
NOTES: These population counts are estimated based on the 2000 census; see "Technical Notes." Race categories are consistent with the 1977 Office of Management and Budget (OMB) standards. The multiple-race population estimates were bridged to the single race categories of the 1977 OMB standards for comparability with the birth data; see "Technical Notes."

0

4-4. Estimated total population and female population aged 15-44 years: United States, each state, and territory: July 1, 2004
Geographic area Total population Females15-44 yearsUnited States 293,655,404 62,033,402
Alabama 4,530,182 953,205Alaska 655,435 138,894Arizona 5,743,834 1,178,796Arkansas 2,752,629 564,382California 35,893,799 7,737,852Colorado 4,601,403 995,583Connecticut 3,503,604 715,420Delaware 830,364 178,248District of Columbia 553,523 136,276Florida 17,397,161 3,401,004Georgia 8,829,383 1,980,901Hawaii 1,262,840 247,068Idaho 1,393,262 291,644Illinois 12,713,634 2,711,823Indiana 6,237,569 1,300,718Iowa 2,954,451 602,688Kansas 2,735,502 568,540Kentucky 4,145,922 875,838Louisiana 4,515,770 980,207Maine 1,317,253 266,261Maryland 5,558,058 1,197,939Massachusetts 6,416,505 1,389,346Michigan 10,112,620 2,112,016Minnesota 5,100,958 1,095,018Mississippi 2,902,966 627,018Missouri 5,754,618 1,209,678Montana 926,865 183,589Nebraska 1,747,214 362,935Nevada 2,334,771 484,917New Hampshire 1,299,500 272,632New Jersey 8,698,879 1,796,444New Mexico 1,903,289 394,725New York 19,227,088 4,119,291North Carolina 8,541,221 1,814,855North Dakota 634,366 129,654Ohio 11,459,011 2,375,500Oklahoma 3,523,553 730,010Oregon 3,594,586 738,861Pennsylvania 12,406,292 2,493,556Rhode Island 1,080,632 232,239South Carolina 4,198,068 889,545South Dakota 770,883 156,547Tennessee 5,900,962 1,255,897Texas 22,490,022 4,929,807Utah 2,389,039 549,253
Page 1

Vermont 621,394 126,655Virginia 7,459,827 1,599,066Washington 6,203,788 1,324,693West Virginia 1,815,354 357,916Wisconsin 5,509,026 1,156,113Wyoming 506,529 102,339
Puerto Rico 3,894,855 853,843Virgin Islands 108,775 22,581Guam 166,090 37,124American Samoa 57,902 12,946Northern Marianas 78,252 31,112
Source: National Center for Health Statistics. Unpublished estimates of the July 1, 2004,United States population by age, sex, race, and Hispanic origin, prepared under acollaborative arrangement with the U.S. Census Bureau, 2004.
Page 2