Vital Signs Crop Yield Measurement 0.3 - Amazon S3 · · 2017-04-20Vital Signs Crop Yield...
30
Vital Signs Crop Yield Measurement 0.3.2 1 Vital Signs Protocol Maize Yield Measurements and Farm Field Soil Sampling Version 1.1 May 2014
Transcript of Vital Signs Crop Yield Measurement 0.3 - Amazon S3 · · 2017-04-20Vital Signs Crop Yield...

Vital Signs Crop Yield Measurement 0.3.2
1
Vital Signs Protocol
Maize Yield Measurements
and Farm Field Soil Sampling
Version 1.1
May 2014

Vital Signs Crop Yield Measurement 0.3.2
2
ACKNOWLEDMENTS
Table of Contents
Contents
1 Introduction
1.1 Definitions of Key Technical Terms
1.2 Standard Conventions Used in this Document
2 ROLES AND RESPONSIBILITIES
3 EQUIPMENT LIST
4 FIELD SELECTION
4.1 Selection of Major Staple Crop Field for Soil Sampling
4.2 Random selection of crop fields for crop harvest:
4.2.1 Example Selection of a Field for Soil Sampling
5 QUESTIONS FOR SELECTED FIELDS
6 IN-FIELD MEASUREMENTS
6.1 Random placement of sampling quadrants in selected fields
6.2 Size of the quadrant

Vital Signs Crop Yield Measurement 0.3.2
3
6.3 Harvesting and measurements
7 SOIL SAMPLE COLLECTION
8 KEY EDITING CHECKS
9 DRY WEIGHT MEASUREMENTS
1 Introduction
It is important to track crop yields and management practices, as well as the soil health of
the fields, within Vital Signs Landscapes using scientifically rigorous and robust tools and
methodologies. The data obtained from farmers’ reports of yields from household surveys
serve as once estimate but can often be unreliable due to problems with estimates of field
areas or the crop harvest from specific fields. These self-reported estimates serve as a
complement to the Vital Signs crop harvest sampling and farm field area measurements. The objective of this protocol is to provide guidelines for field selection and random
placement of the sampling quadrant that provide an unbiased estimate of crop yields. In
addition, instructions for sampling the top soil within the harvested area are provide that
will allow a comparison of soil fertility and crop yields.
Three to five major crops will be selected for yield estimates within each of the landscapes
– the selection should be based on a few criteria – the % of farmers growing the crop; the
area devoted to that crop; and importance to income generation from ag-business activities.
This list will be developed for each landscape after consulting the teams and reviewing
previous agricultural surveys completed in the area.
1.1 Definitions of Key Technical Terms
1.2 Standard Conventions Used in this Document
The following conventions are used throughout this document:

Vital Signs Crop Yield Measurement 0.3.2
4
● The use of bold in the text indicates a critical point. Please pay special attention to
terms, sentences and paragraphs marked in bold as they are key to the
understanding of the protocol.
2 ROLES AND RESPONSIBILITIES
The following table introduces the roles and responsibilities of the members of a Vital
Signs field team:
Role Responsibility
Country Director
● Supports team with a complete understanding of the
protocol manual ● Trains technicians
● Leads technicians in fieldwork and sampling, and
assists with measurements as required
Technical Manager
● Supervises teams
● Assist with field selection for crop harvest as
required ● Ensures equipment is well-managed and team is
safe ● Ensures consistency and quality of measurements
● Ensures data are uploaded to the VS server daily (or
weekly if internet access is limited)
● Ensures back-ups and data entry sheets are properly
archived
Enumerators
● Selects fields for harvest estimates based on the
detailed protocol
● Conducts crop yield harvests
● Conducts short questionnaire on field management.
● Takes soil sample for area of harvest
● Enter and uploads data
● Prepares soil sample for drying
● Clean and store equipment
Africa Field Director
● Helps train technicians and ensures consistency of
protocol implementation across Vital Signs
countries
● Reviews data when uploaded ● Approves protocol updates and sends out update
notifications to field teams
Protocol Manager ● Receives and archives comments about the protocol
from the field team

Vital Signs Crop Yield Measurement 0.3.2
5
● Updates and re-circulates the protocol
3 EQUIPMENT LIST
The following equipment is required to carry out the activities described in this crop
harvest and farm field soil sampling manual. Before traveling to the field to carry out
sampling, use this list to ensure you have all the equipment needed for the day.
If a tablet is been used to record data, at least one on-site backup to a laptop and,
preferably, at least one off-site backup should be made at the end of each day.

Vital Signs Crop Yield Measurement 0.3.2
6
Vital Signs Crop Yield Measurement 0.3.2
7
4 FIELD SELECTION
For each household that has been enumerated using the Agricultural Management survey,
at most two fields for the specific crop in question will be selected per household for crop
yield measurements. The fields will be selected based on the field roster and farm sketch
from the Agriculture Management survey that was already completed for each household.
The enumerator will discuss with the farmer each of the fields mentioned in the roster and
map to find out:
● if any of those fields are currently planted with (the crop of interest for the harvest
exercise; eg. for May-July in the SAGCOT region we will be interested in maize
and/or paddy rice. ● It the crop(s) of interest are in the fields, are the ready to harvest or 2 to 4 weeks
before harvest time. If the crop of interest is not currently found on any of the households’ fields, then no crop
yields will be measured for that household.
If 1 or 2 fields are present that currently have the crop of interest and the crop is ready for
harvest, then both are measured.
If more than 2 are measured, the random number table will be used to randomly select two
fields for harvesting.
4.1 Selection of Major Staple Crop Field for Soil Sampling
To select the first field for crop harvest and soil sampling, the enumerator must discuss
with the farmer, or any household member knowledgeable of all the farm fields, to fill in
the new survey on Crop Yield estimates. This will require looking at the previously
completed Agriculture Management Survey for that household.
Question 1: WHAT IS THE FIELD NAME IN THE AGRICULTURAL MANAGEMENT
SURVEY?
● The first column lists field ID’s (M1 – M8). If the Agricultural Management
survey is available, turn to Section 2 “FIELD ROSTER”, and fill in the names
of each of the fields.
Question 2: Is this field size larger than 100 m2? (or 0.025 acres)
The enumerator determines if the field is larger than 100 m2 (0.025 acres). The enumerator
should reference the agriculture survey, Section 2, FIELD ROSTER, Question 3, AREA
(ACRES) FARMER'S ESTIMATE. If the field is larger than 0.025 acres, this question
should be marked ‘1.’ If not, it should be marked ‘2,’ and the enumerator should move on
to the NEXT FIELD.
Question 3: Is maize cultivated in this field during the CURRENT Season?

Vital Signs Crop Yield Measurement 0.3.2
8
The crop for this question may vary by each landscape. We ask about current activity on
the field. Mark a ‘1’ (for yes) if the field currently contains the given crop. Mark ‘2’ (for
no) otherwise.
Question 4: Is the maize ready for harvest or at least 2 to 4 weeks before harvest?
Mark a ‘1’ (for yes) if the field is ready to be harvested. Mark a ‘2’ (for now) if:
● The crop has already been completed harvested ● The crop is more than one month from harvest time.
Question 5: Is this field eligible for testing?
The enumerator should refer back to the responses for questions 2, 3, and 4. Mark ‘1’ in
question 5 if both:
● Question 2, 3, and 4 are marked ‘1’
Question 6: Is this field selected for testing?
Recall that only two fields will be selected for testing. Refer to the responses to Question 5:
● If no field is marked with a ‘1’ in Question 5, no crop yield estimates will be
conducted at the household ● If 1 or 2 fields are marked with a ‘1’ in Question 5, then mark the fields with a
‘1’ in Question 6. All fields will be selected for crop yield measurements ● If more than 3 fields are marked with a ‘1’ in Question 5, then two fields will be
randomly selected. Follow the process outlined below for the random selection.
4.2 Random selection of crop fields for crop harvest:
The cultivated fields marked with “1” in Question 5 are eligible for selection.
● In order to select the two fields for harvest you will need to have a random
number table with you (provided by the supervisor, example in Appendix 1) and
follow the instructions below.
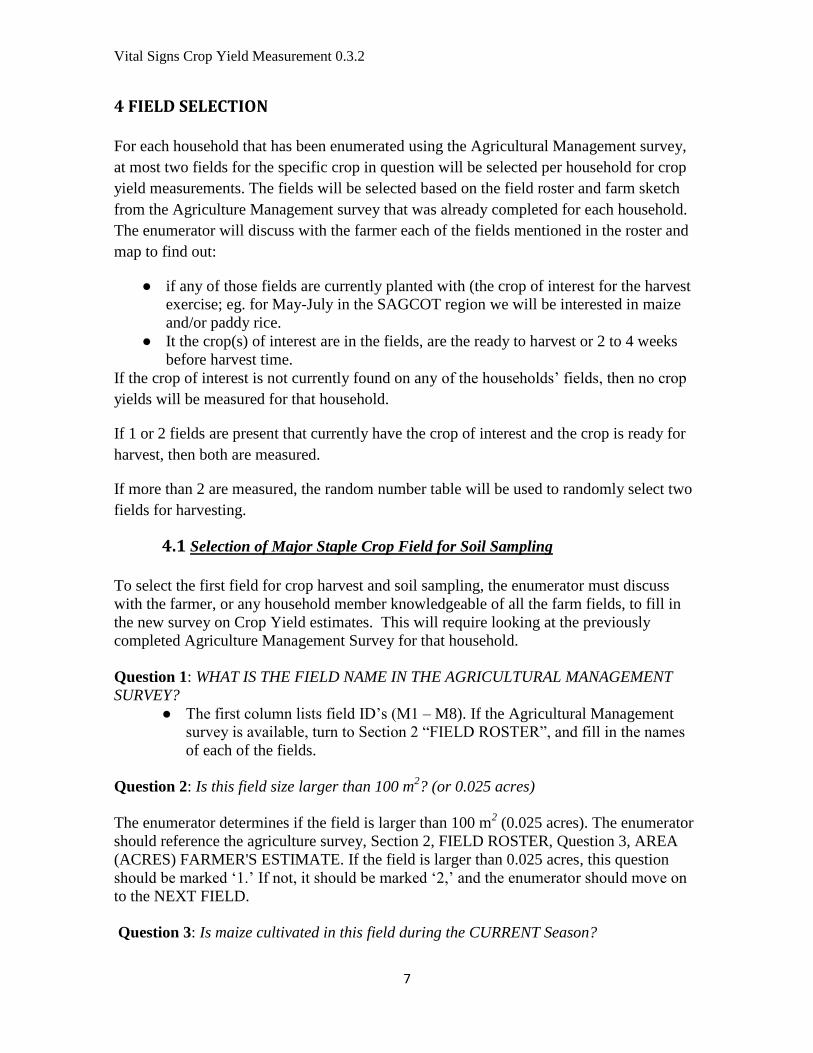
4.2.1 Example Selection of a Field for Soil Sampling
The fields eligible for the first field selection are chosen from those that are larger than 100
m^2 (Question 2), crop cultivated in the current season (Question 3) and ready for harvest
(Question 4).
In this example, there are five fields (Main, River, Forest, House, Other) and all are larger
than 100 m^2. Maize is grown in all fields except for the main field, and the house field is
more than one month away from being harvested. In this scenario, Question 2 should be
marked with a ‘1’ for all fields, and Question 3 should be marked with a ‘2’ for the main

Vital Signs Crop Yield Measurement 0.3.2
9
field, and a ‘1’ for all others. Question 4 should be marked ‘2’ for the house field, and a ‘1’
for the river, forest, and other field (Question 4 may be left blank for the main field).
Finally, we mark all the eligible first fields for selection (Question 5). As there are more
than two fields that have been marked as eligible, we must randomly select which fields to
select.
Use the random number table provided by the supervisor, starting with the first row. To
select the field(s), look for the first number in the random number table that matches the
field ID number of the eligible fields. In this example, the only eligible fields are M2, M3,
and M4. The first number that matches is number 4 – this field will be selected for crop
harvests. 9 4 1 4 3 2
Next, we select the second field for testing from the remaining eligible fields. Looking at
the random number table and starting again from left to right, number 4 is the first number
that matches the field ID number of one of the fields.
9 4 1 4 3 2
However, we have already selected field 4, so we cross out that number and continue on
the number line. Number 3 is the next number, so field M3 will also be selected.
9 4 1 4 3 2
Vital Signs Crop Yield Measurement 0.3.2
10
FIELD ID 1
WHAT IS THE FIELD NAME IN THE AGRICULTURAL MANAGEMENT SURVEY?
2
Is this field size larger than 100 m2? (or 0.025 acres)
3
Is MAIZE cultivated during the Current Season?
4
Is the MAIZE ready for harvest or at least 2 to 4 weeks before harvest?
5
Is this field
eligible for YIELD
MEASUREMENT
?
MARK WITH “1”
IF ELIGIBLE
6
Is this field
selected for
YIELD
MEASUREMENT
?
MARK WITH “1” IF SELECTED
M1 Main Field 1 2
M2 Field by the River 1 1 1 1
M3 Field by the forest 1 1 1 1 1
M4 Other field 1 1 1 1 1
M5 House Field 1 1 2
M6
M7
M8

Vital Signs Crop Yield Measurement 0.3.2
11
5 QUESTIONS FOR SELECTED FIELDS
At this point, there are three possible scenarios. Follow the instructions for each:
● No fields have been selected. At this point, the survey is complete. ● One field has been selected. Proceed with filling out sections B, C, CC, and D
for the field and continuing with the crop yield measurement. ● Two fields have been selected. Proceed with filling out sections B, C, CC, and
D and continuing with the crop yield measurement for the first field. Get
another Maize Yield Measurement Entry Form, and proceed with sections B,
C, CC, and D for the second field.
If two fields are selected, make sure to label each page in the upper right hand
corner with the appropriate field ID.
For each of the two fields that have been selected for crop harvest, ask the following
questions in Section B, Field Characteristics.
Question 1: Field ID
Write down the Field ID of the selected field in Section B, Field Characteristics. For
example, if in the previous section, field ‘m3’ is marked a ‘1’ in Question 7, then write
‘m3’ in Field ID in Section B. Write down the field ID in the upper right hand corner of
each subsequent page.
Q103: Name of the variety: record the name of the variety, being as specific as possible. Ideally this would be as distinct as the variety (for example a cultivar name + number for an improved seed type, or a local name for local seeds). Probing may be necessary to get a distinct name (asking where the seeds were bought from, coordinating with local ag extension agents to get a sense of what seed varieties have been used in the area, etc)
Q103A: Type of seed used: traditional, local seeds are seeds obtained locally and
normally of local varieties. They can be own seeds or obtained e.g., from neighbors. They
are the most commonly sown/planted. Hybrid/improved seeds are mostly sold in shops.
Make the distinction newly improved seeds (“2=New improved seeds”), bought
specifically for the new season, and improved seeds that were saved from a precedent
season (“3=Saved/recycled improved seeds”).
Q106: Planting data: ask the farmer what was the planting date of the designated variety
on his field. If the farmer does not recall the exact day, ask the farmer if this happened
rather at the “beginning”, in the “middle” or at the “end of the month”. In the “DAY”
section, write down 1 for the beginning of the month, 15 for the middle of the month, and

Vital Signs Crop Yield Measurement 0.3.2
12
30 for the end of the month. If the farmer still has no idea, write “ 90” in the “DAY”
section for “Don’t know”.
Q107 to Q115 deal with the use of inorganic fertilizers such as DAP, Urea, etc. for basal
application.
Q107: Basal fertilizer application: ask farmers if they used inorganic fertilizer on the field
during this last growing season as a basal application.
Q109: Type of basal fertilizer: ask the respondent what type of inorganic fertilizer was
applied. Select all that apply. For instance, if the farmer used 100 Kg of NPK and 50 Kg of
Urea as basal fertilizer, circle both of them in Q109.
Q110: Amount of basal fertilizer applied (Kg): record the total quantity of basal fertilizer
that the household used on this specific field only during the reference period. First,
report the fertilizer code used in Q109 (for instance “423” for NPK and “422” for Urea).
Then ask for the amount of fertilizer applied (for 100 Kg for NPK and 50 Kg for Urea). Use
Kg as the unit of measure; convert other measures such as bags, tins, etc. into Kg.
Important note: It is critical that the enumerator record the quantities of fertilizer
specifically used on this field only (as opposed to the total quantity used at farm field or
farm level, which would inflate erroneously fertilizer application rates).
Q112 to Q116 repeat the previous questions for a possible second type of inorganic
fertilizer that was used for topdressing.
Q117 to Q121 repeat the previous questions for a possible organic fertilizer. Organic fertilizers are fertilizers from animal waste products and crop residue/compost.
Q122/Q122B/Q123/Q124: Weeding management: ask the farmer if they weeded, what
technique they used, and how many times they weeded. Note that chemical weeding
includes both herbicides used to kill weeds and other unwanted plants that grow on the
field as well as fungicides, used to kill fungus that might grow on plants. If the farmers
didn’t weed, ask why.
Q125: 75% flowering: ask the farmer the approximate date of 75% flowering on the field,
as best as possible. If the farmer does not recall the exact day, ask the farmer if this
happened rather at the “beginning”, in the “middle” or at the “end of the month”. In the
“DAY” section, write down 1 for the beginning of the month, 15 for the middle of the

Vital Signs Crop Yield Measurement 0.3.2
13
month, and 30 for the end of the month. If the farmer still has no idea, write “ 90” in the
“DAY” section for “Don’t know”.
Q126: Stand quality: ask the farmer about the quality of its crop stand (whether they are
expecting a poor, average or excellent yield based on the appearance of the crop stand.
If the response to Q126 is ‘1 = poor’, ASK QUESTIONS Q126A AND Q126B
Q126A, ask what is the PRIMARY contributing factor to the poor stand quality. SELECT
ONE from:
● pests ● insufficient rainfall ● too much rainfall ● weeds ● low soil fertility/other soil problems ● Other (specify)
Q126B, SELECT ALL contributing factors to the poor crop stand from (including the answer
to Q126A):
● pests ● insufficient rainfall ● too much rainfall ● weeds ● low soil fertility/other soil problems ● Other (specify) ● Other (specify)
Q127. Percentage of field area devoted to the main crop: this question attempts to
determine how much of the field is assigned or devoted to the main crop or crop of
interest. The area of cultivation may be different than the field size reported in the
AGRICULTURAL MANAGEMENT SURVEY. Using the original recorded field size, indicate
how much of the field has been cultivated with the crop. This percentage may be above
100% if the crop cultivation area has expanded beyond the original field dimensions as
recorded in the AGRICULTURAL MANGEMENT SURVEY.
Q128: Estimates of the crop production in the field (current season): ask the farmer to
evaluate, as best as possible, the total quantity (kg) of the designated crop he is planning
to harvest on the field, for this season.
Q128A: Intercropping (current season): ask the farmer if this crop is grown by itself, as a
pure stand, or in association with other crops.

Vital Signs Crop Yield Measurement 0.3.2
14
Figure 3 Pure stand vs. intercropped field
Q128B: Crops intercropped with the main crop (current season): if the field is
intercropped, select all other crops that are grown with the main, designated crop.
Q128C. Percentage of field area devoted to the main crop WHEN INTERCROPPED: We
have already asked about how much of the field this question attempts to determine how
much of the field is assigned or devoted to the main crop or crop of interest. In the right
side of Figure 3 (Intercropped Maize and Beans), we are interested in determining the
area
Question 201: Slope
Ask the respondent about the slope of the field. Is it flat, with moderate slope, or with steep slope?
● Flat (<8%) ● Moderate slope (8-22%) ● Steep slope (>22%)
Question 202: Erosion
Erosion refers to the loss of topsoil from rain, wind, animals or people. Indicate yes if all or some of the field is suffering from erosion.
Are there visible signs of soil erosion (sheet, rill or gully)?
Soil erosion: ● 1 None
● 2 Slight
● 3 Moderate
● 4 Severe
Ask the respondent if he is using any methods to prevent erosion on the field. Also ask about the main method used to protect the field from erosion and record the code.

Vital Signs Crop Yield Measurement 0.3.2
15
Question 203: Surface condition score (0-10)
This question is derived from the soil condition questions for the E-plot sampling but instead of applying it to a one meter quadrat apply it to the circular plot (Figure 2) from which the four soil samples are taken. Please indicate the cover of each in the circular plot, where 1=10%, 2=20%, …, 10=100%. If no cover is present, it should be left blank.
● Rooted plants
● Litter cover
● Downed wood
● Stone or gravel ● Dung
● Disturbed soil (generally means tilled)
● Undisturbed, bare & porous soil ● Undisturbed, bare but sealed soil ● Sodic soil ● Microfloral crust
● Termite mound

Vital Signs Crop Yield Measurement 0.3.2
16
6 IN-FIELD MEASUREMENTS
Because crop harvests will need to be undertaken, only a portion of the field will be
harvested. This portion is called a ‘quadrat’. Follow the instructions below to determine
where to place the quadrat, and how large the quadrant should be.
6.1 Random placement of sampling quadrants in selected fields1
It is impractical to measure the crop yield from the entire field, so a small section of the
field is sampled. This small section is located through random placement of a quadrant,
meaning that the placement of the quadrant should not be biased by the visual inspection
of the field. Only one quadrant will be sampled per field.
For ease of sampling, the quadrat will be placed near the center of the plot. Go the center
of the plot (the same location and method used when taking the GPS coordinates of the
center of the field in the Ag Management Survey).
Once the center point of the field has been reached, the location of the quadrat will be
offset randomly. The offset will be determined by 1) direction and 2) distance.
Direction
At the center of the field, determine the direction by spinning a pencil on the
clipboard. Place the clipboard on the ground. Place the pencil on the center of the
clipboard. Spin the pencil on the clipboard. The pencil will stop spinning and point
towards a direction. This will be the direction to walk towards from the center of the
field.
Distance
Using the random number table, select the first number. Multiply this number by
3. This will be the number of paces to walk.
9 4 1 4 3
8 0 9 4 2
1 Some crops, like onion, cocoa and cassava, will not follow the standard protocol and have instead specific guidelines for the quadrants.

Vital Signs Crop Yield Measurement 0.3.2
17
In the above example, the first line was used for the field selection, so it is skipped. In the
next line, an 8 is the first number. Multiply 8 by 3 to get 24.
From the center of the field, walk to a new point in the field using the direction and
number of paces. If a zero is selected, there is no need to walk any paces. If the edge
of the field reached and you have not completed your pacing, simply turn around and
complete the pacing back towards the center of the field. This point of the field
becomes the quadrat location.
If the quadrat turns out such that either of the conditions below hold – then offset the
quadrat to avoid these conditions.
- There are obstacles in that location such as trees, soil conservation structures,
a rocky surface
- The point is not representative of the main part of the field. For example if a
small section of the field, less than 10% appears to be prone to flooding, has
slope significantly different from the other part of the field; has shallow or
superficial rocky layer such as laterite that is not found in the rest of the field
MAKE SURE THE SAMPLING POINT IS AT LEAST 2 M FROM THE EDGE OF THE FIELD. If it is
not then move the point directly into the field, perpendicular to the field border to the 2
m limit.
Q130.A RECORD THE GPS POINT OF THE SAMPLE LOCATION (Section C: QUADRAT
ESTIMATES)
6.2 Size of the quadrant
The size of the quadrants will vary by crop type and site. For crops with large spacing, the
quadrant size should be increased and for crops with smaller spacing, it should be
reduced. For maize, the quadrant size is 3m x 3m.
6.3 Harvesting and measurements
Utilize the following questions in Section C Quadrant Estimates as you follow the below instructions on measuring out the quadrant and harvest the crop:
Using the twine or measuring tape, mark out the area of the quadrat. Record the size of the quadrant in Question 130A.
Question 130.1 & 130.2: Quadrant estimates (on field, all households)

Vital Signs Crop Yield Measurement 0.3.2
18
The size of the quadrant to measure the MAIZE yields should be 3m X 3m = 9 m2.
Figure 1: Quadrant measured and counting plants
Question 132: What is the number of plants in the sample quadrant?
Within in each quadrant, first count the number of plants in the sample, and record the number in q132.
Q104: Space between ridges (cm): with the measuring tape, measure the distance between ridges. Take these measurements between five different ridges in the field and record the average.
Q105: Space between seeding holes (cm): with the measuring tape, measure the distance between plants. Take these measurements between 4 plants in 5 different rows and record the average.
Important note: make sure to report these distances in centimeters (cm) and not in
inches.
Vital Signs Crop Yield Measurement 0.3.2
19
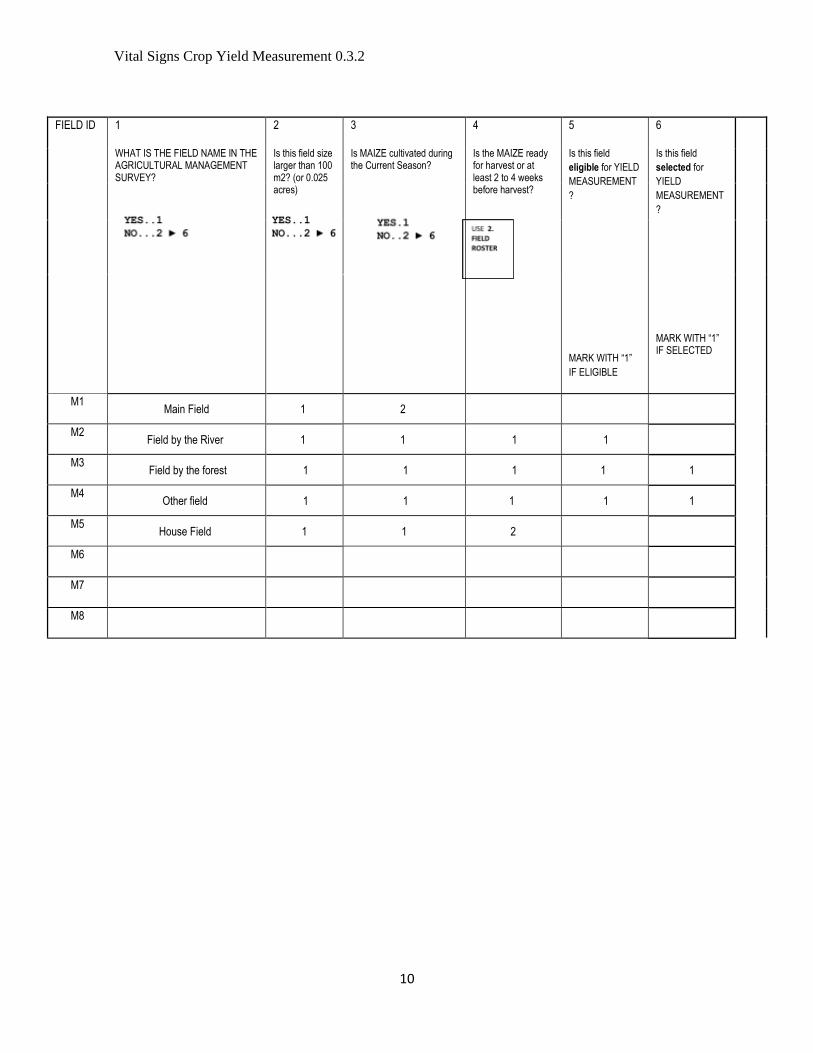
Harvest the entire quadrant area and the cobs/pods by removing them from the stovers [Figure 3]. Count the number of cobs/pods that are harvested, and record the number [Figure 4].
Figure 3 – Harvesting cobs

Vital Signs Crop Yield Measurement 0.3.2
20
Figure 4 – counting the cobs
Question 133: What is the number of cobs/pods in the sample quadrant?
After harvesting all of the cobs, record the number of cobs that had been harvested [Fig 4].
Q134: Total fresh weight of all the cobs in the quadrant:
Remove the cobs from the plants and record the total fresh weight of the cobs. Put the
maize cobs in gunny bags and determine the total cob fresh weight (kg) by weighing using a
suspension balance as in Figure 5.

Vital Signs Crop Yield Measurement 0.3.2
21
Figure 5: Determining total cob fresh weight
Q136: What is the fresh weight of 10 cobs weight (KG)?
Select a representative subsample of 10 cobs and weigh them. The best way to make a
representative subsample is to divide all the cobs in 5 categories according to their size
[Figure 6]. Then take 2 cobs from each category.
Weigh and record the weight of the 10 cobs, by placing them into a manila bag. Note that
the weight of the bag must be known, and subtracted from the weight of the cobs. Not all
10 cobs may fit in the bag, so multiple weighing may be required [Figure 7].

Vital Signs Crop Yield Measurement 0.3.2
22
Figure 6 - Categorizing maize cobs in order to take a representative subsample

Vital Signs Crop Yield Measurement 0.3.2
23
Figure 7: Determining subsample cob-fresh weight
Q137: WHAT IS the fresh weight of grain from 10 cobs composite subsamples THRESHED
(g)?
Thresh the grains from the cobs and record the fresh weight of the rice to the nearest gram . Thresh the grains, being careful not to lose any - a small error in sampling may lead to a large error in calculating the yield.
After recording the fresh weight of grain (Q137), place these grains into the crop sample
bag for drying. Label the crop sample bag with the following information: E-PLOT ID,
HHID, FIELD ID, CROP NAME (eg, MAIZE), AND DATE OF SAMPLING.
Complete the following questions about the crop in the ENTIRE field.
Q138: Pest damage: ask the respondent is the field has suffered from pest damage
(yes/no).
Q139: Other damage: ask the respondent is the field has suffered from animal, theft,
flooding, dry spells or any other damages.
Vital Signs Crop Yield Measurement 0.3.2
24
7 SOIL SAMPLE COLLECTION
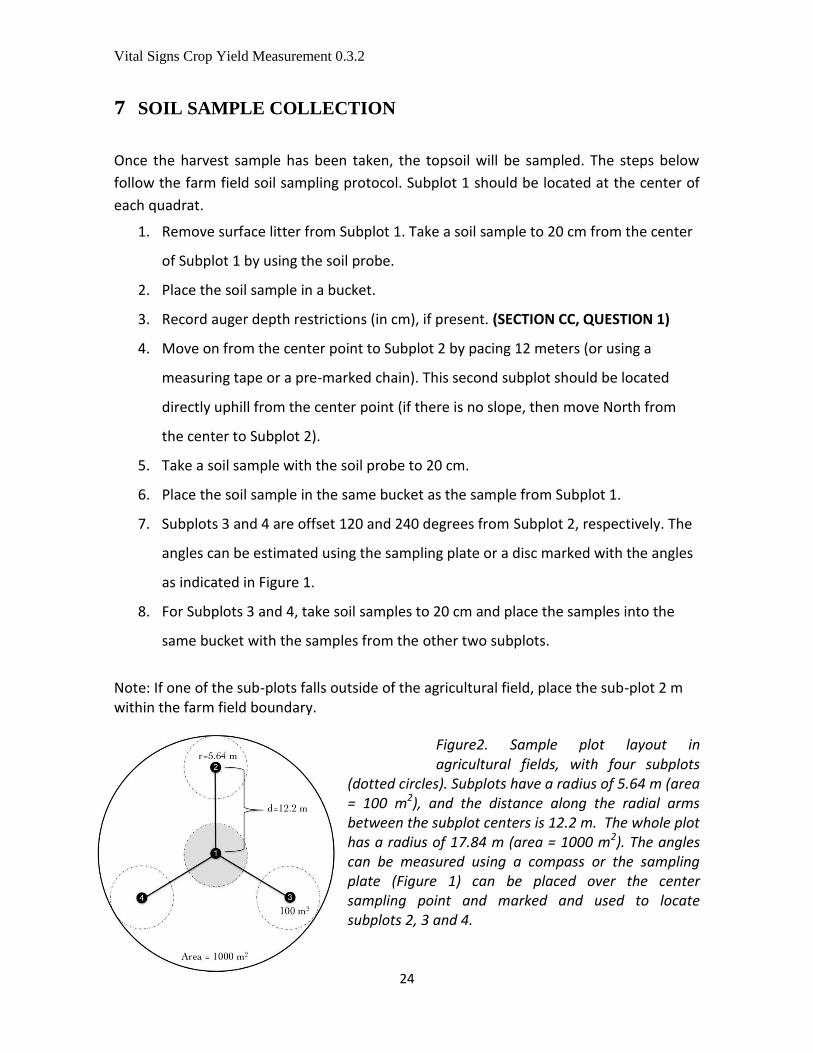
Once the harvest sample has been taken, the topsoil will be sampled. The steps below
follow the farm field soil sampling protocol. Subplot 1 should be located at the center of
each quadrat.
1. Remove surface litter from Subplot 1. Take a soil sample to 20 cm from the center
of Subplot 1 by using the soil probe.
2. Place the soil sample in a bucket.
3. Record auger depth restrictions (in cm), if present. (SECTION CC, QUESTION 1)
4. Move on from the center point to Subplot 2 by pacing 12 meters (or using a
measuring tape or a pre-marked chain). This second subplot should be located
directly uphill from the center point (if there is no slope, then move North from
the center to Subplot 2).
5. Take a soil sample with the soil probe to 20 cm.
6. Place the soil sample in the same bucket as the sample from Subplot 1.
7. Subplots 3 and 4 are offset 120 and 240 degrees from Subplot 2, respectively. The
angles can be estimated using the sampling plate or a disc marked with the angles
as indicated in Figure 1.
8. For Subplots 3 and 4, take soil samples to 20 cm and place the samples into the
same bucket with the samples from the other two subplots.
Note: If one of the sub-plots falls outside of the agricultural field, place the sub-plot 2 m within the farm field boundary.
Figure2. Sample plot layout in agricultural fields, with four subplots
(dotted circles). Subplots have a radius of 5.64 m (area = 100 m2), and the distance along the radial arms between the subplot centers is 12.2 m. The whole plot has a radius of 17.84 m (area = 1000 m2). The angles can be measured using a compass or the sampling plate (Figure 1) can be placed over the center sampling point and marked and used to locate subplots 2, 3 and 4.

Vital Signs Crop Yield Measurement 0.3.2
25
Note: It is possible that the quadrant is located near the edge or corner of the field refer
to figure 3 for instructions on how to deal with this scenario.
Figure 3. If the quadrant is close to the edge or corner of the field (1), either one or two of
the subplots may be located outside the field AND outside the 2 meter buffer (2). Try first
to rotate the orientation of the subplots (3) so that more subplots are located within the
field and buffer. If a subplot is still outside of the field, move that subplot inside the 2
meter buffer of the field (4). This subplot will be closer to the center subplot than the other
two, and may or may not be inside the quadrant.
9. When all the subplots have been sampled, mix the soil from the four subplots in
the bucket thoroughly.
10. Place all the topsoil (0-20 cm) collected in a plastic bag. Label the bag and place
a label tag inside the bag. Label the bags with: E-Plot ID, HHID, field ID, depth of
sample, and date of sampling.

Vital Signs Crop Yield Measurement 0.3.2
26
11. Air dry the soil as described for the E-plot soil health samples, and once it is dry
pass through a 2 mm sieve. Place the soil in a plastic bag with a label on the
inside and outside with the label code. Include E-Plot ID, HHID, field ID, depth of
sample, and date of sampling.
Vital Signs Crop Yield Measurement 0.3.2
27
8 KEY EDITING CHECKS
At this point, the field measurements are complete. Ensure that the KEY EDITING CHECKS
have been reviewed by the enumerator before leaving the field. A Manager or Supervisor should perform a secondary review after the enumerator has completed their review. In terms of timing, it would seem best for the manager/supervisor to review the forms before leaving the field, however, this may not be logistically possible. At a minimum, the manager or supervisor should review the forms before the team leaves the landscape.
1) Field ID Ensure that the Field ID has been correctly matched to the Ag Survey, and that each data sheet has the field ID filled out in the upper right hand corner of each page
2) # of Entry Sheets Check that the number of entry sheets matches the number of fields. Recall that each household may have up to two fields where crop yield measurements will be conducted. If there are two fields, there should be two entry sheets completed.
3) Crop Sample Check that you have the Crop Sample bag, and that it has been properly labeled.
4) Soil Sample Check that you have the Soil Sample bag, and that it has been properly labeled.
If there is another field to visit at the household, proceed to the next field.
The protocol now moves back to instructions for the dry weight crop yield sample taken from the quadrant.

Vital Signs Crop Yield Measurement 0.3.2
28
9 DRY WEIGHT MEASUREMENTS
Yields are usually reported on a dry weight basis. After the fresh weight is measured and
recorded, the dry weight of the harvest is measured by taking a subsample of the fresh
material and drying it to a given moisture content. The composite subsample taken on
the quadrant (Q137) is then taken to the facilities for drying.
Important note: If the farmer selected for dry weight measurement has several fields, the
team should then measure dry weights for each field separately. Each field will have its
own dry weight section as a part of its own questionnaire.
Q141: Dry weight of the grains (from the subsample of 10 cobs) (g): take these grains for
drying for 3-4 days in the sun or in an oven at 60-70 oC and weigh them to the nearest
gram.
Q141A: Method used to dry the grain (g): record what method was used to dry the grain
(oven or sun drying method).

Vital Signs Crop Yield Measurement 0.3.2
29
7. BIBLIOGRAPHY

Vital Signs Crop Yield Measurement 0.3.2
30
8. APPENDIX
Appendix 1: Random Number Table