Vital and Health Statistics; Series 3, No. 4 (10/65) · The Current Status of Infant and Perinatal...
90
NATIONAL CENTER Series 3 For HEALTH STATISTICS Number 4 PROPERWOF~f VITAL and HEALTH STATISTICS p(l~f!c,~/0ti5 f3R4~~ ANALVTICALSTUDIES moRi&u-f InfantandPerinatal Mortality intheUnitedStates Analysis of long- and short-term trends in infant mortality in the United States by age at death, cause of death, sex of child, color, and geographic area; fetal and perinatal mortality trends; role of various risk factors including birth weight, age of mother, birth order, mother’s history of prior pregnancy loss; changes during the 1950 decade in personnel and facilities and services related to obstet- rical and pediatric care; discussion of health insurance crnd maternal and child health programs and services. Washington, D.C. October 1965 U.S. DEPARTMENT OF HEALTH, EDUCATION, AND WELFARE Public Health Service John W. Gardner Luther L. Terry Secretary Surgeon General
Transcript of Vital and Health Statistics; Series 3, No. 4 (10/65) · The Current Status of Infant and Perinatal...

NATIONAL CENTER Series 3
For HEALTH STATISTICS Number 4
PROPERWOF~fVITAL and HEALTH STATISTICS p(l~f!c,~/0ti5f3R4~~ ANALVTICALSTUDIES moRi&u-f
InfantandPerinatalMortality
intheUnitedStates
Analysis of long- and short-term trends in infant mortality
in the United States by age at death, cause of death, sex of child, color, and geographic area; fetal and perinatal
mortality trends; role of various risk factors including
birth weight, age of mother, birth order, mother’s history
of prior pregnancy loss; changes during the 1950 decade
in personnel and facilities and services related to obstet
rical and pediatric care; discussion of health insurance
crnd maternal and child health programs and services.
Washington, D.C. October 1965
U.S. DEPARTMENT OF
HEALTH, EDUCATION, AND WELFARE Public Health Service
John W. Gardner Luther L. Terry
Secretary Surgeon General

Public Health Service Publication No. 1000-Series 3-No. 4
For sale by the Superintendent of Documents, U.S. Government Printing Office Washington, D.C., 20402 - Price U; cents

NATIONAL CENTER FOR HEALTH STATISTICS
FORREST E. LINDER, PH. D,, Director
THEODORE D. WOOLSEY, Deputy Director
OSWALD K. SAGEN, PH. D., ~f.fhta?zt Director
WALT R. SIMMONS, M.A., stati~tical ~dvi~or
ALICE M. WATERHOUSE, M.D., Medical Advi~or
JAMES E. KELLY, D,D.s., Dental Advi~or
LOUIS R. STOLCIS, M.A., Executive oj?cer
OFFICEOF HEALTH STATISTICS ANALYSIS
IWAO M. MORXYAMA,PH. D,, Chief
DIVISIONOF VITAL STATISTICS
ROBERTD. GROVE, PH. D., Chief
DIVISIONOF HEALTH INTERVIEWSTATISTICS
PHXLIPS. LAWRENCE, Sc. D., Chief
DIVISION OF HEALTH RECORDS STATISTICS
MONROE G. SIRKEN, PH. D., Chief
DIVISIONOF HEALTH EXAMINATIONSTATISTICS
ARTFiURJ. MCDOWELL, Chief
DIVISIONOF DATA PROCESSING
SIDNEY BINDER, Chit-f
Public Health Service Publication No. 1000-Series 3-No. 4
Library of Congress Catalog Card Number 6.5s62151

----------------------------------------------------------
--------------------------------------------------------------------------
--------------------------------------------------------------------------------------
------------------
-----------------------------------------------------------
--------------------------------------------------------------------------------
----------------------------------
-----------------------------------------
------------------------------------------
--------------------------------------------------------------------------------------------------------------
--------------------------------------------------------------------------------------------------------------
-------------------------------------------------------------------
----------------------------------------------------------
------------------------------------------------------------------
----------------------------------------------------------------------
-----------------------------------------------------
-----------------------------------------------------------
-------------------------------------------------------
------------------------------------------------------
CONTENTS
Introduction
I. Mortality RatesTrend in Infant, Fetal, and Perinatal Mortality
Infant MortalityFetal and Perinatal Mortality
The Current Status of Infant and Perinatal MortalityInfant Mortali~-------------------------------------------------Fetal and Perinatal MortalityOther Selected Parameters of Infant MortalityTotal Suboptimal Pregnancy Outcome
The 1950BcadeChanges in Parameters of Infant Loss and Their Effect on TrendChanges in High MortalityRiskGroups
Summary—Mortality Rates
II. Medical Resources and HealthProgramsPersonnel, Facilities and Services, and Financing of Care
PhysiciansNursesMidwivesHospitalsFinancing of Care
Maternal and Child Health Programs and ServicesGeneral HealthServicesSpecialized Health Programs for Mothers andInfantsPatterns of Care
Summary—Medical Resources and Health ProgramsMedical Manpower and Facilities---------------------------------,Financing of Medical CareMaternal and CMld Health Program
III. Perspective on Fumre Course of hfant Mortali~---------------------
Acknowledgments
References
Detailed Tables
Appendix Tables
Page
1
2 2 2
10 14 14 18 19 29 32 34 36 39
40 40 40 45 46 46 48 50 50 51 53 54 54 54 55
55
57
58
60
80

------------------------ ---
------------------
----------------------------
--------------
IN THIS REPORT detailed statistics are provided on changes in infant
and pevinatal mortality rates since the early 1930 ‘s. The analysis focuses on the lack of sizable decreases in these rates in the 1950’s and describes the current situation in the white and nonwhite groups and in various geo.graphic subdivisions. Statistics onfetal loss, congenital anomalies, and birth weight devived jkom special studies are given. Changes in parameters of infant loss that may explain the small decveases in this loss during the 1950’s are considered, and differences in rates of change in the infant mortality rate among high-risk gYoups aye analyzed. Statistics are presented on the vatios of general practitioners, obstetricians-gynecologists, pediatricians, nurses, and hospital beds to Yelevant segments of the population. Othey factors, includir@ obstetrical costs, health insurance, and mateynal and child health pyogvams, are discussed.
The rate of decline in the infant moytality rate was 4.7 peycent pey year duying the 1940’s. Between 1951 and 1962 it was 1 percent pey yeay. The slowdown affected all segments of the population. The rate in many layge cities increased, and the gap between Yates in met~opolitan and nonmetropolitan ayeas decveased. High-Yisk gYoups such as childyen weighing 2,500 gyams or less at biyth, children born to motheys who previously
had a fetal death, and nonwhite infants showed almost no improvement
duying the 1950 ‘s.
Increased emphasis through special community-action pyograms on the problem of infant mortality is viewed as OYW of the elements that may
help accelerate the rate of decline in infant mortality.
I I SYMBOLS
Data not available
Category not applicable . . .
Quantity. zero -
Quantity more than O but less than 0.05 ----- 0.0
Figure does not meet standards of *reliability or precision----
INFANT AND PERINATAL MORTALITYIN THE UNITED STATES
The following research repart was prepared by Sam Shapira, Edward R. Schlesinger, M. D., and Robert E. L. Nesbitt, Jr., M.D. a b The methadalagy, findings, and conclusions are those of the investigators.
INTRODUCTION
The relatively poor progress in reducing infant mortality since the early 1950’s has been a source of increasing concern in the United States. The subject has been examined previously in the context of international, national, and local changes in pregnancy loss rates; but it is clear that continued discussion based on the analysis of old and new data is very much the order of the day.1”5
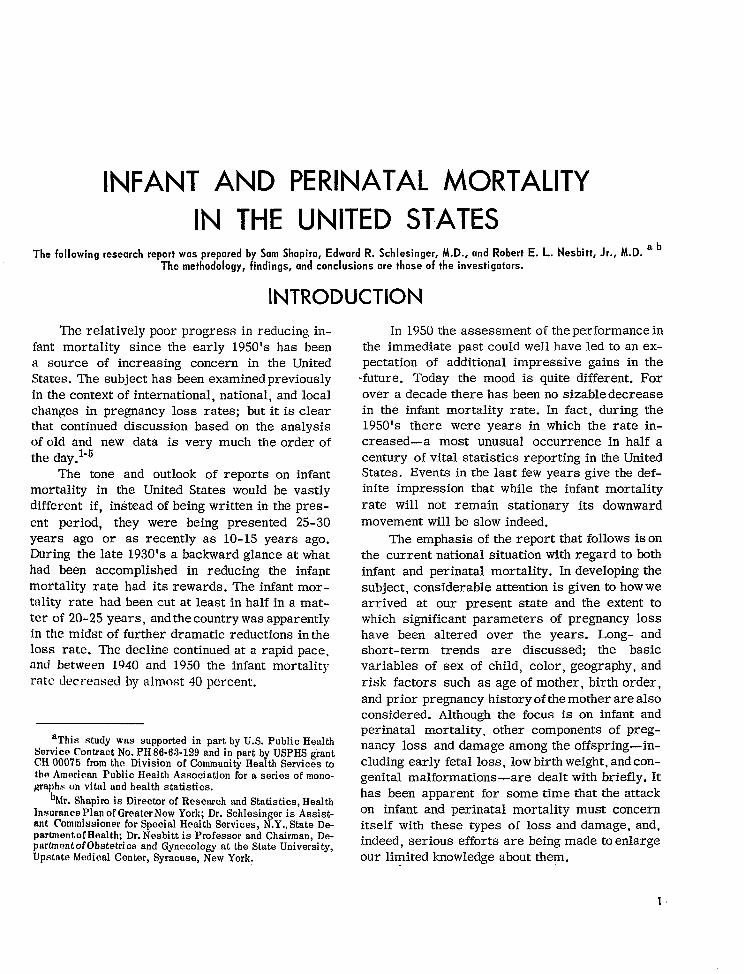
The tone and outlook of reports on infant mortality in the United States would be vastly different if, instead of being written in the present period, they were being presented 25-30 years ago or as recently as 10-15 years ago. During the late 1930’s a backward glance at what had been accomplished in reducing the infant mortality rate had its rewards. The infant mortality rate had been cut at least in half in a matter of 20-25 years, and the country was apparently in the midst of further dramatic reductions in the loss rate. The decline continued at a rapid pace, and between 1940 and 1950 the infant mortality rate decreased by almost 40 percent.
aThis study was supported in part by U.S. Public Health Service Cantract Na. PH 86-63-129 and in part by USPHS grant CH 00075 from the Division af Community Health Services h the American Public Health Association far a series of mono-graphs on vital and health statistics.
bMr. Shapiro is Director of Research and Statistics, Health Insurance Plan of Greater New York; Dr. Schlesinger is Assist-ant Commissioner far Special Health Services, N. Y., State DepartnrentofHealth; Dr. Nesbitt is Professor and Chairman, Department of Obstetri cs and Gynecology at the State University, Upstate Medical Center, Syracuse, New Yark.
In 1950 the assessment of the performance in the immediate past could well have led to an expectation of additional impressive gains in the
-future. Today the mood is quite different. For over a decade there has been no sizable decrease in the infant mortality rate. In fact, during the 1950’s there were years in which the rate increased—a most unusual occurrence in half a century of vital statistics reporting in the United States. Events in the last few years give the definite impression that while the infant mortality rate will not remain stationary its downward movement will be slow indeed.
The emphasis of the report that follows is on the current national situation with regard to both infant and perinatal mortality. In developing the subject, considerable attention is given to how we arrived at our present state and the extent to which significant parameters of pregnancy loss have been altered over the years. Long- and short-term trends are discussed; the basic variables of sex of child, color, geography, and risk factors such as age of mother, birth order, and prior pregnancy history of the mother are also considered. Although the focus is on infant and perinatal mortality, other components of pregnancy loss and damage among the offspring-including early fetal loss, low birth weight, and con-genital malformations—are dealt with briefly. It has been apparent for some time that the attack on infant and perinatal mortality must concern itself with these types of loss and damage, and, indeed, serious efforts are being made to enlarge our limited knowledge about them.

All of the information is derived from existing data or from special tabulations of data collected before the report was initiated. Official vital statistics are the yrimary source. Whenever possible, these data come from the Division of Vital Statistics, Public Health Service. In several instances where national data were unavailable, it proved feasible to examine important relationships on the basis of vital statistics for Up-state New York. c
Although vital statistics are the most comprehensive source of information for examining the national picture on infant and perinatal mortality.
C“Upstate New York” refers to New York State, exclud
ing New York City.
special studies conducted over the past two decades provide additional insights into the epidemiology of pregnancy loss. It is not the intent of the present report to incorporate all of these findings. The approach taken is to include a limited amount of data derived from special investigations which extend information about variables also found in vital statistics.
While the analysis of mortality data is the focus of the present report, a major section is de-voted to a review of medical and paramedical man-power, facilities, and medical care costs in the United States with particular emphasis on their relationship to obstetrical and pediatric services. The final section of the report provides a perspective on the future course of infant mortality in the United States.
L MORTALITY RATES
TREND IN INFANT, FETAL, AND
PERINATAL MORTALITY
Infant Mortality
General tvend. —The long-term trend in infant mortality in the United States and changes in rates of decline are examined in detail from the middle 1930’s to the early 1960’s in this report. It was not until 1933 that data became available for the United States as a whole. In 1915, the Bureau of the Census established the birth registration area which included 10 states and the District of Columbia in which the registration of live births was relatively complete. d periodically other
States were added as they met the minimum requirement of 90 percent completeness of birth registration. Generally the States that entered the Area late have had comparatively high infant mortality rates.
Incompleteness of birth registration persisted as a serious problem in large sections of the country long after 1933, and it was not until
‘The death registration area was established in 1900 for the annual collection of mortality statistics.
the birth registration test of 1950 showed that 98 percent of the live births were being registered that the issue could be dismissed as inconsequential for the United States as a whole.6 There is no direct evidence about the relationship be-tween the completeness of live birth and infant death registration. The usual assumption is that they are of the same order of magnitude and, therefore, that the errors cancel each other when” rates are computed. However, this may be less true for very early infant deaths than for deaths later in infancy.
Despite restrictions imposed by changes in registration completeness, it is believed that. inferences about the course of the infant mortality rate since the mid-1930’s can be drawn with a fairly high degree of accuracy from data based on reported events. The trend analysis in this report starts with these years. With regard to what happened prior to the mid-l 930’s, it is perhaps sufficient to recognize that 10-15 percent of the new-born babies died in infancy at the beginning of the 20th century and that by the 1930’s the mortality rate had been cut at least in half.
Between the mid- 1930’s and 1950 the rate was again greatly reduced. The annual rate of decline was 4.7 percent, but year-to- year changes were very uneven: a few years would go by with comparatively minor changes, and then there would be
2

--
a sharp drop. e Anextremee xampleofthisi sfound in the World War II period when the rates de-creased only about 5 percent from 1942 to 1945. In the immediate postwar years the drop was three times as great. After 1950 the rate began to level off. At first it might have been assumed that this was another temporary situation, but, in time, it became clear that a fundamental change had occurred in the course of the infant mortality rate. Over the entire period of 1951-62 the rate of de-cline was 1.0 percent per year, or a small fraction
of the annual rate of change in the preceding period. Furthermore, some of the year-to-year fluctuations involved important increases in the rate.
Trends by age at death, sex of child, and
CO1OY.—The trend in the infant mortality rate is the resultant of widely different trends in mortality at various ages during infancy. Selected for analysis are three age groupings in the neonatal period (under 1 day, 1-6 days, and 7-27 days) and two age groupings in the postneonatal period (l-5 months and 6-11 months). These provide a fairly complete basis for understanding the changes in mortality that have taken place throughout infant y. Other age groupings lead to inferences that differ in detail but do not alter the general conclusion (table 1 and fig. 1).
Mortality in the first day of life decreased between 1935 and 1951 rather steadily but at a substantially slower rate than for the entire first
‘Annual rates of decline were obtained by fitting straight lit-m by tho method of least squares to the logarithms of the death ratw, Fmm the slopes of these fitted lines the annual rates of duclina or increase (in percent) are derived. Changes in infant mortality rates are determined from rates computed conventionally, i.e., the number of deaths in a particular year is related b the number of live births in that year b obtain an infant mortality rate. During a period of stability in the annual numberof live births the rates closely approximate tbe risk of infant mortality in each of the years. When the number of livo births decreases sharply fmm one year to the next,-an accompanying docrwase in mortality would be understated by conventional rates; the reverse would occur if there were a sharp increaso in the number of live bkthe. The latter situation held during the immediate post-World War II period. The large dmp in the infant mortality rate between 1945 and 1946 is duo, in part, to the changing number of births. Actually
when infturt mortality rates are adjusted for tbe factor, the demwaso in tho rato between 1946 and 1947 appears tn be relaLI\dy greater than in the previous years. It should be noted that tho effect of changes in the number of births varies with ago at death; it is negligible during the first month following birth, but it becomes appreciable in the postneonatal period.
100
80
60 ,*,\ .. Under I year
‘*, %
40 “e,.,,
“$,& ,*
“\.-, + .-,-,+,~,-,-
: ?.0 ~
z
Lu > i
0 1000
* $*
cc % ~
6 m w1-<K I-5 months
4 B B 7-27 days ]8 * a�,4’*
\
2
I I I I I 1 ,1,11,1111,,,,111,111,1
1935 1940 1945 1950 1955 1960
1 From 1935 to 1948 this category refers to deaths at ages 7-29 days.
NOTE2 Beginning in 1959 include Alaska and Hawaii.
Sourc~ Annual volumes Vital Statistics of the United States, Natfonal Center for Healti Statistics, Public Health Service, Washington, U.S.
Government Printing Office.
Fiaure 1. Infant mortal i ty rates by age: Urrited States, 1935-62.
year (2.9 percent). f ‘Then it leveled off, and, starting with 1955, it began to increase slightly. There is no indication yet that the rate of loss in the
fAll percen~ge changes in this section are per annum.
3

--
100
MALE 80 — TOTAL80 TOTAL FEMALEr— 60 L**I\
40 ‘%,y’ ‘Ye”r
8\‘*,
‘s+ \ ‘-, *.
+*-1**-a*,4’%-, -
: 20 1- 20+az tw>i
o 10 10—00
8 En. I
6mw1- 1-5 months az 4
B 4 — I-5months
1 I 1
I 1
2 2 —
I
I I I I 1111111111111111111111111
1935 1940 1945 1950 1955 1960 1965
. ‘From 1935to 1948 this category refers to deaths at ages 7-29 days.
NOTE: Beginning in 1959 include Alaska and Hawaii.
Source: Annual volumes Vifal Sfatisficsofflw Unifed Sfates, National Center for Health Statistics, Public Health Service, Washington, U.S. Government Printing Office.
Figure 2. Infant mortality rates by age and sex: United States, 1935-62.
first day after birthhasresumed itsformerdownward trend. In the balance of the first week of life (l-6 days) the mortality rate followed a course similar to that of the rate for under 1 day until the early 1950’s when, instead of increasing, it continued its slow downward movement (2.0 per-cent). After the first week the trend in the mortality rate showed great variability. At a:>es 7-27 days there were three distinctly different patterns.
4
Between 1935 and 1945 themortality ratedeclined at a fairly rapid rate (4.5 percent). This was followed by even larger reductions in the immediate postwar period. After 1950 the rate of decrease slowed down and was not much greater than at ages 1-6 days (2.7 percent).
The rate of decline in the mortality rate from 1935 to 1945 was larger in the postneonatal period than at earlier ages. At ages 1-5 months the

100 loot
$%,80 — 80 Is
1-
WHITE ‘-** NONWHITE “\
60 — 60 — ‘+,
� ,
c’+, \,
\ “+ ,- s,, -,*,
Under I year
40 – -,
*+ *8*,*
40 — + .-,* *4’* ,+
.-
‘\ ‘*, *
‘\ J-, -Under I year
s.%,,,,$ ‘- I-,-*-, -*- �.
**’’’”?% I -5 months In x
20 - 20 – %,, �,,*..*
~ m Under I day u > z 00 10 Under I day
10 —o_.
KIllL
8 — I-6 days
UJ6 u t-
6 — \ *
A 6-II months < a 1-5 months
4 — 4 — 1 1 1
1
6-11 months
2 — 2 –
I I I II I I I I I I I I I I I I I I I I I I I I I I I I I I I I I I I I I I I I I I I I I 11111 1;35 1940 1945 1950 [955 1960 1965 I935 I940 I945 1950 1955 1960 1965
1lVom 1935 to 1948 this category refers to deaths at ages 7-29 days.
NOTE: Beginning in 1959 include Alaska and Hawaii. New Jersey excluded from data for 1962; race not reported.
Suurcw Annual volumes Vital Statistics of the United States, National Center for Health Statistics, Public Health Service, Washington, U.S. Governmlmt Printing Office.
Figure 3. Infant mortality rates by age and color: United States, 1935-62.
annual rakofdecline was 5.4 percent. Following ever, there is some indication that the rate is a sharp decrease in mortality immediately after starting to decline again—thus far very slowly. World War II, the mortality rate at ages 1-5 The course of the mortality rate at ages 6-11 months followed an erratic downward course until months resembles that at ages 1-5 months except the mid- 1950’s. The precise year when the down- that the decrease in each period has been greater. ward trend ended cannot be determined, but for The trend in the infant mortality rate has been purposes of the current discussion 1956 has been very similar for male and female births (table 2 selected. For six successive years, 1957-62, the and figs. 2 and 3). It is clear that the circum
mortal ity rate has been higher than in 1956. How- stances that led to reductions in infant mortality
7HH-lI%? O - G5 .2
5
bNDER I YEAR
200 } PercenY’’%i’’oF%ang&
I Period Total - Nonwhite
I 1935-50 -4.7 -4.7 -5.0’ 1951-62 -1.0 -1.2 .’-0.7
w
: [00c z w
80~ �*
�* �-,~ * A
000 Nonwhite_.
E 40 — &
m w$ cc J1ll,,,,,,,s*.,~J.,,J,,,,,,,
White20 -
UNOER I OAY I-6 DAYS
‘“~‘“~ 20 20
t t Nonwhite
�. ...---=. 4*,
+=*.+= %.0-...* t %...*
-** m Total Nonwhitei + 10 — “’’’%,**, ,, ,,,,,,,,”r,r,,,,,l$~lll, ,,~@’ E z Whitew 8 – 8 –>i06 — 6 -
White00_.
ti4 _ 4&
~ t Under 1 day 1-6 days‘2 Percent rate of changeL Percent rate of change’K
Period Total = Nonwhite Period Total m- Nonwhite
2 – L935-51 -2.9 -3.1 -L.9 2 1935-51 -2.0 -1.8 -2.9 1952-62 +0.8 +0.6 +1.2 1952-62 -2.0 -2.2 -L.9I
1~ 1~ 1935 5 1935 1965
1Annual rate of change Obtained befitting least square 1IIWS1Ologarithms of rates for specified time period andtaking antL.logofslo~ “f i!tt.dluw.
2Coefficient of variations is one-third or more.
NOTE: Rates for 1959to1962 ticlude Akskmd Hawaii. New Jersey excIuded from &tabycoIor for1962; race not reported.
Source Annual volumes Vi fat.%tisticsofthe United States, NatiaMCe nterforHe aUbStatistics, Fublic Health Service, Washington, U. S. Govern
ment Print fng Office.
Figure !. [nfant mortality rates by color for each age group: IJnitecl states, l~s&Gz.
6

�
7-27 DAYS UNDER 28 DAYS
I
7-27days Under28 days20 Percent rate of changd 100 Percentrate of changez 4
Period Total * Nonwhite 80
Period Total = Nonwhite
1935-f45-4.5 -4.5 -4.4 1935-51 -3.2 -3.2 -3.2t 1951-62 -2.7 -3.3 -2.2 i 1952-62 -0.6 -0.8 2-0.4
�� 60
10 — %... 1 1
8 - % �.W
1’“+
w.,, %...* Nonwhite
6 %.- -“%”,,,,+
**. �-*.- . ...=. �Nonwhite �
,.. Total 4 — 20
White
2 –
White
t --l 6
5 I I I I 1111111111111111111111111 1935 1940 1945 1950 1955 1960 1965
I-5 MONTHS 6-11 MONTHS
lnziizl 20~ 1935-45 -5.4 -5.6 1947-56 -3.6 -4.9 ‘%
40 1957-62=1.0 ‘-1.2 2-1.3
a: 1%*5 ‘\***
y 20i
0 I-1 .4.*,A E- ~“%%
*%*
\ :
;*. Nonwhite II
x 4 White t ~i White I I
1Annual rate of change obtained by fitting Ieast square Unes to logarithms of rates for specified time period and taking anti-log of slope of fitted line.
2Coefficient of variaUons is one-third or more.
NOTE: Rates for 1959 to 1962 include Alaska and Hawaii. New Jersey excluded from data by color for 1962; race not reported.
8ourcw Annual volumes VifaI Statistics @the Um”fed Sf4tes, National Center for Eealtb Statistics, Public Health Service, Washington, U.S. Government Printing Office.
Figure W. Infant mortality rates by color for each age group: United States, 1935-62—Con.
7

have at no time favored one sexgroup over the other. Throughout the years 1935-62 the gap be-tween the rates for males and females remained almost unchanged at every age level, with males having consistently higher rates.
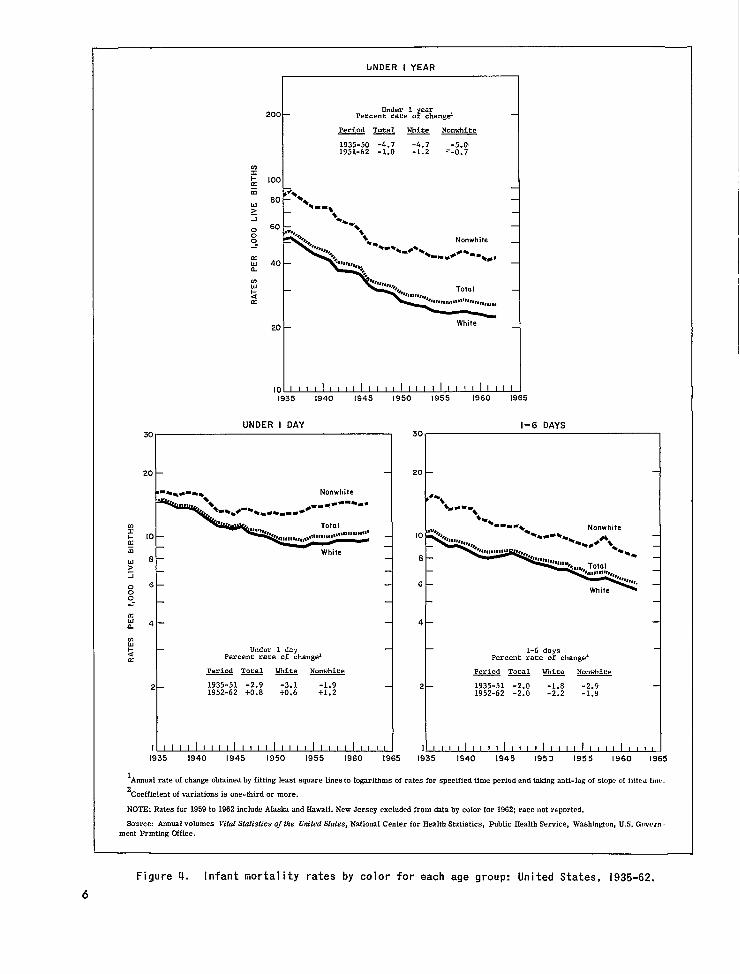
The rates for white and nonwhite groups pre-sent a far different situation. Mortality trends for white infants closely parallel the trends previously presented for all races combined (table 3 and figs. 3 and 4). The only difference of any consequence is a slightly greater decrease in the death rate since 1950 for the white race than for the United States as a whole.
Until 1950 the rate of decrease in the loss during the first year of life was at least as great among the nonwhite births as the white. Since then the slowdown in the rate of decline has been more severe in the mortality rate for the nonwhite group. Larger differences than those suggested by the total infant mortality rate are found in the trends by age at death. Between 1935 and 1951 substantial decreases in mortality in the first day of life were scored by the white group; among nonwhite infants the decrease in the rate of loss under 1 day stopped in 1943. More recently—since 1952—the rate of increase in mortality at this age has been greater for the nonwhite than the white infants.
Question might be raised about the comparative accuracy of the mortality trends for under 1 day among white and nonwhite children. Improvement in the reporting of live births could be accompanied by a more complete registration of deaths in early infancy and thereby artificially in-crease the mortality rate. It might be argued that this would be more significant for the rates among nonwhite babies in view of the reduction in the lag between nonwhite and white persons in the use of hospitals and in the completeness of registration of live births. These considerations are important, but it is unlikely that they completely explain events in the more recent period. The same situation is found in many areas of the country where the problems of underregistration and accuracy of reporting have been inconsequential for a long time. Another possibility is that with improvement in medical care there has been a shift in the timing of the death of some infants from the pre-natal to the immediate postnatal period and that this has been more common among the nonwhite than the white births. This, too, is highly spec
ulative, and it might be more fruitful to seek other explanations for the difference in trends between the rates for white and nonwhite infants.
Following the first day of birth and &mtinuing until the end of the neonatal period, comparisons between mortality trends for the two race groups show a somewhat different set of relationships from those observed in under 1 day. There is some indication that the rate of decline in the 1-6 day period was, at one time, greater for the nonwhite than the white infants and that in more recent years the change in the loss rate has been similar in both race groups. At 7-27 days the decline in losses was almost identical for white and nonwhite infants from 1935 through 1945. It has been more rapid among white births since 1947.
Taking the neonatal period as a whole, the reduction in death rates among the nonwhite births kept pace with the rate of decline among the white births until about 1951. Subsequently the rates for both race groups decreased only slightly, with the rate among nonwhite infants leveling off somewhat more than the rate among white infants.
Both race groups made substantial gains in lowering postneonatal mortality and at about the same rate until the mid- 1940’s. The sharp drop in the death rate immediately after the war was shared by both white and nonwhite infants. Since then the trends in the mortality rates for white and nonwhite births have differed. For almost a decade the rates among the white infants at ages 1-5 months and 6-11 months continued to decline briskly. The tendency of the rates to level off started about 1954 or 1955. In contrast, among the nonwhite infants the rate at 1-5 months flattened out shortly after the war ended. This.situation has persisted through 1962. Mortality rates at 6-11 months followed an erratic course among the non-white births after 1946. Increases in the rate were experienced for several years, and, while there have been decreases in the past few years, reversals still occur.
Trends by cause of death. —The decline in the overall infant mortality rate during the period prior to 1950 is generally accepted as reflecting the global effect of advances in medicine, maternal and child care, and improvement in medical facilities and economic and sanitary conditions in the United States. About half of the de-
8
--------
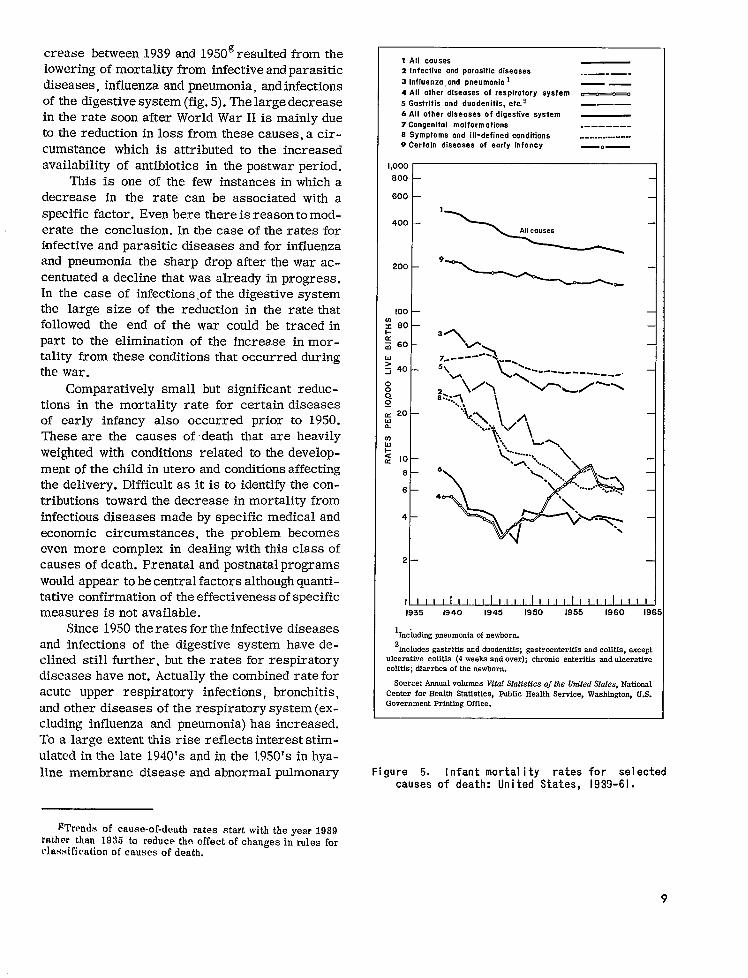
crease between 1939 and 1950gresulted from the lowering of mortality from infective andparasitic diseases, influenza and pneumonia, and infections of the digestive system (fig. 5). The large decrease in the rate soon after World War II is mainly due to the reduction in loss from these causes, a circumstance which is attributed to the increased availability of antibiotics in the postwar period.
This is one of the few instances in which a decrease in the rate can be associated with a specific factor. Even here there is reason to moderate the conclusion. In the case of the rates for infective and parasitic diseases and for influenza and pneumonia the sharp drop after the war accentuated a decline that was already in progress. In the case of infections .of the digestive system the large size of the reduction in the rate that followed the end of the war could be traced in part to the elimination of the increase in mortality from these conditions that occurred during the war.
Comparatively small but significant reductions in the mortality rate for certain diseases of early infancy also occurred prior to 1950. These are the causes of death that are heavily weighted with conditions related to the development of the child in utero and conditions affecting the delivery. Difficult as it is to identify the contributions toward the decrease in mortality from infectious diseases made by specific medical and economic circumstances, the problem becomes even more complex in dealing with this class of causes of death. Prenatal and postnatal programs would appear to be central factors although quantitative confirmation of the effectiveness of specific measures is not available.
Since 1950 the rates for the infective diseases and infections of the digestive system have declined still further, but the rates for respiratory diseases have not. Actually the combined rate for acute upper respiratory infections, bronchitis, and other diseases of the respiratory system (excluding influenza and pneumonia) has increased. To a large extent this rise reflects interest stimulated in the late 1940’s and in the 1950’s in hyaline membrane disease and abnormal pulmonary
~’1’rends of cause-of-death rates start with the year 1939 rather than 1935 to reduce the effect of changes in rules for classification of causes of death.
1 All couses2 Infective and por.asitic diseases
3 Influenzo, and pneumonio 1
4 All other dlseoses of respiratory system
5 Gastritis and duodenitis, etc.2
6 All other diseases of digestive system
7 Congenital malformations8 symptoms and 1[1-defined cOnditiOn~
9 Certain diseoses of early infancy
1,000 800
600
400
- ‘~ 200 ‘—--+-. 100
m s 601-m a 60
Yz 40 0 0 0. g
~ 20 w a
W
Pg 10
8
6
4
2
I 1 I I I 111111111111111111111,11
..—. — . —.
o
———
. . . . . . . . . . . . . . . . . . . .
—.—
1935 i940 1945 1950 1955 1960 196:
1.Including pneumonia of newborn.
2 fncludes gastritis and duodenitfs; gastroenteritfs and colitis, except
ulcerative colitis (4 weeks and over); chronfc enteritis and ulcerative colitis; diarrhea of the newborn.
Source: Annual volumes Vital Statistics of tlze Um”tedStates, National Center for Health Statistics, Public Health Service, Wasbfngton, U.S. Government Printing Office.
Figure 5. [nfant mortal i ty rates for selected causes of death: Un ited States, 1939-61.
9
ventilation as causes of death. In 1958 classification changes transferred hyaline membrane disease from the category other respiratory diseases to ill-defined diseases peculiar to early infancy, and the rate for other respiratory diseases was appreciably reduced. More time is needed to determine the course of the mortality rate for the latter set of conditions. At this point they still represent only one-sixth of the total loss attributed to all respiratory conditions.
The infant mortality rate for the category of conditions, certain diseases of early infancy, de-creased slowly and irregularly for several years after 1950 and then changed little. This is, of course, indicative of the general lack of progress in reducing mortality in early infancy.
An interesting feature of the cause-of-death trends is that the rate for congenital anomalies has changed little in almost a quarter of a century. The rate of decline in this cause of death has consistently lagged behind the decline in the total infant mortality rate during both the period when the infant mortality rate declined rapidly and the past decade when it decreased only moderately.
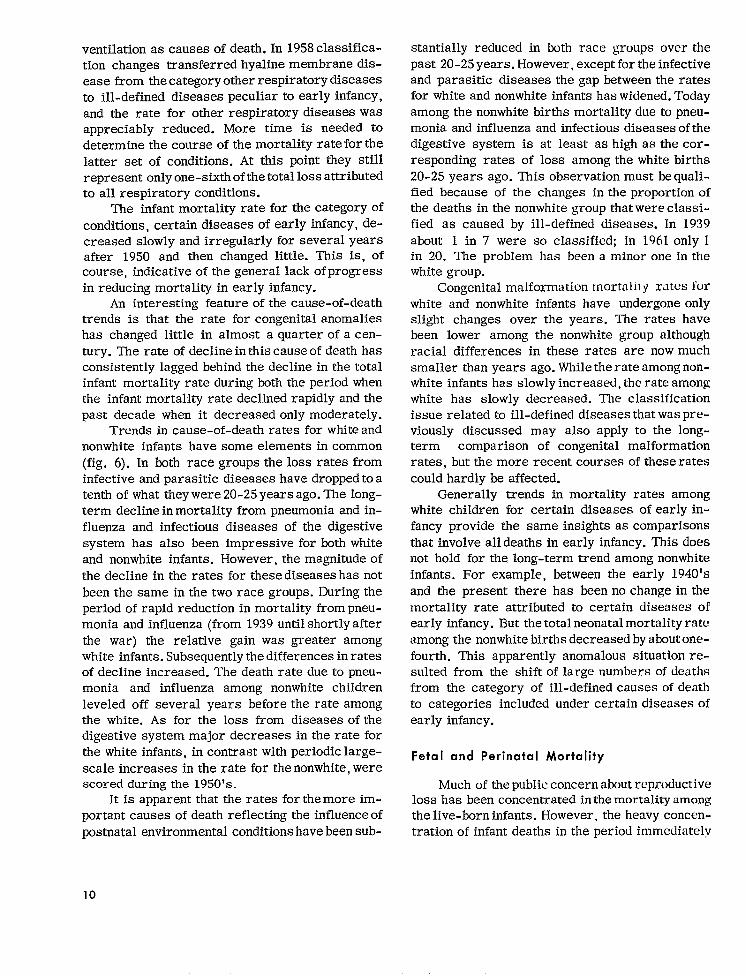
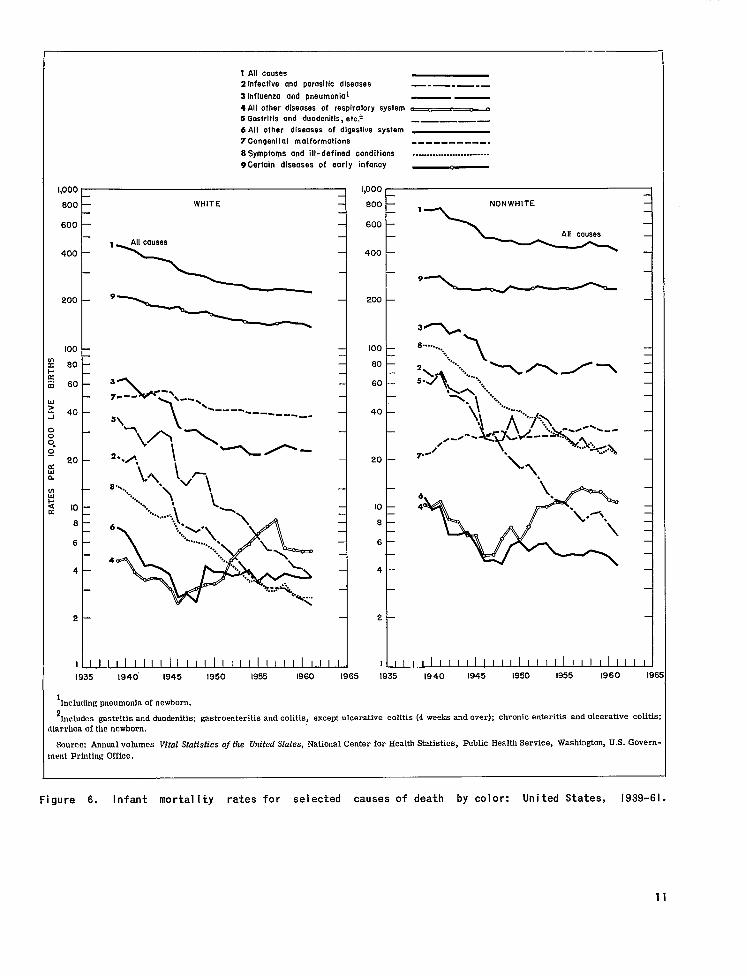
Trends in cause-of-death rates for white and nonwhite infants have some elements in common (fig. 6). In both race groups the loss rates from infective and parasitic diseases have dropped to a tenth of what they were 20-25 years ago. The long-term decline in mortality from pneumonia and influenza and infectious diseases of the digestive system has also been impressive for both white and nonwhite infants. However, the magnitude of the decline in the rates for these diseases has not been the same in the two race groups. During the period of rapid reduction in mortality from pneumonia and influenza (from 1939 until shortly after the war) the relative gain was greater among white infants. Subsequently the differences in rates of decline increased. The death rate due to pneumonia and influenza among nonwhite children leveled off several years before the rate among the white. As for the loss from diseases of the digestive system major decreases in the rate for the white infants, in contrast with periodic large-scale increases in the rate for the nonwhite, were scored during the 1950’s.
It is apparent that the rates for the more important causes of death reflecting the influence of postnatal environmental conditions have been sub
stantially reduced in both race groups over the past 20-25 years. However, except for the infective and parasitic diseases the gap between the rates for white and nonwhite infants has widened. Today among the nonwhite births mortality due to pneumonia and influenza and infectious diseases of the digestive system is at least as high as the corresponding rates of loss among the white births 20-25 years ago. This observation must be qualified because of the changes in the proportion of the deaths in the nonwhite group that were classified as caused by ill-defined diseases. In 1939 about 1 in 7 were so classified; in 19.=51only 1 in 20. The problem has been a minor one in the white group.
Congenital malformation rnortalil y rates for white and nonwhite infants have undergone only slight changes over the years. The rates have been lower among the nonwhite group although racial differences in these rates are now much smaller than years ago. While the -rate among non-white infants has slowly increased, the rate among white has slowly decreased. The classification issue related to ill-defined diseases that was previously discussed may also apply to the long-term comparison of congenital malformation rates, but the more recent courses of these rates could hardly be affected.
Generally trends in mortality rates among white children for certain diseases of early in-fancy provide the same insights as comparisons that involve all deaths in early infancy. This does not hold for the long-term trend among nonwhite infants. For example, between the early 1940’s and the present there has been no change in the mortality rate attributed to certain diseases of early infancy. But the total neonatal mortality rate among the nonwhite births decreased by about one-fourth. This apparently anomalous situation resulted from the shift of large numbers of deaths from the category of ill-defined causes of death to categories included under certain diseases of early infancy.
Fetal and Perinatal Mortality
Much of the public concern about reproductive loss has been concentrated in the mortality among the live-born infants. However, the heavy concentration of infant deaths in the period immediately
10
------ -----
1.000 I
800 —
600 —
400 —
zoo —
100 —
nc 60 –
:n 60 —
L!>i 40 –
>>>“~~ 20 –
d1.
nL1
z 10 —r
8 –
6 —
4 -
2 -
1~
1935
I All causes2 Infective and parasitic diseases
3 Influenza and pneumonial
4 All other diseases of respiratory system
5 Gastritis and duode nit is, etc.~
6 All other diseases of digestive system
7 Congenital malformations
8 Symptoms and ill-defined conditions
9Certain diseases of early infancy
, 1,000
WHITE 600
600
‘\ 400
200
‘————=——1
100 —
60 —
60 —
40 —
20 —
10 —
6 —
6 —
4 —
2 —
I -.ul~
1940” 1945 1950 1955 1960 [965 1935
—.— .—. _ —— 0 0
.—— — .
. . . . . . . . . . . . . . . . . . . . . . . . . . .
——
%,.
6
4
1940 [945 1930 1955 1960 19E
1Including pneumonia of newborn.
2fncludes gastritis and duodenitis; gastroenteritis and colitis, except ulcerative colitis (4 weeks and over); chronic enteritis and ulcerative colitis:
IIarrhca of the newborn.
Source Annual volumes Vital Statistics of the Urn’tedStates, National Center for Health Statistics, Public Health Service, Washington, U.S. GOve~nent Printing Office.
Figure 6. Infant mortality rates for selected causes of death by color: United States, 1939-61.
11
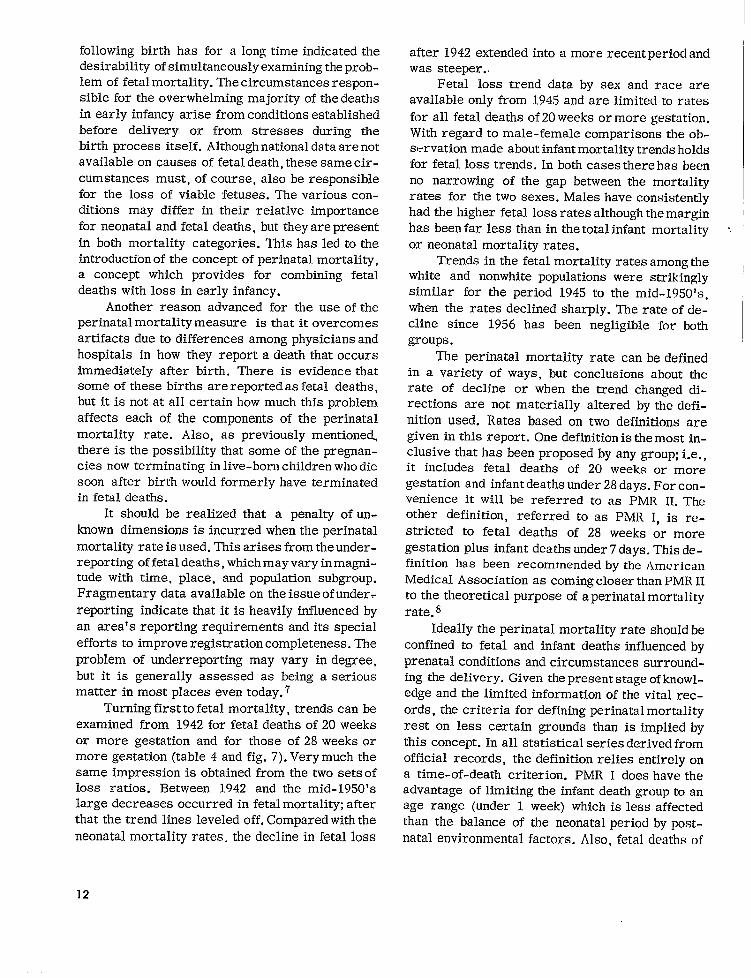
Ifollowing birth has for along time indicated the desirability of simultaneously examining the problem of fetal mortality. The circumstances responsible for the overwhelming majority of the deaths in early infancy arise from conditions established before delivery or from stresses during the birth process itself. Although national data are not available on causes of fetal death, these same circumstances must, of course, also be responsible for the loss of viable fetuses. The various conditions may differ in their relative importance for neonatal and fetal deaths, but they are present in both mortality categories. This has led to the introduction of the concept of perinatal mortality, a concept which provides for combining fetal deaths with loss in early infancy.
Another reason advanced for the use of the perinatal mortality measure is that it overcomes artifacts due to differences among physicians and hospitals in how they report a death that occurs immediately after birth. There is evidence that some of these births are reported as fetal deaths, but it is not at all certain how much this problem affects each of the components of the perinatal mortality rate. Also, as previously mentioned, there is the possibility that some of the pregnancies now terminating in live-born children who die soon after birth would formerly have terminated in fetal deaths.
It should be realized that a penalty of unknown dimensions is incurred when the perinatal mortality rate is used. This arises from the under-reporting of fetal deaths, which may vary in magnitude with time, place, and population subgroup. Fragmentary data available on the issue of under. reporting indicate that it is heavily influenced by an area’s reporting requirements and its special efforts to improve registration completeness. The problem of underreporting may vary in degree, but it is generally assessed as being a serious matter in most places even today. 7
Turning first to fetal mortality, trends can be examined from 1942 for fetal deaths of 20 weeks or more gestation and for those of 28 weeks or more gestation (table 4 and fig. 7). Very much the same impression is obtained from the two sets of loss ratios. Between 1942 and the mid-1950’s large decreases occurred in fetal mortality; after that the trend lines leveled off. Compared with the neonatal mortality rates. the decline in fetal loss
after 1942 extended into a more recent period and was steeper..
Fetal loss trend data by sex and race are available only from 1945 and are limited to rates for all fetal deaths of 20 weeks or more gestation. With regard to male-female comparisons the observation made about infant mortality trends holds for fetal loss trends. In both cases there has been no narrowing of the gap between the mortality rates for the two sexes. Males have consistently had the higher fetal loss rates although the margin has been far less than in the total infant mortality ‘ or neonatal mortality rates.
Trends in the fetal mortality rates among the white and nonwhite populations were strikingly similar for the period 1945 to the mid-1950’s, when the rates declined sharply. The rate of de-cline since 1956 has been negligible for both groups.
The perinatal mortality rate can be defined in a variety of ways, but conclusions about the rate of decline or when the trend changed directions are not materially altered by the definition used. Rates based on two definitions are given in this report. One definition is the most inclusive that has been proposed by any group; i.e., it includes fetal deaths of 20 weeks or more gestation and infant deaths under 28 days. For convenience it will be referred to as PMR II. The other definition, referred to as PMR 1, is restricted to fetal deaths of 28 weeks or more gestation plus infant deaths under 7 days. This definition has been recommended by the American Medical Association as coming closer than PMR 11 to the theoretical purpose of a perinatal mortality rate. 8
Ideally the perinatal mortality rate should be confined to fetal and infant deaths influenced by prenatal conditions and circumstances surrounding the delivery. Given the present stage of knowledge and the limited information of the vital records, the criteria for defining perinatal mortality rest on less certain grounds than is implied by this concept. In all statistical series derived from official records, the definition relies entirely on a time-of-death criterion. PMR I does have the advantage of limiting the infant death group to an age range (under 1 week) which is less affected than the balance of the neonatal period by post-natal environmental factors. Also, fetal deaths of
12

FETAL DEATH RATIO PERINATAL MORTALITY RATE
80 I
--in zi a
10 ~ 1940 1965
Percent rate of change=
~
1942-56 1957-62
Fetal death ratio I--- -3.8 -0.9 Fetal death rati-o II-- -3.3 -0.6
-
1945-56 1957-62
Fetal death ratio II-- -3.3 -0.9
Nonwhite
1945-56 1957-62
Fetal death ratio II-- -4.1 S-0,.3
1 ratio I is defines fetal deaths of 28 weeks gestation
‘4
10 I I I I I I I I I I I I I I I I I I I I I I I I
1940 1945 1950 1955 1960
Percent rate of changes
Total
1942-56 1957-62
Perinatal Perin - cal
mortality mortality
rate rate
I---II--
-2.6 -2.7
-0.7 -0.8
a 1945-56 1957-62
Perinatal mortality rate II-- -3.0 -1.0
Nonwhite
1945-56 1957-62
Perinatal mortality rate II-- -2.8 6-1.1
Futiil death as or more and a proportionate number of fetal deaths of unknown gestation per 1,000 IIVL births.
2Fetal death ratio II differs from fetal death ratio I in that it includes fetal deaths of 20 weeks or more gestation plus all not stated gestation age.
3Perinatul mortality rate I is defined as infant deaths under 1 week plus fetai deaths of 28 weeks or more gestation and a proportionate number of fetal
dc:iths of unknown gestation per 1,000 live births plus specified fetai deaths. 4
Pcwinabal mortality rate 11 differs from perinatal mortality rate I in that it includes infant deaths undzr 26 days plus fetal deaths of 20 weeks or more ~usb~tlon plus III not stated gestation age.
5AmlwJi rate of change obtained by fitting least square lines to logarithms of rates for specified time period and taking anti-log of slope of fitted line.
6Coufficicnt of variation is one-third or more.
NOTE: 1959 hlcIudes Alaska; 1960 and 1961 include Alaska and Hawaii. New Jersey excluded from data by color for 1962. For 1942-44, data not
AviIil.d21u by color.
Smmcw Annual volumes Wtal statistics of Ihe united .$’tdes, National center fOr Health Statistics, public Health Service, Washingt% U.S. GOvern
mtmt Printing Office, and special tabulations.
Figure 7. Fetal death ratios and perinatal mortality rates by color: United States, 1942-62.
7UL3-0!!20-65 -3
13
1965
gestation ages 28 weeks ormoreare believed to be better reported than earlier fetal deaths. In favor of the PMR IIisthe fact that a longer time series of data is available for such variables as color, sex, and geographic area. This circumstancehasledto the more frequent useof PMRII in this report.
In any event, wherever it is possible to examine trends by means of both PMR I and PMR II, the same conclusions are reached. The decreases in these rates paralleled each other between 1942 and 1962. Both rates declined rapidly until 1956, when they leveled off (table 5 and fig. 7). The decline continued until 1956 in the face of a leveling off in the early infant mortality rates that started several years earlier. Fetal mortality decreased enough during this period to overcome the tendency of the mortality rate in early infancy to flatten out.
No new insights are obtained about trends from the perinatal mortality rates by sex or race. There has been no reduction in the sex or racial differences in PMR II between 1945 and 1962. Male births have been subject to a 20-23 per-cent higher risk of perinatal death than female throughout this period. Nonwhite births have consistently had close to a 70 percent higher risk than white.
THE CURRENT STATUS OF INFANT AND PERINATAL MORTALITY
Infant Mortality
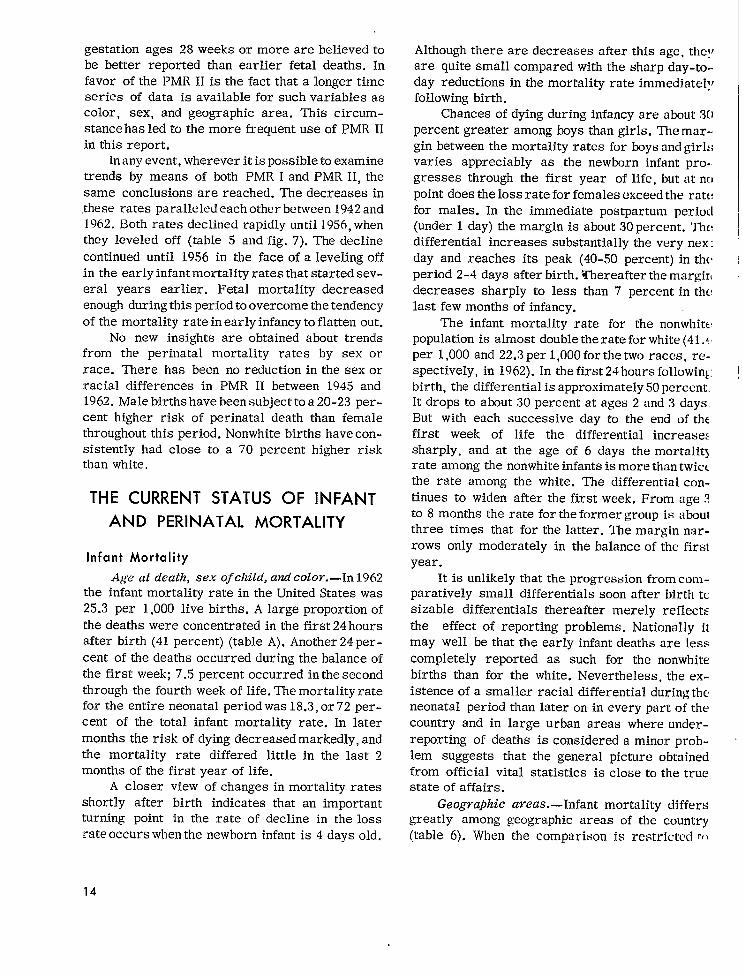
Age at death, S~X of cj~~l~, ad coLoy._~n 1962 the infant mortality rate in the United States was 25.3 per 1,000 live births. A large proportion of the deaths were concentrated in the first 24 hours after birth (41 percent) (table A). Another 24 per-cent of the deaths occurred during the balance of the first week; 7.5 percent occurred in the second through the fourth week of life. The mortality rate for the entire neonatal period was 18.3, or 72 per-cent of the total infant mortality rate. In later months the risk of dying decreased markedly, and the mortality rate differed little in the last 2 months of the first year of life.
A closer view of changes in mortality rates shortly after birth indicates that an important turning point in the rate of decline in the loss rate occurs when the newborn infant is 4 days old.
Although there are decreases after this age, the!r are quite small compared with the sharp day-to.. day reductions in the mortality rate immediately following birth.
Chances of dying during infancy are about 30 percent greater among boys than girls. The mar-. gin between the mortality rates for boys and girh; varies appreciably as the newborn infant progresses through the first year of life, but at nc)
point does the loss rate for females exceed the ratt: for males. In the immediate postpartum periocl (under 1 day) the margin is about 30 percent. The: differential increases substantially the very nex: day and reaches its peak (40-50 percent) in tht period 2-4 days after birth. Thereafter the margir~ decreases sharply to less than 7 percent in the last few months of infancy.
The infant mortality rate for the nonwhitx population is almost double the rate for white (41 .L per 1,000 and 22.3 per 1,000 for the two races, respectively, in 1962). In the first 24 hours following, birth, the differential is approximately 50 percent. It drops to almut 30 percent at ages 2 and 3 days. But with each successive day to the end of the first week of life the differential increases sharply, and at the age of 6 days the mortalit~ rate among the nonwhite infants is more than twice the rate among the white. The differential continues to widen after the first week. From age 3 to 8 months the rate for the former group is about three times that for the latter. The margin narrows only moderately in the balance of the first year.
It is unlikely that the progression from comparatively small differentials soon after birth tc sizable differentials thereafter merely reflects the effect of reporting problems. Nationally it may well be that the early infant deaths are less completely reported as such for the nonwhite births than for the white. Nevertheless, the existence of a smaller racial differential during the neonatal period than later on in every part of the country and in large urban areas where under-reporting of deaths is considered a minor problem suggests that the general picture obtained from official vital statistics is close to the true state of affairs.
Geogvajhic a~eas. —Infant mortality differs greatlY among geographic areas of the country (table 6). When the comparison is restricted t,,
14
I

------------
12 -------------3 -------------4 -------------5 -------------6 -------------
----------------------------
---------------------------------------------------------------------------------------------------------------------
TableA. Infantmortalityratesby age, color,and sex:UnitedStatea,1962
SM.~s.[DMIIrvfm’only (O deathsoccwrinc., withinthe United Excludes fetal deaths. F]gures by-color exclude data for residents of New Jersey because thisStatedidnot require reporting oftheiten~
Total White ITonwhite
AgeBoth Male Female Both Male Female Both Male Femalesexes sexea sexes
Rates per 100,000livebirthsin specifiedcolor-sex groupa
Under 1 year- 2,531.1 2>857.7 2.L88.8 2.233.7 2,543.7 1,907.3 4,135.9 4,568.5 3,693.0
Under28 days-- 1.832.0 2,086.8 1,565.0 1,935.6 1,423.0 2,605.1 2,893.7 2,309.7
959.1 1,084.1 827.6 1,434.1 1,616.9 1,247.0Under 1 day-------- 1,035.9 1.170.7 894.2
1,685.9 zUnder1 hour1-23houra
day-------------daysdaysdaysdayadays
7-13days14-20daya21-27days
28-59days 2 months 3 montha 4 months 5 months b months 7 months 8 mmths 9 months 10months11 months
198.6 209.8 187.0 184.8 192.8 176.4 264.8 290.5 238.5 837.1 961.0 707.2 774.4 891.4 651.2 1,169.3 1,326.4 1,008.5
262.0 301.6 220.6 247.4 291.3 201.2 337.8 358.0 317.0 173$1 206.9 137.7 165.2 200.9 127.6 215.4 242.8 187.4 77.4 92.1 62.1 73.3 87.7 58.2 100.8 119.2 82.0 43.6 51.2 35.7 39.3 47.7 30.5 66.1 69.3 62.8 31.2 35.4 26.8 27.7 31.5 23.6 50.2 57.0 43.2 22.8 24.7 20.8 19.4 21.2 17.5 41.6 44.1 39.1 91.5 100.0 82.7 77.4 85.6 68.8 168.8 181.2 156.1 53.0 58.6 47.2 42.7 47.5 37.7 109.1 116.8 101.3 41.5 45.8 37.1 34.3 38.0 30.3 81.2 88.4 73.8
161.5 188.2 133.5 129.3 152.1 105.2 337.6 385.1 289.0 132.4 149.8 114.3 104.5 120.2 87.9 289.3 317.3 260.6 96.8 106.0 87.1 74.7 82.9 66.2 219.8 235.7 203.5 71.4 77.0 65.4 53.7 57.7 49.3 169.3 185.2 153.0 55.6 57.6 53.6 41.3 42.6 39.9 133.4 140.2 126.5 44.3 46.1 42.5 34.7 36.8 32.5 93.7 95.2 92.1 35.7 39.7 31.6 28.2 31.2 25.0 77.5 88.1 66.6 30.4 33.2 27.4 23.6 25.1 22.1 68.1 79.2 56.8 26.0 27.6 24.2 21.1 22.7 19.4 52.4 54.5 50.2 23.1 23.3 22.9 19.1 L8.7 19.6 46.1 49.3 42.0 21.9 22.3 21.5 17.6 18.1 17.2 43.6 45.0 42.3
I
Source:AnnualvolumeVitalStatisticsof the UnitedStates,NationalCenterfor HealthStatistics,PublicHealthService,Washington,U.S.GovernmentPrintingOffice.
thewhiterace,therange among theratesisquite
small. Despitethevariationuneconomic compo
sition, and inmedicalindegrees ofurbanization,
resources, only about 19 percent separatesthe
geographic division(Mountain)with the highest
rate (25.7 per 1,000) from the division(West
North Central)withthelowestrate(21.6per 1,000)
(infantmortalityrates for 1959-61).Six of the
ninegeographicdivisionshaveratesthataresepa
ratedbylessthanlOpercent.Intheotherthreedi
visions(EastandWest SouthCentralandMountain)
the rates are 10-20 percentabove thefiguresin
the areas with thelowestrates.Only 15 percent
separated the neonatalmortalityrate for white
infantsin the high area from therateinthelow
area. During the postneonatalperiod the rates
diverge, and the margin between low and high
areas increasesto almost 40 percent.
The situationis entirelydifferentamong
nonwhite births.The totalinfantmortalityrate
ranges from 30.4per 1,000inthe Pacificdivision
of Statesto 48.7 per 1,000 intheMountain di-
vision.The compositionof thenonwhitepopula
tionis,however, verydifferentinthesetwoareas.
Over athirdof thenonwhitepersonsinthe Pacific
area are Oriental, and three-fourths in the
Mountain divisionare American Indian.In the
other divisionsall but a small proportionare
Negro. When thecomparison isconfinedtothese
divisions,the gap between low and high is still
15

�
larger than that among the white infants. This is due to major geographic differentials in the post-neonatal rates for nonwhite infants. Rates in the South Atlantic and East South Central parts of the country (19.2 per 1,000 and 19.8 per 1,000, respectively, in 1959-61) are almost twice the rates in the New England and Middle Atlantic areas (10.3 per 1,000 and 11.2 per 1,000, respectively). The variation among the neonatal rates (excluding those for the Mountain and Pacific divisions) is negligible by comparison.
Generally a geographic area with a comparatively low rate among white infants also has a comparatively low rate among the nonwhite; this is also true for high rates. A more important observation is that infant mortality is far greater everywhere among the nonwhite children. The gap is narrowest in the Pacific division, where Oriental persons represent a substantial proportion of the nonwhite population. h But here, too, the margin—34 percent—is large.
Pursuing the issue of geographic variability in infant mortality rates on the basis of smaller aggregates of population than geographic division leads to a number of inferences that are highly relevant to the present discussion. Taking the State as the unit, it is clear that with only a few exceptions the State rates for white births cluster very closely around the national average; for non-white births the spread is substantial (table 7). In every State with sufficient numbers of births to make the comparison (except Hawaii), infant mortality in the nonwhite group is considerably above the rate in the white. These findings are consistent with what has already been pointed out for the geographic divisions. They support the fact that geography does not alter certain fundamental properties of the infant mortality rate at the present time —i.e., an underlying similarity in the level of the rate for the white population when large areas are the unit of analysis and a wide gap between the loss rates for white and nonwhite children almost everywhere.
This is also confirmed when other geographic aggregates are examined. Comparison of mor
‘Infant mortality rates are lower among Oriental persons than among white. The higher rate among the nonwhite population in the Pacific division is due entirely to excess mortality among the other nonwhite persons in the area.
tality rates for metropolitan counties with those for nonmetropolitan counties as well as for cities classified by size leads to the same conclusion (table 8). As a further test infant mortality rates in the 51 cities with a population of 250,000 or more in the 1960 census have been compared. For white infants the lowest rate was 20.3 per 1,000; the highest, 29.6. Five sixths of the cities fell in the narrow range of 20.3-25.5 (data for 1960-61). In about half of the cities the rate among the nonwhite infants was at least 50 percent above the figure for the white. It should be noted that the cities are scattered throughout the country-in the North, South, East, and West.
In the previous discussion variation in the infant mortality rate for white infants has been characterized as relatively small where States, aggregates of States, or individual cities are considered. This should not obscure the fact that within each of the areas there are subregions or neighborhoods (as in the case of cities) with loss rates that deviate widely from overall averages. A more detailed approach to the question of geographic variability in infant mortality would lead to groupings of areas based on demographic, economic, and medical resource indices and to a clearer identification of special problem areas.
Cause of death. —Despite important limitations cause-of-death data are of some help in clarifying the nature of the loss in infancy. With the concentration of infant mortality in the first few days of birth a large proportion of the deaths are not clearly the culmination of a known, specific disease process. About two of five of the deaths are ascribed to a generalized state such as immaturity, unqualified and postnatal asphyxia. and atelectasis or to ill-defined diseases peculiar to early infant y. In almost another 10 percent of the cases the cause of death is birth injury, which combines many different circumstances and often does not reflect the underlying cause of death as much as the known, immediate mechanism which caused the death. Actually almost the entire set of conditions included under the general heading certain diseases of early infancy is, in a sense, vague and probably subject to considerable variation from place to place, from one population group to another, and in what the physician records as the particular cause of death. This restriction
16
-------------------------
------------------
-----------------
-----------------
------------------
----------------------------
-----------------------------------------
------
- - - - - - - - ---- - ----- - - - - --
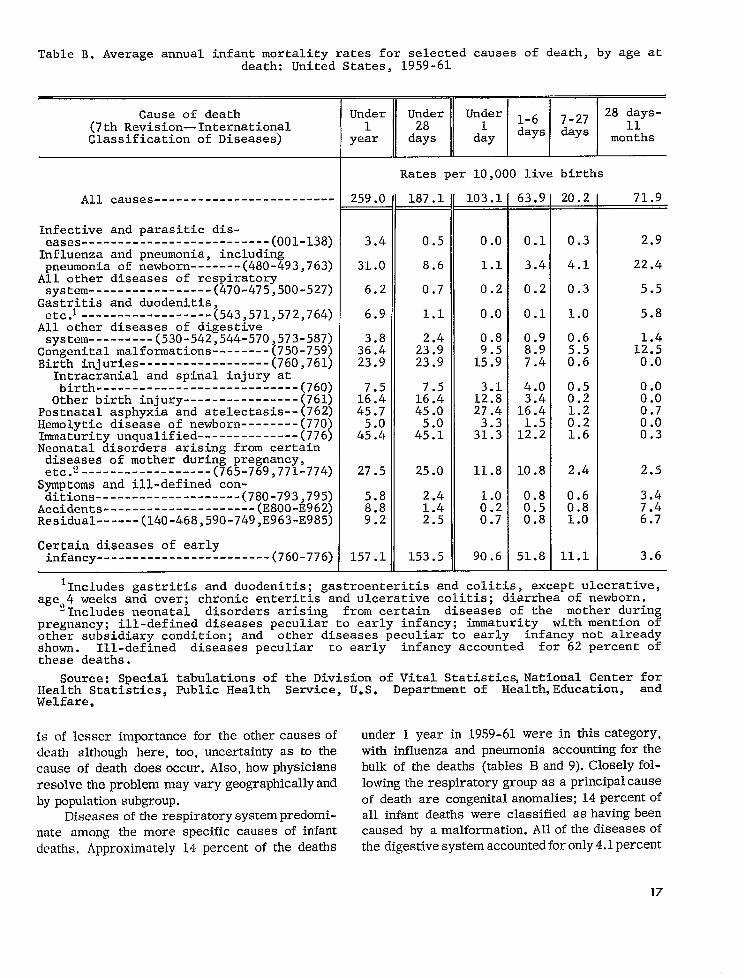
Table B. Average annual infant mortality rates for selected causes of death, by age at death: United States, 1959-61
>
Cause of death Under Under Unpr 1-6
7-27 28 days(7th Revision—International 1 28 11 Classification of Diseases) year days day days days
months
Rates per 10,000 live births
All causes 259.0 187.1 103.1 63.9 20.2 71.9
Infective and parasitic diseases-.------ (001-138) 3.4 0.5 0.0 0.1 0.3 2.9 Influenza and pneumonia, including pneumonia of newborn-------(48O-493,763) 31.0 8.6 1.1 3.4 4.1 22.4
All other diseases of respiratory system (470-475,500-527) 6.2 0.7 0.2 0.2 0.3 5.5
Gastritis and duodenitis, etc.1--.-.-------------(543,571,572,764) 6.9 1.1 0.0 0.1 1.0 5.8
All other diseases of digestivesystem (530-542,544-570,573-587) 2.4 0.8 0.9 0.6
Congenital malformations (750-759) 3::: 23.9 8.9 1::2 Birth injuries (760,761) 23.9 23.9 1;:2 7.4 i:; 0.0
Intracranial and spinal injury at birth (760) 4.0 0.5 0.0
Other birth injury----------------(76l) 1;:: 1[:: 1;:: 3.4 :.; 0.0 Postnatal asphyxia and atelectasis-- (762) 45.7 45.0 27.4 16.4 0.7 Hemolytic disease of newborn--------(77O) ::: 0.0 Immaturity unqualified--------------(776) 4;:: 4::! 3?:: 1::2 . 0.3 Neonatal disorders arising from certain diseases of mother during pregnancy,etcOS------------------(765-769,771-774) 27.5 25.0 11.8 10.8 2.4 2.5
Symptoms and ill-defined conditions (780-793,795) 5.8 2.4 0.8 0.6 3.4
Accidents (E800-E962) 1.4 u 0.5 0.8 ;.:Resi,dual (140-468,590-749,E963-E985) ::; 2.5 0.7 0.8 1.0 .
C;;;~~ydiseases of early (760-776)~ 157.1 153.5 90.6 51.8 11.1 3.6
‘Includes gastritis and duodenitis; gastroenteritis and colitis, except ulcerative, age,4 weeks and over; chronic enteritis and ulcerative colitis; diarrhea of newborn.
‘Includes neonatal disorders arising from certain diseases of the mother during pregnancy; ill-defined diseases peculiar to early infancy; immaturity with mention of other subsidiary condition; and other diseases peculiar to early infancy not alreadyshown . Ill-defined diseases peculiar to early infancy accounted for 62 percent ofthese deaths.
Source: Special tabulations of the Division of Vital Statistics,National Center forHealth Statistics, Public Health Service, U.S. Department of Health,Education, andWelfare.
is of lesser importance for the other causesof death although here, too, uncertainty as to the cause of death does occur. Also, how physicians resolve the problem may vary geographically and by population subgroup.
Diseases ofthe respiratory systempredominate among the more specific causes of infant deaths, Approximately 14 percent of the deaths
under 1 year in 1959-61 were in this category, with influenza and pneumonia accounting for the bulk of the deaths (tables B and 9). Closely following the respiratory group as a principal cause of death are congenital anomalies; 14 percentof all infant deaths were classified as having been caused by a malformation. All of the diseases of the digestive system accountedforonly 4.lpercent
17

of the infant deaths, and the infective and parasitic disease category was responsible for an even smaller proportion of the mortality (1.3 percent).
The relative importance of the various causes of death shifts radically as the infant advances in age. In a matter of several days the overwhelming concentration among causes that reflect the influence of conditions present before the birth or that occur during the birth is attenuated. At ages 7-27 days certain diseases of early infancy accounts for only about half of the deaths; in the post-neonatal period this category is of negligible significance. The infectious diseases, particularly pneumonia and influenza, dominate the causes of death after the first 4 weeks. With regard to mortality due to congenital malformations the rate re-mains comparatively high throughout infancy.
Cause-of-death data give the strong impression that no special group of conditions is responsible for the excess mortality among males during infancy. The rate for every major cause of death, whether biological or environmental in origin, was substantially higher among males than females. To be sure, the relative margin varied from one cause-group to another; e.g., the difference between rates for congenital malformations was under 20 percent, and the difference between rates for birth injuries was especially large (40 to 50 percent). But the basic observation remains: male infants had a distinctly higher mortality rate than female infants in all important cause-of-death categories. Among the comparatively low frequency causes one stands out as an exception to the rule. This is hemolytic disease of the newborn. Here the difference between the rates for males and females is negligible.
Less consistency is found when cause-of-death rates are compared for white and nonwhite infants. Although styles of reporting causes of death may differ for these two population groups, it is clear “that infectious diseases of all types are more common causes of death both early in in-fancy and later on among the nonwhite births than the white. Compared with the margin for these causes, the rates for birth injuries and other digestive diseases are quite similar for the two races. In two cause categories, congenital anomalies and hemolytic diseases, the rates are higher among white than nonwhite infants.
Fetal and Perinatal Mortality
As previously discussed, national data on fet: 1 mortality are most extensive for fetal deaths c,f 20 weeks or more gestation. About 85 percent c,f the population in the United States lives in areas covered by laws that limit fetal death reporting t> this gestational age. In most of the other areas, reporting is required for all products of concep tion without regard to gestational age. Unless otherwise stated, measures of fetal loss discusse i below refer to fetal deaths of 20 weeks or mor t gestation (plus fetal deaths of unknown gestatio a age).
The fetal death ratio in 1961 was 16.1 per 1,000 live births (table 4). This almost equals th 2 neonatal death rate (18 .4). The male-female dif ferential in fetal loss was 12 percent; this is considerably less than the differential found in th: neonatal mortality rate (32 percent). On the othe c hand, the margin between the white and nonwhite races is much greater for fetal loss (91 percent) than for neonatal deaths (55 percent).
Fetal death ratios for geographic division ~ have a wider dispersion around their nationa 1 average than is the case for neonatal death rates (tables 5 and 6). Even so, the range from high to low is not extraordinary in the white population; in the nonwhite the range is 57 percent among the divisions whose nonwhite populations are almost exclusively Negro. This assessment of the variation among geographic divisions is based on an adjustment of the ratios for the Middle Atlantic division of States. The white and nonwhite ratio:; are higher in this area than anywhere else. Thi:j is due to an artifact of reporting. Because of special promotional campaigns to obtain reports of all fetal deaths, New York City, which is con.. tained in the Middle Atlantic division, has an es.. pecially high ratio for fetal’ deaths in the categor:~ 20 weeks or more gestation and gestation not stated (28.0 per 1,000 live births in 1959-61), Excluding the New York City experience from tht: Middle Atlantic division lowers the 1959-61 ratio~i to 15.8 for the geographic area. With these ad-. justments the areas that emerge as having tht: highest fetal death ratios are the South Atlantic: and East South Central. These are the two divisiom + that also had the highest neonatal death rates,
18
No new insights are gained from the perinatal mortality rates. This, of course, results from the similarity in the direction of differences in fetal and early infant loss rates for the variables sex, race, and geographic area. Compared with mortality rates for early infancy, the perinatal mortality rates show a narrower male-female rn:lrgin, a larger white-nonwhite differential, and ~1-LYltL3?” )~~()!~r~phic v~ri~~tion.
Other Selected parameters of Infant Mortality
12iYt11 twi,yhl. —-(Jne of the most important [hV.?LldS that runs through any consideration of infant mortality is the critical role of the maturity of the infant at birth. For years the primary measure used in statistical studies to classify the newborn infant by developmental maturity has been weight at birth. From the beginning the imperfections of this measure have been recognized. A major source of dissatisfaction arose from the clinical observation that a particular birth weight retlects different levels of maturity in various population subgroups. In favor of relying on birth weight has been the comparative ease of collecting on a mass scale reasonably uniform data subject to less error than such other measures of maturitY as gestation age and heel-to-crown length. There is good reason to continue to exert efforts to improve the reporting of gestation age; in fact, moves in this direction are increasingly being made by offices of vital statistics. Such improvement will not mean that birth weight will be replaced by gcwt:~tion age but rather that additional classifications will become available for the study of high-risk groups of infants. Although the main brunt of the analysis that follows is borne by the birth weight item, some indication of what maybe learned through the joint use of birth weight and ;:estation age data is also provided.
It is often desirable to discuss the relationship of birth weight to many parameters in terms of all children who weighed 2,500 grams or less and the remaining children who weighed more than 2,500 grams. Until recently the terms premature and immature were applied to the former group. In view of the literal interpretation of these terms and the recobmition that birth weight has serious shortcomings as a criterion for prematurity, the phrase low birth weight has come into favor. AS used here, this phrase refers to infants with birth wc~iqhts of 2 ,5(Io grams (S!i pounds) or less.
Based on data for a recent period (1960), 7.7 percent of the infants have low ‘birth weights: i.e., 2,500 grams or less (table C). Very small babies (1,500 grams or less) represent almut 1.1 percent of all live births. A somewhat higher pro-portion weigh 1,501-2,000 grams (1.4 percent). With increasing weight the proportion rises sharply, and 5.1 percent, or two-thirds of all those weighing 2,500 grams or less, are in the categor y 2,001-2,500 grams. The modal weight group 3,001-3,500 grams contains 38 percent of the live-born infants. Above this weight the decrease is rapid, and only 1.6 percent are born at the very high weights 4,501 grams or more.
Members of plural sets represent 2.0 percent of all live births, but they account for 14 percent of the children weighing 2,500 grams or less at birth. Over half of the children in multiple de-liveries (54 percent), as compared with 6.8 per-cent among single births, are at these low weights. This is by far the largest differential between two groupings of births in the proportions that are at low birth weights. Nevertheless, differences of great significance in assessing the problem of early infant mortality are found among many other variables. Female babies are more likely than male infants to have low birth weights. An interesting feature of this relationship is that the entire excess in low birth weights is concentrated in the 2,000-2,50()-gram weight group. Under 2,001 grams the proportions are similar for males and females.
Racial differences in birth weight are marked. The likelihood of a nonwhite infant being born at low birth weights where major problems of obstetric and pediatric care exist is almost twice as great as for a white infant.
The only set of national data available on the relationship of birth weight to mortality was compiled by the National Vital Statistics Division (NVSD) from a special study of the experience in January-March 1950.9 There is reason to believe that the associations have not changed materially since this study. As previously stated, in making comparisons between subgroupings of the population, similar birth weights may often involve children with quite dissimilar physical developments.
Among infants weighting 2,500 grams or less at birth, 174 in 1,000 died within 4 weeks after birth (table D). This rate is extremely high in
19

--------------------------------------------------
---------------------------------------
-----------
------------------------------------------------------------------------------------------------------
-----------
-----------
Table C. Percent distribution of live births, by birth weight and selected characteristics: United States, 1950 and 1960
Plurality Sex Color
Birth weight Total [ I I 1 I
Single Plural Male Female White Nonwhite
~ Percent distribution
Total------------------- 100.0 100.0 100.0 100.0 100.0 100.0 100.0
1,000 grams or less 0.5 1,001-1,500grams 0.6
0.5 0.5
4.7 5.4
0.6 0.6 ::2 R 1.0
1,501-2,000grams 1.4 1.2 14.0 1.4 1.5 1.3 ;:; 2,001-2,500 grams 29.5 2,501-3,000 grams------------- 1::: 1;:: 29.6 1::; 2?:; 1% 2!:; 3,001-3,500 grams 38.0 38,5 13.9 36.3 39.8 38.1 37.1 3,501-4,000 grams 26.8 27.3 29.5 23.9 28.2 18.9 4,001-4,500 grams ;.: 7.6 ;:: 9.2 5.6 8.0 4.6 4,501 grams or more----------- . 1.6 0.0 2.1 1.0 1.6 1.3
2,500 grams or less 53.7 12.82,501 grams or more----------- 9;:; 9!:; 46.3 9;:: 9::2 9!:: 87.2
Median birth weight----------- 3,310 3,320 2,440 3,370 3>250 3,340 3,150
~
Total------------------- 100.0 100.0 100.0 100.0 100.0 100.0 100.0
1,000 grams1,001-1,5001,501-2,0002,001-2,5002,501-3,0003,001-3,5003.501-4.0004;001-4;5004,501 grams
2,500 grams2,501 grams
or lessgramsgramsgramsgramsgramsgramsgramsor more----------
or lessor more-----------
::2 0.4 0.5
4.0 0.5 0.6 M 0.4
0.6 0.6 0.9
1.4 12:? 1.4 1.3 ::: 30.0 H :::
1::: 18.1 29.0 1;:: 21.2 1;:: 21.4 37.9 38.4 13.8 36.2 39.6 38.3 35.3 26.8 27.3 29.6 23.9 2;.; 2:.; 7.5 ::; 9.3 5.6 1.9 ;:; 0.1 2.5 1.3 1:7 3:3
6.6 54.1 10.4 9::: 93.4 45.9 9;:: 9::: 9;:: 89.6
Median birth weight 3,310 3,330 2>440 3,380 3,250 3,320 3,250
Source: Annual volumes Vital Statistics of the United States, National Center fo,~Health Statistics, Public Health Service, Washington, U.S. Government Printing Office,
comparisonwiththerateforallotherinfants,7.8Infact,although withlowbirthper1,000. children
weightsrepresentonly7.7percentofallthenew-borninfants,deathsamong thesechildrenaccountfor two-thirdsof thetotalnumber of neonataldeaths.
Only averysmall proportionofthechildrenunder1,001grams (1of8)livedthroughthefirst
28 days.Chances of survivalimprovedconsid-erablywithamoderate increaseinweight,buts
littleover halfof thoseweighing1,001-1,500grams alsodied.Mortalitycontinuedtodeclinesteeplywitheachadded500grams ofweight,andneonataldeathsat 2,001-2,500grams amounted
to 50.4per 1,000infants. decreasesSubstantialwere recordedwellintothehigherweightgroups;
20

------------------------------------------------------------------------------------------------------
-----------
Table D. Neonatal mortality by birth weight and selected characteristics: UnitedStates, January-March 1950
[Excludes data for Massachusetts]
Birth weight
Total-------------------
Sex Color
==T== White INonwhite
Rates per 1,000 live births of specified birth weight
20.0 18.3 98.6 22.7 17.1 18.9 26.7
871.7 871.7 871.5 894.2 848.0 883.3 821.4 551.3 562.3 503.7 621.8 478.2 562.1 507.0 211.0 228.9 145.4 265.0 160.5 214.6 195.7 50.4 52.8 32.9 67.4 36.6 50.6 49.5 12.6 12.6 11.3 16.6 9.5 12.0 15.4 6.7 6.7 10.4 8.1 6.2 5.6 5.6 118.7 6.4 ::2 4.9 1::;
138.1 12.5 1;:; J:; 1;:; 1;:; 1!:; 20.2
173.7 173.4 175.6 213.9 138.9 175.8 164.7 7.8 7.7 11.8 9.1 6.4 7.1 11.9
1,000 grams1,001-1.5001;501-2;0002,001-2,5002,501-3,0003>001-3>5003,501-4>0004,001-4,5004,501 grams
2,500 grams2,501 grams
or lessgramsgramsgramsgramsgramsgramsgramsor more----------
or lessor more----------
lRates based on less than 20 deaths.
NOTE: Figures for birth weight not stated are distributed.
Source: Shapiro, S. Influence of birth weight, sex, and plurality on neonatal lossin the United States. Am. J. Pub. Health 44:1142-ll_53,Sept. 1954.
theoptimum birthweightforthesurvivalofin-fantswas3,501-4 ,000,000grams (5.6deathsperl
Additional whenlivebirths). weight,particularlyitbroughttheweightabove4,500grams,was,ontheaverage,decidedlydisadvantageous.
Becauseoftheheavypreponderanceofpluralbirthsatthelowweights, mortalitytheneonatal
rateforbabiesborninmultiplesets was five to six timestherateforsinglebirths.C)na weightspecificbasis themortalityriskamong pluralbirthswas actually birthslowerthanamongsinglebetween1,001and3,000grams.Almvethispointsinglebirthshad a major advantage.
Duringtheneonatal riskperiodthemortalityformales andfemalesdifferedgreatlyatalmostevery weightlevel.The prognosiswas considerablybetterforgirlsthanforboysatmostbirthweights.Neonatalmortalityratesforfemalesatweightsbetween1,001and4,000grams wereone-
halftothree-fourthsofthoseforthemales.C)nlyinthehighestweightgroup(4,501gramsormore)was theratelowerformales.Thus, despitealess favorableweightdistributiongirlshad alowertotal mortalityneonatal ratethandidboys.
Below 2,001grams thenonwhiteinfantshadabetterchanceofsurvivalthandidthewhite.The
mortalityratesforthetwogroupsdifferedonlyslightlyat 2,001-2,500grams. At allhigherweightsthemortalityriskamong nonwhitebirthswas thegreater,withthegapbetweentherates
forthetwo racegroupsbecomingrelativelywiderat each successivelevelthrough3,501-4,000grams andthennarrowingslightly.
Birth weight and gestation a&fe.-Thecontributionthatcan be made by havingbothbirthweightand gestation has beenagedataavailabledemonstratedin a recentreportfrom theCo
operativeStudyof ChildDevelopment,Oakland,
TULI-1U2 O - G5 - 4
21
---------
----------
-------------------
--------------------------
------------------
California. Reference to one of the observations of this report will tend to underline the value of joint
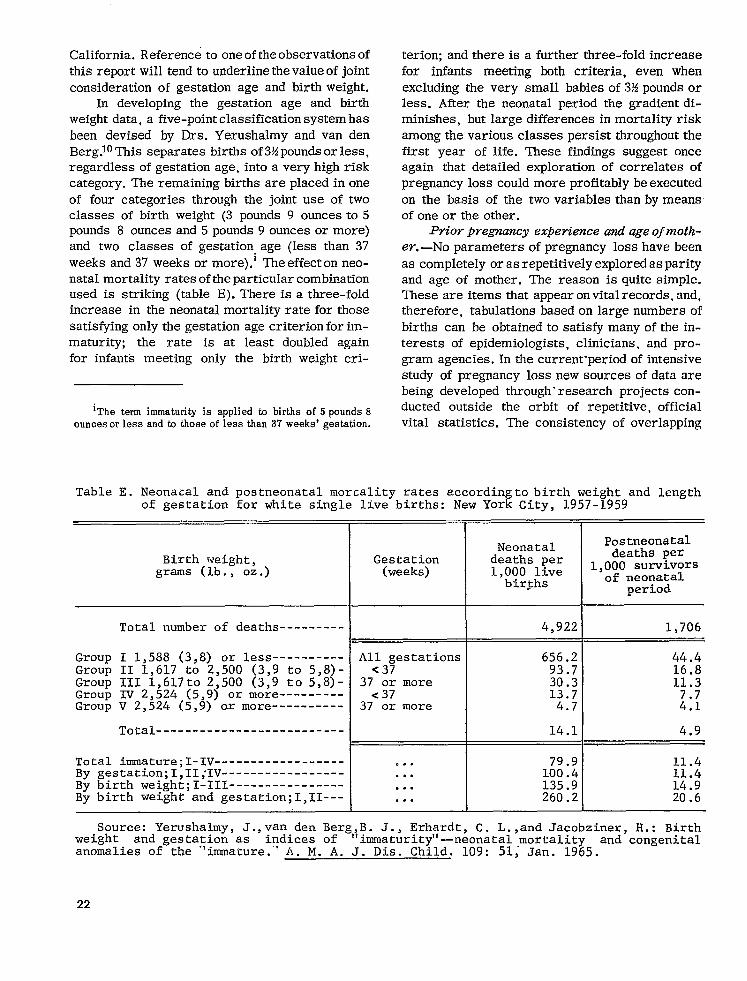
consideration of gestation age and birth weight. ln developing the gestation age and birth
weight data, a five-point classification system has
been devised by Drs. Yerushalmy and van den Berg.1° This separates births of 3!ipounds or less, regardless of gestation age, into a very high risk category. The remaining births are placed in one
of four categories through the joint use of two classes of birth weight (3 pounds 9 ounces to 5 pounds 8 ounces and 5 pounds 9 ounces or more) and two classes of gestation, age (less than 37
weeks and 37 weeks or more).1 The effect on neonatal mortality rates of the particular combination used is striking (table E). There is a three-fold increase in the neonatal mortality rate for those
satisfying only the gestation age criterion for immaturity; the rate is at least doubled again for infants meeting only the birth weight cri
‘The term immaturity is applied to births of 5 pounds 8 ouncesorlessandtothoseoflessthan37weeks’gestation.
Table E. Neonatal and postneonatal mortality
terion; and there is a further three-fold increase
for infants meeting both criteria, even when
excluding the very small babies of M pounds or less. After the neonatal period the gradient diminishes, but large differences in mortality risk
among the various classes persist throughout the first year of life. These findings suggest once again that detailed exploration of correlates of
pregnancy loss could more profitably be executed
on the basis of the two variables than by means of one or the other.
Prior pregnancy expedience and age of mothe
r. —No parameters of pregnancy loss have been as completely or as repetitively explored as parity and age of mother. The reason is quite simple. These are items that appear on vital records, and, therefore, tabulations based on large numbers of
births can be obtained to satisfy many of the interests of epidemiologists, clinicians, and pro-gram agencies. In the current-period of intensive study of pregnancy loss new sources of data are being developed through” research projects conducted outside the orbit of repetitive, official vital statistics. The consistency of overlapping
rates according to birth weight and length of gestation for white single live births: New York City, 1957-1959
I
Birth weight, grams (lb. , oz.)
Total number of deaths
Group I 1,588 (3,8) or lessGroup II 1,617 to 2,500 (3,9 to 5,8)Group III l,617to 2,500 (3,9 to 5,8)Group IV 2,524 (5,9) or moreGroup V 2,524 (5,9) ox more
Total
Total immature ;I-IVBy gestati.on ;I, II; IV-----------------By birth weight ;I-111----------------By birth weight and gestati.on;l,II---
PostneonatalNeonatal
Gestati_on deaths per deaths per
(weeks) 1,000 live 1,000 survivors
bir~hs of neonatal period
All gestations <37
37 or more <37
37 or more
0..
. . .
. . .
. . .
4,922 1,706
14.1
I 79.9 11.4
100.4 11.4 135.9 14.9 260.2 20.6
Source: Yerushalmy, J.,van den Berg,B. J., Erhardt, C. L.,and Jacobziner, H.: Birthweight and gestation as indices of ‘limmaturityll-neonatal mortality and congenitalanomalies of the ‘linmrature.”lA. M. A. J. Dis. Child. 109: 51; Jan. 1965.
22
4.9

findings is so high that the full range of information could be viewed as additive despite its diversity in time and place.
The NOVS study of live births early in 1950 probed into the association between the birth order, age of mother and prior fetal loss, and the incidence of low birth weight and neonatal mortality. 11 It was found that the rate of low birth weight varied only moderately by birth order (table IO). The rate was highest among first births and births of fifth and higher order (7.7 per 100). ‘This was not much greater than the low figure found among second order births (6.9). Excluding births to mothers at ages 15-19 years where the risk was particularly high (9.0 per 100), the vari-
PERCENT [6 —
Fourth birth 14 — $,
\
Third ‘$, blrlh
12
Second 10
+,+,,
�,.,+,
8 First — birth
6
0-
15-19 20-24 25-29
ation by age of mother was also modest. The rate was at a minimum at ages 25-29 years (6.7) and then increased moderately to a high of 7.7 after age 35 years.
Interaction of birth order and age of mother results in a far greater variation in the rates of low birth weight than is indicated when each of these parameters is considered separately (fig. 8). The rate among first births was at its lowest point among women 20-24 years of age. From age 30-34 on the risk increased sharply and about 1 of 8 of the first- barn infants to women 40-44 years old weighed 2,500 grams or less. Rates for the other birth orders followed, in general, an inverted J-shaped curve, with the highest rates usually_
_,,,,,,,,,,, n*,mm,,..slnm*lnll1*,,*
. . 30-34 35-39 4U-44
AGE OF MOTHER (in years)
NOTE: FiWrcs for birth weight, birth order, and age of mother not stated are distributed. Total-birth order refers to number of children ever born mntht,r, inr ludin~ fetal ,deaths. Excludes data for Ma.ssachusetta.
Suurcv; N~tiunil Office of Vital Statistics: Weight at birth and survival of newborn, by age of mother and total-birth order, by J. Lo?b. Vital Sta\/Irs -S/uriu2 hfm’ts, Vol. 47, No. 2. Public Health Service. Washington, D.C., 1958.
Figure 8. Percent of 1 ive births at birth weights of 2,500 grams or less, by age of mother and total-b irth order: Uni ted States, January-March “[950.
23

----------
-------------------------------
-------------------------------
-------
found atthevery young ages 15-19 years. Uninteresting feature of the birth order rates is that their narrowest margin occurred at ages 30-34 years.
Intervening variables unquestionably exert an important influence on the relationships discussed. Illegitimacy, which is particularly high under 20 years of age, may provide part of the answer to why the rates for low birth weights are so high among these young women. 12 The explanation for the sizable increase under age 30 in the risk of low birth weight that accompanies increasing birth order (except for first births) is more uncertain. On the surface, the demographic parameters that are implicated include socioeconomic status, child spacing, and prior fetal loss. However, parity and age may have biological significance independent of these variables.
The importance of prior pregnancy outcome in assessing the risk in the current pregnancy is unequivocal (table F). The proportion of children weighing 2,500 grams or less at birth was more than 1!4times as high among births of women who had reported at least one prior fetal death as
among other births (10.0 and 6.2 per 100 single live births, respectively). Birth order differentials do not explain these relationships. On the contrary, the increase in the risk of low birth weight among births preceded by a fetal death is more marked when comparisons are made by birth order than when birth order is ignored.
As might be expected, the associations be-tween low birth weight and birth order and age of mother are generally paralleled by the neonatal mortality rates (table 11 and fig. 9). The loss rate among first births was moderately high among women 15-19 years of age. It dropped sharply to a low point at ages 20-24 and climbed rapidly as age increased beyond 30 years. Second order births among women aged 25-29 had a particularly favorable loss rate. In fact, the lowest neonatal mortality rate for any age-birth order group was in this category (14.3 per 1,000 live births as compared with the rate of 20.0 for all birth orders and ages combined).
Although the patterns of neonatal mortality rates have some similarity to those of the rates for low birth weights, there are several notable
Table F. Percent of single live births at birth weights of 2,500 grams or less, by total-birth order, outcome of previous deliveries, and color: United States, January-March 1950
order[Total-birth refers to number of children wry born to mother, including fetal deaths. Excludes data for Massachusetts]
Total White Nonwhite
Birth order Prior fetal Prior fetal
Total II deaths I
TotaI = Total deaths
None :.;: None :.;: None 1 or more
Total
First Second Third Fourth Fourth--------------Fifthand over
Percent of current live births at birth weights2,500 grams or less
6.4 6.2 10.0 6.0. 5.9 10.0 8.6 8.4
6.8 11.4 ::: 5.; 10.; 5.6 5.; - 9.1 8.;
10.5 1::; n H 10.2 ::; H 10.1 ;:: ::: 5.9 5.4 9.5 5.7 5.1 9.7 6.6 6.0
10.1
13. i10.710.89.1
NOTE: Figures for birth weight and birth order not stated are distributed.
Source: National Office of Vital Statistics: Weight at birth and survival of new-born, by age of mother and total-birth order, by J. Loeb. Vital Statistics-Special Reports, Vol. 47, No. 2. Public Health Service. Washington, D.C., 1958.
24

CHILDREN WEIGHING ALL CHILDREN
2,500 GRAMS OR LESS
430 FIRST BIRTH ‘-” SECONO BIRTH I- I-I THIRD BIRTH —“t----l 400
L FOURTH BIRTH I,~IIIIIIJI
1FIFTH BIRTH --mm
I ANo OVER I 370 -42t_____l
38 $ 1-K ‘6 ~ 34 — > i o
_.
a \ III 250 —~ a 26 —\ (0u + < = 22 — <..--- ”-”
160
14 130
1 1 1
LI_LLLu o~ 15-19 20-2425-2930-3435-39 40.44 15-19 20-2425-2930-34 35-3940-44
AGE OF MOTHER (in years) AGE OF MOTHER [in yeors)
CHILDREN WEIGHING
2,501 GRAMS OR MORE
15 .
14
13
12
II
10
9
B
7
6
5
—o T T T T
15-19 20-24 23-2930-3435-3940-44
AGE OF MOTHER (in years)
NOTE: Based ondeaths under 28d2ysamong children born Jan. lto Mar. 31, 1950. Rates per 1,000 Iive births in specified group. Total-birth order .cfer~ to n~mb~r CIfchildren ww bm.n @ mother, including fetal deaths. Figures for birth weight, birth order, cnd age of mother not stated are dis
ributed. Excludes data for Massachusetts.
Source: N~tional Office of Vital Statistics Weight at birth and survival of newhorn, by age of mother and total-birth order, by J. Loeb. Vital Sta
islics-Sfkcial Ifeports, Vol. 47, No. 2. Public Health Service. Washington, D. C., 1958.
Figure 9. Neonatal mortality rates by birth weigkt,age of motherland total-birth order:
United stateS, January-March 195G.
differences. Between ages 20 and 39 the relative margins among the neonatal death rates by birth order are greater than those among the low birth weight rates. Fifth and higher order births with their high mortality at every age ofmother con-tribute greatly tothissituation. Anotherdifference is that the shape ofthe curves for neonatal death rates more nearly approximate “U” than are-versed “J,” as was the case for the prematurity
rates. In other words, the risk for mortality clefinitely swings up after age 30 regardless of the birth order. The reason for this is found inthe mortality experience among babies bornweighing more than 2,500 grams. Here the mortalitycurve is J-shaped for every birth order. The turning points occur at different ages, but the pictureis the same—exceptionally high mortality after35 years ofage. Again first births are an exception,
25
1

---------------
-------
---------------
----------------------
-------------------------------
----------------------
Table G. Neonatal mortality rates among single live births, by birth weight, color,total-birth order, and outcome of previous deliveries: United States, January-March1950
[Based ondeaths under 28daysamong children bom January l-hiarcl, ~l, 1950. Total-birth order refers tn number of children ever born tKImother, including fetal deaths. Excludes data for Massachusetts
Birth weight of current live birth
All birth weights 2,500 grams or less 2,501 grams or more
Color and birth ordexPrior fetaldeaths
Total Total
None ~o~ ‘Tot”I=i5iE
Total Rates per 1,000 live births in specified group
Total---------- 18.3 17.6 35.8 173.4 168.8 7.5 13.3
First---------------- 18.4 17.2 27.6 Second 16.2 15.; 34.; 173.4 171.; 223.3 6.3 6.; 12.; Third---------------- 17.8 16.9 33.0 185.9 180.6 233.0 Fourth--------------- 19.1 17.2 38.9 183.6 170.9 259.4 ::: ::: 1;:: Fifth and over 23.4 21.3 36.5 212.6 205.5 236.9 11.4 10.8 15.5
White
Total---------- 17.3 16.6 36.1 176.7 172.0 6.9 12.4—
First---------------- 17.2 156.1 Second 15,4 15.; 32.~ 175.6 173.i 228.; ;:: Third---------------- 17.4 16.6 32.6 192.1 186.5 242.3 7.0 in 10.;
Fourth 18.1 16.3 39.5 182.6 168.6 270.4 Fifth and over 22.7 20.4 38.9 226.2 217.9 256.9 1::: ;:; g::
.
Nonwhite
Total---------- 24.4 23.5 34.9 159.5 154.9 204.0 11.7 11.3 15.9
First 27.6 136.6 13.6 Second 23.3 22.; 47.; 161.6 159.; 206,1 22.; Third---------------- 20.4 19.2 34.7 157.6 153.8 190.8 ::; ::: 15.8 Fourth 23.4 21.8 36.8 187.3 179.8 224.5 11.1 10.7 14.0 Fifth and over 25.1 23.4 32.4 184.1 178.2 201.6 13.8 13.5 15.3t
I
NOTE: FQures for birth weight and birth order not stated are distributed.
Source: National Office of Vital Statistics:Weight at birth and survival of newborn, by age of mother and total-birth order, by J. Loeb. Vital Statistics-SpecialReports, Vol. 47, No. 2. Public Health Service. Washington, D.C., 1958.
with the sharp increasein mortalityoccurringintheearly30’s.
weightinfantsAmong thelowbirth thepatternisnotnearlyasclearanddefiniteasamongchil-drenwithbirthweightsover2,500grams.Whatisapparentisthatforsecond, andfourthorderthird,births, variationthereislittle intheneonatalmor
ratesatmost ages.Also,exceptatthetality more
26
advancedages fifthandhigherorderbirthshavethehighestmortalityrate.
Childrenborntomotherswho had apreviouspregnancyendinginafetaldeathhadintheneo-natalperiodtwicethemortalityrateoftheother
G).Thisincreasedmortalitychildren(table riskwas presentat allbirthorders.Onlypartoftheincreasedriskswas due toa higherrateofpre-

--
Q. ~ ro u a Q u ii ~ 60 u n.u)
~
In 50 : wc1
First birth
$ 40 uIL w2 d
30 w z1- Sixth birth and overm Fourth
*++ - 1-, -,-,-,-,- ,-a-8-G birth �
~ 20 Thirdz birth
~ Second 10 ‘ birth —
$ n
m ul-o<E 15-19 20-24 25-29 30-34 35-39 40-44
AGE OF MOTHER (inyeors)
NOTE; Data for Massachusetts are not included because tbis State dld not require the repm’ting of birtb order. Figmres for birth order not stated and ur agc of mother not stated are distributed. Includes only fetal deatbs forwhich the period of gestation was given as 20 weeks, or 5 months, ormor? ru usnot stated, Total-birth order refers to number of children ever born to mother, including fetal deatbs.
Source: Annual volumes Vital .$frttistics o~tke lJnited Sfates, National Center for Healtb Statistics, Public Healtb Service, Washington, U.S. Governnwrt Printing OffIce.
Figure 10. Average fetal death rates by age of mother and total-birth order: United States, 1960-61.
maturity. In general, neonatal mortality among both the prematurely born and the mature infants was greater among children born to mothers who
. had a previous fetal loss. Asinthe caseof neonatal deaths ,fetalmor
tality (at 20 weeks gestation or later) isstrongly relatedto age of mother and birth order(table 12
and fig. 10). The most favorable loss rates are found among gravida 2and3 womenin their 20’s, who accounted for 30 percent ofallpregnancies of 20 weeks or more gestation. More generaHy the low fetal mortality rate for women of a specified gravidity was at about the same age as occurred in the case of neonatal mortality.
The extent towhich the number ofprior fetal deaths is afactor in subsequentreproductive loss
has been explored on the basis ofvital statistics for white single births in upstateNew Yorkduring 1959 and 1960 (table H).13 Both neonatal and fetal mortality (20 weeks or more gestation) rose steeply as the number of prior fetal deaths in-creased. The neonatal mortality rate went from 14.4 per 1,000 live births where there was no prior fetal death to 129.3 per 1,000 live births where 3 or more fetal deaths preceded the cur-rent pregnancies. The corresponding fetal death rates showed a much bigger spread: 11.8to221.4.
Perinatal mortality rates provide even clearer evidence of the high risk associated with prior fetal loss. Almost a third of the women who had 3 or more previous fetal deaths had their pregnancies terminate with a perinatal death. This
27

------------------------
------------------------------
------------------------------
------------------------------
------------------------------
------------------------------
------------------------------
------------------------
------------------------------
------------------------------
------------------------------
------------------------------
Table H. Neonatal, fetal, and perinatal mortality rates for white single births, by total-birthorder and prior fetal deaths: upstate New york, 1950-52 and 195g-60
Prior fetal deaths
Birth orderl
Deaths under 28 days2
Total
FirstSecond-----------------------------ThirdFourth and over--------------------
Fetal deaths, 20 weeks or mores
Total------------------------
FirstSecond-----------------------------ThirdFourth and over--------------------
Perinatal deatha~
Total------------------------
FirstSecond-----------------------------ThirdFourth and over--------------------
Deatha under 28 days2
Total
FirstSecond-----------------------------ThirdFourth and over--------------------
Fetal deatha, 20 weeks or mores
Total------------------------
FirstSecond-----------------------------Third------------------------------Fourth and over--------------------
Perinatal deaths4
Total------------------------
FirstSecond-----------------------------Third------------------------------Fourth and over--------------------
Total None 1 or more 1 2 3 ormore
1959-60
15.1 14.4 36.8 33.1 49.0 129.3
14.5 14.5 14.4 14.1 38.6 38.6 14.3 13.7 36.4 32.8 5132.3 16.8 15.3 37.1 32.4 42.0 129.;
13.4 11.8 61.9 48.2 141.0 221.4
12.9 12.9 46.; 46.;
1::: 1%; 51.0 48.3 5116.; 18.6 14.8 67.1 48.6 143.0 221.4
28.3 26.1 96.4 79.8 183.1 322.1
27.2 27.2 23.6 22.9 82.; 82.3 25.8 24.2 85.5 79.6 5233.7 35.0 29.8 101.3 79.4 179.0 322.i
1950-52
16.3 15.6 40.3 35.9 73.4 91.3
15.8 15.8 15.0 L4.7 34.6 34.6 16.2 15.3 37.6 35.1 597.; 19.9 17.5 43.8 37.2 69.8 91.;
15.8 14.3 64.6 55.3 109.8 226.5
16.6 16.6 11.3 10.4 64.ii 64.; 15.4 13.8 51.1 46.4 151.9 23.0 18.1 71.2 56.5 103.0 226.;
31.8 29.7 102.3 89.3 175.1 297.0 ;
32.1 32.1 26.1 24.9 96.: 96.; 31.3 28.9 86.8 79.9 234.i 42.5 35.3 111.8 91.6 165.7 297.0
lBirth order refers to number of births the mother has had, including fetal deaths.‘Rates per 1,000 live births in specified group.3Rates per l,O(ICIlive births plus fetal deaths in specified grouP. ~Fetal deaths of 20 weeks ormore gestation (and not stated) PIUS infant deaths under 28 days
per51,000 fetal deatha plus live births in specified group.Rate based on less than 20 deaths.
Source: Special tabulations of New York State Health Department data.
28

is an extreme situation, but women with 2 prior
fetal deaths also had an especially high risk with
1 of 6 of their current pregnancies ending ina perinatal death. The full significance of these figures can be appreciated when it is realized that
all fetal deaths under 20 weeks gestation are ex
cluded.
Total Suboptimal Pregnancy Outc,ome
Infant and perinatal mortality rates provide only a partial view of the total loss and disability as
sociated with pregnancy. They are the best documented measures of loss and historically have attracted most attention. However, as the attack against mortality centers increasingly around conditions that affect the development of the fetus, the desirability of including the total spectrum of loss and congenital defects among children be-comes apparent. It is this perspective that has led some investigators to postulate a continuum of pregnancy wastage involving different types of loss that have similar etiologies.14
Special studies now in progress are beginning to produce data designed to measure the components of this 10Ss and disability and to uncover clues to their etiology. Selected for presentation here are several observations drawn from re-search with which one of the authors (S.S.) is associated. The data represent a small trickle in the flow of information that can be expected from the intensive investigations of the National Institute of Neurological Diseases and Blindness, the Cooperative Study of Child Development in Oakland, California, the Fetal Life Study at Babies Hospital (New York City), Preg~ancy Outcome Study (H.I.P.), and other research projects.
Fetal 10SS. —It is well-known that fetal loss of 20 weeks or more gestation is only a small fraction of the total volume of fetal deaths at all gestational ages. Precisely how many women be-come pregnant each year and how many of these pregnancies end with a dead conceptus is unknown. Even in an area such as New York City, where determined efforts have been made to obtain complete reporting, it is clear that many fetal deaths remain unreported. There are many reasons for this, including the possibilities that the woman herself may not have been aware that she was pregnant or that the pregnancy may have ter-
7i111-022 O -65-5
minated so early and with so little discomfort that a physician was not seen.
By applying life-table techniques in local area studies ,j Erhardt *5 and French and Bierman16 have independently estimated the magnitude of the
fetal loss problem as being more than 20 percent of the pregnancies. No study has produced this
high a figure directly from reported events. How-ever, in a recent investigation of a population in
sured for comprehensive medical care (H.I.P. in the New York City area), it was found that about 14 percent of the pregnancies known to the physi
cians terminated in a fetal death. 1718 Because
of the methodology it was concluded that this was close to the limit of reporting accurac y that might be reached in a large-scale study. A restriction
on the generalizability of rates obtained from this study is that it is known that women under the care of H.I.P. obstetricians have lower prematurity and perinatal mortality rates than do other patients
of private physicians in New York City. Nevertheless, distributions and relationships coming from the study clarify a number of the issues in fetal and infant mortality which cannot readily be
dealt with through official vital statistics.
Almost half of the fetal deaths in the H.I.P. study were at gestation ages under 12 weeks, an-other 32 percent were at ages 12-19 weeks, and
12 percent were at 20 weeks or more gestation. The probability that a “medically known” pregnancy will terminate in a fetal death at a particular gestation age appears to follow a bimodal distribution. The first peak is at about 10 weeks; the other, after 39 weeks (fig. 11). There is prob
ably little reason to question the general form
of the curve except for the early gestation ages. Prior to 10 weeks the rates are of value for medical care programs only as a reflection of what
the physician is seeing, and this, of course, is of
considerable importance. As mentioned earlier,
estimates of the true state of affairs suggest that the risk of a fetal death is greatest prior to 10 weeks gestation.
New insights into the relevance of age of rrrother and birth order to the risk of fetal loss at all
jErhardt’s study was based on a special inquiry among physicians and clinics in New York City; French and Bier-man’s investigation was located in Kauai, Hawaii.
29

A. TOTAL PREGNANCIES
25 –
m w G ~ 20 — z# an -1 g 15 -
P L 0
s 10 — w 2 u n.
5 –
o
B. PREGNANCIES TERMINATING IN FETAL DEATHS
2.5 I
I 5 101520253035 40
GESTATION AGE (weeks) AT TERMINATION
Source: Shapiro, S., Jones, E. W., and Densen, P. M.: Afifetable ofpre@ancy termbations ndcorrektes of fekl loss. MilbmakM em. FundQfmrt.
40:7 -45, Jen. 1962.
Figure Il. Distribution of pregnancies by gestation age at termination: Health Insurance Plan,
1958-59.
gestational ages areprovidedby thisstudy’smaterial. Elevated risks at ages over 30 and at the higher birth orders were found in the H.I.I?. study among fetal deaths under 12 weeks and at 12-19 weeks’ gestation aswell asat 20 weeksor more. The overall impression is that with only minor exceptions the pattern of risk shown by national vital statistics for occurrences at 20 weeks gestation or later is a continuation of similar patterns of risk at earlier gestation ages. One possible exception concerns gravida 1 women who appear to have a lower risk than gravida 2 women early in pregnancy (under 12 weeks: gestation) (table I).
Congenital anomalies. —Information is beginning to accumulate about congenital malformations. Until recently there was considerable underestimation of the magnitude of the problem. Vital statistics could not be expected to do any-
thing more than provide information on those severe anomalies that were detectable at time of birth or reported on-the death certificate. With the appearance of a report on congenital anomalies by McIntosh and associates in 1954 it became clear that the problem was of similar magnitude to low birth weight. 19 In their study of a clinic population (Babies Hospital, Sloan Hospital in New York City) about 8 anomalies were diagnosed per 100 children. The H.I.P. study had a very similar finding, 7 anomalies per 100 children. Both of these figures refer to definite anomalies diag- (
nosed by the time the child reached 2 years of age. They omit conditions, principally orthopedic defects, abut which there might be some question as to whether they are malformations.
An index of suboptimal pregnancy tewlinations.—A loss-disability index which covers the total range of mortality and defects related to
30
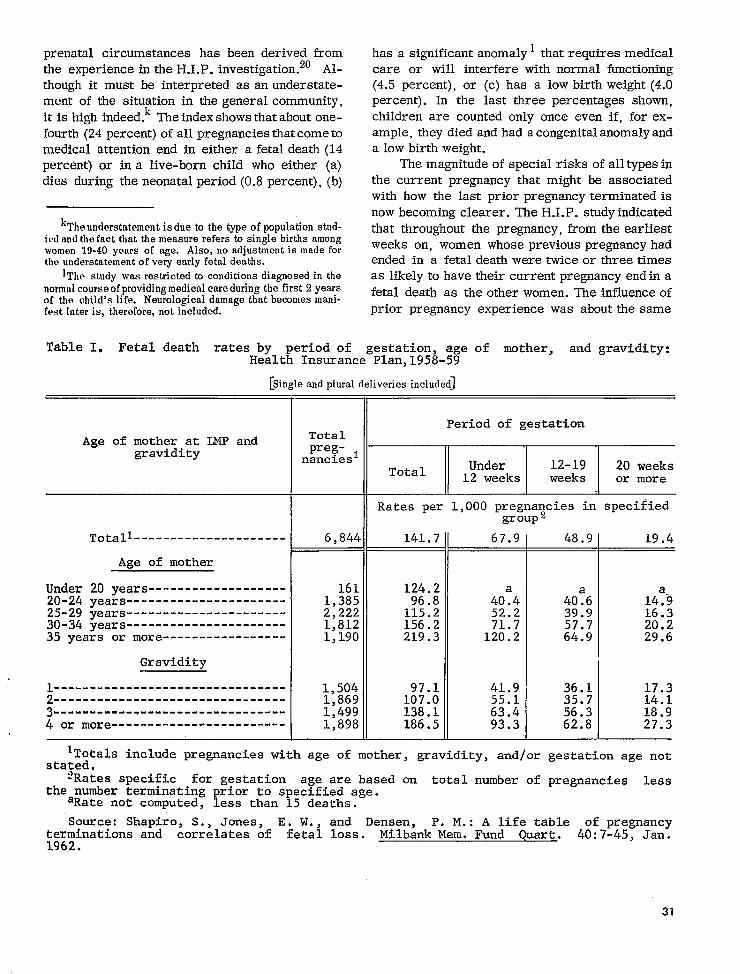
---------------------
------------------------------------------------------------------
------- ------- ------- ------- ----
--------------
prenatalcircumstanceshas been derivedfrom the experience P. investigation.20intheH.I. Althoughitmust be interpretedas an understatement of the situationin thegeneralcommunity, itishighindeed.kTheindexshowsthataboutone
ofallpregnanciesfourth(24percent) thatcome to medicalattention death(14end in eithera fetal percent)or ina live-bornchildwho either(a) diesduringtheneonatal (b)period(0.8percent),
‘The understatement is due to the type of population studied nnd the fnct that the measure refers to single births among womon 19-40 years of age. Also, no adjustment is made for tha understatement of very early fetal deaths.
lThe study was restricted tn conditions diagnosed in the normal course of providing medical care during the first 2 years of the child’s life. Neurological damage that becomes manifest later is, therefore, not included.
has a significantanomaly1thatrequiresmedical care or will interferewithnormal functioning (4.5percent),or (c)has a low birthweight(4.0 percent).In the lastthreepercentagesshown, childrenare countedonlyonce even if,forexample,theydiedandhad acongenitalanomalyand a low birthweight.
The magnitudeofspecialrisksofalltypesin the currentpregnancythatmight be associated withhow the lastpriorpregnancyterminatedis now becomingclearer.The H.I.P.studyindicated thatthroughoutthe pregnancy,from theearliest weeks on, women whose previouspregnancyhad ended in a fetal death were twice or three times
as likelytohavetheircurrentpregnancyendina
fetaldeathas theotherwomen. The influenceof priorpregnancyexperiencewas aboutthesame
Table I. Fetal death rates by period of gestation, age of mother, and gravidity:He<fiInsurance Plan,1958-59
[Single and plural deliveries included]
Period of gestation
Age of mother at LMP and Total preg- ~ gravidity nancies
Under 12-19 20 weeksTotal 12 weeks weeks or more
Rates per 1,000 pregna~cies in specified group z
Totali 6,844 141.7 67.9 48.9 19.4
AEe of mother
Under 20 years------------------- 161 124.2 20-24 years 1,385 96.8 40!4 40!6 14:9 25-29 years 2,222 115.2 52.2 39.9 16.3 30-34 years 1,812 156.2 71.7 57.7 20.2 35 years or more----------------- 1,190 219.3 120.2 T 29.664.9
Gravidity
1,504 97.1 41.9 36.1 17.3L-------------------------------1>869 107.0 55.1 35.7 14.1 3------------------ 1,499 138.1 63.4 56.3 18.9 4 or more------------------------ 1,898 186.5 93.3 62.8 27.3
*Totals include pregnancies with age of mother, gravidity, and/or gestation age not stated.
?Rates specific for gestation age are based on total number of pregnancies less the number terminating prior to specified age.
aRate not computed, less than 15 deaths.
Source: Shapiro, S., Jones, E. W., and Densen, P. M.: A life table of pregnancy terminations and correlates of fetal loss. Milbank Mere.Fund Quart. 40:7-45, Jan. 1962.
31
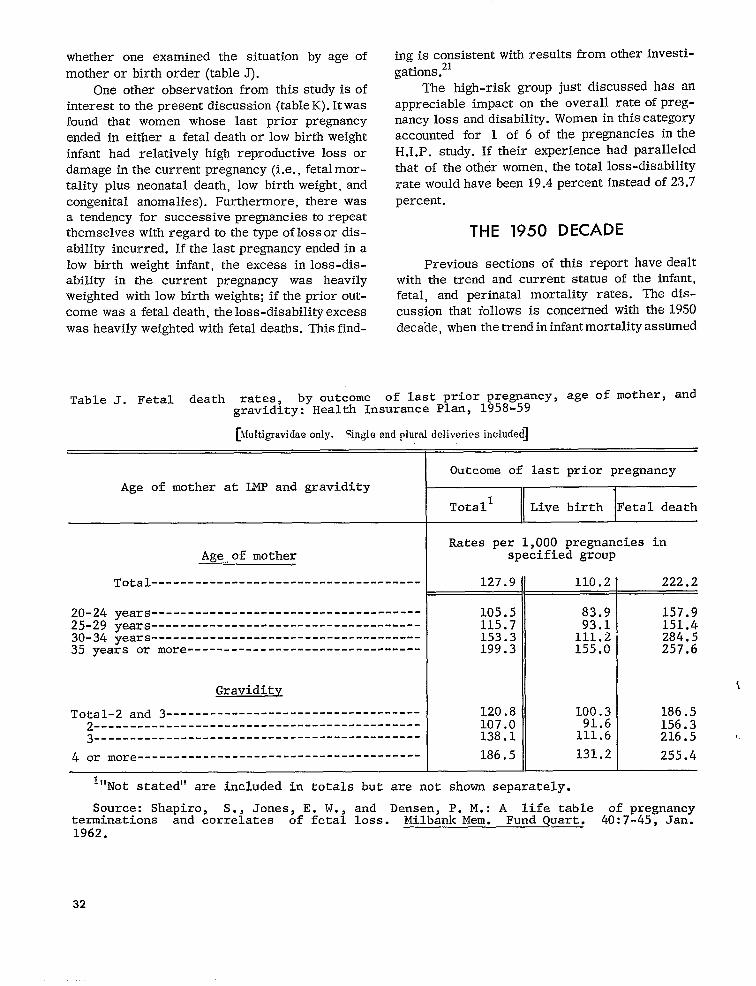
-------------------------------------
---------------------------------------------------------------------------------------------------------------
--------------------------------
- - ---- --- -------- - - - - -- ----- - - - - - - --- -- - - -- - - - --- - - -- - ---
---------------------------------------
whether one examined the situation by age of mother or birth order (table J).
One other observation from this study is of interest to the present discussion (table K). It was found that women whose last prior pregnancy ended in either a fetal death or low birth weight infant had relatively high reproductive loss or damage in the current pregnancy (i.e., fetal mortality plus neonatal death, low birth weight, and congenital anomalies). Furthermore, there was a tendency for successive pregnancies to repeat themselves with regard to the type of loss or disability incurred. If the last pregnant y ended in a low birth weight infant, the excess in loss-disability in the current pregnancy was heavily weighted with low birth weights; if the prior out-come was a fetal death, the loss-disability excess was heavily weighted with fetal deaths. This find
ing is consistent with results from other investi-gations.21
The high-risk group just discussed has an appreciable impact on the overall rate of pregnancy loss and disability. Women in this category accounted for 1 of 6 of the pregnancies in the H.I.P. study. If their experience had paralleled that of the other women, the total loss-disability rate would have been 19.4 percent instead of 23,7 percent.
THE 1950 DECADE
Previous sections of this report have dealt with the trend and current status of the infant, fetal, and perinatal mortality rates. The discussion that follows is concerned with the 1950 decade, when the trend in infant mortality assumed
Table J. Fetal death rates, by outcome of last prior prewancy~ age ‘f ‘other’ and gravidity: Health Insurance Plan, 1958-59
[M”lt,igmvidae %gle andplural included]OIIIY. deliveries
Age of mother at LMP and gravidity
Age of mother
Total
20-24 years 25-29 years 30-34 years
Outcome of last prior pregnancy
J
Totall Live birth Fetal death
Rates per 1,000 pregnancies in specified group
127.9 110,2 222.2
35 years or more
Graviditv
Total-2 and 3-----------------------------------2------ - - - . - ------- . ----3---- . - - - --
4 or more
105.5 83.9 157.9 115.7 93.1 151.4 153.3 111.2 284.5 199.3 155.0 257.6
120.8 100.3 186.5 107.0 91.6 156.3 138.1 111.6 216.5 1.
186.5 131.2 255.4
I“Not stated” are included in totals but are not shown separately.
Source: Shapiro, S., Jones, E. W., and Densen, P. M.: A life table of pregnancyterminations and correlates of fetal loss. Milbank Mere. Fund Quart. 40:7-45, Jan. 1962.
32
i
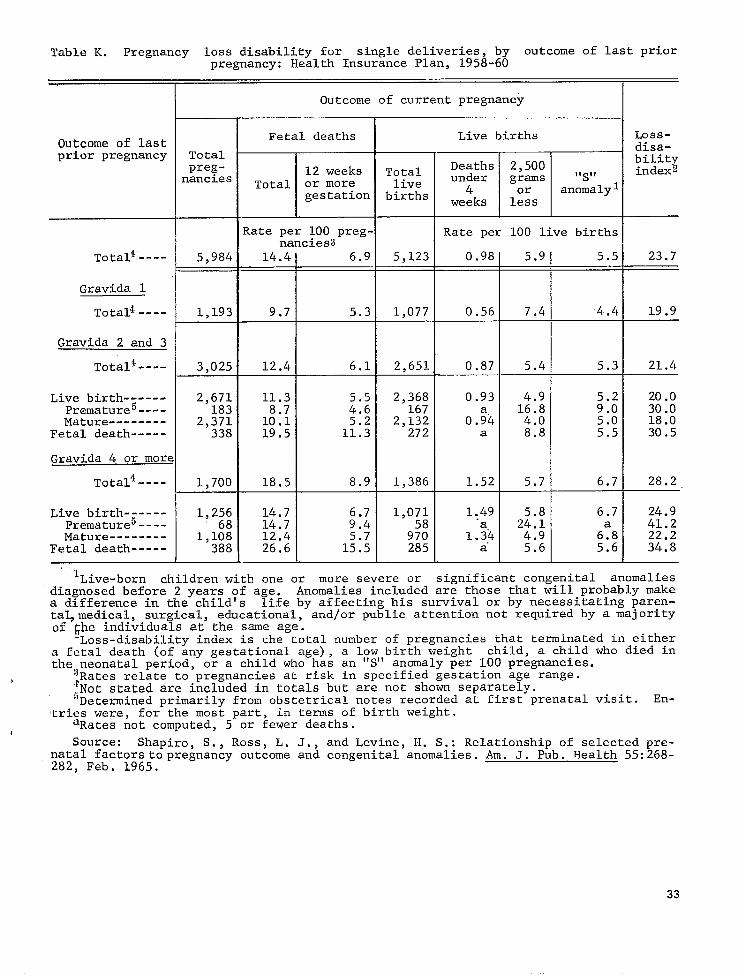
------
-------------
------
-------------
Table K. Pregnancy loss disability for single deliveries, by outcome of last priorpregnancy: Health Insurance Plan, 1958-60
Outcome of current pregnancy
Outcome of lastprior pregnancy Total
pregnancies
ToCa14----
Gravida 1
Tota14----
Gravida 2 and 3
Tota14----
Live birthPremature5----Mature
Fetal death
Gravida 4 or more
T.ota14----
Live birthPremature5----Mature
Fetal death
.,
5,984
1,193
3,025
2,671183
2,371338
1,700
1,25668
1,108388
Fetal deaths
12 weeksTotal or more
gestation
Rate per 100 pregnancies
T
-d--6.112.41
I
11.3:::
1::: 5.219.5 11.3
+
Live births
Totallive
births
m
Rate per 100 live births
5,123 0.98 5.9 5.5 23.7
1,077 0.56 7.4 4.4 19.9
2,651 0.87 5.4 5.3 21.4
2,368 167
0.93 1::: 5.2 9.0
20.0 30.0
2,132 0.$4 4.0 5.0 18.0 272 a 8.8 5.5 30.5
1,386 1.52 5.7 6.7 28.2—
1,071 1.49 5.8 6.7 24.958 ‘a 24.1 41.2
970 1.34 4.9 6:8 22.2285-ul__E a“ 5.6 5.6 34.8
lLive-born children with one or more severe or significant congenital anomaliesdiagnosed before 2 years of age. Anomalies included ar~ those that tiillprobably makea difference in the child’s life by affecting his survival or by necessitating parental,medica~, surgical, educational, and/or public attention not required by a majorityof ~he individuals at the same age.
Loss-disability index is the total number of pregnancies that terminated in eithera fetal death (of any gestational age) , a low birth weight child, a child who died inthe neonatal period, or a child who has an “S” anomaly per 100 pregnancies.
b ‘~Ratesrelate to pregnancies at risk in specified gestation age range. “tNotstated are included in totals but are not shown separately. 5Determined primarily from obstetrical notes recorded at first prenatal visit. En-
tries were, for the most part, in terms of birth weight.
I aRates not computed, 5 or fewer deaths.
Source: Shapiro, S., Ross, L. J., and Levine, H. S.: Relationship of selected pre-natal factors to pregnancy outcome and congenital anomalies. Am. J. Pub. Health 55:268-282, Feb. 1965.
33

--
the slowest rate of decline on record in the United States. Two questions are explored: first, to what extent does the lack of progress in reducing the total infant mortality rate reflect changes that occurred during the 1950-60 decennium in parameters of infant loss? and second, how did the high-risk groups fare; did any of them deviate from the general pattern of small decreases in this period? But first a brief review of the demo-graphic and economic changes that took place in the 1950’s is presented in the following para-graphs.
Most indicators of socioeconomic status point toward a major improvement during the 1950’s in the living standards of the population as a whole. These changes followed impressive gains in the 1940’s. Educational attainment increased, and family income rose (even after taking into ac -count the rise in the cost of living) (Appendix table I). The only countertrend for the country as a whole was in the illegitimate birth rate, which rose appreciably in this period (Appendix table 11).
The birth rate increased during World War 11 and rose sharply in the immediate postwar period; it is only in the past few years that a de-crease has begun (Appendix table III). To a great extent, the maintenance of a high birth rate was due to the rate at which families were increasing in size with the birth of four, five, and additional children (Appendix table IV). Also, age at marriage continued to decrease. Despite these changes more of the women aged 14-44, including those with preschool children, were in the labor force in 1960 than previously (Appendix table V).
Large-scale shifts in the geographic distribution of the population, thereby rivaling the massive movement in the previous decade, occurred during the 1950’s. Half of the population in 1960 were living in a house different from the one they occupied 5 years earlier. Nine percent moved to another county in the same State, and 9 percent moved to another State (Appendix table VI). The movement was out of rural areas and into urban centers in every section of the country. By 1960 about 70 percent of the population was living in a city or the urbanized area around a city (Appendix table VII). Increasing proportions of the population took up residence in the West, and in 1960 almost one in six persons lived in this region (Appendix table VIII).
Changes in Parameters of Infant Loss
and Their Effect on Trend ,
Sufficient information is available to examine this issue, although not as intensively as would be desired, for several of the parameters previously considered. Other parameters, such as child spacing and socioeconomic status, would unquestionably add greatly to the understanding of events during the 1950’s, but there is no direct evidence of these variables through mortality rates. Although all of the indicators of socioeconomic status point toward improvement, what is not known is whether the distribution of live births has also shifted toward greater proportions in the higher status groups or whether the differentials in infant mortality among the various socioeconomic classes have chagged.m
The variables that can be studied include race, birth-order—age-of-mother, geography, and birth weight. With regard to race nonwhite persons have consistently had higher birth rates than have white persons for as long as vital statistics have been available. As compared with the previous decade, racial differentials in the birth rate increased during the 1950’s. But since white births still represented a large majority of all births, the effect of the increased birth rate differentials on changes in the infant mortality rate was negligible. If the racial composition of the live births had not altered, the infant mortality rate would have de-creased between 1949-51 and 1959-61 by about 14 percent, which is almost the same as the decrease based on the observed rates (13 percent).
The influence of changes in birth-order—ageof-mother distributions among live births has also been examined. Two circumstances of potential importance for the infant mortality rate were operating during the 1950’s. As mentioned, age at marriage continued to go down, and there was a persistent trend toward higher birth orders. The
‘No studies have been conducted in the United States, either locally or nationally, on the trend in infant mortality by socioeconomic status. Also, data are not available for differentials in infant mortality among the various socioeconomic groups for a recent time period. However, in a study of fetal deaths and infant mortality during 19 M)-52 in upstato New York, Chase demonstrated that fetal, neonatal, and postne:,noatal death rates varied inversely writh socioeconomic c leveL occupation of the child’s father was used as the socioeconomic indicator.
!
34

net result was that the age-of-mother—birthorder distribution of births has been more unfavorable for survival of the newborn infant in recent years than in 1950; a small part of the slowdown in the rate of decline of the neonatal death raten could be attributed to this factor. If all other conditions had remained stationary except the distribution of births by birth-order— age-of-mother, the neonatal “mortality rate for the United States would have increased by 6 per-cent between 1950-51 and 1960-61 instead of de. creasing by the observed 8 percent. Thus, if ageof-mother—birth-order had not changed, a de-crease of about 13 percent in the neonatal rate might have been expected. This is still far below the decrease that occurred during the 1940 decade (28 percent).
Taking this approach to evaluating how changes in age-of-mother—birth-order distributions affected the neonatal mortality rate for white infants indicates that the overall decrease hmween 1950-51 and 1960-61 would have been 16 percent, instead of the 11 percent actually observed, if it had not been for the more adverse distributions. The decrease in the previous decade was 27 percent. Among nonwhite infants the changes in distribution of these two variables resulted in only a 1-percent reduction in the decline of the neonatal rate. In summary, the shift toward a greater proportion of births being in relatively poor-risk age-of-mother—birth-order categories exerted a small but noticeable deterring effect on the downward trend in the neonatal mortality rate for the United States.
The basic figures in the above analysis follow:”
Neonatal mortality rates per 1,000 live births
Total White Nonwhite——
Adjusted 1950-51- 19.9 18.8 26.4 Expected 1960-61- 21.0 20.0 26.7
observed 1950-51- ~~.: 19.2 27.4 Observed 19b0-bl- . 17.1 26.6
Geographic changes in the distribution of the population might be expected to have an important eff~’ct {m infant mortality rates, particularly since
at the beginning of the 1950 decennium there was considerable variability in the rate among geographic areas and since a high degree of population mobility characterized the 1950’s. Nevertheless, as shown below, when the average rates for 1949-51 are applied to the 1959-61 births classified by groupings of geographic areas, the resulting figures are in almost all cases below the observed rates for 1949-51.
Infant morta lit y rates per 1,000 live births
Total White Nonwhite
Observed 1949 -51----------- 29.6 27.1 45.5
Observed 1959 -61----------- 25.9 22.8 42.5
ExDected 1959-61 ‘la) Baaed on 9 msj or geo-
graphic diviaiona---- 29.4 27.1 44.6
(b) Baaed on m$+ropolitan-noranetropolltan groupings of counties- 28.3 25.9 43.3
These data lead to the conclusion that without the geographic shifts the decline in the white and nonwhite rates might have been slightly less than did occur. It could be argued that for the nonwhite infants in particular the altered distribution of births by geographic area was accompanied by improvement in registration completeness and possibly by an increased likelihood that a death in early infancy would be reported as both a live birth and death instead of as a fetal death.
Other questions can be raised about the effect of mobility on trends. To what extent and how
n’rhis issue could be tested only in relation to the neonatal mortality rate, since mortality rates by age-of-mother–birthorder were available on a national scale only for the neonatal period.
“’Expected” rates were obtain ed by applying the neonatal mortality rates hy birth-order–age-of-mother from the speoi al study of January-hiarch 1950 to the appropti ate subgroups in 1960-61. “Adjusted” rates for 1950-51 were obtained in a similar manner. The adjustment was required since the birthorder–age-o f-mother rates were for January-March 1950. Rates exclude hiassachusetts, where birth order data are not collected. “Observed” rates also exclude Massachusetts.
35
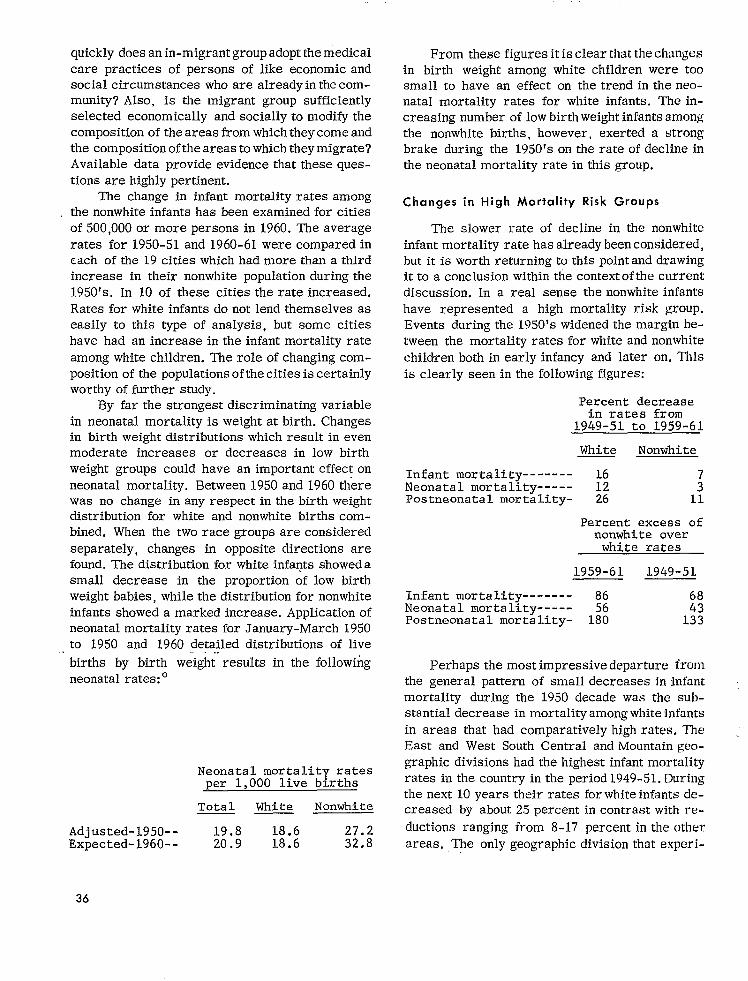
-- ----------
------------
quickly does an in-migrant group adopt the medical care practices of persons of like economic and social circumstances who are already in the community? Also, is the migrant group sufficiently selected economically and socially to modify the composition of the areas from which they come and the composition of the areas to which they migrate? Available data provide evidence that these questions are highly pertinent.
The change in infant mortality rates among the nonwhite infants has been examined for cities of 500,000 or more persons in 1960. The average rates for 1950-51 and 1960-61 were compared in each of the 19 cities which had more than a third increase in their nonwhite population during the 1950’s. In 10 of these cities the rate increased. Rates for white infants do not lend themselves as easily to this type of analysis, but some cities have had an increase in the infant mortality rate among white children. The role of changing composition of the populations of the cities is certainly worthy of further study.
By far the strongest discriminating variable in neonatal mortality is weight at birth. Changes in birth weight distributions which result in even moderate increases or decreases in low birth weight groups could have an important effect on neonatal mortality. Between 1950 and 1960 there was no change in any respect in the birth weight distribution for white and nonwhite births combined. When the two race groups are considered separately, changes in opposite directions are found. The distribution for white infants showed a small decrease in the proportion of low birth weight babies, while the distribution for nonwhite infants showed a marked increase. Application of neonatal mortality rates for January-March 1950 to 1950 and 1960 detailed distributions of live
births by birth weigh~” results in the following neonatal rates: 0
Neonatal mortality rates per 1,000 live births
Total White Nonwhite— —
Adjusted- 1950-- 19.8 18.6 27.2 Expected- 1960-- 20.9 18.6 32,8
From these figures it is clear that the changes in birth weight among white children were too small to have an effect on the trend in the neonatal mortality rates for white infants. The in-creasing number of low birth weight infants among the nonwhite births, however, exerted a strong brake during the 1950’s on the rate of decline in the neonatal mortality rate in this group.
Changes in High Mortality Risk Groups
The slower rate of decline in the nonwhite infant mortality rate has already been considered, but it is worth returning to this point and drawing it to a conclusion within the context of the current discussion. In a real sense the nonwhite infants have represented a high mortality risk group. Events during the 1950’s widened the margin be-tween the mortality rates for white and nonwhite children both in early infancy and later on. This is clearly seen in the following figures:
Percent decrease in races from
1949-51 to 1959-61
White Nonwhite
Infant mortality Neonatal mortali_ty ;; : Postneonata 1 morta Iity - 26 11
Percent excess of nonwhi,te over
white ratea
1959-61 1949-51
Infant mortality 86 68 Neonatal mortality Postneonata 1 morta lit y- 1% 1;:
Perhaps the most impressive departure from the general pattern of small decreases in infant mortality during the 1950 decade was the substantial decrease in mortality among white infants in areas that had comparatively high rates. The East and West South Central and Mountain geographic divisions had the highest infant mortality rates in the country in the period 1949-51. During the next 10 years their rates for white infants de-creased by about 25 percent in contrast with reductions ranging from 8-17 percent in the other areas. The only geographic division that experi-
36

enced a sizable decrease in the nonwhite rate was the Mountain area. Here the nonwhite group, a majority of which was Indian, had the exception-ally high rate of 94.4 per 1,000 live births in 1949-51; in 1959-61 the rate was 48.7.
The closing of the geographic gap in infant mortality among white births resulted almost entirely from major strides in reducing post-neonatal mortality in geographic divisions where these rates were exceptionally high in 1949-51. Postneonatal rates in the East South Central, West South Central, and Mountain divisions were reduced by 40-50 percent during the 1950’s and are now much closer than they have ever been to the rates in the other divisions. Among non-white births the situation differed greatly. Omitting the Mountain division, the geographic variability was not reduced for either the neonatal or postneonatal rates. Actually the range between high and low areas increased for the postneonatal rates.
The sizable reduction in infant mortality differentials among white births just discussed was not simply a continuation of events in the 1940’s. During this earlier period neonatal and posmeonatal mortality rates decreased by about the same relative amounts in all areas. As a result, the gaps between high and low geographic divisions changed little between 1939-41 and 1949-51. Among nonwhite births the outstanding characteristic of the 1940 decade was the sizable reductions that occurred in both the neonatal and postneonatal mortality rates in all geographic areas. As indicated above, except for the Mountain area the changes in the 1950 decade were negligible by comparison.
Other aggregates of geographic areas sup-port the view that there has been a general reduction in geographic variation in the infant mortality rates among white births (tabIe 8). At the beginning of the 1950’s the rates among white children were about a fifth higher in nonmetropolitan counties than in metropolitan counties. During the next 10 years the mortality rate in nonmetropolitan counties was reduced by 20 per-cent as compared with only 9 percent in metropolitan counties, and the gap between the rates for white infants in the two areas was more than cut in half. Among nonwhite infants there was
little change in mortality in either sets of areas, and the rate in nonmetropolitan counties remained substantially above the rate in metropolitan counties.
One of the more critical variables to consider in a discussion of high-risk groups is birth weight. In the absence of national data on changes that have occurred during the 1950’s in the mortality by birth weight, it is necessary to utilize the experience of upstate New York. While the observations based on data for this area cannot be generalized for the country as a whole, they are indicative of what can and does happen in a large area where the rate of decline in infant mortality slowed down during the 1950’s. Upstate New York is also interesting because of its major programs in maternal and child health and the improvement in mortality among low birth weight infants that occurred between 1945 (when the neonatal death rate in this birth weight group was 228 per 1,000 live births) and 1950 (when the rate was 183 per 1,000).13
Assessment of changes in the 1950 decade is based on mortality rates in the two time periods 1950-5224 and 1959-6023 (table L). With regard to the highly vulnerable group of low birth weight infants it is clear that mortality risks shortly after birth were not lowered. This was true for the white and nonwhite races. In fact, among the nonwhite races the neonatal mortality rate for the birth weight group 2,500 grams or less was appreciably higher in the more recent period than at the beginning of the 1950 decade. This excess is primarily due to an increase in the proportion of infants WHOwere born at very low birth weights where the mortality rates are extremely high. To a lesser extent, the same situation was found among white children. Despite these circumstances the main conclusion holds: during the 1950’s there was apparently no de-crease in neonatal mortality among infants at low birth weights (see adjusted mortality rates in table L).
Once the neonatal period was passed, babies weighing under 2,501 grams at birth had a better chance of surviving to the end of the first year of life in the more recent period 1959-60 than previously. The reduction in mortality was substantial and was shared by white and nonwhite
71{U-CLV O - 85 -6
37

-------- --------------
-------------------------------------------------------------------------------------
---------------
------------------------------
---------------
Table L. Infant mortality rates for single births, by birth weight, color, and age atdeath: Upstate New York, 1950-52 and 1959-60
Birth weight and color
White
Tota14
1,000 grams or less---------------1,001-1,500 grams1,501-2,000 grams2,001-2,500 grams2,501-3,000 grams3,001-3,500 grams3,501 grams or more
2,500 grams or less2,501 grams or more
Nonwhite
Tota14----------------------
2,500 grams or less---------------2,501 grams or more
1959-601 1950-52
Under 28 days- Under 28 days-Tota12 28 11 Tota12 28 11
days2 months3 days2 monthss
19.0 15.1 4.0 21.6 16.3 5.4
954.2 950.9 944.8 941.2 :;:.; 549.3 35?8 566.5 544.2 48:8
203.3 16.7 228.5 207.3 26.6 54:1 43.4 11.2 55.0 43.0 12.6 14.9 9.5 5.5 16.8 1;.;
7.0 3.7, 3.3 9.6 ::; 6.2 3.5 2.7 8.0 4:4 3.7
183.7 172.7 13.4 178.0 164.2 16.5 8.3 4.8 3.3 10.4 5.8 4.7
37.4 27.7 9.9 35.8 23.9 12.2
I 194.6 173.4 25.7 179.7 150.7 34.2
15.0 7.0 8.1 17.5 7.6 10.0
lMortality rates for 1959-60 adjusted to birth weight distributions in 1950-52 follow (adjustment is made by applying mortality rates by 500-gram intervals for 1959.60to the distributions in the earlier period):. ,-
Under 28 days-Total 28 11
days months
White: 2,500 grams or less 175.8 164.7 13.3 2,501 grams or more 8.3 4.8 3.5
Nonwhite: 2,500 grams or less 175.0 153.0 25.8 2,501 grams or more 15.0 7.0 8.0
‘Rates per 1,000 live births in specified group.3Rates per 1,000 survivors of neonatal period.4Not stated birth weights are included in totals but not distributed in 1950-52.
Three percent of infant deaths had birth weight not stated; in 1959-60 the figure was1 percent.
aRates not computed, less than 20 deaths.
Source: Unpublished data for 1959-60 received from Dr. A. Gittlesohn,New York StateDepartment of Health; unpublished data for 1950-52 received from Dr. J. Yerushalmy,University of California, School of Public Health.
38

infants. Among the children born weighing over 2,500 grams, decreases in mortality occurred during both the neonatal and postneonatal periods. The gains were much greater in the white group than the nonwhite. Among white infants it appears that the improvement was more marked above 3,000 grams than in the weight class 2,501-3,000 grtims. This is of interest since it further sup-ports the impression that the most impressive gains occurred in those weight groups that already had the most favorable chances of surviving.
The upstate New York data also provide an opportunity to look at another variable that distinguishes between comparatively high- and low-risk pregnancies, This is “prior fetal loss.” The time periods involved are the same as mentioned above. Whether one examines neonatal or fetal mortality in the current pregnancy, the impression is that the gap between the poor-risk groups (i.e., pregnancies preceded by at least one fetal death) and the others did not close (table H).
SUMMARY-MORTALITY RATES
The persistence of a slow rate of decrease in infant mortality over what is now more than a decade has led to the current examination of trends and present status of infant and perinatal mortality. Many of the parameters of loss in pre~mancy are studied with a twofold objective: first, to clarify events in the 1950’s when the infant mortality rates leveled off and second, to define once more the high-risk groups in the population. A summary of available data on these issues follows:
1. Until about 1950 there were large reductions in infant mortality. The de-creases were greater after the first few weeks of life than shortly after birth, but the improvement in mortality at all ages was significant. Every area of the country and both the white and nonwhite populations shared in the sizable reductions in the loss rate. A major contributory factor to the sharp decline in the death rate was the lowering of mortality from infectious diseases of all types.
2. During the 1950’s and the early 1960’s the decline in the infant mortality rate
slowed down appreciably. The specific year when this change occurred differed by age at death, but the general conclusion is the same—the major declines that formerly characterized the mortality rates are no longer being experienced at any stage during infancy, including the postneonatal period. This reflects lack of change in the rates for most of the important causes of death. There were, however, continued declines in the rates for infective diseases and for infections of the digestive system. Increases occurred in the rate for respiratory diseases other than influenza and pneumonia. The rates for both white and nonwhite infants have leveled off, but the slow-down in the rate of decline has been more marked among the nonwhite infants.
Decreases in the infant mortality rate during the 1950’s were small in all geographic areas. Nevertheless, areas that were comparatively high in their rates at the beginning of the decade showed a larger decrease in their infant death rates. The gap between rates in the metropolitan and nonmetropolitan areas narrowed, and the rates in geographic divisions (representing aggregates of States) varied less at the end of the 1950 decade than formerly.
Infant mortality increased in many large cities. Nonwhite infants especially were affected by this increase, but in some cities white infants also had a higher rate in 1960-61 than 10 years earlier. The widespread increase in infant mortality among nonwhite births in cities appears to be related to the movement of many nonwhite persons to major cities during the 1950’s. Large-scale migration was common in all population groups, but among white persons the movement frequently was from the central city to the suburban areas.
3. Changes in racial or geographic composition of births do not explain the slow decline in the infant mortality rate. More important is the increase in the propor-
39

tions of births in the comparatively h~ghrisk groups of very young mothers and women with many pregnancies. However, if this factor were eliminated, the de-crease in the mortality rate during the 1950’s still would lag far behind the de-crease in the 1940’s.
The distribution of births by birth weight hardly changed for the country as a whole. Changes were in opposite directions in the two race groups. Among white babies the proportion that were 2,500 grams (5% pounds) or less decreased slightly; among nonwhite babies the proportion increased markedly. The latter exerted a strong brake on the rate of decline in the neonatal mortality rate among nonwhite infants.
4. High-risk groups identifiable through vital statistics all showed little improvement in the 1950’s in the infant mortality rates. This held for low birth weight groups, children born to mothers who previously had a fetal death, and nonwhite infants.
The situation in high-risk groups as compared with more favored groups follows:
Il. MEDICAL RESOURCES AND
PERSONNEL, FACILITIES AND SERVICES,
a. Nonwhite infants have almost twice as high a death rate as white infants. The differential is relatively small shortly after birth, but it rapidly increases as postnatal environmental conditions become the dominant factors. The loss rate in every part of the country is greater among nonwhite than white infants.
b. Infants weighing 2,500 grams or less at birth have a neonatal death rate that is about 22 times the rate for the other babies, and they account for two-thirds of all the neonatal deaths. Chances of survival improve with in-creasing weight to reach an optimum in the birth weight class 3,501-4,000 grams.
c. Pregnancies among women who previously had a pregnancy which terminated in .2 fetal death are at least twice as likely to end in a neonatal or fetal death as are pregnancies among other women. Very young mothers and women with many prior pregnancies also represent high risks with respect to neonatal and fetal mortality.
HEALTH PROGRAMS
AND FINANCING OF CARE
Physicians
Obstetrical and infant care in the United States is characteristically rendered through arrangements between the individual practicing physician and the pregnant woman with all but 3 percent of the deliveries performed by physicians in hospitals. Outside the larger cities, where hospital clinics are available for outpatient pre-natal and postnatal care, even indigent and medically indigent patients receive their care through individual arrangements under the sponsorship of a public welfare or other official agency. Other types of arrangements for obstetrical and infant services cover only a small proportion of the population.
Whatever the pattern of obstetrical and pediatric services, any assessment of the trends in these services must first consider the quantity and training of medical manpower available for all types of medical care. The overall ratio of physicians to total population—about 138 per 100,000 population-has remained essentially unchanged between 1949 and 1962 (table M).26 However, the ratio of physicians in private practice to population has declined from 101 to 90 per 100,000. About half of this decline is balanced by an increase in the ratio of physicians in other full-time practice from 15.2 to 20.6 per 100,000 population; the other half is related to an almost identical increase in the number of graduate physicians still in training.
40
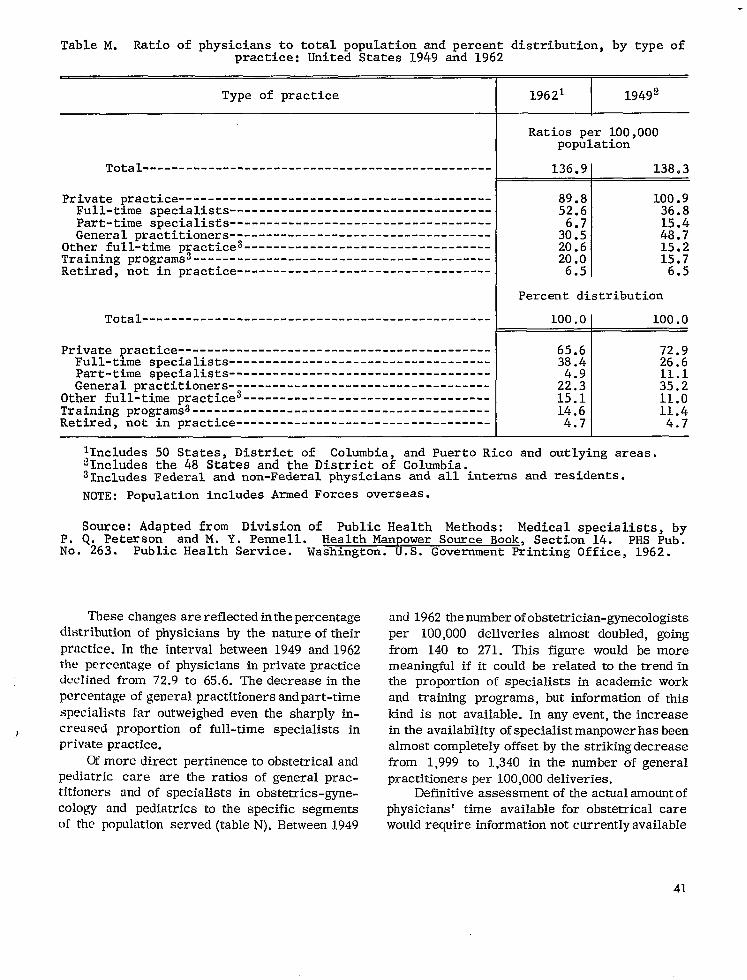
----------------------------------------
-------------------------------------------------------------------------------------------------------------------------------------------------------
-----------------------------------
-------------------------------------------------------------------------------------------------------------------------------------------------------
-----------------------------------
Table M. Ratio of physicians to total population and percent distribution,by type ofpractice: United States 1949 and 1962
Type of practice
Total--------
Private practiceFull-time specialistsPart-time specialistsGeneral practitioners
Other full-time practice3----------------------------------Training programs3-----------------------------------------Retired, not in practice
Total------------------------------------------------
Private practiceFull-time specialistsPart-time specialistsGeneral practitioners
Other full-time practice3----------------------------------Training programs3-----------------------------------------Retired, not im practice
19621 I 19492
Ratios per 100,000population
136.9[ 138.3
89.8 100.9 52.6 36.8
15.4 3::; 48.720.6 15.220.0 15.7
6.5 6.5
Percent distribution
100.OI 100.0
65.6 72.9 3;.; 26.6
11.1 22:3 35.2 15.1 11.0 14.6 11.4
4.71 4.7
lIncludes 50 States, District of Columbia, and Puerto Rico and outlying areas. ~Includes the 48 States and the District of Columbia. 31ncludesFederal and non-Federal physicians and all interns and residents.
NOTE: Population includes Armed Forces overseas.
Source: Adapted from DivLsion of Public Health Methods: Medical specialists, by P. Q. Peterson and M. Y. Pennell. Health Manpower Source Book, Section 14. PHS Pub. No. 263. Public Health Service. Washington. U.S. Government Printing Office, 1962.
Thesechangesarereflectedinthepercentageand 1962thenumberofobstetrician-gynecologistsdistributionof physiciansby thenatureoftheir
practice. between1949 and1962lnthe intervalthepercentageof physiciansinprivatepracticedeclinedfrom 72.9to 65.6.The decreaseinthepercentageofgeneralpractitionersandpart-timespecialistsfaroutweighedeven the sharplyin
) creased proportionof full-timespecialistsinprivatepractice.
Ofmore directpertinence andtoobstetricalpediatriccare are theratiosof generalpractitioners in obstetrics-gyneand of specialistscologyand pediatrics segmentsto the specificof thepopulation N).Between1949served(table
per 100,000deliveriesalmost doubled,goingfrom 140 to 271. This figurewould be moremeaningfulifitcouldbe relatedtothetrendinthe proportionof specialistsin academicworkand trainingprograms,butinformationof this
kindis notavailable.In anyevent,theincreaseintheavailability beenofspecialistmanpowerhasalmostcompletely by thestrikingdecreaseoffsetfrom 1,999to 1,340in thenumber of generalpractitionersper 100,000deliveries.
Definitive ofassessmentoftheactualamountphysicianstime available care‘ forobstetricalwouldrequireinformationnotcurrentlyavailable
41

-------------------------------------------
-------------------------------------------------------------------------
-------------------------------------------------------------------------------
Table N. Ratio of general practitionersand full-time specialists in obstetrics-gyne-cology and in pediatrics to specified population and birth groups: United States,1949 and 1962
Population group 19621 I 19492 I
Ratios per 100,000 inspecified population
General Practitioners group
Total populationFetal deathss and live births------------------------------
30.5 1,340.0
48.7 1,998.6
Children under 15 years------------------------------------ 97.7 179.5
Specialists in obstetrics-gynecology
Total population 6.2 Fetal deathss and live births 270.8
Specialists in pediatrics
Total population 5.6Children under 15 years 17.8
lIncludes50 States, District of Columbia, and Puerto Rico and outlvinszareas..‘Includesthe 48 States and the District of”Columbia.3Fetal deaths of 20 weeks or more gestation or gestation not stated.
NOTE: Data for specialists include those in private practice, hospital service(other than interns and residents), teaching, administration,research, and preventivemedicine; data for general practitionersrefer to those in private practice. Population includes Armed Forces overseas.
Source: Adapted from Division of Public Health Methods: Medical specialists,byP. Q. Peterson and M. Y. Pennell. Health Manpower Source Book, Section 14, PHS Pub.No. 263. Public Health Service. Washington. U.S. Government Printing Office, 1962.
on theproportionoftime generalpractitionersdevoteto obstetricsand similarlytheproportionof timethatobstetrician-gynecologistsdevotetotheobstetricalaspectsoftheirspecialty.Broad assumptionscanbe made on thesepoints:generalpractitionersdevoteabout10percentoftheirtime to obstetricalcare,andobstetriciangynecologistsdevote60 percentoftheirtimeto obstetrics.On thebasisofthesetwoassumptionstheratioof physiciantimetothenumberof de
has increasedonlyslightlyIiveries between1949and 1962.
Otherfactorsmust alsoreconsideredinattemptingtoquantitate manpowertrendsinmedicalin relationto changingobstetricalneeds.Thedeclineinthepercentageofdeliveriesperformedby untrainedmidwives from 4.5percentof thetotalin1950to1.8percentin O) points1962(tableto a correspondingincreaseintheproportionofdeliveriesby physicians.Itis alsolikelythat
physiciansin generalpracticehavereducedtheproportionof theirtime devotedto obstetricalcare, particularly in whichin those localitiesthe concentration has increasedof specialistsmost rapidly.Partoftheimpactofthesefactorstendingto reducethe ratioof manpower todeliverieswould be offsetby theincreaseinthe
of physicians ingraining,proportion still butthecaregivenbyinternsandresidents requiresstill
otherphysicianssupervisionby .Furthermore,thebroadenedconceptof obstetricalcare thatisattracting especially totheattention, withrespectmeticulousand time-consumingdiagnosticandtherapeuticservicesrequiredby women with ‘a historyof relativeinfertilityor previouslycomplicateddeliveries,makesincreaseddemands
on the time of specialistsin obstetrics-gynecology.
About20 years ago thegoalwas suggestedthat“intheUnitedStatesallmaternitypatients
42
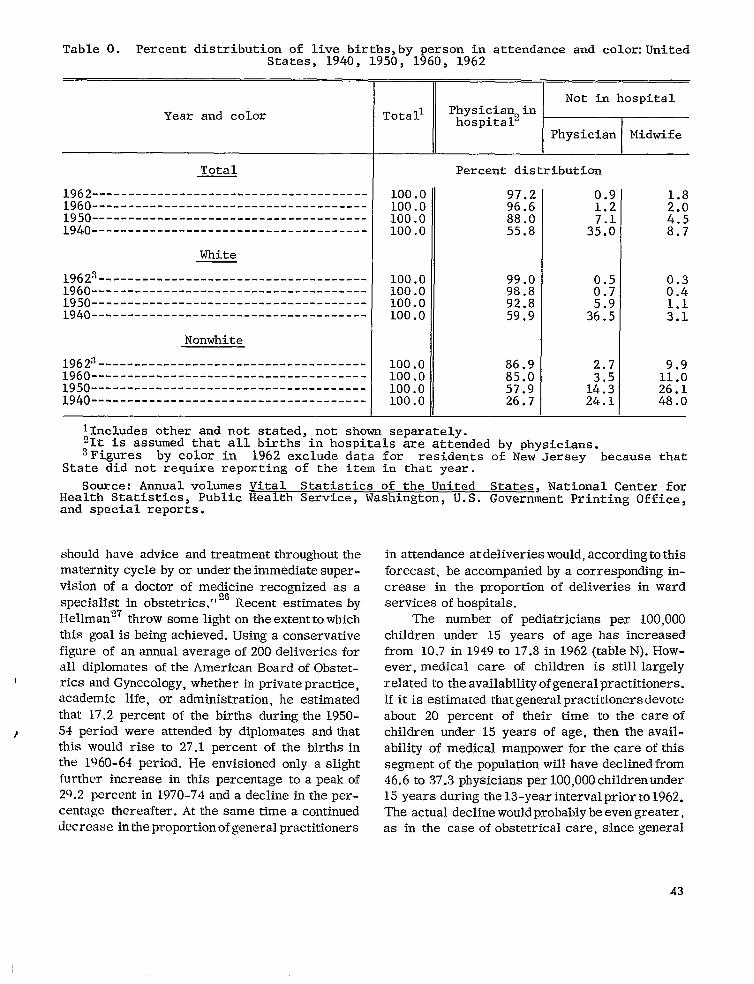
-------------------------------------
Table O. Percent distribution of live births,by person in attendance and color:United States, 1940, 1950, 1960, 1962
Year and color
Total
1962--------------------------------------1960--------------------------------------1950--------------------------------------1940--------------------------------------
White
1962s 1960--------------------------------------1950--------------------------------------1940--------------------------------------
Nonwhite
1962:~-------------------------------------1960--------------------------------------1950--------------------------------------1940-------------------------------------
~‘eta” Percent distribution
100.0 100.0
97.2 96.6 M
100.0 88.0 4.5 100.0 55.8 8.7
100.0 99.0100.0 98.8 :::100.0 92.8100.0 59.9 M
100.0 86.9 9.9100.0 85.0 11.0100.0 57.9 26.1100.0 26.7 48.0
llncludes other and not stated, not shown separately. 21t is assumed that all births in hospitals are attended by physicians. ~Figures by color im 1962 exclude data for residents of New Jersey . because that
State did not %equire reporting of the item in that year.
Source: Annual volumes Vital Statistics of the United States, National Center for Health Statistics, Public Health Service, Washington, U.S. Government Printing Office, and special reports.
should have advice and treatment throughout the maternity cycle by or undertheimmediate super-vision of a doctor of me~6cine recognized as a specialist in obstetrics. ” Recent estimatesby Hellman27 throw some light ontheextentto which this goalis being achieved. Using a conservative figure of an annual average of 200 deliveries for all diplomats of the American BoardofObstetrics and Gynecology, whether in privatepractice, academic life, or administration, he estimated that 17.2 percent of the births duringthe1950-
) 54 period were attended by diplomats and that this would rise to 27.1 percent of the births in the 1960-64 period, He envisioned only aslight further increase in this percentage toa peakof 29.2 percent in 1970-74 and adecline in the percentage thereafter. At the same time a continued decrease inthe proportionofgeneral practitioners
in attendance atdeliveries would, accordingtothis forecast, be accompanied by a corresponding in-crease in the proportion of deliveries in ward services ofhospitals.
The number of pediatricians per 100,000 children under 15 years of age has increased from 10.7 in 1949 to 17.8 in1962 (table N).However, medical care of children is still largely relatedto theavailabilityofgeneralpractitioners. If it is estimated thatgeneralpractitioners devote about 20 percent of their time to the careof children under 15 years of age, then the avail-ability of medical manpower for thecare ofthis segment of the population will have declinedfrom 46.6 t037.3 physicians per 100,0OOchildrenunder 15 years during the 13-yearinterval priorto1962. The actual decline wouldprobably beevengreater, as in the case of obstetrical care, since general
43
1

---------------------------
--------------------------------------
practitioners in areas having a high proportion of pediatricians would tend to devote a smaller fraction of their time to the care of children than would general practitioners in other areas.
One index of the quality of medical care available is the proportion of physicians in a specialty who are diplomats of their respective specialty boards. Of the full-time specialists in obstetrics-gynecology in clinical practice about half (48.8 percent) are diplomats of the American Board of Obstetrics and Gynecology (table P). 25 Among obstetricians in other full-time practice only 36.7 percent were Board diplomats in 1961. Full-time pediatricians as a group have a higher
proportion of diplomats (licentiates) of the American Board of Pediatrics. Among those in clinical practice fully 62.8 percent fall in this group, and those in full-time practice rank only a fraction of a percentage lower.
The distribution of obstetricians is highly variable in different regions of the United States. The number of specialists in obstetrics-gynecology per 100,000 deliveries ranges from a high of 398 in the Northeast to a low of 234 in the South (table Q).zs The North Central region had only a slightly higher proportion of specialists in obstetrics-gynecology than the South, with the West in an intermediate position. Specialists in pediatrics showed a similar type of distribution. Again the Northeast had the highest level with 26.0
.-pediatric specialists per 100,000 children under
15 years of age. However, the North Central region, with 14.6 pediatricians per 100,000 child population, had a definitely smaller concentration than the South, with 15.6.
Physicians in private practice are overwhelmingly solo practitioners. While the number of medical groups in the United States increased by 214 percent between 1946 and 1959 (368 to 1,154), the number of physicians in group practice still constituted only 7 percent of the active, practicing physicians in the countxy. 28 Thehighest proportion of physicians in group practice is found west of the Mississippi River.
The supply of physicians for maternal and child health programs does not appear to be keeping pace with the increasing needs in this field. An annual average of about 14 physicians were majoring in maternal and child health in schools of public health in the decade starting with the 1951-52 academic year. 29 There were 76majors during the second half of this period and 68 during the first half, but the number during the 1960-61 academic year (11) was considerably lower than in the preceding 3 years.
As of January 196217 percent of the positions of directors of State maternal and child health programs were unfilled. 29 Of those filled, 27 per-cent were certified by the American Board of Preventive Medicine, 9 percent by the Board of Pediatrics, and 5 percent by the Board of Obstetrics and Gynecology.
Table P. Diplomate status of full-time specialists in obstetr~cs-gynecology and in pediatrics, exclusive of those in training: United States, 1961
Percent diplomats
Type of specialist Among those 1 Total Among those in other
in clinical full-time practice practice
i Obstetrics-gynecology 48.1 48.8 36.7
Pediatrics 62,7 62.8 62.3
Source: Adapt ed from Division of Public Health Methods: Medical special~;;s$u~y P. Q. Peterson and M. Y. Pennell. Health Manpower Source Book, Section 14. No. 263. Public Health Service. Washington. U.S. Government Printing Office, 1962:
44

------------------------
-----------------------------------------
-----------------
-----
-.
Table Q. Ratio of full-ti,mespecialists in obstetrics-gynecologyand in pediatrics tospecified population and birth groups: United States and geographic regions, 1961
United IINorth- 1NorthPopulation group States east Central SOU th I West
Specialists in obstetrics-mmecolom Ratiosper 100,000 im specified~opulat~on grc
Total populationFetal deathsl and live births-----------
Specialists in pediatrics
Total PomlationChildr%-under 15 years
I
‘Fetal deaths of 20 weeks or more gestation or gestation not stated.
NOTE: Data for specialists include non-Federal physicians and interns and residents. Population is 1961 estimated population exclusive of ‘ArmedForces abroad.Data from the 1960 census used for the population under 15 years of age.
Source: Adapted from Division of Public Health Methods: Medical specialists,byP. Q. Peterson and M. Y. Pennell. Health Manpower Source Book, Section 14. PHS Pub.No. 263. Public Health Service. Washington. U.S. Government Printing Office, 1962.
Nurses in nursingpositions,may, inlargemeasure,beofwomenItis generallyagreedthatthereis a con- tracedto a decreaseintheproportion
tinuing an increasingshortageinnursingpersonnelatalllevels enteringthenursingfield, demand
of trainingeven thoughtheratioofnursingpersonnelto totalpopulationhas increasedduringthepastdecade(table ofnurses,R).The shortageas evidencedby a highproportionof vacancies
Table R. Ratio 05 nursing personnel topopulation, by type of nurse: UnitedStates, 1950 and 1962
Type of nurse 1962 1950
Ratios per 100,000total population
Total-------- 642 487
Professional 298 249 Practical 122 91 Aides, orderlies, and attendants m 222 147
Source: Adapted from Division of Public Health Methods:Man~ower in the 1960b.Health Manpower Source-Book.Section 18.PHS Pub. No. 263. Public Health Service, Washington. U.S. Government Printing Of; fice, 1964.
fornursingservices,and a declineintheworkweek of nursingpersonneltoward a nationalstandardof 40 hours.Professionalnurses,i.e.=registerednurses or nurseswitha bachelorsdegreeor higher,haveincreasedfrom 249t0298perlOO,OOOpopulation,anincreaseof20percent,
30 Duringthisperiodthebetween1950 and 1962.ratioof practicalnurseshas increasedby onethird,from 91 to 122 per 100,000population;the proportionateincrease in nurses*aides,orderlies,and otherattendants—147to 222per100,000population-hasbeen even greaterthanthatof practicalnurses.
Marked regionalvariationsarefoundintheratiosof professional nursestoand practicalpopulation(tableS).The ratioof professionalnurses to populationwas twiceas highin theNortheastas intheSouth,withtheotherregionsof thecountryat a levelabouthalfwaybetweenthesetwo extremes.The distributionofpractical
the samenurses, however, was practically
throughout thevariationthecountry, beingwithintheverynarrow limitsofalowoflllper 100,000populationintheNorth CentralStatestoa highof122per 100,000intheWest.3031
45

------
----------
Table S. Ratio of professional and practical nurses in practice to population:United States and geographic regions,1960 and 1962
I Professional PracticalRegion nurse nurseI 1962 I 1960
Ratios per 100,000population
Total---- 298I 114
I Northeast 396 115 North Central-- 290 111 South 209 113 West----------- 321 122
Sources: Division of Public Health Methods: Manpower in the 1960’s. Health ,Manpower Source Book, Section 18. PHS Pub. No. (1964). and Surgeon General’s Consultant Group on-Nursing: Toward Quality in Nursing, Needs and Goals. PHS Pub. No. (1963): Public Health Service; Washingt&. U~S. Government Printing Office.
The number ofpublichealthnurses,including
nursesemployedby boardsofeducation,has exceededthegrowthofthepopulation.The number increasedfrom 25,800 to 34,700 between1954 and 1962, representing an increase from about 16 to 19 in the number of nurses employed for such public health work per 100,000population.30 A major part of this increase appears to have resulted from the increased number of nurses employed by boards ofeducation.32 Therearealso indications that referrals to public health nurses for routine services in the area of maternal and child health care are decreasing.
Midwives
As previously indicated, the untrained mid-wife is rapidly disappearing from the American scene. In contrast to 8.7 percent in 1940 and 4.5 percent in 1950, in 1962 midwives werein attendance at only 1,8 percent of live births in
the UnitedStates(tableO).In1962 midwife de-Iiveries constituted 9.9 percent of the totalamong nonwhite and only 0.3 percent among white persons. Actually a large majority of all mid-wife deliveries (84 percent) were in the non-white population. Furthermore, it is the rural nonwhite population, mainly in the South, that accounts for most of the midwife deliveries.
At the present time the use of the well-qualified nurse-midwife in the actual conduct of deliveries is still largely experimental in the United Stateso 0nly86 nurse-midwives corn- , pleted the training program inthe 5-year period through 1963, and only 130fthese took positions in this country in which they actually performed deliveries.27 The nature and extent of the role of the well-qualified nurse-midwife in helping to meet anticipated needs in the field of obstetrics must await future developments.
Hospitals
Since the launching of the Hill-Burton programin 1946 the expansion of hospital facilities has proceeded at a pace more rapid than any earlier period in the Nation’s history. The rate of increase in general hospital beds has exceeded even the rapid rate of growth of the population. Between 1948 and 1962 the number of hospital beds has increased from 3.2 to 3.6 per 1,000 population (table T).33 This was the result ofa net annual increase of about 7,000 beds over theneeds from the increase inpopulation.:{~
The increase intheratio of general hospital beds to population hasdiffered ineach region of the country. The ratio in the South, starting from the lowest level ofanyregion in1948, increased by 27 percentto 3.3beds per 1,000population in1962, equal to the ratio inthe West in the same year. The number of beds in the Northeast and the West barely kept pace with the increase in population,while theNorth Centralregionincreased by 18 percent in the ratio of beds to population. i.
The quality of hospital facilities has also improved. Whereas only 59.4 percent of the general hospital beds were considered acceptable under Hill-Burton planning in 1948, fully 80.3 percent fell into theacceptable category in 1962.
46

--------------------------
----------------------------------------------------
--------------------------------
I
Table T. Ratio of general hospital beds to total population and ratio of bassinets to
I live births: United States and geographic regions, 1948 and 1962
General hospital beds Bassinets per 1,000 per 1,000 population live birthsl
Region
1962 1948 1962 1948
Total
NortheastNorth CentralSouthWest --------------------------------
lShort-term general and special hospitals and psychiatric hospitals.
Source: Ameri,can Hospital Association, 1949 andAug. 1963.
However, even today there are areas without acceptable general hospital beds. 34
Emphasis in the Hill-Burton program for general hospital beds has been on the needs of the smaller communities and the rural areas ofthe country whichhad been morepoorlyserved by hospitals than had been the cities. Theobsolescence ofhospital facilities inthe majormetropolitan areas, coupled with the influx of lower socioeconomic groups into the core cities and the flight of middle- and upper-income groups to the suburbs and beyond, has recently resulted in a shift in emphasis toward the large centers of population.
Information on the absolute number ofobstetrical beds oronthe ratio of obstetrical beds to deliveries is not currently available. The nearest approximationis the information onhospital bassinets which ispublished annually in the Journal of the American Hospital Association. The number of bassinets per 1,000 live births increased slightly from 23.5 t023.9 between1948 and 1962 (table T). Actually the South was the only region to show an increase during thispe-
3.6 I 3.21 23.9 I 23.5 I I I
4.0 3.8 26.3 29.9 3.9 3.3 25.3 26.1
22.3 17.6 ::: $:: 21.1 22.1
exclusive of short-term Federal hospitals
Journal of the: Hospitals,Guide Issues,Aug.
riod. Even withits increase inbassinetstheSouth in 1962 still ranked ahead of only one other retion, the West, in the ratio ofbassinetts to live births.
Inthe past few years the decline inthe crude birth rate and the leveling off in the absolute number of births, accompaniedbyashorterlength ofhospital stay after delivery, have at times resulted in underutilization of obstetrical beds in some areas. Even though the outlook during the next decadeis for anew increase of sizable pro-portions in the number of births. and, as aresult, pressure on obstetrical facilities, the cur-rent lull has reactivated interest in admitting selected gynecological patients to the obstetrical service when it is not possible to use flexible partitioning of the hospital corridor to permit proper contraction or expansionof theobstetrical service.
A greater problem is the heavy pressure on obstetrical ward services in large cities. Lesser35 has cited instances in which municipal hospitals in large cities have been forced to discharge patients 24 to 72 hours after delivery
47

--------------------------------------
-------------------------------------------
---------------------------------------------------------------------------------------
------------------------------------------------------------------------------
----------------------------------------------------------------
-----------------------------------------------------------------------------------------------------
--------------------------------------------------------
-----------------------------------------------------------------------------------------------------------
------------------------------
because of overcrowdingof theirfacilities.Inadequacyoffacilitieshas beena longtimecharacteristicof ruralareas,butthe growthoftheproblem in largecitiesisa relativelynew phenomenon.
Financing of Care
Expendituresfor healthand medicalcarein the UnitedStatesmore thandoubledin thedecadefrom 1950 to 1960:theyrosefrom about12.4billiondollarsinthe1949-50Federalfiscalyeartoabout26.5billion U).36in1959-60 (table This representedan increasefrom 4.7 to 5.4 percentin theproportionof thegross national productdevotedto healthand medicalcareexpenditures.
AS might be anticipatedfrom the risingstandardof livingforbroadersegments of the Ipopulation, wastheriseinprivateexpendituresat a more rapid rate than thatof publicexpenditures. ofprivateTheproportion expendituresincreasedfrom 73.1to 76.5percentofthetotal duringthe decadeeventhoughgovernmentalexpendituresincreasedfrom $3.3to $6.2billion, an increaseof 87 percent.Stateand localexpenditureshave increasedmore rapidlythan haveFederalGovernmentexpenditures.
The proportionof expendituresfor identi- ‘fiablematernaland childhealthservicesatalllevelsof government fared betterthan mostotherpublicexpenditures.The increasefrom$29.8to $139.4millionin thedecadefrom 1950
Table U. Percent distributionof private and governmental expenditures for health andmedical care by type of expenditure:United States, fiscal years 1949-50 and 1959-60
Type of expenditure 1959-60 1949-50
Total (in millions) $26,503 $12,365
Total (percent) 100,0 100.0
Private expenditures 76.5 73.1 Public expenditures 23.5 26.9 State and local government 13.9 15:4 Federal Goverment 9.6 11.5
Public expenditures (percent)---------------------------- 100.0 100.0
General medical and hospital care 34.9 35.3 Defense Department facilities 10.0 Medicare ::; Public assistance Maternal and child health services 2:2 0.9 School health (educationalagencies) 0.9 Medical research~ ::: Other health and medical services 27.9 Medical facilities’ construction 8.9
Percent of gross national product 5.4 4.7
lIncludesmedical research carried on by Veterans Administration.
Source: Division of Community Health Services: Medical care financing and utilization. Health Economics Series, No. 1. PHS Pub. No. 947. Public Health Service.Washington. U.S. Government Printing Office, 1962.
48
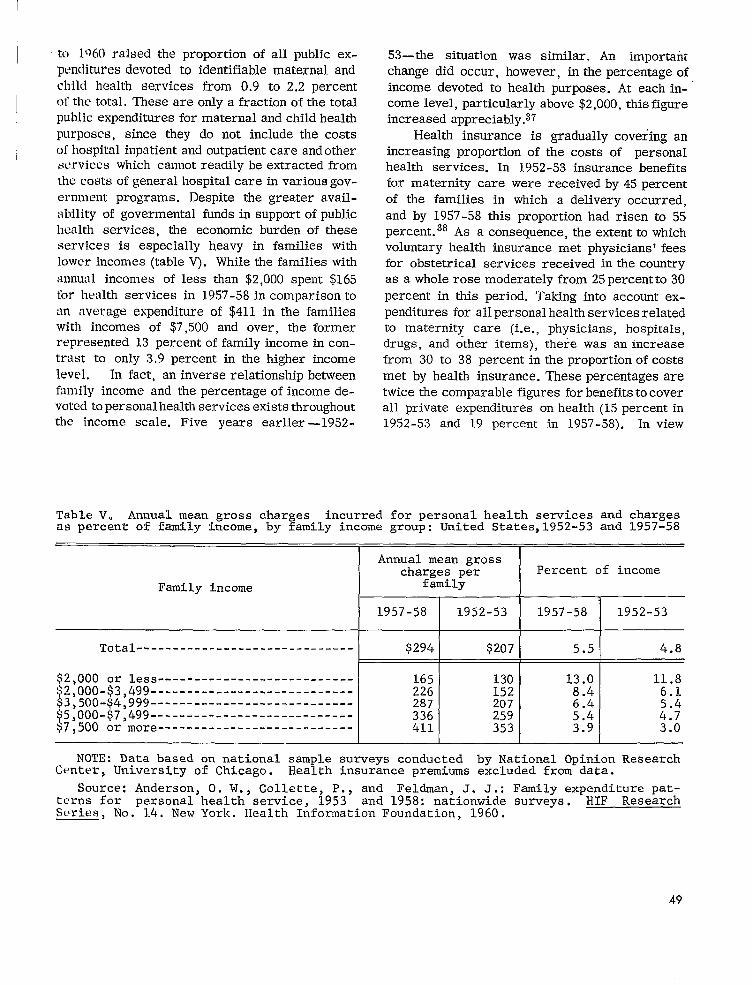
------------------------------
---------------------------------------------------------------------------------------------------------------
to 1Q60 raised the proportion of all public expenditures maternalanddevotedto identifiablechildhealthservicesfrom 0.9 to 2.2percent
These areonlya fractionofthetotal. ofthetotalpublicexpendituresformaternalandchildhealkpurposes,sincethey do not includethe costsofhospital andoutpatientinpatient careandotherserviceswhich cannotreadilybe extractedfromthecostsofgeneralhospitalcareinvariousgov
ernment programs. Despitethegreateravailof governmentalability fundsinsupportofpublic
healthservices,the economicburdenof theseservicesis especiallyheavy in familieswith
lowerincomes(table withV). Whilethefamiliesannualincomes of lessthan$2,000spent$165forhealthservicesin 1957-58incomparisontoan averageexpenditureof $411 in thefamilies with incomes of $7,500and over,theformer represented13 percentoffamilyincomeincon-trastto only3.9percentin the higher income level. In fact,an inverserelationshipbetweenfamilyincome and thepercentageofincomede
health existsvotedtopersonal services throughout—the income scale.Five years earlier 1952-
53—the situationwas similar.An importantchangedidoccur,however,inthepercentageofincome devotedto healthpurposes.At eachincome level, above$2,000,particularly thisfigureincreasedappreciably.37
Healthinsuranceis graduallycoveringanincreasingproportionof thecostsof personalhealthservices.In 1952-53insurancebenefitsformaternitycare were receivedby 45 percentof the familiesin which a deliveryoccurred,and by 1957-58thisproportionhad risento 55
38As a consequence,percent. theextenttowhichvoluntaryhealthinsurancemet physicians’feesforobstetricalservicesreceivedinthecountryas a wholerosemoderatelyfrom 25percentto30percentin thisperiod.Takingintoaccountex
forallpersonal servicespenditures health relatedto maternitycare (i.e., hospitals,physicians,drugs,and otheritems),therewas an increasefrom 30 to 38 percentintheproportionofcostsmet by healthinsurance. areThesepercentagestwicethecomparablefiguresforbenefitstocoverallprivateexpendituresonhealth(15percentin1952-53 and 19 percentin 1957-58).In view
Table V. Annual mean gross charges incurred for personal health services and chargesas percent of family income, by family income group: United States,1952-53 and 1957-58
Annual mean grosscharges per Percent of income
Family income family
1957-58 1952-53 1957-58 1952-53
Total $294 $207 5.5 4.8
$2,000 or less 165 130 13.0 11.8 $2,000 -$3,499 226 152 8.4 6.1
3,500 -$4,999 287 207 6.4
ii 5,000-$7,499 +7)500 or more---------------------------
336 411
259 353
5.4 3.9
::; 3.0
NOTE: Data based on national sample surveys conducted by National Opinion ResearchCenter, University of Chicago. Health insurance premiums excluded from data.
Source: Anderson, O. W., Collette, P., and Feldman, J. J.: Family expenditurepatterns for personal health service, 1953 and 1958: nationwide surveys. HIF ResearchSeries, No. 1.4.New York. Health InformationFoundation, 1960.
49

1of the spread of health insurance with varying degrees of coverage to about three-fourths of the population, by now (1964) the proportions given for 1957-58 may have been exceeded by a considerable margin.
Some idea of the costs of hospital obstetrical care is obtainable from the experience under the Federal Medicare Program for dependents of personnel in the Armed Forces. The average length of hospital stay in 1959 was 4.9 days.ss At an average per diem charge of $30.92 the average hospital cost per case was $151.52, exclusive of Medicare administration costs. The costs of physicians’ fees for care during the maternity cycle must be added to this to obtain the total charge per case.
MATERNAL AND CHILD HEALTH
PROGRAMS AND SERVICES
The many hazards to which the fetus and infant may be vulnerable—genetic disorders, environmental deprivation, oxygen deficiencies, hormonal and enzyme imbalances, infections, and metabolic disorders, to mention a few—call for a multidisciplinary approach to the problem of perinatal and later infant wastage. The acquisition and dissemination of knowledge about the classic art of obstetrics, of knowing when and how to intervene and when it is best to support the patient without intervention, is only one important aspect of the total attack on the problem; the solution to this problem must consist of a broad program in maternal and child health.
The application of the rapid scientific and technical advances of recent years has been uneven, In some instances, as in the screening of newborn infants for phenylketonuria, testing and application of a significant, new development proceeded simultaneously. In contrast, some of the highly sophisticated techniques for the evaluation of women with certain suspected metabolic or e~ljocrinologic disorders can be developed initiall y in only a few medical centers. As matters now stand, the application of some of these services to broad population groups may be deferred indefinitely. For the most part, new research de
velopments are probably applied more rapidly today than at any time in the past.
Changes in patterns of living, particularly in transportation, have introduced an apparent contradiction in the provision of health services. On the one hand, the improvement in roads and the ease of movement in most rural areas have obviated the need for a physician in every ham-let. This makes possible the development of hospitals large enough to provide more complex services for broad geographic areas. At the same time, planning over these wider areas to avoid duplication of expensive facilities and services becomes an urgent need.
On the other hand, many of the underprivileged groups, even in the large cities, cannot or will not take advantage of medical services not in the immediate vicinity of their homes. This is often due to a variety of highly involved circumstances wilich may be generally characterized as economic, educational, or cultural, or to specific conditions such as lack of care for other children in the absence of the mother. These problems are increased when the services are overcrowded OK impersonal. One approach to help overcome this problem is to bring the less complicated services close to their intended recipients.
General Health Services
The level of the community’s general health services, the foundation on which specialized maternal and child health services must be built, directly affects the health of mothers and children.
Environmental health services. —Over the past several decades the provision of safe milk and water supplies has been the major factor in the marked reduction in mortality from diarrheal diseases in infancy. This hazard has been reduced to such a low point in many communities that som,e pediatricians are advocating the preparation of infant feedings with unboiled tap water for use in the home. Pasteurization of milk and control of bovine tuberculosis have made human tuberculosis of the Ixmes and joints a rarity; this contrasts with the situation after the turn of the century when entire institutions were devoted tCJ
the care of children with this condition. New proh-
50

lems, stmhas those of water supply and sewage disposal insuburban housing developments, continue to arise. Air pollution, while far from a new problem, has recently been linked as a possibly significant factor in the health of infants as well as elderly persons.
The potential damage from medical uses of radiation to present and future generations of infants and children has provided the chief impetus to the development of radiation control programs at the national, State, and city levels. Stricter controls are being applied to prevent radiation scatter and to protect the gonads. Major areas of the country, however, still lack effective radio-logic health programs.
Comnumity nursing services. —This public health responsibility has traditionally been divided between voluntary visiting nurse services and the official nursing services of health departments. The former, found mainly in the metropolitan areas, have concentrated on bedside nursing. The trend toward consolidation of the two types of agencies has been slow and spotty.
The slight increase in the number of public nurses, other than those employed by boards of education, was not sufficient between 1950 and 1960 to maintain the earlier ratio of public health nurses to total population. The discrepancy would have been even greater if the ratio were calculated on the basis of public health nurses to number of deliveries.
The public health nurse is the vital link in reaching the high-risk groups early in pregnancy and in maintaining and insuring care for women who have had an unfavorable outcome of a previous pre~mancy. The need to concentrate limited public health nursing manpower on those health problems which are most acute has resulted in decreased attention on home visiting for routine prenatal and newborn care. Furthermore, the rising demands for bedside nursing care may distract attention from the needs of even the high-risk groups of pregnant women unless special emphasis is placed on the latter.
Nutrition #roWams.-Nutrition programs directed mainly toward pregnant women may be relatively ineffective because they may not reach the most vulnerable groups. For example, women who have late or no prenatal care remain outside
the scope of the programs. Also, the early age at which the first pregnancies now occur suggests that any nutritional inadequacies during adolescence would carry over into pregnancy, and limited, unbalanced diets and food fads are frequent among adolescent girls at all social levels in this country.
Health pyo~am”s fo~ migrant- wovkey families. —The migrant farm worker and his family suffer the general disadvantages of being on one of the lowest rungs of the economic ladder. In addition, their constant transiency interferes with their ability to make use of local health services. For these reasons special grants of Federal funds have been made available to the States for special health programs for migrants and their families. Maintaining the continuity of health care as the migrant laborer and his family follow the crops still presents a major problem.
Specialized Health Programs
for Mothers and Infants
Pyenatal and postpavtal health supervision. —€It has been estimated that a great majority of the wom’en delivered by private obstetricians have had regular prenatal care from the first trimester of pregnancy. 35 The prenatal visits, which are spaced more closely together as term approaches, include routine medical examinations and laboratory tests. This highly personalized type of routine care has probably been the major factor in the decline in toxemias and other serious complications of pregnancy.
Maternal health programs of the past, often utilizing itinerant clinics, concentrated on promoting regular prenatal care through health education and the provision of demonstration pre-natal care services. The Federal Emergency Maternity and Infant Care Program of World War H attempted to meet needs in a wartime period.
The problem today appears to be focused among the indigent and medically indigent groups in major metropolitan centers and some rural areas. In most of the large cities and in many of moderate size prenatal and postpartal care for these groups is provided mainly through out-patient clinics housed in either municipal or voluntar y hospitals. The same population shifts that
51
have increased the pressure on inpatient facilities have operated on outpatient clinics as well. In some areas the pressure has become so great that clinic patients may have to spend an entire day for a single prenatal visit. While there are many factors that interfere with the provision of adequate prenatal care to women in the lower socioeconomic groups, gross inadequacy in the volume of clinic services is undoubtedly an important element in discouraging prenatal care among groups which may not be highly motivated to seek care in the first instance. In major municipal hospitals in widely scattered areas of the country, between 20 and 45 percent of the women had no prenatal care at all and first came to the hospital after labor had started.zs
Increased Federal funds for maternity and infant care have been one response to these growing urban problems. Under the Social Security Act the Children’s Bureau had $25 million available in Federal fiscal year 1962-63 for grants to the states for maternal and child health services. In recognition of the need for expanded and improved obstetrical services for deprived segments of the population and with particular emphasis on the bearing these services have on the prevention of mental retardation, Congress provided for a gradual increase in the annual appropriation to a level of $50 million over a period of 7 years. It also established anew 5-year program of grants for obstetrical and pediatric care for high-risk ~roupS, starting with $S million in fiscal year 1964 and rising to an annual level of $30 million during 1966 through 1968. An additional amount was appropriated for program-oriented research in the maternal and child health field.
Special projects are being developed for the provision of obstetrical care through the expansion of basic hospital facilities and in special circumstances the development of new clinics in de-pressed neighborhoods. The latter, so-called satellite clinics staffed by personnel from the parent hospital in which delivery is to take place, help insure continuity of care throughout the maternity cycle. In these special projects the hospital and clinic services are closely coordinated w~th available public health nursing and other public health services.
In those States with a large proportion of rural-midwife deliveries State and local health
departments have conducted programs in which nurse-midwives provide supervision and limited training of the essentially untrained midwives. Medically reamed clinics have also been provided for midwives’ patients who present suspected complications of pregnancy.
In many centers throughout the country specially organized facilities are available for the study of problems of infertility regardless of the specific cause. Usually multidisciplinary in character these clinics utilize the services of a variety of paramedical personnel and provide the opportunity to conduct sophisticated laboratory studies; their staff often serves in a consultative capacity to the primary physician.
For women who have suffered unfortunate outcomes in previous pregnancies, organized pre-conceptional clinics are available in a few medical centers. These services are also usually provided on a selective, consultative basis for the more difficult clinical problems, since many conditions inimical to fetal welfare can be handled through the diagnostic and therapeutic armamentarium in the office of the physician or in conventional out -patient clinics. The extent to which the elaborate biochemical, endocrinologic, and other laboratory studies are available throughout the country is not known, but the full range of needed laboratory procedures is probably to be found almost exclusively in medical centers having a research interest in these problems.
New approaches are being taken to the related question of family planning for medical and socioeconomic reasons. For the most part, voluntary efforts still provide the major support for family planning, but the health or welfare departments in an increasing number of States and localities are supporting services which offer a choice of methods in accordance with the wishes and conscience of the recipients.
Hospital cave. —Many of the problems relating to delivery care have been discussed under hospital facilities. Most organized community ma- , ternal health programs for individual patients stop at the hospital entrance. Since the termination of the Federal Maternity and Infant Care Program shortly after World War II only a few, relatively limited State and local programs have covered hospitalization of women presenting complications of pregnancy. This situation prom-
52
iscs to change sharply with the spread of the new projects under the Maternity and Infant Care Grants.
Most State maternal and child health pro-
1 grams include some type of supervision of hospital obstetrical services (including newborn nurseries) or of the newborn nurseries alone. While originally motivated by the desire to control puerperal infections and epidemic diarrhea of the newborn infant, these supervisory services have been broadened to cover the total management of the hospital maternity and new-born units. Prepackaged infant formulas have been a recent innovation for the newborn nursery. The introduction of screening for phenylketonuria on a routine basis promises to be the prototype of a battery of screening tests for genetically deter-mined disorders of metabolism which in the absence of early and adequate treatment could lead to death, mental retardation, or a permanent physical disability. At least two States have man-dated testing the newborn for phenylketonuria.
For nearly three decades maternity mortality conferences have been conducted in individual hospitals or on a community-wide basis to” re-view the factors involved in maternal deaths. These conferences are a first step in preventing a repetition of the circumstances surrounding maternal deaths. This technique has been extended in the past few years to the study of perinatal deaths.
Cart? of infants of low birth weights. —In the past 20 years many hospitals have developed specially equipped and staffed newborn nurseries for infants of low birth weight. When these nurseries have been set up to care for infants brought in from other hospitals in the surrounding area, they have often been referred to as premature centers. Programs for transporting infants to the premature centers, often with payment for care provided at the centers, are conducted by State health departments and some
6 health departments in large cities. As discussed previously, the impact of such
care on the birth weight-specific death rates of these infants appears to have leveled off. Further major declines in the birth weight-specific fatality rates do not appear likely in the near future unless there is a new breakthrough in infant care. In any event, the high incidence of
low birth weight infants among certain segments of the population suggests that there are controllable factors leading to premature delivery and low birth weight which, if regulated, offer the greatest promise of long-term results in the prevention of death and disability.
Surveillance of records. —The recent thalidomide tragedy has projected dramatically the need for a continuing mechanism for the prompt detection of unusual events affecting infants. A system of surveillance of the incidence of con-genital malformations reported on live-birth certificates and other vital records 39 has been considered a first step toward a more inclusive approach to an ongoing review of fetal and neonatal deaths by hospital and geographic area.
Patterns of Care
Diversity, complexity, and change are the outstanding characteristics in the patterns of health care in this country today. The basic relationship of the individual to a physician for services financed directly by the individual is strongly affected by the growing trend toward medical specialization. The rapidly expanding fund of medical knowledge enables each specialty to offer service of greater depth within its special area of competence. The public is generally eager to take advantage of these services and often directly seeks out a specialist for a particular medical problem. Greater understanding of what modern medical care has to offer has led to the development of new methods and arrangements for meeting the costs of medical care. In these situations the primary physician may, on occasion, not be readily identifiable.
The services provided or financed by government proceed simultaneously under Federal, State, and local auspices. To describe these as levels of services would not present a fair picture of the interrelationships involved, since both Federal and State programs in many cases cover services to individuals in their home communities without involvement of any local governmental jurisdiction. In other instances Federal or State funds, or both, may be made available to local jurisdictions as outright grants or to supplement local funds.
To complicate the picture further, voluntary agencies and private foundations have been prom-
53

inent in almost every field of health, and each agency and foundation has its own policies. Some limit their activities to health education; others, to the support of research. Still others promote and support special clinical facilities and services or finance individual patient care. Coordination of these services is needed if continuity of care is to be attained in the best interest of the patient.
SUMMARY—MEDICAL RESOURCES
AND HEALTH PROGRAMS
Changes in the availability and use of medical personnel, facilities and services, and the financing of medical care as relate~ to obstetrics and pediatrics are reviewed briefly in this section. Maternal and child health programs and services are discussed primarily in terms of the current situation. Highlights follow:
Medical Manpower and Facilities
1. Large increases have occurred during the past 10-15 years in the availability of specialists in the fields of maternal and child health. The ratio of the number of obstetricians -gynecologists to the number of deliveries has doubled since 1949, and the ratio of pediatricians to children under 15 years of age rose sharply. Offsetting these increases is the marked reduction in the corresponding ratios for general practitioners. Accordingly the ratio of medical manpower (specialist and general practitioner) to the number of deliveries in-creased only slightly since 1949; the ratio in the case of children decreased.
2. The distribution of specialists in obstetrics-gynecology and pediatrics varies greatly with geographic region. The highest ratios of these specialists to the number of deliveries and the number of children under 15 years of age, respectively, are in the Northeast. The South has the lowest ratio in obstetrics, and the North Central region has the lowest ratio in pediatrics.
3. Nursing personnel are still in short supply although there have been increases in recent years in both professional
nurses and practical nurses. The supply of public health nurses per 100,000 population has risen, mainly due to increases in nurses employed by boards of education.
4. The long-term trend toward increased use of hospitals at time of confinement has continued to the present. All but 3 percent of the deliveries are now performed by physicians in the hospital. Deliveries by untrained midwives are almost entirely confined to nonwhite women, but even in this group they account for only 1 of 10 deliveries.
5. Major expansion has taken place in hospital facilities since World War II. This has affected all parts of the country. Initially the emphasis in hospital construction was on the needs of smaller communities and rural areas; recently attention has shifted to large centers of population. Hospitals in many large cities face an acute problem related to population changes. Migration has resulted in greater concentration of low socioeconomic groups in some of the large cities. This has increased pressures on prenatal clinics and obstetrical ward services.
Financing of Medical Care
1. Expenditures for health and medical care more than doubled in the 1950 decade. The proportion of the gross national product devoted to health and medical care expenditures rose from 4.7 percent (1950) to 5.4 percent (1960). About three-quarters of the expenditures for health and medical care are met from the private sector of the economy. In 1957-58, the most recent period for which national data are available, the economic burden of personal health services was heaviest in families with low incomes.
2. Health insurance coverage has become ~ widespread. Three of four persons today have basic insurance which provides coverage in varying degrees of in-hospital, surgical, and obstetrical costs. No recent data are available concerning the
54

extent to which health insurance is meeting costs of maternity care. In 1957-58 38 percent of the total expenditures for medical, hospital, and other health se”i._v-ices related to maternity were met by insurance (i.e ., for insured and uninsured persons combined). About 30 percent of the physician charges for obstetrical services were covered by health insurance.
Maternal and Child Health Programs
1. Chan!:es in scope of emphasis of many general health services at the community level have an impact on the health, of mothers and children. Included among these services are radiation control pro-grams, efforts to deal with air pollution and other environmental health problems, and special programs for migrant-worker families. Limited public health nursing manpower has resulted in decreased attention on home visiting for prenatal and newborn care.
2. A large majority of the patients of private physicians receive regular prenatal
care from the first trimester of pregnant y. Substantial segments of women who are delivered in general service wards of municipal and voluntary hospitals obtain little or no prenatal care prior to the de-livery. Programs are being focused on the indigent and medically indigent groups in the major metropolitan centers and in some rural areas. Special projects sup-ported by Federal funds are concentrating on the expansion of facilities and on new means of providing medical care in low-income areas.
3. Special facilities are becoming more numerous for the study of problems of infertility and for dealing with problems of repeated pregnancy loss. Also, new approaches to the question of family planning are being adopted.
4. Hospitals and health agencies are engaged in programs concerned with prematurely born infants and the adoption of new advances in medicine. No information is available on how widespread the implementation of these programs has been.
Ill. PERSPECTIVE ON FUTURE COURSE
OF INFANT
The outstanding characteristic of the trend in the infant mortality rate in the United States since 1950 has been the lack of large-scale reductions in the rate for any segment of the population. This is true whether one considers geography, race, or such parameters of infant mortality”as prior pregnancy history and birth weight. I Iigh-risk groups have fared worse in this regard than the better advantaged groups. But even if
all groups had experienced similar reductions in their death rates, the decrease in the total infnnt mortality rate would have lagged far behind the improvement during the 1940’s. This situation raises a number of provocative questions about the immediate past and the potentials for the future.
Why is it that during a period of great economic advancement and expanding allocation of
economic resources to medical care (i.e., from 1~50 to date) the infant mortality rate has under-
MORTALITY
gone only minor reductions? Given the present state of medical knowledge and practice, is the irreducible minimum in infant mortality being approached, or are there prospects for further reductions in the mortality rate? Are new orientations for dealing with the problem of infant mortality indicated?
There seems to be no question that we are dealing with a difficult” paradox when economic and medical care advances in the 1950’s are contrasted with what happened to the infant mortality rate. Reductions in the proportion of the population in the low socioeconomic classes and migration of population groups from rural areas with high mortality rates and relatively poor medical facilities to large urban centers where highly trained physicians and large medical institutions are located could logically have been expected to result in major decreases in infant mortality. In the 1940’s, when similar conditions
55

prevailed, infant mortality did decline markedly. There were a number of differences, however, between these two periods.
During the 1940’s maternal and child health programs at the State and local levels were greatly strengthened, and infant mortality was a prime target of health department activities. The Federal Emergency Maternity and Infant Care Program,. designed to meet the urgent needs of wives and infants of men in the Armed Forces during World War II, helped bring regular pre-natal and infant health supervision to broad segments of the population. This program ended after World War II. A large part of the reduction in infant loss was concentrated in the control of infectious diseases whose toll was still substantial at the beginning of the 1940’s. In some areas the introduction of special programs for the care of prematurely born infants also had an impact on the mortality rate.
In the 1950’s a general attitude that significant progress in reducing infant mortality required, above all, new insights to basic biological processes tended to dampen the fervor for action programs. The 1950’s might also be characterized as a decade in which earlier medical and program advances continued without significant innovations. This occurred in the absence of major scientific breakthroughs that could have been expected to produce broad effects through immediate application.
Finally, some of the very conditions which, on the surface, might be taken as harbingers of improvement had the reverse result. An out-standing example is the migration of nonwhite persons to large metropolitan areas; in these areas, then, infant mortality increased. The ex-planation is complex, encompassing many social, economic, and program issues. High on the list rn~ght well be a lag in community facilities in accommodating themselves to the change and a delay in the adaptation of the in-migrant group to their new medical care and social environment.
Speculation about the possibility that an irreducible minimum in infant mortality is near generally focuses on the following conclusions: (1) most of the losses occur in early infancy, (2) many of the underlying mechanisms are poorly understood, and (3) reduction in the incidence of low birth weight is central to the problem.
These are truisms; but to accept the irreducible minimum theory, one must also embrace another proposition: biological processes are involved which are not susceptible to modification through an alternation of environmental conditions. It is difficult to accept this hypothesis if environmental conditions are broadly defined to include not only general socioeconomic circumstances but also family planning, organization and availability of high quality medical care, and personal health practices of the population.
Actually the question that needs to be posed is not whether there will be further reductions in infant mortality but whether the rate of decline in the mortality rate will accelerate. Reduct ions in infant mortality, although small, are occurring, and the prospects are for these to continue. Close to 30 percent of the infant deaths are still attributed to factors related to identifiable environmental conditions and to conditions that may reflect quality of medical and hospital care. Decreases in the frequency of deaths from these causes alone would have a significant effect on the level of the infant mortality rate. If mortality from infectious diseases of all types (respiratory, digestive, etc.), accidents and such conditions as hemolytic disease of the newborn and neonatal disorders arising from maternal disorders (diabetes, toxemia, etc.), and ill-defined diseases of the newborn were cut in half, the infant mortality rate would decline from 25.3 per 1,000 (in 1962) to about 22.5.
Additional reductions would have to be sought primarily through decreases in the frequency of prematurity and in mortality attributed directly or indirectly to immaturity. The potential for such reductions is, of course, uncertain. But it should be recognized that only slight improvements in the rates among low-risk groups, if accompanied by a moderate closing of the gap between high- and low-risk groups, would result in lowering the overall mortality rate projected above (22 .5) to abut 20 per 1,000.
Attainment of an infant mortality rate of 20 per 1,000 in the United States would appear to be a realistic goal. General conditions that are expected to contribute to the movement toward this goal are continued improvements in standard of living, strengthening of medical and hospital re-sources, and the likely shift over the next few
56

--------
Table 1.
2.
3.
4.
5.
6.
7.
8.
9.
10,
11.
12.
DETAILED TABLES
Infant mortality ratea by age at death: United States, 1935-62------------------
Infant mortality rates by age at death and sex: United States, 1935-62----------
Infant mortality rates by age at death and color: United States, 1935-62--------
Fetal death ratioa by gestation, sex, and color: United States, 1942-62---------
Perinatal mortality rates by sex and color: United States, 1942-62--------------
Average annual infant mortality rates by age at death, color, and geographic division; average annual fetal mortality ratioa and perinatal mortality rates bycolor and geographic division: United States, selected decennium periods
Average annual infant mortality rates. by age at death and color: United States, each geographic division and State, 1959-61-------------------------------------
Average annual infant mortality rates by age at death, and color: United States,metropolitan and nonmetropolitan counties, and cities over 250,000 population,1950-51 and 1960-61-------------------------------------------------------------
Average annual infant mortality rates for selected cauaes of death, by age atdeath, sex, and color: United States, 1959-61-----------------------------------
Percent of live birtha at birth weights of 2,500 grama or less,by age of mother,color, and total-birth order: United Statea, January-March 1950-----------------
Neonatal mortality rates by total-birth order, color, and age of mother: UnitedStatea, January-March 1950------------------------------------------------------
Average fetal death rates by age of mother, color, and total-birth order: UnitedStates, 1960-61-----------------------------------------------------------------
Page
61
62
64
66
67
68
70
72
75
77
78
79
60

-----------------------------
Table 1. Infant mortality rates by age at death: United States, 1935-62—
Under Under UnderYear 1 28 1 1-6 7-27 1-5 6-11
year daysl day days days1 months months
II II I I I I
Rates per 1,000 live births
19622--------------------------- 25.3 18.3 10.4 6.1 5.2 1.81961:--------------------------- 25.3 18.4 10.3 5.2 1.81960---------------------------- 26.0 18.7 10.3 ;:: 5.4 1.9
19599--------------------------- 26.4 19.0 5.4 1958---------------------------- 27.1 19.5 ;:$ 5.6 ;:: ;;’9;---------------------------- 26.3 19.1 6.8 5.3 2.0
26.0 18.9 6.7 1955---------------------------- 26.4 19.1 7.0 ;:; %:
1954---------------------------- 26.6 19.1 7.1 5.3 2.21953---------------------------- 27.8 19.6 7.5 2.41952---------------------------- 28.4 19.8 7,5 ::: 2.61951---------------------------- 28.4 20.0 7.7 2.51950---------------------------- 29.2 20.5 7.7 ?; 2.7
1949---------------------------- 31.3 21.4 10.5 2.9 1948---------------------------- 32.0 22.2 1o.7 ;:; ;:: 3.0 L947---------------------------- 32.2 22.8 10.7 1946---------------------------- 33.8 24.0 11.4 ::2 ::: ;:; 1945---------------------------- 38.3 24.3 11.2 8.5 9.6 4.4
1944---------------------------- 39.8 24.7 11.5 8.5 10.1 4.9 1943---------------------------- 40.4 24.7 11.6 8.4 10.5 1942---------------------------- 40.4 25.7 12.3 8.5 2:; 1941---------------------------- 45.3 27.7 13.2 9.0 1!:: 5.9 1940---------------------------- 47.0 28.8 13.9 9.4 12.2 6.0
1939---------------------------- 48.0 29.3 14.1 9.6 12.2 6.61938---------------------------- 51.0 29.6 14.1 13.81937---------------------------- 54.4 31.3 14.7 1%; 15.0 ;:;1936---------------------------- 57.1 32.6 15.1 10.7 15.8 8.71935---------------------------- 55.7 32.4 15.0 10.5 15.0 8.3
~FrOQ 1935 to 1948 these categories refer to deaths at ages “7-29 days” and “under 1 month,”res~ectively.
-Includes Alaska and Hawaii.
Source: Annual volumes Vital Statistic of the United States, National Center for Health Statistics, Public Health Service, Washington, U.S. Government Printing Office, and special tabulations.
61

---------------------------
Table 2. Infant mortalityrates by age at death and sex: United States, 1935-62
Under Under Under 1-6 7-27 1-5 6-111 28 1Year year days1 day days daya1 months months
~ Rates per 1,000 live births
19622--------------------------- 28.6 20.9 11.7 7.L 2.0 5.8 1.9
19612--------------------------- 28.4 20.8 11.5 7.2 2.1 5.7 1.9
19602--------------------------- 29.3 21.2 11.6 7.4 2.2 6.0 2.1
19592 29.6 21.6 11.6 7.7 2.3 6.0 2.0
1958---------------------------- 30.2 21.9 11.4 7.9 2.6 6.2 2.1
1957---------------------------- 29.5 21.6 11.1 7.8 2.6 5.9 2,1
1956---------------------------- 29.2 21.5 11.3 7.8 2.5 5.7 2.1
1955---------------------------- 29.6 21.7 11.2 8.1 2.4 5.7 2.2
1954---------------------------- 29.8 21.7 10.8 8.3 2.6 5.8 2.3
1953---------------------------- 31.2 22.3 10.9 8.7 2.7 6.3 2.6
1952---------------------------- 31.8 22.5 11.0 8.8 2.8 6.5 2.8
1951---------------------------- 32.0 22.9 11.1 9.0 2.8 6.4 2.7
1950---------------------------- 32.8 23.3 L1.5 8.9 2.9 6.6 2.8
1949---------------------------- 35.1 24.5 11.9 9.1 3.5 7.6 3.0
1948---------------------------- 35.9 25.2 12.1 9.5 3.6 7.6 3.1
1947---------------------------- 36.1 25.9 12.1 9.9 3.9 7.4 2.9
1946---------------------------- 37.8 27.2 12.9 10.0 ‘4.3 7.5 3.0 1945---------------------------- 42.7 27.6 12.6 9.9 5.1 10.5 4.6
1944---------------------------- 44.1 27.7 12.8 9.8 5.2 11.2 5.2 1943---------------------------- 45.1 28.1 13.1 9.7 5.2 11.5 5.5
1942---------------------------- 44.9 29.1 13.9 9.9 5.3 10.8 5.1 1941---------------------------- 50.4 31.2 14.9 10.4 5.9 12.9 6.3
1940---------------------------- 52.5 32.6 15.7 10.9 6.0 13.4 6.5
1939---------------------------- 53.3 32.9 15.8 11.0 6.1 1.3.3 7.1 1938---------------------------- 56.7 33.4 16.0 11.0 6.4 15,1 8.2 1937---------------------------- 60.3 35.1 16.5 11.5 7.1 16,4 8.8 1936---------------------------- 63.4 36.8 17.1 12.3 7.4 17.4 9.3
1935---------------------------- 62.2 36.7 17.0 12.1 7.6 16,6 9,0
62

Table 2. Infantmortalityrates by age at death and sex: United States, 1935-62—Con.
Under Under Under 1-6 7-27 1-5 6-11Year 1 28 1year days1 day days days1 months months
Female
1962:---------------------------
19612---------------------------
19602---------------------------
19592---------------------------
1958----------------------------
1957----------------------------
1956----------------------------
1955----------------------------
1954----------------------------
1953----------------------------
1952----------------------------
1951----------------------------
1950----------------------------
1949----------------------------
1948----------------------------
L947----------------------------
1946----------------------------
L945----------------------------
1944----------------------------
1943----------------------------
1942----------------------------
1941----------------------------
1940----------------------------
1939----------------------------
1938----------------------------
1937----------------------------
1936----------------------------
1935----------------------------
Rates per 1,000 live births
21,9 15.7 8.9 5.0 L.7 4.5 1.7
22.0 15.8 9.0 5.1 1.7 4.6 1.6
22.6 16.1 9.0 5.3 1.8 4.7 1.8
23.0 16.3 9.0 5.5 1.9 4.9 1.8
23.7 16.8 9.0 5.9 2.0 5.0 1.9
23.0 16.4 8.7 5.6 2.1 4.7 1.9 22.6 16.2 8.5 5.6 2.0 4.5 1.9 23.0 16.4 8.8 5.8 1.9 4.7 2.0
23.2 16.3 8.4 5.9 2.1 4.8 2.1 24.2 16.7 8.3 6.2 2.2 5.2 2.3
24.9 17.0 8.4 6.2 2.3 5.4 2.5
24.7 17.1 8.4 6.4 2.3 5.2 2.4 25.5 17.5 8.8 6.4 2.4 5.4 2.6
27.3 18.3 9.0 6.5 2.8 6.3 2.7
27.9 19.0 9.1 6.9 3.0 6.1 2.8 28.1 19.5 9.3 7.1 3.2 6.0 2.6 29.5 20.7 9.9 7.2 3.6 6.1 2.8
33.6 20.9 9.7 7.1 4.1 8.6 4.1
35.2 21.5 10.1 7.1 4.3 9.0 4.7 35.4 21.2 9.9 7.0 4.3 9.3 4.8
35.7 22.1 10.6 7.1 4,3 9.1 4.5
40.0 23.9 11.4 7.6 4.9 10.7 5.4 41.3 24.7 12.1 7.7 4.9 11.0 5.5
42.5 25.5 12.4 8.2 4.9 10.9 6.1 45.1 25.6 12.2 8.1 5.4 12.4 7.1 48.3 27.3 12.8 8.5 5.9 13.4 7.5
50,5 28.2 13.0 9.0 6.2 14,2 8.1
48.9 27.9 12.8 8.8 6.3 13.4 7.6
‘From L935 to 1948 these categcmiesrefer to deaths at ages “7-29 days” and “under 1 month,”res~ecEively.
-IncludesAlaska and Hawaii.
Source:Annual volumes Vital Statisticsof the.UnitedStates,National Center for Health Statistic, Public Health Service,Washington, U.S. GovernmentPrintingOffice, and specialtabulations.
63
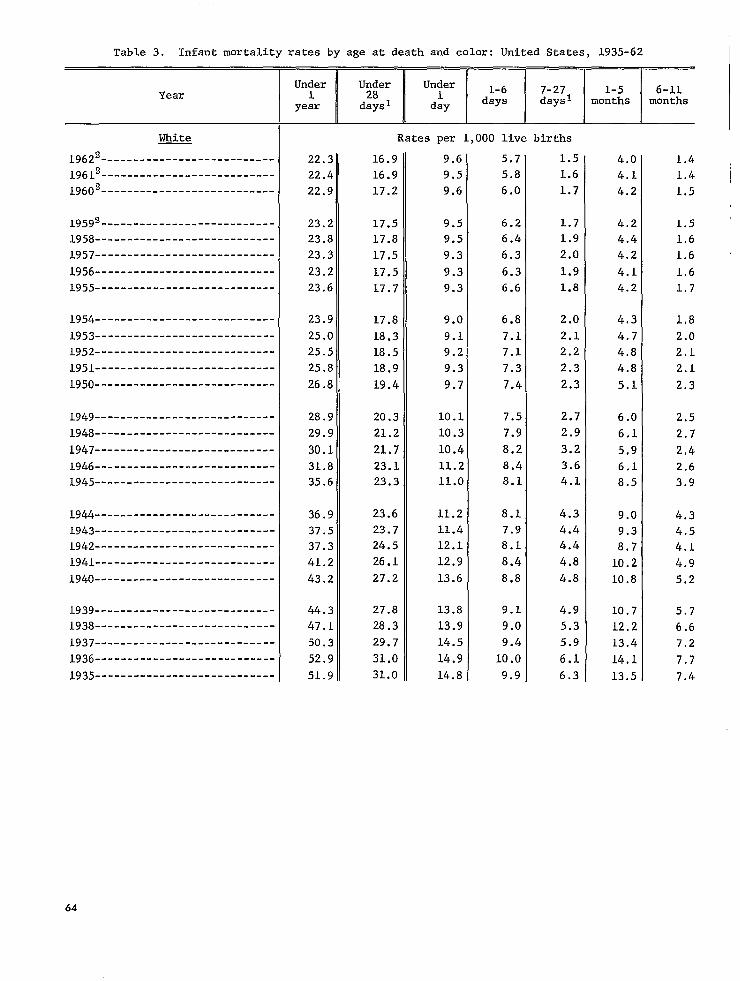
Table 3. Infant mortality ratea by age at death and color: United States, 1935-62
Under Under Under 1-6 7-27 1-5 6-lL1 28 1Year year days1 day days days1 months months
White
19622---------------------------
19612---------------------------
19602---------------------------
19599---------------------------
1958----------------------------
1957----------------------------
1956----------------------------
1955----------------------------
1954----------------------------
1953----------------------------
1952----------------------------
1951----------------------------
1950----------------------------
1949----------------------------
1948----------------------------
1947----------------------------
1946----------------------------
1945----------------------------
1944----------------------------
1943----------------------------
L942----------------------------
1941----------------------------
1940----------------------------
1939----------------------------
1938----------------------------
1937----------------------------
1936----------------------------
1935----------------------------
Rates per 1,000 live births
22.3 16.9 9.6’ 5.7 1.5 4.0 1.4 22.4 16.9 9.5 5.8 1.6 4.1 1.4 22.9 17.2 9.6 6.0 1.7 4.2 1.5 I
23.2 17.5 9.5 6.2 1.7 4.2 1.5 23.8 17.8 9.5 6.4 1.9 4.4 1.6 23.3 17,5 9.3 6.3 2.0 4.2 1.6
23.2 17.5 9.3 6.3 1.9 4.1 1.6 23.6 17.7 9.3 6.6 1.8 4.2 1.7
23,9 17.8 9.0 6.8 2.0 4.3 1.8 25.0 18.3 9.1 7.1 2.1 4.7 2.0 25.5 18.5 9.2 7.1 2.2 4.8 2.I. 25.8 18.9 9.3 7.3 2.3 4.8 2.1
26.8 19.4 9.7 7.4 2.3 5.1 2.3
28.9 20.3 10.1 7.5 2.7 6.0 2.5 29.9 21.2 10.3 7.9 2.9 6,1 2.7
30.1 21,7 10.4 8.2 3.2 5.9 2,4
31.8 23.1 11.2 8.4 3.6 6.1 2.6 35.6 23.3 11.0 8.1 4.1 8.5 3.9
36.9 23.6 11.2 8.1 4.3 9.0 4.3 37.5 23.7 11.4 7.9 4.4 9.3 4.5 37.3 24,5 12.1 8.1 4.4 8.7 4.1 41.2 26.1 12.9 8.4 4.8 10.2 4.9 43.2 27.2 13.6 8.8 4.8 10.8 5.2
44.3 27.8 13.8 9.1 4.9 10.7 5.7 47.1 28.3 13.9 9.0 5.3 12,2 6.6 50.3 29.7 14.5 9.4 5.9 13.4 7.2 52.9 31.0 14.9 10.0 6.1 14.1 7.7 51.9 31.0 14.8 9.9 6.3 13.5 7.4
64

Table 3. Infant mortality rates by age at death and color: United Statea, 1935-62--Con.
Under Under Under Year 1 28 1 1-6 7-27 1-5 6-11
year days1 day days days1 months months
Nonwhite Rates per 1,000 live births
19622--------------------------- 41.4 26.1 14.3 8.1 3.6 11.5 3.8
196i2--------------------------- 40.7 26.2 14.2 8.3 3.8 11.0 3.5
19602--------------------------- 43.2 26.9 14.4 8.5 4.0 12.1 4.2
1959U--------------------------- 43.7 27.5 14.5 8.8 4.2 12.1 4.1
1958---------------------------- 45.7 29.0 14.3 10.0 4.7 12.4 4.3
1957---------------------------- 43.7 27.8 13.9 9.3 4.6 11.6 4.3
1956---------------------------- 42.1 27.0 13.7 8.9 4.4 10.9 4.1
1955---------------------------- 42.8 27.2 13.9 9.1 4.2 11.3 4.3
1954---------------------------- 42.9 27.0 13.3 9,4 4.4 11.3 4.6
1953---------------------------- 44.7 27.4 12.9 9.8 4.7 12.3 5.0
1952---------------------------- 47.0 28.0 12.8 10.2 5.0 13.3 5.7
1951---------------------------- 44.8 27.3 12.7 10.0 4.6 12.2 5.3
1950---------------------------- 44.5 27.5 13.0 9.8 4.8 11.7 5.2
1949---------------------------- 47.3 28.6 12.8 10.1 5.7 13.5 5.3
1948---------------------------- 46.5 29.1 12.9’ 10.4 5.7 12.3 5.0
1947---------------------------- 48.5 31.0 13.5 11.2 6.2 12.4 5.1
1946---------------------------- 49.5 31.5 13.4 11.0 7.2 12,5 5.4
1945---------------------------- 57.0 32.0 12.7 11.3 8.0 17,3 7.8
1944---------------------------- 60.3 32.5 i3.2 11.3 8.0 18.4 9.4
1943---------------:------------ 62.5 32.9 13.2 11.7 8.0 19.2 10.3
1942---------------------------- 64.6 34.6 14.4 12.0 8.3 19.7 10.2
1941---------------------------- 74.8 39.0 15.7 13.5 9.8 23.0 12.8
1940---------------------------- 73.8 39.7 16.0 13.7 10.0 22.5 11.5
1939---------------------------- 74.2 39.6 16.2 13.5 9.8 22.2 12.5
1938---------------------------- 79.1 39.1 15.8 13.4 9.9 24.9 15.1
1937---------------------------- 83.2 42.1 16.1 14.7 11.3 26.0 15.1
1936---------------------------- 87,6 43.9 16.4 15.6 11.9 27.9 15.9
1935---------------------------- 83.2 42.7 16.2 14.8 11.6 25.8 14.7
lFr~m L935 to 1948 these categories refer to deaths at ages “7-29 days” and “under 1 month,” res~ectively.
-Includes Alaska and Hawaii. New Jersey excluded from data for 1962; color not reported onvital record.
Source: Annual volumes Vital Statistics of the United States, National Center for Health Statistics, Public Health Service, Washington, U.S. Government Printing Office, and special tabulations.
65

---
---
---
---
---
---
---
---
---
---
---
---
---
----
---
---
---
---
---
---
---
---
---
---
Table 4. Fetal death ratios by gestation, sex, and color: United States, 1942-62
Fetal death ratio 112
Fetal Year death ~ Total White Nonwhite
:atio I
Total Male Female Total Male Female Total Male Female
19623--------------- 11.5 15.9 16.8 15.0 13.9 14.6 13.3 26.7 28.9 24.5
19613--------------- 11.6 16.1 17.0 15.2 14.1 14.7 13.5 27.0 29.4 24.6
19603--------------- 11.6 16.1 16.9 15.2 14.1 14.7 13.5 26.8 29.1 24.4
19593--------------- 11.7 16.2 17.0 15.3 14.2 14.8 13.5 27.3 29.6 25.0
1958---------------- 11.9 16.5 17.4 15.6 14.5 15.1 13.9 27.5 30.1 24.9
1957---------------- 12.0 16.3 17.3 15.4 14.5 15.2 13.8 26.8 29.2 24.4
1956---------------- 12.1 16.5 17.4 15.5 14.6 15.3 13.9 27.2 29.4 24.9
1955---------------- 12.6 17.1 18.0 16.2 15.2 15.8 14.5 28.4 31.0 25.8
1954---------------- 12.9 17.5 18.4 16.4 15.5 16.3 14.7 28.9 31.2 26.5
1953---------------- 13.4 17.8 18.7 16.8 15.9 16.6 15.1 29.6 32.2 27.0
1952---------------- 13.8 18.3 19.4 17.2 16.1 16.8 15.3 32.2 35.6 28.9
1951---------------- 14.3 18.8 20.0 17.6 16.7 17.6 15.8 32.1 35.4 28.7
1950---------------- 14.6 19.2 20.5 17.9 17.1 18.0 16.1 32.5 36.0 28.9
1949---------------- 15.1 19.8 21.1 18.5 17.5 18.5 16.6 34.6 38.0 31.2
1948---------------- 15.5 20.6 21.8 19.4 18.3 19.3 17.2 36.5 39.6 33.3
1947---------------- 16.1 21.1 22.5 19.6 18.7 19.8 17.4 39.6 43.1 36.0
1946---------------- 17.2 22.8 24.3 21,2 20.4 21.7 19.1 40.9 44.6 37.2
1945---------------- 18.5 23.9 25.5 22.3 21.4 22.6 20.1 42.0 46.3 37.6
19444--------------- 19.0 24.5
19434--------------- 19.3 24.5
19424----------.---- 20.1 25.6
lFetal death ratio I is defined as fetal deaths of 28 weeks or more gestation and a Propor. .tionate number of fetal deaths of unknown gestation per 1,000 live births:
2Fetal death ratio II differs from fetal death ratio I in that it includes fetal deaths of 20weeks or more gestation plus all not stated gestation age.
3Hawaii not available by sex for 1959. Therefore, 1959 does not include Hawaii but includesAlaska. Alaska and Hawaii included beginning 1960. New Jersey excluded from data by color for1962; color not reported.
qFor 1942-44,data not available by color or sex.
NOTE: Fetal deaths with sex not stated distributed proportionately.
Source: Annual volumes Vital Statistics of the United States, National Center for Health Statistics, Public Health Service, Washington, U.S. Government Printing Office, and special tabulations.
66

---------------
---
---
---
---
---
---
---
---
---
---
---
---
---
---
---
---
---
---
---
---
---
---
---
---
1 Table 5. Perinatal mortality rates by sex and color: United States, 1942-62
I
Perinatal mortality rate 112
PerinatalYear uortality Total White Nonwhite
rate 11
1962:{---------------
1961:’
1960:]---------------
19593-..-----------.
1958----------------
1957----------------
1956----------------
1955----------------
1954----------------
1953----------------
1952----------------
1951----------------
1950----------------
1949----------------
1948----------------
1947----------------
1946----------------
1945----------------
19444---------------
19434---------------
19424---------------
Total Male Female Total Male Female Total Male Female
27.7 33.7 37.0 30.2 30.4 33.4 27.2 51.4 56.2 46.4
28.0 34.C 37.0 30.6 30.6 33.5 27.5 51.8 56.9 46.7
28.2 34.: 37.5 30.’8 30.9 33.9 27.8 52.2 57.5 46.9
28.4 34.6 38.0 31.1 31.2 34.3 27.9 53.5 58.5 48.4
28.9 3.5.4 38.6 32.0 31.9 34.8 28.7 55.0 60.3 49.6
28.5 34.8 38.2 31.3 31.6 34.7 28.3 53.2 58.2 47.9
28.6 34.8 38.2 31.2 31.6 34.8 28.3 52.8 58.1 47.3
29.3 35.6 39.0 32.1 32.4 35.5 29.1 54.1 59.4 48.7
29.5 35.9 39.4 32.2 32.8 36.1 29.4 54.3 59.5 48.9
30.3 36.7 40.2 33.0 33.6 37.0 30.1 55.3 60.3 50.2
30.8 37.4 41.1 33.6 34.1 37.4 30.6 58.4 64.8 51.8
31.5 38.1 42.0 34.1 35.0 38.5 31.3 57.6 64.2 50.8
32.2 39.0 42.9 34.8 35.8 39.5 32.0 58.1 64.4 51.7
33.1 40.5 44.6 36.1 37.2 41.0 33.2 61.1 67.5 54.4
34.1 41.9 46.1 37.5 38.7 42.6 34.6 63.3 69.3 57.2
35.1 42.9 47.3 38.4 39.6 43.7 35.3 67.9 74.4 61.2
36.9 45.8 50.3 41.0 42.6 46.9 38.0 69.6 76.2 62.9
37.8 47.2 51.8 42.3 43.7 48.0 39.2 71.0 78.6 63.2
38.6 44.5
38.8 48.1
40.5 50.0
‘Perinatal mortality rate I is defined as infant deaths under 1 week plus fetal deaths of28 weeks or more gestation and a proportionate number of fetal deatha of unknown gestation per1,0~0 live births plus specified fetal deaths.
‘Perinatal mortalitv rate II differs from Derinatal :mortalitv rate I in that it includesinfant deaths under 28-days plus fetal deaths o? 20 weeks or more ~estation plus all not statedgestation age.
‘~Hawaiinot available by sex for 1959. Therefore, 1959 does not include Hawaii but includesAlaska. Alaska and Hawaii included beginning 1960. New Jersey excluded from data by color for1962; color not reported.
‘For 1942-44,data not available by color or sex.
NOTE: Fetal deatha with sex not stated distributed proportionately.
Source: Derived from annual volumes Vital Statistics of the United States, National Center forHealth Statistics,Public Health Service, Washington, U.S. Government Printing Office, and specialtabulations.
67
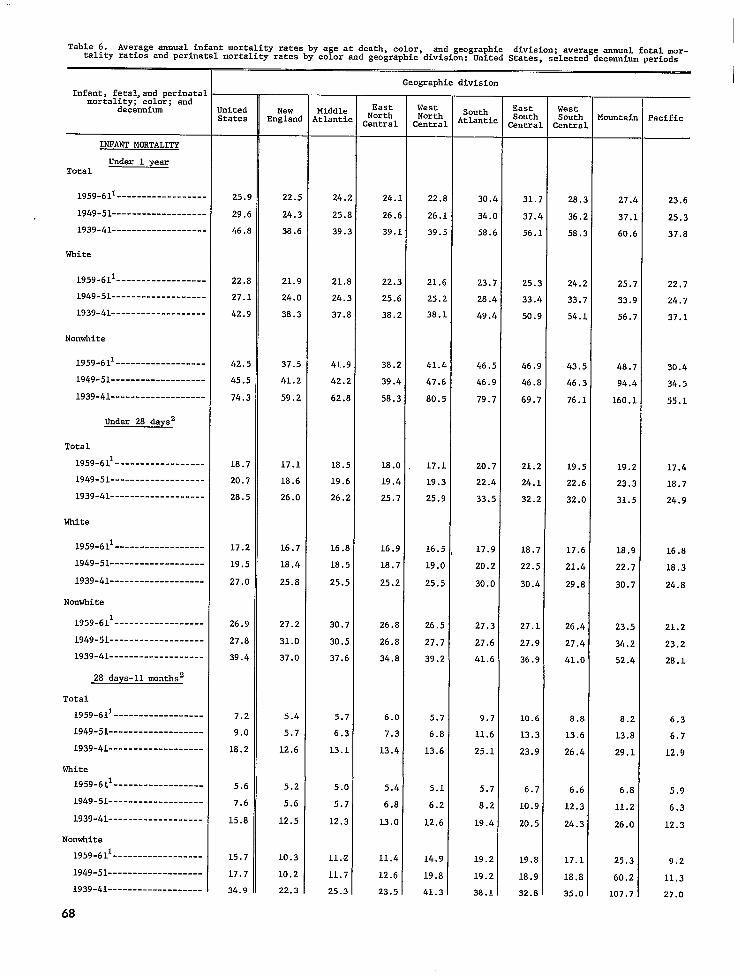
1Table 6. Average annual infant mortality rates by age at death, color, and geographic division; average annual fetal mor
tality ratios and perinatal mortality rates by color and geographic division: United States, selected decennium periods
Geographic division
Infant, feta1,and perinatalmortality; color; and
decennium
INFANT MORTALITY
Under 1 yearTotal
1959-611------------------
1949-51-------------------
1939-41-------------------
White
1959-611------------------
1949-51-------------------
1939-41-------------------
Nonwhite
1959-611------------------
1949-51-------------------
1939-41-------------------
Under 28 daysz
Total
1959-611------------------
1949-51-------------------
1939-41-------------------
White
1959-611------------------
1949-51-------------------
1939-41-------------------
Nonwhite
1959-611------------------
1949-51-------------------
1939-41-------------------
28 days-11 months2
Total
1959-611------------------
1949-51-------------------
1939-41-------------------
White
1559-611------------------
1949-51-------------------
1939-41-------------------
Nonwhite
1959-611------------------
1949-51-------------------
1939-41-------------------
68
Jnited New Middle East West South East West North North South South Mountain ?acificStates England ~tlantic Central Centra1
Atlantic Central Central
25,9 22.5 24.2 24.1 22.8 30.4 31.; 2s.2 27.4 23.6
29.6 24.3 25.8 26.6 26.1 34.0 37.t 36.2 37.1 25.3
46.8 38.6 39.3 39.1 39.5 58.6 56.1 58.? 60.6 37.8
22.8 21.9 21.8 22.3 21.6 23.7 25.: 24.2 25.7 22.7
27.1 24.0 24.3 25.6 25.2 28.4 33.4 33.7 33.9 24.7
$42.9 38.3 37.8 38.2 38.1 49.4 50. 54.1 56.7 37.1
42.5 37.5 41.9 38.2 41.4 46.5 46.9 43.5 48.7 30.4
45.5 41.2 42.2 39.4 47.6 46.9 46.8 46.3 94.4 34.5
74.3 59.2 62.8 58.3 80.5 79.7 69.7 76.1 160.1 55.1
18.7 17.1 18.5 18.0 17.1 20.7 21.2 19.5 19.2 17.4
20.7 18.6 19.6 19.4 19.3 22.4 24.1 22.6 23.3 18.7
28.5 26.0 26.2 25.7 25.9 33.5 32.2 32.0 31.5 24.9
17.2 16.7 16.8 16.9 16.5 L7.9 18.7 17.6 1s.9 16.8
19.5 18.4 18.5 18.7 19.0 20.2 22.5 21.4 22.7 18.3
27.0 25.8 25.5 25.2 25.5 30.0 30.4 29.S 30.7 24.S
26.9 27.2 30.7 26.8 26.5 27.3 27.1 26.4 23.5 21.2
27.8 31.0 30.5 26.8 27.7 27.6 27.9 27.4 34.2 23.2
39.4 37.0 37.6 34.8 39.2 41.6 36.9 41.0 52.4 28.1
7.2 5.4 5.7 6.0 5.7 9.7 10.6 8.S S.2 6.3
9.0 5.7 6.3 7.3 6.8 11.6 13.3 13.6 13.8 6.7
18.2 12.6 13.1 13.4 13.6 25.1 23.9 26.4 29.1 12.9
5.6 5.2 5.0 5.4 5.1 5.7 6.7 6,6 6.S 5.9
7.6 5.6 5.7 6.8 6.2 8.2 10.9 12.3 11.2 6.3
15.8 12.5 12.3 13.0 12.6 19.4 20.5 24.3 26.0 12.3
15.7 10.3 11.2 11.4 L4.9 19.2 19.8 17.1 25.3 9.2
17.7 10.2 11.7 12.6 19.8 19.21 18.9 18.8 60.2 11.3
34.9 22.3 25.3 23.5 41.3 38.1 32.8 35.0 107.7 27.0

------------------
Table 6. Average annua1 infant mortality rates by age at death, color, and geographic division; average amual fetal mor
tality ratios and perinatal mortality rates by color and geographic division:United States,selected decsnnium periods-Con.
Geographic division
Infant, feta1,and perinatalEast Westmortality; color; and East West South South South [ountaindecennium ‘nited New iiddle North North
tates England tlantic entra1 entra1 ,tlantic entra1 entral
FET~ MORTALITY
Tata1
1959-611------------------
1949-51-------------------
white
1959-bll
1949-51-------------------
Nonwhite
1959-611------------------
1949-51-------------------
PERINATAL MORTALITY
Total
1959-611------------------
19/+9-51-------------------
White
1959-611------------------
1949-51-------------------
Nonwhite
1959-611------------------
!.949-51-------------------———
!,IncludeAlaska and Hawaii.
16.1 13.6 319.6 14.4 13.2 19.0 19.8 15.7 13.4 13.0
19.3 16.5 321.0 17.4 16.4 23.3 23.4 20.1 15.s 14.9
14.1 13.4 3L7.4 13.3 12.5 15.0 14.9 13.2 13.2 12.4
17.1 16.4 819.5 16.5 15.7 18.1 18.4 17.1 15.4 14.5
27.0 20.1 335.8 23.2 23.1 28.5 31.5 24.8 16.6 16.9
33.0 23.4 336.9 2S.4 32.6 35.2 35.2 32.0 22.9 20.4
34.3 30.3 437.4 31.9 29.9 3s.9 40.1 34.6 32.2 29.9
39.2 34.6 439.8 36.2 35.2 44.7 46.4 41.9 38.4 33.0
30.9 29.7 433.6 29.8 28.t 32.5 33.0 30.4 31.6 28.9
36.0 34.2 437.3 34.7 34.2 37.7 40.1 37.9 37.5 32.3
52.4 46.4 464.2 48.9 48.5 54.2 56.8 49.9 39,4 37.5
58.9 53.1 465.0 53.7 5s.5 60.7 61.0 57.6 55.8 42.8
~1939-41 age categories are under 1 month and 1-11 months, respectively.By excluding New York City, the following feta1 death ratios result for the Middle Atlantic division:
ml my% 1959-61------------------- 15.8 14.81950-51------------------- 18,7 17.9
‘4By~xc~uding New york City, the following perinatal ~o~tality
~ W*
1959-61------------------- 33.5 31.21950-51------------------- 37.3 35.7
Nonwhite
25.630.0
rate.=, result for the Middle Atlantic division:
Nonwhite
54.959.3
NOTE: Infant mortality rates are per 1 000 live births. Fetal death ratios are all reported fetal deatha of 20 weeka or more gestation (plus not stated)per 1,000 !livebirths. Perinatal mortality rates are reported fetal deaths (ZO weeks or ~ore gestation plus not stated) plus neonatal deaths per 1,000 live births plus fetal deaths.
SOUrCe: Annua1 volumes Vita1 Statistics of the United states, National Center for Health Statistics, public HealthService, Washington, U.S. Government printing oftme; annual vital statistics summary of the New York City Department ofHealth,
69
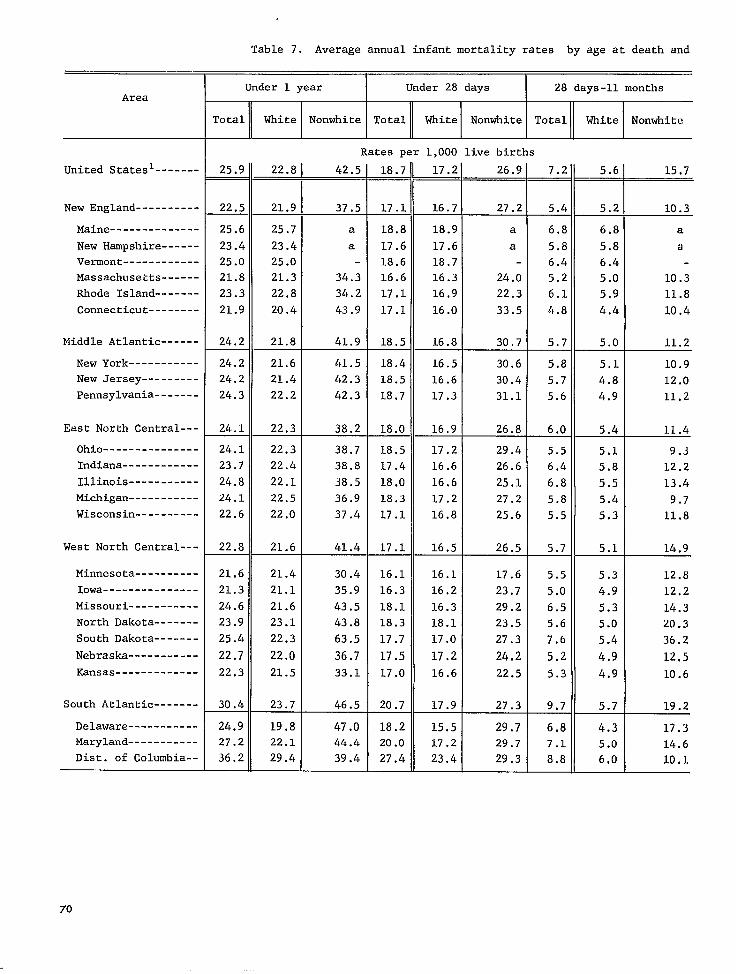
-------
----------
--------------
------
------------
------
-------
--------
------
-----------
---------
-------
---------------
------------
-----------
-----------
----------
----------
---------------
-----------
-------
-------
-----------
-------------
-------
----------------------
Table 7. Average annual infantmortality rates by age at death and
Under 1 year Under 28 days 28 days-n monthsArea
Total White Nonwhite Total White Nonwhite Total White Nonwhite
Rates per 1,000 live births
United Statesl 25.9 22.8 42.5 18.7 17.2! 26.9 7.2 5.6 15.7— — _ —
New England 22.5 21.9 37.5 17.1 16.7 27.2 5.4 5.2 10.3
Maine 25.6 25.7 a 18.8 18.9 a 6.8 6.8 a
New Hampshire 23.4 23.4 a 17.6 17.6 a 5.8 5.8 a
Vermont 25.0 25.0 18.6 18.7 6.4 6.4
Massachusetts 21.8 21.3 34.3 16.6 16.3 24.0 5.2 5.0 10.3
Rhode Island 23.3 22.8 34.2 17.1 16.9 22.3 6.1 5.9 11.8
Connecticut 21.9 20.4 43.9 17.1 16.0 33.5 4.8 4.4 10.4
Middle Atlantic 24.2 21.8 41.9 18.5 16.8 30.7 5.7 5.0 11.2
New York 24.2 21.6 41.5 18.4 16.5 30.6 5.8 5.1 10.9 New Jersey 24.2 21.4 42.3 18.5 16.6 30.4 5.7 4.8 12.0
Pennsylvania 24.3 22.2 42.3 18.7 17.3 31.1 5.6 4.9 11.2
East North Central--- 24.1 22.3 38.2 18.0 16.9 26.8 6.0 5.4 11.4
Ohio 24.1 22.3 38.7 18.5 17.2 29.4 5.5 5.1 9.3 Indiana 23.7 22.4 38.8 17.4 16.6 26.6 6.4 5.8 12.2
Illinois 24.8 22.1 38.5 18.0 16.6 25.1 6.8 5.5 13.4 Michigan 24.1 22.5 36.9 18.3 17.2 27.2 5.8 5.4 9.7 Wisconsin 22.6 22.0 37.4 17.1 16.8 25.6 5.5 5.3 11.8
West North Central--- 22.8 21.6 41.4 17.1 16.5 26.5 5.7 5.1 14.9
Minnesota 21.6 21.4 30.4 16.1 16.1 17.6 5.5 5.3 12.8
Iowa 21.3 21.1 35.9 16.3 16.2 23.7 5.0 4.9 12.2 Missouri 24.6 21.6 43.5 18.1 16.3 29.2 6.5 5.3 14.3 North Dakota 23.9 23.1 43.8 18.3 18.1 23.5 5.6 5.0 20.3
South Dakota 25.4 22.3 63.5 17.7 17.0 27.3 7.6 5.4 36.2
Nebraska 22.7 22.0 36.7 17.5 17.2 24.2 5.2 4,9 12,5
Kansas 22.3 21.5 33.1 17.0 16.6 22.5 5.3 4.9 10.6
South Atlantic 30.4 23.7 46.5 20.7 17.9 27.3 9.7 5.7 19.2
Delaware 24.9 19.8 47.0 18.2 15.5 29.7 6.8 4.3 17,3 Maryland 27.2 22.1 44.4 20.0 17.2 29.7 7.1 5.0 14.6 Dist. of Columbia-- 36.2 29.4 39.4 27.4 23.4 29.3 8.8 6,0 10.1
70
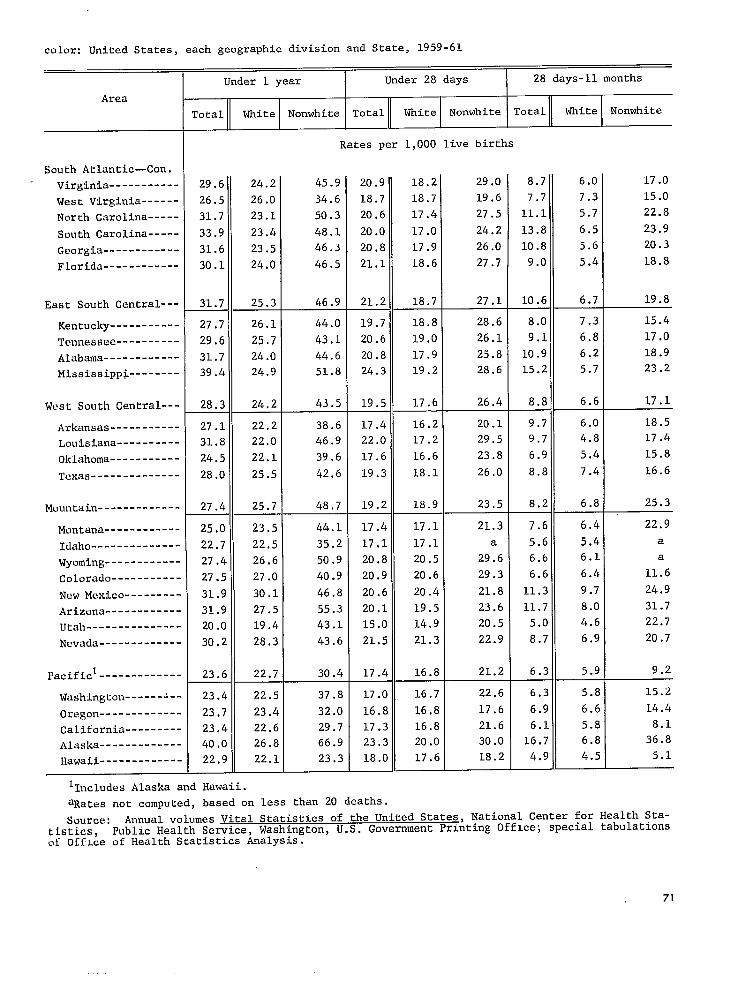
-----------
------
-----
-----
------------
------------
----------
------------
--------
-----------
----------
-------------
------------
------------
-----------
---------
------------
---------------
-------------
---------
-------------
---------
-------------
-------------
color: United States, each geographic division and State, 1959-61
Under 1 year Under 28 days 28 days-n months
Area
Total White Nonwhite Total White Nonwhite Total White Nonwhite
Rates per 1,000 live births
Soubh Atlantic—Con.
Virginia 29.6 24.2 45.9 20.9 18.2 29.0 8.7 6.0 17.0
West Virginia 26.5 26.0 34.6 18.7 18.7 19.6 7.7 7.3 15.0
North Carolina 31.7 23.1 50.3 20.6 17.4 27.5 11.1 5.7 22.8
South Carolina 33.9 23.4 48.1 20.0 17.0 24.2 13.8 6.5 23.9
Georgia 31.6 23.5 46.3 20.8 17.9 26.0 10.8 5.6 20.3
Florida 30.1 24.0 46.5 21.1 18.6 27.7 9.0 5.4 18.8
East South Central--- 31.7 25.3 46.9 21.2 18.7 27.1 10.6 6.7 19.8
Kentucky----------- 27.7 26.1 44.0 19.7 18.8 28.6 8.0 7.3 15.4
Tennessee 29,6 25.7 43.1 20,6 19.0 26.1 9.1 6.8 17.0
Alabama 31.7 24.0 44.6 20.8 17.9 25.8 10.9 6.2 18.9
Mississippi 39.4 24.9 51.8 24.3 19.2 28.6 15.2 .5.7 23.2
West South Central--- 28.3 24.2 43.5 19.5 17.6 26.4 8.E 6.6 17.1
Arkansas 27.1 22.2 38.6 17.4 16.2 20.1 9.7 6.0 18.5
Louisiana 31.8 22,0 46.9 22.C 17.2 29.5 9.7 4.8 17.4
Oklahoma----------- 24.5 22.1 39.6 17.6 16.6 23.8 6.5 5.4 15.8
Texas-------------- 28.0 25.5 42.6 19.: 18.1 26.0 8.[ 7.4 16.6
Mountain 27.4 25.7 48.7 19.2 18.9 23,5 8.2 6.8 25.3
Montana 25.0 23.5 44.1 17.4 17.1 21.3 7.6 6.4 22.9
Idaho-------------- 22.7 22.5 35.2 17.1 17.1 a 5.6 5.4 a
Wyoming 27.4 26.6 50.9 20,8 20.5 29.6 6.6 6.1 a
Colorado 27.5 27.0 40.9 20.9 20.6 29.3 6.6 6.4 11.6
New Mexico 31.9 30.1 46.8 20.6 20.4 21.8 11.3 9.7 24.9
Arizona 31.9 27.5 55.3 20.1 19.5 23.6 11.7 8.0 31.7
Utah 20.0 19.4 43.1 15.0 14.9 20.5 5.0 4.6 22.7
Nevada 30.2 28.3 43.6 21.5 21.3 22.9 8.7 6.9 20.7
PacificI------------- 23.6 22.7 30.4 17.4 16.8 21.2 6.3 5.9 9.2
Washington 23.4 22.5 37.8 17.0 16.7 22.6 6.3 5.8 15.2
Oregon 23.7 23.4 32.0 16.8 16.8 17.6 6.9 6.6 14.4
California 23.4 22.6 29.7 17.3 16.8 21.6 6.1 5.8 8.1
Alaska 40.0 26,8 66.9 23.3 20.0 30.0 16.7 6.8 36.8
Hawaii 22.9 22.1 23.3 18.0 17.6 18.2 4.9 4.5 5.1
l~ncludes Alaska and Hawaii.
aRates not computed, based on less than 20 deaths.
Source: Annual volumes Vital Statistics of the United States, National Center for Health Statistics, Public Health Service, Washington, U.S. Government Printing OffIce; special tabulationsof OffLce of Health Statistics Analysis.
71

--------------
-------------------
--------------------------------
-------------------
------------------
--------------------
--------------------------------
-------------------
-------------------
Table 8. Average annual infant mortality rates by age at death and color: United Statea, metro-
Total
Area
United States
Metropolitan countiealNonmetropolitan countiesl
Cities by sizez
1,000,000 or more 250,000-1,000,000 100,000-250,000------------------
Individual cities by size31.000,000 or more
New York, N.Y.4------------------Chicago, 111.4-------------------Loa Angeles, Calif.4-------------Philadelphia, Pa.4---------------Detroit, Mich.4------------------
500,000-1,000,000
Baltimore, Md.4------------------Houston, Tex.4-------------------Cleveland, 0hio4-----------------Washington, D.c.4----------------st. LOUiS, MO.4------------------Milwaukee, Wia.4-----------------San Franciaco, Calif.4-----------Boston, Mass.4Dallas, Tex.4--------------------New Orleans, La------------------Pittsburgh, Pa-------------------San Antonio, Tex.4---------------San Diego, Calif.4---------------Seattle, Wash.4Buffalo, N.Y.4-------------------Cincinnati, 0hio4----------------
250,000-500,000
Memphis, TermDenver, Col----------------------Atlanta, Ga----------------------Minneapolis, MienIndianapolia,Mr$
%Zu::ziio-:.::::::::::::::::Phoenix, Aria--------------------Newark, N.J----------------------Louisville, KyPortland, Oreg-------------------Oakland, Calif-------------------Fort Worth, Tax------------------Long Beach, Calif----------------Birmingham, Ala------------------Oklahoma City, Okla--------------Rochester, N.Y-------------------Toledo, Ohio---------------------St. Paul, MienNorfolk, Va----------------------Omaha, Near----------------------Honolulu, Hawaii8----------------Miami, Fla-----------------------Akron, Ohio----------------------El Paso, Tax---------------------Jersey City, N.J-----------------Tampa, Fla-----------------------Dayton, Ohio---------------------Tulsa, Okra----------------------Witchita, Kens-------------------
Under 1 year I Under 28 days 28 days-11 months
1960-61 1950-51 1960-61 1950-51 1960-61 1950-51
Rates per 1,000 live birtha
25.7 20.3 7.1 8.6
24.7 26.> 18.4 19.6 6.227.5 32.: 18.8 21.2 8.7 1!::
27.1 26.( 20.1 19.9 6.127.9 27.1 20.9 21.1 6.326.5 27.! 19.8 20.7 6.8
29.4
26.0 24.< 19.2 6.5 28.4 25.1 18.9 8.6 24.1 24.t 20.1 5.8 30.7 31.1 23.526.< 20.2 z:?
32.6::2 6.08.68.3
:::6.06.58.75.8
:::6.55.95.9
22.7 21.7
24.1 22.8 R
24.3 23.7 9.7 18.9 20.1 5.7 20.4 18.9 7.4 18.8 24.2 18.4 18.6 ;:$ 19.1 31.2 25.9 24.5 1;:: 21.8 23.4 6.1 18.3 16.7 6.6 20.3 19.2 6.6 18.8 25,0 8.6 19.0 18.5 6.6 21.4 23.5 8.2 20.0 1.9.4 6.2 18.0 21.5 4.9 17.9 19.6 18.0 18.1 ;:; 23.3 26.2 20.3 21.5 U 17.8 4.0 21.7 ;:.: 6.6 19.5 5.4 18.9 23:5 6.1 21.4 21.6 7.5 25.6 25.6 22.9 23.1 2:? 19.5 22,1 6.4 19.1 21.0 6.5
72

---
---
---
---
---
---
---
---
--
--
DO1itan and nonmetropolitan counties, and cities over 250,000 population, 1950-51 and 1960-61.
Nhite Nonwhite
Under 1 year Under 28 days 28 days-11 months Under 1 year I Under 28 days 28 days-11 months
1960-61 1950-51 1960-61 1950-51 1960-61 1950-51 960-61 1950-51 I1960-61 1950-51 1960-61 1950-51 1
Rstes per 1,000 live births Rates per 1,000 live births
22.7 26.3 17.1 19.1 5.6 7.2 42.0 44.6 26.5 27.4 15.4 17.2— — —
22.0 24,2 16.9 18.4 5.8 38.6 40.0 26.8 27.8 11.8 12.223.8 29.1 17.5 20.1 ::: 8.9 48.4 49.6 26.1 27.1 22.3 22.5
22.5 23.3 17.0 18.0 5.5 5.3 38.4 38.3 27.7 28.6 10.724.2 25.2 18.6 19.8 5.6 5.4 37.7 37.4 26.9 27.1 10.7 1;:223.3 25.5 18.0 19.7 5.3 5.8 39.8 43.7 27.5 30.2 12.3 13.5
21.5 22.4 16.2 17.2 5.2 41.3 39.1 30.5 30.4 10.8 ;.; 23.1 23.0 16.9 17.4 ::; 37.9 34.8 25.2 25.0 12.7 ;;.; :;.; ~ 16.9
19.5’ 18.9 20.1
5.2 5.3
;:: 29.9 41.2
34.9 46.9
22.4 30.3
27.6 33.4 1:::
7:3 13.5
24:7 24:9 19.3’ 18.8 5.5 6:1 37.0 34.6 28.1 25.8 8.8 8.9
22.9 25.6 17.8 21.2 5.1 ::: 36.9 38.5 21.6 31.1 15.2 24.8 23.1 19.5 17.9 5.3 38.0 34.9 30.6 25.6 ;:: 28.3 30.5 22.4 26.0 5.9 ::: 39.4 30.3 29.5 22.6 ;:$ 7.7 24.5 21.2 18.6 16.2 5.0 43.9 40.9 31.8 29.3 12.0 23.2 24.9 18.4 19.8 H 34.0 33.2 25.2 22.9 8.9 5:$: 22.8 21.2 17.0 17.1 5.8 ::: 26.3 24.1 19.6 17.9 6.7 56.2 22.5 24.4 17.2 19.7 5.3 4.7 35.4 34.7 25.5 25.6 57.4 23.9 24.0 19.4 18.9 4.4 5.0 36.9 44.8 25.3 35.4 1?:: 59.3 23.4 26.2
27.0 24.1
19.0 21.7
21.6 20.6
4.5 4.5
5.3 3.5
41.9 39.2
34.5 43.6
28.7 29.0
25.7 36.3
13.2 10.2
58.8 57.3
29.6 38.2 20.3 22.1 9.2 16.1 39.5 34.2 29.1 10.4 57.3 24.3 28.0 18.4 20.6 35.2 44.9 25.5 5%:; 9.7 518.0 23.0 24.0 16.8 18.9 ::; H 27.9 42.6 19.7 31.4 8.2 511.2
25,3 23.8 19.3’ 18.1 6.0 40.3 33.8 29.6 523.1 10.8 510.8
23.3 25.5 18.1 20.5 5.2 5.0 35.8 26.5 27.5 15.1 ;.; 1:.:20.3 23,9 15.0 16.8 5.3 7.0 35.7 38.3 28.1 28.7
23.7 26.0 29.2 24.2
;8.8
;3.9 -..
19.6 20.8 22.8 18.7
22.3 8---19.5 6---
4.1 5.1 6.4 5.5
6.5 6---4.3 6---
37.4 38.3 39.0 31.2
39.4 6---42.7
26.1 29.7 25.8 23.0
26.4 6---30.2 6---
11.3
$!
.11.1
12.5
24.3 25.3 1.7.8 18.0 6.5 7.3 38.5 :Gl 28.2 24.1 10:2 E; 22.4 28.3 16.3 23.4 6.1 37.4 44.9 26.3 29.0 11.1 15.9 22.1 26.0
~3.8 ,---
17.2 18.7
18.1 6---
5.0 e::: 33.5 36.7
:4.: 23.7 23.7
21.8 6--- 1;::
512.9 6---
21,9 25.0 18.8 19.5 ;:: 5.5 46.7 4;:5 32.8 38.7 13.9 9.8 25.2 29.3 20.2 23.4 5.8 37.1 27.2 22.9 12.6 24.5 L9.4 18,4 16.1 :;? 29.0 %:; 18.1 528.8 51::: 54.8 22.4 21.9 17.6 17.7 4.8 ::: 34.2 33.9 24.6 24.9 9.6 59.0 21.8 25.0 23,4 22.9 21.6
~8,5 ..-
26.1 ~4.5
16.1 18.8 18.6 17.9 17.8
~2.9
21.1 ;8.5
::; 4.8 4.9
5.6 6---5.0 5.9 6---
48.4 31.1 36.6 41.3 30.0
::::
37.2 :2.7
29.0 21.0 24.5 29.4 18.9
::::
26.2 26.1 6---
M:? :;.;
11:1
51”.1 6---11.0 56.5 6---
22,0II
24.3 8---
16.6 0---
17.9 6---
::: 6--- 6!:2
& $~:: 24.4 6---
35.0 6---
56.9 6---
510.0 6---
23.7 25.1 18.4 20.0 5.3 55.1 49.2 52.0 35.0 ;;.; 24.5 25.0 19.8 21.2 3.9 30.8 36.4 24.1 5;;:: %:;21.9 18.5 Ai 21.9 17.623.9 22,1 19,8 19.0 53.1 34.7 38.7 24.6 32.5 1::;
6--- 6--- 6--- 6--- 6--- 6---
25.3 22,3 19.1 18.C 40.1 60.6 28.6 49.6 11.5 5!iG 26.5 27.3 21.7 24.1 ::: 5::2 53.8 :;.: 38.3 31.9 15.5 %1.1 24.6 27.7 19.2 22.8 5.5 4.8 42.0 32.3 24.8 512.8 23,3 25.0
;5,4 18.4 19.7
;:.2 -.
4.9 5.4 6?;!
40.7 30.0
:5:: 25.9 15.6
:6:6 1::; 14.4
523.8 6---
~::g 22.8 17.8 19.4 e!:: 3.4 @ 48.6 :::! :::? 11.9 %::
See fOOtnOtes on next psge.
73

Footnotes for table 8.
lCounties are classified by their Standard Metropolitan Area status as of the particular decennial census period for which the rates have been computed. The division between metropolitanand nonmetropolitan counties is based on the “Standard Metropolitan Area” definition establishedby the Federal Committee on Standard Metropolitan Areas (SMA). In 1950-51, except in New England,an SMA was a county or group of counties which contained at least one city of 50,000 inhabitantsor more. Contiguous counties were included in the SMA if they met certain criteria of metropolitan character and social and economic interzration.[In New En!zlandasDecial definition wasaDvlied.)In 1960-61 the definition changed mainl~ in that’under ce;tain circumstances an area co;tainin~two contiguous cities with a combined population of at least 50,000 qualified the area as an SNA.
‘Cities are classified by their size as of the particular decennial census period for whichthe rates have been computed.
31ndividual cicies classified bysize according to 1960 census. Data in 1950-51 column refer to1950 only.
4Number of nonwhite inhabitants increased by at least one-third between 1950 and 1960. (Onlythose cities with a population of 500,000 or more are so identified.)
5Rate based on less than 20 deaths.6Data not available by color.7Based on 1960 data only.8For 1950, data not available for Honolulu by place of residence.
Sources: Annual volumes V~ National Center for Health Statistics, Public Health Service, Washington, U.S. Government Printing Office; 1960 Census of Population, Bureau of the Census, U.S. Department of Commerce.
74

------------------------------------
------------------
--------------------
-----------------------------
-------------------------------------------------
------------------------------------
--------------------
-------------------------------------------------
Table 9. Average annual infantmortality rates for selectedcauses of death, by age at death,sex, and color: United States, 1959-61
Cause of death(7’chRevision—InternationalClassificationof Diseases)
Rates per 10,000 live births ofMale specifiedsex
All causes 291.0 212.2 115.7 74.2 78.8
Infectiveand parasiticdiseases-----------(OOl-l38) 3.8 0.6 0.0 0.1 0.4 3.2 Influenzaand pneumonia,including pneumoniaof newborn (480-493,763) 34.6 9.9 1.2 4.0 4.7 24.7 All other diseasesof respiratory system-----------------------i---(470-475,500-527) 7.1 0.8 0.2 0.3 0.4 6.3
Gastritisand duodenitis,etc. ----(543,571,572,764) 7.5 1.2 0.0 0.1 1.1 6.3All other diseasesof digestivesystem (530-542,544-570,573-587) 0.9 0.7
Congenitalmalformations-------------------(75O-759) 2;:; 9.8 1;:: 6.0 1;:; Birth injuries (760,761) 28.1 28.0 18.4 8.9 0.7 0.1 Intracranialand spinal injury at birth------(76O) 3.8 0.5 0.0Other birth injury---------------------------(76l)1;:; 1::; 14.7 ::: 0.2 0.1
Postnatalasphyxiaand atelectasis-------------(762) 53.0 52.2 31.6 19.4 0.7 Hemol.yticdiseaseof newborn-------------------(77O) 5.2 3.1 ::: 0.1 Immaturityunqualified-------------------------(776)50.0 42:; 35.0 1::: 1.6 0.3 Neonatal disordersarising from certain diseasesof mother during pregnancy,
,771-774) 32.0 29.1 13.6 12.9etclL-----------------------------(765-769 Symptomsand ill-definedconditions----(7793,795)95) 2.6 1.0 ::; H Accidents (E800-E962) $:; 1.5 ::! 0.6 0.8 8.1 Residual (140-468,590-749,E963-E985) 10.3 2.9 0.8 1.0 1.1 7.4
Certain diseasesof early infancy----------(76O-776)179.2 “175.1 102.8 60.1 L2.2 4.0
Female
All causes 225.4 160.8 89.7 53.0 ‘,8.0 64.6
Infectiveand parasiticdiseases-----------(OOl-l38) 3.0 0.4 0.0 0.1 0.3 2.6 Influenzaand pneumonia,including pneumoniaof newborn------------------(48O-493,763)27.3 7.3 0.9 2.8 3.6 20.0 All other diseasesof respiratory
(470-475,500-527) 5.2 0.6 0.2 0.2 0.3 4.6 Gastritisand duodenitis,etc. ----(543,571,572,764) 6.3 1.0 0.0 0.1 0.9 5.3 All other diseasesof digestive system (530-542,544-570,573-587) 0.8 0.8 ;.; 1.1
Congenitalmalformations-------------------(75O-759) 2;:; 9.2 7.4 12.0 19.6 19.5 1;.; 5.8 0:5 0.0
Other birth injury---------------------------(76U 14.0 13.9 10:9 2.9 0.1 0.0 Postnatalasphyxiaand atelectasis-------------(762) 38.0 3;.$ 23.0 13.3 0.6 Hemolyticdisease of newborn-------------------(77O) 4.9 ;:: 0.0 Immaturityunqualified-------------------------(776)40.5 40:2 2;:: J:: . 0.3
)’ Neonatal disordersarising from certain diseasesof mother during pregnancy,etc;~-----------------------------(765-769,77l-774)
system-----------------------i----
Birth injuries-----------------------------(76O,76l)Intracranialand spinal injury at birth------(76O) 5.6 5.6 2.9 0.4 0.0
22.9 20.6 Symptomsand ill-definedconditions----(7793,795)95) 5.2 2.1 %; ::; ::; ::: Accidents (E800-E962 7.9 1.3 0.2 0.4 0.8 6.6Residual (140-468,590-749,E963-E985 8.0 2.1 0.6 0.7 0.8 5.91
I Certain diseasesof early infancy----------(76O-776)134.0 130.8 77.9 43.0 9.9 3.2
75

--------------------------------
-------------------------------------------------
Table 9. Average annual infant mortality rates for selected causes of death, by age at death, sex, and color:-United States, 1959-61—Con.
Cause of death(7th Revision—InternationalClassification of Diseases)
White
All causes------------------------------------
Infective and parasitic diseases-----------(OOl-l38)Influenza and pneumonia, includingpneumonia of newborn------------------(48O-493,763)
All other diseases of respiratorysystem---------------------------- (470-475,500-527)
Gastritis and duodenitis, etc.l----(543,571,572,764)All other diseases of digestivesystem-------------------- (530-542,544-570,573-587)
Congenital malformations-------------------(75O-759)Birth injuries-----------------------------(76O,76l)
Intracranial and spinal injury at birth------(76O)Other birth injury---------------------------(76l)
Postnatal asphyxia and atelectasis-------------(762)Hemolytic disease of newborn-------------------(77O)Immaturity unqualified-------------------------(776)Neonatal disorders arising from certain diseasesof mother during pregnancy, etc.~-(765-769,771-774)
Symptoms and ill-defined conditions----(7793,795)95)Accidents (E800-E962)Residual----------------- (140-468,590-749,E963-E985)
Certain diseases of early inTancy----------(76O-776)
Nonwhite
All causes------------------------------------
Infective and parasitic diseases-----------(OOl-l38)Influenza and pneumonia, includingpneumonia of newborn------------------(48O-493,763)
All other diseases of respiratorysystem---------------------------- (470-475,500-527)
Gastritis and duodenitis, etc.l----(543,571,572,764)All other diseases of digestivesystem--------------------(530-542,544-570,573-587)
Congenital malformations-------------------(75O-759)Birth injuries-----------------------------(76O,76l)
Intracranial and spinal injury at birth------(76O)Other birth injury---------------------------(76l)
Postnatal asphyxia and atelectasis-------------(762)Hemolytic disease of newborn-------------------(77O)Immaturity unqualified-------------------------(776)Neonatal disorders arising from certain diseasesof mother during pregnancy, etc.2-(765-769,771-774]
Symptoms and ill-defined conditions----(7793,795]95]Accidents (E800-E962)Residual (140-468,590-749,E963-E985)
Certain diseases of early infancy----------(76O-776)
I IUnder Under Under
1-6 7-27 28 days. 28 1 11yeir days day days days
months
Rates Der 10.000 live births ins~ecifi;d color group
228.5 172.2 95.6 60.0 16.6 56.3
2.6 0.3 0.0 0.1 0.2 2.3
22.9 6.6 0.8 2.8 3.0 16.3
0.2 0.2 4.6 ::; M 0.0 0.1 ::; 3.4
0.9 0.6 3;:; 2;:; 1::? 1::; 23.4 23.3 15.7 ;:; 2:; 0.0
0.0 1::; 1::; 1::; 3:4 ::: 42.2 41.6 24.9 15.8 :::
;:: 0.0 3;:: 32:; 2;:! 1::: 1.1 0.2
24.0 22.6 10.6 10.2 1.4 2.8 1.1 0.5 0.4 ;:! 1.6 7.3 1.1 0.1 :.: 0.6 8.1 2.3 0.7 . 0.8 ::;
141.7 139.5 83.2 48.2 8.1 2.2
425.3 268.6 143.3 85.3 40.1 156.7
7.9 1.5 0.1 0.3 1.1 6.4
75.3 19.2 2.2 6.5 10.4 56.1
11.3 0.6 10.1 23.0 i:; ::; ::: 3.6 19.1
0.4 0.8 3;:: 1::; 6.4 ;:: 4.6 1;:2 26.9 26.8 16.9 8.9 ;.: 11.2 11.2 5.6 M 15.7 15.6 1::: 3.4 ;.: 0:1 64,8 63.5 4;.; 20.0
0:3 ~:; 7$:: 7::: 51:6 2;:: 4.3 .
46.7 38.0 18.2 14.0 5.8 22.2 9.2 3.8 3.2 2.2 1!?:! 17.0 0.4 1.1 14.0 15.0 ;:: 1.0 1.1 ::2 11.4
241.1 230.0 130.9 71.5 27.5 11.2
‘Includes gastritis and duodenitis., gastroenteritis and colitis,except ulcerative, age 4 weeksand older; chronic enteritis and ulcerative colitis; diarrhea of newborn.
21ncludes neonatal disorders arising from certain diseasesof the mother during pregnancy; ill-defined diseases peculiarto early infancy; immaturity with mention of other subsidiary condition;and other diseases peculiar to early infancy not already shown. Ill-defined diseases peculiar toearly infancy accounted for 62 percent of these deaths.
Source: Special tabulations of the National Vital Statistics Division, National Center forHealth Statistics, Public Health Service, U.S. Department of Health, Education, and Welfare.
76
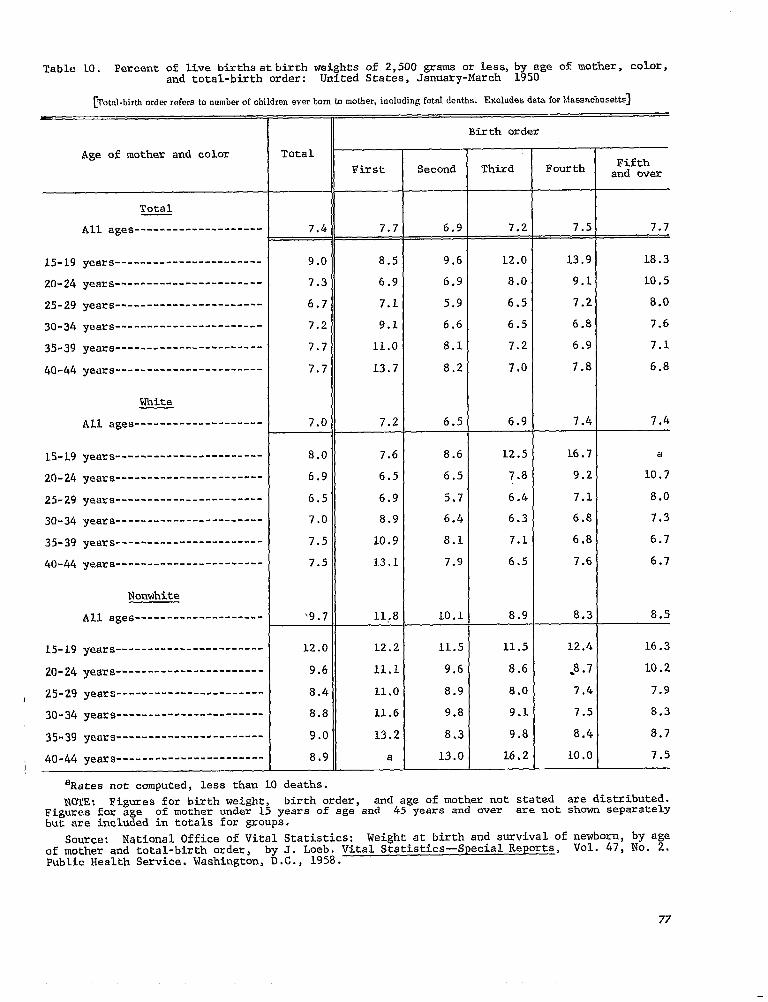
--------------------
-----------------------
-----------------------
-----------------------
-----------------------
-----------------------
-----------------------
--------------------
-----------------------
-----------------------
-----------------------
-----------------------
-----------------------
-----------------------
--------------------
-----------------------
-----------------------
-----------------------
-----------------------
-----------------------
Table LO. Percentof live birthsatbirth weigh~s of 2,500 grams or less,by age of mother, color,and total-birthorder: United States, January-March 1950
[Total-birth order refers to number of children ever born h nmtber, including fetal deaths. Excludes data for !dassaclmsetts]
Birth order
Age of mother and color Total
First Second Third Fourth Fifthand over
Total
I All ages 7.4 7.7 6.9 7.2 7.5 7.7
15-19 years 9.0 8.5 9.6 12.0 13.9 18.3
20-24 years 7.3 6.9 6.9 8.0 9.1 10.5
25-29 years 6.7 7.1 5.9 6.5 7.2 8.0
30-34 years 7.2 9.1 6.6 6.5 6.8 7.6
35-39 years 7.7 11.0 8.1 7.2 6.9 7.1
40-44 years 7.7 13.7 8.2 7.0 7.8 6.8
White
All ages 7.0 7.2 6.5 6.9 7.4 7.4
15-19 years 8.0 7.6 8.6 12.5 16.7 a
20-24 years 6.9 6.5 6.5 7.8 9.2 10.7
25-29 years 6.5 6.9 5.7 6.4 7.1 8.0
30-34 years 7.0 8.9 6.4 6.3 6.8 7.3
35-39 years 7.5 10.9 8.1 7.1 6.8 6.7
40-44 yeara 7.5 13.1 7.9 6.5 7.6 6.7
Nonwhite
All ages ‘9.7 11,8 10,1 8.9 8.3 8.5
L.5-L9yeara 12.0 12.2 11.5 11.5 12.4 16.3
20-24 years 9.6 11.1 9.6 8.6 .8.7 L.O.2
I 25-29 years 8.4 11.0 8.9 8.0 7.4 7.9
30-34 years 8.8 11.6 9.8 9.1 7.5 8.3
35-39 years 9.0 13.2 8.3 9.8 8.4 8.7
40-44 years----=------------------ 8.9 a 13.0 16.2 10.0 7.5 I
aRates not computed,less than 10 deaths.
NOTE; Figures for birth weight, birth order, and age of mother not stated are distributed.Figures for age of mother under 15 years of age and 45 years and over are not shown separatelybut are includedin totals for groups.
Source: National Office of Vital Statistics: Weight at birth and survivalof newborn, by ageof mother and total-birthorder, by J. Loeb. Vital Statistics—SpecialReports, VO1. 47, No. 2.PublicHealth Service.Washington,D.C., 1958.
77

--------------------------
--------------------------------
--------------------------------
-------------------------------
--------------------------
--------------------------------
--------------------------------
-------------------------------
--------------------------
--------------------------------
--------------------------------
-------------------------------
Table 11. Neonatal mortality rates by total-birth ordeq color, and age of mother: IJnitedStates,January-March 1950
[Based IX deaths under 28 days anmng children bmn Jautimy 1 to March 31,1950. ‘1’ottd-birth order refers to number of children over born tI, mother, including fetal deaths. Excludes data for Massacbusettsl
II Age of mother
Birth order and color All ages
Total
Total
First
Second-------------------------------
Third
Fourth
Fifth and over-----------------------
Total
First
Second-------------------------------
Third
Fourth
Fifth and over-----------------------
Nonwhite
Total
First
Second-------------------------------
Third
Fourth
Fifth and over----------------------
‘Rates not computed, less than 10 deaths.
15-19 20-24 25-29 30-34 years years years yeara
II I I 1 EEl__5 Rates per 1,000 live births in specified group
20.C 23.8 19.0 17.6 20.0 23.6 27.2 —-—.
19.1 21.2 16.6 17.3 24.1 28.7 30.9
17.8 28.1 18.2 14.3 16,1 20.3 25.3
19.7 35.3 22.0 17.7 16.9 19.8 26 .:+
21.1 45.2 24.9 19.6 18.8 21.5 23.6
26.9 68.8 35.8 25.5 25.5 26.1 28.1)
18.9 22.3 18.0 16.7 18,9 22.6 26. I. —.
17.8 19.8 15.5 16.4 22.3 28.1 29, [I
16.9 27.2 17.5 14.0 15.2 20.2 26.:1
19.3 41.4 22.5 17.1 16.8 19.9 25. !I
20.: 49.0 25.9 18.8 18.5 20.1 22.1.
26.0 a 37.5 25.9 24.4 24.9 26.!i
26.7 28,3 24.8 24.6 28.7 29.9 35.[1—-
28.9 26.6 27.7 31.8 49.2 37.2 a
25.4 29.9 23.5 20.3 32.6 22.5 a
22.3 28.6 20.5 23.9 18.7 19.0 a’
25.0 43.2 22.9 23.6 21.7 38.3 a.
29.1 a 34.3 24.9 28.7 30.3 34.!
‘1 NOTE : Figures for birth order and ageof mother not stated are distributed. Figures for age of
mother under 15 years of age and 45 years and over are not shown separately but are included ir totals for groups.
Source: National Office of Vital Statistics: Weight at birth and survival of newborn, by age of mother and total-birth order, by J. Loeb. Vital Statistics—Special Reports, Vol. 47, No. 2. Public Health Service. Washington, D.C., 1958.
78

-------------------------
-------------------------------
------------------------------
-------------------------------
------------------------------
-------------------------------
----------------------
-------------------------
-------------------------------
------------------------------
-------------------------------
------------------------------
-------------------------------
----------------------
-------------------------
-------------------------------
------------------------------
-------------------------------
------------------------------
-------------------------------
----------------------
Table 12. Average fetal death rates by age o;9~tl&, color,and total-birthorder: United States,
fetal for[Imdudwonly deaths which the period of gestation was giwm =S W weeks (or 5 months) or more cmwas not stated. Total-birth order refers to number of children ever born @mother, includirrg fetal deaths]
Age of mother
Color and birth order All agesl
Total
Total
First
Second
Third
Fourth
Fifth
Sixth and over
White
Total
First
Second
Third
Fourth
Fifth
Sixth and over
Nonwhite
Total
First
Second
Third
Fourth
Fifth
Sixth and over
15-19 20-24 25-29 30-34 35-39 40-44yeara years years years years years
Rates per 1,000 live births and fetal deathsin specifiedgroup
15.8 13.7 11.9 14.2 19.0 26.8 38.5
15.5 13.8 13.0 17.8 30.0 46.6 60.2
11.2 12.2 9.4 10.7 14.6 21.0 32.2
13.2 16.3 11.3 11.5 14.5 21.4 32.2
16.0 23.1 14.4 13.9 15.8 21.9 31.0
19.1 47.3 17.3 16.2 18.7 23.8 33.0
28.8 72.7 23.3 22.4 25.2 31.6 43.4
13.9 11.7 10.6 12.6 16.6 23.4 34.3
13.8 12.1 11.8 16.3 26.9 41.8 56.2
10.1 10.0 8.5 9.9 13.3 19.2 29.7
12.1 12.7 10.2 10.6 13.4 19.7 30.3
14.7 17.4 12.6 12.7 14.6 20.3 29.4
1.7.5 30.4 15.1 14.6 16.7 22.0 30.7
24.0 41.2 20.3 19.0 21.0 26.3 37.5
26.2 20.9 19.7 24.1 33.1 45.5 61.7
26.5 21.2 25.1 32.4 57.6 88.4 96.7
19,0 18.3 16.4 19.5 27.9 39.3 63.3
20.5 22,1 16.3 20.6 27.5 41.6 54;6
23.3 28.7 19.5 21.7 27.9 39.0 50.0
26.1 60.1 21.0 22.0 31.5 38.4 57.4
36.5 101.0 26.2 27.7 34.4 46.4 62.4
lInclu&s data for age groupa under 15 yeara and 45 Years and over.
NOTE: Data for Massachusettsare included only in the totals by age of mother because thisState did not require the reportingofbirth order.Figures for birth order not stated (for Statesother than Massachusetts)and for age of mother not stated are distributed.
Source: Annual volumes Vital Statistic of the United States,National Center for Health Statistics,Public Health Service,Washington,U.S. GovernmentPrintingOffice.
79

-----------------------------------
-----------------------------------------
-------- ---------------- --------
----------------------------------- -------------
-------------------------------------------------------
---------------------------------------------------------
-------------------------------------------------------
-------------------------------------
-------------------------------------------------
----------------------------------------------------
---------------------------------------------------
---------------------------------------------- ---
APPENDIX TABLES
Table I. Percent distributionof the population,by educational attainmentand family income:United States, 1940, 1950, 1960
Educationalattainmentand family income 1960 I 1950 I 1940 I I
Years of school completed Percent distribution
Persons 25 years and over 100.0
No school years completed
Elementary school:
6 years or less ------.- ---.---- -
7-8 years .------
High School:
1-3 years
4 years
College:
1-3 years
4 years or more-------------------------------------------------
Median school years completed
Family income
0.9
8.1
17.0
21.9
32.6
10.1
9.4
11.7
All incomes 100.0
$2,000 or less 13.1
$2,OOO-$3,999----------------------------------------------------- 17.8
$4,ooo-$5,999-----------------------------------------------------23.3
$6,OOO-$6,999----------------------------------------------------- 10.7
$7,ooo-$9,999-----------------------------------------------------20.1
$10,000 or more 15.0
Median family income $5,657
100.0 100.0
1.1 2,2
12.6 L7.4
23.5 32.9
20.6 18.3
26.2 17.3
8.7 6.5
7.3 5.4
10.5 8.4
100.0 11OO.O
29.3 49.9
38.6 33.1
19.9I
4,3 , 14.7
4.9 1
3.1 2.3
$3,083
lBasedon 1942 study by Office of Price Administration, which based its estimateson income ofall civilianconsumersexcept those in institutions.
NOTE: All data are for conterminousUnited States.
Source:Decennial census reports of Bureau of Census,U.S. Departmentof Commerce.
80

I
Table II. Estimated rattos of illegitimate live births, by color and illegitimacy rates: UnitedStates, 1940, 1945, and 1950-62
Year
L962;'4-------------------------------------------------
.--------------.------------------------------.---.1961’]
.---.-------------1960’] --.------------------------------.
19593------------------.------------------.------------
l958---------------------------------------------------
l957---------------------------------------------------
l956---------------------------------------------------
l955---------------------------------------------------
l954---------------------------------------------------
L953---------------------------------------------------
l952---------------------------------------------------
1951---------------------------------------------------
1950---------------------------------------------------
l945------------------------------------------Y--------
1940---------------------------------------------------
‘Per 1 000 total live births in specified group.
Ratiol
.ate2Total White Nonwhite
58.8 27.5 229.9 21.5
56.3 25.3 223.4 22.6
52.7 22.9 215.8 21.8
52.0 22.1 218.0 22.1
49.6 20.9 212.3 21.0
47.4 19.6 206.7 20.9
46.5 19.0 204.0 20.2
45.3 18.6 202.4 19.3
44.0 18.2 198.5 18.3
41.2 16.9 191.1 17.0
39.1 16.3 183.4 15.6
39.1 16.3 182.8 15.1
39.8 17.5 179.6 14.1
42.9 23.6 179.3 10.1
37.9 19.5 168.3 7.1
~Per 1~000 unmarried female population aged 15-44 years,enumeratedas of April 1 for 1940,1950,and 1960, and estimated as of July 1 for all other years.
3Alaska included beginning 1959; Hawaii, 1960.‘Figures by color exclude data for residents of New Jersey because this State did not require
reporting of the item.
Source: Annual volume Vital Statiaticsof the United States, National Center for Health Statistics, Public Health Service, Washington, U.S. Government Printing Office.
81
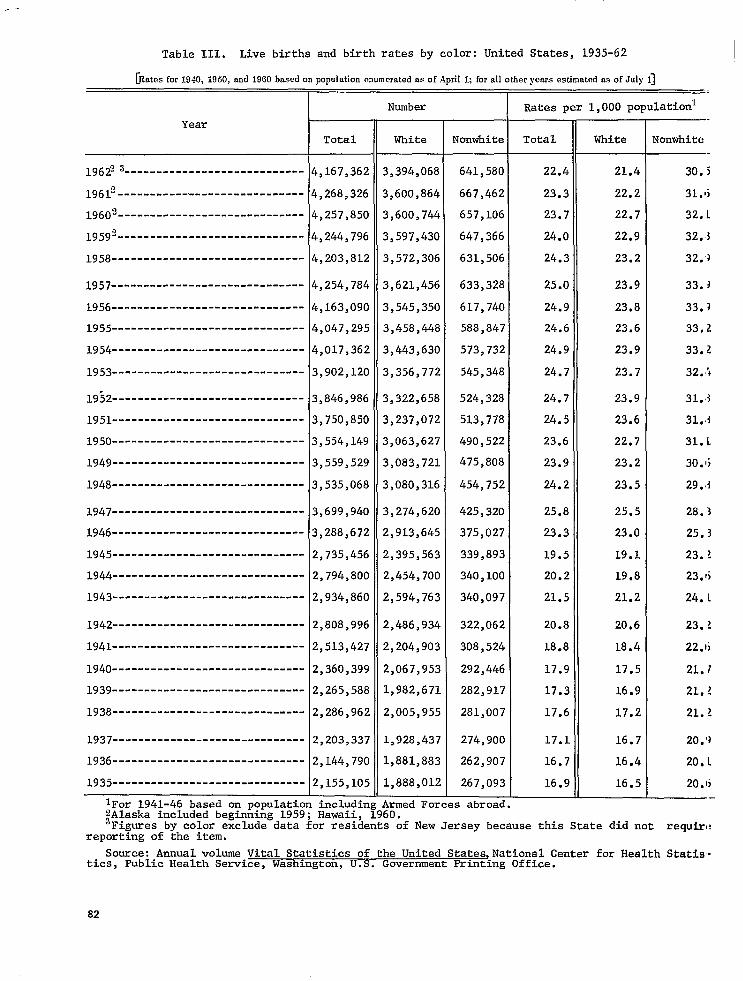
-----------------------------
------------------------------
------------------------------
------------------------------
.-
Table 111. Live births and birth rates by color:United States, 1935-62 1
for1940,1950, 1960basedonpopulation 1;fordlother asofJuly1][Rates .snd emmemtedm ofApril yewsestimated
Number Hates per 1,000 population*
Year
Total White Nonwhite Total White
4,167,362 3,394,068 641,580 22.4 21.4196223----------------------------
$>268,326 3,600,864 667,462 23.3 22.219612-----------------------------
19602 $>257>850 3,600,744 657,106 23.7 22.7
4,244,796 3,597,430 647,366 24.o 22.919592-----------------------------
$,203,812 3,572,306 631,506 24.3 23.21958------------------------------
$>254,784 3,621>456 633,328 25.0 23.91957------------------------------
1956 $,163,090 3,545,350 617,740 24.9 23.8
1955------------------------------$,047,295 3,458,448 588,847 24.6 23.6
1954------------------------------4,017,362 3,443,630 573,732 24.9 23.9
1953------------------------------3,902,120 3,356,772 545,348 24.7 23.7
3,846,986 3,322,658 524,328 24.7 23.919!)2------------------------------
3,750,850 3,237,072 513,778 24.5 23.61951------------------------------
1950------------------------------3,554,149 3,063,627 490,522 23.6 22.7
1949------------------------------3,559,529 3,083,721 475,8o8 23.9 23.2
1948------------------------------3,535>068 3,080,316 454,752 24.2 23.5
3,699,940 3,274,620 425,320 25.8 25.51947------------------------------
1946------------------------------3,288,672 2,913,645 375,027 23.3 23.0
1945------------------------------2,735,456 2,395,563 339,893 19.5 19.1
1944------------------------------2,794,800 2,454,700 340,100 20.2 19.8
2>934,860 2,594,763 340,097 21.5 21.21943------------------------------
1942------------------------------2,808,996 2,486,934 322,062 20.8 20.6
1941 2,513,427 2,204,903 308,524 18.8 18.4
1940------------------------------2,360,399 2,067,953 292,446 17.9 17.5
1939------------------------------2,265,588 1,982,671 282,917 17.3 16.9
1938------------------------------2,286,962 2,005,955 281,007 17.6 17.2
1937------------------------------2,203,337 L,928,437 274,900 17.1 16.7
1936 2,144,790 1,881>883 262,907 16.7 16.4
1935------------------------------2,155,105 1,888,012 267,093 16.9 16.5
lFor lgL1-46 based on population including Armed Forces abroad .2Alaska included beginning 1959; Hawaii, 1960. 3Figures by color exclude data for residents of New Jersey because this State did not require
reportingof the item.
Source:Annual volume Vital Statisticsof the United States,NationalCenter for Health Statis.tics, Public Health Service,Washington,U.S. GovernmentPrintingOffice.
82
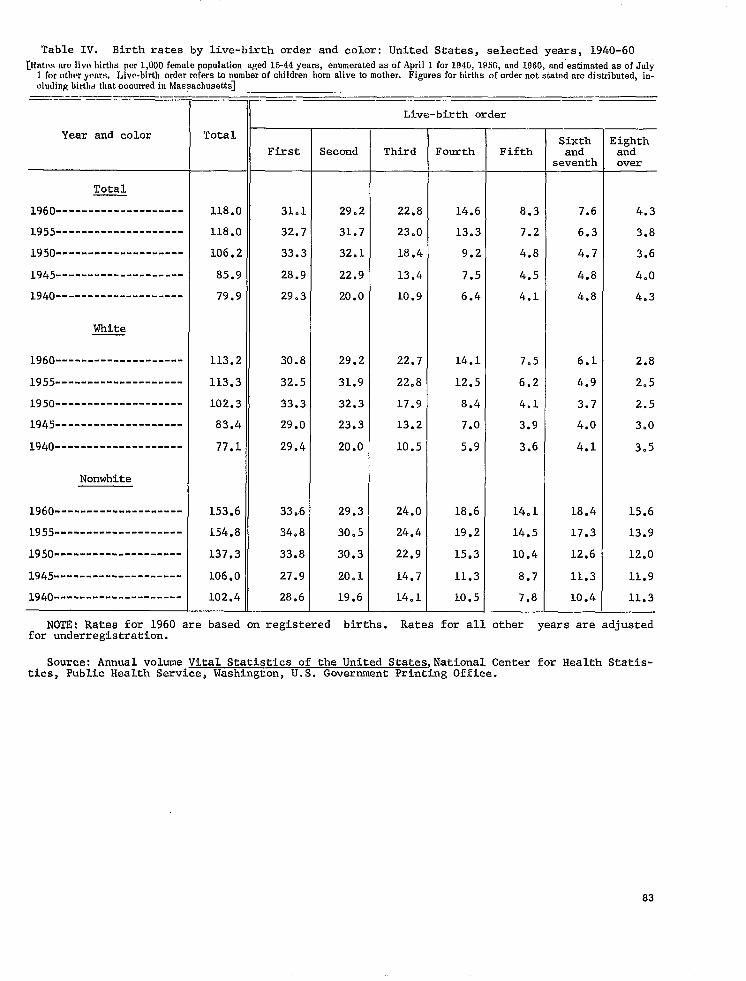
Table IV. Birth rates by live-birth order and color: United States, selected years, 1940-60
~l~atcw births population years, asof April 1 for 194G, 195G, and 1960, and”estimated as of Julyam live per1?000 female aged15-44 enumerated 1 for other years. Live-hmth order refers to number of children born alive to mother. Figures for births of order not stated are distributed, including births that occurred in Massachusetts]
—.. ——. ..— .—
Live-birth order
Year and color Total
Total
1960--------------------
1955--------------------
1950--------------------
1945--------------------
1940--------------------
White
1960--------------------
1955--------------------
1950--------------------
1945--------------------
1940--------------------
NonwhLte
1960--------------------
L955--------------------
1950--------------------
1945--------------------
Sixth Eighth First Second Third Fourth Fifth and and
seventh over
118.0 31.1 29.2 22.8 14.6 8.3 7.6 4.3
118.0 32.7 31.7 23.0 13.3 7.2 6.3 3.8
106.2 33.3 32.1 18.4 9.2 4.8 4.7 3.6
85.9 28.9 22.9 13.4 7.5 4.5 4.8 4.0
79.9 29.3 20.0 10.9 6.4 4.1 4.8 4.3
113.2 30.8 29.2 22.7 14.1 7.5 6.1 2.8
113.3 32.5 31.9 22.8 12.5 6.2 4.9 2.5
102.3 33.3 32.3 17.9 8.4 4.1 3.7 2.5
83.4 29.0 23.3 13.2 7.0 3.9 4.0 3.0
77.1 29.4 20.0 10.5 5.9 3.6 4.1 3.5
153.6 33.6 29.3 24.0 18.6 14.1 18.4 15.6
154.8 34.8 30.5 24.4 19.2 14.5 17.3 13.9
137.3 33.8 30.3 22,9 15.3 10.4 12.6 12.0
106.0 27.9 20.1 14.7 11.3 8.7 11.3 11.9
J.940-------------------- 102.4 28.6 19.6 14.1 10.5 7.8 10.4 11.3
NOTE: Rates for 1960 are based on registered births. Rates for all other years are adjustedfor underregistration.
Source: Annual volume Vital Statistics of the United StatesJNational Center for Health Statistics, Public Health Service, Washington, U.S. Government Printing Office.
83

--------------------
------------
-------------------------------------------------------
-------- -----------------
--------------------------- ---------------------------
-------------------------------------------------
---
---
---
Table V. Percent distribution of female population,by labor force status and educational attainment: United States, 1940, 1950, 1960
=
Labor force status and educational attainment
Labor force status
Total female population aged 14-44 years
In labor force----------------------------------------------------
Not in labor force------------------------------------------------
With own children under 6 yeara of age
Married women, husband present, aged 14-44 years
In labor force----------------------------------------------------
Not in labor force------------------------------------------------
Educational attainment: years of school completed
Total female population aged 25-44 years--------------------
NO school years completed-----------------------------------------
Elementary school:
8 yeara or less-------------------------------------------------
High school:
1-3 years
4 years--.-..=..- ------------------.-----
College:
-1-3 yeara
4 years or more
Median school years completed-------------------------------------
1960 1950 1940
Percent distribution
100.0 100.0 100.0 —-—.
36.7 33.0 30.3
63.3 67.0 69.7
100.0 100.0 —._
19.1 10.5
80.9 89.5
100.0 100.0 100.,)—.—.
0.7 1.0 l,lj
20.5 31.3 45.1
22.4 21.4 19.7
39.3 31.2 2(3*1)
10.2 9.0 7*.i
6.9 6.1 4.”7—-
11.8 11.1 9.()
Source: Decennial census reports of Bureau of Census, U.S. Department of Commerce.
84
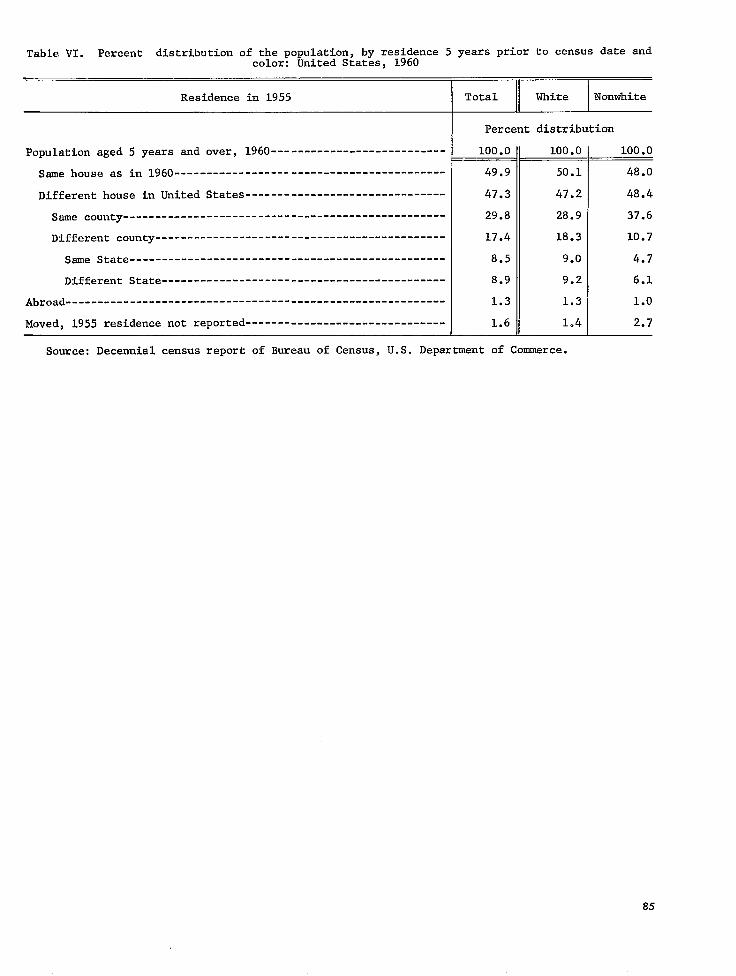
-------------------------------
-----------------------------------------------------------
-------------------------------
Table VI. Percent distribution of the population, by residence 5 years prior to census date andcolor: United States, 1960
Residence in 1955 Total White Nonwhite
Percent distribution
Population aged 5 years and over, 1960--------------------------- 100.0 100.0 100.0
Same house as in 1960------------------------------------------ 49.9 50.1 48.0
Different house in United States 47.3 47.2 48.4
Same county-------------------------------------------------- 29.8 28.9 37.6
Different county--------------------------------------------- 17.4 18.3 10.7
Same State------------------------------------------------- 8.5 9.0 4.7
Different State-------------------------------------------- 8.9 9.2 6.1
Abroad 1.3 1.3 1.0
Moved, 1955 residence not reported 1.6 1.4 2.7
Source: Decennial census report of Bureau of Census, U.S. Department of Commerce.
85

-----------------------------------------------------------
------------------------------------------------ --------
-----------------------------------------------------------
---------------------------------------------------------------------
--------------------------- ---
---------------------------------------------------------------------
-----------------------------------------------------------
---------------------------------------------------------------------
---------------------------------------------------------------------
-----------------------------------------------------------
--------------------------- --------------------------- ---------------
--------------------------------------------------
---------------------------------------------------------------------
--
Table VII. Percent distribution of the population,by type of area and color: United States, 19(,o— —
Type of area and color
Total
All areas
Metropolitan areas
Nonmetropolitan areas-----------------------------------------------------
Total
All areas
Urban
Within urbanized areas--------------------------------------------------
Central cities--------------------------------------------------------
Urban fringes---------------------------
Outside urbanized areas-------------------------------------------------
Rmal
White
All areas
Urban
Within urbanized areas--------------------------------------------------
Central cities--------------------------------------------------------
Urban fringes---------------------------------------------------------
Outside urbanized areas-------------------------------------------------
Rual
Nonwhite
All areas
Urban
WithinUrbanized areas
Central cities--------------------------------------------------------
Urban fringes---------------------------------------------------------
Outside urbanized areas-------------------------------------------------
Raal
Percent distributioxl
100,0—
63,0
37 0
100.0
69,9
53.5
32,3
21,1
16,4
30,1
100,0—
69,5
52,7
30,0
22,8
16,8
30,5
100,0—
72,4
58,9
50,5
8,4
13,5
27,6—
Source: Decennial census report of Bureau of Census, U.S. Department of Commerce.
86
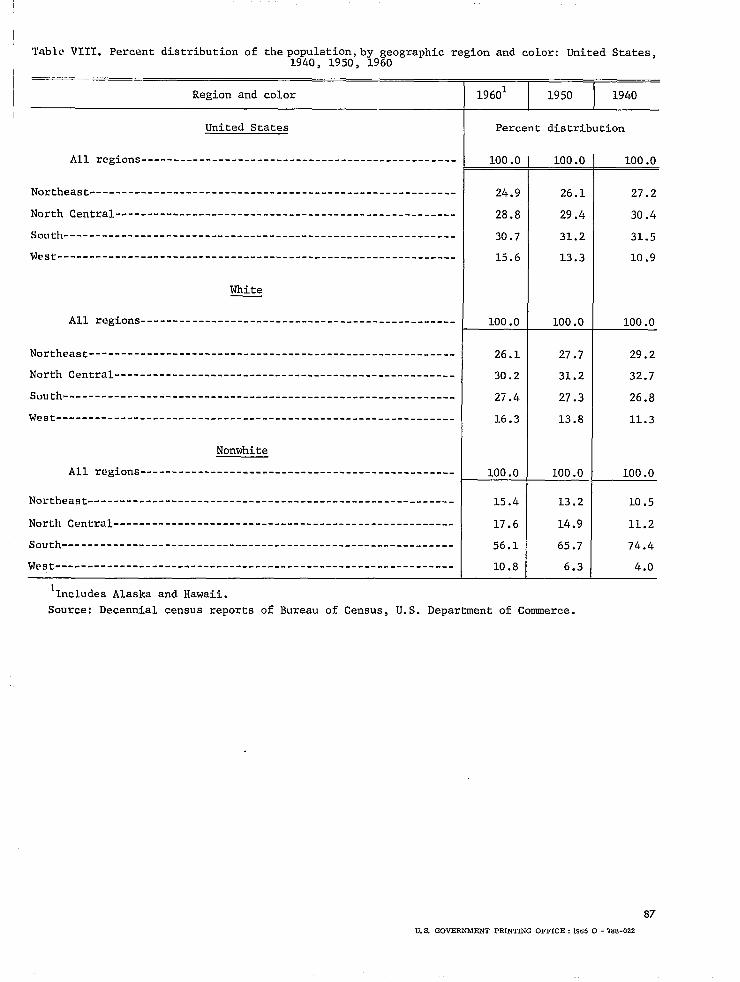
---------------------------------------------------------
-----------------------------------------------------
--------------------------------------------------------------
---------------------------------------------------------
-----------------------------------------------------
-------------------------------------------------------------
--------------------------------------------------------------
---------------------------------------------------------
-----------------------------------------------------
-------------------------------------------------------------
--------------------------------------------------------------
Table VIII. Percent distribution of the population, by geographic region and color: United States,1940, 1950, 1960
Region and color 19601 I 1950 I 1940
United States Percent distribution
All regions------------------------------------------------- 100.0 100.0 100.0
Northeast 24.9 26.1 27.2
North Central 28.8 29.4 30.4
South------------------------------------------------------------- 30.7 31.2 31.5
West 15.6 13.3 10.9
White
All regions------------------------------------------------- 100.0 100.0 100.0
Northeast 26.1 27.7 29.2
North Central 30.2 31.2 32.7
South 27.4 27.3 26.8
West 16.3 13.8 11.3
Nonwhite
All regions------------------------------------------------- 100.0 100.0 100.0
Northeast 15.4 13.2 10.5
North Central 17.6 14.9 11.2
South 56.1 65.7 74.4
west 10.8 6.3
1Includes Alaska and Hawaii.
Source: Decennial census reports of Bureau of Census, U.S. Department of Commerce.
87
U.S. GOVERNMENT PRINITNG OFFICE :1965 0- 76 S-022
4.0

OUTLINE OF REPORT SERIES FOR VITAL AND HEALTH STATISTICS€
Public Health Service Publication No. 1000€
Sevies 1.
Series 2.
Series 3.
Series 4.
Series 10.
SeYies 11.
SeVies 12.
Sevies 20.
SeVies 21.
bevies 22.
Pvog~ams and collection p~oceduves. —Reports which describe the general programs of the Nation~l Center for Health Statistics and its offices and divisions, data collection methods used, definitions, and other material necessary for understanding the data.
Reports number 1-4
Data evaluation and methods reseavch. —Studies of new statistical methodology including: experimental tests of new survey methods, studies of vital statistics collection methods, new analytical techniques, objective evaluations of reliability of collected data, contributions to statistical theory.
Reports number 1-12
Analytica[ studies. — Reports presenting analytical or interpretive studies based on vital and health statistics, carrying the analysis further than the expository types of reports in the other series.
Reports number l-4
Documents and committee vepo)’ts.-Final reports of major committees concerned with vital and health
statistics, and documents such as recommended model vital registration laws and revised birth and death certificates.
Reports number 1 and 2
Data From the Health Interview Survey .—Statistics on illness, accidental injuries, disability, use of hospital, medical, dental, and other services, and other health-related topics, based on data collected in a continuing national household interview survey.
Reports number 1-23
Data From the Health Examination Suvvey.—Statistics based on the direct examination, testing, and measurement of national samples of the population, including the medically defined prevalence of specific diseases, and distributions of the population with respect to various physical and physiological measurements.
Reports number 1-11
Data F~om the Health Reco~ds Su~vey. —Statistics from records of hospital discharges and statistics relating to the health characteristics of persons in institutions, and on hospital, medical, nursing, and personal care received, based on national samples of establishments providing these services and samples of the residents or patients.
Reports number 1 and 2
Data on mortality. —Various statistics on mortality other than as included in annual or monthly reports— special analyses by cause of death, age, and other demographic variables, also geographic and time series analyses.
No reports to date
Data on natality, rnan’iage, and divorce. — Various statistics on natality, marriage, and divorce other than as included in annual or monthly reports— special analyses by demographic variables, also geographic and time series analyses, studies of fertility.
Reports number 1-6
Data From the National Natality and Mortality Surveys. —Statistics on characteristics of births and deaths not available from the vital records, based on sample surveys stemming from these records, including such topics as mortality by socioeconomic class, medical experience in the last year of life, characteristics of pregnancy, etc.
Reports number 1
l-or a list of titles of reports published in these series, write to: National Center for Health Statistics U.S. Public Health Service Washington, D.C. 20201