VITA G&A Comparative Analysis Report - ITIB (January … / Process Classification Framework About...
10
VITA General & Administrative (G&A) Cost Analysis and Comparison Final Report Presented to the ITIB January 17, 2008
Transcript of VITA G&A Comparative Analysis Report - ITIB (January … / Process Classification Framework About...

VITAGeneral & Administrative (G&A) Cost Analysis and Comparison
Final ReportPresented to the ITIB
January 17, 2008

For internal use of VITA.© 2008 Gartner, Inc. and/or its affiliates. All rights reserved.
Page 2
Gartner MethodologyComparative Analysis Steps
Obtain the APQCMetric database
extracts
6
Map VITA G&A activities
to APQC processdefinitions
3Validate the APQC
Mapping
4
Provide theAnalysis,
APQC Comparisonand
Recommendations
9
ProjectInitiation &
Scope Definition
1Document VITA
G&A Functions and Responsibilities
2Identify the relevant
APQC metrics for the comparative analysis
5
Map the VITA G&A Expenses and FTEs to
APQC conformingCost and FTE pools
7Allocate the appropriate
VITA support coststo G&A based on
functions
8

For internal use of VITA.© 2008 Gartner, Inc. and/or its affiliates. All rights reserved.
Page 3
APQC / Process Classification Framework
About American Productivity and Quality Center (APQC)A global resource for process and performance improvement, APQC discovers improvement methods, identifies benchmarks and best practices, disseminates findings and connects individuals. Spearheaded by APQC, the global Open Standards Benchmarking Collaborative (OSBC) research helps executives benchmark comparable business processes. Founded in 1977, the member-based nonprofit serves more than 500 organizations.
About the Process Classification Framework (PCF)APQC and its members developed the Process Classification Framework (PCF), which is updated by a global advisory council of industry leaders. As a common language, the PCF allows organizations to see and discuss their activities from an industry-neutral viewpoint. Regardless of size, industry or geography, organizations can use the PCF to benchmark and improve processes. It is updated twice per year to ensure relevancy and continuous improvement.
For internal use of VITA.© 2008 Gartner, Inc. and/or its affiliates. All rights reserved.
Page 4
APQC’s Process Classification Framework - Definition of G&A
Gartner used the APQC definitions from the Process Classification Framework (PCF) to define G&A for purpose of comparison- Within the PCF, generally functions that relate to delivery of IT services are
not (as used here) considered G&AUsing the PCF definitions, some dollars were excluded from the G&A analysis for VITA in the following areas:
- Portions of Service Management Organization (SMO)- E911- Portions of IT Integration and Enterprise Services (ITIES), and Finance and Administration
(F&A)
The resulting costs, defined as G&A in the analysis using the PCF, are different than those typical considered within VITA and the Commonwealth- VITA has operational terms for “overhead” (keyed to support functions) and
“indirect costs’ (keyed to funding sources) – these are not the same as “G&A” (as used here)
- Gartner has used “G&A” as defined by APQC, to permit an apples-to-apples comparison of like functions with the companies in the APQC database

For internal use of VITA.© 2008 Gartner, Inc. and/or its affiliates. All rights reserved.
Page 5
Overview of the APQC Database

For internal use of VITA.© 2008 Gartner, Inc. and/or its affiliates. All rights reserved.
Page 6
The APQC Comparative Data
Metric Selection- Once the high level comparison results were analyzed, Gartner selected
additional metrics in order to drill down into areas of interest- Based on activity mapping of VITA G&A, we selected comparable cost and
FTE metrics in order to do a high level comparisonThe APQC database extracts used in the analysis had the following characteristics:- The number of data points (observations) for the metrics selected for this
analysis ranged from a low of 13 to a high of 158, depending on the specific metric selected
- No additional selection criteria were used to reduce the database sample size by metric for this analysis (i.e. industry, size)
- The database observations come from a wide spectrum of companies or IT departments of companies across industry, non-profits and government
For internal use of VITA.© 2008 Gartner, Inc. and/or its affiliates. All rights reserved.
Page 7
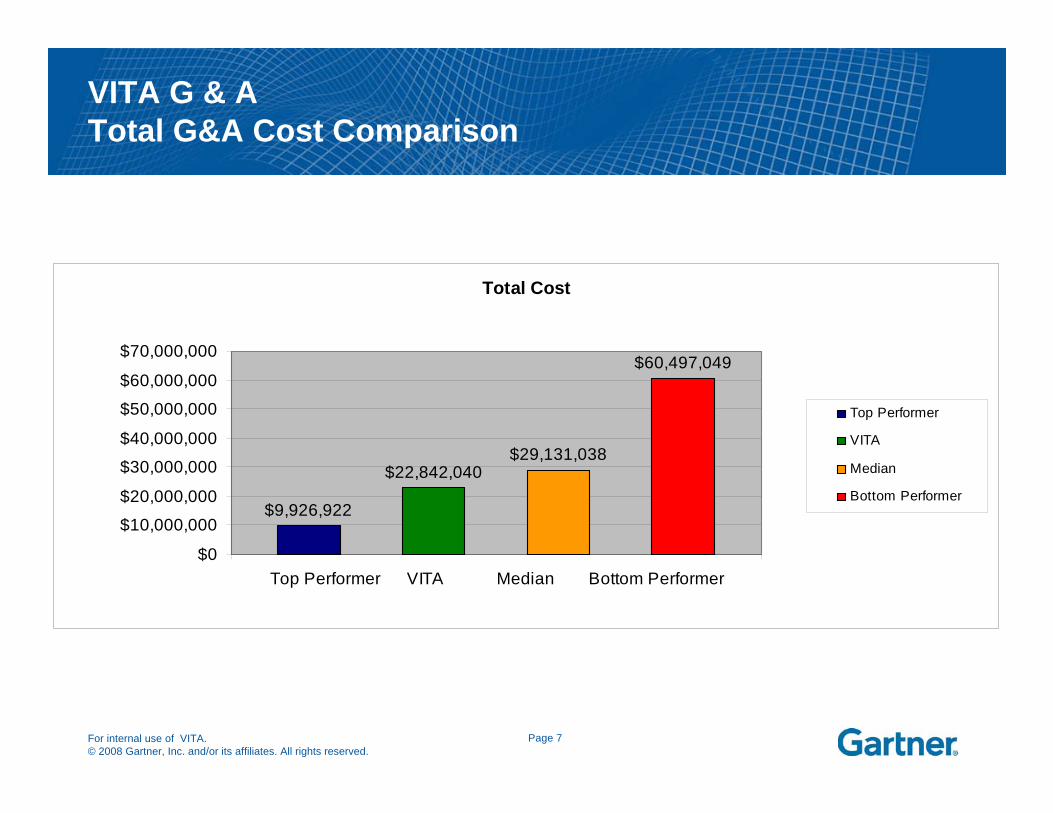
VITA G & ATotal G&A Cost Comparison
Total Cost
$9,926,922
$22,842,040$29,131,038
$60,497,049
$0
$10,000,000
$20,000,000
$30,000,000
$40,000,000
$50,000,000
$60,000,000
$70,000,000
Top Performer VITA Median Bottom Performer
Top Performer
VITA
Median
Bottom Performer

For internal use of VITA.© 2008 Gartner, Inc. and/or its affiliates. All rights reserved.
Page 8
VITA G & ATotal G&A FTE Comparison
Total FTEs
56.6
163.9 168.8
334.8
0.0
50.0
100.0
150.0
200.0
250.0
300.0
350.0
400.0
Top Performer Median VITA Bottom Performer
Top Performer
Median
VITA
Bottom Performer

For internal use of VITA.© 2008 Gartner, Inc. and/or its affiliates. All rights reserved.
Page 9
Conclusion
Gartner was engaged to conduct a comparative analysis of the General and Administrative (G&A) expenses of VITA- The question to be answered for the ITIB was “how does VITA’s G&A
expense compare?” to other entitiesBased on the results of the comparative analysis, we find that VITA’s G&A expenses and G&A related FTEs are within the range anticipated for IT organizations performing similar functions- Total expense performance is better than median performers in the
database data- Total FTEs are in line with median performers in the database data