
Visually Exploring Large Social Networks - microsoft.com · quick comparison with other systems. My...
6
Visually Exploring Large Social Networks Nathalie Henry INRIA Futurs/LRI & University of Sydney Bat. 490 University Paris-Sud, 91405 Orsay, France J12, University of Sydney, NSW 2006, Australia [email protected] http://insitu.lri.fr/ ~ nhenry This PhD is a cotutelle co-advised by: – Dr. Jean-Daniel Fekete 1 , INRIA Futurs, France – Pr. Peter Eades 2 , National ICT Australia & University of Sydney, Australia. Research Area and Topic Information Visualization and Human Computer Interaction. This PhD focuses on visualization and interaction to navigate, explore and present large social networks. 1 Introduction Vast new datasets are available for social scientists to analyze with the increasing use of internet technologies. Email clients, instant messenger and chat; photo sharing and peer-to-peer file exchange; open-source programming platforms and online editable encyclopedias such as wikipedia—all give social scientists ready- to-analyze data about how people communicate and collaborate. This data avalanche raises new challenges these datasets are far larger than those they traditionally analyzed. (For example, the English version alone of Wikipedia contains 1.7 million articles). Also, they frequently contain richer information such as the history of each item: who contributed, when, for how much, and they evolve through time (the network structure changes as articles are added, transformed or removed). The stakes of social network analysis are rising : intelligence agencies struggle to discover terrorist networks or epidemiologists to detect and contain outbreaks of diseases such as avian influenza and SARS. Analysts require effective tools for handling these large, rich and dynamic social networks, to perform reliable yet flexible analysis at many levels, from overviews of the whole to a detailed analysis of important sections. The goal of this PhD is to provide them with visual interactive tools to support both their exploration process and the communication of their findings. 1 [email protected] 2 [email protected]
Transcript of Visually Exploring Large Social Networks - microsoft.com · quick comparison with other systems. My...

Visually Exploring Large Social Networks
Nathalie Henry
INRIA Futurs/LRI & University of SydneyBat. 490 University Paris-Sud, 91405 Orsay, France
J12, University of Sydney, NSW 2006, [email protected]
http://insitu.lri.fr/~nhenry
This PhD is a cotutelle co-advised by:
– Dr. Jean-Daniel Fekete 1, INRIA Futurs, France– Pr. Peter Eades2, National ICT Australia & University of Sydney, Australia.
Research Area and Topic
Information Visualization and Human Computer Interaction. This PhD focuseson visualization and interaction to navigate, explore and present large socialnetworks.
1 Introduction
Vast new datasets are available for social scientists to analyze with the increasinguse of internet technologies. Email clients, instant messenger and chat; photosharing and peer-to-peer file exchange; open-source programming platforms andonline editable encyclopedias such as wikipedia—all give social scientists ready-to-analyze data about how people communicate and collaborate.
This data avalanche raises new challenges these datasets are far larger thanthose they traditionally analyzed. (For example, the English version alone ofWikipedia contains 1.7 million articles). Also, they frequently contain richerinformation such as the history of each item: who contributed, when, for howmuch, and they evolve through time (the network structure changes as articlesare added, transformed or removed).
The stakes of social network analysis are rising : intelligence agencies struggleto discover terrorist networks or epidemiologists to detect and contain outbreaksof diseases such as avian influenza and SARS.
Analysts require effective tools for handling these large, rich and dynamic socialnetworks, to perform reliable yet flexible analysis at many levels, from overviewsof the whole to a detailed analysis of important sections. The goal of this PhD isto provide them with visual interactive tools to support both their explorationprocess and the communication of their findings.1 [email protected] [email protected]

2 Related work
Social networks are composed of actors (people or groups) linked by relationships(for example kinship, communication or collaboration). As social networks aregraphs, their analysis is closely related to the exploration of graphs in general.There are many programs designed to support network analysis. The Interna-tional Network for Social Network Analysis repository lists more than 50 differ-ent programs, and 10 new ones were introduced at last year’s Infovis conference(30% of the articles). I classify these systems in two categories.
Menu-based systems and programming packages provide a wide range of func-tionalities to analyze and visualize social networks. Popular systems such asUCINet[1] and R[2] offer many features for statistical analysis, and commongraph software and packages such as Pajek[3] and JUNG3 also provide a broadrange of algorithms to create visual representations of a network. However, mas-tering all the functionalities of these systems requires a considerable effort fornovice users, as they require knowledge of how the algorithms work and how tocombine or sequence them. Guess [4] is designed to support a more exploratoryprocess. It provides a simple script language for manipulating the visualizations.However, even it remains inaccessible for many novice users, as it is unclear thatsocial scientists will invest time learning it.
Visual exploration systems have emerged recently. They provide interactions tonavigate and manipulate networks, which makes them accessible to novice users.Following Ben Shneiderman’s mantra [5]: “Overview first, zoom and filter, thendetails-on-demand”, they provide users with dynamic queries [6] (operationswith a direct feedback on the representation).
Systems such as SocialAction[7] start the analysis with a node-link diagramof the full graph. For large and dense graphs, however, node overlap and edgecrossing quickly makes these representations unreadable. Users must filter oraggregate nodes to get a readable visualization. SocialAction’s strongest featureis its ranking of possible operations the user can perform at each step, providingguidance for the exploration process.
Since providing a readable representation of the whole network is challeng-ing, several systems completely gave up on providing an overview. For example,Vizster[8] and TreePlus[9] concentrate on displaying and navigating in only asmall part of a network centered on a specific actor. This “ego-centered” strat-egy lets users have a readable representation on the screen at all times. Othersystems take other radical approaches. PivotGraph [10] starts the explorationfrom a high-level aggregated network. The user visualizes nodes’ categories andtheir relationships, and then interacts with the visualization to explore lowerlevels. Finally, NetLens[11] completely gave up the graph representation. It usessimple visualizations such as histograms to explore the graph by its attributes,filtering them back and forth to answer questions.
3 JUNG http://jung.sourceforge.net
3 Approach
This PhD follows statistician John Tukey’s concept of Exploratory Data Analysis[12]: the primary purpose of visualizing and exploring is to raise questions andgather insights about a large quantity of data. Unlike most statistical work, whichevaluates a priori questions according to a model, exploration by informationvisualization has the potential to start analysis without assumptions, or opennew perspectives on a previously-analyzed dataset. For these purposes, overviewsof the whole network are crucial.
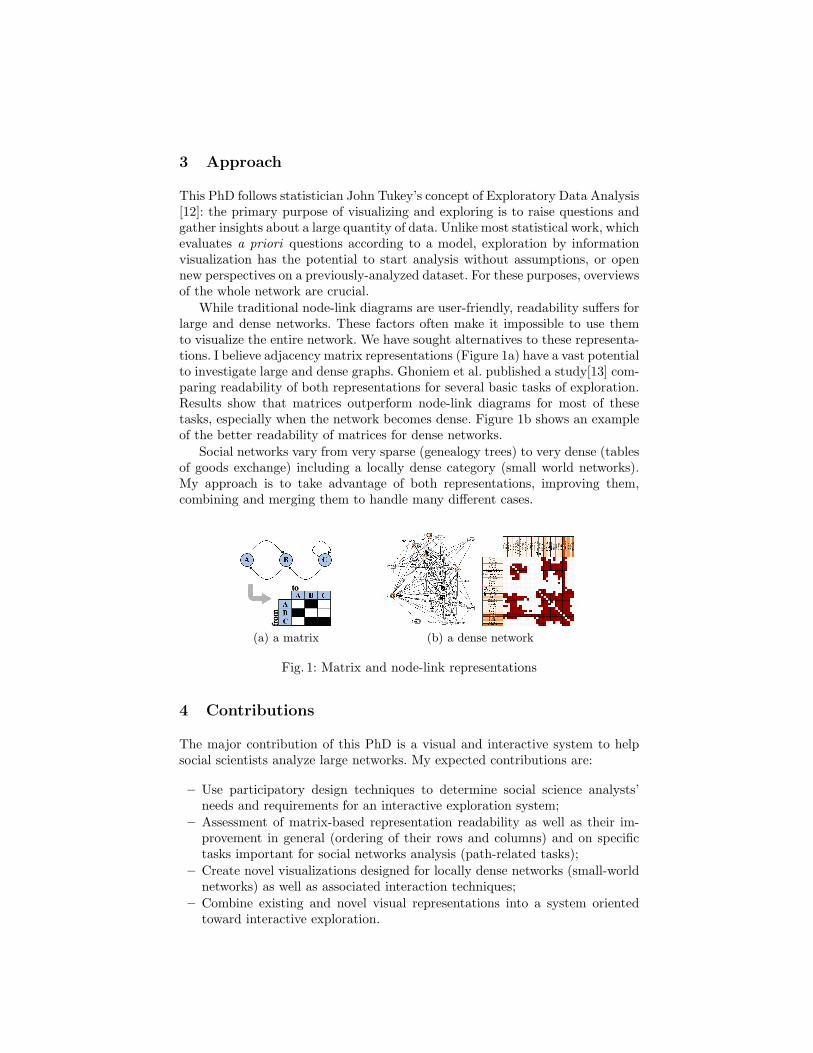
While traditional node-link diagrams are user-friendly, readability suffers forlarge and dense networks. These factors often make it impossible to use themto visualize the entire network. We have sought alternatives to these representa-tions. I believe adjacency matrix representations (Figure 1a) have a vast potentialto investigate large and dense graphs. Ghoniem et al. published a study[13] com-paring readability of both representations for several basic tasks of exploration.Results show that matrices outperform node-link diagrams for most of thesetasks, especially when the network becomes dense. Figure 1b shows an exampleof the better readability of matrices for dense networks.
Social networks vary from very sparse (genealogy trees) to very dense (tablesof goods exchange) including a locally dense category (small world networks).My approach is to take advantage of both representations, improving them,combining and merging them to handle many different cases.
to
from
(a) a matrix (b) a dense network
Fig. 1: Matrix and node-link representations
4 Contributions
The major contribution of this PhD is a visual and interactive system to helpsocial scientists analyze large networks. My expected contributions are:
– Use participatory design techniques to determine social science analysts’needs and requirements for an interactive exploration system;
– Assessment of matrix-based representation readability as well as their im-provement in general (ordering of their rows and columns) and on specifictasks important for social networks analysis (path-related tasks);
– Create novel visualizations designed for locally dense networks (small-worldnetworks) as well as associated interaction techniques;
– Combine existing and novel visual representations into a system orientedtoward interactive exploration.

(a) MatrixExplorer
(b) Zoom on MatLink (c) Zoom on NodeTrix
Fig. 2: MatrixExplorer, MatLink and NodeTrix
MatrixExplorer: an Exploration System[14, 15]. From a serie of interviews fol-lowed by a participatory design workshop, I collected a set of requirements forvisually exploring social networks. One of the major outcome was the need formultiple representations of a same network and tools to help analysts find a con-sensus on their findings. From this study, I designed MatrixExplorer, a systemcombining matrices and node-link diagrams (Figure 2a). When users apply dy-namic queries on one representation, they can observe the results on the other aswell. Matrices are generally used to manipulate the network (filtering, ordering,clustering) and node-link diagrams to visualize the resulting one (smaller andsparser) and finally communicate findings. I observed that ordering rows andcolumns of matrices was crucial to better understand them. Thus, I developedan ordering algorithm based on heurisitics for the traveling salesman problem.
MatLink: Improving Matrix Representations[16]. Ordering a matrix helps iden-tifying communities and central actors, both important tasks for analysis. How-ever, matrices still suffer of a weakness for path-related tasks (how many actorsconnect A to B?). I designed an interactive solution to solve that major disad-vantage of matrices: MatLink (Figure 2b). The principle is to overlay a linearnode-link diagram on the matrix headers as well as display interactively theshortest path between selected actors. Currently, I am working on integratingMatLink into ZAME[17], a multiscale matrix explorer. MatLink can providevisual cues on what is not directly visible on the screen, and thus aid navigation.
NodeTrix: a Hybrid Representation[18]. A large category of social networks areglobally sparse but locally dense. In this case, the structure is readable with anode-link diagram, but dense sub-parts are not. To solve that problem, I createda hybrid representation : NodeTrix , a node-link diagram visualizing dense sub-parts as matrices (Figure 2c). To smoothly manipulate NodeTrix, I designed a setof interaction techniques based on direct manipulation of the nodes using drag-and-drop. A video is available at http://insitu.lri.fr/~nhenry/nodetrix/.

5 Evaluation
Evaluating representations readability can be quantitatively done on a small setof tasks using controlled experiments or on a broader context by running casestudies with benchmarks. In this case, results are more qualitative but allows aquick comparison with other systems. My first attempt at assessing matrix read-ability was a controlled experiment[19]. It partly failed because of the difficultyto operationnalize the exploratory process and to objectively compare subjects’interpretations and findings. To solve that problem, I worked with researchersfrom HCIL on defining a task taxonomy for graphs [20]. The second experimentI performed was much more focused, using five tasks and a technique I de-velopped to generate representative datasets4. It ended with significant resultsshowing that MatLink improved matrices[16]. However, it is hard to generalizedthese results to the global process of exploration. To validate NodeTrix in a morerealistic context, I chose to perform a case study using benchmarks.
Evaluating a visual exploration system is much more complicated as the processto control is long and difficult to operationnalize [21], which exclude controlledexperiment. I chose to validate MatrixExplorer a priori, by implying users beforeand during its design. I am currently running a case study, describing how Ma-trixExplorer is used to explore a large quantity of data and what visualizationsare created. Future evaluation would include a longitudinal study. These studiesrequires effort from both the system creator and the users in term of time andimplication. However, they provide rich feedback and materials to analyze theexploration process and improve greatly the tool.
6 Directions for Future Research
At this stage, I can extend my PhD in many directions, I will only present thefour I am interested in.
1. Creating novel visualizations and interaction techniques. This would espe-cially be usefull to reorganize the high number of controls required to manip-ulate a network. I can imagine integrating them directly in the visualizationsor design smart interaction techniques to replace them.
2. Guiding the exploration. Allowing analysts to visualize their previous anal-ysis, annotating it and providing some indicators to guiding the next stepsof the exploration would help them in their work and help us to understandthe exploration process.
3. Releasing a stable system. This is mandatory to run a longitudinal study. Iwould integrate and instrument all prototypes to log users’ actions.
4. Providing support for collaboration and communication. This extension wouldhelp analysts to work together and to present their findings.
I briefly presented my research work on visual and interactive explorationof social networks. I am looking forward to the Doctoral Consortium to gatherfeedback on my research work and discuss the future direction of my PhD.4 http://www.infovis-wiki.net/index.php/Social_Network_Generation

References
[1] Borgatti, S., Everett, M., Freeman, L.: UCINET V user’s guide. Analytic Tech-nologies, Natick, MA (1999)
[2] R Development Core Team: R: A Language and Environment for Statistical Com-puting. R Foundation for Statistical Computing, Vienna, Austria. (2006) ISBN3-900051-07-0.
[3] de Nooy, W., Mrvar, A., Batagelj, V.: Exploratory Social Network Analysis withPajek. Structural Analysis in the Social Sciences. Cambridge Univ. Press (2005)
[4] Adar, E.: Guess: a language and interface for graph exploration. In: CHI ’06:Proceedings of the SIGCHI conference on Human Factors in computing systems,New York, NY, USA, ACM Press (2006) 791–800
[5] Shneiderman, B.: The Eyes Have It: A Task by Data Taxonomy for InformationVisualization. Visual Languages (1996) 336–343
[6] Ahlberg, C., Williamson, C., Shneiderman, B.: Dynamic queries for informationexploration: An implementation and evaluation. Proceedings of the ACM CHI’92:Human Factors in Computing Systems (1992) 619–626
[7] Perer, A., Shneiderman, B.: Balancing Systematic and Flexible Exploration ofSocial Networks. IEEE TVCG (Infovis’06 proceedings) 12(5) (2006) 693–700
[8] Heer, J., Boyd, D.: Vizster: Visualizing Online Social Networks. In: Proceedingsof the IEEE Symposium on Information Visualization. (2005) 5
[9] Lee, B., Parr, C.S., Plaisant, C., Bederson, B.B., Veksler, V.D., Gray, W.D., Kot-fila, C.: Treeplus: Interactive exploration of networks with enhanced tree layouts.IEEE TVCG (Infovis’06 proceedings) 12(6) (2006) 1414–1426
[10] Wattenberg, M.: Visual exploration of multivariate graphs. In: Proceedings of theCHI conference, Montreal, Quebec, Canada, ACM Press (2006) 811–819
[11] Kang, H., Plaisant, C., Lee, B., Bederson, B.B.: Netlens: Iterative exploration ofcontent-actor network data. Proceeding of IEEE Symposium on Visual AnalyticsScience and Technology (VAST) (2006) 91–98
[12] Tukey, J.: Exploratory Data Analysis. Addison-Wesley (1977)[13] Ghoniem, M., Fekete, J.D., Castagliola, P.: On the readability of graphs using
node-link and matrix-based representations: a controlled experiment and statisti-cal analysis. Information Visualization 4(2) (2005) 114–135
[14] Henry, N., Fekete, J.D.: Matrixexplorer: Un systeme pour l’analyse exploratoire dereseaux sociaux. Proceedings of IHM2006, International Conference ProceedingsSeries (September 2006) 67–74
[15] Henry, N., Fekete, J.D.: MatrixExplorer: a Dual-Representation System to ExploreSocial Networks. IEEE TVCG (Infovis’06 proceedings) 12(5) (2006) 677–684
[16] Henry, N., Fekete, J.D.: Matlink: Enhanced matrix visualization for analyzingsocial networks. Proceedings of Interact (to be published) (2007)
[17] Fekete, J.D., Elmqvist, N., Do, T.N., Goodell, H., Henry, N.: Navigating wikipediawith the zoomable adjacency matrix explorer. INRIA Tech. Report (April 2007)
[18] Henry, N., Fekete, J.D., McGuffin, M.: Nodetrix: Hybrid representation for ana-lyzing social networks. INRIA Tech. Report (April 2007)
[19] Henry, N., Fekete, J.D.: Evaluating visual table data understanding. In: BE-yond time and errors: novel evaLuation methods for Information Visualization(BELIV’06), Venice, Italy, ACM Press (2006)
[20] Plaisant, C., Lee, B., Parr, C.S., Fekete, J.D., Henry, N.: Task taxonomy for graphvisualization. In: BELIV’06 workshop, Venice, Italy, ACM Press (2006) 82–86
[21] Plaisant, C.: The challenge of information visualization evaluation. In: Proceedingsof the AVI Conference, Gallipoli, Italy, ACM Press (2004) 109–116

![Bayesian Dynamic Linear Models for Structural Health ... · structural dynamic models are published in the field of SHM, [5,6,8,17,20,24, 27,28]. A first attempt to employ a BDLM](https://static.fdocuments.in/doc/165x107/5e78d0c164014172bd4e280e/bayesian-dynamic-linear-models-for-structural-health-structural-dynamic-models.jpg)


