Visualizing Incongruity: Visual Data Mining Strategies for ...
68
Central Washington University Central Washington University ScholarWorks@CWU ScholarWorks@CWU All Graduate Projects Graduate Student Projects Fall 2017 Visualizing Incongruity: Visual Data Mining Strategies for Visualizing Incongruity: Visual Data Mining Strategies for Modeling Humor in Text Modeling Humor in Text Andrew Smigaj Central Washington University, [email protected] Follow this and additional works at: https://digitalcommons.cwu.edu/graduate_projects Part of the Other Computer Sciences Commons Recommended Citation Recommended Citation Smigaj, Andrew, "Visualizing Incongruity: Visual Data Mining Strategies for Modeling Humor in Text" (2017). All Graduate Projects. 163. https://digitalcommons.cwu.edu/graduate_projects/163 This Graduate Project is brought to you for free and open access by the Graduate Student Projects at ScholarWorks@CWU. It has been accepted for inclusion in All Graduate Projects by an authorized administrator of ScholarWorks@CWU. For more information, please contact [email protected].
Transcript of Visualizing Incongruity: Visual Data Mining Strategies for ...

Central Washington University Central Washington University
ScholarWorks@CWU ScholarWorks@CWU
All Graduate Projects Graduate Student Projects
Fall 2017
Visualizing Incongruity: Visual Data Mining Strategies for Visualizing Incongruity: Visual Data Mining Strategies for
Modeling Humor in Text Modeling Humor in Text
Andrew Smigaj Central Washington University, [email protected]
Follow this and additional works at: https://digitalcommons.cwu.edu/graduate_projects
Part of the Other Computer Sciences Commons
Recommended Citation Recommended Citation Smigaj, Andrew, "Visualizing Incongruity: Visual Data Mining Strategies for Modeling Humor in Text" (2017). All Graduate Projects. 163. https://digitalcommons.cwu.edu/graduate_projects/163
This Graduate Project is brought to you for free and open access by the Graduate Student Projects at ScholarWorks@CWU. It has been accepted for inclusion in All Graduate Projects by an authorized administrator of ScholarWorks@CWU. For more information, please contact [email protected].

VISUALIZING INCONGRUITY: VISUAL DATA MINING STRATEGIES FOR
MODELING HUMOR IN TEXT
A Project
Presented to
The Graduate Faculty
Central Washington University
In Partial Fulfillment
of the Requirements for the Degree
Master of Science
Computational Science
by
Andrew Smigaj
December 2017
CENTRAL WASHINGTON UNIVERSITY
Graduate Studies
We hearby approve the project of
Andrew Smigaj
Candidate for the degree of Master of Science
APPROVED FOR THE GRADUATE FACULTY
Dr. Razvan Andonie
Dr. Boris Kovalerchuk
Dr. Szilard Vajda
Dean of Graduate Studies
ii

ABSTRACT
VISUALIZING INCONGRUITY: VISUAL DATA MINING STRATEGIES FOR
MODELING HUMOR IN TEXT
by
Andrew Smigaj
December 2017
The goal of this project is to investigate the use of visual data mining to model
verbal humor. We explored various means of text visualization to identify key featrues of
garden path jokes as compared with non jokes. With garden path jokes one interpretation
is established in the setup but new information indicating some alternative interpretation
triggers some resolution process leading to a new interpretation. For this project we
visualize text in three novel ways, assisted by some web mining to build an informal
ontology, that allow us to see the differences between garden path jokes and non jokes
of similar form. We used the results of the visualizations to build a rule based model
which was then compared with models from tradtitional data mining toi show the use
of visual data mining. Additional experiments with other forms of incongruity including
visualization of ’shilling’ or the introduction of false reviews into a product review set.
The results are very similar to that of garden path jokes and start to show us there is a
shape to incongruity. Overall this project shows as that the proposed methodologies
and tools offer a new approach to testing and generating hypotheses related to theories
of humor as well as other phenomena involving opposition, incongruities, and shifts in
classification.
iii

ACKNOWLEDGEMENTS
I want to thank my advisor, comittee, family, friends, pets, car, dead relatives,
myself,and whoever else is appropriate.
iv

TABLE OF CONTENTS
Chapter Page
I INTRODUCTION . . . . . . . . . . . . . . . . . . . . . . . . . . . . . . 1
II LITERATURE REVIEW . . . . . . . . . . . . . . . . . . . . . . . . . . . 4
Incongruity Resolution Theory . . . . . . . . . . . . . . . . . . . . . . . 4Opposition . . . . . . . . . . . . . . . . . . . . . . . . . . . . . . . . . 5Garden Path Humor . . . . . . . . . . . . . . . . . . . . . . . . . . . . 6Representation of Meaning . . . . . . . . . . . . . . . . . . . . . . . . . 6Computational Humor . . . . . . . . . . . . . . . . . . . . . . . . . . . 7Data Visualization And Humor . . . . . . . . . . . . . . . . . . . . . . . 9
III PROBLEMS . . . . . . . . . . . . . . . . . . . . . . . . . . . . . . . . . 11
IV OUR APPROACH . . . . . . . . . . . . . . . . . . . . . . . . . . . . . . 13
Establishing Meanings and Meaning Correlations . . . . . . . . . . . . . 13Example . . . . . . . . . . . . . . . . . . . . . . . . . . . . . . . . . . 16Data Set used in Visualizations . . . . . . . . . . . . . . . . . . . . . . . 18Visualization Approach 1. Collocated Paired Coordinates . . . . . . . . . 20Visualization 2: Heat Maps . . . . . . . . . . . . . . . . . . . . . . . . . 22Visualization 3: Visualizing a model space using monotone boolean chain
visualizations . . . . . . . . . . . . . . . . . . . . . . . . . . . 25Building an expert system from the visualization using visual data mining 27Comparison with the results using a traditional decision tree based data mining
approach . . . . . . . . . . . . . . . . . . . . . . . . . . . . . . 27An alternate axis ordering schema: Ordering based on the computer’s sequence
of interpretations . . . . . . . . . . . . . . . . . . . . . . . . . . 28The results with different search parameters, keywords, and search engine 29
V IMPROVEMENTS TO THE METHOD . . . . . . . . . . . . . . . . . . . 31
Beyond Single Sentence Correlations: Additional Proposed Visualizations 31Automated Keyword Selection . . . . . . . . . . . . . . . . . . . . . . . 34An Alternate Means Of Constructing and Assigning Meaning: Semantic
Taxonomy Branch Clustering . . . . . . . . . . . . . . . . . . . 34
v

Chapter Page
VI VISUALIZING INCONGRUITY: SHILLING WITHIN PRODUCT REVIEWSETS . . . . . . . . . . . . . . . . . . . . . . . . . . . . . . . . . . . . . . 38
An Experiment Using Toy Data Simulating Shilling . . . . . . . . . . . 38
VII OTHER USES OF THE VISUALIZATION STRATEGIES . . . . . . . . . 43
Detection of Shifts In Emotion . . . . . . . . . . . . . . . . . . . . . . . 43
VIII CONCLUSION . . . . . . . . . . . . . . . . . . . . . . . . . . . . . . . . 51
IX APPENDIX ONE: JOKES AND NON JOKES IN CONDENSED FORM . 53
Jokes . . . . . . . . . . . . . . . . . . . . . . . . . . . . . . . . . . . . 53
REFERENCES CITED . . . . . . . . . . . . . . . . . . . . . . . . . . . . . . . . . 57
vi

LIST OF TABLES
Table Page
vii

LIST OF FIGURES
Figure Page
1 Collocated Paired Coordinate Plot of Meaning Context Correlation Over Time.The set of jokes and non jokes plotted as meaning correlation over time usingcollocated paired coordinates. . . . . . . . . . . . . . . . . . . . . . . . . . 21
2 Second Endpoint Only. The correlation coefficients given P2. . . . . . . . 22
3 Heat Map For Correlation Differences. Column A shows that the first meaninghas a higher correlation score than the second given the first part of the jokewhile Column B show that the second meaning Y has a higher correlation thanthe first meaning X in the second part of the joke. . . . . . . . . . . . . . . 24
4 Monotone Boolean Plot of Jokes and Non Jokes. Features from the data setof jokes and non jokes describing differences of correlation given different meaningsand time steps plotted as Boolean vectors . . . . . . . . . . . . . . . . . . . 26
5 Single Chain. Here one chain of monotonically increasing Boolean vectorsis isolated to establish a border between humorous and nonhumorous examplesin terms of features. . . . . . . . . . . . . . . . . . . . . . . . . . . . . . . 26
6 Visualization 1 and 3 with both orderings. On the left meaning X and Y arebased on the sequence which humans will interpret the meanings while on theright the meanings are ordered based on the computers sequence of interpetation
28
7 Visualization 1 and 3 with both orderings. On the left meaning X and Y arebased on the sequence which humans will interpret the meanings while on theright the meanings are ordered based on the computers sequence of interpetation
29
8 Visualizing Shifts in Different Meanings given Jokes With Multiple ContextualComponents Per Part. Correlation with the ’vehicle’ while the ’aquarium’ meaningdecreases. . . . . . . . . . . . . . . . . . . . . . . . . . . . . . . . . . . . 33
9 Time Series of Movie Review With The Introduction of Shilling. This figureshows the estimated sentiment probability scores for a time series of movie reviewsusing a Naive Bayes classifier. . . . . . . . . . . . . . . . . . . . . . . . . . 40
viii

Figure Page
10 Incongruity. When shilling occurs a number of false negative reviews are introducedwhich oppose the good. We see an incongruity form given the simultaneouspresence of the opposing class. . . . . . . . . . . . . . . . . . . . . . . . . 41
11 The happy/sad emotion classifier. Clearly it is too large to see at this view.The next figure will show just a section. . . . . . . . . . . . . . . . . . . . . 47
12 One particular branch path indicating sadness. . . . . . . . . . . . . . . . . 48
13 Emotion classification over time given an alternating series of happy and sadwritings. . . . . . . . . . . . . . . . . . . . . . . . . . . . . . . . . . . . . 49
ix

CHAPTER I
INTRODUCTION
This text describes the results of a several projects with the goal to visualize
incongruity and resolution. Incongruity and resolution are a core part of the theory
of humor but appear in many other places. We will first show the results of a study to
visualize humor in text which was successful and visually shows the resolution process.
Then we will look at a study to visualize shilling, or the entry of false reviews into a
product review set by a shiller, which ends up visually showing us what incongruity looks
like.
While many theories of humor agree that humor often involved the detection of
incongruities and their resolution the details remain vague and there is no agreed upon
theoretical framework which describes how these incongruities form and are detected
by intelligent agents [1]. Our project explored the use of text visualization for modeling
humor in text in process known as visual text mining, a subset of visual data mining [2]
[3]. In particular our approach visualizes shifts in meaning assignment over time as jokes
are processed when compared with non jokes. While this does not fully solve the problem
of modeling the specific mechanisms underlying humor, visualization and visual text
mining gives us one more data centric tool for detecting features associated with various
natural language phenomena Furthermore these approaches can be used to model and
detect many other phenomena where incongruities arise within text data.
This text will begin with a quick literature review. We will look look at incongruity-
resolution based theories of humor and then garden path humor in particular. We will then
look at different means of working with meaning with computers, and then a few projects
attempting to use computers to detect humor in text. We will then review some current
1

problems with the state of computational humor which we think could be addressed
through data visualization as well as traditional data mining techniques which let the data
tell its own story..
This text will then describe the development of the three visualization approaches
to model, detect, and classify sequential jokes involving shifts in the interpreted meaning
of some ambiguous word. This form of sequential joke has been referred to as a garden
path joke to differentiate it from other sequential jokes involving incongruity and
resolution which do not involve a shift from on interpretation to the next [4]. The three
approaches use a correlation based measure to assign meaning of ambiguous words given
the context of the ambiguous word in different parts of a surface level text and relations
associated with different meanings of that word as defined in an ontology as a deeper
level.
The first visualization shows how meaning correlation scores for two or more
opposing meanings are plotted as coordinates using an approach known as collocated
paired coordinates [5]. This lets us visually see shifts of meaning associated when given
a set of jokes when compared with a set of non jokes which is equivalent to the resolution
process where meanings assignment is switched. The next visualization uses heat maps
to color code the differences of meaning correlation scores given different time steps.
The heat maps for the set of jokes is distinguishable from that of non jokes with respect
to these meaning correlation differences. Finally the third visualization displays in two
dimensions an entire model space consisting of boolean vectors describing meaning
correlation over time. The set of jokes and non jokes are plotted on this space allowing
us to see the boundary between what is a joke and non joke. To show the power of this
approach we compare the results with traditional data mining approaches which result
in models describing the same key features. This text describes all three approaches in
2

detail, including the construction of an informal ontology using web mining to identify
semantic relations, and shows how these approaches were used to visualize jokes and non
jokes to get experimental results. We then present a fourth visualization which extends
this approach to use with more complex jokes where multiple correlation might form
in each part of text. Following this we will discuess some other improvements to this
method including a different means of establishing and assigning meaning which was
developed based on unsupervised learning and ways of automatically selecting keywords
to use in search queries for meaning disambiguation.
Whereas the first visualization process shows us what resolution looks like, the
next will visualize incongruity as we shift our focus to a study of shilling. Shilling occurs
when a shill leaves fake reviews for some gain which createi incongruities within product
review sets. We will look at the results of a small toy project involving the simlation
of shilling within a movie review time series where combine sentiment analysis with
visualization to visualize these incongruities which arise when shilling occurs.
We will present the results of a study to visualize shifts of emotion found within
the toy diary of a bipolar patient. This is another phenomena showing shifts between two
polar and mutually exclusive classes.
Finally we will conclude with a discussion of our overall findings where we discuss
the shape of incongruity.
3

CHAPTER II
LITERATURE REVIEW
A number of attempts have been made to explore and model humor using
computers, most of which can be found within the growing field of Computational
Humor. These approaches are very diverse in that they build on different theoretical
foundations, look at different subtypes of humor, take different approaches to modeling,
vary in their degree of detail, and are used for to solve isolated tasks. The goal of this
project is to model and detect instances of sequential humor involving the formation of
incongruity and resolution over time in a sequential fashion which this literature review
will focus on. We will first describe Incongruity-Resolution based theories of humor,
second we will look at different theories of humor which specifically focus on sequential
humor such as forced reinterpretation, frame shifting, and garden path humor, third we
will look at several computational techniques used to represent and work with meaning
using computers, and finally we will discuss some recent approaches to modeling
sequential humor using computers which led to viable results. What we have found is
not that the models used experimental and diverse but no approach has made use of text
visualization.
Incongruity Resolution Theory
One predominant theory of verbal humor states that humor is triggered by the
detection and resolution of semantic incongruities that arise during communication. The
dictionary defines ’incongruous’ as lacking harmony of parts, discordant, or inconsistent
in nature. Semantic incongruities form when a reader’s interpretation of some concept
4

conflicts with other possible interpretations. Suls [6] coined the term ’incongruity
resolution’ which is the terminology we will use.
Take for example the following joke:
Two fish are in a tank. One looks to the other and asks how do you drive this thing?
When a reader initially reads it in the tank is interpreted as an aquarium.When
additional information is presented an alternative interpretation arises, that of a vehicle.
Some form of resolution process occur to deal with this contradiction.
Theorists argue though as to how these incongruities arise and are resolved. Over
the years other theorists have coined other terms as they try to work out the specific nature
of incongruity and resolution as it applies to humor from cognitively, sociologically, and
linguistical viewpoints. These include Semantic-Script Theory of Humor and Ontological
Semantic Theory of Verbal Humor [7] and Theory of False Fuzzy Causation [8]. They
have also identified many subtypes of humor involving incongruity and resolution. In this
thesis we are focused on sequential humor, where a incongruity arises and then is resolved
in a sequential manner, and in particular a pattern of sequential humor involving what is
called the garden path mechanism [4].
Opposition
The concept of opposition arises when workingn with incongruity Incongruities
often arise when ’opposing’ elements simultaneously occur. One way of describing them
are as mutually exclusive classifications. If you are happy then you are not sad, if it is
summer then it is not winter, and if the word ’tank’ indicates of ’vehicle’ then it does not
indicate an ’aquarium. Raskin used the term ’opposition’ when he developed the concept
of ’script opposition’ but the concept has been described in other manners before and
since then. Often when things oppose there is a form of negative correlation with respect
5

to some subset of features. For example when it is summer you would go sunbathing
more often but less often in the winter while you would go skiing less often and vice
versa. Emotions such as happiness and sadness oppose - when you are happy you are
more likely to smile and less lilkely to frown. If a product is good then it is not bad.
Garden Path Humor
This paper will focus on a particular humor subtype where there is a shift from
some interpretation to some opposing other. Dynel calls these jokes ”garden path”
jokes using the garden path metaphor of being misled [4], while other theorists use
the terminology of ’forced reinterpretation’ and ’frame shifting’ [1]. These jokes are
sequential in nature and describe a certain pattern of incongruity and resolution. With a
garden path joke a reader establishes some interpretation A as they read the first part of
a joke, the setup, but given new evidence included in the second part, the punchline, they
must discard this interpretation and establish a new interpretation B. Our visualizations
show this shifting process along with the incongruity.
Representation of Meaning
The computational representation and manipulation of meaning is essential
for language processing tasks including humor detection. There are no agreed upon
approaches to this and the approaches currently use tend to be of a heuristic and limited
nature. To truly pass a turing test for humor detection we not only need to detect the
meaning of words and phrases but perform complex tasks of inference and reasoning.
We do not solve this problem and limit the experiments in this thesis to jokes requiring
no complex processes of inference. We do require a semantic model which can perform
surface level lexical disambiguation so have chosen to use a model utilizing distributional
6

semantics. Computational models inspired by distributional semantics have been shown
to work for basic tasks such as lexical disambigutation [9]. In this section we will briefly
discuss the distributional hypothesis.
The distributional hypothesis is a linguistic theory that similar meanings will have
similar contextual distributions [10]. That is, if a meaning is the same you will find it in
the same contexts. For example the meaning for the word ’tank’ which is that of a fish
tank will be found in the same context as ’aquarium’. They will both co-occur at higher
than normal frequency with words such as ’gallon’, ’water’, ’guppies’, and so on. The
visualizations introduced later will make use of this in that there will be a correlation of
contextual frequencies given words with the same meaning.
There have been many computational models which make use of distributional
semantics and vary in degrees of complexity. Most of them work with vectors of word
frequencies given words which co-occur with different words given a large corpus of
natural language data. Some of these such as latent semantic analysis (LSA) will perform
some type of dimensionality reduction . Others utilize special techniques for extracting co
occuring keyword frequencies from document sets such as the term-frequency to inverse
document frequency (TF-IDF) approach which adjusts for the fact that some words just
happen to appear more frequently in a document set [11]. The approach we use is very
simple one which uses a target web search, making use of special keyword sets associated
with specific meanings, use a TF-IDF approach to establish co-occuring web frequencies,
and then look only at the top frequencies to reduce noise.
Computational Humor
A number of attempts have been made to explore and model humor within text
using computers. Some approaches make use of a joke templates (in a typical generative
7

approach words are fit into specific sentence patterns), while others are less restricted and
designed to work with any joke format. Some approaches attempt to generate jokes and
other to recognize them, a considerably harder task. Finally they differ in the depth and
nature of the underlying model. Some models only work with surface level features while
others utilize ontologies and deep semantic processing capabilities to extract meaning
from text or generate jokes. Overall these approaches are diverse and disjointed. This
section will describe several of these recent attempts..
Raskin and Taylor have seen considerable success in template free detection
of jokes with the implementation of systems described in the Ontological Semantic
Theory of Verbal Humor. They developed a robust system for extracting text meaning
representations from text The program has access to an ontology, describing how the
world works, a database of name and historical facts, and a semantic analyzer that uses
grammatical and semantic rules to parse meaning. Their ontology though is mostly hand
constructed. We are interested in automated approaches to ontology developmen, some of
which may reflect how the human mind learns to store and communicate meaning more
accurately.
Others have engaged in a number of projects using different experimental designs.
Since Computational Humor is a new field with great experimental capacity these
researchers work from a diverse variety of theoretical backgrounds.
Working within the framework of the Semantic-Script Theory of Humor [7],
Labutov and Lipson [12] modeled incongruity based on the idea of script opposition.
In their model a script is a path through a semantic network, and potential humor when
cycles form. Divergence, that is having multiple paths to go down to get from one point to
another is proposed as a key component to humor. A template based approach is used
8
to insert elements of the script into a text and generated several humorous instances
according to a survey.
Strapparrava and Mihalcea [?] took a data analysis/mining approach, analyzing a set
of joke setups and punchlines, focusing mostly on features related to semantic similarity.
Each entry in the data set has one joke setup, and then a number of possible punchlines of
which only one was humorous and the rest chosen as normal non-humorous followups.
An underlying hypothesis was that the punchline would be unexpected, leading to the
use of similarity metrics. They used both corpus based and knowledge based metrics for
similarity. They also include a explored a number of other features including measures
of polysemy, alliteration, and features resulting from latent semantic analysis of the joke
set. We use a data mining approach but work with correlation of meaning given meaning
vectors.
Petrovic and Matthews [13] developed a program for generating jokes of the form I
like my X like I like my Y, Z using corpus-extracted word relation metrics. In order to be
considered as a possible joke, using their template, several conditions had to be met. First,
X and Y are nouns while Z is an adjective. Second, Z must describe both X and Y. Third,
Z should be rare. Fourth, Z is often polysemous with multiple words senses. Finally, X
and Y should be dissimilar. According to their results, 16 percent of all automatically
generated statements matching these criteria were found to be humorous. In this study
we have a similar situation where a pair of elements involved in the incongruity should
oppose.
Data Visualization And Humor
The approach we proposed was to develop visual data mining techniques for
visualizing humor within text, that is the visualization of incongruity and resolution
9

within natural langauge texts. To our knowledge our project is the first attempt to
visualize incongruities within text.
10

CHAPTER III
PROBLEMS
There are a number of problems still to be solved within the domain of
computational humor.
First at this point a Turing Test for humor recognition would not be passed. This
is partially due to the heuristic and limited nature of models used which lack the ability
to perform complex inference and have limited knowledge bases. This is true even with
short jokes, which almost all studies have focused on, let alone longer and more complex
jokes.
Second, no incongruity-resolution based model of humor has been established that
describe how incongruities are detected by the brain. Current researchers take different
approaches to modeling and start with different underlying theoretical viewpoints. To
resolve these issues new approaches to modeling humor in text should be tried, ones
which are more data centric and let the data tell its own story such as visual data miining.
Next, the garden path subtype of incongruity-resolution based jokes remains a
unexplored phenomena on its own. Some researchers blindly look at a mix of joke
subtypes, including other sequential joke subtypes other than garden path jokes. Modeling
of garden path jokes may require other approaches than a mixed bag other subtypes on
their own.
Our solution is the use ofvisualization to identify features which let us differentiate
between jokes and non jokes, in particular those of the garden path joke subtype, and
from them build models. In the next section we will describe the use of visualization to
identify model features in various ways, from visualization of the semantic shifts which
11

occur in text to visualization of entire model spaces which allows us to quickly explore
various models.
12

CHAPTER IV
OUR APPROACH
This chapter describes our approach. Parts of this section have been published in
[14] and [15].
Establishing Meanings and Meaning Correlations
We chose a vector representation of meaning based on the frequency at which
different words occur in the context of some target word. This is a standard approach
taken by a number of researchers in the past for dealing with meaning [16]. These vector
of word associations form an informal ontology describing entities and their relations.
The material used to build these vectors was retrieved via a web search. Below we
consider some ambiguous word A with a number of possible meanings AM1...AMn and
different parts of some text P1...Pm containing the ambiguous word A.
Establishing vectors of word association frequencies using a web mining approach
For each meaning AMx we establish a set of disambiguating keywords K(AMx)
which uniquely identify that meaning. While we hand chose our keyword sets these can
be established using a variety of resources such as wordnet.
Next we use K(AMx) as a query for a search engine retrieve the top n documents.
Let D(q, n) be a search function which retrieves n documents relevant to some query q.
The resulting document set for some meaning AMx is thus designated D(K(AMx), n).
Finally we compute frequencies of all words occuring within distance j of A
given the document set D(K(AMx), n). We designate this F (A, j,D(K(AMx), n)))
where F is a function that returns a vector of word frequencies. In this paper F uses the
13

term-frequency to inverse document frequency approach (TF-IDF) to establishing word
frequencies [11]. F (A, j,D(K(AMx), n))) represents the meaning for AMx as a set
of word association frequencies or in other words its contexts. These frequencies are
ordered by the lexicographic order of the words. Note that we include the frequency of
the given word A itself though have experimented with variants which do not include the
ambiguous word.
In a similar fashion we established semantics for the ambiguous word A given the
different parts P1...Pm of some text containing A. We denote them as F (A, j,D(P1, n))...
F (A, j,D(Pm, n)).
Calculating correlation coefficients
We are interested in how the meaning of A given a search for some phrase Px
correlates with the meaning of A given the meaning established for each word sense
AM1...AMn.
We compute the correlation coefficient given the vector of word frequencies
associated with A given a search for some part of text Pi, that is F (A,D(Pi, n), and
the vector of word frequencies associated with a search for some meaning AMx, that
is F (A, j,D(K(AMx), n), using a function C which return the correlation. In our
case we use Pearon’s correlation coefficient given two vectors. We denote these Ciy =
C(F (A, j,D(Pi, n)), F (A, j,D(K(AMy), n))).
All of the jokes in our data set are two part jokes in which two meanings are
invoked. Given two meanings of some ambiguous word A and some statement with parts
P1 and P2 that refer to A, we calculate the following correlation scores:
Given P1 (part one of some text):
14

C1x = C(F (A, j,D(P1, n)), F (A, j,D(K(AMx), n))) is a correlation of meaning
AP1 with meaning AMx,
C1y = C(F (A, j,D(P1, n)), F (A, j,D(K(AMy), n))) is a correlation of meaning
AP1 with meaning AMy,
Given P2 (part two of some text):
C2x = C(F (A, j,D(P2, n)), F (A,D(K(AMx), n))) is a correlation of meaning
AP2 with meaning AMx,
C2y = C(F (A, j,D(P2, n)), F (A,D(K(AMy), n))) is a correlation of meaning
AP2 with meaning AMy.
Calculating correlation coefficient differences given different parts of text
Finally we calculate differences between the correlation coefficients which
are useful for joke classification as they describe g correlation movement patterns.
For example the difference between C1x and C1y tells us which meaning has greater
correlation given P1, the first part of the joke, while the difference between C1x and C1y
tells us which meaning has greater correlation given the second part . If C1x − C1y > 0
then this meaning meaning x is greater than meaning y given part one. On the other hand
the difference between C1x and C2x tells us if a correlation coefficient for some meaning
has increased or decreased given part on or part two of some text. If C1x − C2x > 0 then
the correlation of meaning x has decreased as the text is read in while if C1x − C2x < 0
then it has increased.
We calculate the differences between C1x, C1y, C2x, and C2y. The difference
C1x − C1y shows which meaning correlates higher given the first part of text, C2x − C2y
shows which meaning correlates higher given the second part of text, C1x − C2x shows
if meaning X correlates higher in the second part of text compared with the first, and
15

C1y − C2y shows if meaning Y correlates higher in the second part of text compared with
the first.
Building Features from correlation coefficient differences given different time steps
We then define four Boolean variables x1 − x4 using these differences:
x1 = 1 If C1x > C1y, else x1 = 0
x1 = 1 means the correlation with meaning X is greater than meaning Y given the
first part of the text.
x2 = 1 If C1x > C2x, else x2 = 0
x2 = 1 means the correlation with meaning X decreased going from part one to part
two of the text
x3 = 1 If C1y < C2y, else x3 = 0
x3 = 1 means the correlation with meaning Y increased going from par tone to part
two of the text
x4 = 1 If C2x < C2y, else x4 = 0
x4 = 1 means the correlation with meaning Y is greater than meaning X given the
second part of the text.
Example
Take a two-part garden path joke J with the parts P1 = fish in tank and P2 = they
drive the tank that contains the ambiguous word A = tank. Let tankM1 and tankM2 be
the two meanings invoked at different points while reading J, that of an aquarium and that
of a vehicle.
P1=fish in a tank.
P2=drives the tank
16

K(tankM1) = [aquarium, tank]
K(tankM2) = [vehicle, panzer, tank]
This is a distilled example of the fishtank joke presented in the section 3. In order to
concentrate on the issue at hand, i.e. visualizing incongruity and resolution, we reduced
many jokes to simplified form.
We establish vectors for the various meanings of tank using data from searches
for P1, P2, K(tankMx) and K(tankMy) and then calculate the correlation coefficients
between these meaning vectors. The meanings for ’tank’ found in P1 and P2 may or may
not be the same as M1 and M2. According to the distributional hypothesis, which states
that similar meanings will have similar contexts, if they are the same then there should be
correlation of context. The correlation of context can be found by comparing the vectors
of word associations we extracted via web mining.
Frequent words near ’tank’ given a search for ’A fish in a tank.’ include
(fish,0.328), (clean,0.094), (size,0.092), (water,0.088), (mates,0.059), (aquarium,0.053),
(gallon,0.034) etc
Frequent words near ’tank’ given a search for ’Drives the tank.’ incldue
(drive,0.125), (driving,0.111), (battle,0.068), (main,0.057), (war,0.052), (light,0.045),
(world,0.041) etc
Frequent words near ’tank’ given a search for ’Aquarium tank’ include (fish,0.369),
(aquarium,0.270), (gallon,0.151), (led,0.117), (kit,0.109), (giant,0.083), (ocean,0.083) etc
Frequent words near ’tank’ given a search for ’Vehicle tank’ include (gas,0.076),
(battle,0.073), (main,0.061), (war,0.051), (fuel,0.048), (light,0.045), (world,0.040) etc
We would expect that the first vector, given a search for the first part of the joke,
should correlate with the third vector while the second vector, given a search for the
17

second part of the joke, should correlate with the fourth. So we calculate meaning
correlations.
Meaning correlation coefficients given P1:
C1x = C(F (tank, 5, D(fish in a tank, 10)), F (tank, 5, D([aquarium, tank], 10))) =
0.824
C1y = C(F (tank, 5, D(fish in a tank, 10)), F (; tank, 5, D([vehicle, panzer, tank], 10))) =
0.333
Meaning correlation coefficients given P2:
C2x = C(F (tank, 5, D(drives the tank, 10)), F (tank, 5, D([aquarium, tank], 10))) =
0.389
C2y = C(F (tank, 5, D(drives the tank, 10)), F (tank, 5, D([vehicle, panzer, tank], 10))). =
0.573
Over the course of a garden path joke there should be a switch in dominant meaning
correlation coefficient. Given the first part correlation with meaning X should be greater
and given the second part correlation with meaning Y should be greater.
Data Set used in Visualizations
We collected two part jokes of garden path form containing lexical ambiguities
and converted them into a simple form by hand as we want to model incongruity rather
than focusing on other issues related to parsing text. Algorithmically selecting relevant
parts of text P1 and P2 from longer texts that contain a lot of additional material is a
valid approach but outside the scope of this research. Thus material not relevant to the
interpretation of the ambiguous lexical entity was removed. Thus Two fish are in tank
becomes a fish in a tank. as the number of fish has little to do with the lexical ambiguity
involed in the incongruity we are attempted to model. In order to focus on developing
18

means of visualizing text we let meaning X to be the meaning indicated in the first part of
the text and meaning Y to be the secondary meaning.
For each joke we created a non joke of similar form. It contains the same first
part but a different non-humorous second part. We strove to change as little as possible,
usually only a noun or verb, to preserve the structure of the statement. The following are
some examples of jokes and non jokes contained in the data set.
Joke1:
P1: Two fish are in a tank.
P2: They drive the tank.
NonJoke1:
P1: Two fish are in a tank.
P2: The swim in the tank.
Meaning X search query: Aquarium tank
Meaning Y search query: Panzer tank
Joke2:
P1: No charge said the bartender..
P2: To the neutron.
NonJoke2:
P1: No charge said the bartender.
P2: To the customer.
Meaning X search query: Cost charge
Meaning Y search query: Electron charge.
19

Visualization Approach 1. Collocated Paired Coordinates
Our first visualization uses a visualization technique known as collocated paired
coordinates [5]. Given some ambiguous element with multiple possible meanings, we
plot meaning correlation scores established given a part of text and the various meanings
as points on a coordinate graph. The Y axis measures the correlation with meaning Y,
while the X axis measures the correlation with meaning X. Each part of text in a sequence
results in a point and these points are connected with arrows representing time. This
allows us to visualize correlation patterns over time. A garden path jokes which involves
a shift from one meaning to the next should form a line moving away from one axis and
towards another as the meaning correlation score for one meaning lessens and another
meaning increases. In our visualization we set the X axis to measure correlation with the
meaning invoked by the first part of the text and the Y axis to measure the correlation
with second meaning invoked in the second part of text so that the arrows should all move
in the same direction as a meaning shift occurs.
Visualization overview:
For P1 and P2 we plot the meaning correlation coefficients given two opposing
meanings for some ambiguous word with AMx and AMy as points:
The X axis represents correlation with some meaning AMx.
The Y axis represents correlation with some meaning AMy
1. Plot a point representing the meaning correlations given P1.
2 . Plot a coordinate representing the meaning correlations given P2.
3. Connect via an arrow indicating time.
4. Color-code green if humorous, red if not, and black if unknown.
20

FIGURE 1: Collocated Paired Coordinate Plot of Meaning Context Correlation OverTime. The set of jokes and non jokes plotted as meaning correlation over time usingcollocated paired coordinates.
Discussion
While there are some examples which fail to match the pattern, it is clear that most
jokes involve a shift away from correlation with one meaning and towards the second
meaning given part two of the joke. Fig. 1 shows this as the green arrows, representing
jokes, move from one axis to another while the red arrows tend to stay closer to the
original meaning as there is no meaning change. An analysis of the handful of cases that
do not follow this pattern indicates explainable circumstances such as the web search
21

FIGURE 2: Second Endpoint Only. The correlation coefficients given P2.
returning irrelevant documents due to things like a poor choice in keywords or semantic
noise. Methods such as dimensionality reduction including latent semantic analysis
may help with this. Fig. 2 only looks at the meaning correlation coefficients given P2
which clearly shows that there is higher correlation with meaning Y which opposes some
meaning X that was initially established.
Visualization 2: Heat Maps
Visualization Overview: In the previous visualization we saw that there is a shift
from one meaning correlation being higher to the opposite. To test this intuition we make
use of heat maps based on differences in correlation coefficient values given the different
22

meanings and different parts of text. With this approach we can identify potential features
that distinguish jokes from non-jokes, assisting in model discovery.
Visualization Algorithm:
1. Organize the correlation coefficient differences as established in Section 4.3 in a
data frame along with classification of being a joke or not.
2. Color code the correlation score differences based on value.
3. Sort the rows into groups by classification, that is into two groups of joke and
non joke.
4. Identify regions of the heat map where there is a distinguishable difference
between the joke and non joke sections in terms of color.
23

FIGURE 3: Heat Map For Correlation Differences. Column A shows that the firstmeaning has a higher correlation score than the second given the first part of the jokewhile Column B show that the second meaning Y has a higher correlation than the firstmeaning X in the second part of the joke.
Discussion
While this heat map only uses three colors when color coding correlation
coefficients by value, clearly we can identify areas where the joke data set differs from the
non joke dataset. Lets look at the column representing the difference between C2x − C2y .
In Fig. 3 this is the column indicating the difference between correlation with meaning X
24

and meaning Y given the second part of the joke. If this value is less than 0 then meaning
Y is greater given P2, if it is greater than 1 then meaning X remains dominant. While we
already expected this to happen, the heat map would allow us to automatically identify
this value as being a distinguishing feature between classes.
Visualization 3: Visualizing a model space using monotone boolean chain
visualizations
In the last viusalization we use a two-dimensional representation of Boolean space
based on the plotting of chains of monotonically increasing Boolean vectors [17] to
visualize the difference between garden path jokes and non jokes. Vectors are arranged
according to their norm, with the all true Boolean vector at one end of the plot and the all
false vector at the other. The arrangement of the vectors form chains where monotonicity
is preserved, that is as each succeeding vector in the chain is the same as the last except
has an additional bit set to one. Each chain describes the change in features. The chains
altogether represent a model space based on the Boolean features x1...x4 derived from the
meaning correlation coefficient differences described in section 4.4.
Visualization overview:
1. For each joke/nonjoke establish a vector of Boolean values as described in
section 4.4.
2. Establish and visualize a 2D Boolean space representation as described in [17].
3. Plot vectors established each joke or non-joke as a dot on the Boolean plot.
4. Color code the dot as green if humorous, red if not humorous.
Fig. 4 and 5 show the resulting visualization using our data set.
25

FIGURE 4: Monotone Boolean Plot of Jokes and Non Jokes. Features from the data setof jokes and non jokes describing differences of correlation given different meanings andtime steps plotted as Boolean vectors
FIGURE 5: Single Chain. Here one chain of monotonically increasing Boolean vectors isisolated to establish a border between humorous and nonhumorous examples in terms offeatures.
Discussion
Jokes and non jokes can be converted to a vector of Boolean values representing
the presence or lack of various features in a such that we can visually distinguish and
establish a border between the two classes of humorous and not humorous. By looking
at a chains of Boolean vectors that contains examples from each class, each vector
containing one additional feature, we can clearly see where non-humorous texts end and
humorous ones begin in terms of model features. When looking at chain as shown in Fig.
5 we see that the key difference is the Boolean value which indicates that some second
meaning correlated higher than the first given the second part of the text.
26

Building an expert system from the visualization using visual data mining
We have now visualized the jokes and nonjokes in such a way that we can now
build a model. Through a visual inspection of the monotone boolean chain plot we see
that jokes fall within areas where the last boolean value is one.
The rules of the system are thus:
If C2x − C2y < 0 then the class is humorous.
Comparison with the results using a traditional decision tree based data mining
approach
Our analysis of visualizations generated using humorous and non humorous data
sets can be compared with the results using traditional data mining approaches. In
particular we used a C4.5 decision tree algorithm which resulted in a model indicating
the same key features involving changes in meaning correlation as our visualization show.
Resulting C4.5 model:
IfC2x − C2y < 0.0075 then class= joke (89.4% of 19 examples) IfC2x − C2y >=
0.0075 then class= nonjoke (100.0% of 15 examples)
The C4.5 decision tree results in one key splitting feature which is the same which
we found through the visual data mining process. Given a two part garden path joke
involving a lexical ambiguity where some meaning for an ambigous word is implied in
the first part of the text, another alternate meaning shows higher correlation given the
second.
27
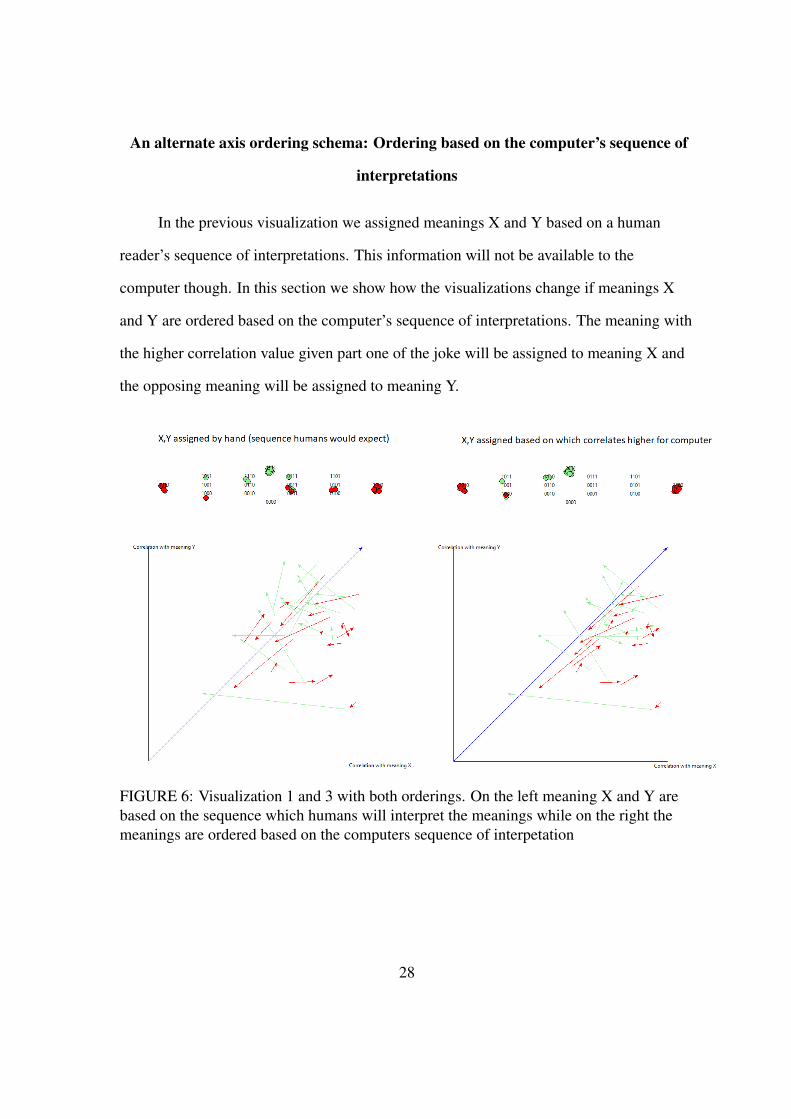
An alternate axis ordering schema: Ordering based on the computer’s sequence of
interpretations
In the previous visualization we assigned meanings X and Y based on a human
reader’s sequence of interpretations. This information will not be available to the
computer though. In this section we show how the visualizations change if meanings X
and Y are ordered based on the computer’s sequence of interpretations. The meaning with
the higher correlation value given part one of the joke will be assigned to meaning X and
the opposing meaning will be assigned to meaning Y.
FIGURE 6: Visualization 1 and 3 with both orderings. On the left meaning X and Y arebased on the sequence which humans will interpret the meanings while on the right themeanings are ordered based on the computers sequence of interpetation
28

Discussion
The addition of the rule which establishes which meaning to assign which axis
restricts our potential models. The first boolean value will always be one, thus we can
disregard a section of the model space. The rule restricts our model space and we can see
this as it moves data points out of that section.
The results with different search parameters, keywords, and search engine
The experiment was run a second time - this time with only 25 sites per search and
different keywords using the Google Api rather than Bing. Attached to this thesis is the
python scripts and data set used to create this visualization.
FIGURE 7: Visualization 1 and 3 with both orderings. On the left meaning X and Y arebased on the sequence which humans will interpret the meanings while on the right themeanings are ordered based on the computers sequence of interpetation
29

Discussion
With this second attempt we can see that a number of jokes did not cross the line
though you can clearly see the shift. The boolean vector (1,0,1,1) describes shift without
crossing the line and a considerable number of jokes plot there. Which model should we
use, the one where the is an explicit switch in classification or the one where there is just a
significant movement from one class to the other. Ensemble techniques may be interesting
by combining the visualizations in a weighted manner based on their accuracy.
30

CHAPTER V
IMPROVEMENTS TO THE METHOD
Beyond Single Sentence Correlations: Additional Proposed Visualizations
The way correlation with meaning is handled in this data set can be improved since
each part of some text may have multiple elements which interact from the ambiguous
word in different ways. In collaboration with Boris Kovalerchuk and inspired by the
previous visualizations a new visualization was developed which takes into account more
complex texts. This visualization also lets us look at shifts with respect to more than two
meanings which lets us visualize significantly more data with respect to a joke or non
joke.
VIsualizing Shifts in Meaning Given Parts of Text with more than one contextual
component
Consider a two part text J.
Each part of text Pi contains some ambiguous word A and two contextual elements
Pi1 and Pi2. Let M1...Mn be the different meanings of A. Example: A fish in a saltwater
tank. Drives the wartime tank.
A: tank
M1: vehicle
M2: aquarium
P11: A fish in
P12: saltwater
P21: drives the
31

P22: wartime
For each part of the text we use the web search approach to build meaning vectors
and calculate the correlation values for each contextual component separately. For
example with the first part of the joke we do web search for a fish in a tank and calculate
the correlation values for the different meanings and then do the same with a tank full of
water. We end up with:
Part one of the joke and meaning 1:
C(P11,M1) = C111 C(P12,M1) = C121
Part two of the joke and meaning 1:
C(P21,M1) = C211 C(P22,M1) = C221
Part one of the joke and meaning 2:
C(P11,M2) = C112 C(P12,M2) = C122
Part two of the joke and meaning 2: C(P21,M2) = C212 C(P22,M2) = C222
Visualization
1. Designate the X axis to be the correlation value established using the first
contextual component and the Y axis to be the correlation value established using the
second contextual component.
2. Plot correlation values with respect to meaning 1 given the first part of a text as a
point.
3. Plot the correlation values with respect to meaning 2 given the second part of the
text as a point.
4. Connect the points via a line with an arrow indicating time. Results using the
humor exploration website to calculate correlation scores.
The resulting visualization:
32

FIGURE 8: Visualizing Shifts in Different Meanings given Jokes With MultipleContextual Components Per Part. Correlation with the ’vehicle’ while the ’aquarium’meaning decreases.
Discussion
While the fishtank joke is an ideal candidate for this type of visualization we have
shown potential for this new approach. The beauty of this approach is that we can now
deal with more than two meanings aside from dealing with more complex jokes. We can
add a third arrow for septic tank and a fourth for gas tank and so on.
33

Automated Keyword Selection
We chose keywords by hand, ones which were representative of the different
meanings, but this is not always possible as there are thousands of words in common
use. There are a number of methods which could be used to automatically generate the
keywords needed to do a disambiguated web search to find document sets. One option
are formal and informal ontologies such as Wordnet or OpenCyc. For each word sense
wordnet can give you hypernyms and hyponyms, for example the vehicle variant of the
word tank has hypernym sets including ’panzer’. We tried out the fishtank joke using the
dictionary entries for ’aquarium’ and ’tank (vehicle)’ and got the same results as using
hand selected keywords so it is possible.
An Alternate Means Of Constructing and Assigning Meaning: Semantic Taxonomy
Branch Clustering
Problem: Usage of semantic context requires an ontology; in our case web mining
is used to establish relations between objects. The problem is that we are trying to
deal with inherently ambiguous words thus a web search will result in document sets
representing different word senses. The technique used earlier in this paper makes use
of disambiguating keywords attached to a search query which allow us to search for
documents relevant to a specific word sense. In some cases we do not have a list of
disambiguating keywords for a word or even a dictionary entry given new trends.
Solution: Unsupervised learning can be used to cluster semantic data resulting
from a web search into meaningful and connected groups. Document clustering has been
explored extensively for topic modeling so we are attempting an approach which clusters
not documents but rather subtrees of a semantic taxonomy built using web mining. As
outlined in [1], recursive construction of a tree based semantic taxonomy using a targeted
34

web search approach really allows us to robustly explore different meaning components
in a targeted and isolated manner which reduces the amount of noise and topic mixture for
each branch of the taxonomy.
Given a tree based semantic taxonomy built using a web mining approach as
described in [1], we can cluster the semantic taxonomy subtrees into meaningful groups
representing word sense and usage.
We use the approach described in [1] to build a tree based semantic taxonomy with
a depth of 3. The root is an ambiguous word. 15 initial branches represent high frequency
bigrams associated with different word senses. Each branch recursively branches 5 ways.
Leaves consist of the top 40 keywords given a search for a keyword string formed from
the branch path starting at the root.
The resulting 75 leafs keyword sets were then clustered using k-means clustering. I
am clustering leaves for now, but whole subtrees could be clustering. I am doing this for
time constraints as I could have recursively kept building subtrees but it takes awhile.
Result
Below is a printout of the top four clusters primary keyword sets. We print all
keyword which have a centroid value greater than 0.2. We then labeled the clusters by
hand.
Cluster number 1 tank top
Significant keywords:// tank, new, top, colors, lace, print, crochet, tops, front,
back, neck, shirt, cotton, long, see, size, sleeveless, nursing, basic, nursing nursing,
muscle, added, neckline, white, shop, men, graphic, clothing, related, black, dressy,
loose, swim, style, fit, gym, plus size, plus, comfort, color, colored, wholesale, tunic,
tops wholesale, tops tops, comfort tops, colored tops, cheap, hem, size tunic, striped,
35
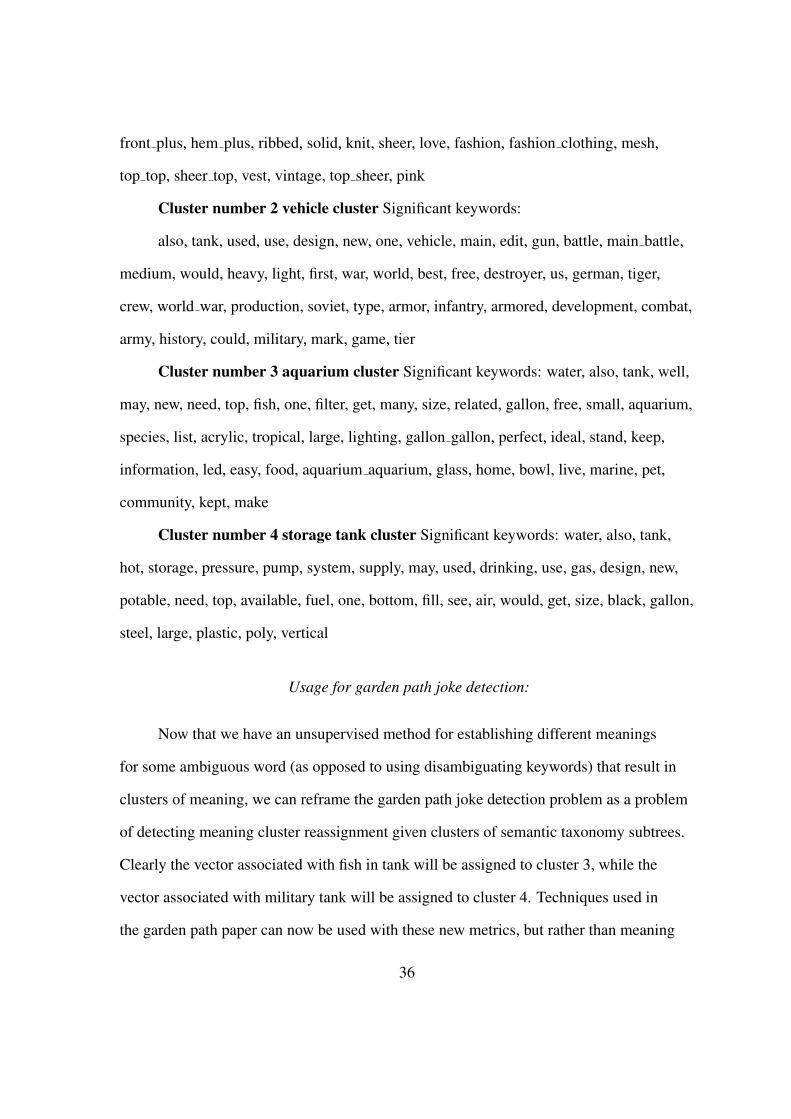
front plus, hem plus, ribbed, solid, knit, sheer, love, fashion, fashion clothing, mesh,
top top, sheer top, vest, vintage, top sheer, pink
Cluster number 2 vehicle cluster Significant keywords:
also, tank, used, use, design, new, one, vehicle, main, edit, gun, battle, main battle,
medium, would, heavy, light, first, war, world, best, free, destroyer, us, german, tiger,
crew, world war, production, soviet, type, armor, infantry, armored, development, combat,
army, history, could, military, mark, game, tier
Cluster number 3 aquarium cluster Significant keywords: water, also, tank, well,
may, new, need, top, fish, one, filter, get, many, size, related, gallon, free, small, aquarium,
species, list, acrylic, tropical, large, lighting, gallon gallon, perfect, ideal, stand, keep,
information, led, easy, food, aquarium aquarium, glass, home, bowl, live, marine, pet,
community, kept, make
Cluster number 4 storage tank cluster Significant keywords: water, also, tank,
hot, storage, pressure, pump, system, supply, may, used, drinking, use, gas, design, new,
potable, need, top, available, fuel, one, bottom, fill, see, air, would, get, size, black, gallon,
steel, large, plastic, poly, vertical
Usage for garden path joke detection:
Now that we have an unsupervised method for establishing different meanings
for some ambiguous word (as opposed to using disambiguating keywords) that result in
clusters of meaning, we can reframe the garden path joke detection problem as a problem
of detecting meaning cluster reassignment given clusters of semantic taxonomy subtrees.
Clearly the vector associated with fish in tank will be assigned to cluster 3, while the
vector associated with military tank will be assigned to cluster 4. Techniques used in
the garden path paper can now be used with these new metrics, but rather than meaning
36

correlation we can use distance to cluster center and look at how those distances change
over time.
37

CHAPTER VI
VISUALIZING INCONGRUITY: SHILLING WITHIN PRODUCT REVIEW SETS
A ’shill’ is someone, often an company insider or someone who has something to
gain, who leaves false reviews for some item. ’shilling’ is the act of leaving these reviews.
Shilling can occur within product review sets at sites like Amazon.com, during political
elections, and is a serious problem on penny stock and cryptocurrency forums. When
shilling occurs an incongruity forms - one of sentiment. Positive and negative sentiment
generally oppose in that if something is rated high it will not be rated low. When false
reviews are left the incongruity forms when these oipposing classes exist simultaneously.
As a consumer you must perform some resolution process and decide to ubuy or not.
In this section we use similar forms of visualization that we used for humor to
show this incongruity forming. This time rather than plotting ’correlation’ of opposing
meanings we built a Naive Bayes classifier and plot on one axis the probability of being a
positive review and the other axis the probability of being a negative review.
An Experiment Using Toy Data Simulating Shilling
Data set Used
We generated a set of fake movie reviews by hand. The first six are positive
sentiment and then the next 6 alternate between positive and negative sentiment
simulating a shill.
38

The Visualization Process
1. Train a Naive Bayes classifier to predict the probability of the text being a
positive or negative sentiment text.
Training set used: movie reviews tagged with positive or negative sentiment
provided by the NLTK corpus library. [18]
2. For each review in the time series of fake movie reviews:
a. Use the classifier to generate a positive probability and negative probability
score.
b. Plot the probabilities as a point using the paired coordinates system but with the
addition of a Z axis representing time.
39

Resulting Visualization
FIGURE 9: Time Series of Movie Review With The Introduction of Shilling. This figureshows the estimated sentiment probability scores for a time series of movie reviews usinga Naive Bayes classifier.
40

FIGURE 10: Incongruity. When shilling occurs a number of false negative reviews areintroduced which oppose the good. We see an incongruity form given the simultaneouspresence of the opposing class.
Discussion
Clearly we see the reviews diverge in terms of sentiment. Additionally we see
two clusters form, one closer to one class and the other closer to the opposing class. If
a movie actually has mixed reviews there would be more mixture. In this case a bimodal
distribution forms. This divergence represents and incongruity. Whereas with the garden
path visualization we only see the resolution as we don’t visualize the stage of humor
where the meaing simultaneously exist, in this case we do visualize the incongruiy or
simultaneous existence of opposing classes.
One interesting thing to note is that we used a classifier to establish the class
probabilities. What type of distance measure we used or the inner workings of the
classifier do not matter as long as they work - what matters is the shifts and divergence
41

in sentiment over time. This is a useful way of visualizing phenomena involving patterns
of classification.
42

CHAPTER VII
OTHER USES OF THE VISUALIZATION STRATEGIES
Our project continued with further experiments visualizing incongruities beyond
those found in humor. In this section we will look at two of these experiments:
visualizing incongruities that form within movie review sets when false reviews are
introduced and visualizing the cyclic shifts of emotion given a bipolar author.
Detection of Shifts In Emotion
This sectin looks at another exploration of opposing classification and patterns
involving polar shifts. We looked at how the detection and visualization of shifts
in emotion over time detected within an authors writing can potentially be used for
bipolar detection. First this section will introduce a web mining strategy for obtaining
emotionally charged texts, second describe a context based classifier ensemble for
emotion detection built using the texts, third and finally will demonstrate its usage
for visualizing emotion shifts over time using a positive and negative emotion score
coordinate visualization approach toy diaries of bipolar and non bipolar authors
Polar emotion pairs: Emotions can often be grouped into pairings which are
communicate whether we are meeting or not meeting some need associated with some
internal state. Emotions form a motivational signaling system which both inform us as
to our internal need levels associated with some state and motivate us to take action to
meet those needs via positive and negative signals. These signals inform us when our
behaviors are or are not meeting our needs and guides the evolution of behavioral system.
For example when our food levels are low hunger motivates us to find food while satiation
tells us we are full. In this case study we will be looking at happiness and sadness levels
43

which are associated with overall meeting of needs and needs being unmet. One can
experience multiple emotions as long as they are associated with different internal states
and need levels and are not polar pairs.
Mutual exclusion of behaviors given polar emotions: Emotions which are
associated with the two poles of some internal need state tend to associate with mutually
exclusive behavior. When we are sad we do not engage in behavior when happy and vice
versa. Hypothetically there should be a negative correlation between behaviors given two
polar emotional states. Through finding orthogonal subsets of behavior we can model
differences in emotional state.
Emotional Incongruity and bipolar disorder: A temporal emotional incongruity
arises with a bipolar person. Due to differences in brain chemistry they will exhibit
polar opposites of behavior given similar contexts. They often cycle through positive and
negative moods. The informal hypothesis that temporal incongruity of emotion correlated
behavior arises as a bipolar patients cycles through emotional poles. We can test this
hypothesis visually using the algorithms used to visualize shifts in meaning presented
earlier in this thesis.
Detecting Shifts In Emotion:
This approach is similar to the one we used to detect shifts in meaning.
Rather than looking at some ambiguous word A at some ambiguous indicator of
emotion I . For example the words feel, mood, and emotion all indicate that some emotion
is being felt but without context the reader does not know which one.
Rather than AMx which we used to designate some meaning x for the ambiguous
word A will call designate IEx some emotion x for the ambiguous emotion indicator I .
44

Example: Take for example the word feel. In different emotional contexts you ’feel’
like doing different things. Thus:
I = feel
IM1 = happy
IM2 = sad
Web Mining
We mine the web for documents containing some target word within different
emotional keyword. For example we want to see what co-occurs with the word ’feel’
in different emotional contexts so we generate the folloing queries.
e1 = happy
e2 = sad
wx = feel
q(e1(wx)) = +happy +feel
q(e2(wx)) = +sad +feel
Visualizing shifts in emotion
Take for example the two part text:
P1 = I feel like laughing
P2 = I feel like crying
1. Mine the web for documents containing the target word ’feel’ along with
different emotion keywords to find documents relevant to different emotional contexts.
2. Extract frequencies at which words co-occur with the target word. For each
document we add a row to a table along with the target emotion label or class.
3. Train a classifier to predict the emotion.
45

4. Use this classifier to assign emotion scores for a series of texts.
5. Visualize these scores over time using a paired coordinates approach with respect
to two different polarly opposed emotions.
Our Classifier of Choice: Decision Trees
Using the count vectors describing n-gram co-occurrence given a search for target
phrases along with emotional disambiguators and emotion class labels we trained decision
trees using various approaches. Using the sklearn python libraries [19] we tried out
several decision tree induction algorithms with various parameters including max depth,
minimum leaf size, and n-gram width.
To choose a final classifier we used accuracy on a testing set which was not used
during training using a python script.
The best classifier scored 0.74 accuracy on the testing set using bigrams, a max
depth of 100 and a minimum leaf size of 2.
46

FIGURE 11: The happy/sad emotion classifier. Clearly it is too large to see at this view.The next figure will show just a section.
47

FIGURE 12: One particular branch path indicating sadness.
Third Step: Visualizing emotion assignment scores over time Visualizing patterns
of detected emotion over time given polar emotion pairs for exploration of bipolar
disorder using collocated paired coordinates with time as a third axis.
Data: Our data set is a hand written toy diary of a bipolar writer to show proof
of concept. There will be nuances in real world diaries but in order to focus on initial
algorithm development we chose. We wrote these entries without looking at the decision
tree model or n-gram sets.
ToyDiary:
d1 = [’feel bad’] d2 = [’feel good’] d3 = [’feel awful’] d4 = [’feel great’] d5 = [’feel
like crying’] d6 = [’feel like dancing’] d7 = [’feel sadness’] d8 = [’feel happiness’]
48
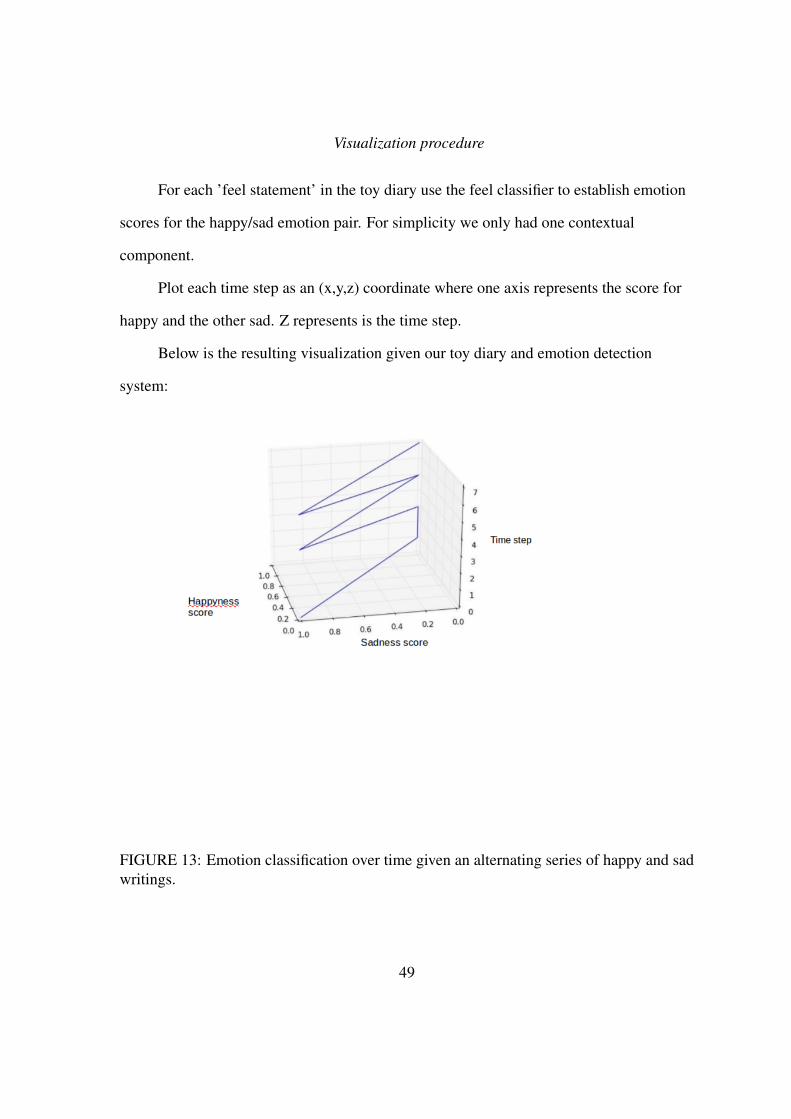
Visualization procedure
For each ’feel statement’ in the toy diary use the feel classifier to establish emotion
scores for the happy/sad emotion pair. For simplicity we only had one contextual
component.
Plot each time step as an (x,y,z) coordinate where one axis represents the score for
happy and the other sad. Z represents is the time step.
Below is the resulting visualization given our toy diary and emotion detection
system:
FIGURE 13: Emotion classification over time given an alternating series of happy and sadwritings.
49

Discussion
Whereas in the last section with shilling we plotted class probabilities as points that
span a range of possible values adding to one, the decision tree classifier only outputs 0
or 1. A more sophisticated technique could be devleoped which calculates the differrent
class leaf counts along the branch path to calculate scores for each class. It still shows
we can use this form of visualization to visualize patterns of classification over time
associated with phenomena involving shifting and resolution but no incongruity. We
see with the toy diary of the bipolar patient there is a cyclic pattern shifting from one
opposing state to the other whereas a depressive episode would look different.
50

CHAPTER VIII
CONCLUSION
Overall the results from this study show that visualization can be used as a valid
strategy for approaching the modeling and detection of humor within text as well as other
phenomena involving incongruities, characterized by the simultaneous presence of two
opposing classifications of state.
The shape of incongruity
Humor theorists argue about how incongruities are formed and resolved. The
garden path visualizations clearly shows the resolution that occurs but not the incongruity
itself as much as the shilling visualization. The incongruity forms when both meanings
are activated, just as with shilling the incongruity foirms when clusters of reviews of
opposing sentiment occur simultaneously. We propose that shilling visualization represent
incongruity and the the garden path visualization resolution. Incongruity is the stage
where the opposing classifications exist simultaneously while resolution comes when
one classification occurs. With the garden path jokes we have ’shifting resolution’ which
is visualized.
Requirements For The Future
There are several things we would like to see happen. First is the replication of our
results using garden path jokes like ours. Development of these very specific data sets,
and with them some benchmarks, would be very useful. Second we would like to see
the notions of incongruity and resolution formalized both mathematically and visually.
We believe there is a shape to incongruity and resolution which is shared by several
51
phenomena that we can capture and make use of. Finally we would like to see continued
work on modeling and detecting incongruities beyond humor, both in general and using
visualization.
There are many potential uses for visualization and possible studied which could
yield interesting results that involve incongruity and resolution. When theorists argue as
to some cause incongruities arise within academic document sets. The generation and
resolution of these incongruities is how paradigm evolve. Visualization could play an
interesting role here. Tasty food involves incongruities, the mind finds the simultaneous
presence of opposing tastes and textures appealing, and visualizing recipes using an
ontology of tastes and textures might be an interesting way of modeling tastiness. Beyond
verbal humor it would be interesting to study nonverbal humor found within comic
nonverbal films sequences. With garden path humor of this form the viewer establishes
one interpretation but given new clues must establish a new interpretation. In this case
computer vision would be needed and our hypothesis is that humorous sequences would
involve more scene element misclassifications.
52

CHAPTER IX
APPENDIX ONE: JOKES AND NON JOKES IN CONDENSED FORM
Jokes
”Two fish are in a tank. One looks to the other and asks: ”how do you drive this
thing?””
”I asked the teller at the bank to check my balance, so she pushed me”
”Clean after soap ... addiction.”
”My computer mouse ate some cheese.”
”My computer has a terminal illness.”
”The picture was framed and found guilty.”
”Online on the web the fly got caught up.”
”Are you free for dinner, or will it cost me?”
”The hot dog barked.”
”No charge said the shopkeeper to the neutron.”
”A pork chop is a pig who knows karate”
”We went to the roof as the waiter said it was on the house.”
”A potato that sits around the house is a couch potato.”
”The fish swam by the bank to make a deposit.”
”The computer had a virus. It had malaria.”
”The ocean waves to his friend.”
”I got a cat scan. The cat did not like it.”
Data set of jokes and non jokes after simplifying:
Name, P1, P2, M1, M2, A
53

Jokes
[”fishJoke”,”fish in a tank”, ”drives the tank”, ”aquarium tank”, ”vehicle tank”,
”tank”],
[”bankJoke”,”check balance at bank”, ”balance when pushed”, ”account balance”,
”stability balance”, ”balance”],
[”soapJoke”,”clean after soap”, ”clean after addiction”, ”wash hands clean”, ”clean
and sober”, ”clean”],
[”mouseJoke”,”computer mouse”, ”mouse eats cheese”, ”mouse and keyboard”,
”rodent mouse”, ”mouse”],
[”terminalJoke”,”computer has a terminal”, ”terminal illness”, ”screen terminal”,
”cancer terminal”, ”terminal”],
[”framedJoke”,”picture was framed”, ”framed found guilty”, ”decoration framed”,
”framed go to jail”, ”framed”],
[”webJoke”,”online on the web”, ”fly was caught in a web”, ”web search”, ”spider
web”, ”web”],
[”freeJoke”,”are you free for dinner?”, ”free or will it cost me?”, ”free available”,
”free no charge”, ”free”],
[”dogJoke”,”a hot dog”, ”the dog barked”, ”dog and bun”, ”dog and cat”, ”dog”],
[”chargeJoke”,”no charge said the shopkeeper”, ”neutron charge”, ”charge
payment”, ”electron charge”, ”charge”],
[”chopJoke”,”pork chop”, ”karate chop”, ”breaded baked chop”, ”martial arts
chop”, ”chop”],
[”houseJoke”,”it is on the house”, ”the roof of house”, ”on the house free”,
”construction house”, ”house”],
54

[”potatoJoke”,”a potato vegetable”, ”that sits around is a couch potato”, ”meat and
potato”, ”lazy potato”, ”potato”],
[”bankJoke”,”the fish swam by the bank”, ”went to the bank to make a deposit”,
”bank of a river”, ”bank account”, ”bank”],
[”virusJoke”,”the computer had a virus”, ”malaria virus”, ”malware virus”, ”disease
virus”, ”virus”],
[”wavesJoke”,”the ocean waves”, ”waves to his friend”, ”water waves”, ”waves and
says hello”, ”waves”],
[”catJoke”,”got a cat scan”, ”the cat did not like it”, ”Computed Axial Tomography
cat”, ”cat and mouse”, ”cat”]
Non Jokes
[”fishNJoke”,”a fish in a tank”, ”swims in the tank”, ”aquarium tank”, ”vehicle
tank”, ”tank”],
[”bankNJoke”,”check balance at bank”, ”asked teller to check balance”, ”account
balance”, ”stability balance”, ”balance”],
[”soapNJoke”,”clean after soap”, ”soap and water”, ”wash hands clean”, ”clean and
sober”, ”clean”],
[”mouseNJoke”,”computer mouse”, ”mouse click”, ”mouse and keyboard”, ”cat and
mouse”, ”mouse”],
[”terminalNJoke”,”computer has a terminal”, ”terminal and keyboard”, ”screen
terminal”, ”cancer terminal”, ”terminal”],
[”framedNJoke”,”picture was framed”, ”framed on the wall”, ”decoration framed”,
”framed go to jail”, ”framed”],
[”webNJoke”,”on the web”, ”web results”, ”web search”, ”spider web”, ”web”],
55

[”freeNJoke”,”are you free for dinner?”, ”free to meet?”, ”free available”, ”free no
charge”, ”free”],
[”dogNJoke”,”eating a hot dog”, ”hot dog with ketchup”, ”dog on a bun”, ”dog and
cat”, ”dog”],
[”chargeNJoke”,”no charge said the shopkeeper”, ”free no charge”, ”charge
payment”, ”electron charge”, ”charge”],
[”chopNJoke”,”pork chop”, ”pork chop and applesauce”, ”baked chop”, ”martial
arts chop”, ”chop”],
[”houseNJoke”,”it is on the house”, ”no charge on the house”, ”on the house free”,
”tiles on the house”, ”house”],
[”potatoNJoke”,”a potato is a vegetable”, ”is a potato used in a stew”, ”meat and
potato”, ”lazy potato”, ”potato”],
[”bankNJoke”,”the fish swam by the bank”, ”the bank of the river”, ”stream bank”,
”bank account”, ”bank”],
[”virusNJoke”,”the computer had a virus”, ”computer virus protection”, ”malware
virus”, ”disease virus”, ”virus”],
[”wavesNJoke”,”the ocean waves”, ”liquid waves”, ”water waves”, ”waves hello”,
”waves”],
[”catNJoke”,”got a cat scan”, ”cat scan at hospital”, ”Computed Axial Tomography
cat”, ”cat and mouse”, ”cat”]
56

REFERENCES CITED
[1] G. Ritchie, “Developing the incongruity-resolution theory,” 1999.
[2] S. J. Simoff, M. H. Bohlen, and A. Mazeika, “Visual data mining: An introduction andoverview,” in Visual Data Mining, pp. 1–12, Springer, 2008.
[3] B. Kovalerchuk and J. Schwing, “Visual and spatial analysis,” Advances In DataMining, Reasoning, And Problem Solving, 2005.
[4] M. Dynel, “Garden paths, red lights and crossroads.,” Israeli Journal of HumorResearch, vol. 1, no. 1, p. 289320, 2012.
[5] B. Kovalerchuk, “Visualization of multidimensional data with collocated pairedcoordinates and general line coordinates,” in IS&T/SPIE Electronic Imaging,pp. 90170I–90170I, International Society for Optics and Photonics, 2013.
[6] “Jerry m. suls. a two-stage model for the appreciation of jokes and cartoons: aninformation-processing analysis,” 1972.
[7] V. Raskin, Semantic Mechanisms of Humor. Studies in Linguistics and Philosophy,Springer Netherlands, 1984.
[8] Y. Wang, “Fuzzy causal patterns of humor and jokes for cognitive and affectivecomputing,” International Journal of Cognitive Informatics and NaturalIntelligence (IJCINI), vol. 8, no. 2, pp. 34–46, 2014.
[9] R. Navigli, “Word sense disambiguation: A survey,” ACM Comput. Surv., vol. 41,pp. 10:1–10:69, Feb. 2009.
[10] Z. S. Harris, “Distributional structure,” ¡i¿WORD¡/i¿, vol. 10, no. 2-3, pp. 146–162,1954.
[11] A. Rajaraman and J. D. Ullman, “Mining of massive datasets,” in Visual Data Mining,pp. 1–17, 2011.
[12] I. Labutov and H. Lipson, “Humor as circuits in semantic networks,” in Proceedingsof the 50th Annual Meeting of the Association for Computational Linguistics: ShortPapers-Volume 2, pp. 150–155, Association for Computational Linguistics, 2012.
[13] S. Petrovic and D. Matthews, “Unsupervised joke generation from big data.,” in ACL(2), pp. 228–232, Citeseer, 2013.
57

[14] A. Kovalerhuck, B Smigaj, “Computing with words beyond quantitative words:Incongruity modeling,” in 2015 Annual Conference of the North American FuzzyInformation Processing Society (NAFIPS) held jointly with 2015 5th WorldConference on Soft Computing (WConSC), pp. 1–6, Aug 2015.
[15] A. Smigaj and B. Kovalerchuk, Visualizing Incongruity and Resolution: Visual DataMining Strategies for Modeling Sequential Humor Containing Shifts ofInterpretation, pp. 660–674. Cham: Springer International Publishing, 2017.
[16] T. Mikolov, I. Sutskever, K. Chen, G. S. Corrado, and J. Dean, “Distributedrepresentations of words and phrases and their compositionality,” in Advances inNeural Information Processing Systems 26 (C. Burges, L. Bottou, M. Welling,Z. Ghahramani, and K. Weinberger, eds.), pp. 3111–3119, Curran Associates, Inc.,2013.
[17] B. Kovalerchuk and F. Delizy, “Visual data mining using monotone booleanfunctions,” in Visual and Spatial Analysis, pp. 387–406, Springer, 2004.
[18] S. Bird, “Nltk: the natural language toolkit,” in Proceedings of the COLING/ACL onInteractive presentation sessions, COLING-ACL ’06, (Stroudsburg, PA, USA),pp. 69–72, Association for Computational Linguistics, 2006.
[19] F. Pedregosa, G. Varoquaux, A. Gramfort, V. Michel, B. Thirion, O. Grisel,M. Blondel, P. Prettenhofer, R. Weiss, V. Dubourg, J. Vanderplas, A. Passos,D. Cournapeau, M. Brucher, M. Perrot, and E. Duchesnay, “Scikit-learn: Machinelearning in Python,” Journal of Machine Learning Research, vol. 12,pp. 2825–2830, 2011.
58