
Visualizing Application Behavior on Superscalar...
9
Visualizing Application Behavior on Superscalar Processors Chris Stolte, Robert Bosch, Pat Hanrahan, and Mendel Rosenblum Computer Science Department Stanford University Abstract The advent of superscalar processors with out-of-order execution makes it increasingly difficult to determine how well an applica- tion is utilizing the processor and how to adapt the application to improve its performance. In this paper, we describe a visualiza- tion system for the analysis of application behavior on superscalar processors. Our system provides an overview-plus-detail display of the application’s execution. A timeline view of pipeline per- formance data shows the overall utilization of the pipeline, indi- cating regions of poor instruction throughput. This information is displayed using multiple time scales, enabling the user to drill down from a high-level application overview to a focus region of hundreds of cycles. This region of interest is displayed in detail using an animated cycle-by-cycle view of the execution. This view shows how instructions are reordered and executed and how functional units are being utilized. Additional context views correlate instructions in this detailed view with the relevant source code for the application. This allows the user to discover the root cause of the poor pipeline utilization and make changes to the application to improve its performance. This visualization system can be easily configured to display a variety of processor models and configurations. We demonstrate it for both the MXS and MMIX processor models. Keywords: Computer systems visualization, visualization sys- tems, superscalar processors. 1 INTRODUCTION The processing power of microprocessors has undergone un- precedented growth in the last decade [5]. Desktop computers produced today outperform supercomputers developed ten years ago. To achieve these performance enhancements, mainstream microprocessors such as the Intel Pentium Pro [11] and the MIPS R10000 [15] employ complex pipelines with out-of-order execu- tion, speculation and rename registers. The implementation techniques used by these processors are intended to be invisible to the programmer. This is true from the standpoint of correctness: application writers need not know the details of the processor implementation to write code that exe- cutes correctly. In order to write code that runs well, however, programmers need an understanding of their applications’ inter- actions with the processor pipeline. While optimizing compilers aid in producing compiled code that can take advantage of these powerful processors, they are unable to leverage semantic knowl- edge about the application in performing their optimizations. Changes made to the code structure of an application by the pro- grammer can increase the instruction-level parallelism that a proc- essor can exploit, resulting in increased performance. However, because of the complexity of these processors, few software developers understand the interactions between their applications and the processor pipeline. The analysis of applica- tion behavior on superscalar processors is complicated by several factors: • Having to look at the details. Many different events can cause poor utilization of the processor pipeline: contention for functional units, data dependencies between instructions, and branching are examples. High-level statistics can indi- cate that these hazards exist within an application, but they cannot indicate when, where, or why these events are occur- ring. Understanding specific hazards requires a detailed ex- amination of pipeline behavior at the granularity of individ- ual instructions. • Having to know where to look. Modern processors can execute hundreds of millions of instructions in a single sec- ond. Therefore, it is not feasible to browse through either a trace file or detailed visualization of an application’s entire execution searching for areas of poor performance. High- level performance overviews of the execution are required to identify regions of interest before detailed visualizations can be used for analysis. • Having to have context. Most programmers think in terms of source code, not in terms of individual instructions. In or- der to modify their applications to enhance performance, programmers need to be able to correlate instructions in the pipeline with the application’s source code. We have developed a visualization system that addresses all of these issues. Our system consists of three displays: a timeline view of pipeline performance statistics, an animated cycle-by- cycle view of instructions in the pipeline, and a source code view that maps instructions back to lines of code. These views com- bine to provide an overview-plus-detail [13] representation of the pipeline, enabling the effective analysis of applications. A pro- grammer can utilize the timeline view to observe the time-varying behavior of the pipeline and identify regions of execution where events of interest (such as poor pipeline utilization) occur. The detailed pipeline view can then be used to display and animate the flow of instructions through the pipeline, providing an under- standing of why the pipeline is stalling. Finally, the source code view can be used to correlate the problematic instruction se- quences with source code, where changes may be made to im- prove application performance. In addition to program analysis, this visualization system is also useful for several other tasks, including compiler analysis, hardware design, and processor simulator development.
Transcript of Visualizing Application Behavior on Superscalar...
Visualizing Application Behavior on Superscalar Processors
Chris Stolte, Robert Bosch, Pat Hanrahan, and Mendel RosenblumComputer Science Department
Stanford University
AbstractThe advent of superscalar processors with out-of-order executionmakes it increasingly difficult to determine how well an applica-tion is utilizing the processor and how to adapt the application toimprove its performance. In this paper, we describe a visualiza-tion system for the analysis of application behavior on superscalarprocessors. Our system provides an overview-plus-detail displayof the application’s execution. A timeline view of pipeline per-formance data shows the overall utilization of the pipeline, indi-cating regions of poor instruction throughput. This information isdisplayed using multiple time scales, enabling the user to drilldown from a high-level application overview to a focus region ofhundreds of cycles. This region of interest is displayed in detailusing an animated cycle-by-cycle view of the execution. Thisview shows how instructions are reordered and executed and howfunctional units are being utilized. Additional context viewscorrelate instructions in this detailed view with the relevant sourcecode for the application. This allows the user to discover the rootcause of the poor pipeline utilization and make changes to theapplication to improve its performance.
This visualization system can be easily configured to display avariety of processor models and configurations. We demonstrateit for both the MXS and MMIX processor models.
Keywords: Computer systems visualization, visualization sys-tems, superscalar processors.
1 INTRODUCTIONThe processing power of microprocessors has undergone un-precedented growth in the last decade [5]. Desktop computersproduced today outperform supercomputers developed ten yearsago. To achieve these performance enhancements, mainstreammicroprocessors such as the Intel Pentium Pro [11] and the MIPSR10000 [15] employ complex pipelines with out-of-order execu-tion, speculation and rename registers.
The implementation techniques used by these processors areintended to be invisible to the programmer. This is true from thestandpoint of correctness: application writers need not know thedetails of the processor implementation to write code that exe-cutes correctly. In order to write code that runs well, however,programmers need an understanding of their applications’ inter-actions with the processor pipeline. While optimizing compilers
aid in producing compiled code that can take advantage of thesepowerful processors, they are unable to leverage semantic knowl-edge about the application in performing their optimizations.Changes made to the code structure of an application by the pro-grammer can increase the instruction-level parallelism that a proc-essor can exploit, resulting in increased performance.
However, because of the complexity of these processors, fewsoftware developers understand the interactions between theirapplications and the processor pipeline. The analysis of applica-tion behavior on superscalar processors is complicated by severalfactors:
• Having to look at the details. Many different events cancause poor utilization of the processor pipeline: contentionfor functional units, data dependencies between instructions,and branching are examples. High-level statistics can indi-cate that these hazards exist within an application, but theycannot indicate when, where, or why these events are occur-ring. Understanding specific hazards requires a detailed ex-amination of pipeline behavior at the granularity of individ-ual instructions.
• Having to know where to look. Modern processors canexecute hundreds of millions of instructions in a single sec-ond. Therefore, it is not feasible to browse through either atrace file or detailed visualization of an application’s entireexecution searching for areas of poor performance. High-level performance overviews of the execution are required toidentify regions of interest before detailed visualizations canbe used for analysis.
• Having to have context. Most programmers think in termsof source code, not in terms of individual instructions. In or-der to modify their applications to enhance performance,programmers need to be able to correlate instructions in thepipeline with the application’s source code.
We have developed a visualization system that addresses all ofthese issues. Our system consists of three displays: a timelineview of pipeline performance statistics, an animated cycle-by-cycle view of instructions in the pipeline, and a source code viewthat maps instructions back to lines of code. These views com-bine to provide an overview-plus-detail [13] representation of thepipeline, enabling the effective analysis of applications. A pro-grammer can utilize the timeline view to observe the time-varyingbehavior of the pipeline and identify regions of execution whereevents of interest (such as poor pipeline utilization) occur. Thedetailed pipeline view can then be used to display and animate theflow of instructions through the pipeline, providing an under-standing of why the pipeline is stalling. Finally, the source codeview can be used to correlate the problematic instruction se-quences with source code, where changes may be made to im-prove application performance. In addition to program analysis,this visualization system is also useful for several other tasks,including compiler analysis, hardware design, and processorsimulator development.
The flexibility of our system enables us to visualize severaldifferent processor models, as well as a variety of configurationsof a particular processor model. In this paper, we include visuali-zations of the MXS [1] simulator and two configurations of theMMIX [8] processor model. While our current focus is on thestudy of processor pipelines, this system could be extended todisplay other types of pipelines, such as manufacturing assemblylines and graphics pipelines.
2 RELATED WORKAlthough there are many systems available for high-level analysisof application performance, there are few systems available forthis detailed visualization of application execution on superscalarprocessors. Existing systems include DLXview [3], VMW [2],BRAT [12], and the Intel Pentium Pro tutorial [11].
DLXview [3], an interactive pipeline simulator for the DLXinstruction set architecture [5], provides a visual, interactive envi-ronment that explains the detailed workings of a pipelined proces-sor. Performance evaluation is a secondary goal of their system:their focus is on the pedagogical nature of visualization. For per-formance analysis purposes, the pipeline displays of DLXviewprovide too much detail without enough overall context.
The Visualization-based Microarchitecture Workbench(VMW) [2] is a more complete system for the visualization ofsuperscalar processors. This system was developed with the dualgoals of aiding processor designers and providing support to soft-ware developers trying to quantify application performance.However, there are several disadvantages to the visualizations andanimation techniques used by the system. VMW provides verylimited high-level information on application performance, and itis difficult to correlate this information with the detailed views.Animation is used to depict cycle-by-cycle execution, but theanimation is not continuous – it consists of sequential snapshots ofprocessor state. While we initially used this approach, we foundthis animation technique was both difficult to follow and detri-mental to understanding the instruction flow.
During the development of the PowerPC, IBM used a simula-tion tool called the Basic RISC Architecture Timer (BRAT) [12]to study design trade-offs. BRAT provides a graphical interfacethat allows the user to step through trace files, displaying theprocessor state at each cycle. BRAT provides only the single,detailed view of the processor state and does not utilize animationin the visualization. Like VMW, this visualization is tightly inte-grated with the simulator and thus not a general-purpose tool.
Intel distributes an animated tutorial [11] that illustrates thetechniques the Pentium Pro processor utilizes to improve per-formance. Similar to DLXview, the pedagogical intent of thistutorial has resulted in a different design than our system. Thetutorial provides a limited cycle-by-cycle view of the instructionsin the pipeline with explanatory annotations. No contextual per-formance data or source code displays are provided.
3 BACKGROUNDTo provide a context for our visualization, we begin by describingthe salient characteristics of superscalar processors that impactapplication performance. We first introduce the major techniquesthat superscalar processors use to improve performance, and thenexplain the types of events that can cause a processor pipeline tobe underutilized.
Given a fixed instruction set architecture, a reasonable meas-ure of a processor’s performance is the throughput – that is, thenumber of instructions that complete execution and exit the pipe-line in a given period of time. Modern microprocessors utilizeseveral techniques to improve their throughput:
• Pipelining. Pipelining overlaps the execution of multipleinstructions within a functional unit, much like an assemblyline overlaps the steps in the construction of a product. Forexample, a single-stage floating point unit might require 60cycles to complete execution of a single divide instruction.If this functional unit were pipelined into six stages of 10 cy-cles apiece, the unit would be able to process multiple divideinstructions at once (with each stage working on a particularpiece of the computation). While it would still require 60cycles to compute a single divide, the pipelined functionalunit would produce a result every 10 cycles when performinga series of divide instructions.
• Multiple Functional Units. Superscalar processors includemultiple functional units, such as arithmetic logic units andfloating-point units. This enables the processor to exploit in-struction-level parallelism (ILP), executing several inde-pendent instructions concurrently. However, some instruc-tions cannot be executed in parallel because one of the in-structions produces a result that is used by the other. Theseinstructions are termed dependent.
• Out-of-Order Execution. In order to improve functionalunit utilization, many superscalar processors execute instruc-tions out of order. This allows a larger set of instructions tobe considered for execution, and thus exposes more ILP.Out-of-order execution can improve throughput if the nextinstruction to be sequentially executed cannot utilize any ofthe currently available functional units or is dependent onanother instruction. Although instructions may be executedout of order, they must graduate (exit the pipeline) in theiroriginal program order to preserve sequential execution se-mantics. The reordering of instructions is accomplished inthe reorder buffer, where completed instructions must waitfor all preceding instructions to graduate before they mayexit the pipeline.
• Speculation. Rather than halting execution when a branchinstruction is encountered until the branch condition is com-puted, most processors will continue to fetch and execute in-structions by predicting the result of the branch. If the proc-essor speculates correctly, throughput is maintained and exe-cution continues normally. Otherwise, the speculated in-structions are squashed and their results are discarded.
Despite the use of these techniques, superscalar processors areoften unable to achieve maximum throughput. There are manypossible causes for underutilization of the pipeline.
When there are not enough functional units to exploit the ILPavailable in a code sequence, instructions must wait for a unit tobecome available before they can execute. These structural haz-ards often occur in code that is biased towards a particular type ofinstruction, such as floating-point instructions. The functionalunit for those instructions will be consistently full, and the otherunits will often remain empty for lack of instructions. Conse-quently, the throughput of the processor is limited to the through-put of the critical functional unit alone.
Dependencies prevent instructions from executing in parallel.Out-of-order execution enables the pipeline to continue executionin the face of individual dependencies; however, if a code se-
quence includes enough dependencies, the lack of ILP will limitpipeline throughput.
Speculative execution can impact throughput in two ways.First, most processors cannot speculate through more than four orfive branches at once. Once this deep speculation is reached, theprocessor cannot speculate through subsequent branch instruc-tions. This forces the pipeline to stop fetching instructions untilone of the pending branches is resolved. Second, processors donot always predict the result of a branch correctly. When branchmisprediction occurs, throughput suffers since the incorrectlyspeculated instructions must be squashed from the pipeline.
Because main memory accesses often require hundreds of cy-cles to complete, memory stall can have a major impact on pipe-line performance. When an instruction cache miss takes place, theprocessor cannot fetch instructions into the pipeline until the nextsequence of instructions is retrieved from memory. The resultinglack of instructions in the pipeline reduces the processor through-put. Misses to the data cache increase the effective execution timeof load and store instructions, since they must wait for the mem-ory access to complete before they can graduate. This delays theexecution of any dependent instructions, and eventually stalls thepipeline by preventing subsequent instructions from graduating.
Finally, some instructions, such as traps and memory barrierinstructions, require sequential execution, forcing the pipeline tobe emptied of all other instructions before they can execute. Thishas an obvious detrimental effect on throughput.
Although high-level visualizations can indicate that theseevents are occurring during the execution of an application, onlydetailed visualizations can reveal the instruction flow and depend-encies that are responsible for these performance bottlenecks.This detailed knowledge is critical for adapting the application toimprove the performance.
4 VISUALIZATION ENVIRONMENTThe pipeline visualization system discussed in this paper wasdeveloped using Rivet. Rivet is a visualization environment weare developing to support the rapid prototyping of visualizationsfor the exploration and understanding of real world problems,with an emphasis on the analysis and visualization of computersystems. Several attributes of Rivet were particularly importantfor the development of this visualization system.
Flexibility. Rivet provides flexibility through a compositionalarchitecture. Components such as data objects and visual primi-tives, written in C++ and OpenGL, are designed to be composedto form objects with greater functionality. Primitives and objectsalso export an interface to a scripting language such as Tcl, whichallows them to be composed further to create sophisticated, inter-active visualizations.
One of our design goals for the pipeline visualization systemwas to make it easily adaptable to many processor models. Tosupport this, our processor pipeline display is composed from twomajor classes of visual primitives, containers and pipes, bothwritten in C++. We use the Tcl scripting language to combinethese primitives into higher-level building blocks: the functionalunits, stages, and data paths of the processor pipeline. We thencombine these objects according to the configuration of the par-ticular processor model under study to represent the entire pipe-line.
The decomposition of the pipeline into its constituent elementsenables us to easily adapt the layout to represent a variety of proc-essor models with different pipeline organizations. It also enables
us to easily configure the visualization according to the parame-ters of a particular processor model, such as the number of func-tional units or the size of the reorder buffer.
Aggregation. The complexity of computer systems demands thata visualization environment be able to efficiently manage anddisplay large data sets. To simplify this task, Rivet provides built-in data management objects that support data aggregation. Data iscollected at a fine granularity over a long period; it is then builtinto an aggregation structure that includes both the raw data andsmaller, less detailed aggregates. When displaying the data, Rivetchooses the appropriate data resolution based on the time windowto be displayed and the available screen space.
The study of superscalar processors requires large volumes ofdata be collected and visualized. Our experimental runs oftengenerate data for hundreds of thousands of execution cycles. Foreach cycle, information about any instruction that changes statemust be collected. The use of Rivet aggregation structures en-ables us to explore this data from a high-level overview down toindividual data elements.
Animation. Animation is a core service provided by Rivet. Thissupport includes the ability to request timed callbacks to visualprimitives and path interpolation for a variety of animation paths.The Rivet redraw mechanism supports incremental redraw ofvisual primitives, important for efficient animation of objects.
Animation is crucial for understanding the cycle-by-cycle be-havior of the pipeline. Our original pipeline implementation sim-ply displayed the state of the pipeline at a particular cycle with novisual transitions between cycles. Without the visual cues pro-vided by animation, we found it very difficult to track instructionsas they advanced through the pipeline.
5 PIPELINE VISUALIZATION SYSTEMOur pipeline visualization combines three major components toprovide an overview-plus-detail display of application execution.We first describe each of the components of the system, and thenpresent an example showing how the system is used to understandapplication behavior.
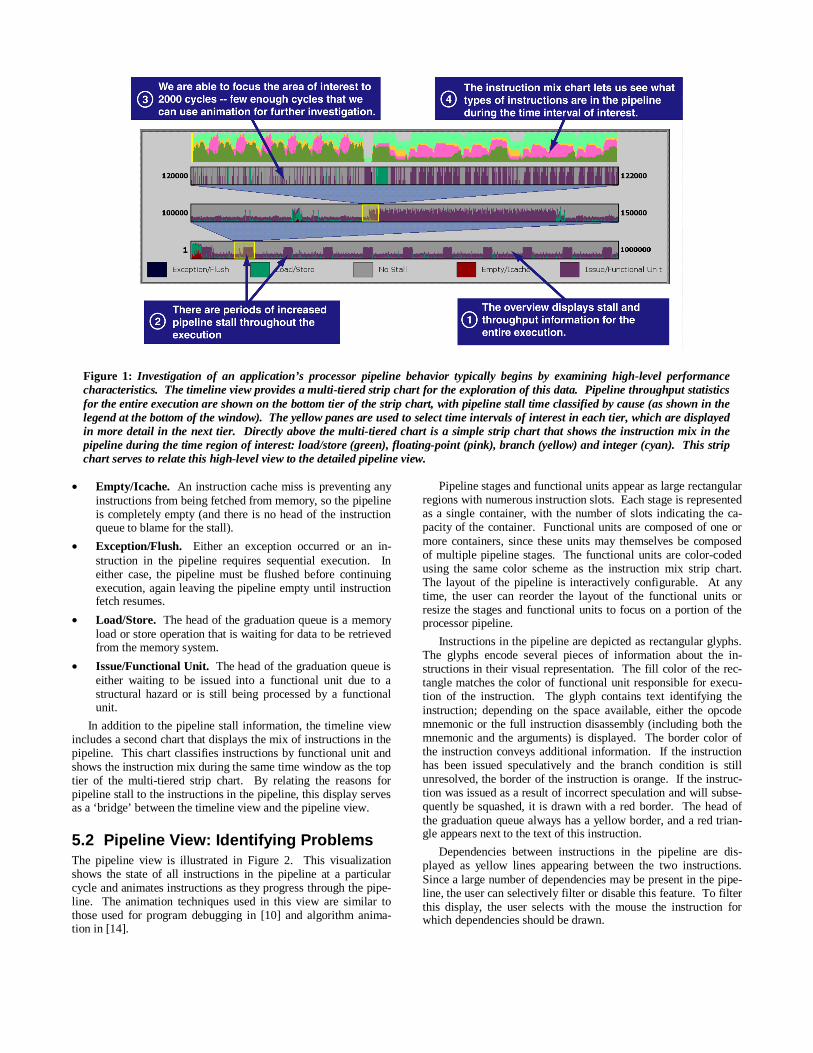
5.1 Timeline View: Finding ProblemsThe first task in understanding the behavior of an application on aprocessor is to examine an overview of the application’s execu-tion to locate regions of interest. The timeline view, shown inFigure 1, utilizes a multi-tiered strip chart to display overall pipe-line performance information at multiple levels of detail. Thebottom tier shows data collected over the entire execution of theapplication. The user interactively selects regions of interest ineach tier, which are expanded and displayed in the next tier. Thisvisualization exploits the aggregation mechanism described inSection 4: the data in each tier is displayed at the highest resolu-tion possible, determined by the number of horizontal pixelsavailable for display.
The multi-tiered strip chart is used to indicate the reasons thatthe pipeline was unable to achieve full throughput on a particularcycle (or range of cycles in the aggregated displays). In a super-scalar processor, throughput is lost whenever the pipeline fails tograduate a full complement of instructions from the pipeline in agiven cycle. Because instructions must graduate in order, weattribute this pipeline graduation stall to the instruction at the headof the graduation queue (i.e. the oldest instruction in the pipeline).The reasons for failure to achieve full pipeline throughput can beclassified into the following categories:
• Empty/Icache. An instruction cache miss is preventing anyinstructions from being fetched from memory, so the pipelineis completely empty (and there is no head of the instructionqueue to blame for the stall).
• Exception/Flush. Either an exception occurred or an in-struction in the pipeline requires sequential execution. Ineither case, the pipeline must be flushed before continuingexecution, again leaving the pipeline empty until instructionfetch resumes.
• Load/Store. The head of the graduation queue is a memoryload or store operation that is waiting for data to be retrievedfrom the memory system.
• Issue/Functional Unit. The head of the graduation queue iseither waiting to be issued into a functional unit due to astructural hazard or is still being processed by a functionalunit.
In addition to the pipeline stall information, the timeline viewincludes a second chart that displays the mix of instructions in thepipeline. This chart classifies instructions by functional unit andshows the instruction mix during the same time window as the toptier of the multi-tiered strip chart. By relating the reasons forpipeline stall to the instructions in the pipeline, this display servesas a ‘bridge’ between the timeline view and the pipeline view.
5.2 Pipeline View: Identifying ProblemsThe pipeline view is illustrated in Figure 2. This visualizationshows the state of all instructions in the pipeline at a particularcycle and animates instructions as they progress through the pipe-line. The animation techniques used in this view are similar tothose used for program debugging in [10] and algorithm anima-tion in [14].
Pipeline stages and functional units appear as large rectangularregions with numerous instruction slots. Each stage is representedas a single container, with the number of slots indicating the ca-pacity of the container. Functional units are composed of one ormore containers, since these units may themselves be composedof multiple pipeline stages. The functional units are color-codedusing the same color scheme as the instruction mix strip chart.The layout of the pipeline is interactively configurable. At anytime, the user can reorder the layout of the functional units orresize the stages and functional units to focus on a portion of theprocessor pipeline.
Instructions in the pipeline are depicted as rectangular glyphs.The glyphs encode several pieces of information about the in-structions in their visual representation. The fill color of the rec-tangle matches the color of functional unit responsible for execu-tion of the instruction. The glyph contains text identifying theinstruction; depending on the space available, either the opcodemnemonic or the full instruction disassembly (including both themnemonic and the arguments) is displayed. The border color ofthe instruction conveys additional information. If the instructionhas been issued speculatively and the branch condition is stillunresolved, the border of the instruction is orange. If the instruc-tion was issued as a result of incorrect speculation and will subse-quently be squashed, it is drawn with a red border. The head ofthe graduation queue always has a yellow border, and a red trian-gle appears next to the text of this instruction.
Dependencies between instructions in the pipeline are dis-played as yellow lines appearing between the two instructions.Since a large number of dependencies may be present in the pipe-line, the user can selectively filter or disable this feature. To filterthis display, the user selects with the mouse the instruction forwhich dependencies should be drawn.
Figure 1: Investigation of an application’s processor pipeline behavior typically begins by examining high-level performancecharacteristics. The timeline view provides a multi-tiered strip chart for the exploration of this data. Pipeline throughput statisticsfor the entire execution are shown on the bottom tier of the strip chart, with pipeline stall time classified by cause (as shown in thelegend at the bottom of the window). The yellow panes are used to select time intervals of interest in each tier, which are displayedin more detail in the next tier. Directly above the multi-tiered chart is a simple strip chart that shows the instruction mix in thepipeline during the time region of interest: load/store (green), floating-point (pink), branch (yellow) and integer (cyan). This stripchart serves to relate this high-level view to the detailed pipeline view.
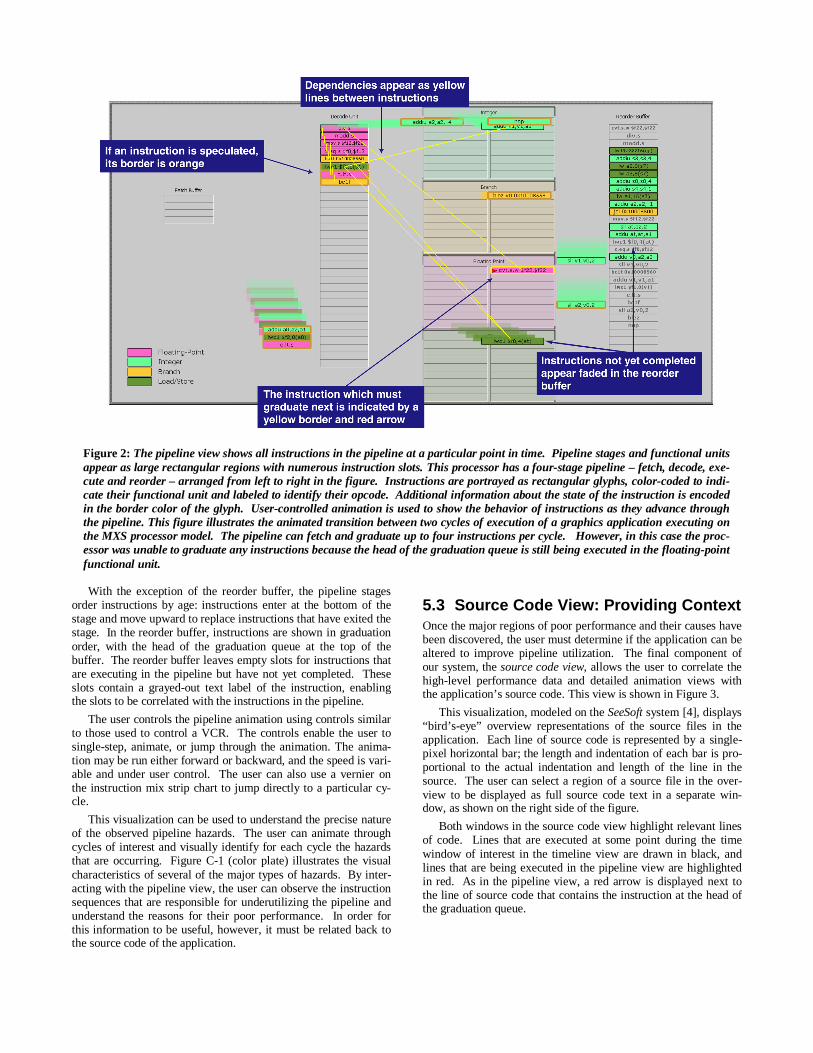
With the exception of the reorder buffer, the pipeline stagesorder instructions by age: instructions enter at the bottom of thestage and move upward to replace instructions that have exited thestage. In the reorder buffer, instructions are shown in graduationorder, with the head of the graduation queue at the top of thebuffer. The reorder buffer leaves empty slots for instructions thatare executing in the pipeline but have not yet completed. Theseslots contain a grayed-out text label of the instruction, enablingthe slots to be correlated with the instructions in the pipeline.
The user controls the pipeline animation using controls similarto those used to control a VCR. The controls enable the user tosingle-step, animate, or jump through the animation. The anima-tion may be run either forward or backward, and the speed is vari-able and under user control. The user can also use a vernier onthe instruction mix strip chart to jump directly to a particular cy-cle.
This visualization can be used to understand the precise natureof the observed pipeline hazards. The user can animate throughcycles of interest and visually identify for each cycle the hazardsthat are occurring. Figure C-1 (color plate) illustrates the visualcharacteristics of several of the major types of hazards. By inter-acting with the pipeline view, the user can observe the instructionsequences that are responsible for underutilizing the pipeline andunderstand the reasons for their poor performance. In order forthis information to be useful, however, it must be related back tothe source code of the application.
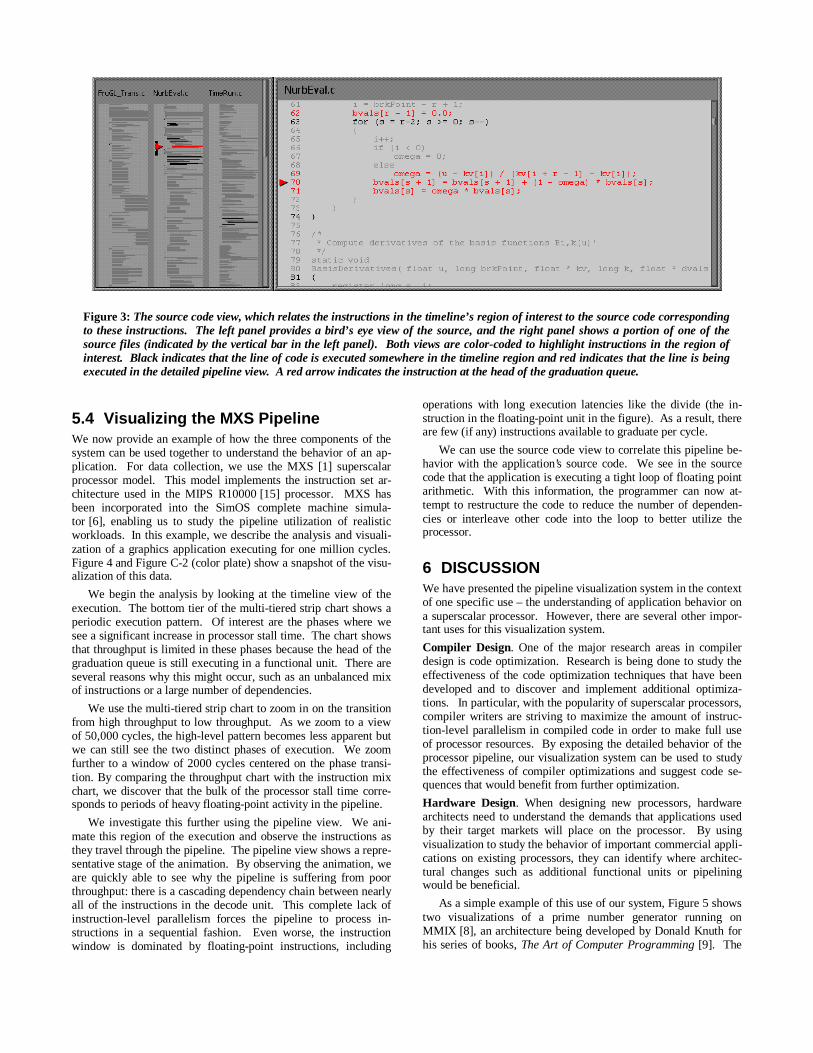
5.3 Source Code View: Providing ContextOnce the major regions of poor performance and their causes havebeen discovered, the user must determine if the application can bealtered to improve pipeline utilization. The final component ofour system, the source code view, allows the user to correlate thehigh-level performance data and detailed animation views withthe application’s source code. This view is shown in Figure 3.
This visualization, modeled on the SeeSoft system [4], displays“bird’s-eye” overview representations of the source files in theapplication. Each line of source code is represented by a single-pixel horizontal bar; the length and indentation of each bar is pro-portional to the actual indentation and length of the line in thesource. The user can select a region of a source file in the over-view to be displayed as full source code text in a separate win-dow, as shown on the right side of the figure.
Both windows in the source code view highlight relevant linesof code. Lines that are executed at some point during the timewindow of interest in the timeline view are drawn in black, andlines that are being executed in the pipeline view are highlightedin red. As in the pipeline view, a red arrow is displayed next tothe line of source code that contains the instruction at the head ofthe graduation queue.
Figure 2: The pipeline view shows all instructions in the pipeline at a particular point in time. Pipeline stages and functional unitsappear as large rectangular regions with numerous instruction slots. This processor has a four-stage pipeline – fetch, decode, exe-cute and reorder – arranged from left to right in the figure. Instructions are portrayed as rectangular glyphs, color-coded to indi-cate their functional unit and labeled to identify their opcode. Additional information about the state of the instruction is encodedin the border color of the glyph. User-controlled animation is used to show the behavior of instructions as they advance throughthe pipeline. This figure illustrates the animated transition between two cycles of execution of a graphics application executing onthe MXS processor model. The pipeline can fetch and graduate up to four instructions per cycle. However, in this case the proc-essor was unable to graduate any instructions because the head of the graduation queue is still being executed in the floating-pointfunctional unit.
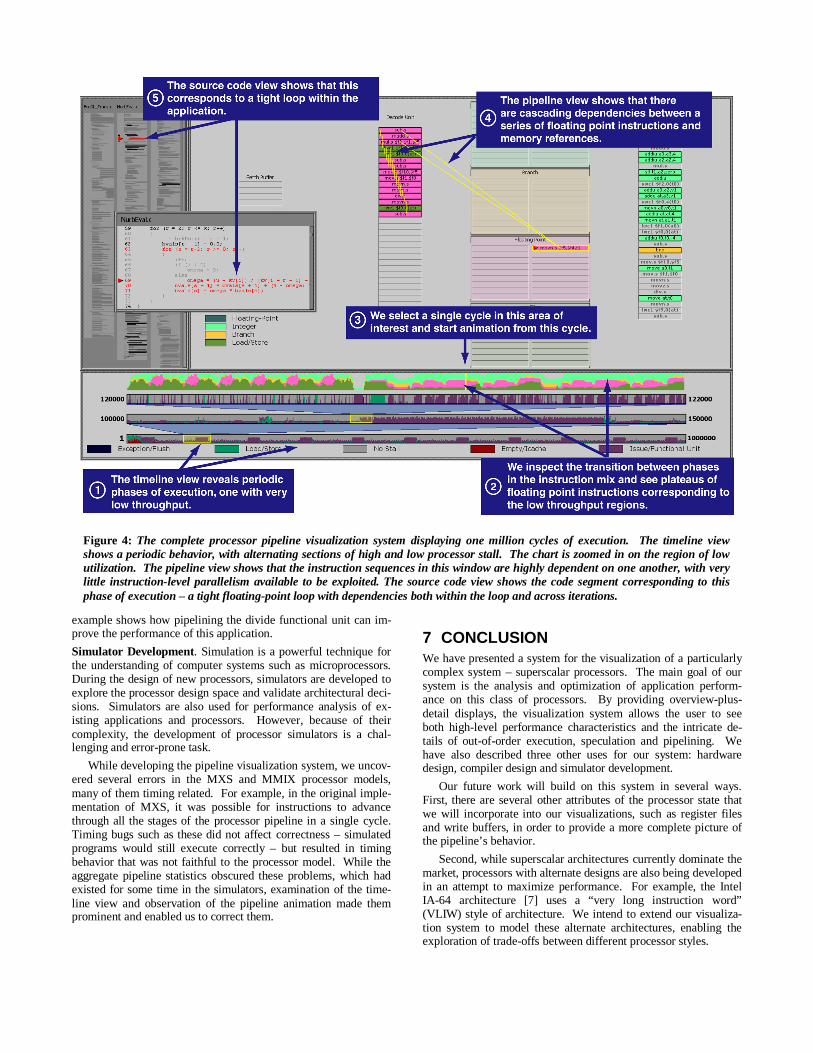
5.4 Visualizing the MXS PipelineWe now provide an example of how the three components of thesystem can be used together to understand the behavior of an ap-plication. For data collection, we use the MXS [1] superscalarprocessor model. This model implements the instruction set ar-chitecture used in the MIPS R10000 [15] processor. MXS hasbeen incorporated into the SimOS complete machine simula-tor [6], enabling us to study the pipeline utilization of realisticworkloads. In this example, we describe the analysis and visuali-zation of a graphics application executing for one million cycles.Figure 4 and Figure C-2 (color plate) show a snapshot of the visu-alization of this data.
We begin the analysis by looking at the timeline view of theexecution. The bottom tier of the multi-tiered strip chart shows aperiodic execution pattern. Of interest are the phases where wesee a significant increase in processor stall time. The chart showsthat throughput is limited in these phases because the head of thegraduation queue is still executing in a functional unit. There areseveral reasons why this might occur, such as an unbalanced mixof instructions or a large number of dependencies.
We use the multi-tiered strip chart to zoom in on the transitionfrom high throughput to low throughput. As we zoom to a viewof 50,000 cycles, the high-level pattern becomes less apparent butwe can still see the two distinct phases of execution. We zoomfurther to a window of 2000 cycles centered on the phase transi-tion. By comparing the throughput chart with the instruction mixchart, we discover that the bulk of the processor stall time corre-sponds to periods of heavy floating-point activity in the pipeline.
We investigate this further using the pipeline view. We ani-mate this region of the execution and observe the instructions asthey travel through the pipeline. The pipeline view shows a repre-sentative stage of the animation. By observing the animation, weare quickly able to see why the pipeline is suffering from poorthroughput: there is a cascading dependency chain between nearlyall of the instructions in the decode unit. This complete lack ofinstruction-level parallelism forces the pipeline to process in-structions in a sequential fashion. Even worse, the instructionwindow is dominated by floating-point instructions, including
operations with long execution latencies like the divide (the in-struction in the floating-point unit in the figure). As a result, thereare few (if any) instructions available to graduate per cycle.
We can use the source code view to correlate this pipeline be-havior with the application’s source code. We see in the sourcecode that the application is executing a tight loop of floating pointarithmetic. With this information, the programmer can now at-tempt to restructure the code to reduce the number of dependen-cies or interleave other code into the loop to better utilize theprocessor.
6 DISCUSSIONWe have presented the pipeline visualization system in the contextof one specific use – the understanding of application behavior ona superscalar processor. However, there are several other impor-tant uses for this visualization system.
Compiler Design. One of the major research areas in compilerdesign is code optimization. Research is being done to study theeffectiveness of the code optimization techniques that have beendeveloped and to discover and implement additional optimiza-tions. In particular, with the popularity of superscalar processors,compiler writers are striving to maximize the amount of instruc-tion-level parallelism in compiled code in order to make full useof processor resources. By exposing the detailed behavior of theprocessor pipeline, our visualization system can be used to studythe effectiveness of compiler optimizations and suggest code se-quences that would benefit from further optimization.
Hardware Design. When designing new processors, hardwarearchitects need to understand the demands that applications usedby their target markets will place on the processor. By usingvisualization to study the behavior of important commercial appli-cations on existing processors, they can identify where architec-tural changes such as additional functional units or pipeliningwould be beneficial.
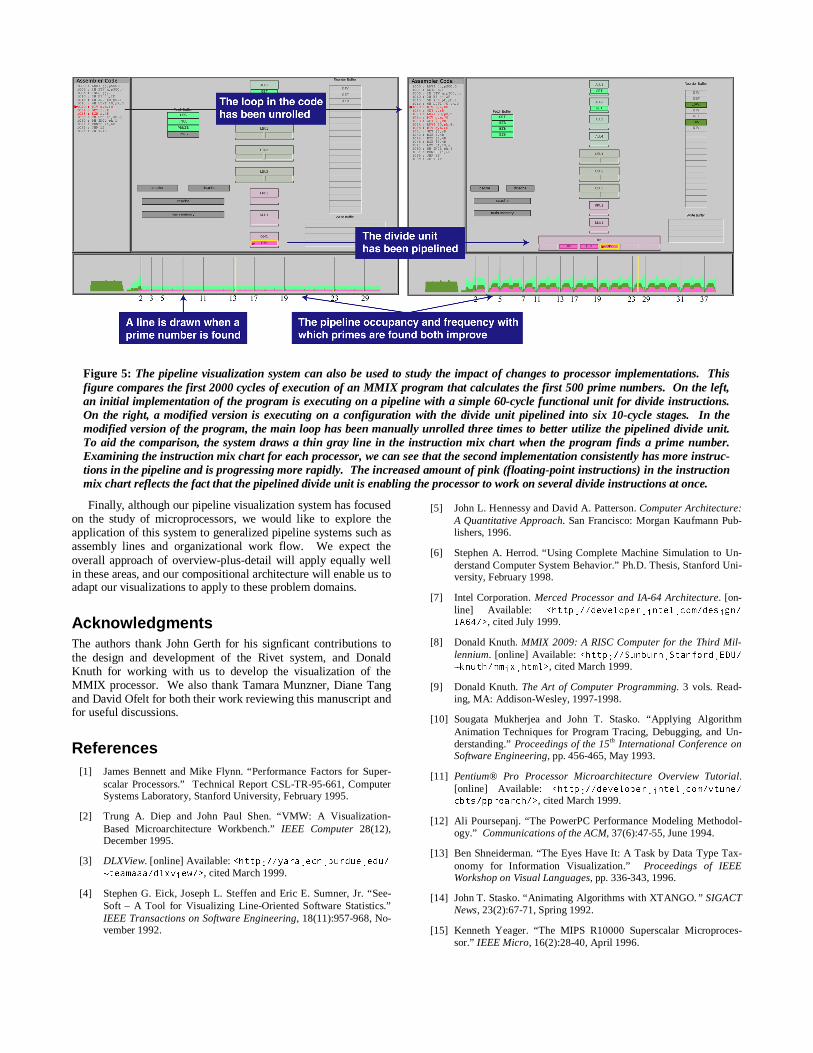
As a simple example of this use of our system, Figure 5 showstwo visualizations of a prime number generator running onMMIX [8], an architecture being developed by Donald Knuth forhis series of books, The Art of Computer Programming [9]. The
Figure 3: The source code view, which relates the instructions in the timeline’s region of interest to the source code correspondingto these instructions. The left panel provides a bird’s eye view of the source, and the right panel shows a portion of one of thesource files (indicated by the vertical bar in the left panel). Both views are color-coded to highlight instructions in the region ofinterest. Black indicates that the line of code is executed somewhere in the timeline region and red indicates that the line is beingexecuted in the detailed pipeline view. A red arrow indicates the instruction at the head of the graduation queue.
example shows how pipelining the divide functional unit can im-prove the performance of this application.
Simulator Development. Simulation is a powerful technique forthe understanding of computer systems such as microprocessors.During the design of new processors, simulators are developed toexplore the processor design space and validate architectural deci-sions. Simulators are also used for performance analysis of ex-isting applications and processors. However, because of theircomplexity, the development of processor simulators is a chal-lenging and error-prone task.
While developing the pipeline visualization system, we uncov-ered several errors in the MXS and MMIX processor models,many of them timing related. For example, in the original imple-mentation of MXS, it was possible for instructions to advancethrough all the stages of the processor pipeline in a single cycle.Timing bugs such as these did not affect correctness – simulatedprograms would still execute correctly – but resulted in timingbehavior that was not faithful to the processor model. While theaggregate pipeline statistics obscured these problems, which hadexisted for some time in the simulators, examination of the time-line view and observation of the pipeline animation made themprominent and enabled us to correct them.
7 CONCLUSIONWe have presented a system for the visualization of a particularlycomplex system – superscalar processors. The main goal of oursystem is the analysis and optimization of application perform-ance on this class of processors. By providing overview-plus-detail displays, the visualization system allows the user to seeboth high-level performance characteristics and the intricate de-tails of out-of-order execution, speculation and pipelining. Wehave also described three other uses for our system: hardwaredesign, compiler design and simulator development.
Our future work will build on this system in several ways.First, there are several other attributes of the processor state thatwe will incorporate into our visualizations, such as register filesand write buffers, in order to provide a more complete picture ofthe pipeline’s behavior.
Second, while superscalar architectures currently dominate themarket, processors with alternate designs are also being developedin an attempt to maximize performance. For example, the IntelIA-64 architecture [7] uses a “very long instruction word”(VLIW) style of architecture. We intend to extend our visualiza-tion system to model these alternate architectures, enabling theexploration of trade-offs between different processor styles.
Figure 4: The complete processor pipeline visualization system displaying one million cycles of execution. The timeline viewshows a periodic behavior, with alternating sections of high and low processor stall. The chart is zoomed in on the region of lowutilization. The pipeline view shows that the instruction sequences in this window are highly dependent on one another, with verylittle instruction-level parallelism available to be exploited. The source code view shows the code segment corresponding to thisphase of execution – a tight floating-point loop with dependencies both within the loop and across iterations.
Finally, although our pipeline visualization system has focusedon the study of microprocessors, we would like to explore theapplication of this system to generalized pipeline systems such asassembly lines and organizational work flow. We expect theoverall approach of overview-plus-detail will apply equally wellin these areas, and our compositional architecture will enable us toadapt our visualizations to apply to these problem domains.
AcknowledgmentsThe authors thank John Gerth for his signficant contributions tothe design and development of the Rivet system, and DonaldKnuth for working with us to develop the visualization of theMMIX processor. We also thank Tamara Munzner, Diane Tangand David Ofelt for both their work reviewing this manuscript andfor useful discussions.
References[1] James Bennett and Mike Flynn. “Performance Factors for Super-
scalar Processors.” Technical Report CSL-TR-95-661, ComputerSystems Laboratory, Stanford University, February 1995.
[2] Trung A. Diep and John Paul Shen. “VMW: A Visualization-Based Microarchitecture Workbench.” IEEE Computer 28(12),December 1995.
[3] DLXView. [online] Available: �KWWS���\DUD�HFQ�SXUGXH�HGX�aWHDPDDD�GO[YLHZ�!, cited March 1999.
[4] Stephen G. Eick, Joseph L. Steffen and Eric E. Sumner, Jr. “See-Soft – A Tool for Visualizing Line-Oriented Software Statistics.”IEEE Transactions on Software Engineering, 18(11):957-968, No-vember 1992.
[5] John L. Hennessy and David A. Patterson. Computer Architecture:A Quantitative Approach. San Francisco: Morgan Kaufmann Pub-lishers, 1996.
[6] Stephen A. Herrod. “Using Complete Machine Simulation to Un-derstand Computer System Behavior.” Ph.D. Thesis, Stanford Uni-versity, February 1998.
[7] Intel Corporation. Merced Processor and IA-64 Architecture. [on-line] Available: �KWWS���GHYHORSHU�LQWHO�FRP�GHVLJQ�
,$���!, cited July 1999.
[8] Donald Knuth. MMIX 2009: A RISC Computer for the Third Mil-lennium. [online] Available: �KWWS���6XQEXUQ�6WDQIRUG�('8�aNQXWK�PPL[�KWPO!, cited March 1999.
[9] Donald Knuth. The Art of Computer Programming. 3 vols. Read-ing, MA: Addison-Wesley, 1997-1998.
[10] Sougata Mukherjea and John T. Stasko. “Applying AlgorithmAnimation Techniques for Program Tracing, Debugging, and Un-derstanding.” Proceedings of the 15th International Conference onSoftware Engineering, pp. 456-465, May 1993.
[11] Pentium® Pro Processor Microarchitecture Overview Tutorial.[online] Available: �KWWS���GHYHORSHU�LQWHO�FRP�YWXQH�
FEWV�SSURDUFK�!, cited March 1999.
[12] Ali Poursepanj. “The PowerPC Performance Modeling Methodol-ogy.” Communications of the ACM, 37(6):47-55, June 1994.
[13] Ben Shneiderman. “The Eyes Have It: A Task by Data Type Tax-onomy for Information Visualization.” Proceedings of IEEEWorkshop on Visual Languages, pp. 336-343, 1996.
[14] John T. Stasko. “Animating Algorithms with XTANGO.” SIGACTNews, 23(2):67-71, Spring 1992.
[15] Kenneth Yeager. “The MIPS R10000 Superscalar Microproces-sor.” IEEE Micro, 16(2):28-40, April 1996.
Figure 5: The pipeline visualization system can also be used to study the impact of changes to processor implementations. Thisfigure compares the first 2000 cycles of execution of an MMIX program that calculates the first 500 prime numbers. On the left,an initial implementation of the program is executing on a pipeline with a simple 60-cycle functional unit for divide instructions.On the right, a modified version is executing on a configuration with the divide unit pipelined into six 10-cycle stages. In themodified version of the program, the main loop has been manually unrolled three times to better utilize the pipelined divide unit.To aid the comparison, the system draws a thin gray line in the instruction mix chart when the program finds a prime number.Examining the instruction mix chart for each processor, we can see that the second implementation consistently has more instruc-tions in the pipeline and is progressing more rapidly. The increased amount of pink (floating-point instructions) in the instructionmix chart reflects the fact that the pipelined divide unit is enabling the processor to work on several divide instructions at once.
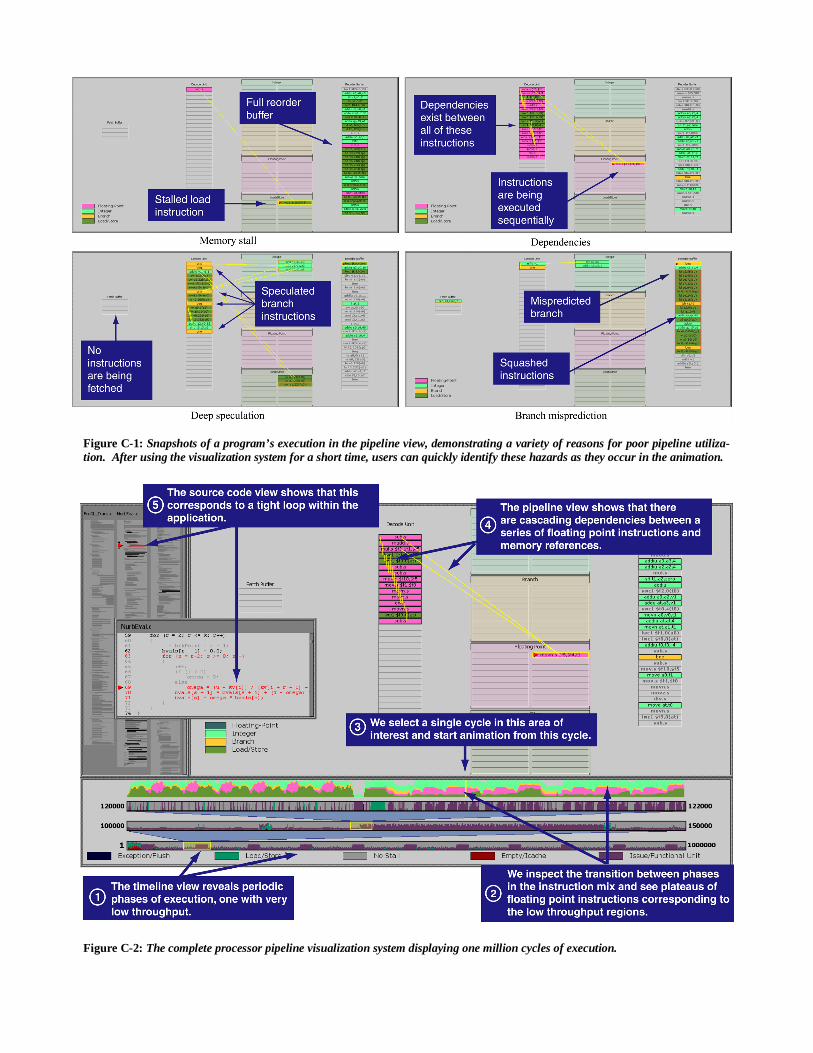
Figure C-1: Snapshots of a program’s execution in the pipeline view, demonstrating a variety of reasons for poor pipeline utiliza-tion. After using the visualization system for a short time, users can quickly identify these hazards as they occur in the animation.
Figure C-2: The complete processor pipeline visualization system displaying one million cycles of execution.


![Visualizing Application Behavior on Superscalar Processors · MMIX [8] processor model. While our current focus is on the study of processor pipelines, this system could be extended](https://static.fdocuments.in/doc/165x107/5e7659003f038068f170395b/visualizing-application-behavior-on-superscalar-processors-mmix-8-processor-model.jpg)


