Visualizations of Adaptation Scenarios and Next …...Visualizations of Adaptation Scenarios and...
56
Visualizations of Adaptation Scenarios and Next Steps White Paper Local Government Capacity Grant Program Prepared for: City of Jersey City Prepared by: Michael Baker Jr., Inc., a unit of Michael Baker International, LLC Hamilton, NJ Date: February 14, 2015
Transcript of Visualizations of Adaptation Scenarios and Next …...Visualizations of Adaptation Scenarios and...

Visualizations of Adaptation Scenarios and Next Steps
White Paper
Local Government Capacity Grant Program Prepared for: City of Jersey City
Prepared by: Michael Baker Jr., Inc., a unit of Michael Baker International, LLC Hamilton, NJ
Date: February 14, 2015
Visualizations of Adaptation Scenarios and Next Steps White Paper Page 2 of 56
The work that provided the basis for this report was supported by funding under an award from the U.S. Department of Housing and Urban Development with additional funding from the U.S. Department of Transportation. The substance and findings of the work are dedicated to the public. The authors of the report are solely responsible for the accuracy of the data, statements and interpretations contained in this document. Such statements and interpretations do not necessarily reflect the views of the Together North Jersey Steering Committee or its individual members or any other agency or instrumentality of Government. For more information on Together North Jersey, please visit http://www.togethernorthjersey.com.
Visualizations of Adaptation Scenarios and Next Steps White Paper Page 3 of 56
Acknowledgements
City of Jersey City Steven M. Fulop, Mayor
Division of City Planning
Robert D. Cotter, FAICP, PP, Director Maryann Bucci-Carter, AICP, PP, Supervising Planner
Jeff Wenger, AICP, Principal Planner Tanya Marione, AICP, PP, Senior Planner
Naomi Hsu, AICP, PP, Senior Planner
Collaborative Climate Adaptation Planning for Urban Coastal Flooding Study Team Dr. Philip Orton, Ph.D., Stevens Institute of Technology
Dr. Sergey Vinogradov, Ph.D., Stevens Institute of Technology Dr. Peter Rowe, Ph.D., New Jersey Sea Grant Consortium
Members of the Jersey City Resiliency Task Force City of Jersey City Environmental Commission
Rutgers University
David Aimen, AICP, PP, Assistant Director, Planning and Technical Assistance, Voorhees Transportation Center Miriam Salerno, Voorhees Transportation Center
North Jersey Transportation Planning Authority
Douglas Greenfeld, AICP, PP, Manager, Sustainability and Plan Development Christine Mittman, Principal Planner, Project Management
Liz DeRuchie, Principal Planner, Air Quality
Michael Baker International / Civic Eye Collaborative, LLC Steve Eberbach, CFM, Coastal Science & Engineering Practice Manager
Michael Conaboy, P.E., Vice President Ranjit Walia, AICP, PP, Principal
Visualizations of Adaptation Scenarios and Next Steps White Paper Page 4 of 56
Table of Contents Acknowledgements ................................................................................................................................ 3
1. Project Overview ..................................................................................................................... 6
2. Summary of Selected Adaptation Measures ............................................................................ 8
3. Visualization Products ........................................................................................................... 11
3.1 Methodology .......................................................................................................................... 11
3.2 Photography Collection .......................................................................................................... 13
3.2.1 Scenario 1: Washington Street .............................................................................................. 14
3.2.2 Scenario 2: Dudley Street ...................................................................................................... 16
3.2.3 Scenario 3: Tidewater Basin .................................................................................................. 18
3.2.4 Scenario 4: Mill Creek ............................................................................................................ 20
3.2.5 Scenario 5: Route 440/Country Village .................................................................................. 22
3.2.6 Scenario 6: Society Hill .......................................................................................................... 24
4. Meetings Summary & Stakeholder Outreach ......................................................................... 26
4.1 Coordination Meetings with CCAPUCF Study Team .............................................................. 26
4.2 Resiliency Task Force Meeting .............................................................................................. 26
4.3 Public Open House ................................................................................................................ 26
4.4 Sustainable Cities Conference ............................................................................................... 29
5. Next Steps White Paper ........................................................................................................ 32
5.1 Introduction ............................................................................................................................ 32
5.2 White Paper Goals................................................................................................................. 32
5.3 Benefit-Cost Analysis Overview ............................................................................................. 32
5.4 The Value and Need for a Benefit-Cost Analysis ................................................................... 33
5.4.1 Justifying a project ................................................................................................................. 33
5.4.2 Grant application support ....................................................................................................... 33
5.4.3 Establishing Design Elevations .............................................................................................. 37
5.5 Local / Regional Data Collection Requirements ..................................................................... 37
5.5.1 Coastal Flood Elevation Information ...................................................................................... 38
5.5.2 Property Value Factors .......................................................................................................... 39
5.5.3 Financial and Tax Revenue Factors ...................................................................................... 42
5.5.4 Economic Factors .................................................................................................................. 43
5.5.5 Social Factors ........................................................................................................................ 43
5.5.6 Public Health, Safety, and Disaster Preparedness and Response Factors ............................ 45
5.5.7 Regional Connection Factors ................................................................................................. 47

Visualizations of Adaptation Scenarios and Next Steps White Paper Page 5 of 56
5.6 Accuracy and Uncertainty Standards ..................................................................................... 47
5.6.1 Establishing data accuracy .................................................................................................... 47
5.6.2 Strategies to account for uncertainty ...................................................................................... 48
5.6.3 The benefit of accounting for data uncertainty ....................................................................... 48
5.7 Next Steps for Jersey City in the Benefit-Cost Analysis Process............................................ 48
6. Regional Connections, Implementation, and Next Steps ....................................................... 51
6.1 General Requirements of Together North Jersey Final Report Guidance .............................. 51
6.2 Specific Requirements of Together North Jersey Final Report Guidance ............................... 51
6.2.1 Engagement and Consideration of Traditionally Under-represented Communities ................ 51
6.2.2 Study Recommendations in the RPSD Context ..................................................................... 52
7. References ............................................................................................................................ 54
Appendix A .......................................................................................................................................... 55
Appendix B .......................................................................................................................................... 56
Visualizations of Adaptation Scenarios and Next Steps White Paper Page 6 of 56
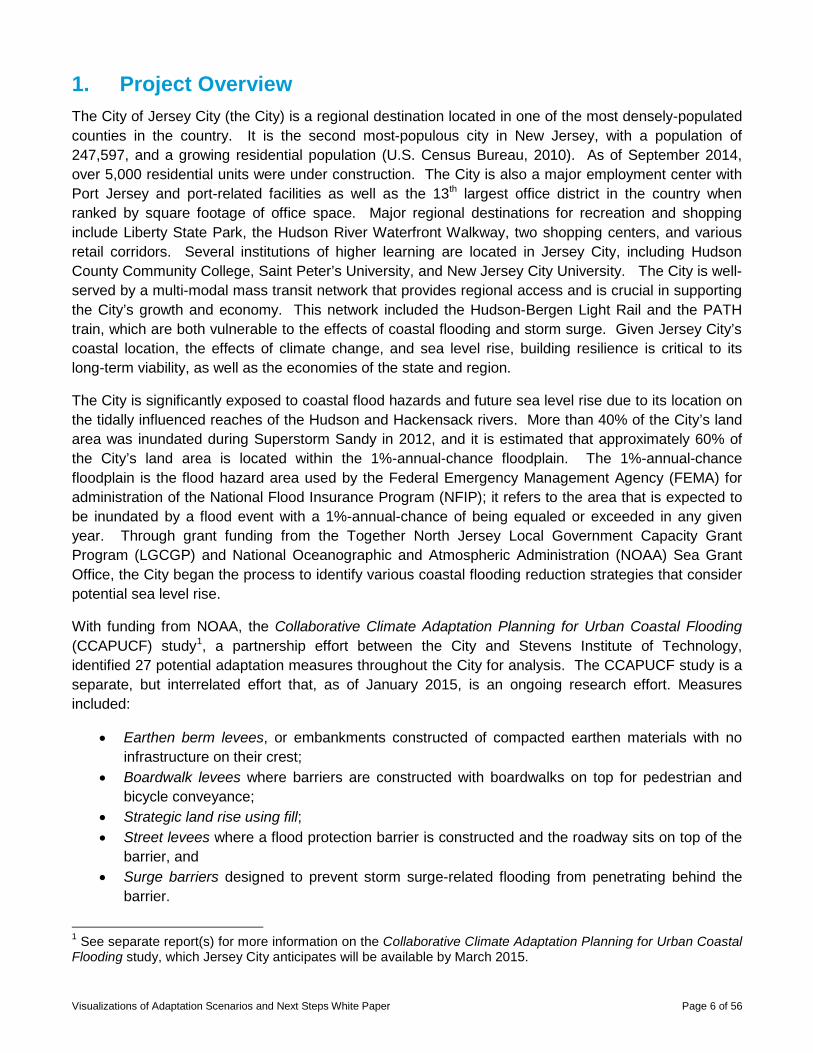
1. Project Overview The City of Jersey City (the City) is a regional destination located in one of the most densely-populated counties in the country. It is the second most-populous city in New Jersey, with a population of 247,597, and a growing residential population (U.S. Census Bureau, 2010). As of September 2014, over 5,000 residential units were under construction. The City is also a major employment center with Port Jersey and port-related facilities as well as the 13th largest office district in the country when ranked by square footage of office space. Major regional destinations for recreation and shopping include Liberty State Park, the Hudson River Waterfront Walkway, two shopping centers, and various retail corridors. Several institutions of higher learning are located in Jersey City, including Hudson County Community College, Saint Peter’s University, and New Jersey City University. The City is well-served by a multi-modal mass transit network that provides regional access and is crucial in supporting the City’s growth and economy. This network included the Hudson-Bergen Light Rail and the PATH train, which are both vulnerable to the effects of coastal flooding and storm surge. Given Jersey City’s coastal location, the effects of climate change, and sea level rise, building resilience is critical to its long-term viability, as well as the economies of the state and region.
The City is significantly exposed to coastal flood hazards and future sea level rise due to its location on the tidally influenced reaches of the Hudson and Hackensack rivers. More than 40% of the City’s land area was inundated during Superstorm Sandy in 2012, and it is estimated that approximately 60% of the City’s land area is located within the 1%-annual-chance floodplain. The 1%-annual-chance floodplain is the flood hazard area used by the Federal Emergency Management Agency (FEMA) for administration of the National Flood Insurance Program (NFIP); it refers to the area that is expected to be inundated by a flood event with a 1%-annual-chance of being equaled or exceeded in any given year. Through grant funding from the Together North Jersey Local Government Capacity Grant Program (LGCGP) and National Oceanographic and Atmospheric Administration (NOAA) Sea Grant Office, the City began the process to identify various coastal flooding reduction strategies that consider potential sea level rise.
With funding from NOAA, the Collaborative Climate Adaptation Planning for Urban Coastal Flooding (CCAPUCF) study1, a partnership effort between the City and Stevens Institute of Technology, identified 27 potential adaptation measures throughout the City for analysis. The CCAPUCF study is a separate, but interrelated effort that, as of January 2015, is an ongoing research effort. Measures included:
• Earthen berm levees, or embankments constructed of compacted earthen materials with no infrastructure on their crest;
• Boardwalk levees where barriers are constructed with boardwalks on top for pedestrian and bicycle conveyance;
• Strategic land rise using fill; • Street levees where a flood protection barrier is constructed and the roadway sits on top of the
barrier, and • Surge barriers designed to prevent storm surge-related flooding from penetrating behind the
barrier.
1 See separate report(s) for more information on the Collaborative Climate Adaptation Planning for Urban Coastal Flooding study, which Jersey City anticipates will be available by March 2015.

Visualizations of Adaptation Scenarios and Next Steps White Paper Page 7 of 56
All measures assume a conceptual crest elevation of 14 ft. North American Vertical Datum 1988 (NAVD88). This elevation represents approximate Superstorm Sandy high-water marks in the City, plus an upper (90th percentile) sea level rise projection at the year 2050 established by the New York City Panel on Climate Change (2013). As it is used in this project, the 14 ft. NAVD88 crest elevation does not correspond to a specific return period, which is the likelihood of a given flood event occurring within a particular time period, or a specific historical event. Rather, conceptually, the measures are designed for a coastal storm event which produces a storm surge elevation of up to 14 ft. NAVD88. The heights of the adaptation measures vary by location and are measured as the distance between current grade elevation and the assumed crest elevation.
As part of the CCAPUCF study, Stevens Institute of Technology performed advanced storm surge modeling to understand the effectiveness of the measures in reducing the risk of coastal flooding. The 27 adaptation measures were incorporated into the 2-dimensional Advanced Circulation (ADCIRC) model and storm simulations were executed to understand coastal flood effects under both with- and without-project (i.e., existing) conditions. A summary of the various sets of simulations appears in Section 2. Figure 1 illustrates a sample model output produced as part of the CCAPUCF study. This modeling effort analyzed storm surge only. There was no quantification of rainfall, sewer systems, land porosity (for surface water infiltration), pumping systems, or sewer blockage. None of the adaptation measures were designed to address rainfall or stormwater issues. There was no quantification of how rainfall drainage patterns will be increasingly affected as sea level increases. The model results are captured in the CCAPUCF report. Adaptation measures were explored at a conceptual level; future studies will include detailed benefit-cost analyses and preliminary engineering design work as resources allow.
In addition to products such as the graphic contained in Figure 1, products that illustrate and clearly communicate adaptation concepts to the public were needed. In order to support the outreach effort, the City developed true-to-life visualizations for a subset of the identified adaptation measures with funding from the LGCGP. This subset of measures represents those locations within the city where the adaptation measures might have the the most significant impacts to the city’s visual landscape and is not representative of all locations for which concept adaptation measures were identified. Using ground-level photography, these visualizations illustrate how the adaptation measures might appear in these select locations. The LGCGP effort also included the preparation of a The City of Jersey City, NJ – Flood Adaptation Strategy Next Steps White Paper, which is intended to guide the City in future decision-making and pursuit of a comprehensive flood adaptation strategy. It can be found
Figure 1: Peak flood elevations from ADCIRC model simulation in Jersey City, NJ and vicinity.
Visualizations of Adaptation Scenarios and Next Steps White Paper Page 8 of 56
in Section 5 of this report. This document serves as a road map for the City in the scoping and development of an approach to the preparation of a benefit-cost analysis of adaptation measures.
Together, the ADCIRC modeling, the visualizations, and the white paper provide critical tools and information to guide pursuit of flood risk reduction actions.
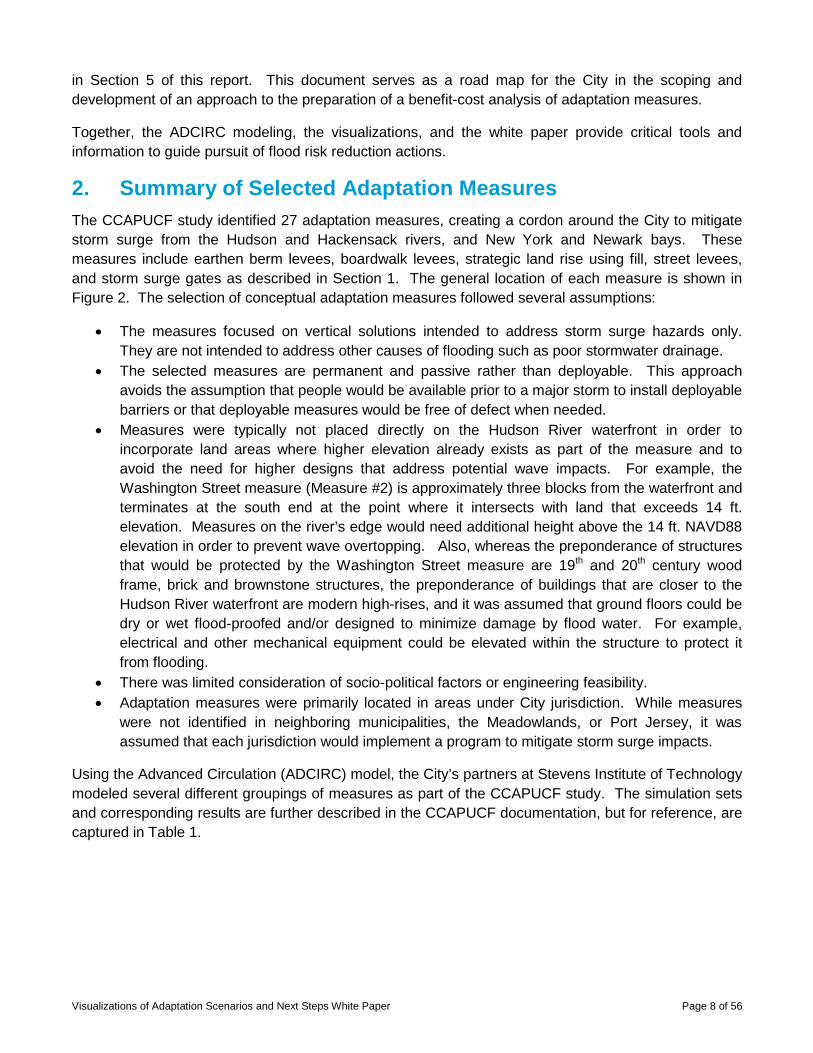
2. Summary of Selected Adaptation Measures
The CCAPUCF study identified 27 adaptation measures, creating a cordon around the City to mitigate storm surge from the Hudson and Hackensack rivers, and New York and Newark bays. These measures include earthen berm levees, boardwalk levees, strategic land rise using fill, street levees, and storm surge gates as described in Section 1. The general location of each measure is shown in Figure 2. The selection of conceptual adaptation measures followed several assumptions:
• The measures focused on vertical solutions intended to address storm surge hazards only. They are not intended to address other causes of flooding such as poor stormwater drainage.
• The selected measures are permanent and passive rather than deployable. This approach avoids the assumption that people would be available prior to a major storm to install deployable barriers or that deployable measures would be free of defect when needed.
• Measures were typically not placed directly on the Hudson River waterfront in order to incorporate land areas where higher elevation already exists as part of the measure and to avoid the need for higher designs that address potential wave impacts. For example, the Washington Street measure (Measure #2) is approximately three blocks from the waterfront and terminates at the south end at the point where it intersects with land that exceeds 14 ft. elevation. Measures on the river’s edge would need additional height above the 14 ft. NAVD88 elevation in order to prevent wave overtopping. Also, whereas the preponderance of structures that would be protected by the Washington Street measure are 19th and 20th century wood frame, brick and brownstone structures, the preponderance of buildings that are closer to the Hudson River waterfront are modern high-rises, and it was assumed that ground floors could be dry or wet flood-proofed and/or designed to minimize damage by flood water. For example, electrical and other mechanical equipment could be elevated within the structure to protect it from flooding.
• There was limited consideration of socio-political factors or engineering feasibility. • Adaptation measures were primarily located in areas under City jurisdiction. While measures
were not identified in neighboring municipalities, the Meadowlands, or Port Jersey, it was assumed that each jurisdiction would implement a program to mitigate storm surge impacts.
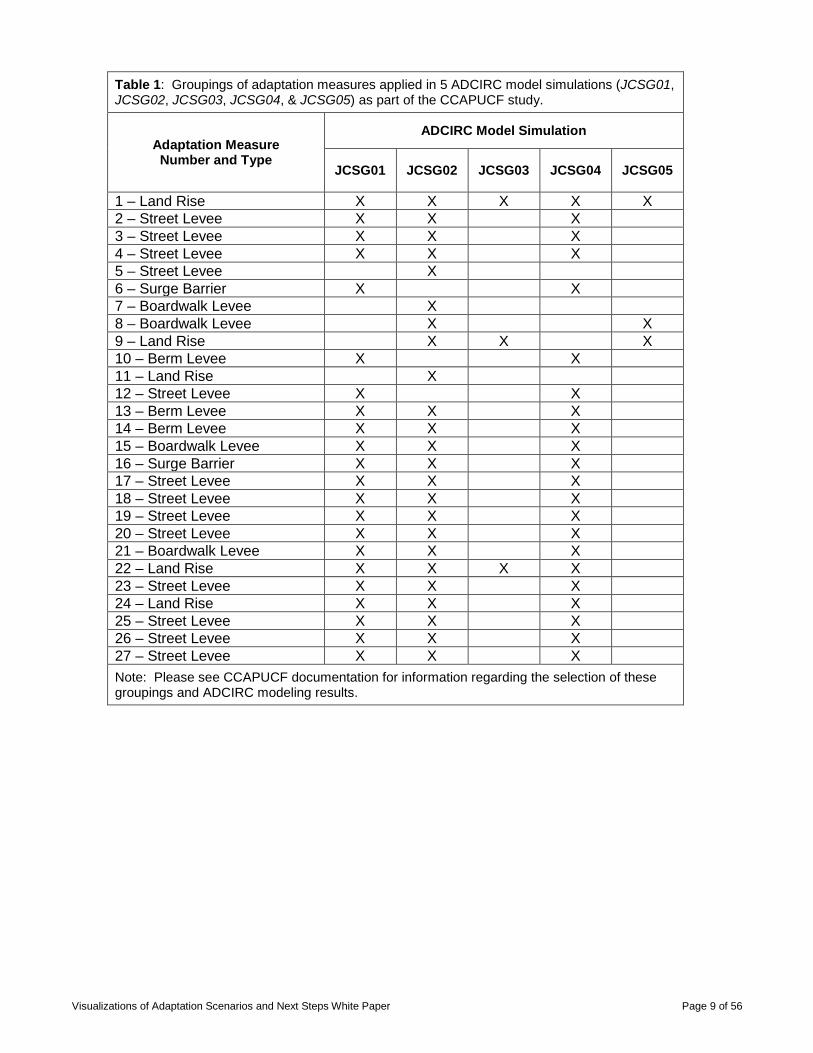
Using the Advanced Circulation (ADCIRC) model, the City’s partners at Stevens Institute of Technology modeled several different groupings of measures as part of the CCAPUCF study. The simulation sets and corresponding results are further described in the CCAPUCF documentation, but for reference, are captured in Table 1.
Visualizations of Adaptation Scenarios and Next Steps White Paper Page 9 of 56
Table 1: Groupings of adaptation measures applied in 5 ADCIRC model simulations (JCSG01, JCSG02, JCSG03, JCSG04, & JCSG05) as part of the CCAPUCF study.
Adaptation Measure Number and Type
ADCIRC Model Simulation
JCSG01 JCSG02 JCSG03 JCSG04 JCSG05
1 – Land Rise X X X X X 2 – Street Levee X X X 3 – Street Levee X X X 4 – Street Levee X X X 5 – Street Levee X 6 – Surge Barrier X X 7 – Boardwalk Levee X 8 – Boardwalk Levee X X 9 – Land Rise X X X 10 – Berm Levee X X 11 – Land Rise X 12 – Street Levee X X 13 – Berm Levee X X X 14 – Berm Levee X X X 15 – Boardwalk Levee X X X 16 – Surge Barrier X X X 17 – Street Levee X X X 18 – Street Levee X X X 19 – Street Levee X X X 20 – Street Levee X X X 21 – Boardwalk Levee X X X 22 – Land Rise X X X X 23 – Street Levee X X X 24 – Land Rise X X X 25 – Street Levee X X X 26 – Street Levee X X X 27 – Street Levee X X X Note: Please see CCAPUCF documentation for information regarding the selection of these groupings and ADCIRC modeling results.

Visualizations of Adaptation Scenarios and Next Steps White Paper Page 10 of 56
Figure 2: Map of conceptual coastal flood adaptation strategies for the City of Jersey City, NJ.
Visualizations of Adaptation Scenarios and Next Steps White Paper Page 11 of 56
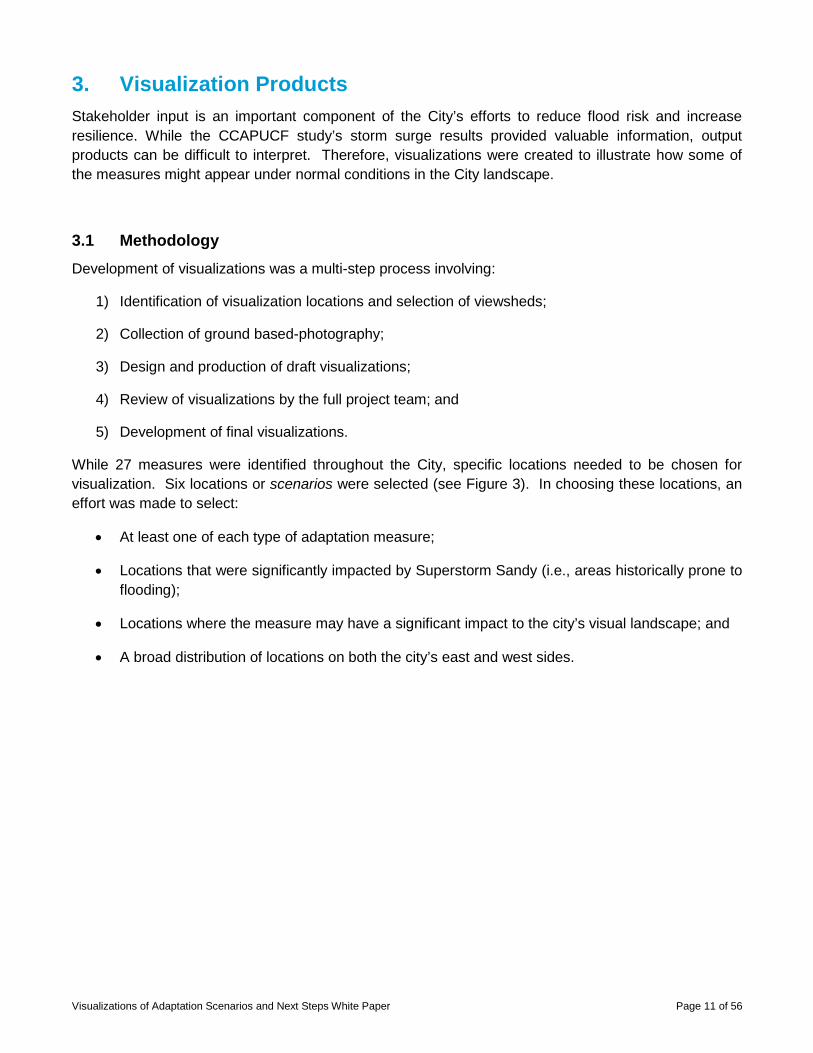
3. Visualization Products Stakeholder input is an important component of the City’s efforts to reduce flood risk and increase resilience. While the CCAPUCF study’s storm surge results provided valuable information, output products can be difficult to interpret. Therefore, visualizations were created to illustrate how some of the measures might appear under normal conditions in the City landscape.
3.1 Methodology Development of visualizations was a multi-step process involving:
1) Identification of visualization locations and selection of viewsheds;
2) Collection of ground based-photography;
3) Design and production of draft visualizations;
4) Review of visualizations by the full project team; and
5) Development of final visualizations.
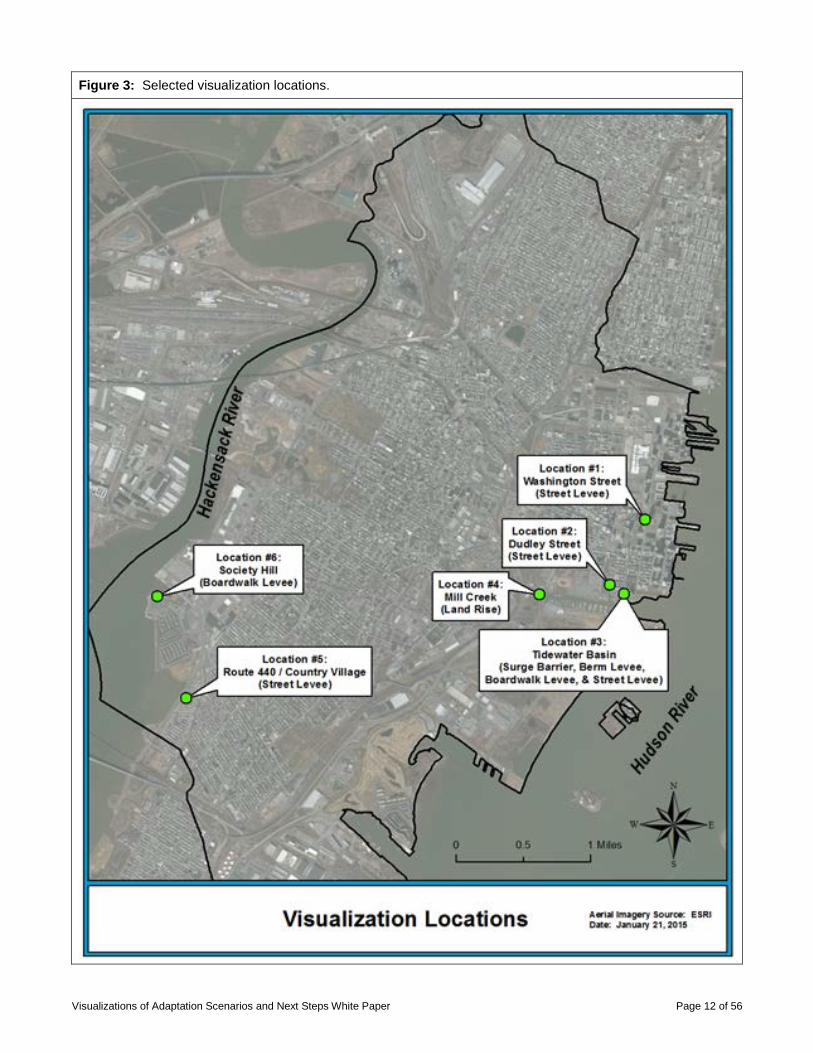
While 27 measures were identified throughout the City, specific locations needed to be chosen for visualization. Six locations or scenarios were selected (see Figure 3). In choosing these locations, an effort was made to select:
• At least one of each type of adaptation measure;
• Locations that were significantly impacted by Superstorm Sandy (i.e., areas historically prone to flooding);
• Locations where the measure may have a significant impact to the city’s visual landscape; and
• A broad distribution of locations on both the city’s east and west sides.
Visualizations of Adaptation Scenarios and Next Steps White Paper Page 12 of 56
Figure 3: Selected visualization locations.

Visualizations of Adaptation Scenarios and Next Steps White Paper Page 13 of 56
Photographs taken in May 2014 provided existing background images of the areas over which the visualization model would be rendered. A three-dimensional surface model depicting existing ground elevation was created using a topographic dataset provided by the City. As mentioned in Section 1, measures were drawn to a 14 ft. NAVD88 crest elevation within the model, which is scaled based on existing conditions. Proposed models were then overlaid on existing conditions photographs using on-the-ground features as control points. Virtual cameras were set up within the computer aided drafting (CAD) file to mimic each photograph view. The view was then rendered to create a realistic, high quality image using Bentley Microstation and Autodesk Maya software.
Sections 3.2.1 through 3.2.6 provide a summary of each of the six visualization scenarios. Approximately three to five visualizations were developed for each scenario. Each of these visualizations focuses on a different perspective or view. Visualizations are compiled in documents formatted to 11” x 17” page size along with raw image files in Appendix A. Large 36” x 48” poster boards were created for each scenario that incorporated the visualizations. Each board includes a written description of the measures depicted, a map of the location of interest, and three or four visualizations of the adaptation measure with corresponding photos of existing conditions. Boards were displayed at stakeholder and public meetings held as part of this project and may be used for future outreach efforts as well. Digital versions of these boards are in Appendix A; hard copies are stored with the Jersey City Division of City Planning. While the boards and visualizations are best viewed full-size in person or digitally, board images are provided in Figure 4 through Figure 9 to give a sense of the products developed. In addition to the poster boards, a handout brochure with an overview of the project was created for distribution at meetings with stakeholders. This is contained in Appendix A.
While the visualizations are accurate renderings of the adaptation measures in the existing context, the depicted design of the adaptation measures does not optimize aesthetics or context sensitivity. It was a deliberate decision to visualize the fundamental essence of these measures in order to focus on their function as barriers to storm surge. Future study, design, and engineering will be necessary for all adaptation measures. The visualizations were intended to introduce the conceptual adaptation measures to stakeholders for feedback. Furthermore, the creation of visualizations for an adaptation measure does not imply that the measure has been proven effective or that the measure will be advanced. The effectiveness of measures in reducing the potential for storm surge inundation is being addressed in the CCAPUCF study.
3.2 Photography Collection Ground-based photography was collected to provide base images for use in development of visualizations. A Canon 5D DSLR camera with various lens kits was used. Prior to commencing photography collection, locations of interest and view sheds were identified and mapped by both the LGCGP and CCAPUCF project teams. The ground photography team conducted field visits and photography collection accompanied by Jersey City staff on May 2, 2014 and May 6, 2014. A small collection of supplemental photographs were taken on June 30, 2014.
The ground photography team took images from different angles and elevations using vantages from existing topography, street furniture, step ladders, and buildings. Viewsheds were adjusted in the field according to field conditions as well as suggestions from Jersey City staff and the ground photography team. The team took over 800 ground photographs over the course of the project. All photographs collected during the project are on file with the Jersey City Division of City Planning.

Visualizations of Adaptation Scenarios and Next Steps White Paper Page 14 of 56
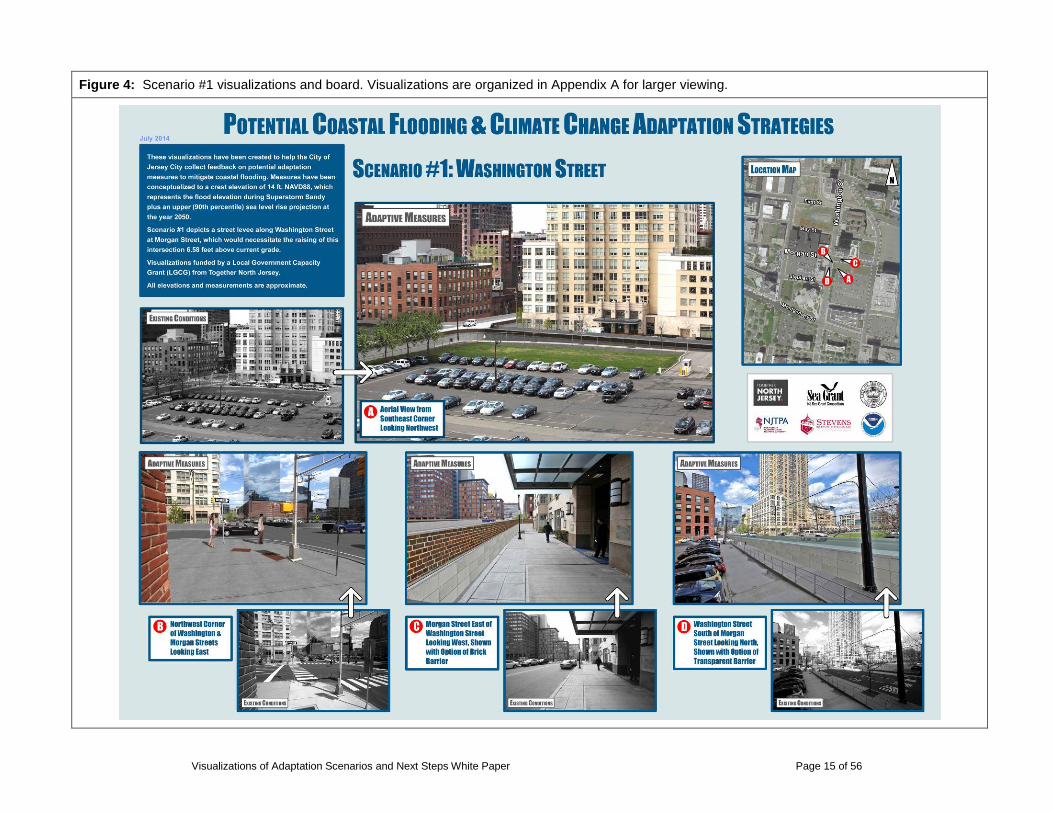
3.2.1 Scenario 1: Washington Street Scenario #1 depicts a street levee along Washington Street at the intersection with Morgan Street, which would necessitate the raising of this intersection by approximately 6-7 ft. above current grade. This location was selected for visualization because it is one of the lowest lying points along Washington Street and is therefore a location where the elevated street would be particularly “tall” relative to adjacent grade. This location is three blocks west of the Hudson River, and the scenario assumes that properties east of the street levee, which are mostly modern high rise buildings, could be designed or retrofitted to withstand flooding. As depicted, this adaptation measure would raise the elevation of the cartway and not the sidewalks, and locate a wall approximately 15 ft. from the front entrance to Trump Tower, the tallest residential building in New Jersey, creating challenges related to aesthetics and access.
Visualizations of Adaptation Scenarios and Next Steps White Paper Page 15 of 56
Figure 4: Scenario #1 visualizations and board. Visualizations are organized in Appendix A for larger viewing.

Visualizations of Adaptation Scenarios and Next Steps White Paper Page 16 of 56
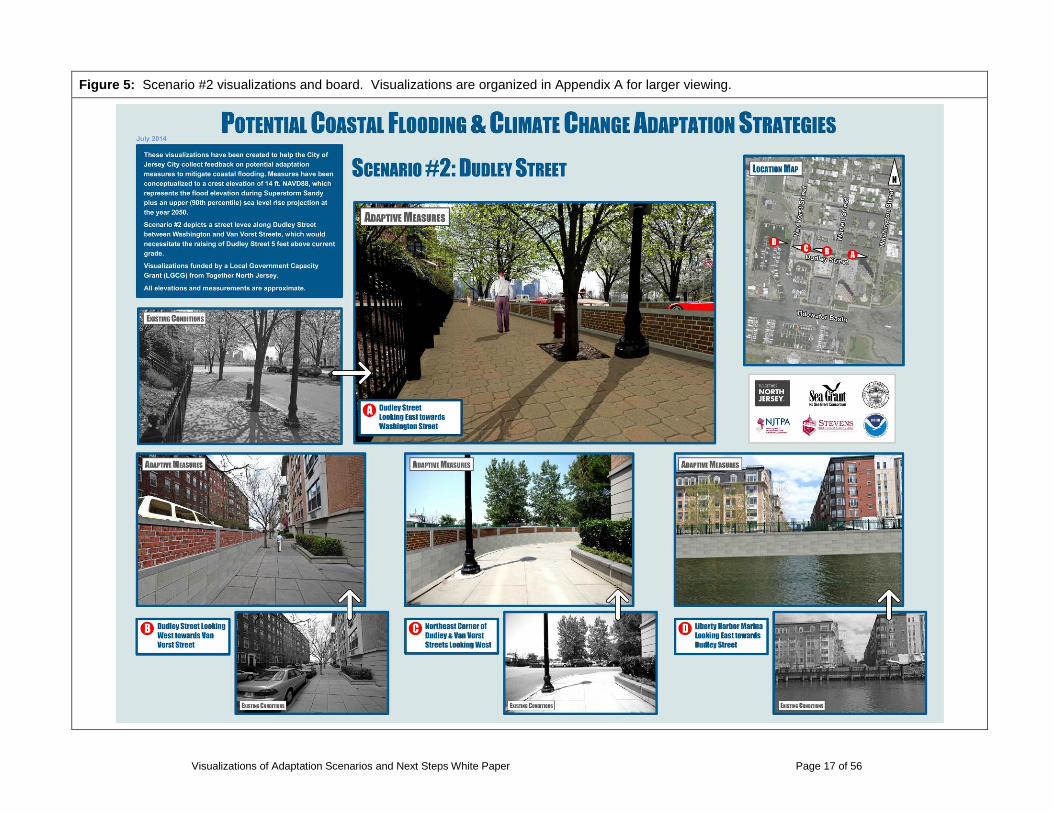
3.2.2 Scenario 2: Dudley Street Scenario #2 depicts a street levee along Dudley Street between Washington and Van Vorst streets, which would necessitate the raising of Dudley Street by as much as approximately 5 ft. above current grade. As depicted, this adaptation measure would raise the elevation of the cartway and not the sidewalk. Conceptually, an elevated Dudley Street would restrict the propagation of storm surge into downtown Jersey City from the Tidewater Basin, one of the more vulnerable locations along the Hudson River. Like Scenario #1, this adaptation measure creates challenges related to aesthetics and access for both pedestrians and vehicles.
Visualizations of Adaptation Scenarios and Next Steps White Paper Page 17 of 56
Figure 5: Scenario #2 visualizations and board. Visualizations are organized in Appendix A for larger viewing.
Visualizations of Adaptation Scenarios and Next Steps White Paper Page 18 of 56
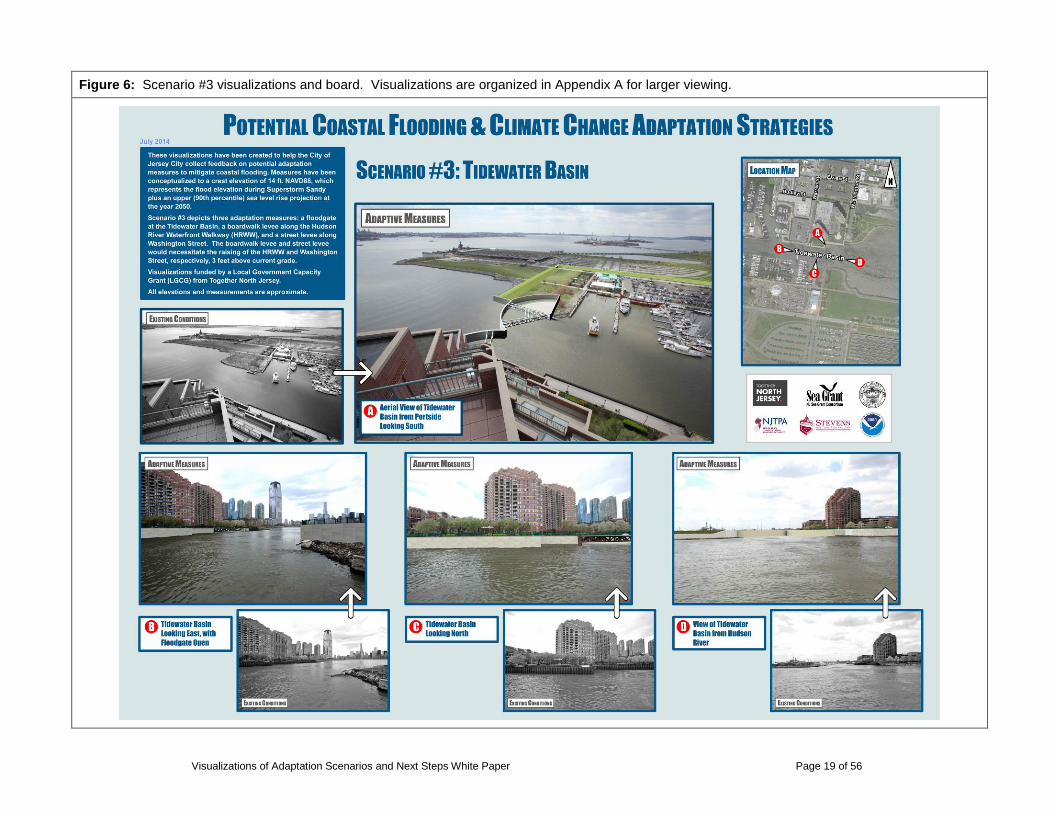
3.2.3 Scenario 3: Tidewater Basin Scenario #3 depicts four adaptation measures: a floodgate at the Tidewater Basin, an earthen berm levee in Liberty State Park, a boardwalk levee along the Hudson River Waterfront Walkway (HRWW), and a street levee along Washington Street. The boardwalk levee and street levee would necessitate the raising of both the HRWW and Washington Street 3 ft. above current grade. There are a variety of different floodgate or storm surge barrier types constructed throughout the world. For purposes of the visualizations, a horizontally moving or rotating gate was chosen. Under normal circumstances, the floodgate would remain open to allow for boat and ferry access from the marina in the Tidewater Basin to the Hudson River.
Visualizations of Adaptation Scenarios and Next Steps White Paper Page 19 of 56
Figure 6: Scenario #3 visualizations and board. Visualizations are organized in Appendix A for larger viewing.
Visualizations of Adaptation Scenarios and Next Steps White Paper Page 20 of 56
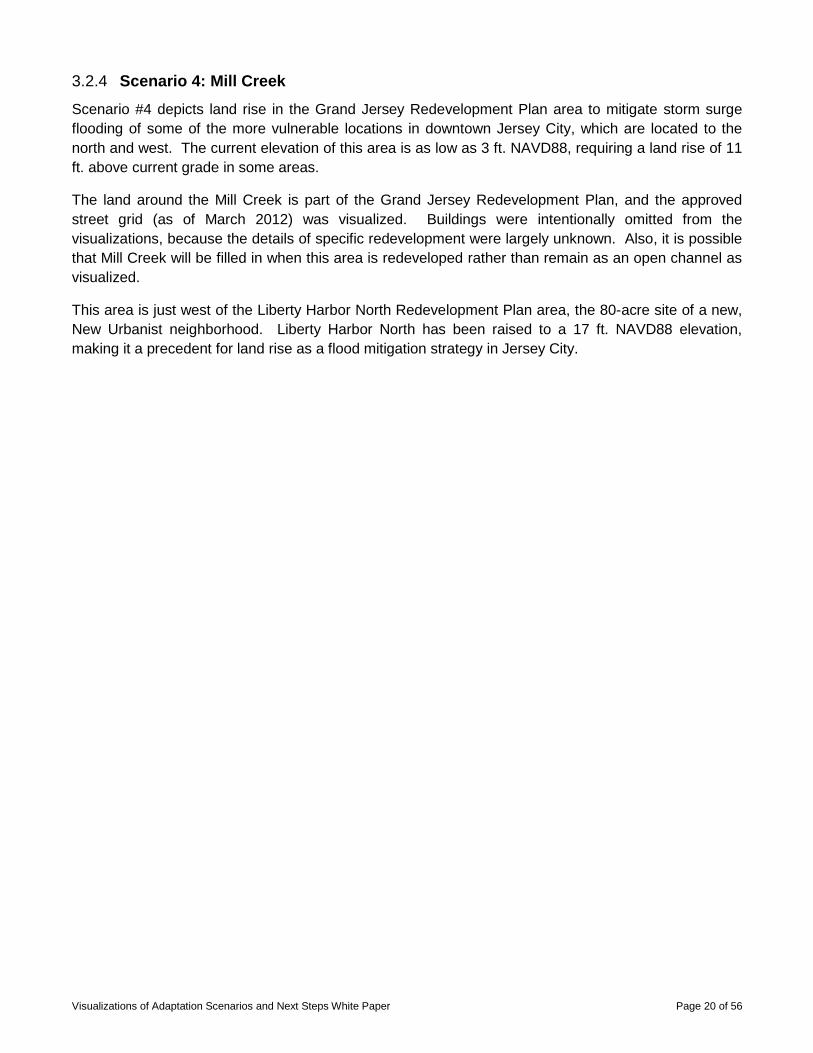
3.2.4 Scenario 4: Mill Creek Scenario #4 depicts land rise in the Grand Jersey Redevelopment Plan area to mitigate storm surge flooding of some of the more vulnerable locations in downtown Jersey City, which are located to the north and west. The current elevation of this area is as low as 3 ft. NAVD88, requiring a land rise of 11 ft. above current grade in some areas.
The land around the Mill Creek is part of the Grand Jersey Redevelopment Plan, and the approved street grid (as of March 2012) was visualized. Buildings were intentionally omitted from the visualizations, because the details of specific redevelopment were largely unknown. Also, it is possible that Mill Creek will be filled in when this area is redeveloped rather than remain as an open channel as visualized.
This area is just west of the Liberty Harbor North Redevelopment Plan area, the 80-acre site of a new, New Urbanist neighborhood. Liberty Harbor North has been raised to a 17 ft. NAVD88 elevation, making it a precedent for land rise as a flood mitigation strategy in Jersey City.
Visualizations of Adaptation Scenarios and Next Steps White Paper Page 21 of 56
Figure 7: Scenario #4 visualizations and board. Visualizations are organized in Appendix A for larger viewing.
Visualizations of Adaptation Scenarios and Next Steps White Paper Page 22 of 56
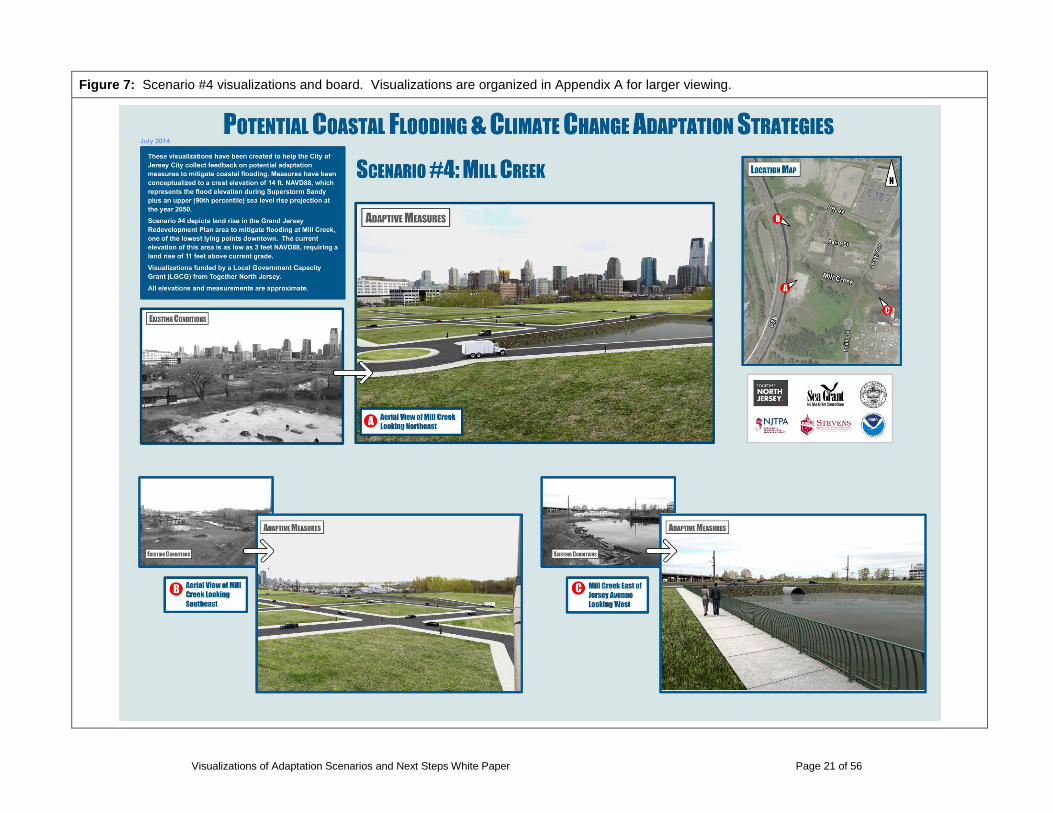
3.2.5 Scenario 5: Route 440/Country Village Scenario #5 depicts a street levee along Route 440 at its intersection with Pinecrest Road at the edge of the Country Village neighborhood. This measure, which would mitigate storm surge from the Hackensack River, would require raising Route 440 by approximately 3-4 ft. above current grade. Since this section of Route 440 does not currently experience a large amount of pedestrian traffic, there is relatively minimal concern regarding impact to pedestrian activity compared to other adaptation measures. However, there is concern that raising Route 440 would restrict vehicular access as well as block views and overall access from Country Village to the Hackensack River, which is on the other side of Route 440.

Visualizations of Adaptation Scenarios and Next Steps White Paper Page 23 of 56
Figure 8: Scenario #5 visualizations and board. Visualizations are organized in Appendix A for larger viewing.

Visualizations of Adaptation Scenarios and Next Steps White Paper Page 24 of 56
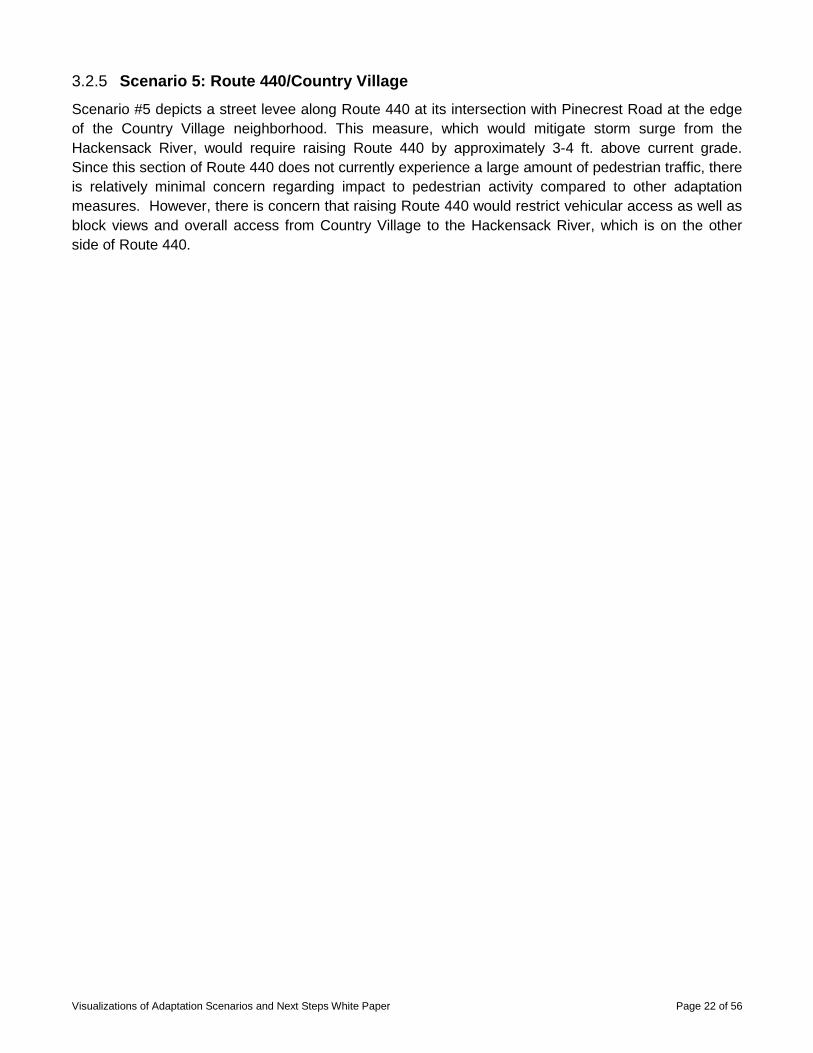
3.2.6 Scenario 6: Society Hill Scenario #6 depicts a boardwalk levee in Society Hill along the Hackensack River waterfront. This measure would require raising the existing Hackensack Riverwalk approximately 5-6 ft. above current grade at this location.
Visualizations of Adaptation Scenarios and Next Steps White Paper Page 25 of 56
Figure 9: Scenario #6 visualizations and board. Visualizations are organized in Appendix A for larger viewing.

Visualizations of Adaptation Scenarios and Next Steps White Paper Page 26 of 56
4. Meetings Summary & Stakeholder Outreach 4.1 Coordination Meetings with CCAPUCF Study Team
The project teams from both the LGCGP and the CCAPUCF studies formally met twice to coordinate efforts. The purpose of the meeting on April 29, 2014 was to identify the six scenarios for visualization, determine critical photography needs, and discuss the layout and content of the display boards. On May 28, 2014, the project teams met again to review draft visualizations and boards and to provide feedback on draft work products prior to the Jersey City Resiliency Task Force meeting.
4.2 Resiliency Task Force Meeting Draft visualizations and boards were presented to the Resiliency Task Force on June 12, 2014. The Resiliency Task Force was convened as a sounding board for the CCAPUCF study and consists of representatives from various City offices and agencies, as well as representatives from Hudson County, Hoboken, and Secaucus, with an interest in flood mitigation. The purpose of this meeting was to present the visualizations and poster board proofs to the Resiliency Task Force prior to presentation to the public. Detailed minutes including a list of attendees and all comments received are contained in Appendix B.
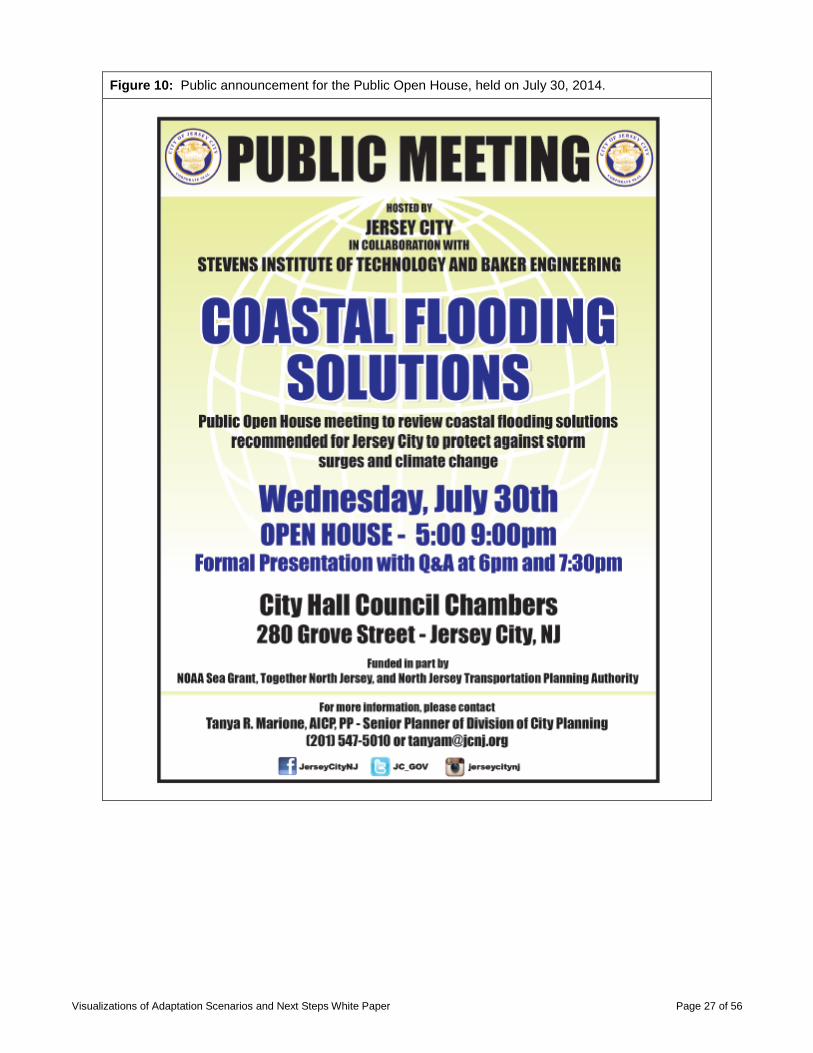
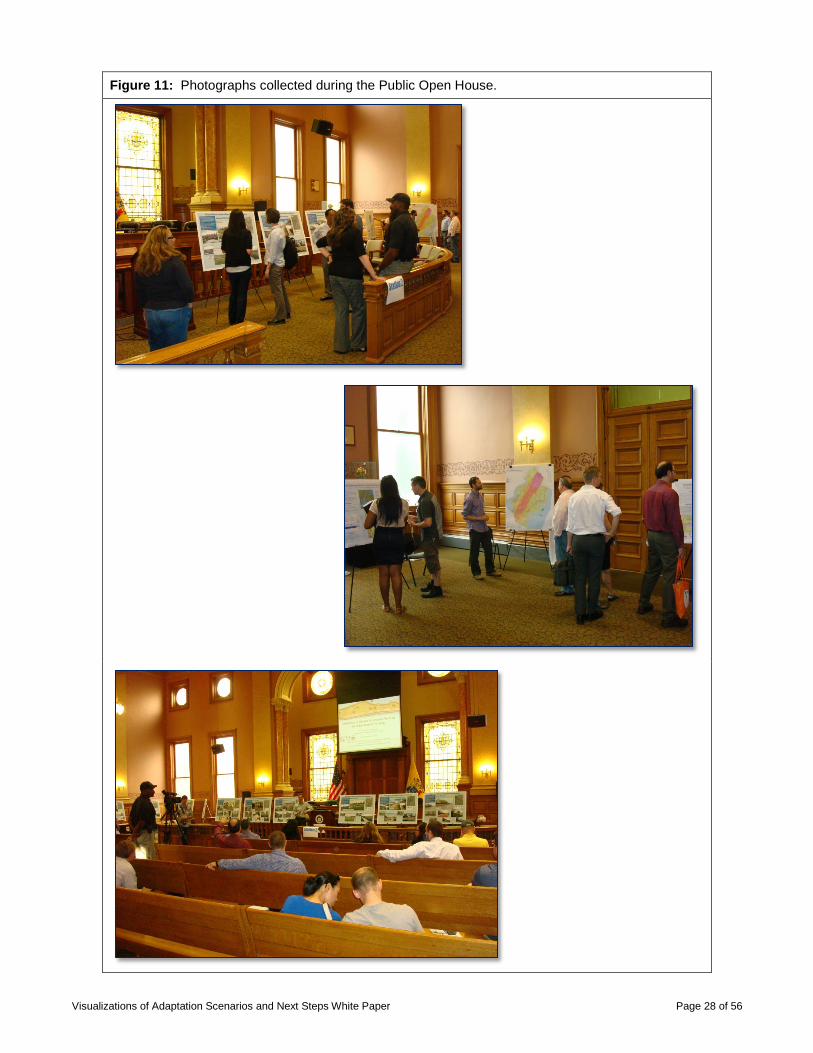
4.3 Public Open House The major outreach milestone for the project was the public open house, held on July 30, 2014 from 5-9 PM at City Hall in Jersey City. Hosted by the City of Jersey City, this meeting provided an open forum to give the public a comprehensive overview of project efforts and solicit feedback on the adaptation measures. Approximately 50 people attended. Materials from both the CCAPUCF and the LGCGP studies were on display, including the six poster boards of the visualizations, a map of all 27 measures, and a summary of the ADCIRC model. Members of both study teams were available to interact with members of the public, and Dr. Philip Orton of Stevens Institute of Technology gave a formal presentation at 6 PM and again at 7:30PM. After the open house, meeting materials were posted to a dedicated webpage on the City website, and a public comment period was held through August 8, 2014. The announcement for the public meeting is shown in Figure 10 and a compilation of attendees and all comments received are contained in Appendix B. Figure 11 contains a few pictures collected during the event.
Visualizations of Adaptation Scenarios and Next Steps White Paper Page 27 of 56
Figure 10: Public announcement for the Public Open House, held on July 30, 2014.
Visualizations of Adaptation Scenarios and Next Steps White Paper Page 28 of 56
Figure 11: Photographs collected during the Public Open House.

Visualizations of Adaptation Scenarios and Next Steps White Paper Page 29 of 56
4.4 Sustainable Cities Conference The City of Jersey City hosted the 2014 Sustainability Conference on October 1, 2014. Approximately 75 people attended. The focus of the 2014 conference was the impact of climate change on coastal communities and the on-going efforts to build resilience. Panel 2, Solutions and Adaptations, included a presentation on the LGCGP study by Steve Eberbach, the project manager of the consultant team led by Michael Baker International. Dr. Philip Orton of Stevens Institute of Technology gave a presentation on the CCAPUCF study during Panel 3, Solution Implementation. The conference provided an opportunity to further publicize project efforts and collect comments from attendees. The public announcement for the conference is shown in Figure 12, and Microsoft PowerPoint slides from the presentation given at the conference are contained in Appendix B. Figure 13 contains a photograph collected during the event.

Visualizations of Adaptation Scenarios and Next Steps White Paper Page 30 of 56
Figure 12: Public announcement for the Jersey City 2014 Annual Sustainability Conference, held on October 1, 2014.

Visualizations of Adaptation Scenarios and Next Steps White Paper Page 31 of 56
Figure 13: Photograph collected during the Sustainable Cities Conference.
Visualizations of Adaptation Scenarios and Next Steps White Paper Page 32 of 56
5. Next Steps White Paper
5.1 Introduction
A detailed investigation of the costs and benefits associated with adaptation measures is anticipated as a future phase of resilience planning in Jersey City. Future analysis is needed to fully quantify the tradeoffs associated with the measures. The City of Jersey City, NJ – Flood Adaptation Strategy Next Steps White Paper was developed to provide a working framework for the analysis to guide the City in future decision-making and pursuit of a comprehensive flood adaptation strategy. This white paper has been integrated into the report herein as Section 5.
5.2 White Paper Goals This white paper serves as a road map for the City in the scoping and development of an approach to the preparation of a benefit-cost analysis of adaptation measures. The City received grant funding from the National Oceanic and Atmospheric Administration Sea Grant program for the Collaborative Climate Adaptation Planning For Coastal Flooding study to identify and analyze potential adaptation measures. In addition, the City received a Local Government Capacity Grant from Together North Jersey to prepare visualizations of a subset of potential adaptation measures and this white paper. Neither grant award provided resources for a full benefit-cost analysis, which is considered a major follow-up action to these initial efforts. The white paper presents the best practices for the development of this economic analysis and an exploration of requirements moving forward. The paper has two primary goals:
1) Identify the value of a benefit-cost analysis and establish the need to fund and complete a thorough benefit-cost analysis study.
2) Provide a basic methodological framework for evaluating the estimated costs and the expected benefits associated with the adaptation measures. This includes identification of data requirements and benefit-cost modeling parameters needed to comprehensively understand the economics of a project, including social, economic, financial, public safety, public health, disaster preparedness, and property value factors.
5.3 Benefit-Cost Analysis Overview Benefit-cost analysis is the method by which the future benefits of a flood adaptation project are estimated and compared to the project’s cost. Results from this analysis reveal whether the project is cost-effective; that is, where cumulative project benefits exceed project costs. These analyses can be very simplistic, focusing on only a single set of benefits and one-time costs. However, long-term planning and responsible decision-making require comprehensive analysis where, for example, social, economic, financial, public safety, public health, disaster preparedness, and property value factors are included, and construction, operation, and maintenance costs over the life of a project are considered.
The calculation of benefits for a proposed adaptation project entails estimating the present value of the sum of the expected avoided damages and other costs over the project useful life. The process takes into consideration:
1) probabilities of various levels of flooding events and associated costs; 2) the useful lifetime of the project (i.e., how long the project can effectively reduce risk); and 3) the value of money over time.
Visualizations of Adaptation Scenarios and Next Steps White Paper Page 33 of 56
A benefit-cost analysis should clearly describe all of a project’s potential costs and benefits, the data sources used, and the assumptions surrounding those data sources. For example, comparing only the construction costs of an adaptation measure to only flood damages avoided would not yield a robust analysis of all associated costs and benefits. Factors such as long-term project maintenance costs and benefits associated with avoided lost tax revenues should be included. While identifying and predicting all sources of costs and benefits for any given project is a challenge, Section 5.5 summarizes many of the factors and data needs which should be considered as adaptation measures are further evaluated in Jersey City.
5.4 The Value and Need for a Benefit-Cost Analysis
5.4.1 Justifying a project
An evaluation of the costs and benefits of an adaptation project is needed in order to make a decision to move towards preliminary design and project implementation. Large adaptation projects such as those currently being explored in Jersey City are often constrained due to cost concerns. As the cost of a project increases, an accurate, detailed, and comprehensive benefit-cost analysis becomes more critical in order to ensure responsible use of funds. While large flood adaptation projects are expensive, if analyzed properly, they can lead to significant long-term savings and growth for a community. A robust benefit-cost analysis will bolster justification for an effective project and eliminate projects that have limited benefit prior to costly planning and design expenses. In addition, this analysis is often useful for long-term planning and budget allocation.
5.4.2 Grant application support
Project justification is often a requirement for mitigation grant funding opportunities and can be influential for obtaining external funding. Federal and State funding typically requires some form of a benefit-cost analysis be performed. The Federal Emergency Management Agency (FEMA) will only accept Hazard Mitigation Grant Applications that have demonstrated cost effectiveness of the proposed project through one of their approved methods. The U.S. Army Corps of Engineers (USACE) must justify any project that they propose in a similar fashion. State funding requirements vary, but typically require something similar to prove cost-effective use of public funds.
The State of New Jersey’s Community Development Block Grant (CDBG) Disaster Recovery Action Plan (NJ DCA, 2013), a state-wide guide to long-term recovery actions created following Superstorm Sandy, states that economic revitalization is a core goal of the State’s recovery plan. As part of the neighborhood and community revitalization program within the Action Plan, grant funds will be distributed to “support the long-term recovery of small businesses and communities by funding long-term economic revitalization priorities.” Results from a benefit-cost analysis can be used to help demonstrate anticipated economic revitalization.
While there are many federal grant programs, the FEMA Hazard Mitigation Grant Program (HMGP) is the most common funding source for localized flood mitigation. The formation of partnerships with USACE on large-scale regional mitigation projects is common. Projects can be initiated and potentially funded long-term by accessing technical assistance available through USACE. Such partnerships typically require a local sponsor and cost-share arrangement. In addition, there are other Federal programs like the National Fish and Wildlife Foundation grant program for Superstorm Sandy relief.
Visualizations of Adaptation Scenarios and Next Steps White Paper Page 34 of 56
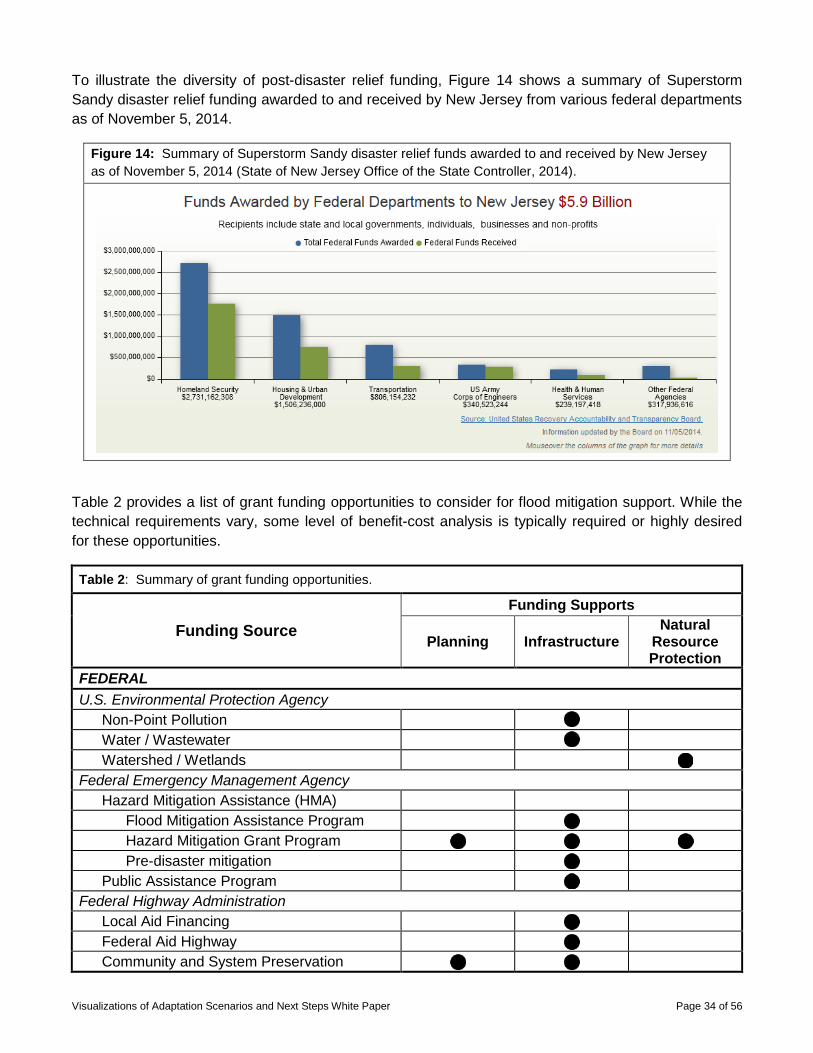
To illustrate the diversity of post-disaster relief funding, Figure 14 shows a summary of Superstorm Sandy disaster relief funding awarded to and received by New Jersey from various federal departments as of November 5, 2014.
Figure 14: Summary of Superstorm Sandy disaster relief funds awarded to and received by New Jersey as of November 5, 2014 (State of New Jersey Office of the State Controller, 2014).
Table 2 provides a list of grant funding opportunities to consider for flood mitigation support. While the technical requirements vary, some level of benefit-cost analysis is typically required or highly desired for these opportunities.
Table 2: Summary of grant funding opportunities.
Funding Source Funding Supports
Planning Infrastructure Natural
Resource Protection
FEDERAL U.S. Environmental Protection Agency
Non-Point Pollution Water / Wastewater Watershed / Wetlands
Federal Emergency Management Agency Hazard Mitigation Assistance (HMA)
Flood Mitigation Assistance Program Hazard Mitigation Grant Program Pre-disaster mitigation
Public Assistance Program Federal Highway Administration
Local Aid Financing Federal Aid Highway Community and System Preservation

Visualizations of Adaptation Scenarios and Next Steps White Paper Page 35 of 56
Table 2: Summary of grant funding opportunities.
Funding Source Funding Supports
Planning Infrastructure Natural
Resource Protection
U.S. Department of Housing and Urban Development Community Development Block Grant – Disaster Recovery (CDBG-DR) Note: these programs are managed by NJ Department of Community Affairs and NJ Department of Environmental Protection.
Blue Acres Buyout Program Infrastructure Programs
Flood Hazard Risk Reduction New Jersey Energy Resilience Bank Non-Federal Cost Shares (Match)
Support for Local Government Entities Essential Public Services
Planning, Oversight, and Monitoring U.S. Department of Agriculture
Conservation Stewardship Wildlife/ Habitat Restoration Emergency Watershed Protection
U.S. Army Corps of Engineers Continuing Authorities Program Emergency Response Program
Water Resource Development Act of 2013 Oceans Endowment Beach / Dunes/ Beneficial Reuse Harbor Maintenance Navigation Mitigation Planning and Studies
STATE NJ Department of Environmental Protection
Flood Hazard Risk Reduction and Resiliency Grant Program
NJ Board of Public Utilities Clean Energy Program Energy Resilience Bank
NJ Economic Development Authority Streetscape Revitalization Clean Energy
NJ Environmental Infrastructure Trust Long Term Sandy Loan Program Water supply Waste water Stormwater, Green Projects

Visualizations of Adaptation Scenarios and Next Steps White Paper Page 36 of 56
Table 2: Summary of grant funding opportunities.
Funding Source Funding Supports
Planning Infrastructure Natural
Resource Protection
Open space Brownfields, Landfill / Redevelopment
OTHER (METROPOLITAN PLANNING ORGANIZATIONS) North Jersey Transportation Planning Authority
Community Planning Local infrastructure grants
PRIVATE 100 Resilient Cities
5.4.2.1 Federal Grant Requirements: FEMA and USACE
Federal benefit-cost analysis requirements vary by agency, but are similar in purpose. All federal executive departments and establishments are to follow the Office of Management and Budget’s Circular No. A-94, which provides guidance for Benefit-Cost Analyses of Federal Programs. Within this guidance, branches of the federal government have their own requirements. The focus of this section will be on the two agencies with the most well-defined requirements, FEMA and USACE. Both organizations have made it a goal to fund projects leading to the reduction of flood risk.
FEMA provides funds through their Hazard Mitigation Assistance (HMA) program via the HMGP, Flood Mitigation Assistance (FMA), and Pre-Disaster Mitigation (PDM) opportunities. State agencies, Indian Tribal governments, and local governments/communities are eligible to apply for all these funding programs, while private non-profit organizations (PNPs) can only apply for HMGP funding. The amount of funding available through the HMA program varies by opportunity. The HMGP funding is allotted post-disaster and is funded by an act of the U.S. Congress.
An application for funding through the HMA program requires a comprehensive and well-documented benefit-cost analysis. FEMA requires the use of one of their approved methods in performing this benefit-cost analysis and recommends using the tools they have developed to ensure that the calculations are done correctly. FEMA-compliant benefit-cost analyses yield a benefit-cost ratio (BCR), which is derived from a project’s total net benefits divided by its total project cost. The BCR is a numerical expression of the cost effectiveness of a project. A project is considered to be cost-effective when the BCR is 1.0 or greater. The Benefit Cost Analysis Reference Guide (FEMA, 2009) provides an overview of the grant programs, application development, benefits and costs, and is available on the FEMA website at: http://www.fema.gov/media-library-data/20130726-1736-25045-7076/bca_reference_guide.pdf.
There are two funding sources from USACE which are listed in Table 2. USACE follows the National Economic Development (NED) objective, which is to maximize increases in the net value of the national output of goods and services. USACE measures these increases (or decreases) by comparing the value produced by the project (benefits) to value of the resources required to produce those benefits.

Visualizations of Adaptation Scenarios and Next Steps White Paper Page 37 of 56
NED benefits for flood control projects are defined as reduced property damages, emergency costs, and avoiding losses. NED costs are defined as materials, labor, other direct construction costs, operation and maintenance costs over a project life, environmental mitigation costs, real estate needed for the project, and other improvements to realize benefits. NED benefits and costs are from the perspective of the federal government, where federal funds are required to achieve the greatest national benefit.
USACE also takes into consideration Regional Economic Development (RED). RED benefits include regional shifts such as employment gains or community sustainability. These gains may not create net economic development benefits to the nation as a whole, but do benefit the community and are considered in the overall selection of an alternative. Input-output analysis is an integral to determining RED impacts. It measures the interdependence among industries in the regional economy. There are a variety of software program available to determine RED impacts, including IMPLAN (Version 3.0), Regional Economic System (RECONS), Regional Input-Output Modeling System (RIMS II), and Recreation Economic Assessment System (REAS).
5.4.2.2 State Programs
In the wake of Superstorm Sandy, there are a variety of grant programs available through the State of New Jersey, the most publicized of which is the Flood Hazard Risk Reduction and Resiliency Grant Program. This is a $50 million program that provides funding for construction-ready flood control projects through a competitive grant process. Projects funded by the grant must address an impact caused by Superstorm Sandy, reduce flooding risk, improve flood resiliency, and meet an unmet need. Benefit-cost analysis must be performed in accordance with FEMA standards. A minimum benefit-cost ratio of 1.0 is required, although projects with ratios exceeding 1.0 are more competitive. The most recent grant application process ended on December 15, 2014.
5.4.3 Establishing Design Elevations
A 14 ft. NAVD88 crest elevation was selected for purposes of conceptualizing adaptation measures. This elevation is further discussed in Section 5.5.1. In addition to justifying the need for the project and meeting grant program requirements, a benefit-cost analysis is used to establish cost-effective or optimal design elevations. The analysis should be structured such that the design elevation will be a free variable, where varying design elevations are accompanied by a range of associated costs and benefits. Typically, as design elevations increase, costs increase. A cost-effective design elevation is achieved when total benefits exceed total costs. An optimal design elevation is derived by determining the elevation which achieves a maximum net benefit. Both cost-effective and optimal design elevations may be higher, lower, or equal to the 14 ft. NAVD88 elevation. There are a multitude of growth rates and slopes that both benefit and cost curves could have relative to changing design elevations. The benefit-cost analysis accurately reveals the shape of these curves and ensures that a given project is not overbuilt, resulting in excessive costs, or underbuilt, yielding insufficient benefits.
5.5 Local / Regional Data Collection Requirements A summary of data requirements and potential data sources needed to complete a benefit-cost analysis is provided in this section, including suggested external study data, empirical evidence, and information
Visualizations of Adaptation Scenarios and Next Steps White Paper Page 38 of 56
found in peer-reviewed literature. The summaries provided in Section 5.5.1 through Section 5.5.6 note whether the data described is typically characterized as a “benefit” or a “cost.” However, these data often do not fall exclusively into a “benefit” or “cost” category, but rather are utilized in a comprehensive analysis to define either costs or benefits depending on how the data is applied. For example, Section 5.5.2 discusses property value data. Property values may be used to calculate potential flood damages (i.e., costs of not adapting). Property values may also be used to quantify damages avoided as a result implementing an adaptation strategy (i.e., benefits of adapting).
Data can be gathered from a multitude of stakeholders. Governments play a particularly important role in present and future data collection as they have access to spatial data on the assets—such as buildings, infrastructure, and environmentally protected areas—and socio-demographics of flood zones (Aerts et al., 2014). Thus, Jersey City staff will play a valuable role in compiling present and future data.
All data considered for use in the project should be examined for accuracy. Different types of data will have different standards of accuracy and different levels of uncertainty. Associated uncertainties should also be accounted for within the benefit-cost analysis so that a range of potential outcomes is captured in the final results. The topic of uncertainty is further discussed in Section 5.6.
5.5.1 Coastal Flood Elevation Information
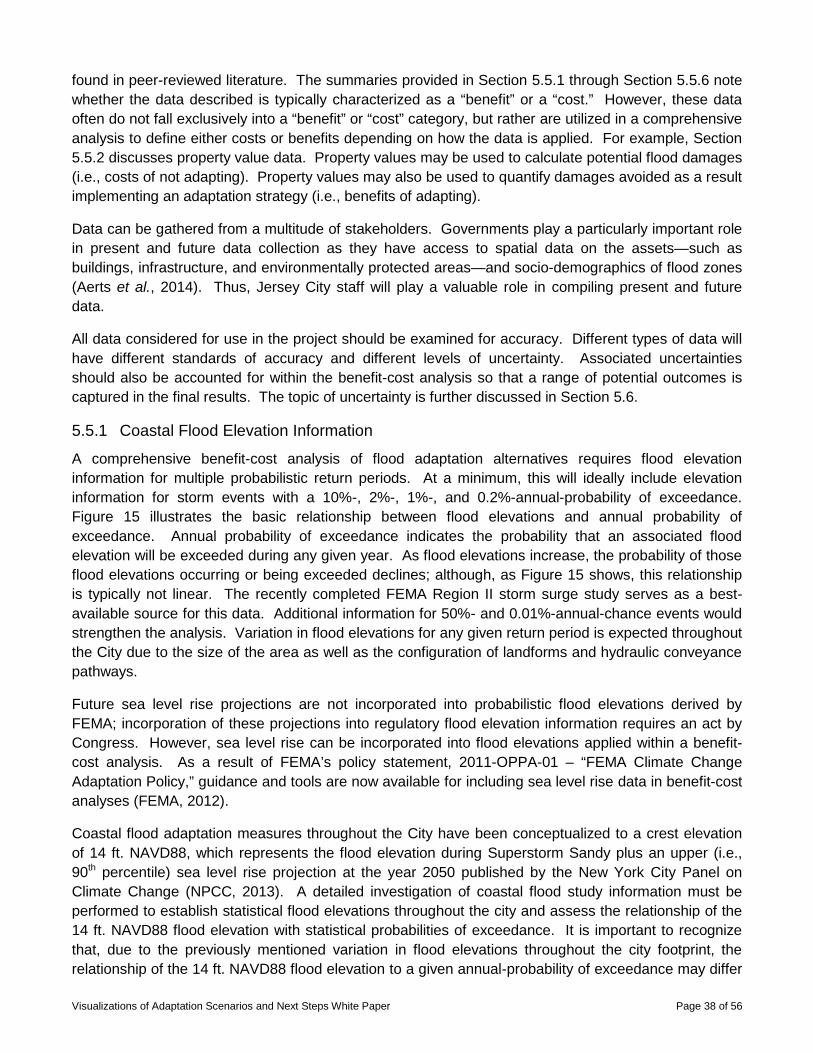
A comprehensive benefit-cost analysis of flood adaptation alternatives requires flood elevation information for multiple probabilistic return periods. At a minimum, this will ideally include elevation information for storm events with a 10%-, 2%-, 1%-, and 0.2%-annual-probability of exceedance. Figure 15 illustrates the basic relationship between flood elevations and annual probability of exceedance. Annual probability of exceedance indicates the probability that an associated flood elevation will be exceeded during any given year. As flood elevations increase, the probability of those flood elevations occurring or being exceeded declines; although, as Figure 15 shows, this relationship is typically not linear. The recently completed FEMA Region II storm surge study serves as a best-available source for this data. Additional information for 50%- and 0.01%-annual-chance events would strengthen the analysis. Variation in flood elevations for any given return period is expected throughout the City due to the size of the area as well as the configuration of landforms and hydraulic conveyance pathways.
Future sea level rise projections are not incorporated into probabilistic flood elevations derived by FEMA; incorporation of these projections into regulatory flood elevation information requires an act by Congress. However, sea level rise can be incorporated into flood elevations applied within a benefit-cost analysis. As a result of FEMA’s policy statement, 2011-OPPA-01 – “FEMA Climate Change Adaptation Policy,” guidance and tools are now available for including sea level rise data in benefit-cost analyses (FEMA, 2012).
Coastal flood adaptation measures throughout the City have been conceptualized to a crest elevation of 14 ft. NAVD88, which represents the flood elevation during Superstorm Sandy plus an upper (i.e., 90th percentile) sea level rise projection at the year 2050 published by the New York City Panel on Climate Change (NPCC, 2013). A detailed investigation of coastal flood study information must be performed to establish statistical flood elevations throughout the city and assess the relationship of the 14 ft. NAVD88 flood elevation with statistical probabilities of exceedance. It is important to recognize that, due to the previously mentioned variation in flood elevations throughout the city footprint, the relationship of the 14 ft. NAVD88 flood elevation to a given annual-probability of exceedance may differ
Visualizations of Adaptation Scenarios and Next Steps White Paper Page 39 of 56
from one location to the next. For example, it is possible that a 14 ft. NAVD88 elevation may represent a 0.2%-annual-probability of exceedance in one location of the City, but a 0.5%-annual-probability of exceedance in a different location. In addition, the annual probability of exceedance will change over time as sea levels rise.
Figure 12 illustrates the conceptual relationship between flood elevations and the annual probability of exceedance of a flood event. There is an inverse relationship between flood height and the annual probability of exceedance; flood elevations are higher when the annual probability of exceedance is lower. In other words, the flood elevation of an event with a 0.2%-annual-chance probability exceedance will be higher than an event with a 10%-annual-chance probability of exceedance.
Figure 15: Conceptual diagram of the relationship between flood elevations and annual probability of exceedance.
Note: Uncertainty exists for each flood elevation along the annual probability of exceedance curve.
5.5.2 Property Value Factors
In order to estimate potential damages caused by a flood event, the value of a property must be understood. The value of a property is determined using common factors such as those listed in Table 3. Residential, commercial (both retail and office), and industrial structures will all have different factors contributing to their overall values. A residential structure’s value can be determined by a general real estate estimate, appraisal information, or by estimating the value based on the depreciated costs of the building’s materials. The age of the structure will contribute the depreciated replacement cost of that structure. Appraisal information and real estate information take into account regional and local property values that will lead to escalated structure values. Given that collection of this information can

Visualizations of Adaptation Scenarios and Next Steps White Paper Page 40 of 56
be a significant effort, development of a dataset should focus on properties within flood-prone areas specifically rather than a city-wide collection.
Table 3: Buildings factors commonly used to establish property value.
Construction Type Is this property built on site or off site and delivered?
Residence Type Is the residence a single family home, a duplex, or a multi-family dwelling?
Quality A descriptor for the construction of the building Condition A descriptor for the upkeep of the residence Stories Number of stories? Basement Does a basement exist? Garage Does the residence have a garage? Attached Garage Is the garage attached? Garage Size Square footage of the garage Exterior Walls Exterior wall material Roofing Roofing material Effective Age An age of the residence based on condition and quality Square Footage Square footage of the property Ground Elevation The elevation of the ground at the structure (a representative elevation) First Floor Elevation The elevation of the first floor of the residence Zero Damage Elevation The elevation where the structure will first incur damage from a hazard Northing* Northing location of the structure Easting* Easting location of the structure * Northing revers to the northward-distance measured (or the y-coordinate) of geographic Cartesian coordinates; Easting refers to the eastward-measured distance (or the x-coordinate).
Commercial and industrial structures can follow the same procedure to evaluate their depreciated replacement cost. These structures are often better estimated with historic information from the business owner. If this historical data is available it should be compared with the estimated depreciated replacement value.
Content values should also be considered. In the event of a storm, contents may be damaged and in need of replacement. Without access to the inside of a residence, content value is almost impossible to determine. It is common practice to apply a ratio of the structure’s value and assume it to be the structure’s content value (e.g., contents value = structure value x 30%). The contents ratio should be determined based on surveys and economic indicators of the area.
Commercial and industrial content values should rely first on business owner surveys. Content values for a business can often-times far outweigh the structure’s value. A common example would be a microprocessor warehouse. The warehouse could be an aluminum facility with concrete floors and no basement that is very resilient to flooding. The content, however, is comparatively much more expensive and would be a large source of overall damages.
Vehicle values can be determined based on the make and model of the vehicles if the data is available. Vehicles have a relatively small replacement value and can also be estimated based on regional and national average values.
Visualizations of Adaptation Scenarios and Next Steps White Paper Page 41 of 56
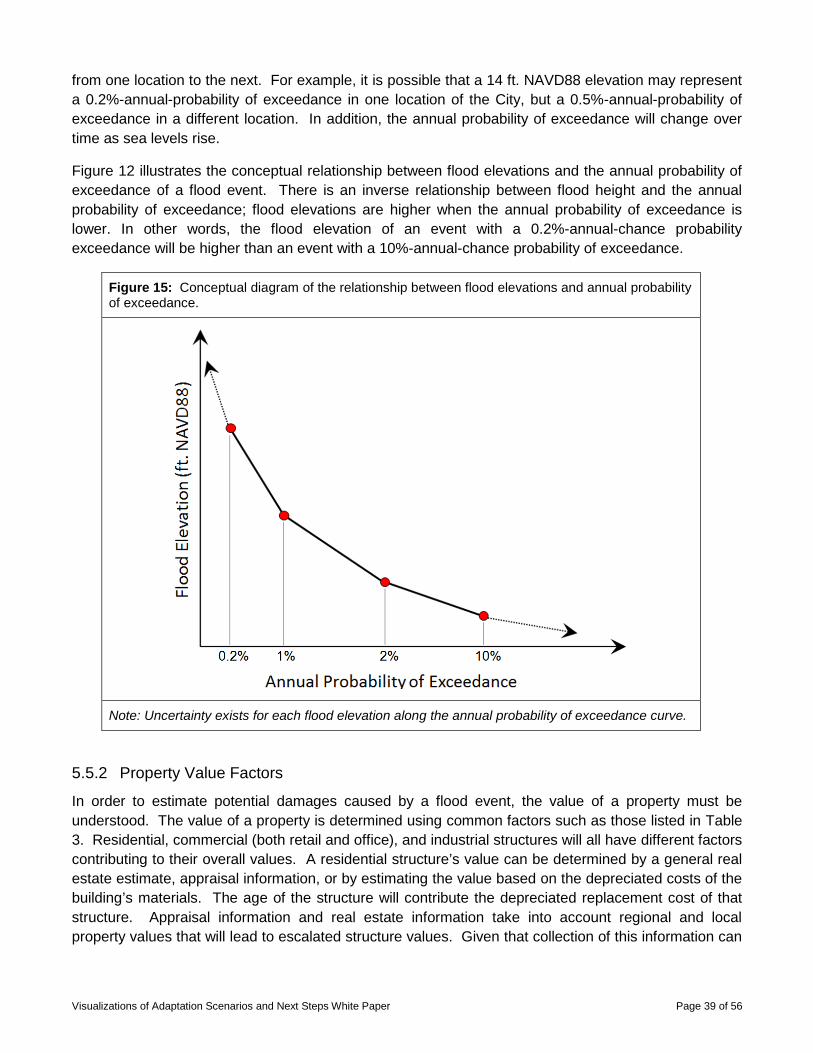
Once property values are determined, estimated damages can be derived for various storm events and flood depths using industry-established depth-damage functions, combined with local historical knowledge. A depth-damage function describes the damage a building sustains under a full range of flood depths. Figure 16 shows a generic depth-damage function. Note, depth-damage functions vary by structure type, distribution of contents within the structure, flood hazard type, and other factors. Given Jersey City’s exposure to coastal flood hazards, specific coastal depth-damage functions should be applied. Best-available resources for these functions include the FEMA Benefit-Cost Analysis Re-engineering (BCAR) panel (FEMA, 2011) and the ongoing North Atlantic Coast Comprehensive Study (NACCS).
Figure 16: Generic depth-damage function (USACE, 1992).
Residential properties will typically have structure damages, content damages, and vehicle damages whereas commercial (both retail and office) or industrial damages are typically estimated on a case-by-case basis. While depth-damage functions are typically developed using empirical information, unique functions which are specific to a community, project, or specific assets can be created. Tailoring of depth-damage functions should be considered for businesses, commercial properties, and industrial facilities in particular.
In Jersey City, a variety of land uses and development types exist in neighborhoods vulnerable to flooding. Along the Hackensack River waterfront, the Country Village neighborhood consists primarily of one- and two-family detached houses built in the 1960s over 42 acres. Many of these houses have driveways that slope down to access garages that are below grade. Also along the Hackensack River

Visualizations of Adaptation Scenarios and Next Steps White Paper Page 42 of 56
is Society Hill, a gated community of 1,400 condominiums and townhomes constructed during the 1980s and 1990s.
On the other side of the City, along the Hudson River, are several vulnerable areas in Downtown Jersey City. Residential properties in Downtown Jersey City command some of the highest rents/sale prices in the City. There are dozens of high-rise residential towers, with several more under construction, throughout Downtown Jersey City. Many of these residential towers are located on the Hudson River waterfront in an area nicknamed the Gold Coast. The Gold Coast is also home to many mid-rise and high-rise office buildings.
Four historic districts are located in Downtown Jersey City, including the Paulus Hook and Van Vorst Park Historic Districts, which both experienced significant flooding during Superstorm Sandy, particularly along their southern and western boundaries. Housing stock in the historic districts is predominantly late-19th century brick and brownstone-fronted row homes, largely built in Greek Revival, Italianate, and Neo-Grec styles. Of the 1,963 properties, some are located out of the floodplain, but significant, low-lying resources include City Hall and Barrow Mansion.
Other vulnerable communities along the Hudson River waterfront include Port Liberte, a community comprised of luxury condominiums and townhomes with amenities including a marina and canals, and the Booker T. Washington housing community, a public housing complex managed by the Jersey City Housing Authority.
5.5.3 Financial and Tax Revenue Factors
Tax revenue factors can influence a benefit-cost analysis in several ways. A reduction in risk to property and other tax revenue generating assets represents a reduction in risk to tax revenue. In this way, reduced risk to these revenues is quantified as a benefit. Conversely, if a mitigation strategy involves the strategic removal of buildings or other tax revenue generating assets, future revenues are typically lost. Also, revenue streams from assets which are impacted by a flood event will likely be lost weeks, months, and even years after a major event and can decrease a municipality’s budget, increase expenses, and reduce the property tax base. In both cases, these impacts would be viewed as a cost. Jersey City experienced a loss of $12,337,900 in tax ratable properties due to Superstorm Sandy related damage (Greenfeld et al., 2014).
Major flooding events force people out of their homes and many do not return. Populations that do return could potentially see a decrease in their property values due to the increase perception of risk by the public. Abandoned homes decrease the tax base and lower surrounding property values. A formal real estate evaluation or investigation of the tax income from the city would allow for quantification of these financial factors. Factors of this nature may have short-term and long-term impacts. Historical nationwide studies are a good source of data to compare with any available recent city data.
In addition to tax revenue impacts, local governments often see a variety of increased expenses following a flood event. These will typically be due to special programs related to emergency management, social programs, business aid, and infrastructure repair (discussed in Section 5.5.4 through Section 5.5.6). These programs result in expenses that local government budgets are not usually equipped to handle and should be factored into the analysis. The source of this data should be heavily tied to historical records.
Visualizations of Adaptation Scenarios and Next Steps White Paper Page 43 of 56
5.5.4 Economic Factors
The Jersey City Hudson River waterfront has 13.3 million square feet of Class A office space located in flood zones (Greenfeld et al., 2014). While the adaptation measures visualized for this study are not focused on protecting this Class A office space, any flooding is likely to impact this office space and normal economic operations in Jersey City. A significant flood event will result in business interruption and economic down-time for offices and other commercial activities in Jersey City, including loss of productivity in offices and retail venues due to power interruptions, limited transit and roadway access, and/or building closures. Survey information indicates that businesses in 113 New Jersey municipalities suffered $63.9 million in business interruption losses as a result of Superstorm Sandy (New Jersey Department of Community Affairs, 2013). These business interruptions stemmed from mandatory office closures as well as the inability of workers to get to their jobs. These losses would be captured as costs within a benefit-cost analysis. Alternatively, avoided economic losses due to the presence of a flood adaptation strategy are captured as benefits. Estimating these avoided losses can be difficult to break out at a community level, but their inclusion in the analysis can help justify a project. Stakeholder surveys or collection of economic loss estimates often provide the best resources for this information.
In addition, the presence of a superior flood adaptation strategy will typically attract more business and enhance economic growth. Economic growth or existing lack of growth is hard to attribute to one specific project or factor. However, census data and recent city-wide trends should be evaluated to determine the existing business atmosphere and the attitude of businesses toward flood risk. Like avoided economic losses, the potential for enhanced economic growth due to the presence of reduced flood risk should be captured as a benefit within the benefit-cost analysis.
5.5.5 Social Factors
Disadvantaged populations are typically more vulnerable to disaster events. A majority of the block groups within the City (138 out of 166) equal or exceeds the regional threshold for the percentage of households in poverty. Of these 138 block groups, 48 are subject to 1%-annual-chance flood hazards based on FEMA Preliminary Flood Insurance Rate Map data published on December 20, 2013. Figure 17 shows the 1%-annual-chance floodplain located within these block groups. As part of the benefit-cost analysis, it is important that these and other disadvantaged populations be considered. In addition to populations in poverty, disadvantaged populations may include a household where a female with children is the head of the household, persons with limited English language proficiency, households without automobiles, or elderly populations.

Visualizations of Adaptation Scenarios and Next Steps White Paper Page 44 of 56
Figure 17: Block groups within Jersey City that equal or exceed the regional poverty threshold.
Visualizations of Adaptation Scenarios and Next Steps White Paper Page 45 of 56
The Social Vulnerability Index (SoVI®) published by the Hazards and Vulnerability Research Institute at the University of South Carolina provides a framework for evaluating social vulnerability factors. The index synthesizes 30 socioeconomic variables, which research literature suggests contribute to reduction in a community’s ability to prepare for, respond to, and recover from hazards. Most SoVI® data sources are from the United States Census Bureau (Hazards and Vulnerability Research Institute, 2014). This index can be used to comprehensively identify the social benefits introduced via the presence of effective adaptation measures in terms of reduced vulnerability.
Disaster events such as floods create a need for start-up of new social programs or enhancement of existing social programs. These programs provide various public assistance services to help people find housing, programs to help people with their personal finances, and programs targeted to reduce the stress that victims of a storm face. As an example specific to Jersey City following Superstorm Sandy, the Sandy Special Needs Housing Fund was established to provide capital subsidies for supportive housing development and to allocate CDBG-DR funds to the Departments of Human Services, Health, and Children and Families (NJ DCA, 2013). These and other government provided services should be captured as costs within the benefit-cost analysis. A comparison of post-Sandy expenses with typical operating budgets for social service agencies and non-profit groups will yield valuable information on the costs avoided by project implementation.
5.5.6 Public Health, Safety, and Disaster Preparedness and Response Factors
Aside from the factors previously discussed in Section 5.5.2 through Section 5.5.5, there are multiple factors related to public health, public safety, disaster preparedness, and disaster response which must be considered. Public safety is a serious concern in an urban area such as Jersey City in the aftermath of a storm event. Ensuring the health, security, and safety of Jersey City residents is a primary adaptation goal and the costs of these services must be considered when evaluating an adaptation measure. In addition, there are large costs associated with repairing damaged infrastructure post-disaster, or designing and constructing resilient infrastructure pre-disaster, particularly in an urban environment such as Jersey City where infrastructure and services are expansive. A list of these factors is provided below with relevant examples from the City’s experience with Superstorm Sandy, one of the most disruptive storms in recent history. A more detailed description of the impacts of Sandy can be found in the Sandy Recovery Strategic Planning Report: A Strategic Plan for Resilience (Greenfeld et al., 2014).
1) Sanitary waste issues: Proper function of combined sewer overflows is a critical public safety consideration for Jersey City. During a storm event, these systems can overflow creating an unhealthy environment where the public is exposed to sanitary waste. During Superstorm Sandy, storm surge overtopped tide gates designed to protect the City’s combined sanitary and storm sewer outfalls from backflow at high tide. Flood water also entered the combined sewer system through catch basins in city streets, flooding buildings with insufficient backflow protection. However, it should be noted that adaptation measures proposed by this study likely will not prevent sewer overflows and therefore would not be captured as a benefit.
2) Health and sanitary concerns associated with post-disaster housing: Temporary and interim housing is a necessity when many are forced to evacuate or homes are damaged. While necessary, these facilities can be centers for health and sanitary issues as well as crime. According to the Jersey City Office of Emergency Management, there were no incidents of crime reported at emergency shelters following Superstorm Sandy. However, as an example,
Visualizations of Adaptation Scenarios and Next Steps White Paper Page 46 of 56
following Superstorm Sandy, there was a Norovirus outbreak at one of the City’s emergency housing shelters that was likely spread via person-to-person contact. According to the City’s Department of Health and Human Services, 25 cases were identified, affecting both residents at the Jersey City Armory and soldiers who were working at the shelter (Greenfeld et al., 2014). The costs of preventing and addressing these types of challenges should be considered.
3) Emergency service response: In times of emergency, more medical, police, fire, and other emergency service professionals are likely to be utilized causing strains on budgets. A survey of these agencies can reveal cost information during past events and what could be the potential savings with adaptation measures in place.
4) Electrical service: The costs of restoring electrical service immediately following a flood event, repairs to electrical systems (e.g., transfer stations, underground electrical vaults, and transformers), and replacing individual electric and gas meters at homes and businesses should be included. Three PSE&G substations in Jersey City were flooded during Superstorm Sandy, resulting in power outages that affected approximately 75% of Jersey City’s population. Power was not restored to many households for over one week.
5) Public transit: Impacts to mass transit systems can be expected. This includes the cost to remove floodwater, damage to stations/facilities, equipment, and infrastructure, and service shutdowns immediately following the flood event as well as later on for inspections, repairs or improvements. Superstorm Sandy disrupted critical mass transit service and caused significant damage to NJ TRANSIT’s Hudson-Bergen Light Rail (HBLR) system and the Port Authority of New York and New Jersey’s Port Authority Trans-Hudson (PATH) train system. Nearly two years after Superstorm Sandy, there continue to be service disruptions to portions of the PATH system so that repairs and upgrades can be made.
6) Post-disaster debris and garbage clean-up: Cost of debris and garbage disposal for post-storm cleanup. At least 15,000 tons of debris was removed from Jersey City streets following Superstorm Sandy (Greenfeld et al., 2014).
7) Medical facility operation: Impacts to the Jersey City Medical Center during and immediately following a flood event. The emergency room at the Jersey City Medical Center was inundated by floodwater during Superstorm Sandy, hampering the ability to provide urgent medical care.
8) Public Facilities: Impacts to public buildings and facilities not only hinder the City’s ability to provide vital services in the aftermath of a storm event but also add to the public cost of recovery. City Hall was flooded during Superstorm Sandy, and many non-essential offices were closed in the days following the storm. Several Jersey City Housing Authority housing communities were hit hard, necessitating millions of dollars in repairs. Jersey City Public Schools were closed for several days following Superstorm Sandy, and many school buildings were damaged, requiring clean-up and repairs.
Note, in future stages of benefit-cost evaluation, this list should be critiqued and further expanded as it is likely that additional public health, safety, and disaster preparedness and response factors are not captured. The Sandy Recovery Strategic Planning Report: A Strategic Plan for Resilience (Greenfield et al., 2014) serves as a valuable resource for determining other factors that may be considered.

Visualizations of Adaptation Scenarios and Next Steps White Paper Page 47 of 56
These factors have a relationship with the financial impacts described in Section 5.5.3 in that there are potential costs which typically transfer to governments and taxpayers. Those relationships should be characterized in order to understand the potential combined effect of changes in revenue streams as well as the costs of satisfying health, safety, and disaster preparedness and response considerations within overall budgets.
5.5.7 Regional Connection Factors
Jersey City is a regional destination located in one of the most densely-populated counties in the country. It is the second most-populous city in New Jersey, with a population of 247,597, and a growing residential population (U.S. Census Bureau, 2010). As of September 2014, over 5,000 residential units were under construction. The City is also a major employment center with Port Jersey and port-related facilities as well as the 13th largest office district in the country when ranked by square footage of office space. Major regional destinations for recreation and shopping include Liberty State Park, the Hudson River Waterfront Walkway, two shopping centers, and various retail corridors. Several institutions of higher learning are located in Jersey City, including Hudson County Community College, Saint Peter’s University, and New Jersey City University. The City is well-served by a multi-modal mass transit network that provides regional access and is crucial in supporting the City’s growth and economy. This network included the Hudson-Bergen Light Rail and the PATH train, which are both vulnerable to the effects of coastal flooding and storm surge. Given Jersey City’s coastal location, the effects of climate change, and sea level rise, building resilience is critical to its long-term viability, as well as the economies of the state and region. A fully functioning Jersey City is critical to the regional economy. These influences must be captured as benefits within the benefit-cost model.
While the focus of the Local Government Capacity Grant and the Collaborative Climate Adaptation Planning for Urban Coastal Flooding study was on adaptation measures that fall under the City’s jurisdiction, it is recognized that, for solutions to be more effective, a regional approach is needed. Where opportunities arise, conceptual adaptation measures can potentially be tied into other flood risk reduction projects both within and outside Jersey City. A regional approach provides opportunities to leverage funds, maximize cost efficiencies, and execute a comprehensive risk reduction strategy. Jersey City Planning Department staff are continuing to coordinate with the Jersey City Office of the Mayor and adjacent communities such as Hoboken and Weehawken to develop a regional flood adaptation strategy.
5.6 Accuracy and Uncertainty Standards
5.6.1 Establishing data accuracy
A comprehensive benefit-cost analysis pulls together many different factors into one holistic model. Those factors have been described in Section 5.5, but with each piece of data supporting these factors, there should be an acknowledgment of its potential inaccuracy. It is important to identify associated data uncertainties and all modeling assumptions. Uncertainty should be described by a parameter or series of parameters to assess the statistical dispersion of the data.
In particular, the benefit-cost analysis must account for the uncertainty inherent to flood hazard information. The presence of epistemic (i.e., systematic, model) and aleatory (i.e., natural) uncertainties make it impossible to precisely specify a given flood frequency elevation. The analysis must recognize that a 1%-annual-chance elevation may in fact be a range of elevations as opposed to a single elevation. While, in principal, epistemic uncertainties can be reduced with collection of
Visualizations of Adaptation Scenarios and Next Steps White Paper Page 48 of 56
additional data or the use of advanced models, uncertainties are altogether unavoidable within a benefit-cost analysis. Section 5.6.2 discusses methods for quantifying and capturing these uncertainties.
5.6.2 Strategies to account for uncertainty
Data collected by instrumentation over many years can typically be described by a probability distribution. This is the case for hydrologic data collected at gages which provide historic water level information. Historical data is often harder to describe with a probability distribution, but strategies exist to estimate these parameters. Stochastic simulation methods (e.g., Monte Carlo simulations) are common practices to create data based on selected assumptions for different variables. The distribution of the data can then be used to quantify uncertainty.
A sensitivity analysis is an important step in determining the impact that certain assumptions have on the benefit-cost outcomes. This is a useful approach to evaluate whether changes to benefit-cost inputs due to known uncertainties significantly affect final analysis outcomes. If it is found that uncertainties have minimal influence on final results, it may be possible to exclude uncertainties for particular inputs altogether.
Lastly, it is important to remember that an ultimate goal of a benefit-cost analysis is to produce a result which leads to a decision on whether to proceed with a flood adaptation strategy. Therefore, it may be worth considering a conservative approach whereby the extreme uncertainties that would lead to reduced cost-effectiveness are incorporated. Using this approach, a minimum return on investment will be revealed. If results from the analysis indicate a project is cost-effective, a decision to proceed can be made despite maximum uncertainties.
5.6.3 The benefit of accounting for data uncertainty
Accounting for accuracy and uncertainty can reveal the dominant factors within a benefit-cost model and significant assumptions. In addition, it can lead to more efficient planning. Identifying uncertainty and performing a sensitivity analysis will identify the largest weaknesses in the benefit-cost model and help shape the research and data needs of the community.
In addition, a model that applies probability distributions to the data sources will yield a range of probabilistic outputs. Identifying the costs and benefits of a mitigation project while considering associated probabilities allows for more informed decision-making based on the likelihood of an outcome. If built correctly, the model will identify not only an expected value but a confidence interval for that value. Planning contingencies can then be developed to better understand the risks of funding a potential project.
5.7 Next Steps for Jersey City in the Benefit-Cost Analysis Process Performing a benefit-cost analysis is a significant undertaking. This white paper was intended to identify the value of a benefit-cost evaluation for use in grant application processes and decision-making, as well as provide a basic overview of data and factors which will be needed to complete a benefit-cost analysis.
As the City proceeds in further evaluating conceptual adaptation measures, next steps include:
1) Specific elements of most interest within a benefit-cost evaluation will vary by grant opportunity. Finalize selection of grant opportunities which the City intends to pursue.

Visualizations of Adaptation Scenarios and Next Steps White Paper Page 49 of 56
2) Identify any benefit-cost analysis requirements associated with grant opportunities that the City pursues. The analysis should provide a comprehensive evaluation that may extend beyond specific grant-related requirements. Therefore, critical questions or concerns from stakeholders or decision-makers that the analysis should address must also be identified.
Results from a more comprehensive approach can then be used to communicate to the public and key decision-makers regarding which alternatives provide the largest vs. smallest net benefit. They will prove valuable in master planning efforts and help to achieve an overarching goal of fully quantifying the cumulative costs and benefits associated with implementation.
3) In an effort to streamline the benefit-cost evaluation, identify areas of the City or portions of the City’s overall adaptation strategy on which the evaluation should focus. For example, the analysis can likely focus on areas which are more vulnerable to flooding (e.g., the 0.2%-annual-chance floodplain). This focus would minimize and streamline data collection for information described in Section 5.5.
4) Prioritization of adaptation actions will allow the City to focus resources and ensure advances in flood risk reduction. If the City decides not to evaluate the full envelope of adaptation measures, identify actions which have the highest potential for implementation based on the following considerations:
o Technical: How effective will the action be in avoiding or reducing future losses? o Economic: What are the costs and benefits of the action and does it contribute to
community economic goals? o Political: Does the action have public and political support? o Administrative: Is there adequate staffing and funding available to implement the action
in a timely manner? o Social: Will the action be acceptable by the community or will it cause any one segment
of the population to be treated unfairly? o Environmental: Will the action provide environmental benefits and will it comply with
local, state and federal environmental regulations? o Legal: Does the community have the authority to implement the proposed measure?
5) Collect data described in Section 5.5 and capture uncertainties discussed in Section 5.6.
6) Proceed with benefit-cost evaluation.
7) Select adaptation measures which provide the largest net benefit and have the greatest potential for successful implementation.
8) Proceed with preliminary engineering design, feasibility assessment, pursuit of necessary permitting, and acquisition of funding for future construction.
Figure 18 illustrates these steps and provides a roadmap of the basic steps for the City to follow in moving adaptation measures from conceptualization to construction phases.

Visualizations of Adaptation Scenarios and Next Steps White Paper Page 50 of 56
Figure 18: Next steps roadmap from conceptualization to construction phases.

Visualizations of Adaptation Scenarios and Next Steps White Paper Page 51 of 56
6. Regional Connections, Implementation, and Next Steps The Visualizations of Adaptation Scenarios and Next Steps White Paper was completed under the Local Government Capacity Grant Program under Together North Jersey’s Regional Plan for Sustainable Development (RPSD). Funding for this study was provided by the U.S. Department of Housing and Urban Development and the U.S. Department of Transportation. This section is intended to summarize the Jersey City study and its connections to the greater Together North Jersey region with an emphasis on the general and specific final report guidance set forth by Together North Jersey.
6.1 General Requirements of Together North Jersey Final Report Guidance The adaptation measure visualizations contained in this report are not recommendations for future action. Instead, they represent possible adaptation measures that require further study and analysis. The key recommendation of this project is to conduct an in-depth prioritization of adaptation options and comprehensive benefit-cost analysis for priority actions. The report contains an action plan for future study in the form of a white paper contained herein as Section 5. The white paper details both the reasons to perform a benefit-cost analysis and the specific data metrics Jersey City should pursue to comprehensively understand the most cost-effective adaptation actions. While a suite of options, including berm levees, boardwalk levees, land rise, street levees, and surge barriers, have been proposed, it is not appropriate to advance any one action or project without a benefit-cost analysis.
A detailed benefit-cost analysis and prioritization process considers the following factors:
• Responsible entity: City of Jersey City, NJ
• Funding needed: Funding for both the benefit-cost analysis and any subsequent adaptation projects is outlined by agency and type of funding in Table 2. Potential funding opportunities include the U.S. EPA, FEMA, FHWA, USDA, and HUD CDGB-DR as well as state and regional sources. The exact funding stream used would depend on the nature of the final list of adaptation projects.
• Resources available for next steps: As discussed above, the white paper contained in Section 5 provides a suite of funding resources available to support next steps.
• Opportunities for partnership: The U.S. Army Corps of Engineers, Stevens Institute of Technology, and private, for profit planning and engineering firms are well-matched partners for future adaptation implementation. These entities have the required technical expertise and depth of knowledge that would support the benefit-cost analysis as well as the engineering and design of any selected adaptation measures. In addition, partnerships with surrounding municipalities and jurisdictions will provide opportunities to establish regionally-based coastal flood risk reduction solutions.
6.2 Specific Requirements of Together North Jersey Final Report Guidance
6.2.1 Engagement and Consideration of Traditionally Under-represented Communities
Since the adaptation measures are located citywide, publicity for the July 30, 2014 public open house was not targeted to residents of a specific neighborhood. All residents and stakeholders were invited. Furthermore, Jersey City’s population is one of the most diverse in the country, making it a challenge to target individual subgroups. Of Jersey City’s residents, 39% are foreign-born (U.S. Census Bureau,
Visualizations of Adaptation Scenarios and Next Steps White Paper Page 52 of 56
2009-2013). Over half (52%) speak a language other than English, of which 40% report that they speak English less than “very well” (U.S. Census Bureau, 2009-2013). Thirty-three percent of residents are White, 26% African-American, 24% Asian, 13% some other race, and 4% are two or more races (U.S. Census Bureau, 2010). The median household income is $58,206 (U.S. Census Bureau, 2009-2013), and average household size is 2.53 (U.S. Census Bureau, 2010). 18.4% of individuals are below the poverty level (U.S. Census Bureau, 2009-2013). Citywide, 39% of residents do not have access to a vehicle, and 46% of residents commute to work via public transportation (U.S. Census Bureau, 2009-2013). Approximately 70% are renters and 30% are homeowners (U.S. Census Bureau, 2010).
Leading up to the event, multiple announcements were posted on the City’s website and social media accounts (Facebook, Twitter). The Public Open House was also listed on the event calendar on the Together North Jersey website. A flyer was created and posted at City Hall and other community gathering places (see Figure 10). The flyer was also distributed electronically to stakeholders and interested parties including the Jersey City Housing Authority, Women Rising, and Puertorriquenos Asociados for Community Organization (PACO) for distribution to their constituents. Approximately 50 people attended the Public Open House.
In addition to the engagement of traditionally under-represented communities, Section 5.5.5 used the Together North Jersey Fair Housing Equity Assessment data to discuss the importance of future adaptation measures in protecting traditionally under-represented communities. There are 138 out of 166 block groups in the City equaling or exceeding the regional threshold for households in poverty. Of these 138 block groups, 48 are subject to 1%-annual-chance flood hazards based on FEMA Preliminary Flood Insurance Rate Map data published on December 20, 2013. The White Paper discusses the importance of protecting these traditionally under-represented communities, since they tend to be more vulnerable to and less mobile during disaster events.
6.2.2 Study Recommendations in the RPSD Context
This project provides true-to-life renderings and an analysis framework that could inform the development of adaptation scenarios throughout the Together North Jersey region, especially communities that suffered serious flooding during Superstorm Sandy. The methodological approach, general description and type of adaptation measures could be considered elsewhere in the region, especially in the more densely-populated coastal communities of northern New Jersey. The benefit-cost analysis framework and data collection effort described in Section 5 is specific to Jersey City, but has utility in the evaluation of other flood risk reduction projects throughout the region. The adaptation options visualized in this project are most appropriate for urban place-types, especially those with heavily built-out waterfronts and significant impervious area.
The recommendations of this study fall primarily under two topics within the Livability and the Environment RPSD category: the Energy and Climate topic and the Land Use and Urban Design topic. They are also relevant to the Health and Safety topic under Society and Community category.
This study identified the following primary lessons learned that could feed back into the RPSD effort and should be considered for other places interested in adaptation measures:
• The public and stakeholders must be involved early in the process. The work performed in this project using LGCGP funds facilitated the beginning of a longer process to enhance Jersey City’s resilience to coastal flood challenges.
Visualizations of Adaptation Scenarios and Next Steps White Paper Page 53 of 56
• There is interest in developing a comprehensive or regional approach that can be tied to and leverage actions being taken by separate agencies (e.g. Jersey City Municipal Utility Authorities) or adjacent communities (e.g. City of Hoboken, NJ).
• It is helpful to distill complicated and highly-technical concepts to their fundamental core, especially when bringing concepts to the public. The visualization products developed in this project were intended for just this purpose. Without buy-in from the community on the basic concepts, advancing into more complex phases of analysis such as preliminary design, engineering, and feasibility should be pursued cautiously.
• It is not necessary to have all the answers before presenting to the public. While this can be a frightening approach, it demonstrates that the City wants to engage with the public in order to collect feedback. This approach inspires partnership between the City and the public as solutions are developed.
• The adaptation measures address storm surge exposure only; based on feedback, community members and stakeholders want to see projects that have the potential to simultaneously address other flood-related challenges like stormwater management, including pumping for low-lying areas.
• The adaptation measures identified implementation challenges that may emerge in other communities undertaking similar work. These challenges included pedestrian and vehicle crossings with elevated roadways; impact on building entrances; impact on residential views; and sidewalk tie-ins.

Visualizations of Adaptation Scenarios and Next Steps White Paper Page 54 of 56
7. References
1) Aerts, J., W. Botzen, K. Emanuel, N. Ling, H. de Moel, and E. Michel-Kerjan. 2014. Evaluating Flood Resilience Strategies for Coastal Megacities. Science.
2) Federal Emergency Management Agency (FEMA). January, 2011. FEMA Benefit-Cost Analysis Re-engineering (BCAR): Flood Module Revision – Updates to Residential Depth-Damage Functions (DDFs) and Guidance for Coastal Flooding – Methodology Report (version 4.5.5.).
3) Federal Emergency Management Agency (FEMA). January, 2012. FEMA Climate Change Adaptation Policy Statement. Retrieved at: http://www.fema.gov/media-library/assets/documents/33082.
4) Greenfeld, Doug et al. City of Jersey City, NJ. 2014. Sandy Recovery Strategic Planning Report: A Strategic Plan for Resilience.
5) Hazards and Vulnerability Research Institute. 2014. Social Vulnerability Index for the United States - 2006-10. Obtained from: http://webra.cas.sc.edu/hvri/products/sovi.aspx
6) New Jersey Department of Community Affairs (NJ DCA). 2013. Community Development Block Grant Disaster Recovery Action Plan. Retrieved at: http://www.state.nj.us/dca/divisions/sandyrecovery/pdf/CDBG-DisasterRecoveryActionPlan.%20non.substantial.amendments.%2011.14.13.pdf.
7) New York City Panel on Climate Change (NPCC). 2013. Climate Risk Information 2013: Observations, Climate Change Projections, and Maps. C. Rosenzweig and W. Solecki (Editors), NPCC2. Prepared for use by the City of New York Special Initiative on Rebuilding and Resiliency, New York, New York.
8) State of New Jersey Office of the State Controller. 2014. NJ Sandy Transparency – Funds Awarded by Federal Departments to New Jersey. Obtained from: http://nj.gov/comptroller/sandytransparency/.
9) U.S. Army Corps of Engineers (USACE). May, 1992. Catalog of Residential Depth-Damage Functions Used by the Army Corps of Engineers in Flood Damage Estimations. IWR Report 92-R-3.
10) U.S. Army Corps of Engineers (USACE). 2011. Regional Economic Development (RED) Procedures Handbook. Institute for Water Resources. 2011-RPT-01. Retrieved at: http://www.iwr.usace.army.mil/Portals/70/docs/iwrreports/2011-RPT-01.pdf.
11) U.S. Census Bureau. 2009-2013. American Community Survey (ACS) 5-year estimates. Retrieved at: http://www.factfinder2.census.gov.
12) U.S. Census Bureau. 2010. Decennial Census: 2010. Retrieved at: http://www.factfinder2.census.gov.

Visualizations of Adaptation Scenarios and Next Steps White Paper Page 55 of 56
Appendix A
Digital files of all visualizations, all meeting boards, and the poster handout.

Visualizations of Adaptation Scenarios and Next Steps White Paper Page 56 of 56
Appendix B
Meeting notes.