Visualization techniques to support CCTV operators of ...
33
Visualization techniques to support CCTV operators of smart city services Paweł Pawłowski 1 & Adam Dąbrowski 1 & Julian Balcerek 1 & Adam Konieczka 1 & Karol Piniarski 1 Received: 14 January 2019 /Revised: 7 March 2020 /Accepted: 27 March 2020 # The Author(s) 2020 Abstract In this paper visualization techniques for modern closed circuit television (CCTV) smart city services are discussed with application to prevention of threats. Unconventional approaches to the intelligent visual data processing are proposed in order to support video surveillance operators, thus to make their work less exhaustive and more effective. Although registration of a huge amount of video data requires development of intelligent and automatic signal processing information extraction techniques, improvement of visualization methods for operators is also a very important task, because of the crucial role the human factor plays and should always play in the decision making, e.g. in the operator reactions to various crisis situations, which can never be fully eliminated by artificial intelligence. Four software based mechanisms connected with a standard or with a slightly extended hardware are proposed as options for the CCTV operators. They utilize rather known ideas but are implemented with new extensions to original algorithms, as well as with additional, innovative modifications and solutions (not presented in the literature). With them they become reliable and efficient tools for the CCTV systems. First, generation of cylindrical panoramas is suggested in order to make Multimedia Tools and Applications https://doi.org/10.1007/s11042-020-08895-6 * Paweł Pawłowski [email protected] Adam Dąbrowski [email protected] Julian Balcerek [email protected] Adam Konieczka [email protected] Karol Piniarski [email protected] 1 Faculty of Control, Robotics and Electrical Engineering, Institute of Automation and Robotics, Division of Signal Processing and Electronic Systems, Poznan University of Technology, 3A Piotrowo Street, 60-965 Poznan, Poland
Transcript of Visualization techniques to support CCTV operators of ...

Visualization techniques to support CCTV operatorsof smart city services
Paweł Pawłowski1 & Adam Dąbrowski1 & Julian Balcerek1 & Adam Konieczka1 &
Karol Piniarski1
Received: 14 January 2019 /Revised: 7 March 2020 /Accepted: 27 March 2020
# The Author(s) 2020
Abstract
In this paper visualization techniques for modern closed circuit television (CCTV) smart cityservices are discussed with application to prevention of threats. Unconventional approaches tothe intelligent visual data processing are proposed in order to support video surveillanceoperators, thus to make their work less exhaustive and more effective. Although registrationof a huge amount of video data requires development of intelligent and automatic signalprocessing information extraction techniques, improvement of visualization methods foroperators is also a very important task, because of the crucial role the human factor playsand should always play in the decision making, e.g. in the operator reactions to various crisissituations, which can never be fully eliminated by artificial intelligence. Four software basedmechanisms connected with a standard or with a slightly extended hardware are proposed asoptions for the CCTVoperators. They utilize rather known ideas but are implemented withnew extensions to original algorithms, as well as with additional, innovative modifications andsolutions (not presented in the literature).With them they become reliable and efficient tools forthe CCTV systems. First, generation of cylindrical panoramas is suggested in order to make
Multimedia Tools and Applicationshttps://doi.org/10.1007/s11042-020-08895-6
* Paweł Pawł[email protected]
Adam Dą[email protected]
Julian [email protected]
Adam [email protected]
Karol [email protected]
1 Faculty of Control, Robotics and Electrical Engineering, Institute of Automation and Robotics,Division of Signal Processing and Electronic Systems, Poznan University of Technology, 3APiotrowo Street, 60-965 Poznan, Poland
long-time video content analysis of a defined area easier and faster. Using panoramas it ispossible to reduce the time that is required to watch the video by a factor of hundreds or eventhousands and perform an efficient compression of the video stream for the long-time storage.Second, the controlled stereovision option is discussed for quicker and more precise extractionof relevant information from the observed scene. Third, the thermo-vision is analyzed forfaultless detection of pedestrians at night. Finally, a novel high dynamic range (HDR)technique is proposed, dedicated to the CCTV systems, in contrast to other typical entertain-ment oriented HDR approaches, for clear visualization of important and meaningful imagedetails, otherwise invisible. We validated usefulness of the proposed techniques with manyexperiments presented in this paper.
Keywords Visionmonitoring . Panoramas . Stereovision . Thermo-vision . High dynamic range(HDR) . Threat recognition
1 INTRODUCTION
Urban areas are inhibited by 3.9 billion people in the world scale. Moreover, in the next 30 years,further growth of this number tomore than 6 billion people is expected [40]. Only in the EuropeanUnion (EU)more than 350million people live in cities bigger than 5 thousands inhabitants [33]. Ahigh density of people means a very high density of traffic. This situation generates many issuesrelated to safety and transport efficiency. For example, in the city of Łódź (Poland) typical meantravel time is by 51% longer than it could be with uncongested traffic [78].
Due to a high density traffic there occur many undesirable traffic accidents. According tothe newest information present in the EU Commission website [34], only in 2018 there weremore than 25 thousand road fatalities in the EU, about 135 thousand were seriously injured,and the yearly cost of road crashes has been estimated to be around EUR 280 billion.
In addition, there are threats of contraventions, misdemeanors, and felonies. In the EU thereare approximately 13 million crimes committed per year, including more than a quarter millionof them in Poland [35]. Examples of these are: thefts, beatings, robberies, kidnapping, drugtrafficking, and terrorism.
In order to effectively fight against the above phenomena, we focused our efforts on aconcept of a visual system for prevention of threats not only by using nonstandard closedcircuit television (CCTV) equipment (e.g. a dedicated 3D video equipment [55]) but also byapplying novel approaches to intelligent visual analysis based on automatic extraction ofrelevant visual information. Although registration and analysis of huge amounts of datarequires intelligent signal processing techniques, the human factor represented by observationsand manual reactions made directly by CCTV operators still plays, and will undoubtedlyalways play, the crucial role. The proposed visualization concepts and techniques should makethe operators’ work more effective but in the same time less exhaustive.
Nowadays one can observe a quick and intensive progress in CCTV monitoring applica-tions. For example, in the city of Chongqing (China) there are almost 2.6 million cameras (168per 1000 people) [85]. In 2016 in the city of Brussels (Belgium) there were approximately 1.4thousand security cameras in public spaces [75]. In Poznan (Poland, the home city of theauthors of this paper), with an agglomeration population of about million inhabitants, there arecurrently hundreds of thousands of cameras, including over 700 cameras of the urban videosurveillance system. The information is collected statically with fixed cameras or 360–degree
Multimedia Tools and Applications

panoramic cameras and dynamically with pan–tilt–zoom (PTZ) cameras. This monitoringsystem consists not only of the recording equipment, but also of 6 special supervision centerswhere images from cameras are viewed and analyzed by operators. In addition, the imagesfrom the cameras reach other services, e.g. traffic control and crisis management [59].
Based on a location of a camera it is roughly known what kind of information the datastream will deliver, including the Internet transmission. In spite of recent efforts concerningspecial data compression techniques for this application [81] the amount of the collected datato be analyzed remains huge and even still grows [77]. Therefore the demand for newvisualization techniques and for novel video content analysis is strong [56, 57].
In consequence, the development of new supporting tools for detection of threats using CCTVdata is one of the most important tasks and still an essential research problem, although somemethods (referred in this paper to as the standard approaches) have already been developed. Amongthem e.g. are: detection of motion, left luggage, smoke, fire, people crossing roads on the red light,etc. [20]. Examples of other important tasks are: people tracking and counting, detection of crossingsecurity lines e.g. at stations, or face, gender, and gait analysis, including people recognition basedon various biometric parameters [25]. Vision systems are also being applied to detection, tracking,and counting vehicles, including recognition of their types, license plate numbers, traffic conges-tions, and accidents [20, 23].
It has been proven that various methods for automatic detection of threats help operators toproperly react and make decisions, especially in complex situations [20, 48]. However, fullyautomatic mechanisms for detection of threats are not acceptable as they may omit reallydangerous events and/or evoke false alarms. Moreover, automatic detection methods reducenatural operators’ abilities for quick and relevant reactions, sometimes even putting their vigilalmost to sleep. Thus semiautomatic and various manual options for control of informationextraction (far beyond merely zooming chosen rectangular screen areas) and novel visualiza-tion techniques make the operators’ work more effective and in the same time more attractive(i.e., much less monotonous, arduous, boring, and cumbersome), by keeping the operators’concentration and consciousness constantly much more active [66].
Four such visualization techniques are proposed in this paper as CCTVobservation options.They have been selected and applied because they take into account various analysis times(short or long) and lighting conditions (day, night, high-contrast scenes). Thus together theyoffer a comprehensive and complementary solution (Fig. 1).
First, generation of cylindrical panoramas is recommended to use in the CCTV systems in orderto make long-time video content analysis of a defined area easier and faster. The described methodsignificantly facilitates searching for important events in selected areas, assuming that the videomaterial was recorded with a rotating PTZ camera, operating in recurrent pan cycles. Our approachconsists of: generation of a dynamic cylindrical scene model (composed of a sequence of pano-ramas), and then, in creation of a video sequence(s) containing selected panorama part(s) (frames)for convenient automatic or manual video analysis of the interesting areas over a relatively long timespan [27]. The detailed description is presented in Section 2.
The second proposed mechanism is a stereovision option for quick decision making and moreprecise extraction of relevant information from the observed scenes through generation or evendirect registration of depth. By this means we can offer a stereovision illusion that helps themonitoring operators to analyze the scene in a short time (e.g. to quickly count people present inthe observed scene) [42]. It should be stressed that stereovision is not only useful for humans but itcan also be used for data acquisition and processing in intelligent machine vision applications [14,22, 80, 82]. This mechanism is presented in detail in Section 3.
Multimedia Tools and Applications

Third, a thermo-vision for faultless detection of pedestrians at night is discussed. Due to thespecial properties of thermo-vision, it is possible to easily segment relevant objects fromimages and early warn the monitoring operators or drivers in automotive applications [65]about dangerous situations at night conditions. The thermo-vision mechanism is proposed andtested with two options: standard thermo-vision but with fast, automatic scene analysis and theso-called multi-spectral vision i.e. thermo-vision merged with a standard camera as an optionfor the manual scene analysis. Performed experiments show that this option shortens reactionsand supports faster identification of objects (e.g. pedestrians) at night.
Finally, a novel, efficient high dynamic range (HDR) technique for clear visualization ofimportant and meaningful image details, otherwise invisible, is proposed, dedicated to CCTVsystems. It offers much more correct and meaningful representation of high contrast scenesusing standard LCD displays than other typical entertainment wise HDR approaches, thusmaking the objects hidden in too dark or in too bright image areas much easier visible. Thistechnique is presented in Section 5.
With the performed, described, and discussed experiments we validated usefulness of allproposed techniques.
2 Search of objects and video compression of panorama-like images
In many urban services like i.e. police, security services, crisis management groups, there aretight limits concerning management and analysis of the CCTV cameras recorded videomaterials. It is nothing uncommon that many events, which are categorized in lower layersof hierarchy, are omitted. This is still emphasized by time limits related to finite video storagespace and legal restrictions.
Typical PTZ cameras, used for video recording, may be controlled manually or operateautomatically in recurrent cycles. By this they offer large coverage of the monitored areas, butdrastically hamper analysis of fixed scenes [20].
Fig. 1 General schema of the proposed solution
Multimedia Tools and Applications

Video analysis in CCTV is typically divided into two types: short-time analysis and long-time analysis. Short-time video analysis from the PTZ cameras may detect fast motion,robberies, and other “actions” and is typically performed in real-time. The long-time analysis(among individual camera cycles) will help to detect such phenomena as abandoned luggage,lying person, freshly painted graffiti, and many other long-time “quasi stationary” situations.These phenomena are detected by comparison cycle to cycle of the selected camera views.
Let us consider the following typical example. A CCTV console operator should find anevent that happened in the known place but in an unknown instant during a prescribed periodof time, e.g. during the last 24 h. A full even fast-forward analysis of the whole video recordedwith the PTZ camera within this period would be a very time consuming (24 h with full framerate or at least some hours with a reduced rate), boring, and exhausting work.
To improve analysis of the described, or similar task we propose to convert therecorded, linear video to the sequence of cycles of the PTZ camera (by makingpanoramas) and then perform the panorama analysis (Fig. 2). In the proposed method,the operator first merely selects the interesting area from the first pan cycle. Next, thesoftware calculates the sequence of panoramas and finally offers a highly decimatedvideo sequence of frames representing the chosen area in each panorama (Fig. 3).Assuming in our example the PTZ camera pan cycle mode of 360° per minute, theoperator will only have to watch 1440 frames (24 h times 60 pan cycles per hour),i.e., 1440/25 = 57.6 s of 25 fps video or 57.6/24 = 2.4 s only per one hour of theoriginal video. We can notice that the achieved watch speed increase with a factor(time compression ratio) of 3600/2.4 = 1500 is impossible to reach such factor with aconventional watching time reduction approach, i.e., observation with the reducedframe rate.
It is also possible to store the sequence of full panoramas as a movie. By this the presentedsolution can also be used for a high and quite unconventional video compression.
2.1 Preparing panoramas
Panorama making and stitching have already been studied and published. They are eitherfeature-based techniques [16, 17] or direct solutions [45]. However, generation of cylindricalpanoramic images with a rotating camera operating in recurrent pan cycles, discussed e.g. in[41, 84], is still not a satisfactorily well solved task.
Fig. 2 Panorama model of video recorded by panning CCTV camera
Multimedia Tools and Applications

There also existmore precisemodels than cylindrical panoramas e.g. spherical or conicalmodels,but they are much more complicated during generation, video processing, and more difficult forinterpretation. Therefore they have not been considered among the presented techniques.
The problem of creating panoramas may generally be divided into: background estimation,movement detection, and image stitching with appropriate fixed feature points.
In our approach the background modeling and movement detection are used to distinguishbetween the camera movement and the movements associated with moving objects. Typicalalgorithms for making panoramas by stitching of the consecutive images work well with stillobject, but fail in the CCTV recordings with the moving objects. Simple and fast methods forbackground extraction i.e. subtraction of a current frame from the reference frame andsubtraction of subsequent frames cannot be used for modeling of the moving background.Therefore we have proposed an adaptive background modeling based on selection of featurepoints [27]. Properly selected feature points must not move, i.e. belong to the background andeasily be recognized in consecutive frames of the original video sequence in order to stitchthem correctly together in the resulting panorama [39]. The most accurate feature points are thecrossings of edges in the image. The most popular methods of finding the feature points areHarris & Stephens and the Shi-Tomasi algorithms [27].
The Harris & Stephens method is based on two steps. The first one consists in the analysisof the matrix of the second-order partial derivatives of the image. In the next step the so calledHarris matrix is created, which is the autocorrelation matrix of small parts (windows) of theimage. This method classifies an image point as edge, if the eigenvalues of the Harris matrixare larger than those in the local surrounding.
The Shi-Tomasi method is a modification of the Harris & Stephens approach. According to thisalgorithm, the edge is determined with these eigenvalues, which are above the proper threshold.
The next step after finding and choosing the feature points is tracking them betweenconsecutive frames of the original video sequence. The main solutions for this are: opticalflow calculation with Lucas-Kanade approach or pyramid Lucas-Kanade algorithm as well asthe scale invariant feature transform (SIFT) [1, 10].
Tracking of feature points makes it possible to find the displacement between consecutiveframes and perform stitching of those frames. Repeated stitching of frames taken from thevideo made by panning the camera creates the panorama.
Generally, for image stitching in the panorama the homography transformation may beused. It may slightly change object sizes and angles, but straight lines in the original framesremain straight after transforming them in the resulting panorama. This is a sufficiently precise
Fig. 3 Video sequence for fast forwarding in panorama representation
Multimedia Tools and Applications

procedure although the scaling errors may occur with some tendency to accumulate. Forinstance, the resulting panoramas may be burdened by some artifacts caused by quicklymoving objects (cf. Figure 4).
During experiments we noticed that in the final panoramas an object may be showncontracted (if it moves in an opposite direction to the camera rotation), extended (if it movesin the same direction as the camera but with lower velocity), reversed (if it moves in the samedirection as the camera but with higher velocity), or even can be not preserved in the panorama(if it moves in the opposite direction with higher velocity than the camera rotational speed).Some solutions of the problems with such artifacts, taken into account in our approach to thepanorama generation and analysis, were studied in [79, 83].
2.2 Panorama generator for video analysis and video compression
The presented idea based on cylindrical panoramas requires adaptive and precisely optimizedvideo analysis of continuously changing scenes with moving objects such as cars andpedestrians in order to generate plausible, high quality panoramas [27]. One of the majorproblems is that consecutive panoramas must have approximately the same lengths i.e. shouldbe generated without any nonlinear warping in order to make it possible to generate a sequenceof precise frames across the panoramas, representing the same required area. Furthermore, forpractical reasons, the whole algorithm should function in real-time to be applicable in practicalmonitoring systems.
A block diagram of the video processing, realizing the panorama generation for videoanalysis and compression for video storage, is presented in Fig. 5. The software implements allrequired steps for the panorama generation, i.e. the background estimation, movement detec-tion, and image stitching with feature points.
In the prepared software for the panorama generation and compression we realized maintasks with additional options. In the beginning, frames from the input video may optionally becropped and cleared of noise. Then the feature points are searched. Crossings of image edgeswere used as appropriate feature points to track because of their spatial accuracy. It is possibleto select one of two algorithms of feature points searching: Harris & Stephens or Shi-Tomasi.Next, the tracking of feature points is performed using the Lucas-Kanade method, pyramidLucas-Kanade method, or SIFT.
The following assumptions were made in our implementation: almost same colors of thepoints tracked between frames, relatively small movement of the tracked points, almost nochange of surroundings of the tracked points between frames in the sequence (thus theneighboring pixels move along with the tracked point). We accepted displacements of certainpixels in order to track the features. In order to find long shifts the pyramid Lucas-Kanademethod was used with a possibility for successive repetition among images with differentscales. The SIFT algorithm was adapted to detect the corresponding points in two images evenif they significantly change size, orientation, lightness, or position. It is the best and most
a) b) c) Fig. 4 Artifacts in panoramas: (a) contraction, (b) extension, (c) inversion of moving objects
Multimedia Tools and Applications

robust method among the implemented ones for comparing images with utilization the featurepoints. However, because of a relative high complexity, it reduces the processing frame rate.
Because the PTZ camera is panning in cycles, a very important task is to find the end ofevery cycle and therefore produce panoramas with constant width. If the speed of the cameramovement is constant it will be possible to simply calculate the length of the cycle. However,our solution is more flexible and this assumption is not required. To detect the end of thepanorama our algorithm continuously compares the features of the current frame with the veryfirst frame of the first panorama. If the similarity is above the assumed threshold, a new (i.e.,the next) panorama is started.
After a series of panoramas is created it is possible to compress the results into a videosequence. We suggested to compress and store full panoramas, or, if it is enough just to choosethe interesting area for compression and for further analysis (as in the example at the beginningof this section).
2.3 Implementation and experiments
The experiments with the generation and compression of panoramas were made with ourspecialized software implemented in Visual Studio C# environment with the OpenCV library.Under the panorama compression ratio we mean reduction of the time of the video recordingor equivalently reduction of the size of the video file. To show effectiveness of the proposedsolution we present results of two experiments (Table 1).
The first illustrative video sequence in Table 1 is the low resolution MPEG-4 compressedvideo. The camera pan cycle period is 14.4 s i.e. relatively short. The second sequence inTable 1 has the SD (standard definition) resolution and is compressed with the DV standard.The camera pan cycle period is relatively long (91 s).
Using panoramas we may reduce the time that is required to watch the video by a factor ofhundreds or even thousands times (e.g. by a factor of 2202 for the second illustrativesequence). Such values are not reachable in any other video compression methods. The longerthe pan cycle period the higher the compression ratio is achieved. In result, the proposedpanorama technique substantially saves the analysis time of the video monitoring operators,thus makes their work with the video analysis much more efficient. Additionally, with the
Fig. 5 Panorama generation and compression
Multimedia Tools and Applications

proposed compression of the generated panoramas we may reduce the file sizes (and therequired amount of storage, costs, etc.) even by more than thousand times. Although, withpanoramas we lose some local time resolution, the obtainable compression rates are unreach-able with any other video compression method. If we crop the panorama just to the selectedarea of interest the final data compression will be even higher.
3 Stereovision option for CCTV
Stereovision option is the second technique proposed in this paper. Up to now, stereovision wasused in CCTV systems to estimate the 3D-coordinates of the objects of interest [24, 58, 72]. Inour case, however, it is offered to the monitoring operators mainly in order to activate theirattention, to enhance their concentration, and to make their decisions faster and more precise.For this purpose we introduced a possibility of stereovision analysis of both a stereoscopic andeven a single monoscopic video channel, using our own, CCTVoriented, 2D to 3D conversionapproach. Thus, the proposed stereovision is thought as an additional visualization option totypical monoscopic video observation, obtained with a typical monoscopic CCTVequipment,in order to make the monitoring operators work more flexible and less cumbersome. Theproposed stereovision option approach is presented as diagram in Fig. 6.
Although, the stereovision data is typically coded as a video stream, using merely pairs ofimages in our experiments was enough (and certainly much more effective) to verify our ideas.On the other hand, the monitored scenes should in many situations be analyzed with stillimages (e.g. while people counting).
This Section aims to explain importance of the proposed 3D effect enhancement for CCTVin order to best fit into the human sense of vision. First we report the results of our studies onperception of the 3D effect evoked from 2D data. Then, for image areas with lack ofinformation, several gap complementation methods have been proposed and tested. We alsotested selection of the best parameters for the observed 3D effect. On the basis of the noticedrelationship between these parameters, it was possible to reduce the number of the necessarycontrol parameters to only one.
The perceived image quality and especially the depth range enhancement was tested usingboth: images obtained with the proposed 2D to 3D conversion approach and with real 3Dimages taken using specialized 3D camera equipment. An influence of the 3D visualization
Table 1 Results of video compression with panoramas
Original videosequence 1
Sequence 1of panoramas
Original videosequence 2
Sequence 2of panoramas
Video resolution [px] 320 × 212 2000 × 212 720 × 576 2000 × 576Display aspect ratio 3:2 9.4:1 4:3 3.5:1Number of frames 1730 5 9175 4Frame rate [fps] 24 24 25 24Duration [s] 72 0.21 367 0.17Camera pan cycle time [s] 14.4 – 91 –Time compression ratio 346 2202Video codec MPEG-4 MPEG-4 DV MPEG-4Video file size [MB] 8.3 0.37 1325.0 0.84File compression ratio 22 1587
Multimedia Tools and Applications

and observation by the viewers on recognition of chosen scene details was tested. Additionally,influence of the proposed depth enhancement method on automatic recognition of the scenedetails was also examined with real 3D images.
3.1 Enhanced 3D effects for CCTV
Our goal is to offer monitoring operators a controlled 3D effect in order to extract selectedobjects from the observed scene, i.e. to pay special attention to them and to faultless followthem in the video. Thus our approach is entirely different from those used in commercial andentertainment applications, e.g. in television, in which astonishing, spectacular 3D effects areof primary importance [8, 18, 46, 51, 76]. In the contrary, we are interested in simple,computation-efficient, real-time, depth enhancement effect. Therefore even binary, howevercontrolled, depth maps seem to be sufficient to fulfill this goal.
Two variants of the proposed approach have been tested: direct 2D to 3D conversion (in thecase of the use of standard 2D CCTV equipment) and the depth enhancement based in thebinary map of original 3D recordings. Both of them are described below.
The performed experiments were first of all concentrated on the study of the subjectiveperception of the relevant 3D effect and then on testing influence of the depth enhancement onthe recognition of details in the observed scenes [69].
3.2 Study of subjective perception of 3D effect
The starting point for our study was investigation of how differences between two images (thefirst one for the left eye and the second one for the right eye) influence perception of the 3Deffect performed by a human brain. If the differences between the two images affect creation ofthe 3D effect, they offer zooming in or out of the image plane. After dividing the image planeinto smaller plains related to the visible objects, it is possible to prepare a 3D visualizationmethod that particularize objects observed by the CCTVoperator with the monitoring system.
Fig. 6 Stereovision option forCCTV
Multimedia Tools and Applications
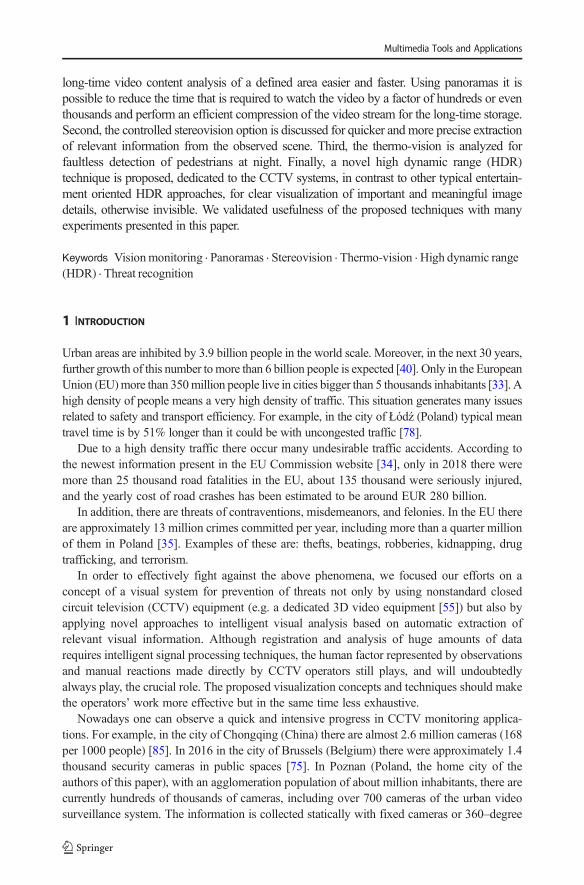
In our experiments we investigated influence of the horizontal shifts of the left eyeimage. 71 people observed 3 test images: auto, chopin, lena_color [4] of resolutions 767 ×576, 960 × 720, and 512 × 512 pixels. Each image was prepared with 15 different horizontalshifts of the left eye view in relation to the right eye view. The shift step-length was 1.5% ofthe original image horizontal resolution (Fig. 7). For simplicity of experiments the anaglyphvisualization standard with the red component image for the left eye and the cyan componentimage for the right eye was used. Therefore, in the experiments we horizontally shifted the redcomponent image. The results for other, more advanced 3D visualization techniques (e.g.polarization or autostereoscopic screens) are similar.
Negative values of the shift in Fig. 7 mean that the left eye view image was shifted tothe left and positive values mean the shifts to the right. On the vertical axis in Fig. 7 thepercentage of cases is indicated, in which the subjects perceived a clear 3D effect. Bythis means we experimentally proved that even a small image modification (merely ahorizontal shift of the left eye view image) triggers the brain to evoke relevant 3Dimpressions (approximately 90% of viewers observed a clear 3D effect) [4].
The horizontal shift of the left eye image determines perception of a distance decrease orincrease between the screen surface and the viewer, i.e. an illusion of binary depth mapmodification. A majority of viewers perceived the right shift of the left eye view image asdecrease of the screen surface distance with respect to the viewer [4].
3.3 Depth enhancement
In order to obtain a more precise 3D effect, instead of shifting the whole image, as discussed inthe previous Subsection, we will henceforth consider, right shifting of chosen objects in the lefteye view only. This means the binary depth map modification in order to highlight importanceof the chosen objects, i.e. to evoke an illusion that they are moved towards the viewer.
Two cases can be considered: the depth map generation i.e. a 2D to 3D conversion fororiginal 2D images (those registered with the use of conventional 2D CCTV equipment) andthe depth enhancement for originally registered 3D images.
Fig. 7 3D effect perception among viewers as a function of the left view to the right view shift for 3 test images(auto, chopin, lena_color); the horizontal axis indicates shifts between the left and the right eye views aspercentage of the original image horizontal resolution
Multimedia Tools and Applications

In the case of the 2D to 3D conversion the depth map can be generated using variousinformation types: motion vectors, edges, colors, or textures [21, 43, 50, 67]. With 8 bits wewill get 256 depth values but only about 20 of them or even less are sufficient for the excellent3D effect [2, 44]. However, as we experimentally proved, the simplest possible i.e. the binarydepth map is sufficient to evoke the relevant 3D effect for the monitoring operators, highlight-ing the objects of interest, e.g. a person or a vehicle (Fig. 8). Therefore, in this paper we haveconcentrated on generation of the binary depth maps.
A very interesting observation is that the same procedure of the binary depth mapmodification can also be used for the second considered task, i.e. for highlighting the objectsof the interest in the original 3D images. For this reason, all considered variants of the binarydepth map modifications will be henceforth referred to as the depth map enhancement.
The objects of interest can be automatically recognized and highlighted or can be pointedmanually by the operator and then segmented by e.g. detection of edges or their colors andfinally augmented in a controllable manner [2]. Such a situation is illustrated in Fig.8. A vehicle marked with the yellow frame by the operator (Fig. 8a) is indicated inthe binary depth map in Fig. 8b. Then, in Fig. 8c–h various variants of thisaugmentation technique are illustrated.
a) b)
c) d)
e) f)
g) h)Fig. 8 Binary depth map generation: (a) original image, (b) binary depth map for the vehicle of interest, (c)augmented view with a visible information gap, (d) anaglyph visualization of c), (e) information gap filled usinginterpolation, (f) anaglyph visualization of e), (g) information gap filled using mirroring supplemented byfiltering, (h) anaglyph visualization of g)
Multimedia Tools and Applications

3.4 Gap complementation
It should be stressed that the object shifting operation results in occurrence of empty (black)image areas called information gaps. Such a gap is for instance visible on the left hand side ofthe right shifted vehicle in Fig. 8c. The information gaps represent parts of the scene thatshould be visible by the left eye only but this information is not present in the initial image dueto covering it with the objects to be stereo-visually augmented, i.e. horizontally moved.
The information gaps occur in the background, thus they do not interfere with theperception of the augmented objects. In consequence they do not need to be preciselycomplemented. Thus in our case relatively simple gap filling methods are acceptable [3].Two of them are illustrated: the horizontal linear interpolation in Fig. 8e and the horizontalmirroring supplemented by filtering in Fig. 8g. We also proposed other simple methods. All ofthem are described in detail in [2, 3, 5, 6].
More sophisticated and more precise gap filling methods, like e.g. the expectationmaximization or artificial neural networks, can certainly also be used. However, theyrequire more calculations because of their iterative nature. Hence, they are difficult tobe realized in real-time.
3.5 Control of the 3D effect
The required control possibilities for the best subjective 3D object augmentation effect werestudied experimentally. Two adjustable control parameters were proposed: the backgroundhorizontal shift and the object horizontal shift.
In the experiment we collated two above mentioned methods for the gap complementation.We compared them with no filling the gaps. For each image the examined persons had toadjust both parameters for the best subjective 3D effect. The viewers could also answer that theadjustment of the optimal parameter values was impossible.
Three test images were used: lena (the standard test color image, Fig. 9a) with resolution512 × 512 pixels, bugatti with resolution 518 × 389 pixels (Fig. 9b), and column with resolu-tion 509 × 382 pixels (Fig. 9c).
Even without filling the gaps, more than 95% of 56 viewers perceived a clear 3D effect andunambiguously could choose the optimal control parameter values. For mirroring supplement-ed by filtering the percentage was more than 97% and for interpolation it was even almost99%. The illustrative distribution of parameters for bugatti test image is presented in Fig. 10. Itshould be noticed that this distribution is almost linear. Therefore the optimal 3D effectparameter settings, chosen by the viewers, can be approximated using the linear regression,resulting in a linear relation between both adjustable control parameters. It means that both ofthem may be reduced to only one control parameter realizing the straight line, e.g. that oneshown in Fig. 10.
a) b) c) Fig. 9 Images used for the experiment: (a) lena, (b) bugatti, (c) column
Multimedia Tools and Applications

The next step was examination of ability of the viewers to adjust the best point onthe straight line. Therefore, the previously computed linear relations for individual testimages, were averaged for every conversion scheme. For the bugatti test image 92%of 25 examined viewers were able to select a single point, achieving the optimum 3Deffect (see Fig. 11). Thus, it is possible to evoke a plausible 3D effect by extremelysimple means (a single controllable parameter).
Fig. 10 Distribution of the best control parameter values as a function of the object versus background shifts forbugatti test image; gaps complemented using horizontal linear interpolation
Fig. 11 Distribution of the best control parameter on the averaged straight line for bugatti test image; gapscomplemented using horizontal linear interpolation
Multimedia Tools and Applications

3.6 3D effect quality
In order to show advantages of using the proposed stereovision option over a typical 2DCCTV imaging we performed a number of further experiments. We analyzed both 2D to 3Dconverted images and originally registered 3D images.
The first experiment was devoted to examination of the perceived quality of the 2D to 3Dconverted images. The visible distortions were taken into account, rated using the meanopinion score (MOS) with the range from 1 for very annoying, 2 for annoying, 3 for slightlyannoying, 4 for perceptible but not annoying, and 5 for imperceptible distortions. 30 viewersobserved and scored 30 test images of 5 carefully chosen indoor and outdoor CCTV sceneswith resolutions of 1019 × 585 and 963 × 564 pixels. Each scene view was offered in thefollowing 6 versions: (1) an original 2D image, (2, 3) a 2D to 3D converted images with twomentioned gap complementation methods, (4) a real 3D image (obtained with a 3D two lenscamera), and finally (5, 6) the processed 3D images obtained again with both gap comple-mentation methods. The results are summarized in Table 2.
The second experiment was made in order to examine the strength of the 3D effect. The sameset of test images was used but another group of 30 viewers. Again theMOSwith the range from 1for imperceptible, 2 for poor, 3 for fair, 4 for good, and 5 for excellent was used taking thesensation of the depth range into account. The obtained results are also presented in Table 2.
The resulting MOS values in the rightmost column of Table 2 confirm usefulness of theproposed 3D enhancement effect procedures for both 2D and 3D original images. The overallimage quality was only slightly reduced from 4.5 to 3.1–3.5.
3.7 Influence of 3D visualization on manual recognition of scene details
Then, the influence of the use of 3D visualization on recognition of typical situations in videomonitoring was tested. The illustrative tested scenes are shown in Fig. 12. The experimentswere divided into two sets: those with untrained and those with trained viewers [7].
The experiments with untrained viewers were performed for testing: indication of the objectof interest, perception of hues, readability of inscriptions, extended range of view, distanceestimation, contact and trajectory relations between moving objects, and people counting.
For the experiments with untrained viewers 14 test images in 2D and 3D mode wereprepared. 48 viewers observed 2D and 3D variants of 12 images in one cycle and answered theaccompanying questions. These viewers were not trained and they were not informed aboutthe tasks in advance. The images were first presented in 2D and then in 3D mode. In this way,the tests were focused on influence of the 3D effect on the recognition of the image details. In
Table 2 Resulting Mos Values For Perceived Quality And Depth Range Of Images Processed Using 2D To 3DConversion
No. Scene view version Imagequality
3D effect(image depth)
1 Original 2D image 4.5 1.42 2D to 3D converted image using direct shift with interpolation 3.1 3.03 2D to 3D converted image using mirroring supplemented by filtering 3.5 3.34 Original 3D image 4.5 2.85 3D image with increased depth using direct shift with interpolation 3.1 3.66 3D image with increased depth using mirroring supplemented by filtering 3.5 3.6
Multimedia Tools and Applications

the case of two images, half of the people was watching the 2D version, and the second half −the 3D version. By this means, a possibility of remembering the information from the 2Dimage versions for the analysis of the 3D versions was avoided.
On the other hand, the experiments with the trained viewers (e.g. the skilled CCTVoperators) were focused on typical tasks of the video monitoring, i.e. counting peopleincluding counting groups of people.
In these experiments a group of six observers paying the role of operators was prepared andtrained to counting individual persons and groups of people. The observers were not distractedwith other tasks. Seven photos both as the 2D images and the corresponding 3D images, wereused for counting individual persons. Three other photos again as the 2D images and thecorresponding 3D images, were intended to counting groups of people.
In Table 3 results of the following tests are shown: indication of the object of interest(augmented by making it closer to the viewer with the 3D effect), counting recognizable huesof shirts, and reading inscriptions. It has to be stressed that 95.8% of viewers clearly pointedthe person augmented with the 3D effect with almost no negative influence on perception ofthe image details (numbers of hues and readability of inscription).
Comparison of 2D and 3D recognition of: the license plate number, dangerous layout ofobjects, person in the shortest distance to the object, then estimation of: the distance between twopersons, occurrence of the direct touch contact, relations between movement trajectories, andfinally people counting were also tested with the same group of untrained viewers. The results aresummarized in Table 4. Advantages of the 3D quality are clearly visible because we obtained
a) b)
c) d)Fig. 12 Illustrative CCTV test images
Table 3 Recognition of details of object processed using 2D to 3D conversion in video monitoring
2D 3D
Indication of object of interest (artificially closer to the viewer) – 95.8%Counting of shirt hues 91.7% 87.5%Reading the inscription 87.5% 87.5%
Multimedia Tools and Applications

substantial improvements in all tested criteria (e.g. estimation of touch contact was improved from13.5% to 65.1%) with one exception, namely the time of people counting (in the 3D version rosefrom 8.2 s to 10.8 s as compared to the 2D version). This effect may be the result of examininguntrained viewers who were not accustomed to counting people in 3D images.
Experiments with the trained viewers, summarized in Table 5, on people counting andcounting of groups of people clearly proved advantages of the 3D imaging. The number ofcorrect counts was improved even twice, simultaneously the counting time was reduced byapproximately 10%.
Concluding, the proposed 3D visualization option generally improves quality of theCCTV operators work. Therefore we cannot only foresee but also strongly recommendthe use of the hardware-based 3D equipment (i.e. two synchronized cameras) in futureCCTV systems.
Table 4 Influence of stereovision on precision and speed of analysis of monitoring situations with untrainedviewers
Analysistype
Object/situation 2D 3D
Descriptionof the result
Numericalvalue
Descriptionof the result
Numericalvalue
Recognition license plate number correct answers 0% correct answers 100%dangerous layout
of objects0% 87.5%
person in the shortestdistance to the object
27.1% 66.6%
Estimation distance betweentwo persons
mean percent error 29.5% meanpercent error
20.1%
occurrenceof contact
by touch
correct answers 13.5% correct answers 65.1%
relations betweenmovementtrajectories
36.5% 45.3%
Counting people 91.7% 100%mean time of counting 8.2 s mean time
of counting10.8 s
Table 5 Influence of stereovision on precision and speed of analysis of monitoring situations with trainedoperators
Analysis 2D 3D
Descriptionof the result
Numerical value Descriptionof the result
Numerical value
People counting correct answers 33.3% correct answers 54.8%mean time of counting 4.4 s mean time of counting 4.1 s
Counting ofgroups of people
correct answers 50.0% correct answers 72.2%mean time of counting 4.3 s mean time of counting 3.7 s
Multimedia Tools and Applications

3.8 Influence of stereovision on automatic recognition of scene details
In order to finally confirm usability of our 3D depth enhancement approach and application ofthe real 3D equipment with two cameras we also tested their influence on automatic recogni-tion of scene details, although this was neither the purpose nor the subject of this paper. Inresult we found that the proposed 2D to 3D conversion (referred as the depth enhancement) iscompletely transparent to automatic information extraction algorithms. However, the real 3Dapproach is very valuable especially for automotive applications.
The latter was tested on recognition of vehicle license plates and on recognition ofpedestrians with their faces. In order to recognize license plates the text regions werefirst detected using the maximally stable extreme regions (MSER) method. Then, thenon-text regions were removed using the geometric properties and a stroke widthvariation. Next the text regions were merged and recognized using standard OCRtechnique. People faces were detected using the sliding window technique to decidewhether the window contained the object of interest and then the Viola-Jones objectdetection algorithm [28]. The window varied to detect objects at different scales. Theobtained results are presented in Table 6.
4 Thermo-vision option for CCTV with pedestrian detection facilities
Thermo-vision is the next proposed technology (Section 4.A) foreseen as another option forthe use in CCTV city centers to enhance visibility in bad weather conditions and at nights. Wepropose two options: thermo-vision with automatic scene analysis for detection of dangeroussituations and thermo-vision merged with standard camera vision (the so called multi-spectralvision) as an option for manual scene analysis.
The first option of automatic scene analysis is discussed in Sections 4.B and 4.C (with anexample of detection of pedestrians). In Section 4.B we present a general procedure ofpedestrian detection and the analysis of the image segmentation process in Section 4.C. Wedescribe the threshold based image segmentation for thermal images in detail and discussadvantages and disadvantages of this approach. Then we propose a technique of local adaptivedual-threshold (ADT) with global adaptation based on the Otsu and Region Enlargement(ADT +Otsu+RE) method. The proposed procedure is then experimentally compared withother conventional threshold based techniques.
In the last Subsection 4.D, the second option of multi-spectral imaging for CCTV isdescribed. We present a method of creating multi-spectral images and experimentally testefficiency of the proposed multi-spectral imaging.
Table 6 Influence of stereovision on automatic recognition and detection efficiency
Analysis 2D 3D
Leftview only
Rightview only
Merged view(left and right)
Recognition efficiency of characters for license plate 43.7% 47.6% 57.9%Efficiency of human face detection 38.9% 94.4% 100%
Multimedia Tools and Applications

4.1 Thermo-vision technology
The thermal cameras capture infrared (IR) radiation, i.e. heat, which is naturally emitted bymost of objects. However, only objects with temperatures other than the surroundings tem-perature become distinctive. Moreover, the thermal camera cannot be dazzled by street lightsor car headlights. In consequence, living beings and vehicles can be better visible at night andfog on the IR part of the spectrum than in the visual light (cf. Figure 13a and b). This featuresignificantly facilitates automatic detection of objects (such as pedestrians) due to lack of othersuperfluous and/or interfering information.
On the other hand, due to a low number of other but important details in IR images (Fig.13b), for manual scene analysis by e.g. the CCTV operators, more convenient are the multi-spectral images (Fig. 13c), which are obtained by merging conventional images together withtheir IR counterparts. This technology is discussed in Section 4.D.
Indeed such important details, as e.g. road lines, posts and signs, lights of upcoming carsetc., are all together clearly much better visible by humans in Fig. 13c than in Fig. 13a or b,separately.
4.2 Objects (pedestrians) detection functionality
The main henceforth considered application is the IR detection of pedestrians especially atnight [9, 11, 37, 54, 63–65]. In the literature also involved analysis procedures using standardvision were successfully considered for this purpose [47, 70, 71].
The proposed scheme of the video processing procedure for detection of pedestrians ispresented in Fig. 14. It is composed of several following stages.
The first stage is the image acquisition. Then, the image preprocessing is performed toreduce the image sensor noise. The next stage prepares the so called region of interest (ROI),which is composed of the selected parts of the image for further processing. The ROI consistsof a suite of rectangular areas, called the “samples”, potentially containing the objects to bedetected. The ROI generation is made with two steps: by the image segmentation and byselection of pedestrian candidates based on statistical features of the candidate objects. Thecorrect ROI should contain all objects, which only potentially are in the scope of the interest. Ifthe algorithm discards some regions with pedestrians it will be impossible to correct this errorin further stages and thus to detect pedestrians. On the contrary, it is no problem if the ROIincludes some non-pedestrian objects, because they can be filtered out in the further analysis.
The succeeding stage is the object classification with two steps: feature extraction andvalidation. The first step reduces the amount of data that describes the object (i.e. pedestrian).Then, the second step validates the object with the properly pre-trained classifier.
a) b) c) Fig. 13 Illustrative images of the same scene recorded at night: (a) visual light image, (b) thermal image, (c)multi-spectral image
Multimedia Tools and Applications

Finally, the last stage is the feedback/warning used to inform the operator about theautomatically detected pedestrians.
4.3 Image segmentation
The image segmentation and object classification processes have major influence on efficiencyof the object detection. While object classification is a well investigated process, which offers avery high (even nearly 99%) detection ratio [29, 37], in the segmentation there is much moreroom for improvements.
As segmentation consists in generation of the ROI, it should reduce the amount of data tobe transferred to the next stage. It results in low false acceptance ratio and avoids scanning ofouter ROI regions like e.g. the sky.
In a wide area of image processing many segmentation methods have already beenproposed. An exhaustive scanning (also called the sliding window) [26] is one of the simplestsegmentation techniques, but it produces a large amount of samples (even thousands perimage). This is due to the lack of relevant information, which could be used to separateforeground from the background. A more advanced segmentation technique is based on theobject tracking. It reduces the number of samples for the classification stage, because it looksfor similar areas in consecutive frames. However, the resulting number of samples is still verylarge. Motion analysis (frequently used in CCTV) is another technique that can be used forsegmentation [26]. Inter-frame motion and optical flow are other techniques, which can also beused for the foreground segmentation [32]. However an important drawback of all of them isthat still objects cannot be detected. A solution of this problem can be the stereovision justdiscussed in previous Section, which enables segmentation using a disparity map [13].
In our case, i.e. the thermo-vision segmentation can be realized in a quite simple way,because it can be based on the assumption that pedestrians are warmer therefore brighter thanthe surroundings in the thermal images [38]. The darker background can be separated even bya simple threshold approach.
However, some problems may arise due to the fact that pedestrians may emit non-uniformthermal radiation (cf. Figure 15a). Changes in thermal contrast due to weather conditions cancause additional problems.
Analysis of the proper segmentation techniques for thermo-vision we started with evalua-tion of three commonly used techniques: a manually chosen global threshold for all frames
Fig. 14 Video processing for detection of pedestrians
Multimedia Tools and Applications
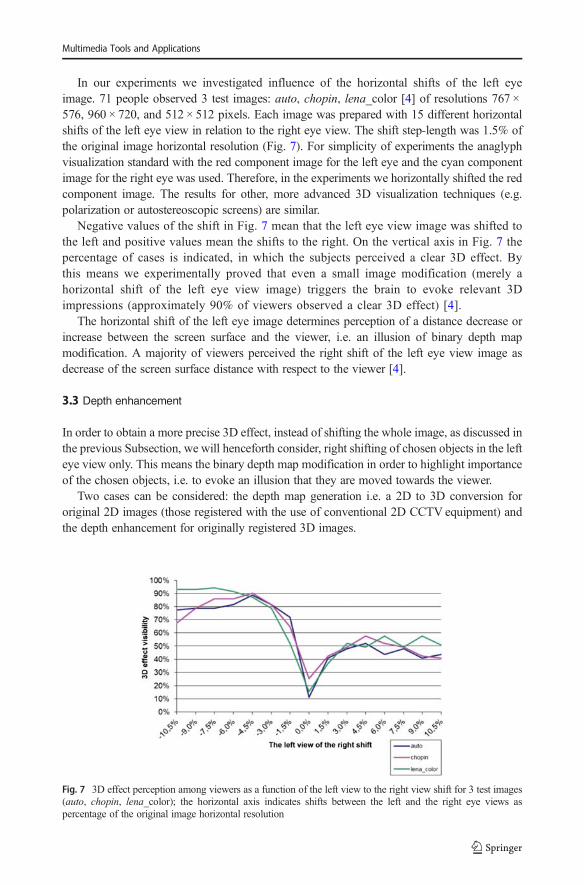
(referred to as the single threshold), the adaptively selected frame-wise global threshold (theOtsu method [61]), and the local adaptive dual-threshold (ADT) [53].
In the Otsu method it is assumed that the image contains two classes of pixels (foregroundand background), which form a bi-modal histogram. Then the optimum global threshold,separating these two classes by maximizing the inter-class variance, is computed.
The next and more advanced technique is the ADT threshold method with the local (inter-frame) threshold adaptation [53]. Two decision thresholds forming an adaptive hysteresisdecision loop are calculated for individual pixels taking their horizontal neighborhood intoaccount. The ADT parameters have been set to values: β = 16, w = 20, and λ = 0.3 (aspresented and explained in our previous paper [65]).
The comparison results are presented in Table 7. Generally, effectiveness of all consideredtechniques is better for segmentation of isolated pedestrians (one person per sample) than forgroups of pedestrians (multiple persons in a sample). The global threshold and the Otsumethod are much faster than the ADT. However, the ADT procedure due to the localadaptation offers better separability (Fig. 15).
Tests presented in this section (see results in Tables 7 and 8) were performed on speciallyprepared benchmark using the thermal “USArmy Tetravision” dataset [12]. This databaseconsists from sequences registered simultaneously from two thermal uncooled focal-planearray (FPA) sensors and two visible charge-coupled device (CCD) cameras. The cameras wereset to observe the same area. The original resolution of thermal images is 320 × 240 pixels and
Table 7 Results of segmentation
Segmentation methodNumber of:
Single thresholding Otsu ADT ADT +Otsu ADT +Otsu + RE
Correctly segmentedisolated pedestrians1,2
210/25781.7%
212/25782.5%
222/25786.4%
222/25786.4%
253/25798.4%
Correctly segmentedgroups of pedestrians2
17/39 43.6% 17/39 43.6% 10/39 25.6% 12/39 30.8% 39/39 100%
Average number ofsamples per frame
2.3 2.5 3.1 3.0 8.6
Processing time per frame 0.57 ms 0.73 ms 337 ms 338 ms 339 ms
Efficiency of the tested segmentation procedure was calculated as follows: single isolated pedestrian must beselected as one ROI and the bounding rectangle must cover at least 90% of the pedestrian
Test were performed on especially prepared benchmark using the thermal “USArmy Tetravision” dataset [12]. Itconsist from 257 isolated pedestrian and 39 groups of pedestrian included on 187 frames
a) b)Fig. 15 Standard ADT segmentation: (a) input image, (b) binary image after thresholding
Multimedia Tools and Applications

640 × 320 for visual light images. The image depth for both sensors is 8 bit per pixel. Thedetails about Tetravision system (e.g. the field of view and calibration processes) are presentedin [12]. In the prepared benchmark all 257 isolated pedestrians and 39 groups of pedestrians (in187 frames) were included.
The techniques for image segmentation presented above have drawbacks, whichcan be important in the CCTV systems used for pedestrian detection. The mostimportant among them are: connecting multiple pedestrians into a single sample(e.g. due to overlapping of pedestrians in the scene), splitting one pedestrian intomultiple samples (e.g. because of non-uniform IR radiation of clothed humans),generation of fake samples with no pedestrians (e.g. due to a variance in the ambienttemperature) (see white areas in Figs. 13b and 14b). To avoid these drawbacks wepropose two combined segmentation methods: the ADT with Otsu threshold and theADT with region enlargement (ADT-RE).
4.4 ADT with Otsu threshold
It was noticed that for a problem of connecting multiple pedestrians into a single sample ismore common for the global thresholding methods (a single threshold and Otsu) than for thelocal ADT technique. This results in a slightly lower accuracy (see Table 7, the accuracy variesfrom 86.4% to 81.7%). On the other hand, the ADT method has lower accuracy withsegmentation of groups of pedestrians than the global methods (the accuracy varies from43.6% to 25.6%), due to splitting pedestrians into multiple samples. Without any globaladaptation the ADT method tends to local changes in the image.
In order to increase adaptability to changes in various conditions, we proposefusion of the global and local thresholding, by using the global threshold value fromthe Otsu method [61] as the adjustment i.e. bias bOtsu = ThrOtsu/5.3, where ThrOtsu isthe Otsu threshold while the 5.3 constant is determined empirically. The bOtsu value isadded to the local part of the lower ADT threshold (as described in [53, 65]) insteadof constant β. The upper threshold is computed with the original ADT algorithm, i.e.as the lower threshold plus the standard deviation computed in the consideredhorizontal neighborhood. In the performed experiments, the Otsu threshold was inthe range ⟨80,120⟩ with the average value of 97.0. It gives bOtsu equal to 18.3 (onaverage). The proposed algorithm (ADT with Otsu threshold) reaches better adapt-ability to changes in various conditions. The accuracy for group of pedestriansincreased from 25.6% to 30.8%.
Table 8 Influence of type of night vision imaging on precision and speed of analysis of monitoring situations
Analysis Description of the result Conventionalimages
Thermalimages
Multi-spectralimages
1 2 1 2 1 2
General pedestrian counting correct answers 55.2% 58.2% 98.1% 98.3% 89.9% 91.2%mean time of counting 2.6 s 2.0 s 2.1 s 1.7 s 2.4 s 2.1 s
Pedestrian counting on the roadway correct answers 52.3% 53.0% 68.7% 71.6% 80.5% 87.3%
Results obtained with untrained observers
Results obtained with trained observers
Multimedia Tools and Applications

4.5 ADT with region enlargement (ADT-RE)
Parts of the bodies of pedestrians (see Fig. 16a, especially heads, arms, and legs) canhave much higher intensities (due to relatively high body temperature) than the rest ofthe bodies covered by cloths with a relatively cold surfaces. Using typical segmenta-tion methods this may result in splitting the pedestrian bodies into parts putting themto separate samples (see Fig. 16b and red rectangles in Figs. 16c and Fig. 16d).Taking into account that the pedestrians to be detected typically have vertical postures(although in abnormal situations they may also have horizontal postures), we proposeto enlarge the number of the analyzed samples by additional samples composed of allpossible pairs of original samples aligned vertically. By this means, for all pairs ofsamples, e.g. a pair s1(x, y, w1, h1) and s2(x, y, w2, h2), which have a common part inthe horizontal coordinate axis a new merged sample s3(x, y, w3, h3) is created, whichcovers the area of both samples and the area between them (where x, y are imagecoordinates taken from the upper-left corner). Assuming that xi, yi are the smallestcoordinate values and wi, hi are the width and height, respectively of the sample si,i = 1, 2), for e.g. x2 > x1 and y2 > y1 we get w3 = x2 − x1 + w2, and h3 = y2 − y1 + h2. Anexample of vertical alignment is shown in Fig. 17b. Notice that yellow and greenrectangles assign original samples, while the violet rectangles correspond to themerged samples.
It can be seen from the rightmost column of Table 7 that the proposed methodextensively improves the segmentation quality, especially for groups of pedestrians(almost 100% of the correctly detected cases). The cost is a larger number of samplesper frame (3.1 for the standard ADT versus 8.6 for the proposed ADT-RE extension)but the processing time per frame almost does not change with comparison to otherADT methods.
a) b)
c) d)Fig. 16 ADT segmentation with region enlargement: (a) input frame, (b) binary image after thresholding withADT, (c) segments (after ADT – red rectangles, after region enlargement – violet rectangles), (d) segmentedimage
Multimedia Tools and Applications

4.6 Thermal and multi-spectral imaging for CCTV operators
According to observations following from Fig. 13 in order to facilitate analysis of CCTVimages at night by humans (CCTV operators) we propose, as we already announced at thebeginning of this Section, to use the multi-spectral image quality, which is obtained bymerging the conventional camera image together with its thermal camera image counterpart[49]. Both cameras should operate in parallel and observe the same scene. A similar idea wasalready proposed by Flir as the so-called “multi-spectral dynamic imaging function” offered inthe measurement cameras [73].
The proposed multi-spectral option for the CCTV visualization (see Fig. 18) is realized asfollows: first, the thermal image is upsized to the resolution of conventional image, then the
a) b)
Fig. 17 Segmentation with regionenlargement: (a) input frame, (b)binary image after thresholdingwith detected segments (green andyellow rectangles) and additionalsegment after region enlargementtechnique (violet rectangle)
a) b) c)Fig. 18 Illustrative examples of three scenes (in each row) from the prepared testing set: (a) conventional cameraimage, (b) thermal image, (c) prepared multi-spectral image (yellow rectangle denotes the field of view of thethermal camera)
Multimedia Tools and Applications
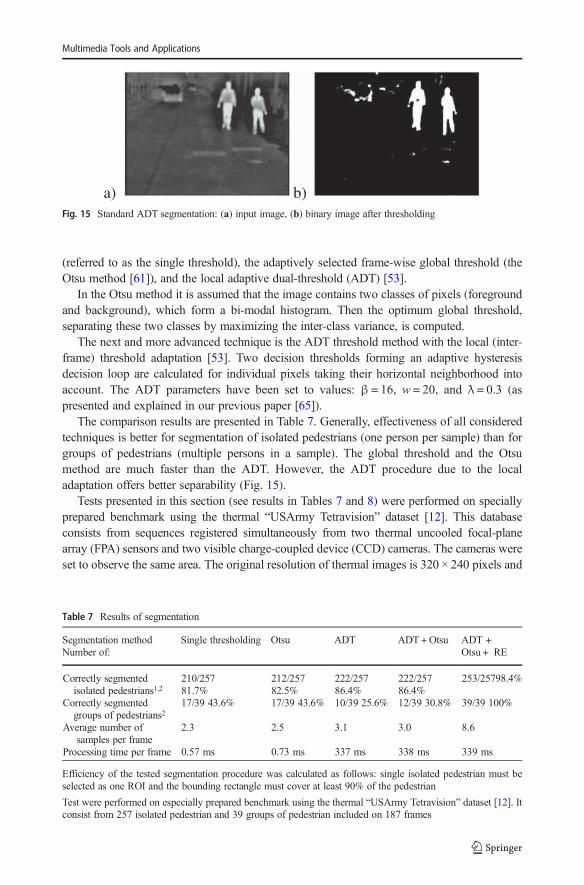
conventional image is taken as a background for the final multi-spectral image. After that allhigh luminance pixels in the thermal image (those exceeding certain threshold) replace thecorresponding background pixels but only if their luminances are higher than these in theconventional image.
To study effectiveness of the multi-spectral versus thermal image perception by humans weperformed experiments with a group of observers. The observers had to count pedestrians inimages of three types: conventional, thermal, and multi-spectral. Additionally they shouldestimate the number of pedestrians located on the roadway. The first task was proposed inorder to evaluate precision and speed of the pedestrians detection using the analyzed imagetypes, while the aim of the second task was to check an ability of correct environmentallocation of the detected pedestrians.
A testing set consisted of 11 different monitoring scenes of resolutions 640 × 320. For eachscene images of three types were prepared: conventional, thermal, and multi-spectral. Imagesof the first two types were taken directly from the USArmy Tetravision dataset [12]. Images ofthe third type were generated using the approach described above. Finally, the testing set wascomposed of 33 images.
The experiment participants were divided into two groups. The first group consisted of 45untrained persons (students) and the second group was constituted by 14 trained observers(most of them from the academic staff). The experiment was performed with speciallyprepared software and in similar lighting conditions.
With three scenes (rows in Fig. 18) we illustrate visibility enhancement using the multi-spectral option. The first example shows a single pedestrian in a short distance from thecamera. The second one presents pedestrians in a far distance (both are invisible with thestandard camera). The last example depicts two pedestrians in the mid-range. Only one of them(the right one) is clearly visible in the standard camera image.
The results of the performed experiments are presented in Table 8. It can be seenthat for precise counting of pedestrians thermal images are much better than conven-tional images (an improvement from 55 to 60% to ca. 98%) and even better thanmulti-spectral images. However, the precise localization of pedestrians (in our case ofthose present in the road) is the best using the proposed multi-spectral image quality(an improvement from ca. 53% to ca. 87%).
5 HDR option for CCTV
It is well known that humans are able to adapt to various lighting conditions, e.g., to highcontrast scenes. However, typical image reproduction methods are not. Using a typicalequipment, the resulting images can in some areas be brighter but in other darker than thedirectly observed real scenes. In result, some important objects can be invisible within too darkwhile other within too bright CCTV image parts, although all being naturally clearly visible.
Indeed, the dynamic range of the real-world luminance (from 3∙10−5 cd/m2 formoonless night sky to 2∙109 cd/m2 for the sunny day, i.e. the range of ca. 242 or 42EV measured in the so called exposure values) is enormously large. On the otherhand, modern imaging sensors like those described in [19] offer a dynamic range ofca. 214 (or 14 EV). Unfortunately, the luminance range of a typical liquid crystaldisplay (LCD) is only 0.5–500 cd/m2, i.e. ca. 210 (or 10 EV), which approximatelycorresponds to the static dynamic range of the human eye [60].
Multimedia Tools and Applications
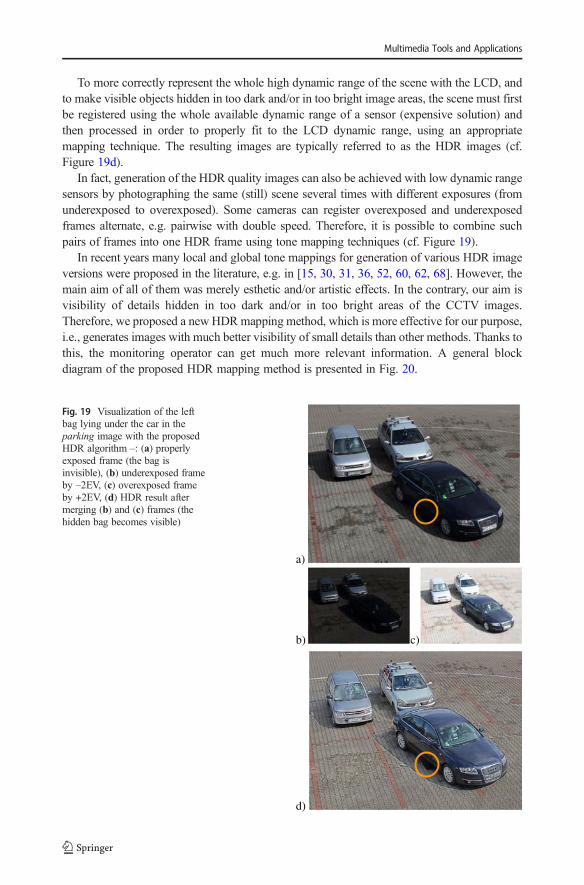
To more correctly represent the whole high dynamic range of the scene with the LCD, andto make visible objects hidden in too dark and/or in too bright image areas, the scene must firstbe registered using the whole available dynamic range of a sensor (expensive solution) andthen processed in order to properly fit to the LCD dynamic range, using an appropriatemapping technique. The resulting images are typically referred to as the HDR images (cf.Figure 19d).
In fact, generation of the HDR quality images can also be achieved with low dynamic rangesensors by photographing the same (still) scene several times with different exposures (fromunderexposed to overexposed). Some cameras can register overexposed and underexposedframes alternate, e.g. pairwise with double speed. Therefore, it is possible to combine suchpairs of frames into one HDR frame using tone mapping techniques (cf. Figure 19).
In recent years many local and global tone mappings for generation of various HDR imageversions were proposed in the literature, e.g. in [15, 30, 31, 36, 52, 60, 62, 68]. However, themain aim of all of them was merely esthetic and/or artistic effects. In the contrary, our aim isvisibility of details hidden in too dark and/or in too bright areas of the CCTV images.Therefore, we proposed a new HDRmapping method, which is more effective for our purpose,i.e., generates images with much better visibility of small details than other methods. Thanks tothis, the monitoring operator can get much more relevant information. A general blockdiagram of the proposed HDR mapping method is presented in Fig. 20.
a)
b) c)
d)
Fig. 19 Visualization of the leftbag lying under the car in theparking image with the proposedHDR algorithm –: (a) properlyexposed frame (the bag isinvisible), (b) underexposed frameby –2EV, (c) overexposed frameby +2EV, (d) HDR result aftermerging (b) and (c) frames (thehidden bag becomes visible)
Multimedia Tools and Applications

In order to obtain our version of the HDR image we use two initial images: theunderexposed image (UI) and the overexposed image (OI). In our case both are generatedfrom the same original raw image. The HDR image pixels are either taken from the sharpenedUI for the bright areas or from the sharpened OI for the dark areas or they are the weightedmixtures of both. The decisions are made using the averaged tone map using values q in therange from 0 to 1, whereby new pixel values are computed with the formula q⋅UI + (1 – q)⋅OI.Thus q = 0 means just using UI pixels and q = 1 means using OI pixels. The q values used areobtained in several steps. First, during the brightness processing step (cf. Figure 20) gray-scaleversions of UI and OI are computed. Preliminary tone mapping values are equal to 0.5 forpixels if differences between gray-scale OI and UI versions exceed a controllable threshold. Inother areas, q = 0 is used if the absolute values of differences between adjacent pixels in UI aregreater than those in OI. Similarly, q = 1 if the absolute values of differences between adjacentpixels in OI are greater than those in UI. By this means only coarse tonal map is determined. Itis finally blurred to avoid creating pseudo-edges in the resulting HDR image.
The proposed HDR method is visually compared with other HDR approaches (offered inthe Luminance HDR 2.4.0 software [74]) in Fig. 21 using the street image (Fig. 22a) croppedto 120 × 90 pixels. It is clearly visible that our method (Fig. 21f) provides much better visibilityof details and more accurate color reproduction than other tested approaches.
We also quantitatively tested effectiveness of our HDR method in comparison to otherapproaches checking whether the processed images allow to see more details, which arerelevant to the monitoring operators, such as: readability of license plates, good visibility ofpeople (especially in dark places), assessment of colors (e.g. colors of cloths). For this purpose,we prepared three benchmark test scenes: parking (Fig. 19), street (Fig. 22a), and market(Fig. 22b). They were recorded using 14-bit resolution then processed to 8-bit HDR versions.
We conducted experiments with 36 trained university employees and students at the PoznanUniversity of Technology. They viewed several versions of test images: 8-bit standard
a) b) c)
d) e) f)Fig. 21 Comparison of various HDR approaches using the 120 × 90 pixel cropped street image: (a) notprocessed, (b) Ashikhmin HDR, (c) Drago HDR, (d) Mantiuk HDR, (e) Pattanaik HDR, (f) the proposedHDR method
Fig. 20 General schema of the proposed HDR mapping method
Multimedia Tools and Applications

resolution (without HDR quality) and other HDR processed versions using the followingmethods: low contrast (a primitive HDR-like approach), Ashikhmin, Drago, Mantiuk,Pattanaik, and our method. The achieved results (shown in Table 9) prove, that the proposedHDR method ensures the best visibility of details in all tested cases (from 88.9% to 100%participants of the experiments correctly completed the tasks). Only for the hidden objectindication (the parking image), the Ashikhmin and Pattanaik methods gave the same, i.e. themaximum (100%) results. However, the Ashikhmin method is by 33 percentage points worsein the license plate readability, by 75 percentage points worse in the color rating, and by 25percentage points worse in the people visibility. Similarly, the Pattanaik method is by ca. 3percentage points worse in the license plate readability, by 50 percentage points worse in thecolor rating, and by 14 percentage points worse in the people visibility.
Additionally, we tested quality, details, and naturalness of the test images using thesubjective mean opinion score (MOS) method. The following answers were linked with thefollowing numerical values:
– quality: 1 – very poor, 2 – poor, 3 – acceptable, 4 – good, 5 – very good,– details: 1 – completely invisible, 2 – poorly visible, 3 – visible, 4 – clearly visible, 5 – very
clearly visible,– naturalness: 1 – very unnatural, 2 – unnatural, 3 – normal, 4 – natural, 5 – very natural.
The averaged results are presented in Table 10. Our method occurred to be the best forrecognition of details. It was also in average the best for the market image and only slightlyoutperformed by other methods for other images.
a) b) Fig. 22 Test images: (a) street, (b) market
Table 9 The percentage of experiment participants who correctly completed the tasks for the test images
ImageMethod
Parking –platereadi-bility [%]
parking – hiddenluggage visibility [%]
street – clothescolor rating [%]
market – peoplevisi-bility in theshadow [%]
Not processed 69.4 44.4 27.8 16.7Low contrast (HDR-like) 55.6 52.8 44.4 36.1Ashikhmin HDR 55.6 100.0 16.7 66.7Drago HDR 61.1 63.9 41.7 41.7Mantiuk HDR 69.4 66.7 75.0 69.4Pattanaik HDR 86.1 100.0 41.7 77.8Proposed HDR for CCTV 88.9 100.0 91.7 91.7
Multimedia Tools and Applications

6 Conclusion
In this paper four visualization techniques have been proposed, presented, and tested, servingas options for monitoring operators of city CCTV services. They are: generation of cylindricalpanoramas in order to make the long-time video content analysis of the defined monitoredareas much easier and faster, stereovision option for quicker and more precise extraction ofrelevant information from the observed scenes, thermo-vision analysis for faster and faultlessdetection of pedestrians at night, and an efficient HDR technique to clearly visualize importantand meaningful image details, otherwise hardly visible.
Using panoramas it is possible to reduce the time that is required to watch the video by afactor of hundreds or even thousands. It should be stressed that our approach to the cylindricalpanorama processing not only makes it possible to quickly search for the relevant events, butalso offers an efficient compression of the video stream for the long-time storage.
The proposed stereovision approach merged with the object of interest augmenta-tion helps the monitoring operators to quickly notice and permanently pay attention torelevant objects contained in the observed scenes. Furthermore, with our cheap andsimple stereo option the quick and correct evaluation of distances and relationshipsbetween objects is possible for the CCTV operators. This facility is very helpful inmany situations e.g. for: people counting, estimation of distances among variousobjects, detection of direct contact between people etc. It is very important that theperceived quality of sensation of depth is quite high even with simple on-linecomputations. Thus it strongly increases the feeling of immersion and illusion ofparticipation of the operator in the observed scene. This is an additional argumentfor application of the proposed stereovision option in the video surveillance systems.
The next considered thermo-vision video analysis also occurred to be a very helpful facilityfor CCTVoperators. Due to warnings about dangerous situations with pedestrians, it shortensdelays of appropriate reactions. The thermal spectrum provides a suitable possibility forobservation at night, offering the farthest viewing range. The proposed ADT +Otsu+REsegmentation approach for thermal images proves that pedestrians could be accurately extract-ed (up to 99.4%). Moreover, the performed experiments with operators show that the secondproposed option of multi-spectral imaging (obtained by merging conventional and thermalcamera images) effectively improves the manual CCTV scene analysis at night. It shortensreactions and supports faster identification of objects.
The proposed new algorithm for obtaining HDR images, which is dedicated to the CCTVapplications, enables accurate and convenient observation of detailed scenes even in verydifficult lighting conditions. Using our HDR approach, the normally invisible details in too
Table 10 Averaged MOS results for evaluation of the quality, details, and naturalness
ImageMethod
parking street market
Not processed 3.88 2.56 3.21Low contrast (HDR-like) 3.83 2.88 3.31Ashikhmin HDR 2.69 1.81 2.19Drago HDR 3.62 3.03 3.00Mantiuk HDR 3.43 3.77 3.43Pattanaik HDR 3.11 2.63 3.34Proposed HDR for CCTV 3.30 3.19 3.61
Multimedia Tools and Applications

dark and/or in too bright image parts are becoming quite clearly visible, additionally preserv-ing almost unchanged object colors.
Therefore we strongly believe, that all clear advantages of all proposed visualizationtechniques are very important for operators of the CCTV systems because they make theirjob much more effective and in the same time much less monotonous, boring, and cumber-some, changing it into much more comfortable activity, resulting in their quick and correctdecisions. This is of primary importance for safety of traffic and generally of people safety,especially in modern highly populated urban areas.
This paper was supported with the subvention for the year 2019.
Open Access This article is licensed under a Creative Commons Attribution 4.0 International License, whichpermits use, sharing, adaptation, distribution and reproduction in any medium or format, as long as you giveappropriate credit to the original author(s) and the source, provide a link to the Creative Commons licence, andindicate if changes were made. The images or other third party material in this article are included in the article'sCreative Commons licence, unless indicated otherwise in a credit line to the material. If material is not includedin the article's Creative Commons licence and your intended use is not permitted by statutory regulation orexceeds the permitted use, you will need to obtain permission directly from the copyright holder. To view a copyof this licence, visit http://creativecommons.org/licenses/by/4.0/.
References
1. Baker S, Matthews I (2004) Lucas-kanade 20 years on: a unifying framework. Int J of Comput Vision 56(3):221–255
2. Balcerek J, Dąbrowski A, Konieczka A (2008) Simple efficient techniques for creating effective 3Dimpressions from 2D original images. Proc new trends in audio and video/signal process. − algorithms,architectures, arrangements and applications NTAV/SPA ‘2008, IEEE Int Conf, Poznań, Poland, 25−27thSeptember 2008, 219–224
3. Balcerek J, Konieczka A, Dąbrowski A, Marciniak T (2011) Binary depth map generation and colorcomponent hole filling for 3D effects in monitoring systems. Proc of signal process − algorithms,architectures, arrangements and applications SPA ‘2011, IEEE Int Conf, Poznań, Poland, 29–30September 2011, 138–143
4. Balcerek J, Konieczka A, Dąbrowski A, Stankiewicz M, Krzykowska A (2012) Approach to evokingstereovision impressions from images. Electr Rev 6:17–23
5. Balcerek J, Dąbrowski A, Konieczka A (2013) Stereovision option for monitoring systems – a methodbased on perception control of depth. Proc of signal processing − algorithms, architectures, arrangementsand applications SPA 2013, IEEE Int Conf, Poznań, Poland, 26−28 September 2013, 226−230
6. Balcerek J, Dąbrowski A, Konieczka A (2014) Supporting stereovision tool for visual monitoring operators.Electronics – Constructions, Technologies, Applications 4:9–13
7. Balcerek J, Pawłowski P, Dąbrowski A, Konieczka A (2017) Detection of events in CCTV with 3Dtechnology. Electronics – Constructions, Technologies, Applications 10:31–34
8. Banitalebi-Dehkordi A, Pourazad MT, Nasiopoulos P (2017) A learning-based visual saliency predictionmodel for stereoscopic 3D video (LBVS-3D). Multimed Tools Appl 76:23859–23890. https://doi.org/10.1007/s11042-016-4155-y
9. Bao SYZ, Sun M, Savarese S (2010) Toward coherent object detection and scene layout understanding.Proc IEEE Conf on Comput Vision and Pattern Recognition:65–72
10. Benhimane S, Malis E (2004) Real-time image-based tracking of planes using efficient second-orderminimization. Proc of Intelligent Robots and Systems Conf 1:943–948
11. Bertozzi M, Broggi A, Del Rose M, Lasagni A (2005) Infrared stereo vision-based human shape detection.Proc IEEE intelligent vehicles symposium, 23–28
12. Bertozzi M, Broggi A, Felisa M, Vezzoni G (2006) Low-level pedestrian detection by means of visible andfar infra-red tetra-vision. Proc of IEEE intelligent vehicles Symp, 231–236
13. Bertozzi M, Broggi A, Del Rose M, Felisa M, Rakotomamonjy A, Suard F (2007) A pedestrian detectorusing histograms of oriented gradients and a support vector machine classifier. IEEE intelligent transpor-tation systems Conf, 143–148
Multimedia Tools and Applications

14. Bota S, Nedevschi S, KonigM (2009) A framework for object detection, tracking and classification in urbantraffic scenarios using stereovision. IEEE 5th Int Conf. On intelligent Comput. Commun. And process.(ICCP), 153–156
15. Bouzidi I, Ouled Zaid A, Larabi MC (2018) Revertible tone mapping of high dynamic range imagery:integration to JPEG 2000. Multimed Tools Appl 77:5215–5239. https://doi.org/10.1007/s11042-017-4425-3
16. Brown M, Lowe DG (2003) Recognizing panoramas. Proc of the 9th Int Conf on Comput vision, 1218–1225
17. Brown M, Lowe DG (2007) Automatic panoramic image stitching using invariant features, IJCV (74) 1:59–73
18. Calagari K, Elgharib M, Didyk P, Kaspar A, Matusik W, Hefeeda M (2018) Data driven 2-D-to-3-D videoconversion for soccer. IEEE Trans. Multimedia 20(3):605–619
19. Cambridge in Colour, A Learning Community for Photographers, “Dynamic range in digital photography”.http://www.cambridgeincolour.com/tutorials/dynamic-range.htm. Accessed 12 October 2019
20. Cetnarowicz D, Dąbrowski A, Pleva M, Juhar J, Ondas S (2012) Creation of event model in order to detectdangerous events. D7.2, European Seventh Framework Programme, FP7-218086-collaborative project, theINDECT consortium
21. Chang YL, Fang CY, Ding LF, Chen SY, Chen LG (2007) Depth map generation for 2D-to-3D conversionby short-term motion assisted color segmentation. 2007 IEEE Int Conf on multimedia and expo, 2–5July 2007, 1958–1961
22. Chellappan KV, Erden E, Surman P (2011) State of the art in stereoscopic and autostereoscopic displays.Proc of the IEEE 99(4):540–555
23. Chen Z, Ellis T, Velastin SA (2012) Vehicle detection, tracking and classification in urban traffic. 15th IntIEEE Conf on intelligent transportation Syst. (ITSC), 951–956
24. Choi K, Lee I (2015) CCTV coverage index based on surveillance resolution and its evaluation using 3Dspatial analysis. Sensors. 15:23341–23360. https://doi.org/10.3390/s150923341
25. Dąbrowski A et al (2010) Biometric features analysis component based on video and image information.D7.3, European Seventh Framework Programme, FP7-218086-collaborative project
26. Dąbrowski A, Cetnarowicz D, Pawłowski P, Stankiewicz M (2011) People Recognition and TrackingMethods for control of Viewpoint in CCTV Systems. 20th European Conf. Circuit Theory and Design(ECCTD), 29–31 August 2011, Linköping, Sweden, 878–881
27. Dąbrowski A, Pawłowski P, Kurpisz J, Stankiewicz M, Krzykowska A (2012) Modeling of cylindricalscene in CCTV systems with motorized camera. Proc of Picture Coding Symposium (PCS), 7–9 May 2012,Kraków, Poland, 329–332
28. Dalal N, Triggs B (2005) Histograms of oriented gradients for human detection. Proc IEEE Conf ComputVision and Pattern Recognition 1:886–893
29. Dollar P, Wojek C, Schiele B, Perona P (2012) Pedestrian detection: an evaluation of the state of the art.IEEE Trans on Pattern Analysis and Machine Intelligence 34:743–761
30. Durand F, Dorsey J (2002) Fast bilateral filtering for the display of high-dynamic-range images. ACMTranson Graph 21(3):257–266
31. Eilertsen G, Mantiuk RK, Unger J (2017) A comparative review of tone-mapping algorithms for highdynamic range video. Computer Graphics Forum 36:565–592. https://doi.org/10.1111/cgf.13148
32. Elzein H, Lakshmanan S, Watta P (2003) A motion and shape based pedestrian detection algorithm. ProcIEEE intelligent vehicles Symp, 500–504
33. Eur. Commission (2011) Cities of tomorrow – challenges, visions, ways forward. https://ec.europa.eu/regional_policy/sources/docgener/studies/pdf/citiesoftomorrow/citiesoftomorrow_final.pdf. Accessed12 October 2019
34. Eur. Commission, (2019) EU road safety policy framework 2021–2030 – next steps towards “vision zero”,commission staff working document, SWD(2019) 283 final (official website), Brussels, 19 June 2019.https://ec.europa.eu/transport/road_safety/sites/roadsafety/files/1_en_document_travail_service_part1_v2.pdf. Accessed 12 October 2019
35. Eur. Commission, Crime and criminal justice statistics, data 2008–2013. https://ec.europa.eu/eurostat/statistics-explained/index.php?title=Archive:Crime_and_criminal_justice_statistics,_data_2008-2013. Accessed 12 October 2019
36. Fattal R, Lischinski D, Werman M (2002) Gradient domain high dynamic range compression. ACM Transon Graph 21(3):249–256
37. Ge J, Luo Y, Tei G (2009) Real time pedestrian detection and tracking at night time for driver-assistancesystems. IEEE Trans on Intelligent Transportation Systems 10(2):283–298
38. Geronimo D, Lopez AM, Sappa AD (2010) Survey of pedestrian detection for advanced driver assistancesystems. IEEE Trans on Pattern Analysis and Machine Intelligence 32(7):1239–1258
Multimedia Tools and Applications

39. Guo Y, Zhao R, Wu S, Wang C (2018) Image capture pattern optimization for panoramic photography.Multimed Tools Appl 77:22299–22318. https://doi.org/10.1007/s11042-018-5948-y
40. Herald Globe, Int. News & Information Service (2014) City population to reach 6.4bn by 2050. http://www.heraldglobe.com/news/223727231/city-population-to-reach-64bn-by-2050. Accessed 12 October2019
41. Huang F, Klette R, Scheibe K (2008) Panoramic Imaging: Sensor-Line, Cameras and Laser Range-Finders.Wiley, West Sussex, England
42. Huynh-Thu Q, Barkowsky M, Le Callet P (2011) The importance of visual attention in improving the 3D-TV viewing experience: overview and new perspectives. IEEE Trans on Broadcasting 57:421–431
43. Ideses I, Yaroslavsky LP, Fishbain B (2007) Real-time 2D to 3D video conversion. Real-Time Image Proc 2:3–9
44. Ideses I, Yaroslavsky L, Amit I, Fishbain B (2007) Depth map quantization – how much is sufficient?3DTV Conf, 7–9 may 2007, 1–4
45. Irani M, Anandan P (1999) About direct methods. Vision Algorithms, Theory and Practice, pp 267–27746. Jiang H, Jumisko-Pyykkö S, Utriainen T (2011) A hybrid method for quality evaluation in the context of use
for Mobile (3D) television. Multimed Tools Appl 55:185–225. https://doi.org/10.1007/s11042-010-0573-447. Jiang Y, Wang J, Liang Y, Xia J (2018) Combining static and dynamic features for real-time moving
pedestrian detection. Multimed Tools Appl 78:3781–3795. https://doi.org/10.1007/s11042-018-6057-748. Kaljahi MA, Palaiahnakote S, Anisi MH, Idris MYI, Blumenstein M, Khan MK (2018) A scene image
classification technique for a ubiquitous visual surveillance system. Multimed Tools Appl 78:5791–5818.https://doi.org/10.1007/s11042-018-6151-x
49. Kanmani M, Narasimhan V (2017) An optimal weighted averaging fusion strategy for thermal and visibleimages using dual tree discrete wavelet transform and self tunning particle swarm optimization. MultimedTools Appl 76:20989–21010. https://doi.org/10.1007/s11042-016-4030-x
50. Kim D, Min D, Sohn K (2007) Stereoscopic Video Generation Method Using Motion Analysis. 3DTVConf, 2007, 7–9 May 2007, 1–4
51. Koch A, Bourgeois-République C, Dipanda A (2015) Evolutionary algorithms for a mixed stereovisionuncalibrated 3D reconstruction. Multimed Tools Appl 74:8703–8721. https://doi.org/10.1007/s11042-014-2354-y
52. Kuang J, Yamaguchi H, Liu C, Johnson GM, Fairchild MD (2007) Evaluating HDR rendering algorithms.ACM Trans on Applied Perception 4(2):1–27
53. Liu Q, Zhuang J, Kong S (2012) Detection of pedestrians at night time using learning-based method andhead validation. IEEE Int Conf imaging systems and Techn (IST), 398–402
54. Liu Q, Zhuang J, Ma J (2013) Robust and fast pedestrian detection method for far-infrared automotivedriving assistance systems. Infrared Phys Technol 60:288–299
55. Lopez-Fuentes L, van de Weijer J, González-Hidalgo M, Skinnemoen H, Bagdanov AD (2018) Review oncomputer vision techniques in emergency situations. Multimed Tools Appl 77:17069–17107. https://doi.org/10.1007/s11042-017-5276-7
56. Marciniak T, Dąbrowski A, Chmielewska A, Weychan R (2012) Face recognition from low resolutionimages. Multimed. Comm., services a. security. Book Series: Communications in Computer andInformation Science 287:220–229
57. Marciniak T, Chmielewska A, Weychan R, Parzych M, Dąbrowski A (2015) Influence of low resolution ofimages on reliability of face detection and recognition. Multimed Tools Appl 74:4329–4349. https://doi.org/10.1007/s11042-013-1568-8
58. Mishra AK, Ni B,Winkler S, Kassim A (2007) 3D surveillance system using multiple cameras. Proceedingsof SPIE - The International Society for Optical Engineering. https://doi.org/10.1117/12.703449
5 9 . M o n i t o r i n g s y s t e m i n t h e c i t y o f P o z n a ń ( 2 0 1 9 ) . h t t p : / / d s p . o r g .pl/uploaded/badania/VideoMonitoringInPoznan.pdf. Accessed 12 October 2019
60. Myszkowski K, Mantiuk R, Krawczyk G (2008) high dynamic range video. Morgan & Claypool, 200861. Otsu N (1979) A threshold selection method from gray-level histograms. IEEE Trans Sys, Man, Cyber 9(1):
62–6662. Pattanaik SN, Tumblin J, Yee H, Greenberg DP (2000) Time-dependent visual adaptation for fast realistic
image display. Proceedings of SIGGRAPH 2000:47–5463. Pawłowski P, Piniarski K, Dąbrowski A (2015) Pedestrian detection in low resolution night vision images.
Proc of IEEE SPA: Signal Processing Conf, 185–19064. Piniarski K, Pawłowski P, Dąbrowski A (2014) Pedestrian detection by video processing in automotive
night vision system. Proc of IEEE SPA: Signal Processing Conf, 104–10965. Piniarski K, Pawłowski P, Dąbrowski A (2015) Video processing algorithms for detection of pedestrians.
Computational methods in science and Technol. (CMST) 21(3):141–150
Multimedia Tools and Applications

66. Rankin S, Cohen N, Maclennan-Brown K, Sage K (2012) CCTV operator performance benchmarking.IEEE Int Carnahan Conf on Security Technol (ICCST):325–330
67. Redert A, Berretty RP, Varekamp C,Willemsen O, Swillens J, Driessen H (2006) Philips 3D solutions: fromcontent creation to visualization. Third Int Symp 3D data process. Visualization, and Transmission,June 2006:429–431
68. Reinhard E, Debevec P, Ward G (2006) High dynamic range imaging: theory and practice. SIGGRAPH2006, course #5
69. Ribeiro FML, de Oliveira JFL, Ciancio AG, da Silva EAB, Estrada CRD, Tavares LGC, Gois JN, Said A,Martelotte MC (2018) Quality of experience in a stereoscopic multiview environment. IEEE TransMultimedia 20(1):1–14
70. Shashua A, Gdalyahu Y, Hayun G (2004) Pedestrian detection for driving assistance systems: single-frameclassification and system level performance. Proc IEEE Intelligent Vehicles Symp:1–6
71. Shimizu H, Poggie T (2004) Direction estimation of pedestrian from multiple still images. Proc IEEEIntelligent Vehicles Symp:596–600
72. Stepanov D, Tishchenko I (2016) The concept of video surveillance system based on the principles of stereovision. 18th conference of open innovations association and seminar on information security and protectionof information technology (FRUCT-ISPIT). https://doi.org/10.1109/FRUCT-ISPIT.2016.7561546
73. The official website of FLIR Systems company, http://www.flir.eu/home. Accessed 12 October 201974. The official website of Luminance HDR software, http://qtpfsgui.sourceforge.net. Accessed 12 October
201975. Torfs M (2016) Brussels: number of CCTV cameras “explodes”. Flanders News. http://deredactie.
be/cm/vrtnieuws.english/Brussels/1.2789772. Accessed 12 October 201976. Valizadeh S, Nasiopoulos P, Ward R (2018) Perceptual rate distortion optimization of 3D–HEVC using
PSNR-HVS. Multimed Tools Appl 77:22985–23008. https://doi.org/10.1007/s11042-017-5486-z77. Velten J et al (2012) Preliminary multimodal features detection system prototype. European Seventh
Framework Programme, D7.6, FP7-218086-collaborative project, the INDECT consortium78. Wagner I, Statista Business Data Platform (2018), Most congested cities in Europe 2018. https://www.
statista.com/statistics/235780/most-traffic-jam-prone-cities-in-europe/. Accessed 12 October 201979. Wan Y, Miao Z (2008) Automatic panorama image mosaic and ghost eliminating. Int Conf on Multimedia
& Expo, 945–94880. Wang B, Fremont V (2013) Fast road detection from color images. IEEE Intelligent Vehicles Symp (IV),
1209–121481. Wang M, Cheng B, Yuen C (2018) Joint coding-transmission optimization for a video surveillance system
with multiple cameras. IEEE Trans. Multimedia 20(3):620–63382. Wei-Song L, Ming-Kang C, Tien G (2005) Autonomous mobile robot navigation using stereovision. IEEE
Int Conf on Mechatronics (ICM), 410–41583. Xiao-chun Z, Ming-yi H, Xin-bo Z, Yan F (2010) A robust mosaic panorama technique for video. 2nd Int
Conf on Comput Eng and Technol. (ICCET) 2:V2-641–64484. Yang KM, Huang F, Lin SH (2010) Generation of animated panorama from single video sequence. 3rd Int
congress on image and signal processing (CISP) 1:477–48185. Zhang P. (2019) 8 of the 10 cities with the most surveillance cameras in the world are in China, and the other
2 are in the UK and the US. Business Insider. https://www.businessinsider.com/most-surveilled-cities-in-the-world-china-london-atlanta-2019-8?IR=T. Accessed 12 October 2019
Publisher’s note Springer Nature remains neutral with regard to jurisdictional claims in published maps andinstitutional affiliations.
Multimedia Tools and Applications